Embed Size (px)
Citation preview

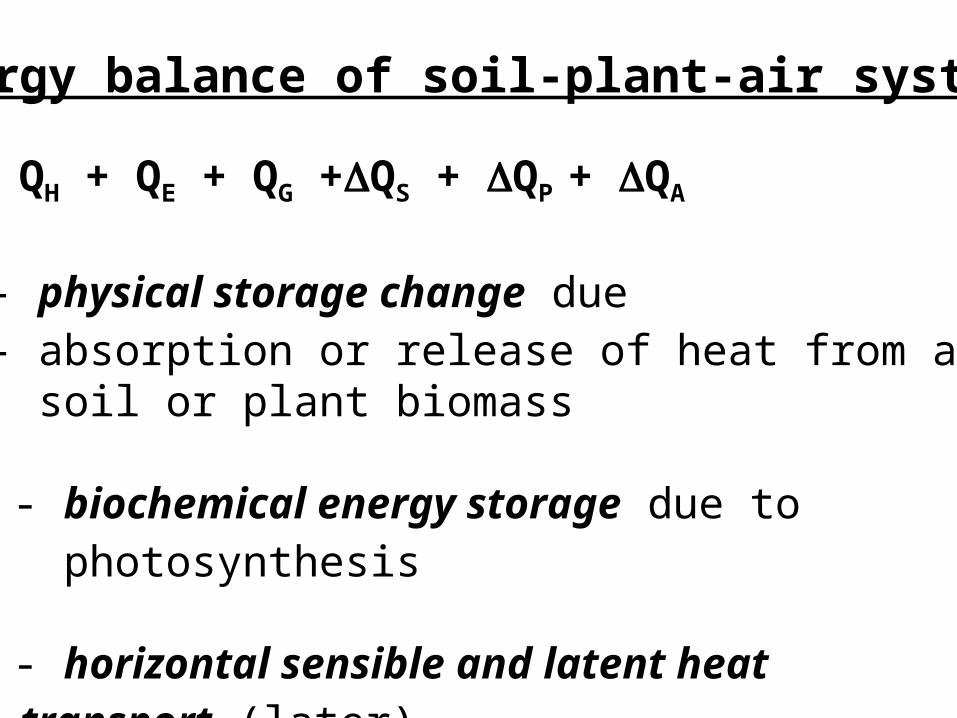
Q* = QH + QE + QG +QS + QP + QA
QS - physical storage change due - absorption or release of heat from air, soil or plant biomass
QP - biochemical energy storage due to photosynthesis
QA - horizontal sensible and latent heat transport (later)
Energy balance of soil-plant-air system

Water balance of soil-plant-air system
p = E + r + S
S – net water storage of air, soil and plants(internal and external)
Photosynthesis, P:6CO2 + 6H2O + sunlight C6H12O6 + 6O2
Respiration, R:C6H12O6 + 6O2 6CO2 + 6H2O + energy

Surface RadiationBalance for aPlant Canopy

Heat Storage by Photosynthesis
The net rate of CO2 assimilation (kgm-2s-1)
P = P – R
Heat storage by net photosynthesis is, therefore:
QP = P
where is the heat of assimilation of carbon (Jkg-1)
Values are very small compared to other fluxes - up to ~10 Wm2 during the day- about -3 Wm2 during the night

Transpiration through stomata
•increases the QE flux•prevents overheating•induces moisture and nutrient transport
Stomata- open during the day for gas exchange- closed at night- stomata open when there is enough
light, and appropriate levels of moisture, temperature, humidity and internal CO2
concentration- 10-30 m long, 0-10 m wide- 50-500 stomata mm-2

Stomate (wheat)
Degree of openingdepends on lightintensity, moistureavailability, temperature, humidity and internal CO2 concentration


Stand Architecture and the Active Surface
Position of active surface lies at the zero planedisplacement: d 2/3 h
Modified logarithmic wind profile equation:
uz = (u*/k) ln (z-d/z0)
For simplicity, energy exchange is considered at a plane at the top of the system (‘big leaf’ approach)

Plant canopieselevate the position of theactive surface

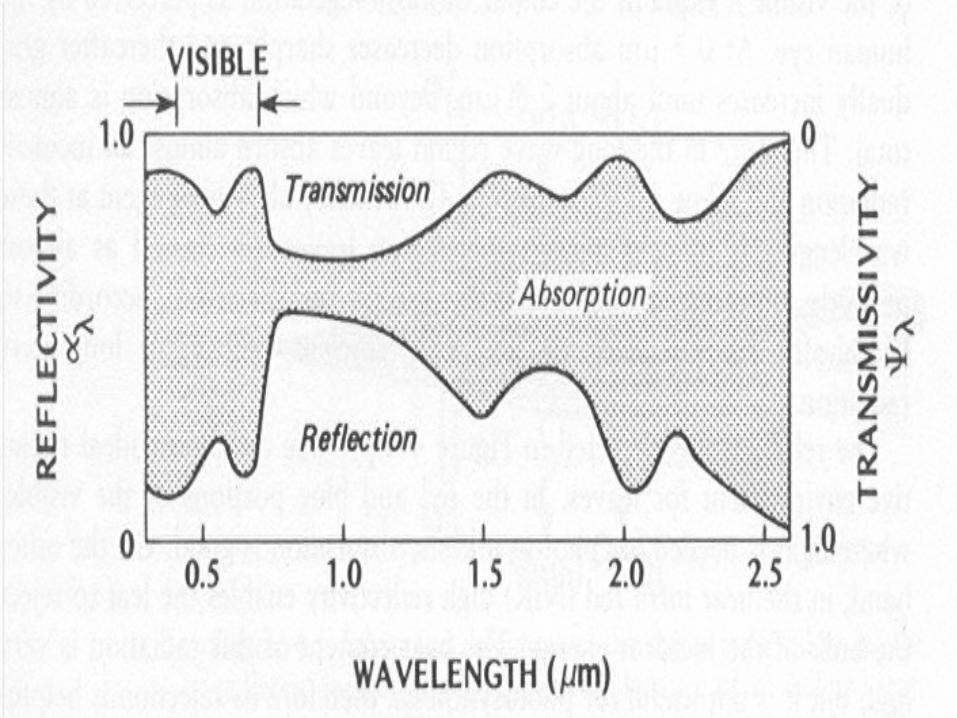
Wavelength Dependence of Leaves
Leaves absorb photosynthetically-active radiation (PAR)effectively for carbon assimilation
Better absorption in blue and red bands than in the green band
Leaves reflect and transmit near infra-red radiation (NIR)This helps limit heating
Leaves are very efficient emitters of longwave radiationdue to their high water content (absorb L too)This helps the leaves shed heat effectively

Leaf Radiation Balance
Q*leaf = [(Kin(t) + Kin(b))(1--)]+[(Lin(t)-Lout(t))+(Lin(b)-Lout(b))]
= K*(t)+K*(b)+L*(t)+L*(b)
= K*leaf + L*leaf

Leaf Energy Balance
Q*leaf = (QH(t)+QH(b))+(QE(t)+QE(b))= QH(leaf) + QE(leaf)

Sensible Heat Flux and Leaf Temperature
QH = Ca (T0-Ta)/rb
- rb is the diffusive resistance the laminar sublayer-rb value higher for larger leaves as laminar layer grows-higher resistance during calm conditions
T0 = Ta + rb/Ca (Q*leaf – QE leaf)
-Air temperature is important for leaf temperature-Leaf may be warmer or cooler than the air-If rb is large, Q*leaf – QE leaf determine T0-Ta
-Hot, dry environments: plants develop small leaves, with high albedo,or orient leaves vertically near solar noon-Very cold environments: leaves grow close to ground, have large rb, and, in the arctic, touch the warmer ground

Number of degrees bywhich the leaf temperatureexceeds the air temperatureduring the daytime

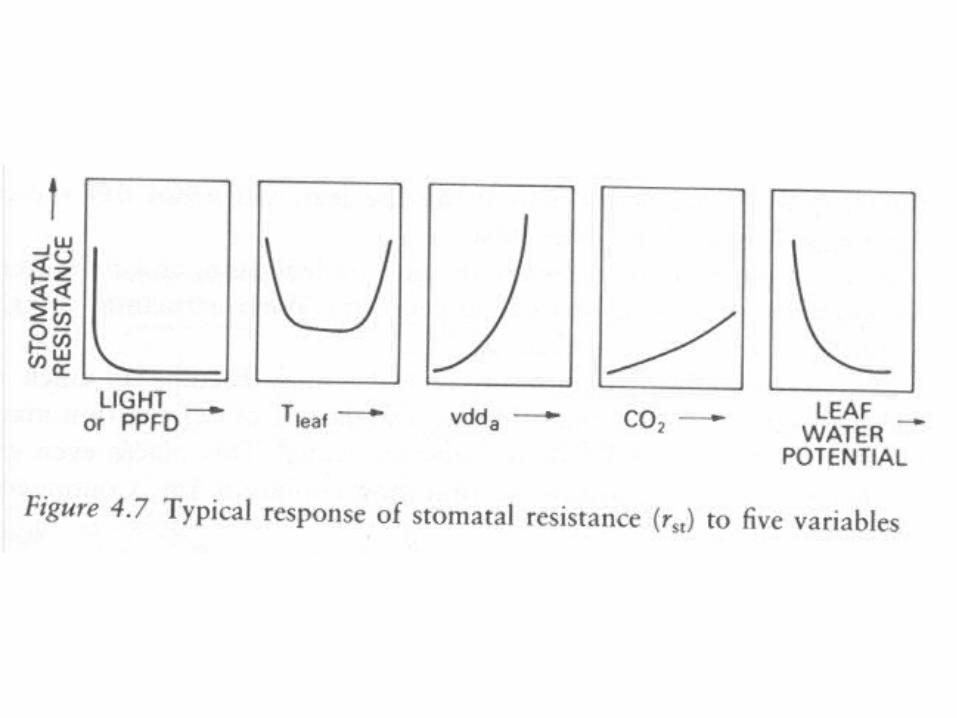
Evapotranspiration from a Leaf
-Depends on vapour pressure deficit and diffusive resistance of the laminar sublayer
E = (*v(To) - va)/ (rb + rst)
- rst is a variable stomatal resistance-at the canopy level, we can think of a canopy resistance, vdd/E, which varies with rst/LAI and an aerodynamic resistance describing the role of turbulence in evaporation
Carbon flux from a Leaf
Fc = (ca - ci)/ (rb + rst)

cuticle
palisade mesophyll
spongy mesophyll
lower epidermis
upper epidermis
Carbon dioxide must travel from atmosphere,through mesophyll to chloroplasts


Photosynthesis Measurement
max
max
PPAR
PPARPn
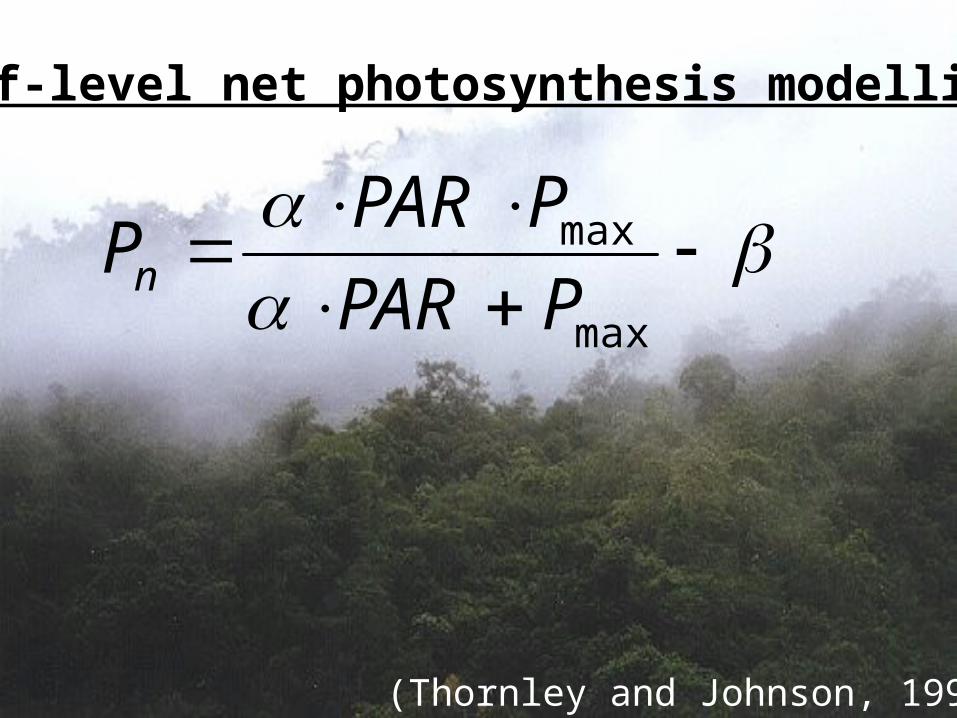
Leaf-level net photosynthesis modelling
(Thornley and Johnson, 1990)

-2
0
2
4
6
8
10
12
14
16
0 500 1000 1500 2000 2500
PAR (molm-2s-1)
Net
ph
oto
syn
thes
is (m
ol
m-2s
-1)
Photosynthesis vs. Elevation
1450 masl
2150 masl
Miconia sp.

-2
0
2
4
6
8
10
12
14
0 50 100 150 200 250
Modelled LMCF
Observed LMCF
Modelled UMCF
Observed UMCF
-4
0
4
8
12
16
20
0 600 1200 1800 2400
Modelled LMCF
Observed LMCF
Modelled UMCF
Observed UMCF
a.
b.
PAR (µmolm-2s-1)
PAR (µmolm-2s-1)
Pn
µmol CO2m2s1
Pn
µmol CO2m2s1
LMCF
RMSE = 1.10 µmolm-2s-1
R2 = 0.77; N=820
UMCF
RMS E = 1.69 µmolm-2s-1
R2 = 0.55; N=500

-5
0
5
10
15
20
25
0 500 1000 1500 2000 2500
2xCO2
Ambient
Mod 2xCO2
Mod Ambient
-5
0
5
10
15
20
25
0 500 1000 1500 2000 2500
2xCO2
Ambient
Mod 2xCO2
Mod Ambient
Pn = 0.0364 (PAR) - 0.2994
R2 = 0.88; 30<PAR<350
Pn = 0.0442 (PAR) - 0.3025
R2 = 0.93; 7<PAR<570
-5
0
5
10
15
20
25
0 200 400 600
Ambient
2xCO2
Linear (Ambient)
Linear (2xCO2)
-5
0
5
10
15
20
25
0 400 800 1200
2xCO2
Ambient
Mod 2xCO2
Mod Ambient
-5
0
5
10
15
20
25
0 500 1000 1500 2000 2500
2xCO2
Mod 2xCO2
Ambient
Mod Ambient
-5
0
5
10
15
20
25
0 500 1000 1500 2000 2500
2xCO2
Ambient
Mod 2xCO2
Mod Ambient
Anthurium sp.
All generaPsychotria sp.
Clusia sp.Miconia sp.
Cecropia sp.
Pn
molm2·s
PAR (mol·m-2·s-1)
PAR (mol·m-2·s-1)PAR (mol·m-2·s-1)
PAR (mol·m-2·s-1)PAR (mol·m-2·s-1)
PAR (mol·m-2·s-1)
Pn
Pn Pn
PnPn
The short-terminfluence of increasedCO2 concentration.
Also:Stomatal conductancetends to decrease(enough CO2), leading to increasedwater use efficiency

Plant Canopies and Carbon Dioxide Flux
At night: - flux directed from canopy to the atmosphere- respiration from leaves, plant roots, soil
Daytime: - CO2 assimilation rate exceeds respiration rate
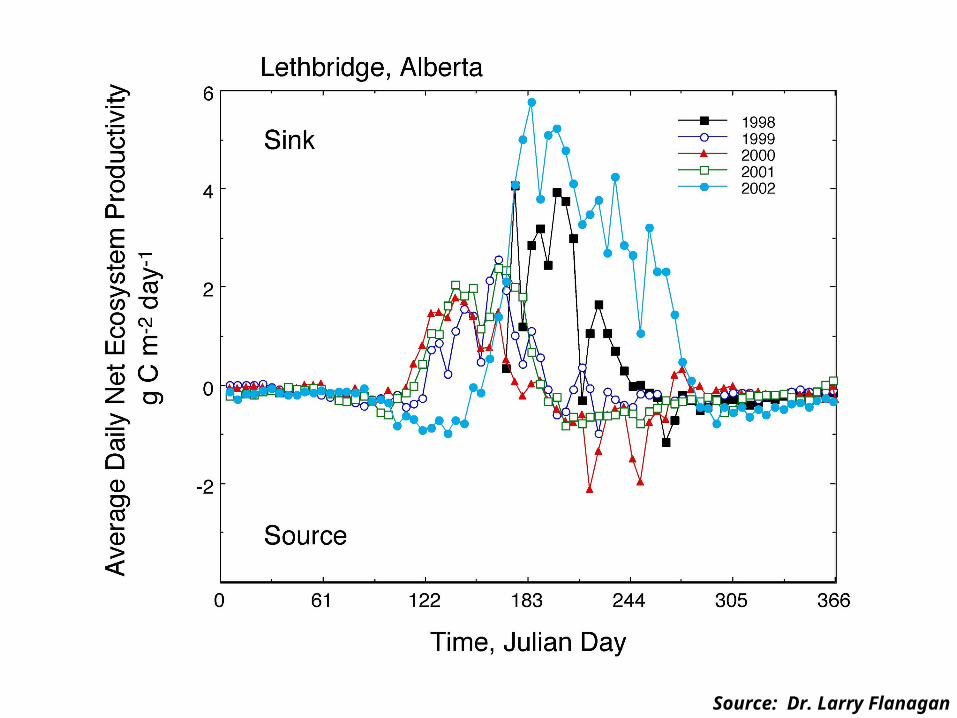
Seasonal Variation in Temperate Environments
Spring: Assimilation increases with leaf area index and increasing solar radiation availability/day length
Midsummer: Fc drops despite sun, due to soil moisture depletion – flux higher in morning
Winter: Small, negative flux

Vertical flux of carbon dioxide(FC) over a prairiegrassland
What causes theMidday minimum in August?
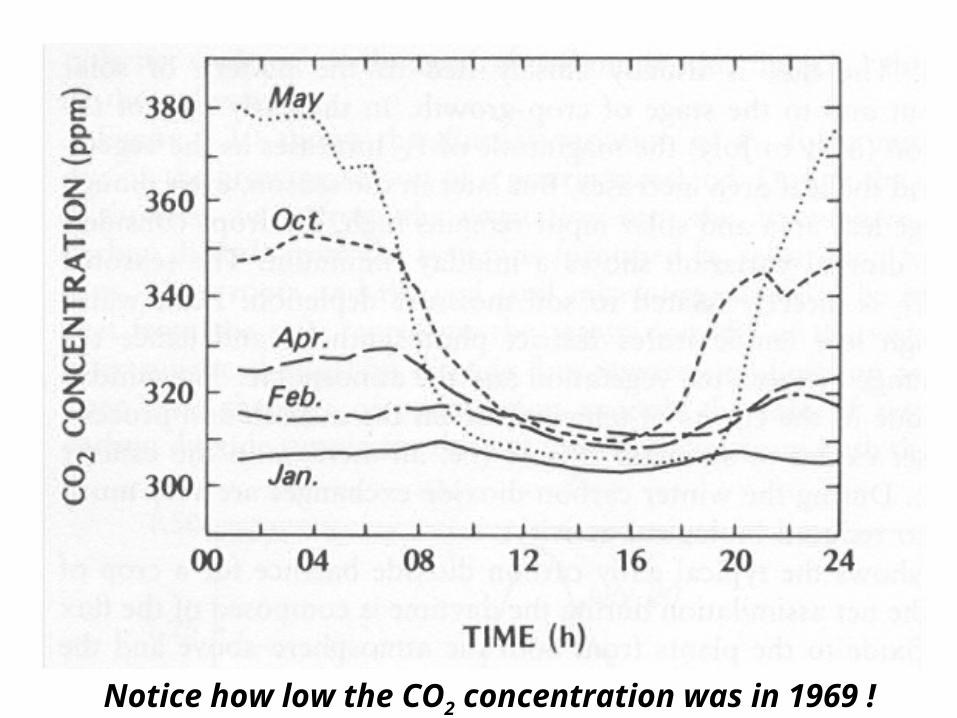
Notice how low the CO2 concentration was in 1969 !

Canopy Radiation Budget
- Incident light greatest at crown and decreases logarithmically with depth in the canopy
- Approximated by Beer’s Law for canopy extinction
K(z) = K0e-kLAI
k is a canopy-specific extinction coefficient (0.4-0.9)(‘a’ in Oke)
LAI is the leaf area index (m2 leaf m-2 ground) accumulatedfrom the top of the canopy to the level in question(‘A1(z)’ in Oke)

Q* influencesthe temperatureand humidityStructure withina canopy


Leaf temperatureremained cooldue to evaporation
Decreasing lightintensity or increasing water stress
Dew present
Energy balanceover an Englishbarley field
cloud cover
QE dominated indissipating radiativesurplus


LAIPPARk
ePPARP
LAIk
c
max
)(max ]1[
Net canopy photosynthesis (Pc)
Charles-Edwards (1986)

Photosynthetically-active radiation(“direct” portion,0.3-0.4 CI, 0400h-1200h)
0400-0500h 0500-0600h 0600-0700h 0700-0800h
0800-0900h 0900-1000h 1000-1100h 1100-1200h

-70
-60
-50
-40
-30
-20
-10
0
10
20
0 1 2 3 4 5 6 7 8
August
November
Rel
ativ
e pr
od
ucti
vity
(%
)
Leaf Area Index (LAI)
Effect of LAI on Pc

-60-50-40-30-20-10
010203040
0 0.2 0.4 0.6 0.8 1
August (1400m)November (1400m)August (1600m)November (1600m)
Rel
ativ
e pr
od
ucti
vity
(%
)
Canopy leaf respiration rate (molCm-2s-1)
Effect of Respiration Parameter on Pc

-25
-20
-15
-10
-5
0
5
10
0.2 0.4 0.6 0.8 1
August
November
Rel
ativ
e pr
od
ucti
vity
(%
)
Extinction coefficient, k
Effect of Extinction Coefficient, k, on Pc

Soil respiration measurements

There is a much easier way toassess productivity…
A micrometeorological solution:Eddy correlation

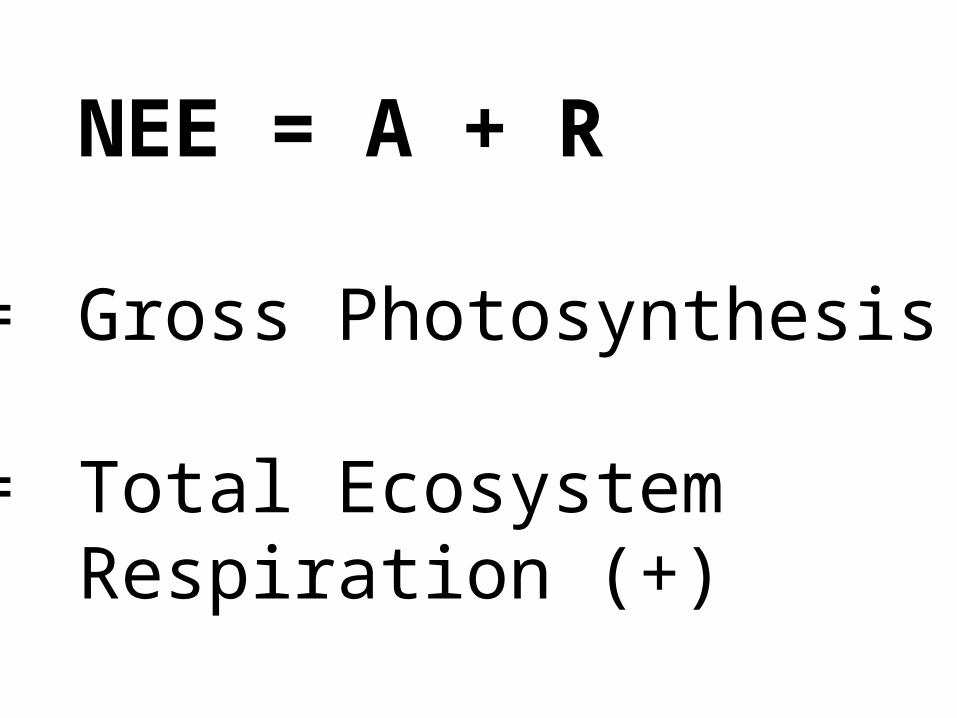
NEE = A + R
A = Gross Photosynthesis (-)
R = Total EcosystemRespiration (+)
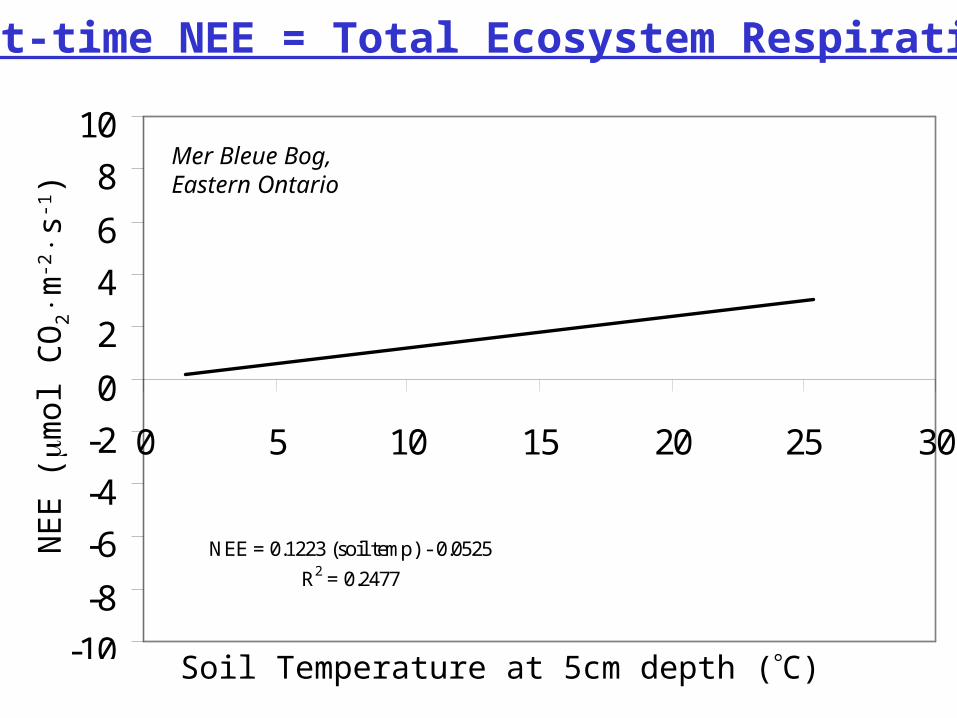
NEE = 0.1223 (soil temp) - 0.0525
R2 = 0.2477
-10
-8
-6
-4
-2
0
2
4
6
8
10
0 5 10 15 20 25 30
Night-time NEE = Total Ecosystem RespirationN
EE
(m
ol C
O2
m-2s
-1)
Soil Temperature at 5cm depth (C)
Mer Bleue Bog,Eastern Ontario

-12
-8
-4
0
4
8
0 1000 2000
Daytime NEE Gross Photosynthesis – Total Ecosystem Respiration
NE
E (m
ol C
O2
m-2s
-1)
Photosynthetically-active radiation (molm-2s-1)


Fluxnet-Canada Carbon Flux Stations
Coastal conifers
Southern boreal conifers and hardwoods Boreal
mixedwood
Balsam fir
Eastern peatlandWestern
peatland
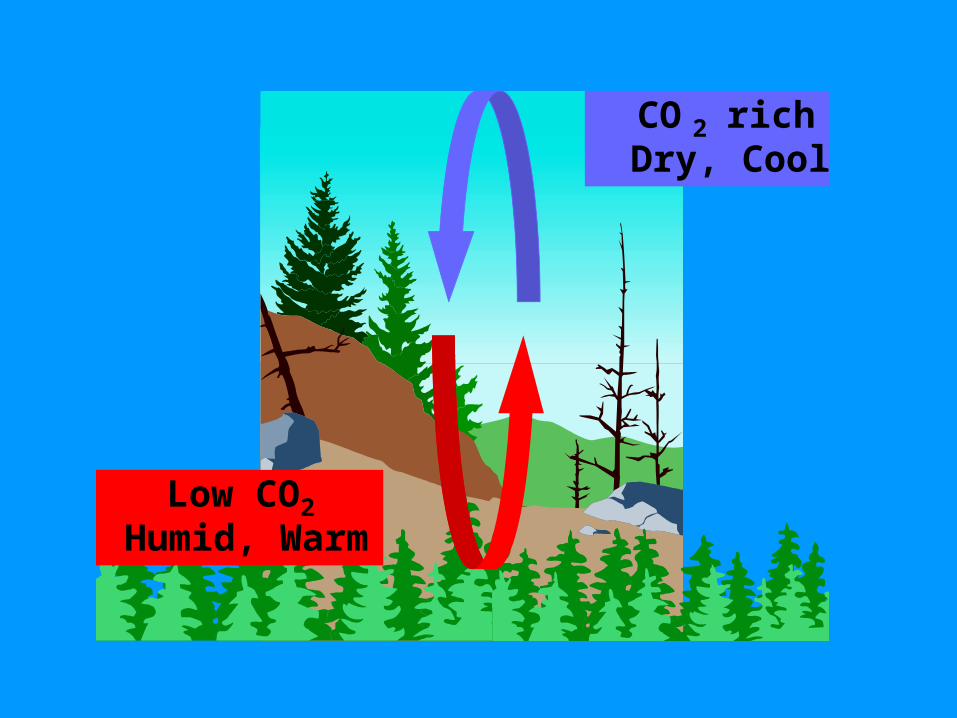
CO2 richDry, Cool
Low CO2
Humid, Warm


Source: Dr. Larry Flanagan

c
Distance
Profile View
c
Top View
Footprint: Area affecting measurements at the tower varies withwind speed, wind direction, roughness, stability etc.
The black area has the greatestinfluence on tower measurements


![[Introduction] - WordPress.com...Chapter - Introduction Discrete Structures Samujjwal Bhandari 4 Disjunction (or) Given two propositions p and q, the proposition “p or q” denoted](https://img.dokumen.tips/doc/110x75/5f038d747e708231d4099e3a/introduction-chapter-introduction-discrete-structures-samujjwal-bhandari.jpg)