Embed Size (px)
Citation preview
J. R. Soc. Interface (2011) 8, 740–755
on July 30, 2018http://rsif.royalsocietypublishing.org/Downloaded from
*Author for c
Electronic sup10.1098/rsif.2
doi:10.1098/rsif.2010.0466Published online 28 October 2010
Received 25 AAccepted 8 O
Adaptations for economical bipedalrunning: the effect of limb structure on
three-dimensional joint mechanicsJonas Rubenson1,*, David G. Lloyd1, Denham B. Heliams2,
Thor F. Besier3 and Paul A. Fournier1
1School of Sport Science, Exercise and Health, University of Western Australia,Crawley, Western Australia 6009, Australia
2Fauna Technology, PO Box 558, Gosnells, Western Australia 6990, Australia3Department of Orthopaedic Surgery, Stanford University, Stanford, CA 94305, USA
The purpose of this study was to examine the mechanical adaptations linked to economical loco-motion in cursorial bipeds. We addressed this question by comparing mass-matched humansand avian bipeds (ostriches), which exhibit marked differences in limb structure and runningeconomy. We hypothesized that the nearly 50 per cent lower energy cost of running in ostrichesis a result of: (i) lower limb-swing mechanical power, (ii) greater stance-phase storage and releaseof elastic energy, and (iii) lower total muscle power output. To test these hypotheses, we usedthree-dimensional joint mechanical measurements and a simple model to estimate the elasticand muscle contributions to joint work and power. Contradictory to our first hypothesis, wefound that ostriches and humans generate the same amounts of mechanical power to swingthe limbs at a similar self-selected running speed, indicating that limb swing probably doesnot contribute to the difference in energy cost of running between these species. In contrast,we estimated that ostriches generate 120 per cent more stance-phase mechanical joint powervia release of elastic energy compared with humans. This elastic mechanical power occursnearly exclusively at the tarsometatarso-phalangeal joint, demonstrating a shift of mechanicalpower generation to distal joints compared with humans. We also estimated that positivemuscle fibre power is 35 per cent lower in ostriches compared with humans, and is accountedfor primarily by higher capacity for storage and release of elastic energy. Furthermore, our analy-sis revealed much larger frontal and internal/external rotation joint loads during ostrich runningthan in humans. Together, these findings support the hypothesis that a primary limb structurespecialization linked to economical running in cursorial species is an elevated storage and releaseof elastic energy in tendon. In the ostrich, energy-saving specializations may also include passivefrontal and internal/external rotation load-bearing mechanisms.
Keywords: bipedal; joint mechanics; cursorial; ostrich; cost of transport; running
1. INTRODUCTION
Cursorial animal species are characterized by a limbmorphology with lighter (and often reduced) skeletalelements, more proximally located muscle mass andelongated distal limb segments and tendons that arethought to allow faster and more economical running[1]. The ostrich, for example can achieve extraordinaryspeeds (greater than 50 km h21) and possess a remark-able economy of locomotion; for their size, their energycost of running (J kg21 m21) is among the lowestrecorded [2]. What are the specific relationshipsbetween cursorial musculoskeletal specializations andgait mechanics that allow these species to run with alow metabolic energy cost? This question has been of
orrespondence ( [email protected]).
plementary material is available at http://dx.doi.org/010.0466 or via http://rsif.royalsocietypublishing.org.
ugust 2010ctober 2010 740
interest to biologists trying to understand structure–function relationships among both extant species[3–5] and extinct species such as dinosaurs [1,6] orearly hominids [7–9]. The relationship between limbstructure and locomotor economy is also pertinent toseveral bioengineering fields. For example, the emergingdiscipline of bioinspired robotics aims to exploit designprinciples found in nature in order to achieve agile,stable and economical robot locomotion [10–12]. Like-wise, the design of energy-efficient prosthetic limbsand limb orthoses for assisting human locomotiondepends on a sound understanding of the relationshipbetween limb structure and locomotor mechanics andeconomy [13,14]. Engineered solutions for robotic andhuman locomotion can thus benefit from the insightsand principles learnt in addressing biological questionssuch as the one posed above.
Our current understanding of the link between limbstructure and locomotor mechanics and economy stems
This journal is q 2010 The Royal Society
knee
knee
hip
hip
ankle
ankle
femur
femur
tibia
foot
pelvispelvis
phalanges
tibiotarsus
tarso-metatarsus
TMP
(a) (b)
(c) (d)
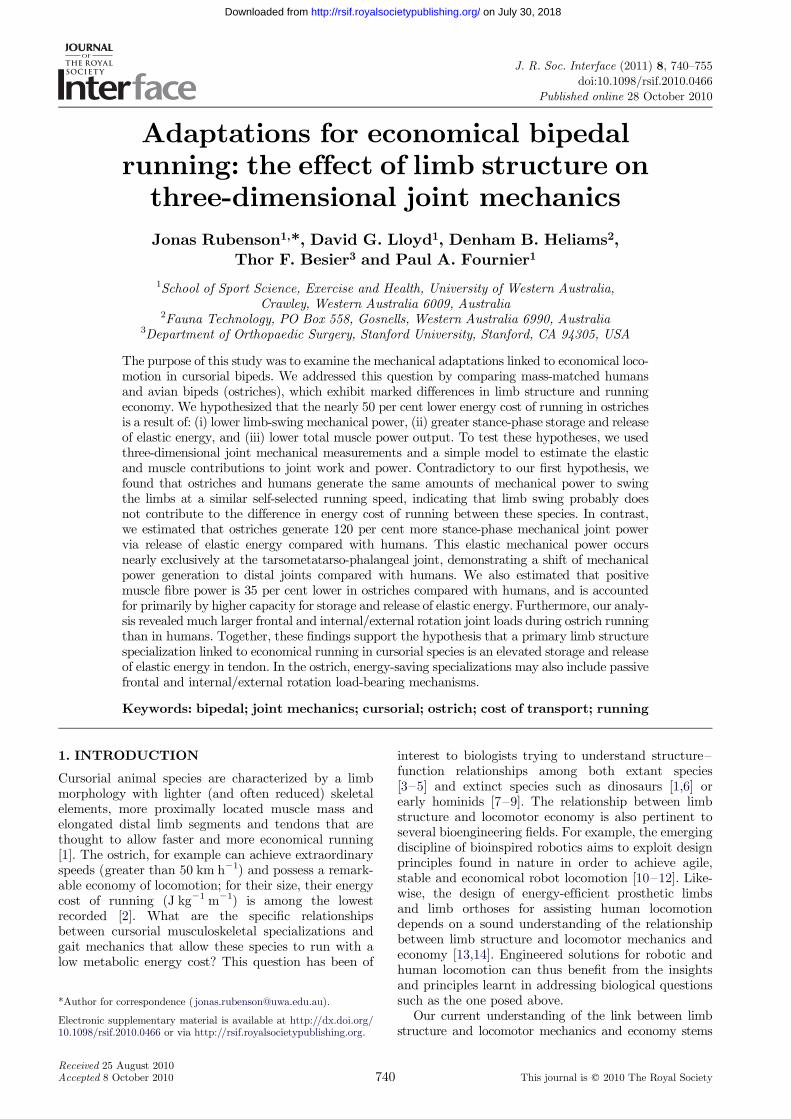
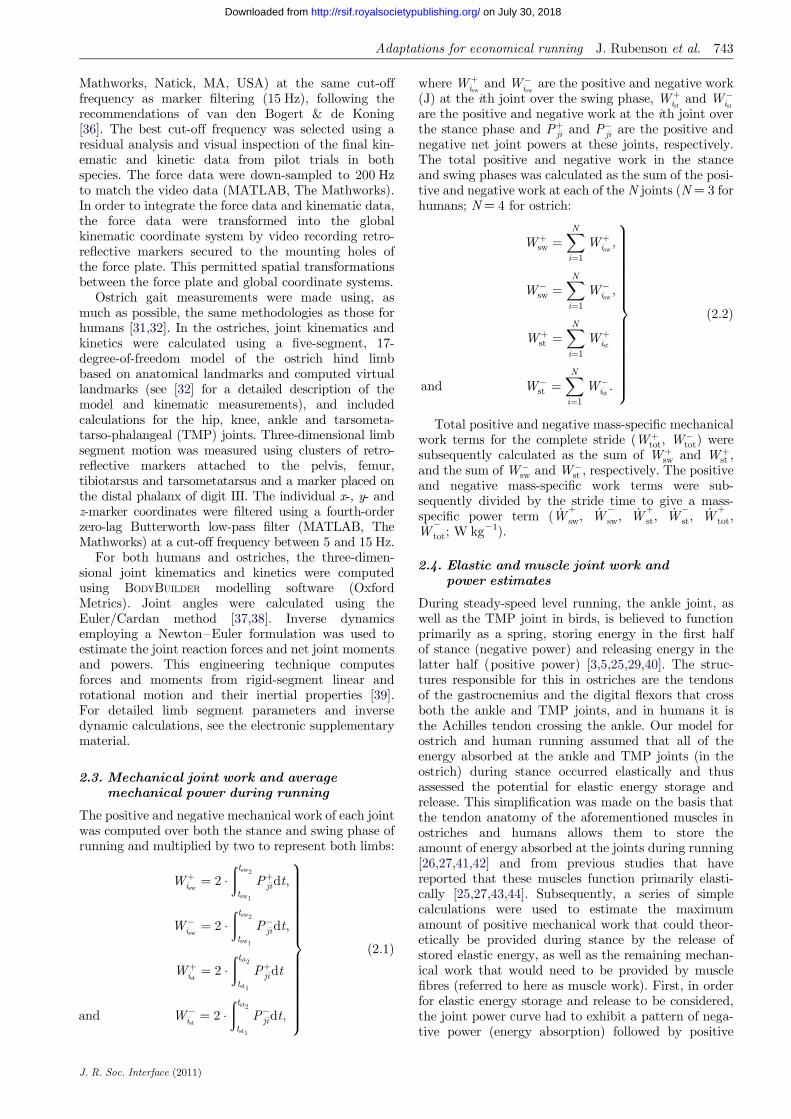
Figure 1. Human and ostrich hind-limb postures during mid-stance of running: (a,b) sagittal plane; (c,d) frontal plane. Note: onlythe right limb is displayed for the ostrich. The vertical line represents the orientation of the ground reaction force vector. Thecircular mark represents the position of the combined centre of mass for all lower limb segments of the right limb (excludingpelvis). Differences between limb structures include: (i) a more distal limb-mass distribution in humans compared with ostriches,(ii) a plantigrade posture where the metatarsal bones of the foot are kept in contact with the ground in humans compared with adigitigrade posture in ostriches (walking/running on toes), resulting in a longer effective limb length and an additional joint forstoring and releasing elastic energy (tarsometatarso-phalangeal (TMP) joint), and (iii) shorter tendons crossing the distal joints(ankle and TMP) in humans compared with ostriches; tendons crossing these joints originate from muscle–tendon junctions closeto the knee joint (and mid-shank for the human soleus). Images developed from Vicon BODYBUILDER software (Oxford Metrics,Oxford, UK) and bone images from OPENSIM software at corresponding limb postures (SIMTK; www.simtk.org). For motion filesof ostrich and human running, see electronic supplementary material.
Adaptations for economical running J. Rubenson et al. 741
on July 30, 2018http://rsif.royalsocietypublishing.org/Downloaded from
predominantly from anatomical studies (e.g. [15–17]) andscaling studies, where the effect of size is the key variableof interest [18–21]. Surprisingly, what remains much lessstudied are the mass-independent effects of limb structureon locomotor mechanics and economy, and thus the influ-ence of limb structure per se remains unclear.
Two common explanations for economical running incursorial animals are: (i) that a reduced number ofbones in the distal limb and a more proximal limb-mass distribution reduce lower limb mass and momentof inertia, and subsequently the mechanical powerrequired for limb swing (swing phase of running)[4,22,23] and (ii) that greater storage and release of elas-tic strain energy in tendons reduces the mechanicalpower required of muscle fibres during the stancephase of running [3,5,24,25]. Although there is anatom-ical evidence to support both these hypotheses
J. R. Soc. Interface (2011)
[5,16,17,26], little quantitative data exist on the extentto which these musculoskeletal adaptations affectlocomotor mechanics and energetics.
The purpose of this study was to compare the limbmechanics between a species with a cursorial limbstructure and low energy cost of running to that witha non-cursorial limb structure and a higher energycost of running, but which share a common bodymass. We have chosen to study ostrich and humanbipedalism among the many possible choices of speciesbecause such a comparison offers several advantages.Firstly, ostriches and humans have a similar mass andthe contrast between their limb structures is more pro-nounced than those found between most other suitableanimals, exemplifying the cursorial adaptations linkedto economical locomotion (figure 1; also see electronicsupplementary material, table S1 and motion files).
742 Adaptations for economical running J. Rubenson et al.
on July 30, 2018http://rsif.royalsocietypublishing.org/Downloaded from
These adaptations include: (i) a digitigrade stance inostriches (standing on digits with raised metatarsalbones) versus a plantigrade stance in humans (standingwith metatarsals flush to the ground), (ii) a longer limblength, reduced distal limb bones and a more proximallimb-mass distribution [26] (figure 1), and (iii) longertendons with a greater capacity for elastic energystorage and release [26,27]. Secondly, ostriches andhumans are compared because ostriches are able toreach maximal speeds two times those of humans (60versus 30 km h21) [27] and, importantly, have a meta-bolic cost of running that is nearly 50 per cent lower[2,28]. Finally, by comparing ostrich with human biped-alism, the information gained may be more readilyapplied to human-based technologies (e.g. prostheticlimb design, rehabilitation robotics).
Our primary aims were to test the following threehypotheses: (i) the joint work and power required forlimb swing is lower in ostriches compared withhumans, (ii) the estimated joint work and power attrib-uted to storage and release of elastic energy duringstance is greater in ostriches compared with humans,and (iii) the estimated joint mechanical power attributedto muscle fibres during running is lower in ostriches com-pared with humans. These hypotheses were tested usingthree-dimensional inverse dynamic analysis techniquesand a simple model of joint actuation. Furthermore,given that relatively little is known about bipedal jointmechanics in a comparative context despite the well-accepted merit of joint mechanics to understandinggait function [29,30], another aim of this study was toexplore the magnitude and distribution of three-dimensional joint moments and mechanical work andpower across the hind-limb joints between human andavian bipedal running. Measurements were made inthree dimensions because considerable informationregarding joint kinematics [31,32] and bone loading[33,34] is known for non-sagittal planes in both speciesand thus analyses restricted to the sagittal plane mayobscure important structure–function relationships.These analyses allow for a detailed understanding ofthe relationship between limb structure and itsinfluence on locomotor function.
2. METHODS
2.1. Animals and human subjects
Five recreationally active male participants volunteeredto participate (mean mass 70.5+ 0.5 kg s.d.; mean hipheight and total limb segment length 0.94+ 0.03 and1.14+ 0.05 m s.d., respectively; mean age 25+ 1.5years s.d.). Five ostriches obtained from a local breederwere hand-reared and trained 3–4 days per week for aperiod of eight months prior to biomechanical analyses(mean mass at time of experiment 75.2+ 0.5 kg s.d.;mean hip height and total limb segment length1.15+ 0.09 and 1.40+ 0.05 m s.d., respectively; age12–14 months). After training, two animals (mass70.0 and 78.7 kg) were amenable to the proceduresrequired for full three-dimensional gait analysis.A third animal (mass 75.9 kg) provided additionaldata on three-dimensional pelvic motion as well as
J. R. Soc. Interface (2011)
overall three-dimensional limb displacement, and allfive animals provided three-dimensional ground reac-tion force data. All ground reaction force andkinematic data matched closely those of the animalsused for full three-dimensional gait measurements. Ani-mals were kept in a large outdoor field (5000 m2) andprovided with unlimited access to food and water. Allexperiments were performed in accordance with theAnimal and Human Ethics Committees of the Univer-sity of Western Australia.
2.2. Three-dimensional jointkinematics and kinetics
The procedures used for three-dimensional joint kinematicand kinetic measurements in humans and ostriches havebeen detailed in Besier et al. [31], and three-dimensionaljoint kinematic measurements in ostriches have been pre-viously detailed in Rubenson et al. [32]. Briefly, motionanalysis of the humans was performed using a six-cameraVicon motion analysis system (Oxford Metrics, Oxford,UK; 200 Hz) with a 1200 mm � 600 mm force plate(AMTI, Watertown, MA, USA; 2000 Hz). Retro-reflectivemarkers were placed on each subject’s lower body markerset and consisted of markers placed on anatomical land-marks (hip and foot), and clusters of three markers onthe thigh and shank [31]. Prior to testing, subject cali-bration trials were performed [31] to locate anatomicallandmarks and define joint coordinates systems. Thesefunctional hip and knee tasks were performed to locatehip joint centres by fitting a sphere to the motion of thethigh markers, with the knee joint flexion/extensionaxes defined using a mean helical axis-based method.The subject also stood on a foot calibration rig, whichwas used to establish the position of the foot markersand to measure foot abduction/adduction and rear footinversion/eversion angles. These protocols have beenshown to improve repeatability of joint kinematic and kin-etic data [31]. Subjects were asked to run at a comfortable,freely chosen speed (recorded by timing gates). Thesespeeds corresponded well to those observed for ostriches(3.0–3.5 m s21), and only those trials that matched therunning speed of ostriches were selected for analysis.
Ostrich gait analyses were made on a custom-built50 m long outdoor gait runway equipped with two200 Hz video cameras (Peak Performance, Centenial,CO, USA) and a 600 � 400 mm force plate (KistlerType 9865E; Winterthur, Switzerland), and con-structed with similar surface materials to those of thehuman laboratory. An approximately 3 m3 calibratedvolume was constructed at the centre of the runwayusing a direct linear transformation method withPEAK MOTUS software [35]. The animals’ self-selectedrunning speeds were determined both from timinggates and from kinematic data. Motion capture trialswere performed at night under artificial light in orderto optimize marker tracking. Ground reaction force sig-nals were sampled at 2000 Hz and synchronized withthe video capture using a manually triggered þ5 Vsquare wave that generated a barcode on the corre-sponding video field. The marker motion and groundreaction force data were filtered using a fourth-orderzero-lag Butterworth low-pass filter (MATLAB, The
Adaptations for economical running J. Rubenson et al. 743
on July 30, 2018http://rsif.royalsocietypublishing.org/Downloaded from
Mathworks, Natick, MA, USA) at the same cut-offfrequency as marker filtering (15 Hz), following therecommendations of van den Bogert & de Koning[36]. The best cut-off frequency was selected using aresidual analysis and visual inspection of the final kin-ematic and kinetic data from pilot trials in bothspecies. The force data were down-sampled to 200 Hzto match the video data (MATLAB, The Mathworks).In order to integrate the force data and kinematic data,the force data were transformed into the globalkinematic coordinate system by video recording retro-reflective markers secured to the mounting holes ofthe force plate. This permitted spatial transformationsbetween the force plate and global coordinate systems.
Ostrich gait measurements were made using, asmuch as possible, the same methodologies as those forhumans [31,32]. In the ostriches, joint kinematics andkinetics were calculated using a five-segment, 17-degree-of-freedom model of the ostrich hind limbbased on anatomical landmarks and computed virtuallandmarks (see [32] for a detailed description of themodel and kinematic measurements), and includedcalculations for the hip, knee, ankle and tarsometa-tarso-phalangeal (TMP) joints. Three-dimensional limbsegment motion was measured using clusters of retro-reflective markers attached to the pelvis, femur,tibiotarsus and tarsometatarsus and a marker placed onthe distal phalanx of digit III. The individual x-, y- andz-marker coordinates were filtered using a fourth-orderzero-lag Butterworth low-pass filter (MATLAB, TheMathworks) at a cut-off frequency between 5 and 15 Hz.
For both humans and ostriches, the three-dimen-sional joint kinematics and kinetics were computedusing BODYBUILDER modelling software (OxfordMetrics). Joint angles were calculated using theEuler/Cardan method [37,38]. Inverse dynamicsemploying a Newton–Euler formulation was used toestimate the joint reaction forces and net joint momentsand powers. This engineering technique computesforces and moments from rigid-segment linear androtational motion and their inertial properties [39].For detailed limb segment parameters and inversedynamic calculations, see the electronic supplementarymaterial.
2.3. Mechanical joint work and averagemechanical power during running
The positive and negative mechanical work of each jointwas computed over both the stance and swing phase ofrunning and multiplied by two to represent both limbs:
Wþisw ¼ 2 �
ðtsw2
tsw1
Pþjidt;
W�isw ¼ 2 �
ðtsw2
tsw1
P�jidt;
Wþist ¼ 2 �
ðtst2
tst1
Pþjidt
and W�ist ¼ 2 �
ðtst2
tst1
P�jidt;
9>>>>>>>>>>>>>>>>=>>>>>>>>>>>>>>>>;
ð2:1Þ
J. R. Soc. Interface (2011)
where Wþisw and W�
isw are the positive and negative work(J) at the ith joint over the swing phase, Wþ
ist and W�ist
are the positive and negative work at the ith joint overthe stance phase and Pþji and P�ji are the positive andnegative net joint powers at these joints, respectively.The total positive and negative work in the stanceand swing phases was calculated as the sum of the posi-tive and negative work at each of the N joints (N ¼ 3 forhumans; N ¼ 4 for ostrich:
Wþsw ¼
XNi¼1
Wþisw ;
W�sw ¼
XNi¼1
W�isw ;
Wþst ¼
XNi¼1
Wþist
and W�st ¼
XNi¼1
W�ist :
9>>>>>>>>>>>>>>>>>=>>>>>>>>>>>>>>>>>;
ð2:2Þ
Total positive and negative mass-specific mechanicalwork terms for the complete stride (Wþ
tot, W�tot) were
subsequently calculated as the sum of Wþsw and Wþ
st ,and the sum of W�
sw and W�st , respectively. The positive
and negative mass-specific work terms were sub-sequently divided by the stride time to give a mass-specific power term ( _W
þsw, _W
�sw, _W
þst, _W
�st, _W
þtot,
_W�tot; W kg21).
2.4. Elastic and muscle joint work andpower estimates
During steady-speed level running, the ankle joint, aswell as the TMP joint in birds, is believed to functionprimarily as a spring, storing energy in the first halfof stance (negative power) and releasing energy in thelatter half (positive power) [3,5,25,29,40]. The struc-tures responsible for this in ostriches are the tendonsof the gastrocnemius and the digital flexors that crossboth the ankle and TMP joints, and in humans it isthe Achilles tendon crossing the ankle. Our model forostrich and human running assumed that all of theenergy absorbed at the ankle and TMP joints (in theostrich) during stance occurred elastically and thusassessed the potential for elastic energy storage andrelease. This simplification was made on the basis thatthe tendon anatomy of the aforementioned muscles inostriches and humans allows them to store theamount of energy absorbed at the joints during running[26,27,41,42] and from previous studies that havereported that these muscles function primarily elasti-cally [25,27,43,44]. Subsequently, a series of simplecalculations were used to estimate the maximumamount of positive mechanical work that could theor-etically be provided during stance by the release ofstored elastic energy, as well as the remaining mechan-ical work that would need to be provided by musclefibres (referred to here as muscle work). First, in orderfor elastic energy storage and release to be considered,the joint power curve had to exhibit a pattern of nega-tive power (energy absorption) followed by positive

–(abs)
+(gen)
(a) (b)
Wel+
Wmus
Wel–
Wel+
Wel–
+
Figure 2. A graphical representation of the calculation of the negative and positive elastic work and the positive muscle fibre workestimated at the joints during running. The power traces represent scenarios where either (a) all of the positive joint work (areaunder joint power curve) is provided by the recoil of stored elastic strain energy or (b) where only a fraction of the positive jointwork is provided passively by the recoil of stored elastic strain energy with the remainder attributed to muscle fibres.
744 Adaptations for economical running J. Rubenson et al.
on July 30, 2018http://rsif.royalsocietypublishing.org/Downloaded from
power (energy generation). Calculations were onlymade over these portions of the joint power curves(typically only one clear absorption–generationsequence was present). We assumed that the elasticenergy storage equalled the negative work at the ankleand TMP joints (W�
astand W�
tmpst, respectively). We
subsequently estimated the positive mass-specific mus-cular work at the ankle and TMP joints that couldnot be provided by elastic recoil by integrating thejoint power over its absorption–generation phase. If anegative value was computed, it was assumed that allthe positive joint work was supplied through elasticrecoil and no muscle work was required at the joint(i.e. net absorption of energy; figure 2):
Wþmusa;st ¼ max 0;
ðt2
t1Padt
� �
and Wþmustmp;st ¼ max 0;
ðt2
t1Ptmpdt
� �;
9>>>=>>>;
ð2:3Þ
where Wþmusa;st and Wþ
mustmp;st are the positive mass-specific muscle work during stance at the ankle andTMP joints of a single limb, respectively. Finally, thepositive elastic work during the stride was estimated as
Wþel ¼ 2 �
ðtst2
tst1Pþa dt �Wþ
musa;st
� ��
þðtst2
tst1Pþtmpdt �Wþ
mustmp;st
� ��: ð2:4Þ
The total muscle work over the stride was computedby subtracting the positive elastic work (Wþ
el ) from thetotal positive mechanical work (Wþ
tot). Finally, themass-specific positive mechanical power attributed toelastic recoil ( _W
þel) and muscle ( _W
þmus) was computed
by dividing the positive elastic work and positivemuscle work by stride time, respectively.
2.5. Comparison of net joint moment,power and work distribution
In order to compare the pattern and distribution of thenet joint moments and powers between ostriches andhumans, we normalized the moment and power tracesto 101 points over one stride using a cubic spline
J. R. Soc. Interface (2011)
interpolation, allowing a mean+ s.d. of the kineticcurves to be determined for each group. The distri-bution of mechanical work among the hind-limb jointswas compared between species by partitioning thejoint work as follows: (i) positive and negative stance-phase joint mechanical work at each joint expressedas a percentage of the total positive and negativestance-phase work, respectively, and (ii) positive andnegative swing-phase joint mechanical work at eachjoint expressed as a percentage of the total positiveand negative swing-phase work, respectively.
2.6. Statistics
Joint moments, power and work were normalized tobody mass in order to take into account any effect ofsmall mass differences. We also performed jointmoment comparisons normalized to body mass andtotal leg segment length (dimensionless) given that leglength can affect joint moment magnitudes. Althoughallometric normalizing can non-dimensionalize thedata, this has a negligible effect on our comparisonbecause of the small (approx. 5%) between-speciesdifference in body mass. Running trials for analysiswere restricted within a narrow range of self-selectedspeeds, ranging from 3.0 to 3.5 m s21 in order to mini-mize speed effects on our comparisons. Furthermore,at running speeds above 3 m s21, both humans andostriches adopt a dynamic running gait (where thegravitational and kinetic energies of the centre ofmass fluctuate in phase) that includes an aerial phase[28], indicating a dynamically similar gait in bothspecies. A minimum of five trials per individual wereused to calculate individual mean data, which weresubsequently used for group mean comparisons.An unpaired, one-tailed Student’s t-test was used tocompare limb-swing mechanical work (predicted to belower in ostriches compared with humans) and the esti-mated elastic and muscle fibre work (predicted to behigher and lower in ostriches compared with humans,respectively). Peak joint moments and joint work distri-bution were compared using a two-tailed Student’st-test. The variance in the data in each group wasassessed and found not to be significantly different(equal variance) using an F-test. The alpha level wasset to p , 0.05.
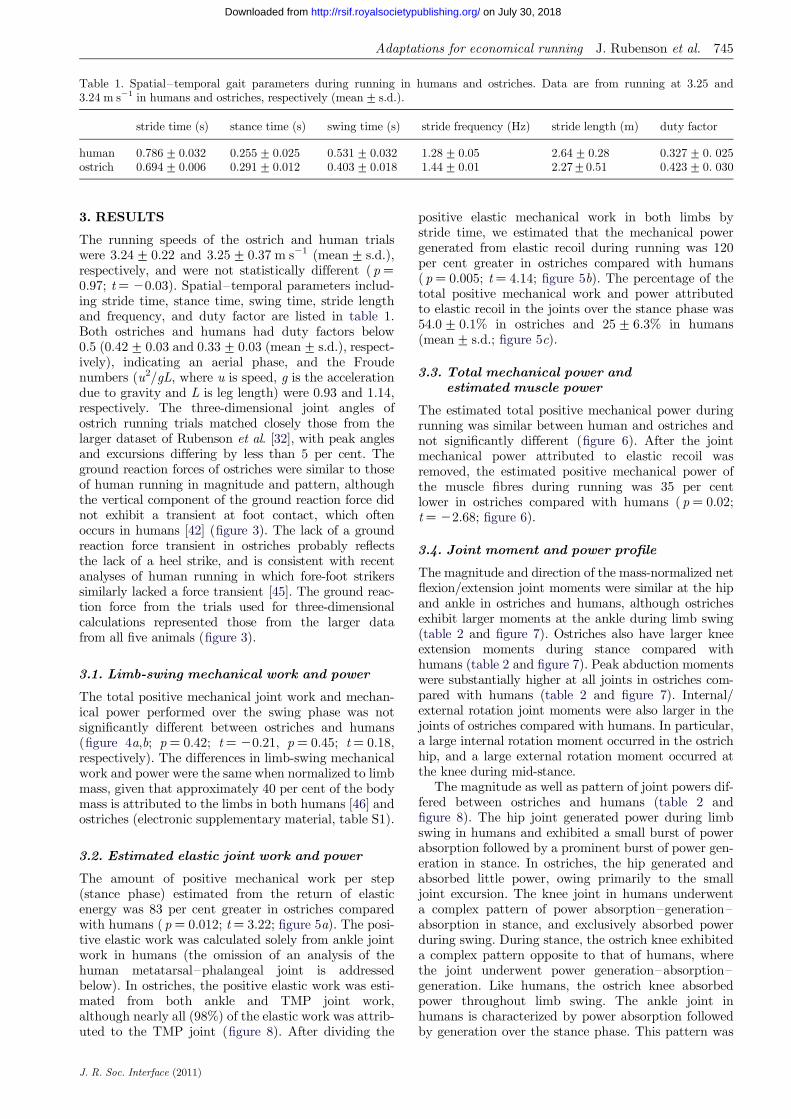
Table 1. Spatial–temporal gait parameters during running in humans and ostriches. Data are from running at 3.25 and3.24 m s21 in humans and ostriches, respectively (mean+ s.d.).
stride time (s) stance time (s) swing time (s) stride frequency (Hz) stride length (m) duty factor
human 0.786+0.032 0.255+ 0.025 0.531+ 0.032 1.28+0.05 2.64+0.28 0.327+ 0. 025ostrich 0.694+0.006 0.291+ 0.012 0.403+ 0.018 1.44+0.01 2.27+0.51 0.423+ 0. 030
Adaptations for economical running J. Rubenson et al. 745
on July 30, 2018http://rsif.royalsocietypublishing.org/Downloaded from
3. RESULTS
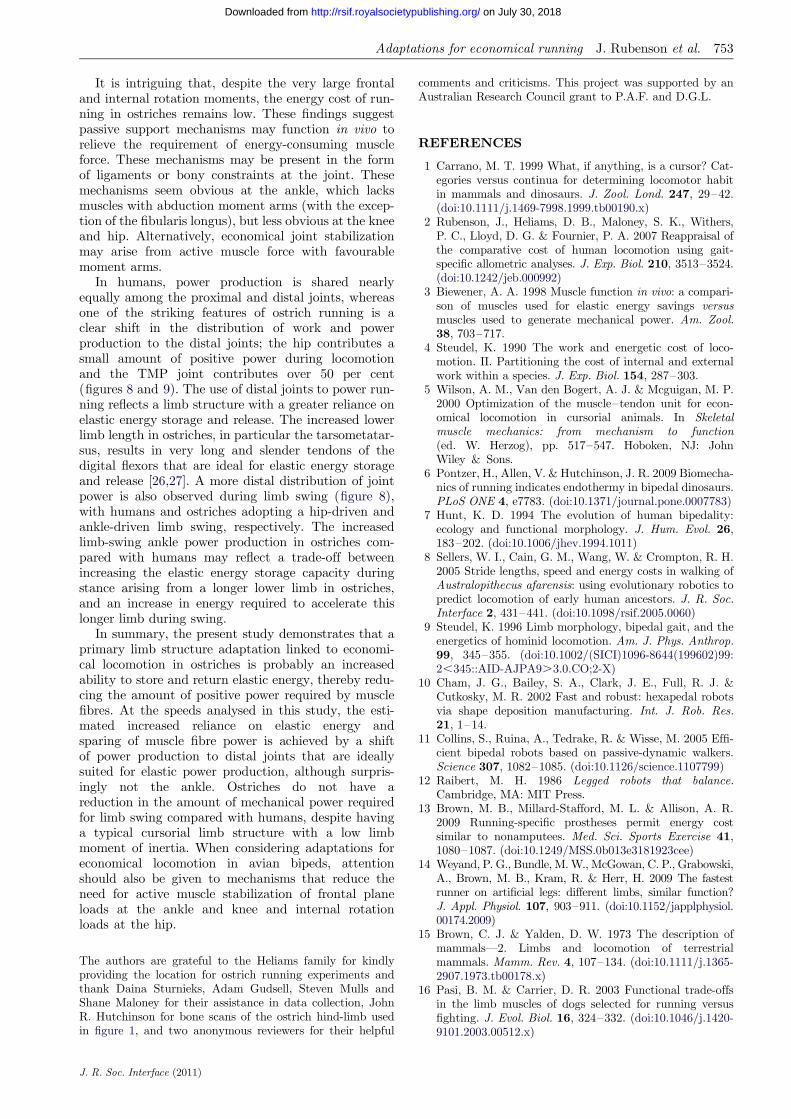
The running speeds of the ostrich and human trialswere 3.24+ 0.22 and 3.25+ 0.37 m s21 (mean+ s.d.),respectively, and were not statistically different (p ¼0.97; t ¼ 20.03). Spatial–temporal parameters includ-ing stride time, stance time, swing time, stride lengthand frequency, and duty factor are listed in table 1.Both ostriches and humans had duty factors below0.5 (0.42+ 0.03 and 0.33+ 0.03 (mean+ s.d.), respect-ively), indicating an aerial phase, and the Froudenumbers (u2/gL, where u is speed, g is the accelerationdue to gravity and L is leg length) were 0.93 and 1.14,respectively. The three-dimensional joint angles ofostrich running trials matched closely those from thelarger dataset of Rubenson et al. [32], with peak anglesand excursions differing by less than 5 per cent. Theground reaction forces of ostriches were similar to thoseof human running in magnitude and pattern, althoughthe vertical component of the ground reaction force didnot exhibit a transient at foot contact, which oftenoccurs in humans [42] (figure 3). The lack of a groundreaction force transient in ostriches probably reflectsthe lack of a heel strike, and is consistent with recentanalyses of human running in which fore-foot strikerssimilarly lacked a force transient [45]. The ground reac-tion force from the trials used for three-dimensionalcalculations represented those from the larger datafrom all five animals (figure 3).
3.1. Limb-swing mechanical work and power
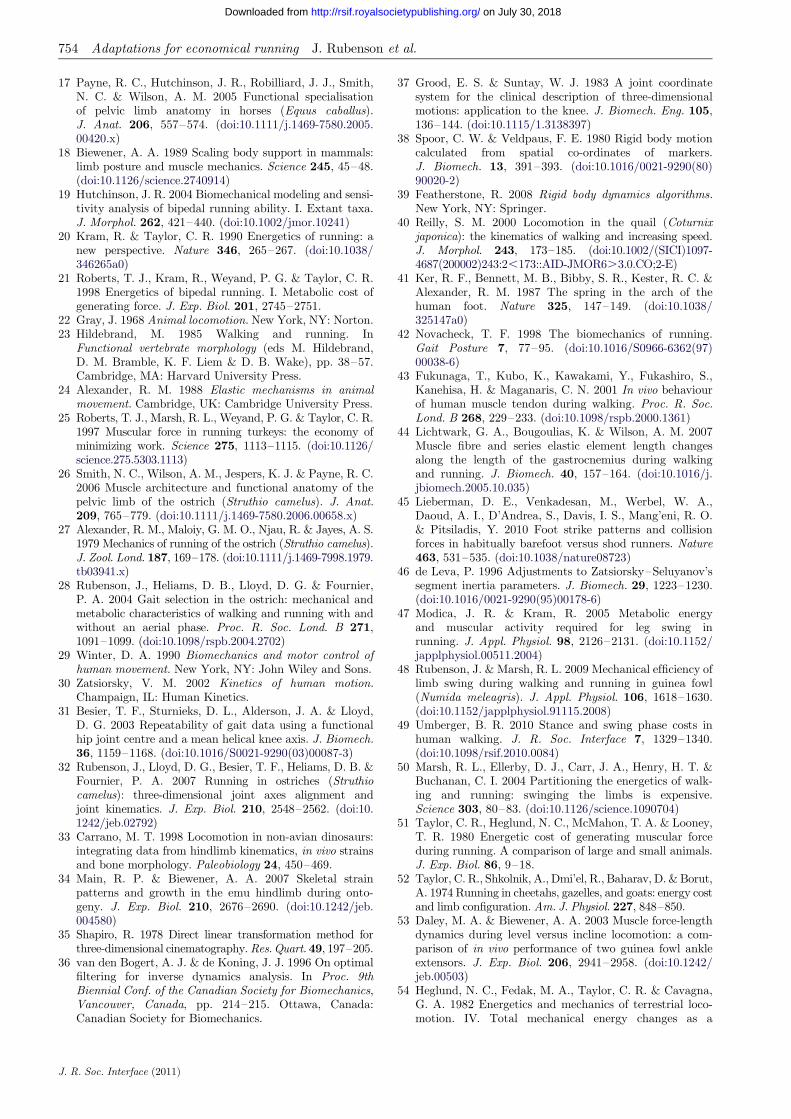
The total positive mechanical joint work and mechan-ical power performed over the swing phase was notsignificantly different between ostriches and humans(figure 4a,b; p ¼ 0.42; t ¼ 20.21, p ¼ 0.45; t ¼ 0.18,respectively). The differences in limb-swing mechanicalwork and power were the same when normalized to limbmass, given that approximately 40 per cent of the bodymass is attributed to the limbs in both humans [46] andostriches (electronic supplementary material, table S1).
3.2. Estimated elastic joint work and power
The amount of positive mechanical work per step(stance phase) estimated from the return of elasticenergy was 83 per cent greater in ostriches comparedwith humans ( p ¼ 0.012; t ¼ 3.22; figure 5a). The posi-tive elastic work was calculated solely from ankle jointwork in humans (the omission of an analysis of thehuman metatarsal–phalangeal joint is addressedbelow). In ostriches, the positive elastic work was esti-mated from both ankle and TMP joint work,although nearly all (98%) of the elastic work was attrib-uted to the TMP joint (figure 8). After dividing the
J. R. Soc. Interface (2011)
positive elastic mechanical work in both limbs bystride time, we estimated that the mechanical powergenerated from elastic recoil during running was 120per cent greater in ostriches compared with humans( p ¼ 0.005; t ¼ 4.14; figure 5b). The percentage of thetotal positive mechanical work and power attributedto elastic recoil in the joints over the stance phase was54.0+ 0.1% in ostriches and 25+ 6.3% in humans(mean+ s.d.; figure 5c).
3.3. Total mechanical power andestimated muscle power
The estimated total positive mechanical power duringrunning was similar between human and ostriches andnot significantly different (figure 6). After the jointmechanical power attributed to elastic recoil wasremoved, the estimated positive mechanical power ofthe muscle fibres during running was 35 per centlower in ostriches compared with humans (p ¼ 0.02;t ¼ 22.68; figure 6).
3.4. Joint moment and power profile
The magnitude and direction of the mass-normalized netflexion/extension joint moments were similar at the hipand ankle in ostriches and humans, although ostrichesexhibit larger moments at the ankle during limb swing(table 2 and figure 7). Ostriches also have larger kneeextension moments during stance compared withhumans (table 2 and figure 7). Peak abduction momentswere substantially higher at all joints in ostriches com-pared with humans (table 2 and figure 7). Internal/external rotation joint moments were also larger in thejoints of ostriches compared with humans. In particular,a large internal rotation moment occurred in the ostrichhip, and a large external rotation moment occurred atthe knee during mid-stance.
The magnitude as well as pattern of joint powers dif-fered between ostriches and humans (table 2 andfigure 8). The hip joint generated power during limbswing in humans and exhibited a small burst of powerabsorption followed by a prominent burst of power gen-eration in stance. In ostriches, the hip generated andabsorbed little power, owing primarily to the smalljoint excursion. The knee joint in humans underwenta complex pattern of power absorption–generation–absorption in stance, and exclusively absorbed powerduring swing. During stance, the ostrich knee exhibiteda complex pattern opposite to that of humans, wherethe joint underwent power generation–absorption–generation. Like humans, the ostrich knee absorbedpower throughout limb swing. The ankle joint inhumans is characterized by power absorption followedby generation over the stance phase. This pattern was

200
150
100
50
0
–50
forc
e (N
)
0.300.200.100time (s)
300
200
100
0
–100
–200
2000(a)
(b)
(c)
1500
1000
500
0
forc
e (N
)fo
rce
(N)
Figure 3. Ground reaction force profiles for ostriches (solidlines) and a typical human trace (dotted line): (a) vertical,(b) fore–aft, and (c) medio-lateral directions. Red tracesrepresent ostrich data from those trials used for full three-dimensional joint mechanical analyses (five traces peranimal), and blue traces represent data from an additionalthree animals from which ground reaction forces werecollected (five traces per animal).
0.6(a)
(b)
0.5
0.4
0.3
0.2
0.1
0
swin
g w
ork
(J k
g–1)
swin
g po
wer
(W
kg–1
)
1.6
1.4
1.2
1.0
0.8
0.6
0.4
0.2
ostrich human0
Figure 4. (a) Total positive body mass-specific joint mechan-ical work during limb swing and (b) the average positivebody mass-specific mechanical power used to swing thelimb during running in ostriches and humans.
746 Adaptations for economical running J. Rubenson et al.
on July 30, 2018http://rsif.royalsocietypublishing.org/Downloaded from
not observed in the ostrich, where only modest powergeneration was present, again reflecting a minimalchange in joint angle during stance [32]. Considerablegeneration of power was observed at the ankle duringlimb swing in ostriches. The joint power profile andmagnitude of the TMP joint in ostriches were similarto those of the human ankle, characterized by a promi-nent burst of power absorption in the first half ofstance, followed by power generation in the latter half.
3.5. Distribution of joint work
The hip joint produced most of the positive mechanicalwork in human running, accounting for 50.0+ 10.1%(mean+ s.d.) of the positive mechanical work duringstance and 78.3+ 4.2% (mean+ s.d.) in limb swing(figure 9a). In humans, the ankle contributed substan-tially to positive stance-phase mechanical work (32.5+9.0%; mean+ s.d.). In contrast, in the ostrich, themajority of the stance-phase mechanical work was
J. R. Soc. Interface (2011)
performed in the TMP joint (52.8+ 0.2%; mean+s.d.), with the hip contributing a small amount of posi-tive work (figure 9a). During limb swing in the ostrich,the positive mechanical work occurred predominantlyat the ankle joint.
The ankle and knee joints accounted for the majorityof the negative mechanical work during stance inhumans (figure 9b), and during limb swing, the kneeaccounted for nearly all of the negative work. Inostriches, the majority (63.3+1.0%; mean+ s.d.) ofthe negative stance-phase work was performed at theTMP joint, with the hip, knee and ankle contributingonly moderate amounts. As in humans, the limb-swingnegative mechanical work in ostriches was performedprimarily (77.6+5.4%; mean+ s.d.) at the knee.
4. DISCUSSION
Cursorial species, such as the ostrich, are able to runboth quickly and economically [2,5,27]. The aim ofthis study was to explore the features of bipedal jointmechanics that can help explain the low energy costof running in these cursorial animals. To this end, wemade a case comparison of running in mass- andspeed-matched ostriches and humans. These specieswere compared because the specializations that havepreviously been hypothesized to reduce the energycost of running are typified in the comparison betweenthe avian and human lower limbs, and because humans

60
50
40
30
20
10
0
% p
osit
ive
stan
ce p
ower
2.5
2.0
1.5
1.0
0.5
0
0.8
(a)
0.6
0.4
0.2
0
elas
tic
wor
k (J
kg–1
)
(b)
(c)
elas
tic
pow
er (
W k
g–1)
*
*
*
ostrich human
Figure 5. (a) Total positive body mass-specific joint mechan-ical work estimated to be generated via release of stored elasticenergy during the stance phase (single limb), (b) the averagepositive body mass-specific mechanical power estimated tobe generated by the release of elastic energy (both limbs),and (c) the percentage of the total positive mechanicalpower during the stance phase that is generated by the releaseof stored elastic energy in ostriches and humans. The asteriskdenotes a significant difference between ostriches and humans( p , 0.05).
6
5
4
3
2
1
0
estim
ated
mec
hani
cal p
ower
(W
kg–1
)total power muscle power
35% difference*
Figure 6. The total average positive body mass-specificmechanical power during running in humans and ostrichesand the average positive body mass-specific mechanicalpower estimated to be attributed to muscle fibres. Theasterisk denotes a significant difference between ostrichesand humans (p , 0.05). White bars, ostrich; black bars,human.
Adaptations for economical running J. Rubenson et al. 747
on July 30, 2018http://rsif.royalsocietypublishing.org/Downloaded from
are known to have a nearly 50 per cent higher cost ofrunning compared with their avian bipedal counterpart.
4.1. Mechanical power of limb swing
Several recent experimental and modelling studieshave found that the metabolic cost of limb swing is asubstantial (approx. 20–30%) component of thetotal metabolic cost of running [47–50]. This largelimb-swing cost corroborates the long-standing
J. R. Soc. Interface (2011)
hypothesis that animals specialized for economical run-ning benefit from having a comparatively low limb massand moment of inertia, resulting in lower limb-swingmechanical power and thus metabolic energy use[4,16,22,23]. At the outset, this hypothesis seems to fitwith our human–ostrich comparison. Ostriches have asimilar limb mass, but a more proximal mass distri-bution compared with humans (figure 1), which hasthe effect of lowering their limb moment of inertia.The combined centre of mass of the lower limb seg-ments (weighted average excluding the pelvis mass) isapproximately 0.27 m from the hip joint in ostrichesand 0.34 m in humans, representing a relative positionof approximately 28 and approximately 40 per centalong the length of the limb in ostriches and humans,respectively (the position of the combined centre ofmass of the lower limb segments is represented by thecircular mark in figure 1). However, despite this ana-tomical difference, our results do not show strongsupport for the limb-swing-cost hypothesis. The mech-anical power of swinging the limbs across strides isnot substantially different between humans andostriches, and is thus probably not a major factor con-tributing to their lower energy cost of running.
The finding that ostrich and human limb-swingmechanical power is not substantially different doesnot, however, imply that limb structure has no bearingon swing cost, as has been suggested previously [51,52],or that the ostrich limb structure does not reflectspecialization for reducing limb-swing energy use. It is

Tab
le2.
Pea
kjo
int
mom
ents
and
pow
erin
hum
ans
and
ostr
iche
s.D
ata
are
from
runn
ing
at3.
25an
d3.
24m
s21
inhu
man
san
dos
tric
hes,
resp
ecti
vely
(mea
n+
s.d.
).M
omen
tsar
eex
pres
sed
norm
aliz
edto
body
mas
s(N
mkg
21 )
and
body
mas
san
dle
gle
ngth
(Nm
kg2
1m
21 ;
dim
ensi
onle
ss).
Pos
itiv
ene
tjo
int
mom
ents
repr
esen
tne
tin
tern
al(i
.e.
mus
cle)
flexi
onm
omen
ts(d
orsi
-flex
ion
and
digi
tal
exte
nsio
nat
the
ankl
ean
dT
MP
inhu
man
san
dos
tric
hes,
resp
ecti
vely
).N
egat
ive
net
join
tm
omen
tsre
pres
ent
net
inte
rnal
(i.e
.m
uscl
e)ex
tens
ion
mom
ents
(pla
ntar
flexi
onan
ddi
gita
lfle
xion
atth
ean
kle
and
TM
Pin
hum
ans
and
ostr
iche
s,re
spec
tive
ly).
Pos
itiv
e(þ
)jo
int
pow
erre
pres
ents
ener
gyge
nera
tion
;ne
gati
ve(2
)jo
int
pow
erre
pres
ents
ener
gyab
sorp
tion
.B
old
deno
tes
asi
gnifi
cant
differ
ence
betw
een
hum
ans
and
ostr
iche
s(p
,0.
05).
Abb
revi
atio
ns:
flex/
ext,
flexi
on/e
xten
sion
;ad
d/ab
d,ad
duct
ion/
abdu
ctio
n;in
t/ex
tro
t,in
tern
al/e
xter
nalro
tati
on;T
MP,ta
rsom
etat
arso
-pha
lang
ealjo
int.
flex/
ext
mom
ent
add/
abd
mom
ent
int/
ext
rot
mom
ent
pow
er(W
kg2
1 )
Nm
kg2
1N
mkg
21m
21
Nm
kg2
1N
mkg
21m
21
Nm
kg2
1N
mkg
21m
21
þ–
hip hu
man
21.
47+
0.64
21.
24+
0.50
22.0
3+++++
0.5
92
1.7
7+++++
0.4
60.2
7+++++
0.1
40.2
4+++++
0.1
36.3
6+++++
0.2
22
2.0
8+++++
0.4
7os
tric
h2
2.03
+0.
462
1.44
+0.
282
0.9
3+++++
0.3
12
0.6
7+++++
0.2
51.1
4+++++
0.1
10.8
1+++++
0.1
01.0
1+++++
0.2
22
1.1
1+++++
0.0
5kn
ee hum
an2
1.0
8+++++
0.2
32
0.9
6+++++
0.2
52
0.8
0+++++
0.2
52
0.7
0+++++
0.2
00.2
8+++++
0.1
50.2
5+++++
0.1
43.
66+
0.80
24.
64+
0.66
ostr
ich
22.5
0+++++
0.0
72
1.7
9+++++
0.0
22
3.0
8+++++
0.7
52
2.1
9+++++
0.4
52
1.1
4+++++
0.1
72
0.8
1+++++
0.0
92.
61+
0.22
24.
21+
0.05
ankl
ehu
man
22.
40+
0.74
22.
09+
0.55
20.1
7+++++
0.1
32
0.1
2+++++
0.1
12
0.28
+0.
212
0.25
+0.
206.2
4+++++
1.3
02
6.1
4+++++
0.7
9os
tric
h2
2.37
+0.
012
1.69
+0.
052
2.4
5+++++
0.5
62
1.7
4+++++
0.3
32
0.48
+0.
082
0.48
+0.
052.7
0+++++
0.8
52
1.1
7+++++
0.2
5T
MP
748 Adaptations for economical running J. Rubenson et al.
J. R. Soc. Interface (2011)
on July 30, 2018http://rsif.royalsocietypublishing.org/Downloaded from
ostr
ich
22.
57+
0.13
21.
84+
0.03
20.
88+
0.30
20.
62+
0.19
0.30
+0.
430.
21+
0.30
8.68
+1.
192
10.8+
1.77
reasonable to assume that, were the limb moment ofinertia to be higher in the ostrich, they would incur alarger limb-swing cost and would thus consume moreenergy when running with the same limb mechanics.In this regard, their lower limb moment of inertia maybe viewed as an adaptation that permits them to usea high stride frequency, long contact time and a rapidlimb swing, which may confer benefits such as stability,while maintaining a relatively low limb-swing energyexpenditure.
It should also be stressed that the exact relationshipbetween limb-swing mechanical power and energy use isnot known for ostriches or humans. In guinea fowl, ithas been found that the relationship between limb-swing mechanical power and the rate of limb-swingmetabolic energy use (limb-swing efficiency) is variableacross speed [48]. It is possible that different limb-swingmechanical efficiencies exist between ostriches andhumans, and therefore it is unclear whether the differ-ence in limb-swing cost is necessarily represented bylimb-swing mechanical power. Nevertheless, our resultsdo not offer support for the hypothesis that the energycost of running in ostriches is lower compared withhumans owing to lower limb-swing mechanical power.
4.2. Estimated elastic and muscle power
In agreement with our second hypothesis, we estimatedthat approximately 83 per cent more work is generatedby the release of elastic energy in the ostrich jointsduring stance compared with humans. Our model ofelastic work and power production at the origin ofthis finding was based on joint power measurementsand a prediction of whether a joint’s actuation couldfeasibly be accomplished using elastic storage andrelease based on muscle–tendon unit architecture (seebelow). When taking into account stride frequency,over two times (approx. 1.2 W kg21) more stance-phase positive mechanical power is estimated to begenerated by the release of elastic energy in ostrichesthan in humans (figure 5a,b). It is important to stressthat the overall mechanical power generated by thereturn of elastic energy is more directly associatedwith reducing the rate of metabolic energy use thanelastic work per se, and that the large difference in elas-tically generated power may thus help explain the 50per cent lower cost of running between these species.The discrepancy in the capacity for elastic power gener-ation is further supported by the observation thatostriches are estimated to generate over twice as muchrelative stance-phase positive mechanical power by therelease of elastic energy, compared with humans(figure 5c).
One surprising finding was the distribution of elasticenergy storage and release in the ostrich. Practically allof the elastic energy storage and release was observed inthe TMP joint, confirming that this joint is highlyspecialized for elastic power production [27] and amore effective spring than that of the human ankle.The lack of energy absorption and generation at theankle in ostriches was unexpected. The ostrich gastro-cnemius muscle–tendon unit is ideal for storing andreleasing elastic energy at the ankle [26], but the pattern

–1.0
–0.5
0
0.5
1.0
–3
–2
–1
0
–3
–2
–1
0
–1.5
–1.0
–0.5
0
0.5
–3
–2
–1
0
1
2.0
1.0
0
–1.0
int/e
xt r
ot
mom
ent (
Nm
kg–1
)
ext rot
int rot
abd
add
flex
hip knee ankle/TMP
ext
flex
ext
flex
ext
abd
add
ext rot
int rot
ext rot
int rot
add/
abd
mom
ent (
Nm
kg–1
)fl
ex/e
xtm
omen
t (N
m k
g–1)
100806040% stride
200 100806040
% stride
200 100806040
% stride
200
–3
–2
–1
0
1
–3
–2
–1
0
1
–4
–3
–2
–1
0
1 add
abd
Figure 7. The average (+s.d.; grey-shaded regions) net mass-specific joint moments in humans (dotted lines) and ostriches (solidlines) over the stride (mid-swing to mid-swing). Solid grey lines, ostrich (TMP). Toe/foot-down and toe-off are designated by thevertical bars (dotted, humans; solid, ostriches). Joint moments are the internal (i.e. muscle) net joint moment (negative valuesrepresent moments countering gravity).
Adaptations for economical running J. Rubenson et al. 749
on July 30, 2018http://rsif.royalsocietypublishing.org/Downloaded from
of joint power during stance indicated that the gastro-cnemius does not function as a spring during runningat the speeds studied (figure 8). Given that the speedexamined is well below the maximum speed of ostriches,it is possible that the ankle and gastrocnemius musclegroup function to store and release elastic energy onlyat faster speeds, where greater mechanical power isrequired. In this case, an even larger discrepancybetween ostrich and human elastic joint function mayexist at faster speeds. This scenario would fit with theankle-based elastic energy storage and release that hasbeen observed in other running ground birds, includingturkeys [25] and guinea fowl [53]. Interestingly, theselater studies examined faster relative speeds comparedwith the ostrich in the present study; Froude numberswere approximately 1.5 for the turkey and guinea fowland 0.93 for the ostrich.
Our results also support our third hypothesis, thatthe estimated total muscle power is lower in ostrichesthan in humans. When an estimate of the storageand release of elastic energy at the joints is takeninto account, the remaining mechanical power attribu-ted to the muscle fibres was 35 per cent lower inostriches compared with humans. It should be notedthat because the total positive mechanical power issimilar between humans and ostriches (figure 6), thefactor contributing to the lower muscle power inostriches, as estimated from our model, remains thegreater joint power attributed to the return of storedelastic energy in ostriches, which acts to sparemuscle fibre power. These results reinforce our
J. R. Soc. Interface (2011)
interpretation that reduced muscle fibre poweroutput may be linked to economical running in cursor-ial species such as the ostrich. Our findings indicatethat muscle power may be a more important factordictating energy use than often purported [54,55],and that it should not be overlooked when addressinglinks between locomotor mechanics and energetics.This may be partly because the present approachaddresses several of the limitations in earlier studieslinking muscle power to locomotor energy use (e.g.joint-level versus whole-body work measurements andestimates of elastic energy contributions).
Nevertheless, producing force isometrically, as wouldbe required by the muscles crossing the ankle and TMPjoints in our model, also exacts a metabolic cost. Itremains possible that a lower energy cost of runningin ostriches is also, in part, a result of more economicalforce production. This seems plausible given the impor-tance of the distal joints to powering running, especiallyin the ostrich, where muscles with small volumes (thatare inherently economical force producers) [56] are pre-dicted to function isometrically and possibly withslower rates of force development. A simple estimateof the cost of ground force production can be madeusing foot contact times [20], where metabolic ratesare predicted to be inversely related to the time thefoot spends in contact with the ground in each step.The 14 per cent longer foot contact time in ostrichessuggests that the cost of producing ground force mayexplain some of the 50 per cent difference in metaboliccost between species. However, this interpretation

–10
–5
0
5
10
100806040200
6(a)
(b)
(c)
gen
abs
gen
abs
gen
abs
4
2
0
–2
–4
0
4
hip
join
t pow
er
(W k
g–1)
knee
join
t pow
er(W
kg–1
)an
kle/
TM
P jo
int p
ower
(W
kg–1
)
% stride
Figure 8. The average (+s.d.; grey shaded regions) mass-specificjoint power in humans (dotted lines) and ostriches (solid lines)over the stride (mid-swing to mid-swing). Toe/foot-down andtoe-off are designated by the vertical bars. (a,b) Dotted,humans; solid, ostriches. (c) Grey lines, ostrich (TMP).
750 Adaptations for economical running J. Rubenson et al.
on July 30, 2018http://rsif.royalsocietypublishing.org/Downloaded from
must be tempered by stressing that this very simpleassessment of cost of force only takes into accountdifferences in the time course for force production.Without estimating muscle forces and volumes [56],we are not able to accurately distinguish betweencosts of isometric force production and workproduction.
4.3. Limitations to elastic and musclepower estimates
Our estimate of elastic power generation and musclepower relies on a simple inverse dynamic model ofjoint work. It has been argued previously that jointwork does not necessarily equate to muscle–tendonunit work owing to muscle co-contraction [29]. If co-contraction were to occur, our estimate of work andpower would be underestimated, but there does notexist, to the best of our knowledge, data that indicatewhether levels of co-contraction differ between humanand avian bipedal running. Similarly, passive momentsat the joints may alter the requirement of active musclefibre work. A recent analysis of passive moments byWhittington et al. [57] revealed that a moderateamount of positive joint work in humans (approx.22% of the total positive work) might be provided bypassive muscle moments during walking, primarily at
J. R. Soc. Interface (2011)
the hip. It remains unclear how passive momentsaffect active muscle work during running. Given thatpassive moments have been found to be independentof joint angular velocity [58], increases in passivemoments between walking and running are probablysmaller (and owing primarily to angular excursion)compared with the net joint moments, which increasesubstantially with speed. This relationship is evidentbetween slow and fast walking speeds [57] and indicatesthat passive moments may, in general, play a relativelysmaller role in running. However, the lack of data onpassive moments during human running and in avianbipedalism makes assessing their contribution to ourestimates of work production difficult.
Furthermore, inverse dynamic analysis does not initself differentiate between tendon and muscle fibrework and power. We make the assumption that all ofthe work and power at the ankle and TMP jointsduring steady-speed running can theoretically be pro-vided via storage and release of elastic energy in thetendons crossing these joints if the positive joint workproduced is preceded by an equal or greater amountof absorbed (negative) joint work. As such, our analysesserve to assess the potential for elastic energy storageand release rather than a precise partition of elasticand muscle fibre power production.
Although it is possible that not all of the measurednegative and positive joint work at the ankle andTMP joints occurs as storage and release of elasticenergy in tendons, there are several factors which indi-cate that these joints do function primarily elastically.Firstly, the architecture of the ankle and TMPmuscle–tendon units suggests that they are designedfor elastic energy storage and return, as opposed toposition control where the joint excursion is accom-plished by muscle fibre lengthening/shortening [3].In humans, the primary plantar-flexor muscle, thesoleus, has an optimal fibre length and moment armof approximately 4 cm [59,60]. Assuming no tendonstretch, the approximately 408 of movement at theankle during stance would result in over 50 per centmuscle strain, a value that would result in a severelylimited force-producing capacity of the muscle owingto the force–length relationship (a prediction using amusculoskeletal model indicates the muscle would berestricted to less than 50 per cent force capacity; OPENSIM,simtk.org) [59]. For the muscle to function over a narrow,high-force, region on the force–length curve, the tendonmust account for 75 per cent of the muscle–tendon unitstrain. This amount of tendon strain, or more, is realisticconsidering that if all of the joint motion during theenergy-absorbing phase (approx. 208 dorsi-flexion) isattributed to tendon stretch (free tendon þ aponeurosis),the tendon would experience a strain of 4.6 per cent basedon the muscle moment arm and tendon slack length par-ameters in Arnold et al. [59]. Tendon strain of thismagnitude or greater has been reported for the medialgastrocnemius, which shares the common Achillestendon with the soleus muscle (e.g. up to 5.5 per centstrain has been reported for the medial gastrocnemiusfree tendon and aponeurosis during the energy-absorptionphase of running [44]). The relationship between muscle–tendon unit architecture and tendon strain is even more

TMP
stance(–)
swing(–)
(a)
(b)
swing(+)
stance(+)
77.6
TMP 0.3%6.9%
15.2%
88.6%
ankle 1.0% 10.4%
39.6%47.4%
13.0%
63.3%
8.4%
19.3%
9.0%
ankle
78.3%
17.9%
3.8%
ostrich human
ostrich human
0.9%
6.7%
17.8% 32.5% 49.6%
17.9%
52.8%
22.7%
4.7%
80.2%
14.2%
hip
knee
ankle
TMP
ankle hip
knee
hip
kneehip
knee
ankle
hiphip
knee
ankleTMPknee
ankle
hip
knee
anklehip
knee
Figure 9. The distribution of (a) positive mechanical work and (b) negative mechanical work among the hind-limb joints duringstance and swing in ostriches and humans.
Adaptations for economical running J. Rubenson et al. 751
on July 30, 2018http://rsif.royalsocietypublishing.org/Downloaded from
pronounced in ostriches. The digital flexor muscles thatcross the TMP joint have muscle fibres that are between1.5 and 4 cm long [26], with tendon slack lengths up to80 cm. With a mean moment arm of approximately3 cm [61], the muscle fibres can only account for a negli-gible component of the TMP joint excursion within arealistic range of muscle fibre strain, suggesting that thejoint excursion occurs as a result of tendon stretchand recoil.
A second factor indicating that the ankle and TMPjoints function primarily elastically is that the fibres
J. R. Soc. Interface (2011)
of the gastrocnemius and soleus muscles in humans[44,62] and the gastrocnemius and digital flexor musclesin birds [25,53] undergo much smaller length changesthan their tendons during stance. These findings indi-cate that tendon is primarily responsible for storageand release of elastic energy at the ankle and TMPjoints. Finally, the estimated storage of elastic energyat the TMP and ankle joints in the present studymatches closely previous elastic energy storage esti-mates in both the digital flexor tendons in the ostrichduring running (67.8 J this study versus 60 J [27]) and

752 Adaptations for economical running J. Rubenson et al.
on July 30, 2018http://rsif.royalsocietypublishing.org/Downloaded from
the Achilles tendon in humans (37.5 J this study versus35 J [41]; note moderately higher/lower estimates ofelastic energy storage in the Achilles tendon have beenreported with variation in the Achilles moment arm[63]). Furthermore, using the cross-section areas andmoment arms of the digital flexor tendons (from[26,61]), the measured peak TMP joint moment fromthe present study (table 1) and a tendon modulus ofelasticity of 1.2 GN m22 (following the calculations ofAlexander et al. [27]), we computed 75.5 J of energystorage in the ostrich digital flexor tendons duringrunning. The similarity of this second estimate of elasticenergy storage in the tendons crossing the TMP jointcompared with our estimate from joint work furthersubstantiates our estimate of elastic energy storageand release based on our joint work model.
The present study did not include an analysis ofjoints distal to the ankle in humans and the TMPjoint in ostriches, and assumed no elastic energy storageand return at proximal joints. Proximal joints (the hipand knee) may be capable of storing and returningsome elastic energy (e.g. in the tendon of the quadriceps[64]). The joint power profile of the hip and knee in bothostriches and humans exhibits periods in the stancephase that would permit elastic energy storage andreturn according to our elastic model (equations (2.3)and (2.4); figures 2 and 8). However, the amount ofpower absorbed at these joints is much less than atthe ankle and TMP joints (figure 8). Furthermore, inboth humans and ostriches, the proportion of theenergy absorbed elastically at the hip and knee is prob-ably minimal given that the large majority of themuscle–tendon units at these joints are parallel fibredand possess little tendinous material compared withmuscles at the distal joints [26,59,60]. It is also interest-ing to note that the amount of elastically generatedpositive work at the hip and knee, as defined by ourjoint model, is similar in ostriches and humans, furtherindicating that these joints probably do not influencethe difference in elastic energy storage and release andtotal positive muscle fibre work during running betweenthese species.
Mechanical work and power in the form of elasticenergy storage and release may exist at more distaljoints than those studied, including the metatarsal–phalangeal joint in humans and the interphalangealjoints in ostriches. In ostriches, any mechanical powerat the interphalangeal joint is performed primarily bystorage and release of elastic energy in the digitalflexor tendons given that minimal muscle tissue existsin the distal phalanges. The interphalangeal jointexcursion mirrors that of the TMP joint during stance(J. Rubenson 2006, unpublished results), indicatingthat our estimate of elastic energy storage and releasemay be underestimated. However, because the centreof pressure of the ground reaction force is close to theinterphalangeal joint during stance, the joint momentand hence elastic power absorption/production at theinterphalangeal joint are expected to be less than atthe TMP joint. In humans, it has been shown thatthe metatarsal–phalangeal joint absorbs mechanicalpower nearly exclusively during running [65].Therefore, this joint is not expected to contribute to
J. R. Soc. Interface (2011)
either elastic- or muscle-generated positive mechanicalpower. The arch of the human foot has also been ident-ified as a spring mechanism during running. Ker et al.[41] estimated that the ligaments in the arch of thefoot can return approximately 17 J of energy when run-ning at 4.5 m s21 (approx. 0.24 J kg21). Using theenergy versus load plot and the load balance theory ofKer et al. [41], the average (mass-normalized) peakjoint reaction force from our inverse dynamic analysis,and a predicted Achilles tendon moment arm of 4 cm[59], we estimated approximately 10 J (0.14 J kg21) ofenergy return from elastic recoil in the arch of thefoot. If all else remains equal, this amount of elasticenergy return would lower the difference in mass-specific positive elastic work between ostriches andhumans to 34 per cent, and lower the difference inmass-specific elastic power between species to 61 percent (the differences in estimated elastic work andpower between species remained significant; p , 0.05).This scenario probably represents a lower limit in thedifference in positive elastic power between humansand ostriches. The amount of elastic energy stored inthe arch of the foot may be less than 10 J since theforce required to balance a considerable metatarsal–phalangeal moment during running [65] will reducethe load in the foot ligaments. Furthermore, the elasticenergy storage and return may be slightly higher inostriches owing to the interphalangeal joint. Therefore,although this study has not provided a precise quantifi-cation of elastic power production, it is reasonable toconclude that a significantly higher potential for elasticpower output exists in ostriches compared withhumans. Furthermore, because the interphalangealjoint in ostriches and the arch of the human foot areexpected to function purely elastically, the estimateof positive muscle fibre power would not be affectedby their omission.
4.4. Pattern of joint moments, power and work
The pattern of the sagittal plane moments at all of thejoints was surprisingly similar between ostriches andhumans, both during stance and limb swing(figure 7). This finding extends the concept thatlegged animals share similar dynamics of runningbeyond overall centre of mass movement [66] to thelevel of the joint. However, frontal and long-axismoments exhibit clear differences in magnitude. Themuch larger frontal plane loads at the knee and ankleof the ostrich are due largely to the abducted postureof the hip joint and the resulting bow-legged (varus)posture required to return the phalanges under thebody (figure 1; also see motion files of runninghumans and ostriches in the electronic supplementarymaterial). The large internal rotation moment at thehip corroborates the prediction of Hutchinson &Gatesy [67] that, together, the horizontal femur postureand the varus lower limb posture of birds necessitate ahip internal rotation support moment. While Carrano[33] and Main & Biewener [34] provided bone straindata indicating long-axis loading, the present study isthe first to quantify long-axis loading at the joint level.
Adaptations for economical running J. Rubenson et al. 753
on July 30, 2018http://rsif.royalsocietypublishing.org/Downloaded from
It is intriguing that, despite the very large frontaland internal rotation moments, the energy cost of run-ning in ostriches remains low. These findings suggestpassive support mechanisms may function in vivo torelieve the requirement of energy-consuming muscleforce. These mechanisms may be present in the formof ligaments or bony constraints at the joint. Thesemechanisms seem obvious at the ankle, which lacksmuscles with abduction moment arms (with the excep-tion of the fibularis longus), but less obvious at the kneeand hip. Alternatively, economical joint stabilizationmay arise from active muscle force with favourablemoment arms.
In humans, power production is shared nearlyequally among the proximal and distal joints, whereasone of the striking features of ostrich running is aclear shift in the distribution of work and powerproduction to the distal joints; the hip contributes asmall amount of positive power during locomotionand the TMP joint contributes over 50 per cent(figures 8 and 9). The use of distal joints to power run-ning reflects a limb structure with a greater reliance onelastic energy storage and release. The increased lowerlimb length in ostriches, in particular the tarsometatar-sus, results in very long and slender tendons of thedigital flexors that are ideal for elastic energy storageand release [26,27]. A more distal distribution of jointpower is also observed during limb swing (figure 8),with humans and ostriches adopting a hip-driven andankle-driven limb swing, respectively. The increasedlimb-swing ankle power production in ostriches com-pared with humans may reflect a trade-off betweenincreasing the elastic energy storage capacity duringstance arising from a longer lower limb in ostriches,and an increase in energy required to accelerate thislonger limb during swing.
In summary, the present study demonstrates that aprimary limb structure adaptation linked to economi-cal locomotion in ostriches is probably an increasedability to store and return elastic energy, thereby redu-cing the amount of positive power required by musclefibres. At the speeds analysed in this study, the esti-mated increased reliance on elastic energy andsparing of muscle fibre power is achieved by a shiftof power production to distal joints that are ideallysuited for elastic power production, although surpris-ingly not the ankle. Ostriches do not have areduction in the amount of mechanical power requiredfor limb swing compared with humans, despite havinga typical cursorial limb structure with a low limbmoment of inertia. When considering adaptations foreconomical locomotion in avian bipeds, attentionshould also be given to mechanisms that reduce theneed for active muscle stabilization of frontal planeloads at the ankle and knee and internal rotationloads at the hip.
The authors are grateful to the Heliams family for kindlyproviding the location for ostrich running experiments andthank Daina Sturnieks, Adam Gudsell, Steven Mulls andShane Maloney for their assistance in data collection, JohnR. Hutchinson for bone scans of the ostrich hind-limb usedin figure 1, and two anonymous reviewers for their helpful
J. R. Soc. Interface (2011)
comments and criticisms. This project was supported by anAustralian Research Council grant to P.A.F. and D.G.L.
REFERENCES
1 Carrano, M. T. 1999 What, if anything, is a cursor? Cat-egories versus continua for determining locomotor habitin mammals and dinosaurs. J. Zool. Lond. 247, 29–42.(doi:10.1111/j.1469-7998.1999.tb00190.x)
2 Rubenson, J., Heliams, D. B., Maloney, S. K., Withers,P. C., Lloyd, D. G. & Fournier, P. A. 2007 Reappraisal ofthe comparative cost of human locomotion using gait-specific allometric analyses. J. Exp. Biol. 210, 3513–3524.(doi:10.1242/jeb.000992)
3 Biewener, A. A. 1998 Muscle function in vivo: a compari-son of muscles used for elastic energy savings versusmuscles used to generate mechanical power. Am. Zool.38, 703–717.
4 Steudel, K. 1990 The work and energetic cost of loco-motion. II. Partitioning the cost of internal and externalwork within a species. J. Exp. Biol. 154, 287–303.
5 Wilson, A. M., Van den Bogert, A. J. & Mcguigan, M. P.2000 Optimization of the muscle–tendon unit for econ-omical locomotion in cursorial animals. In Skeletalmuscle mechanics: from mechanism to function(ed. W. Herzog), pp. 517–547. Hoboken, NJ: JohnWiley & Sons.
6 Pontzer, H., Allen, V. & Hutchinson, J. R. 2009 Biomecha-nics of running indicates endothermy in bipedal dinosaurs.PLoS ONE 4, e7783. (doi:10.1371/journal.pone.0007783)
7 Hunt, K. D. 1994 The evolution of human bipedality:ecology and functional morphology. J. Hum. Evol. 26,183–202. (doi:10.1006/jhev.1994.1011)
8 Sellers, W. I., Cain, G. M., Wang, W. & Crompton, R. H.2005 Stride lengths, speed and energy costs in walking ofAustralopithecus afarensis: using evolutionary robotics topredict locomotion of early human ancestors. J. R. Soc.Interface 2, 431–441. (doi:10.1098/rsif.2005.0060)
9 Steudel, K. 1996 Limb morphology, bipedal gait, and theenergetics of hominid locomotion. Am. J. Phys. Anthrop.99, 345–355. (doi:10.1002/(SICI)1096-8644(199602)99:2,345::AID-AJPA9.3.0.CO;2-X)
10 Cham, J. G., Bailey, S. A., Clark, J. E., Full, R. J. &Cutkosky, M. R. 2002 Fast and robust: hexapedal robotsvia shape deposition manufacturing. Int. J. Rob. Res.21, 1–14.
11 Collins, S., Ruina, A., Tedrake, R. & Wisse, M. 2005 Effi-cient bipedal robots based on passive-dynamic walkers.Science 307, 1082–1085. (doi:10.1126/science.1107799)
12 Raibert, M. H. 1986 Legged robots that balance.Cambridge, MA: MIT Press.
13 Brown, M. B., Millard-Stafford, M. L. & Allison, A. R.2009 Running-specific prostheses permit energy costsimilar to nonamputees. Med. Sci. Sports Exercise 41,1080–1087. (doi:10.1249/MSS.0b013e3181923cee)
14 Weyand, P. G., Bundle, M. W., McGowan, C. P., Grabowski,A., Brown, M. B., Kram, R. & Herr, H. 2009 The fastestrunner on artificial legs: different limbs, similar function?J. Appl. Physiol. 107, 903–911. (doi:10.1152/japplphysiol.00174.2009)
15 Brown, C. J. & Yalden, D. W. 1973 The description ofmammals—2. Limbs and locomotion of terrestrialmammals. Mamm. Rev. 4, 107–134. (doi:10.1111/j.1365-2907.1973.tb00178.x)
16 Pasi, B. M. & Carrier, D. R. 2003 Functional trade-offsin the limb muscles of dogs selected for running versusfighting. J. Evol. Biol. 16, 324–332. (doi:10.1046/j.1420-9101.2003.00512.x)
754 Adaptations for economical running J. Rubenson et al.
on July 30, 2018http://rsif.royalsocietypublishing.org/Downloaded from
17 Payne, R. C., Hutchinson, J. R., Robilliard, J. J., Smith,N. C. & Wilson, A. M. 2005 Functional specialisationof pelvic limb anatomy in horses (Equus caballus).J. Anat. 206, 557–574. (doi:10.1111/j.1469-7580.2005.00420.x)
18 Biewener, A. A. 1989 Scaling body support in mammals:limb posture and muscle mechanics. Science 245, 45–48.(doi:10.1126/science.2740914)
19 Hutchinson, J. R. 2004 Biomechanical modeling and sensi-tivity analysis of bipedal running ability. I. Extant taxa.J. Morphol. 262, 421–440. (doi:10.1002/jmor.10241)
20 Kram, R. & Taylor, C. R. 1990 Energetics of running: anew perspective. Nature 346, 265–267. (doi:10.1038/346265a0)
21 Roberts, T. J., Kram, R., Weyand, P. G. & Taylor, C. R.1998 Energetics of bipedal running. I. Metabolic cost ofgenerating force. J. Exp. Biol. 201, 2745–2751.
22 Gray, J. 1968 Animal locomotion. New York, NY: Norton.23 Hildebrand, M. 1985 Walking and running. In
Functional vertebrate morphology (eds M. Hildebrand,D. M. Bramble, K. F. Liem & D. B. Wake), pp. 38–57.Cambridge, MA: Harvard University Press.
24 Alexander, R. M. 1988 Elastic mechanisms in animalmovement. Cambridge, UK: Cambridge University Press.
25 Roberts, T. J., Marsh, R. L., Weyand, P. G. & Taylor, C. R.1997 Muscular force in running turkeys: the economy ofminimizing work. Science 275, 1113–1115. (doi:10.1126/science.275.5303.1113)
26 Smith, N. C., Wilson, A. M., Jespers, K. J. & Payne, R. C.2006 Muscle architecture and functional anatomy of thepelvic limb of the ostrich (Struthio camelus). J. Anat.209, 765–779. (doi:10.1111/j.1469-7580.2006.00658.x)
27 Alexander, R. M., Maloiy, G. M. O., Njau, R. & Jayes, A. S.1979 Mechanics of running of the ostrich (Struthio camelus).J. Zool. Lond. 187, 169–178. (doi:10.1111/j.1469-7998.1979.tb03941.x)
28 Rubenson, J., Heliams, D. B., Lloyd, D. G. & Fournier,P. A. 2004 Gait selection in the ostrich: mechanical andmetabolic characteristics of walking and running with andwithout an aerial phase. Proc. R. Soc. Lond. B 271,1091–1099. (doi:10.1098/rspb.2004.2702)
29 Winter, D. A. 1990 Biomechanics and motor control ofhuman movement. New York, NY: John Wiley and Sons.
30 Zatsiorsky, V. M. 2002 Kinetics of human motion.Champaign, IL: Human Kinetics.
31 Besier, T. F., Sturnieks, D. L., Alderson, J. A. & Lloyd,D. G. 2003 Repeatability of gait data using a functionalhip joint centre and a mean helical knee axis. J. Biomech.36, 1159–1168. (doi:10.1016/S0021-9290(03)00087-3)
32 Rubenson, J., Lloyd, D. G., Besier, T. F., Heliams, D. B. &Fournier, P. A. 2007 Running in ostriches (Struthiocamelus): three-dimensional joint axes alignment andjoint kinematics. J. Exp. Biol. 210, 2548–2562. (doi:10.1242/jeb.02792)
33 Carrano, M. T. 1998 Locomotion in non-avian dinosaurs:integrating data from hindlimb kinematics, in vivo strainsand bone morphology. Paleobiology 24, 450–469.
34 Main, R. P. & Biewener, A. A. 2007 Skeletal strainpatterns and growth in the emu hindlimb during onto-geny. J. Exp. Biol. 210, 2676–2690. (doi:10.1242/jeb.004580)
35 Shapiro, R. 1978 Direct linear transformation method forthree-dimensional cinematography. Res. Quart. 49, 197–205.
36 van den Bogert, A. J. & de Koning, J. J. 1996 On optimalfiltering for inverse dynamics analysis. In Proc. 9thBiennial Conf. of the Canadian Society for Biomechanics,Vancouver, Canada, pp. 214–215. Ottawa, Canada:Canadian Society for Biomechanics.
J. R. Soc. Interface (2011)
37 Grood, E. S. & Suntay, W. J. 1983 A joint coordinatesystem for the clinical description of three-dimensionalmotions: application to the knee. J. Biomech. Eng. 105,136–144. (doi:10.1115/1.3138397)
38 Spoor, C. W. & Veldpaus, F. E. 1980 Rigid body motioncalculated from spatial co-ordinates of markers.J. Biomech. 13, 391–393. (doi:10.1016/0021-9290(80)90020-2)
39 Featherstone, R. 2008 Rigid body dynamics algorithms.New York, NY: Springer.
40 Reilly, S. M. 2000 Locomotion in the quail (Coturnixjaponica): the kinematics of walking and increasing speed.J. Morphol. 243, 173–185. (doi:10.1002/(SICI)1097-4687(200002)243:2,173::AID-JMOR6.3.0.CO;2-E)
41 Ker, R. F., Bennett, M. B., Bibby, S. R., Kester, R. C. &Alexander, R. M. 1987 The spring in the arch of thehuman foot. Nature 325, 147–149. (doi:10.1038/325147a0)
42 Novacheck, T. F. 1998 The biomechanics of running.Gait Posture 7, 77–95. (doi:10.1016/S0966-6362(97)00038-6)
43 Fukunaga, T., Kubo, K., Kawakami, Y., Fukashiro, S.,Kanehisa, H. & Maganaris, C. N. 2001 In vivo behaviourof human muscle tendon during walking. Proc. R. Soc.Lond. B 268, 229–233. (doi:10.1098/rspb.2000.1361)
44 Lichtwark, G. A., Bougoulias, K. & Wilson, A. M. 2007Muscle fibre and series elastic element length changesalong the length of the gastrocnemius during walkingand running. J. Biomech. 40, 157–164. (doi:10.1016/j.jbiomech.2005.10.035)
45 Lieberman, D. E., Venkadesan, M., Werbel, W. A.,Daoud, A. I., D’Andrea, S., Davis, I. S., Mang’eni, R. O.& Pitsiladis, Y. 2010 Foot strike patterns and collisionforces in habitually barefoot versus shod runners. Nature463, 531–535. (doi:10.1038/nature08723)
46 de Leva, P. 1996 Adjustments to Zatsiorsky–Seluyanov’ssegment inertia parameters. J. Biomech. 29, 1223–1230.(doi:10.1016/0021-9290(95)00178-6)
47 Modica, J. R. & Kram, R. 2005 Metabolic energyand muscular activity required for leg swing inrunning. J. Appl. Physiol. 98, 2126–2131. (doi:10.1152/japplphysiol.00511.2004)
48 Rubenson, J. & Marsh, R. L. 2009 Mechanical efficiency oflimb swing during walking and running in guinea fowl(Numida meleagris). J. Appl. Physiol. 106, 1618–1630.(doi:10.1152/japplphysiol.91115.2008)
49 Umberger, B. R. 2010 Stance and swing phase costs inhuman walking. J. R. Soc. Interface 7, 1329–1340.(doi:10.1098/rsif.2010.0084)
50 Marsh, R. L., Ellerby, D. J., Carr, J. A., Henry, H. T. &Buchanan, C. I. 2004 Partitioning the energetics of walk-ing and running: swinging the limbs is expensive.Science 303, 80–83. (doi:10.1126/science.1090704)
51 Taylor, C. R., Heglund, N. C., McMahon, T. A. & Looney,T. R. 1980 Energetic cost of generating muscular forceduring running. A comparison of large and small animals.J. Exp. Biol. 86, 9–18.
52 Taylor, C. R., Shkolnik, A., Dmi’el, R., Baharav, D. & Borut,A. 1974 Running in cheetahs, gazelles, and goats: energy costand limb configuration. Am. J. Physiol. 227, 848–850.
53 Daley, M. A. & Biewener, A. A. 2003 Muscle force-lengthdynamics during level versus incline locomotion: a com-parison of in vivo performance of two guinea fowl ankleextensors. J. Exp. Biol. 206, 2941–2958. (doi:10.1242/jeb.00503)
54 Heglund, N. C., Fedak, M. A., Taylor, C. R. & Cavagna,G. A. 1982 Energetics and mechanics of terrestrial loco-motion. IV. Total mechanical energy changes as a
Adaptations for economical running J. Rubenson et al. 755
on July 30, 2018http://rsif.royalsocietypublishing.org/Downloaded from
function of speed and body size in birds and mammals.J. Exp. Biol. 97, 57–66.
55 Kram, R. 2000 Muscular force or work: what determinesthe metabolic energy cost of running? Exercise SportSci. Rev. 28, 138–143.
56 Roberts, T. J., Chen, M. S. & Taylor, C. R. 1998 Ener-getics of bipedal running II. Limb design and runningmechanics. J. Exp. Biol. 201, 2753–2762.
57 Whittington, B., Silder, A., Heiderscheit, B. & Thelen,D. G. 2008 The contribution of passive-elastic mechanismsto lower extremity joint kinetics during human walking.Gait Posture 27, 628–634. (doi:10.1016/j.gaitpost.2007.08.005)
58 Yoon, Y. S. & Mansour, J. M. 1982 The passive elasticmoment at the hip. J Biomech. 15, 905–910. (doi:10.1016/0021-9290(82)90008-2)
59 Arnold, E. M., Ward, S. R., Lieber, R. L. & Delp, S. L.2009 A model of the lower limb for analysis of humanmovement. Ann. Biomed. Eng. 38, 269–279. (doi:10.1007/s10439-009-9852-5)
60 Ward, S. R., Eng, C. M., Smallwood, L. H. & Lieber, R. L.2009 Are current measurements of lower extremitymuscle architecture accurate? Clin. Orthop.Relat. Res. 467, 1074–1082. (doi:10.1007/s11999-008-0594-8)
61 Smith, N. C., Payne, R. C., Jespers, K. J. & Wilson, A. M.2007 Muscle moment arms of pelvic limb muscles of the
J. R. Soc. Interface (2011)
ostrich (Struthio camelus). J. Anat. 211, 313–324.(doi:10.1111/j.1469-7580.2007.00762.x)
62 Cronin, N. J., Ishikawa, M., Grey, M. J., af Klint, R.,Komi, P. V., Avela, J., Sinkjaer, T. & Voigt, M. 2009Mechanical and neural stretch responses of the humansoleus muscle at different walking speeds. J. Physiol.587, 3375–3382. (doi:10.1113/jphysiol.2008.162610)
63 Scholz, M. N., Bobbert, M. F., van Soest, A. J., Clark,J. R. & van Heerden, J. 2008 Running biomechanics:shorter heels, better economy. J. Exp. Biol. 211, 3266–3271. (doi:10.1242/jeb.018812)
64 Muraoka, T., Kawakami, Y., Tachi, M. & Fukunaga, T.2001 Muscle fiber and tendon length changes in thehuman vastus lateralis during slow pedaling. J. Appl.Physiol. 91, 2035–2040.
65 Stefanyshyn, D. J. & Nigg, B. M. 1997 Mechanical energycontribution of the metatarsophalangeal joint to runningand sprinting. J. Biomech. 30, 1081–1085. (doi:10.1016/S0021-9290(97)00081-X)
66 Cavagna, G. A., Heglund, N. C. & Taylor, C. R. 1977Mechanical work in terrestrial locomotion: two basicmechanisms for minimizing energy expenditure.Am. J. Physiol. 233, R243–R261.
67 Hutchinson, J. R. & Gatesy, S. M. 2000 Adductors,abductors, and the evolution of archosaur locomotion.Paleobiology 26, 734–751. (doi:10.1666/0094-8373(2000)026,0734:AAATEO.2.0.CO;2)