Embed Size (px)
Citation preview
Question Domain Satisfied % vs Goal% Satisfied % Goal % State Avg
Quality and Appropriateness 98% 80% 93%
Participation in Treatment 98% 80% 92%
Respect 97% 80% 91%
Overall 96% 80% 91%
General Satisfaction 93% 80% 92%
Outcome 93% 80% 83%
Recovery 90% 80% 79%
Access 88% 80% 88%
(Based on 283 FY17 Surveys)
Satisfied % 0-80%Goal % 80-100% Goal Met Under Goal
Consumer Satisfaction Survey
Ethnicity # % State Avg
Non-Hispanic 1,801 74% 74%
Hisp-Puerto Rican 376 15% 13%
Hispanic-Other 212 9% 7%
Unknown 20 1% 6%
Hispanic-Cuban 9 0% 0%
Hispanic-Mexican 8 0% 1%
Age # % State Avg
18-25 176 7% 11%
26-34 629 26% 22%
35-44 588 24% 19%
45-54 582 24% 22%
55-64 382 16% 19%
65+ 67 3% 6%
> 10% Under State Avg> 10% Over State AvgUnique Clients State Avg
Client DemographicsGender # % State Avg
Male 1,555 64% 58%
Female 868 36% 41%
Transgender 0%
Race # % State Avg
White/Caucasian 1,554 64% 65%
Other 436 18% 13%
Black/African American 402 17% 16%
Asian 10 0% 1%
Multiple Races 9 0% 1%
Am. Indian/Native Alaskan 7 0% 1%
Unknown 6 0% 3%
Hawaiian/Other Pacific Islander 2 0% 0%
Discharges 619 583 6%
Admits 597 574 4%
Service Hours 10,198 10,294 -1%
Bed Days 12,928 13,290 -3%
Monthly Trend Measure Actual 1 Yr Ago Variance %
Unique Clients 2,426 2,363 3%
> 10% Under 1Yr Ago> 10% Over 1 Yr Ago
Clients by Level of CareProgram Type Level of Care Type # %
AddictionMedication Assisted Treatment 1,985 77.6%
Outpatient 257 10.0%
Residential Services 257 10.0%
Mental HealthResidential Services 59 2.3%
Provider Activity
Connecticut Dept of Mental Health and Addiction ServicesRecovery Network of Programs
Reporting Period: July 2017 - September 2017
Provider Quality DashboardBridgeport, CT(Data as of Dec 13, 2017)

Measure Actual 1 Yr Ago Variance %
Unique Clients 5 7 -29%
Admits - -
Discharges - -
Bed Days 460 644 -29%
Program Activity
On-Time Periodic Actual State Avg
6 Month Updates 80% 81%
Data Entry Actual State Avg
Valid NOMS Data 100% 99%
Data Submission Quality
Cooccurring Actual State Avg
MH Screen Complete N/A 85%
SA Screen Complete N/A 83%
Diagnosis Actual State Avg
Valid Axis I Diagnosis 100% 99%
Valid Axis V GAF Score 100% 96%
Connecticut Dept of Mental Health and Addiction Services2445 Main St. # 2 SupRes 117-252
Mental Health - Residential Services - Supervised Apartments Program Quality DashboardRecovery Network of Programs
Reporting Period: July 2017 - September 2017 (Data as of Dec 13, 2017)
* State Avg based on 70 Active Supervised Apartments Programs
> 10% Over < 10% Under
Actual Goal Goal Met Below Goal
Jul Aug Sep % Months Submitted
Admissions 0%
Discharges 0%
1 or more Records Submitted to DMHAS
Data Submitted to DMHAS by Month
Bed Utilization12 Months Trend Beds Avg LOS Turnover Actual % Goal % State Avg Actual vs Goal
Avg Utilization Rate 7 7,555 days 1.4 71% 90% 95% -19%
90-110%< 90% >110%
Actual % vs Goal % Actual Actual % Goal % State Avg Actual vs Goal
Treatment Completed Successfully N/A N/A 60% 77% N/A
Actual % vs Goal % Actual Actual % Goal % State Avg Actual vs Goal
Follow-up within 30 Days of Discharge N/A N/A 90% 80% N/A
Discharge Outcomes
RecoveryNational Recovery Measures (NOMS) Actual % vs Goal % Actual Actual % Goal % State Avg Actual vs Goal
Social Support 5 100% 60% 85% 40%
Stable Living Situation 5 100% 95% 98% 5%
Employed 0 0% 25% 6% -25%
Improved/Maintained Axis V GAF Score 3 60% 95% 66% -35%
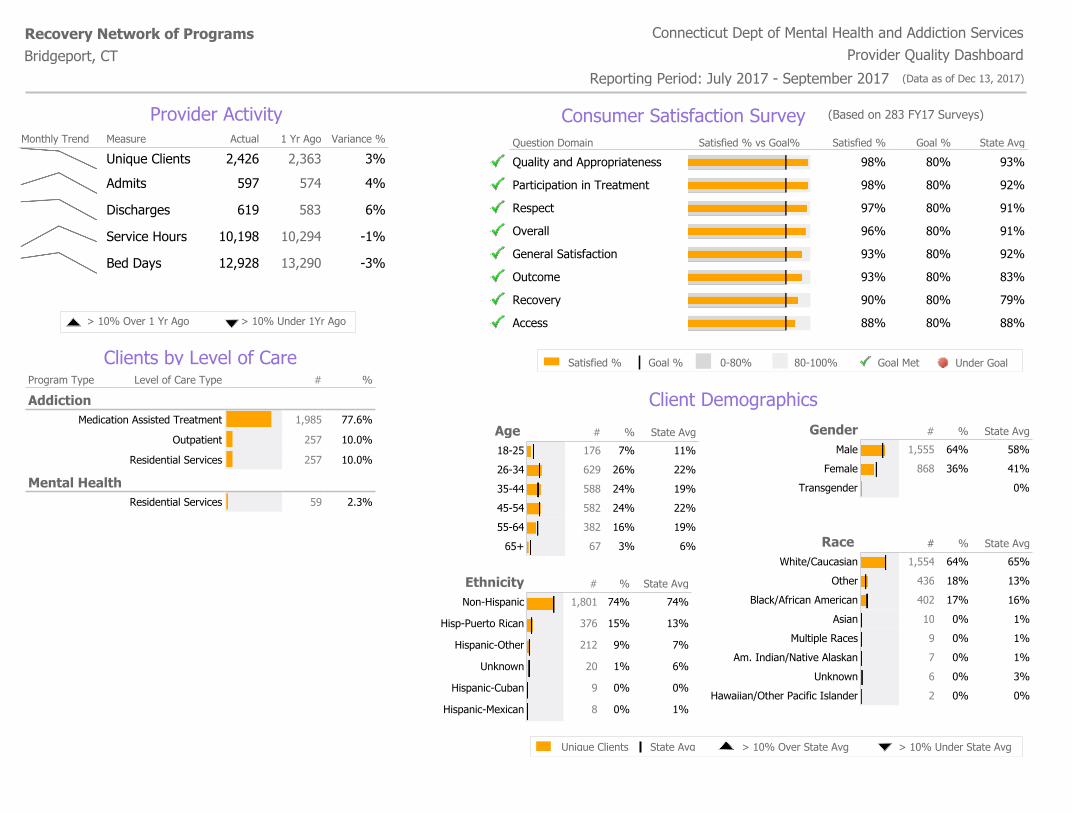
Measure Actual 1 Yr Ago Variance %
Unique Clients 32 34 -6%
Admits - -
Discharges 2 3 -33%
Bed Days 2,851 3,005 -5%
Program Activity
On-Time Periodic Actual State Avg
6 Month Updates 100% 99%
Data Entry Actual State Avg
Valid NOMS Data 100% 99%
Data Submission Quality
Cooccurring Actual State Avg
MH Screen Complete N/A 95%
SA Screen Complete N/A 93%
Diagnosis Actual State Avg
Valid Axis I Diagnosis 100% 99%
Valid Axis V GAF Score 100% 99%
Connecticut Dept of Mental Health and Addiction Services2445 Main St..SupRes 117-250
Mental Health - Residential Services - Residential Support Program Quality DashboardRecovery Network of Programs
Reporting Period: July 2017 - September 2017 (Data as of Dec 13, 2017)
* State Avg based on 38 Active Residential Support Programs
> 10% Over < 10% Under
Actual Goal Goal Met Below Goal
Jul Aug Sep % Months Submitted
Admissions 0%
Discharges 67%
1 or more Records Submitted to DMHAS
Data Submitted to DMHAS by Month
Bed Utilization12 Months Trend Beds Avg LOS Turnover Actual % Goal % State Avg Actual vs Goal
Avg Utilization Rate 29 3,783 days 0.9 107% 90% 107% 17%
90-110%< 90% >110%
Actual % vs Goal % Actual Actual % Goal % State Avg Actual vs Goal
Treatment Completed Successfully 2 100% 50% 84% 50%
Discharge Outcomes
RecoveryNational Recovery Measures (NOMS) Actual % vs Goal % Actual Actual % Goal % State Avg Actual vs Goal
Social Support 30 94% 60% 91% 34%
Stable Living Situation 32 100% 85% 96% 15%
Improved/Maintained Axis V GAF Score 28 93% 95% 82% -2%
Employed 5 16% 25% 11% -9%
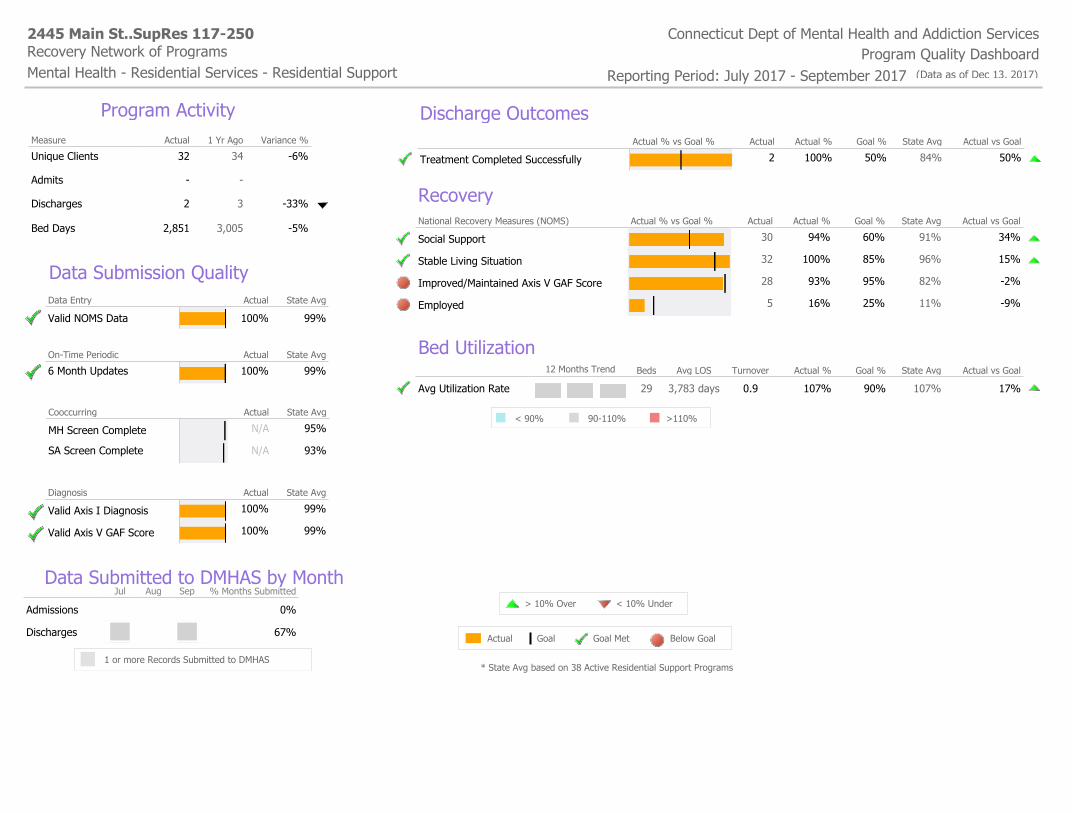
Measure Actual 1 Yr Ago Variance %
Unique Clients 9 8 13%
Admits 1 -
Discharges 2 1 100%
Bed Days 638 731 -13%
Program Activity
On-Time Periodic Actual State Avg
6 Month Updates 100% 82%
Data Entry Actual State Avg
Valid NOMS Data 100% 99%
Data Submission Quality
Cooccurring Actual State Avg
MH Screen Complete 100% 90%
SA Screen Complete 100% 90%
Diagnosis Actual State Avg
Valid Axis I Diagnosis 100% 100%
Valid Axis V GAF Score 100% 99%
Connecticut Dept of Mental Health and Addiction Services964 Iranistan AveGrpRes117-241
Mental Health - Residential Services - Group Home Program Quality DashboardRecovery Network of Programs
Reporting Period: July 2017 - September 2017 (Data as of Dec 13, 2017)
* State Avg based on 24 Active Group Home Programs
> 10% Over < 10% Under
Actual Goal Goal Met Below Goal
Jul Aug Sep % Months Submitted
Admissions 33%
Discharges 67%
1 or more Records Submitted to DMHAS
Data Submitted to DMHAS by Month
Bed Utilization12 Months Trend Beds Avg LOS Turnover Actual % Goal % State Avg Actual vs Goal
Avg Utilization Rate 8 822 days 0.9 87% 90% 96% -3%
90-110%< 90% >110%
Actual % vs Goal % Actual Actual % Goal % State Avg Actual vs Goal
Treatment Completed Successfully 2 100% 80% 90% 20%
Actual % vs Goal % Actual Actual % Goal % State Avg Actual vs Goal
No Re-admit within 30 Days of Discharge 2 100% 85% 100% 15%
Actual % vs Goal % Actual Actual % Goal % State Avg Actual vs Goal
Follow-up within 30 Days of Discharge 1 50% 90% 84% -40%
Discharge Outcomes
RecoveryNational Recovery Measures (NOMS) Actual % vs Goal % Actual Actual % Goal % State Avg Actual vs Goal
Social Support 7 78% 60% 85% 18%
Stable Living Situation 9 100% 90% 99% 10%
Improved/Maintained Axis V GAF Score 5 83% 95% 62% -12%
Measure Actual 1 Yr Ago Variance %
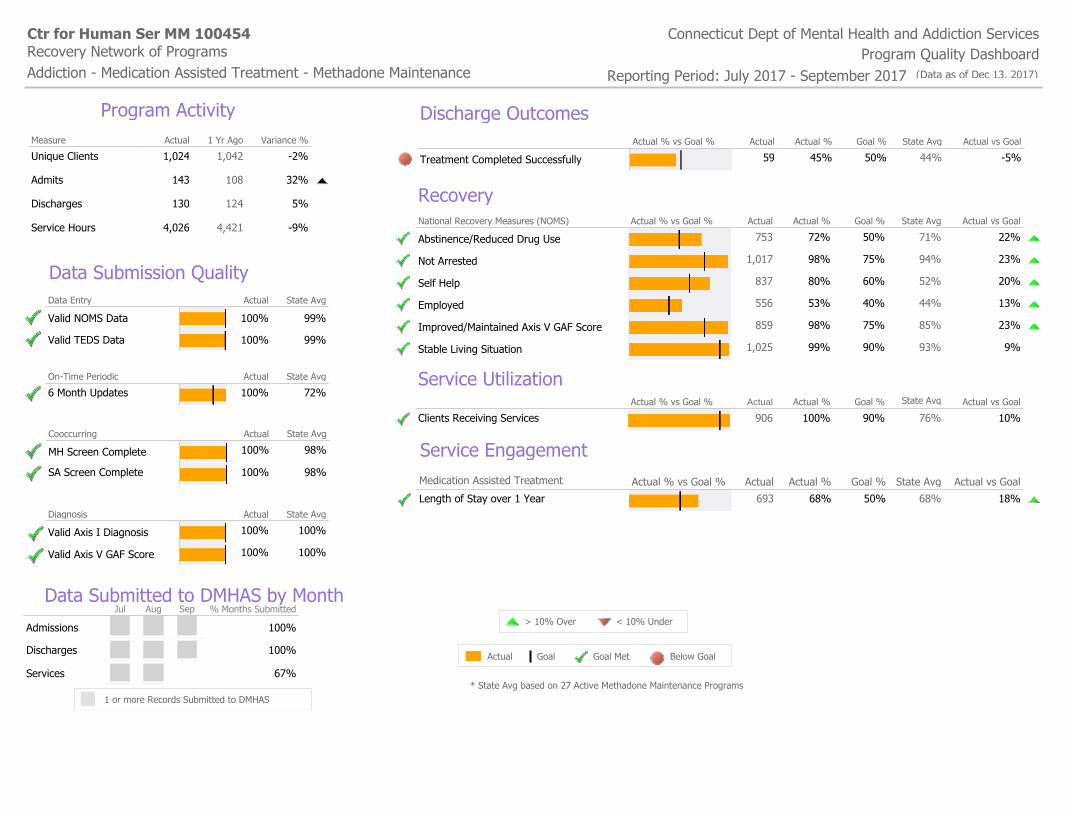
Unique Clients 1,024 1,042 -2%
Admits 143 108 32%
Discharges 130 124 5%
Service Hours 4,026 4,421 -9%
Program Activity
On-Time Periodic Actual State Avg
6 Month Updates 100% 72%
Data Entry Actual State Avg
Valid NOMS Data 100% 99%
Valid TEDS Data 100% 99%
Data Submission Quality
Cooccurring Actual State Avg
MH Screen Complete 100% 98%
SA Screen Complete 100% 98%
Diagnosis Actual State Avg
Valid Axis I Diagnosis 100% 100%
Valid Axis V GAF Score 100% 100%
Connecticut Dept of Mental Health and Addiction ServicesCtr for Human Ser MM 100454
Addiction - Medication Assisted Treatment - Methadone Maintenance Program Quality DashboardRecovery Network of Programs
Reporting Period: July 2017 - September 2017 (Data as of Dec 13, 2017)
* State Avg based on 27 Active Methadone Maintenance Programs
> 10% Over < 10% Under
Actual Goal Goal Met Below Goal
Jul Aug Sep % Months Submitted
Admissions 100%
Services 67%
Discharges 100%
1 or more Records Submitted to DMHAS
Data Submitted to DMHAS by Month
Actual % vs Goal % Actual Actual % Goal % State Avg Actual vs Goal
Treatment Completed Successfully 59 45% 50% 44% -5%
Discharge Outcomes
RecoveryNational Recovery Measures (NOMS) Actual % vs Goal % Actual Actual % Goal % State Avg Actual vs Goal
Abstinence/Reduced Drug Use 753 72% 50% 71% 22%
Not Arrested 1,017 98% 75% 94% 23%
Self Help 837 80% 60% 52% 20%
Employed 556 53% 40% 44% 13%
Improved/Maintained Axis V GAF Score 859 98% 75% 85% 23%
Stable Living Situation 1,025 99% 90% 93% 9%
Service UtilizationActual % vs Goal % Actual Actual % Goal % State Avg Actual vs Goal
Clients Receiving Services 906 100% 90% 76% 10%
Medication Assisted Treatment Actual % vs Goal % Actual Actual % Goal % State Avg Actual vs Goal
Length of Stay over 1 Year 693 68% 50% 68% 18%
Service Engagement
Measure Actual 1 Yr Ago Variance %
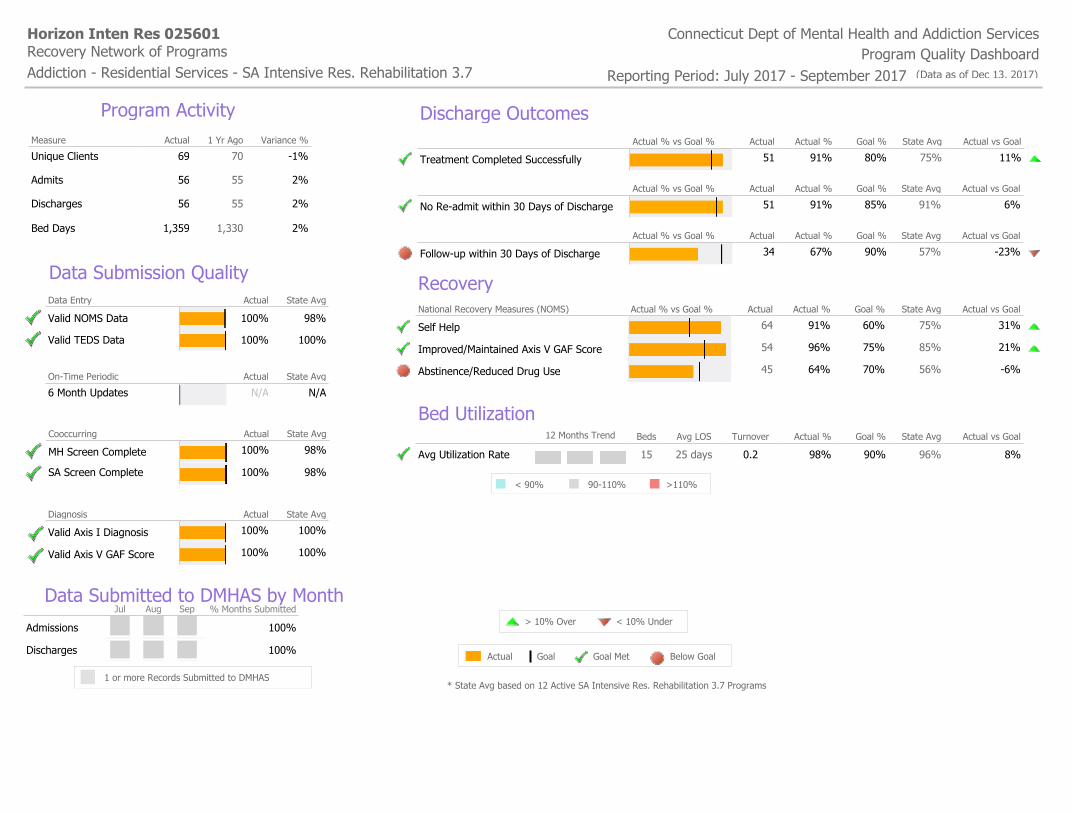
Unique Clients 69 70 -1%
Admits 56 55 2%
Discharges 56 55 2%
Bed Days 1,359 1,330 2%
Program Activity
On-Time Periodic Actual State Avg
6 Month Updates N/A N/A
Data Entry Actual State Avg
Valid NOMS Data 100% 98%
Valid TEDS Data 100% 100%
Data Submission Quality
Cooccurring Actual State Avg
MH Screen Complete 100% 98%
SA Screen Complete 100% 98%
Diagnosis Actual State Avg
Valid Axis I Diagnosis 100% 100%
Valid Axis V GAF Score 100% 100%
Connecticut Dept of Mental Health and Addiction ServicesHorizon Inten Res 025601
Addiction - Residential Services - SA Intensive Res. Rehabilitation 3.7 Program Quality DashboardRecovery Network of Programs
Reporting Period: July 2017 - September 2017 (Data as of Dec 13, 2017)
* State Avg based on 12 Active SA Intensive Res. Rehabilitation 3.7 Programs
> 10% Over < 10% Under
Actual Goal Goal Met Below Goal
Jul Aug Sep % Months Submitted
Admissions 100%
Discharges 100%
1 or more Records Submitted to DMHAS
Data Submitted to DMHAS by Month
Bed Utilization12 Months Trend Beds Avg LOS Turnover Actual % Goal % State Avg Actual vs Goal
Avg Utilization Rate 15 25 days 0.2 98% 90% 96% 8%
90-110%< 90% >110%
Actual % vs Goal % Actual Actual % Goal % State Avg Actual vs Goal
Treatment Completed Successfully 51 91% 80% 75% 11%
Actual % vs Goal % Actual Actual % Goal % State Avg Actual vs Goal
No Re-admit within 30 Days of Discharge 51 91% 85% 91% 6%
Actual % vs Goal % Actual Actual % Goal % State Avg Actual vs Goal
Follow-up within 30 Days of Discharge 34 67% 90% 57% -23%
Discharge Outcomes
RecoveryNational Recovery Measures (NOMS) Actual % vs Goal % Actual Actual % Goal % State Avg Actual vs Goal
Self Help 64 91% 60% 75% 31%
Improved/Maintained Axis V GAF Score 54 96% 75% 85% 21%
Abstinence/Reduced Drug Use 45 64% 70% 56% -6%

Measure Actual 1 Yr Ago Variance %
Unique Clients 980 978 0%
Admits 151 187 -19%
Discharges 182 187 -3%
Service Hours 4,792 4,863 -1%
Program Activity
On-Time Periodic Actual State Avg
6 Month Updates 100% 72%
Data Entry Actual State Avg
Valid NOMS Data 100% 99%
Valid TEDS Data 100% 99%
Data Submission Quality
Cooccurring Actual State Avg
MH Screen Complete 100% 98%
SA Screen Complete 100% 98%
Diagnosis Actual State Avg
Valid Axis I Diagnosis 100% 100%
Valid Axis V GAF Score 100% 100%
Connecticut Dept of Mental Health and Addiction ServicesKinsella Treatment Center 301862
Addiction - Medication Assisted Treatment - Methadone Maintenance Program Quality DashboardRecovery Network of Programs
Reporting Period: July 2017 - September 2017 (Data as of Dec 13, 2017)
* State Avg based on 27 Active Methadone Maintenance Programs
> 10% Over < 10% Under
Actual Goal Goal Met Below Goal
Jul Aug Sep % Months Submitted
Admissions 100%
Services 67%
Discharges 100%
1 or more Records Submitted to DMHAS
Data Submitted to DMHAS by Month
Actual % vs Goal % Actual Actual % Goal % State Avg Actual vs Goal
Treatment Completed Successfully 95 52% 50% 44% 2%
Discharge Outcomes
RecoveryNational Recovery Measures (NOMS) Actual % vs Goal % Actual Actual % Goal % State Avg Actual vs Goal
Not Arrested 961 97% 75% 94% 22%
Abstinence/Reduced Drug Use 684 69% 50% 71% 19%
Stable Living Situation 953 96% 90% 93% 6%
Improved/Maintained Axis V GAF Score 792 98% 75% 85% 23%
Employed 416 42% 40% 44% 2%
Self Help 432 44% 60% 52% -16%
Service UtilizationActual % vs Goal % Actual Actual % Goal % State Avg Actual vs Goal
Clients Receiving Services 807 100% 90% 76% 10%
Medication Assisted Treatment Actual % vs Goal % Actual Actual % Goal % State Avg Actual vs Goal
Length of Stay over 1 Year 579 59% 50% 68% 9%
Service Engagement
Measure Actual 1 Yr Ago Variance %
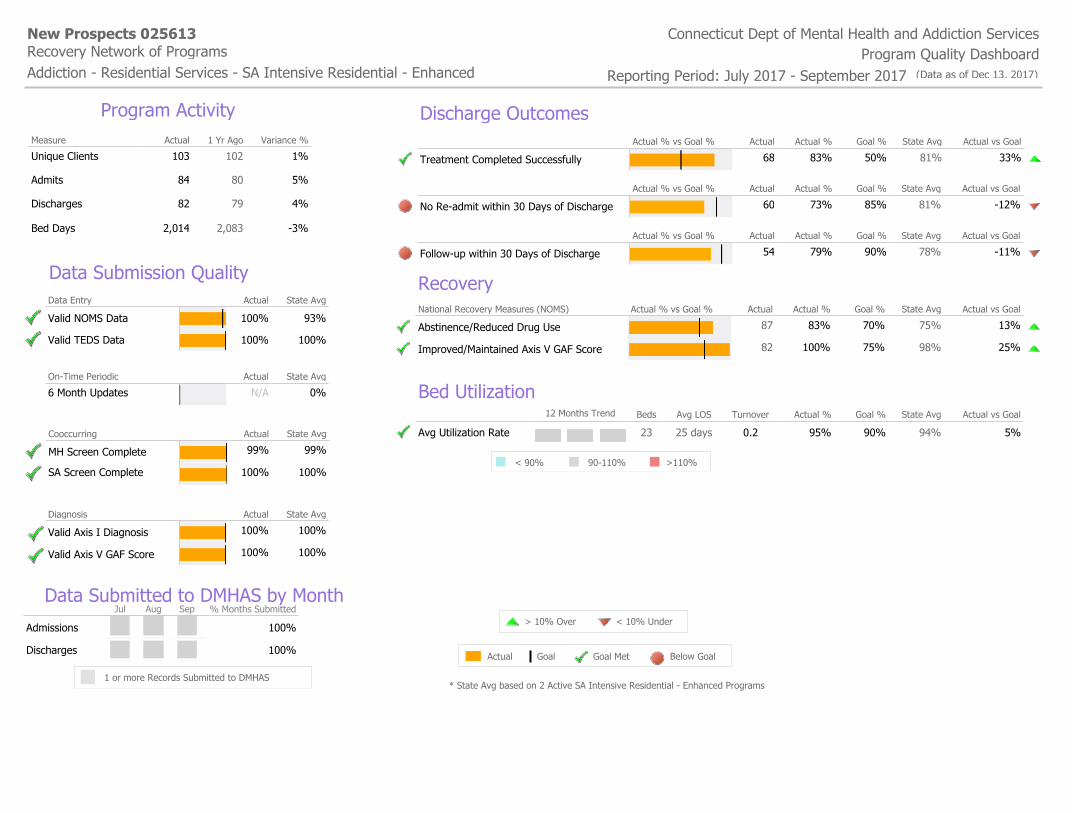
Unique Clients 103 102 1%
Admits 84 80 5%
Discharges 82 79 4%
Bed Days 2,014 2,083 -3%
Program Activity
On-Time Periodic Actual State Avg
6 Month Updates N/A 0%
Data Entry Actual State Avg
Valid NOMS Data 100% 93%
Valid TEDS Data 100% 100%
Data Submission Quality
Cooccurring Actual State Avg
MH Screen Complete 99% 99%
SA Screen Complete 100% 100%
Diagnosis Actual State Avg
Valid Axis I Diagnosis 100% 100%
Valid Axis V GAF Score 100% 100%
Connecticut Dept of Mental Health and Addiction ServicesNew Prospects 025613
Addiction - Residential Services - SA Intensive Residential - Enhanced Program Quality DashboardRecovery Network of Programs
Reporting Period: July 2017 - September 2017 (Data as of Dec 13, 2017)
* State Avg based on 2 Active SA Intensive Residential - Enhanced Programs
> 10% Over < 10% Under
Actual Goal Goal Met Below Goal
Jul Aug Sep % Months Submitted
Admissions 100%
Discharges 100%
1 or more Records Submitted to DMHAS
Data Submitted to DMHAS by Month
Bed Utilization12 Months Trend Beds Avg LOS Turnover Actual % Goal % State Avg Actual vs Goal
Avg Utilization Rate 23 25 days 0.2 95% 90% 94% 5%
90-110%< 90% >110%
Actual % vs Goal % Actual Actual % Goal % State Avg Actual vs Goal
Treatment Completed Successfully 68 83% 50% 81% 33%
Actual % vs Goal % Actual Actual % Goal % State Avg Actual vs Goal
No Re-admit within 30 Days of Discharge 60 73% 85% 81% -12%
Actual % vs Goal % Actual Actual % Goal % State Avg Actual vs Goal
Follow-up within 30 Days of Discharge 54 79% 90% 78% -11%
Discharge Outcomes
RecoveryNational Recovery Measures (NOMS) Actual % vs Goal % Actual Actual % Goal % State Avg Actual vs Goal
Abstinence/Reduced Drug Use 87 83% 70% 75% 13%
Improved/Maintained Axis V GAF Score 82 100% 75% 98% 25%
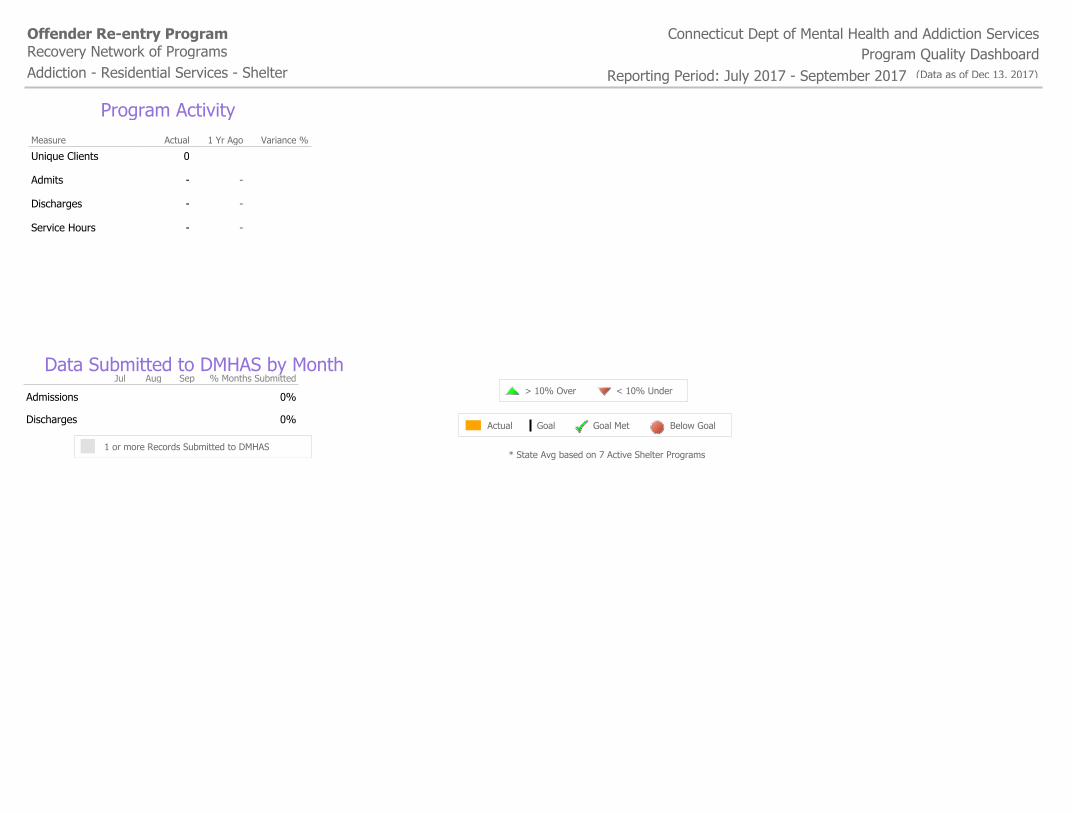
Measure Actual 1 Yr Ago Variance %
Unique Clients 0
Admits - -
Discharges - -
Service Hours - -
Program Activity
Connecticut Dept of Mental Health and Addiction ServicesOffender Re-entry Program
Addiction - Residential Services - Shelter Program Quality DashboardRecovery Network of Programs
Reporting Period: July 2017 - September 2017 (Data as of Dec 13, 2017)
* State Avg based on 7 Active Shelter Programs
> 10% Over < 10% Under
Actual Goal Goal Met Below Goal
Jul Aug Sep % Months Submitted
Admissions 0%
Discharges 0%
1 or more Records Submitted to DMHAS
Data Submitted to DMHAS by Month
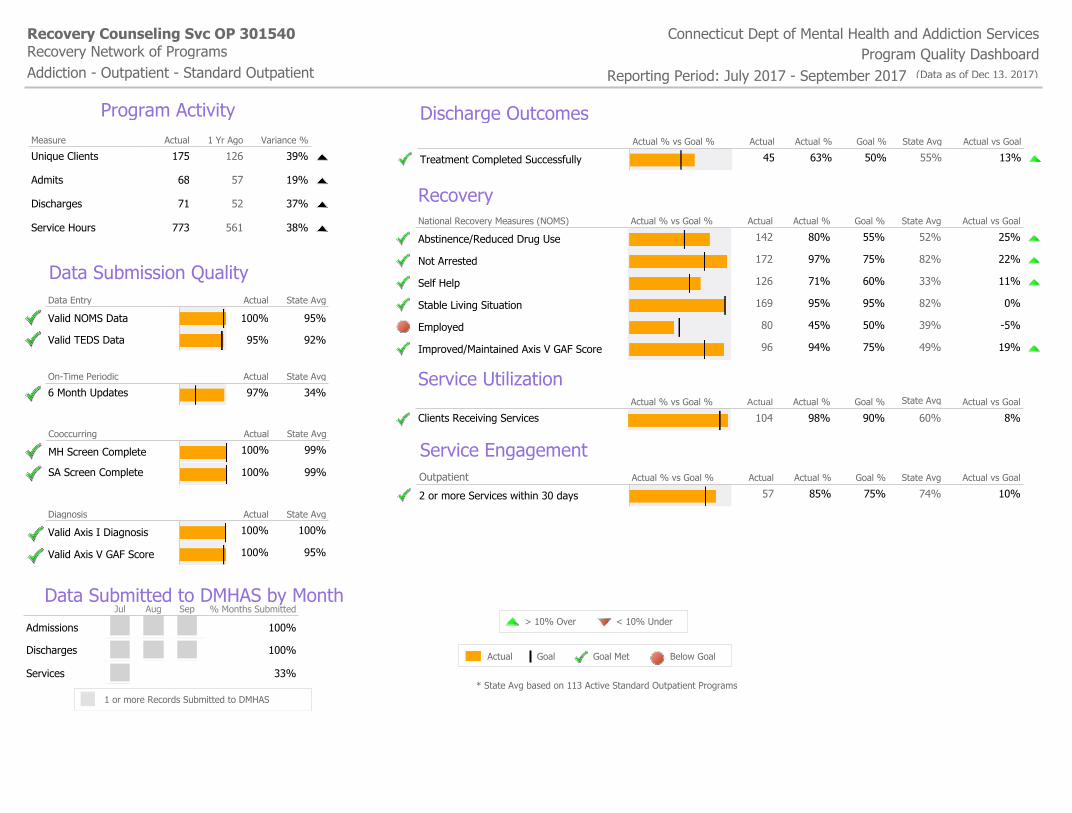
Measure Actual 1 Yr Ago Variance %
Unique Clients 175 126 39%
Admits 68 57 19%
Discharges 71 52 37%
Service Hours 773 561 38%
Program Activity
On-Time Periodic Actual State Avg
6 Month Updates 97% 34%
Data Entry Actual State Avg
Valid NOMS Data 100% 95%
Valid TEDS Data 95% 92%
Data Submission Quality
Cooccurring Actual State Avg
MH Screen Complete 100% 99%
SA Screen Complete 100% 99%
Diagnosis Actual State Avg
Valid Axis I Diagnosis 100% 100%
Valid Axis V GAF Score 100% 95%
Connecticut Dept of Mental Health and Addiction ServicesRecovery Counseling Svc OP 301540
Addiction - Outpatient - Standard Outpatient Program Quality DashboardRecovery Network of Programs
Reporting Period: July 2017 - September 2017 (Data as of Dec 13, 2017)
* State Avg based on 113 Active Standard Outpatient Programs
> 10% Over < 10% Under
Actual Goal Goal Met Below Goal
Jul Aug Sep % Months Submitted
Admissions 100%
Services 33%
Discharges 100%
1 or more Records Submitted to DMHAS
Data Submitted to DMHAS by Month
Actual % vs Goal % Actual Actual % Goal % State Avg Actual vs Goal
Treatment Completed Successfully 45 63% 50% 55% 13%
Discharge Outcomes
RecoveryNational Recovery Measures (NOMS) Actual % vs Goal % Actual Actual % Goal % State Avg Actual vs Goal
Abstinence/Reduced Drug Use 142 80% 55% 52% 25%
Not Arrested 172 97% 75% 82% 22%
Self Help 126 71% 60% 33% 11%
Stable Living Situation 169 95% 95% 82% 0%
Employed 80 45% 50% 39% -5%
Improved/Maintained Axis V GAF Score 96 94% 75% 49% 19%
Service UtilizationActual % vs Goal % Actual Actual % Goal % State Avg Actual vs Goal
Clients Receiving Services 104 98% 90% 60% 8%
Outpatient Actual % vs Goal % Actual Actual % Goal % State Avg Actual vs Goal
2 or more Services within 30 days 57 85% 75% 74% 10%
Service Engagement

Measure Actual 1 Yr Ago Variance %
Unique Clients 82 52 58%
Admits 41 26 58%
Discharges 44 23 91%
Service Hours 423 246 72%
Program Activity
On-Time Periodic Actual State Avg
6 Month Updates 50% 34%
Data Entry Actual State Avg
Valid NOMS Data 100% 95%
Valid TEDS Data 100% 92%
Data Submission Quality
Cooccurring Actual State Avg
MH Screen Complete 100% 99%
SA Screen Complete 100% 99%
Diagnosis Actual State Avg
Valid Axis I Diagnosis 100% 100%
Valid Axis V GAF Score 100% 95%
Connecticut Dept of Mental Health and Addiction ServicesRecovery Empowerment Services 750
Addiction - Outpatient - Standard Outpatient Program Quality DashboardRecovery Network of Programs
Reporting Period: July 2017 - September 2017 (Data as of Dec 13, 2017)
* State Avg based on 113 Active Standard Outpatient Programs
> 10% Over < 10% Under
Actual Goal Goal Met Below Goal
Jul Aug Sep % Months Submitted
Admissions 100%
Services 33%
Discharges 100%
1 or more Records Submitted to DMHAS
Data Submitted to DMHAS by Month
Actual % vs Goal % Actual Actual % Goal % State Avg Actual vs Goal
Treatment Completed Successfully 25 57% 50% 55% 7%
Discharge Outcomes
RecoveryNational Recovery Measures (NOMS) Actual % vs Goal % Actual Actual % Goal % State Avg Actual vs Goal
Not Arrested 75 90% 75% 82% 15%
Abstinence/Reduced Drug Use 52 63% 55% 52% 8%
Stable Living Situation 81 98% 95% 82% 3%
Employed 37 45% 50% 39% -5%
Self Help 38 46% 60% 33% -14%
Improved/Maintained Axis V GAF Score 46 100% 75% 49% 25%
Service UtilizationActual % vs Goal % Actual Actual % Goal % State Avg Actual vs Goal
Clients Receiving Services 37 95% 90% 60% 5%
Outpatient Actual % vs Goal % Actual Actual % Goal % State Avg Actual vs Goal
2 or more Services within 30 days 38 95% 75% 74% 20%
Service Engagement
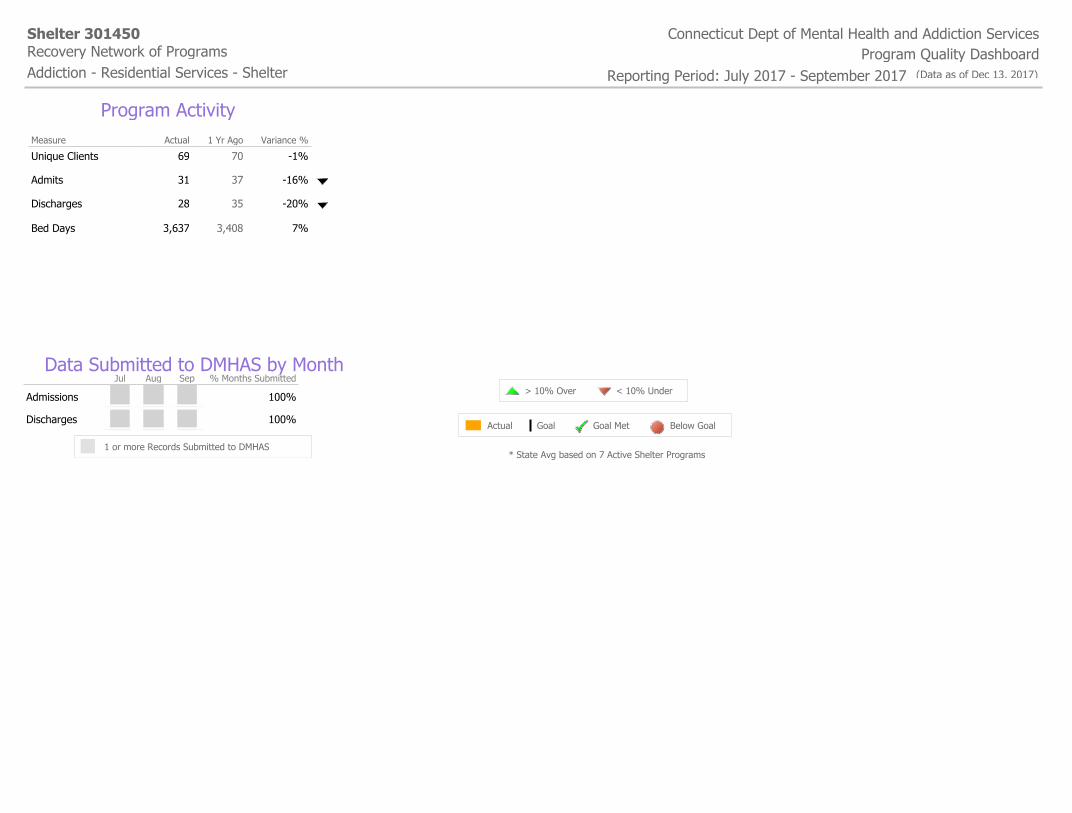
Measure Actual 1 Yr Ago Variance %
Unique Clients 69 70 -1%
Admits 31 37 -16%
Discharges 28 35 -20%
Bed Days 3,637 3,408 7%
Program Activity
Connecticut Dept of Mental Health and Addiction ServicesShelter 301450
Addiction - Residential Services - Shelter Program Quality DashboardRecovery Network of Programs
Reporting Period: July 2017 - September 2017 (Data as of Dec 13, 2017)
* State Avg based on 7 Active Shelter Programs
> 10% Over < 10% Under
Actual Goal Goal Met Below Goal
Jul Aug Sep % Months Submitted
Admissions 100%
Discharges 100%
1 or more Records Submitted to DMHAS
Data Submitted to DMHAS by Month
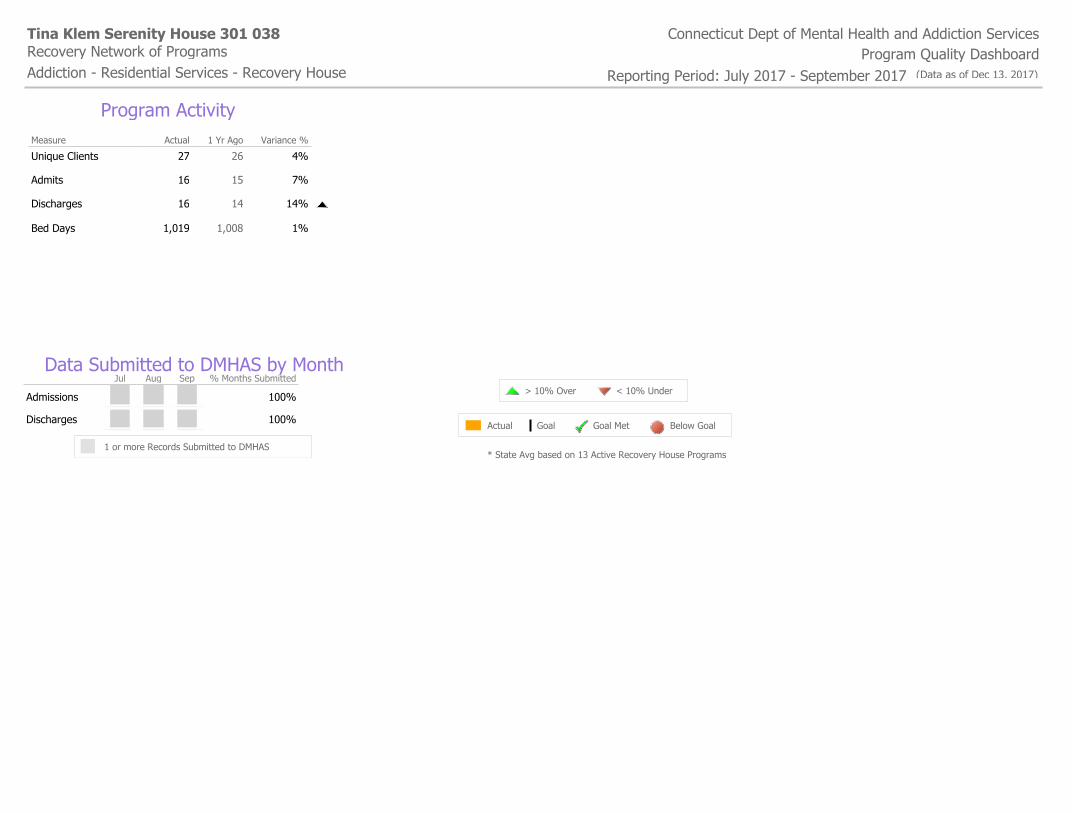
Measure Actual 1 Yr Ago Variance %
Unique Clients 27 26 4%
Admits 16 15 7%
Discharges 16 14 14%
Bed Days 1,019 1,008 1%
Program Activity
Connecticut Dept of Mental Health and Addiction ServicesTina Klem Serenity House 301 038
Addiction - Residential Services - Recovery House Program Quality DashboardRecovery Network of Programs
Reporting Period: July 2017 - September 2017 (Data as of Dec 13, 2017)
* State Avg based on 13 Active Recovery House Programs
> 10% Over < 10% Under
Actual Goal Goal Met Below Goal
Jul Aug Sep % Months Submitted
Admissions 100%
Discharges 100%
1 or more Records Submitted to DMHAS
Data Submitted to DMHAS by Month
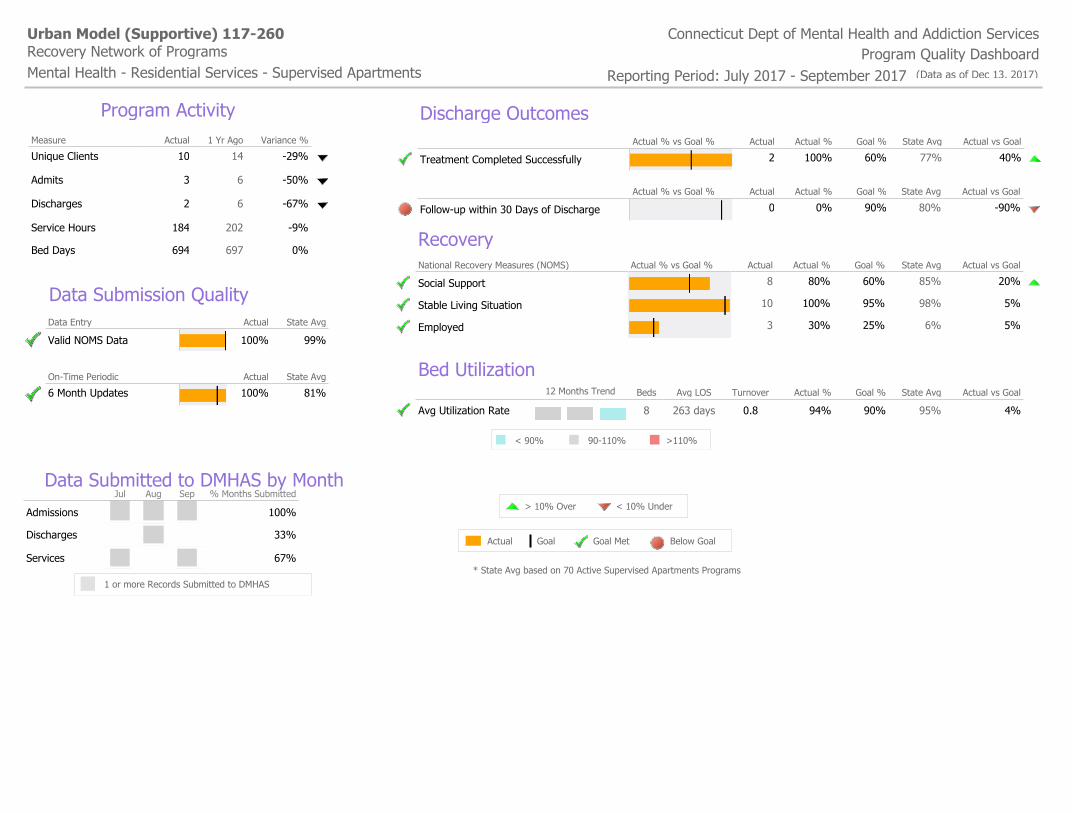
Measure Actual 1 Yr Ago Variance %
Unique Clients 10 14 -29%
Admits 3 6 -50%
Discharges 2 6 -67%
Service Hours 184 202 -9%
Bed Days 694 697 0%
Program Activity
On-Time Periodic Actual State Avg
6 Month Updates 100% 81%
Data Entry Actual State Avg
Valid NOMS Data 100% 99%
Data Submission Quality
Connecticut Dept of Mental Health and Addiction ServicesUrban Model (Supportive) 117-260
Mental Health - Residential Services - Supervised Apartments Program Quality DashboardRecovery Network of Programs
Reporting Period: July 2017 - September 2017 (Data as of Dec 13, 2017)
* State Avg based on 70 Active Supervised Apartments Programs
> 10% Over < 10% Under
Actual Goal Goal Met Below Goal
Jul Aug Sep % Months Submitted
Admissions 100%
Services 67%
Discharges 33%
1 or more Records Submitted to DMHAS
Data Submitted to DMHAS by Month
Bed Utilization12 Months Trend Beds Avg LOS Turnover Actual % Goal % State Avg Actual vs Goal
Avg Utilization Rate 8 263 days 0.8 94% 90% 95% 4%
90-110%< 90% >110%
Actual % vs Goal % Actual Actual % Goal % State Avg Actual vs Goal
Treatment Completed Successfully 2 100% 60% 77% 40%
Actual % vs Goal % Actual Actual % Goal % State Avg Actual vs Goal
Follow-up within 30 Days of Discharge 0 0% 90% 80% -90%
Discharge Outcomes
RecoveryNational Recovery Measures (NOMS) Actual % vs Goal % Actual Actual % Goal % State Avg Actual vs Goal
Social Support 8 80% 60% 85% 20%
Stable Living Situation 10 100% 95% 98% 5%
Employed 3 30% 25% 6% 5%
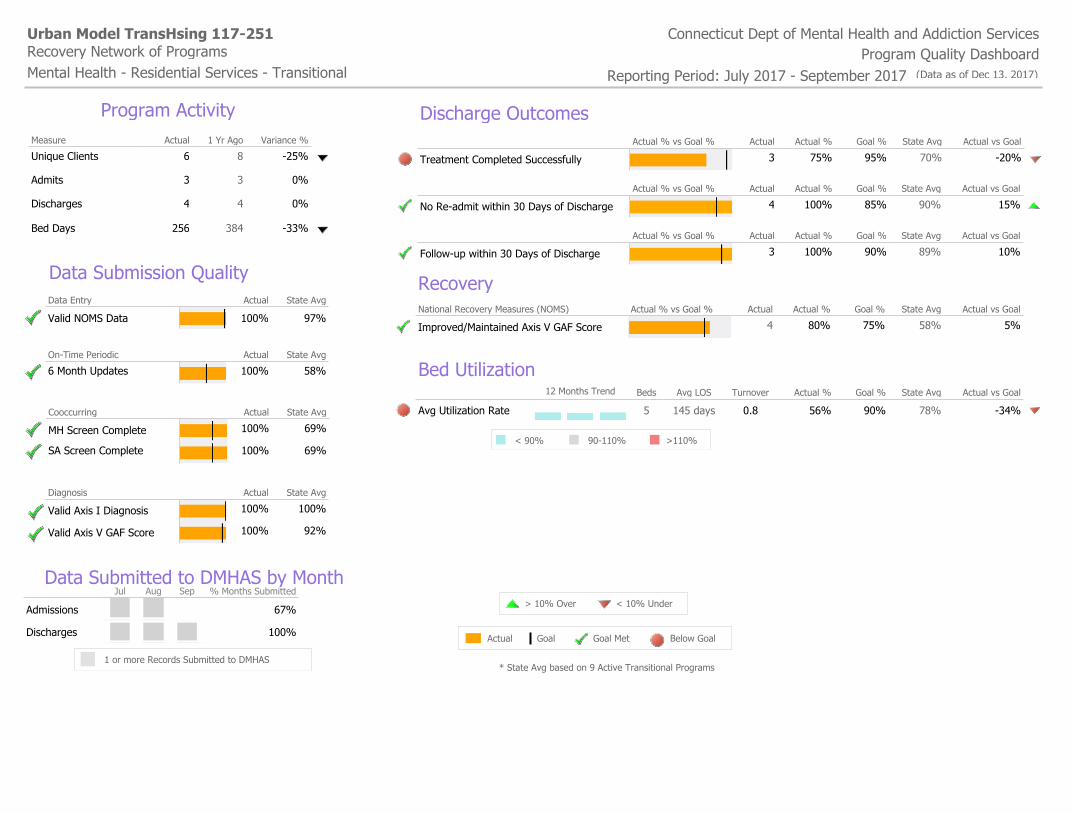
Measure Actual 1 Yr Ago Variance %
Unique Clients 6 8 -25%
Admits 3 3 0%
Discharges 4 4 0%
Bed Days 256 384 -33%
Program Activity
On-Time Periodic Actual State Avg
6 Month Updates 100% 58%
Data Entry Actual State Avg
Valid NOMS Data 100% 97%
Data Submission Quality
Cooccurring Actual State Avg
MH Screen Complete 100% 69%
SA Screen Complete 100% 69%
Diagnosis Actual State Avg
Valid Axis I Diagnosis 100% 100%
Valid Axis V GAF Score 100% 92%
Connecticut Dept of Mental Health and Addiction ServicesUrban Model TransHsing 117-251
Mental Health - Residential Services - Transitional Program Quality DashboardRecovery Network of Programs
Reporting Period: July 2017 - September 2017 (Data as of Dec 13, 2017)
* State Avg based on 9 Active Transitional Programs
> 10% Over < 10% Under
Actual Goal Goal Met Below Goal
Jul Aug Sep % Months Submitted
Admissions 67%
Discharges 100%
1 or more Records Submitted to DMHAS
Data Submitted to DMHAS by Month
Bed Utilization12 Months Trend Beds Avg LOS Turnover Actual % Goal % State Avg Actual vs Goal
Avg Utilization Rate 5 145 days 0.8 56% 90% 78% -34%
90-110%< 90% >110%
Actual % vs Goal % Actual Actual % Goal % State Avg Actual vs Goal
Treatment Completed Successfully 3 75% 95% 70% -20%
Actual % vs Goal % Actual Actual % Goal % State Avg Actual vs Goal
No Re-admit within 30 Days of Discharge 4 100% 85% 90% 15%
Actual % vs Goal % Actual Actual % Goal % State Avg Actual vs Goal
Follow-up within 30 Days of Discharge 3 100% 90% 89% 10%
Discharge Outcomes
RecoveryNational Recovery Measures (NOMS) Actual % vs Goal % Actual Actual % Goal % State Avg Actual vs Goal
Improved/Maintained Axis V GAF Score 4 80% 75% 58% 5%