Embed Size (px)
Citation preview

ORIGINAL PAPER
Provenance variation and within-provenance genetic parametersin Eucalyptus urophylla across 125 test sites in Brazil, Colombia,Mexico, South Africa and Venezuela
G. R. Hodge1 & W. S. Dvorak1
Received: 13 November 2014 /Revised: 5 May 2015 /Accepted: 7 May 2015 /Published online: 21 May 2015# Springer-Verlag Berlin Heidelberg 2015
Abstract Provenance and within-provenance genetic var-iation for stem volume growth in Eucalyptus urophyllawas examined in a large trial series of 125 provenance/progeny tests in five countries. In general, heritability(within-provenance) for age-3 volume was around 0.15for Brazil, Colombia, Mexico, and South Africa and wasslightly lower in Venezuela, where tree volume was lower.Provenances from all seven islands in Indonesia where thespecies occurs were included in the trials. Substantialprovenance variation was observed in all countries, withthe best provenances showing from 25 to 30 % morevolume than the mean. The average of between-countrygenetic correlation estimates for growth traits was 0.72,both among and within provenances. Provenance andfamily performance between Mexico and Venezuela werevery similar, with estimated provenance and within-provenance genetic correlations of 1.00 and 0.90, respec-tively. There was some tendency for lower-elevation prov-enances to show better volume growth, but there werealso very large differences observed between provenanceslocated very close to one another. The results underscorethe value of extensive provenance collections throughoutthe range of a species in order to ensure that the very bestprovenances are being captured.
Keywords Genetic parameters . Provenance . Genotype×environment interaction . Conservation status . Type Bcorrelations .Meta-analysis .Eucalyptus urophylla
Introduction
Eucalyptus urophylla is one of the most important species intropical plantation forestry. It is occasionally used commer-cially as a pure species in regions of Southeast Asia, tropicalBrazil, and along the western Gulf Coast inMexico. However,it is better known as an important hybrid partner and is com-monly crossed with other eucalypt species to produce progenythat often exhibit remarkable hybrid vigor for growth.Historically, E. urophylla has most often been hybridized withEucalyptus grandis to produce fast-growing clonal plantationsfor the pulp and solid-wood industries in the SouthernHemisphere. Generally, the E. grandis×E. urophylla hybridhas better disease tolerance for some leaf and stem diseases,and higher wood density than pure E. grandis. More recently,E. urophylla has been tested as a hybrid partner withEucalyptus pellita in the Republic of the Congo (Vigneronet al. 2000) and in Indonesia, and with E. pellita andE. brassiana in north-eastern Brazil, where the hybrids thereare commercially planted as a source of high-density wood forbio-energy. Crosses between E. urophylla and cold-tolerantspecies like E. benthamii and E. dunnii are also now beingtested in seasonally cool areas in southern Latin America. TheE. urophylla parent brings increased growth and better rootingability to the hybrid compared to the cold-tolerant eucalyptparent. In many ways, E. urophylla is a universal hybrid do-nor, since it can easily be crossed with a number of differenteucalypt species and often produces reasonable crops of viablehybrid seeds.
Communicated by: R. Burdon
This article is part of the Topical Collection on Breeding
* G. R. [email protected]
1 Camcore, Department of Forestry and Environmental Resources,North Carolina State University, Raleigh, NC, USA
Tree Genetics & Genomes (2015) 11: 57DOI 10.1007/s11295-015-0889-3

E. urophylla is native to seven islands in the eastern LesserSunda Archipelago: Flores, Adonora, Lembata, Pantar, Alor,Timor, and Wetar (see Fig. 1). The species occurs from 70-melevation (Wetar) to over 2500 m (Timor) (Gunn andMcDonald 1991) across a myriad of soil types that are usuallywell-drained. Black and dark-grey volcanic soils typify thesites at Mt. Egon (Flores), Mt. Boleng (Adonara), and Mt.Lewotolo (Lembata). More ancient and weathered yellow-brown soils can be found on some sites on Mt. Mutis in west-ern Timor and reddish-yellow soils derived from upliftedocean crust typify the soil profiles on Wetar. Estimates ofannual precipitation on the islands vary depending on the cli-matic models used. The FloraMap™ model (Jones andGladkov, 1999) indicates that mean annual precipitationranges from 820 to 1250 mm across the islands (Dvoraket al. 2008). Calculations using WorldClim™ (Hijmans et al.2005, 2012) suggest higher yearly precipitation averages from1130 to 1580mm (Camcore, unpublished). Both models showWetar to receive the least precipitation and the Timor high-lands to be the wettest, with the WorldClim model indicatingthat some provenances on the latter receive approximately
2000 mm of rain annually. The length of the dry season variesby island. The island of Wetar and some provenances in thehighlands of Timor have only a 3-month dry season (<50 mmof rain per month), while most of the other islands have morepronounced dry periods of 5 months between June andOctober. Of the seven islands, the climate on Wetar is mostdistinct from the other six islands, with lower, more evenlydistributed rainfall (Dvorak et al. 2008).
Australian and French forest researchers were the first tomake seed collections of E. urophylla in Indonesia for prove-nance testing in the 1960s and 1970s (see Martin andCossalter 1975–1976; Turnbull and Brooker 1978; Jacobs1981; FAO 1981; Moura 1981; Gunn and McDonald 1991).There have been a number of papers published in the last 2decades on the results of provenance and family testing ofE. urophylla from these early seed collections, including esti-mation of genetic parameters (see Vercoe and Clarke 1994;Wei and Borralho 1998; Rocha et al. 2006; Kien et al. 2009;Maid and Bhumibhamon 2009; Souza et al. 2011; and others).Results generally indicated that Mt. Egon and Mt. Lewotobi,on Flores Island, were the best in productivity and that the
Fig. 1 Natural range of E. urophylla and provenances where family seed collections were made on seven islands in Indonesia
57 Page 2 of 18 Tree Genetics & Genomes (2015) 11: 57

high-elevation Timor sources were the poorest in growth.However, Vercoe and Clarke (1994) concluded in their sum-mary of international test results of E. urophylla trials in thetropics and subtropics that there was no one single superiorprovenance or island of origin, with the exception of the poorperformance of high-elevation sources on Timor. The mainlimitation of many of these early E. urophylla studies was thatonly one to a few trials were established per country andsometimes the studies included populations represented byonly a few open-pollinated families. In some cases,provenance/progeny trials were selectively thinned prior toassessment, which would bias differences among provenancesand families, and affect the precision of estimates of geneticparameters.
As E. urophylla has grown in importance as a plantationspecies and a hybrid partner, governments, universities, andprivate sector organizations have made additional seed collec-tions on the islands to resample known populations of provenquality and to locate new ones. One of the most recent com-prehensive seed collections of E. urophylla were made byCamcore (International Tree Breeding and ConservationProgram), North Carolina State University, and PTSumalindo Hutani Jaya, a local Indonesian forest industry,from 1996 to 2003 (Hodge et al. 2001; Pepe et al. 2004;Dvorak et al. 2008). In the 7 years of seed collections, 62populations and 1104 mother trees were sampled on the sevenislands where E. urophylla naturally occurs. Camcore collec-tions were different than prior ones in several respects. First,the collection efforts sampled a larger number of locations onmost islands than previous collections. Second, there was anattempt to make multiple seed collections of E. urophylla ondifferent aspects of the slopes of several volcanoes with arecent history of eruptions (Mt. Egon, Mt. Boleng, Mt.Lewotolo). This was to determine if different levels of naturaland/or man-made disturbance influenced provenance perfor-mance in field trials dependent on the life history of the par-ticular stands. Third, there was a mandate from the Camcoremembership to assess the conservation status of each naturalpopulation sampled on the islands using standards of theInternational Union for the Conservation of Nature andNatural Resources (IUCN) (Pepe et al. 2004). The ultimategoal was to establish ex situ conservation parks of theE. urophylla in various countries (Mitchell 2010; Dvorak2012). Fourth, all Camcore members participating in the fieldtesting of the genetic material collected in Indonesia in thevarious countries were required to use the same test design,establish trees at approximately the same spacing, and makeassessments at the same age to facilitate meaningful compar-isons across sites and years.
In this paper, we examine provenance and familyperformance across two continents and five countries in 125Camcore E. urophylla trials. Preliminary assessments of asubset of this trial series were made by Hodge et al. (2001)
and Dvorak et al. (2008); the current data set is large and isessentially complete, as very few further measurements fromthese trials are expected. The large data set allows for preciseresults of provenance and family mean growth and survival atdifferent locations, and good estimates of genetic parametersfor breeding purposes, including genotype×environment in-teraction of provenances and families across a range of climat-ic and edaphic effects over large geographic areas. The con-tinuing Camcore efforts on ex situ conservation ofE. urophylla populations are summarized. Having good infor-mation on the geographical limits of transfer of genetic mate-rial in E. urophylla is important, especially during a period ofglobal climatic fluctuations, for the development of pure-species and hybrid breeding programs, and the genetic com-position and placement of ex situ conservation plantings in thetropics and subtropics.
Even though E. urophylla naturally occurs in the Republicof Indonesia and the Democratic Republic of Timor-Leste(formerly East Timor, Indonesia), we refer to E. urophyllaoccurring only in Indonesia in this paper. None of theCamcore seed collections made between 1996 and 2003 camefrom the Democratic Republic of Timor Leste because of po-litical difficulties in entering the region as the local populacepushed for independence.
Materials and methods
Seed collections
Seed collections in natural populations of E. urophylla occurredfrommid-June to early September over the 7 years from 1996 to2003, depending on the seasonality of capsule ripening andelevation of the collection site. Seeds were collected from 10to 30 trees per provenance whenever possible. Observationswere made at each site to classify the stand as old-growth forestsor secondary regeneration, and to describe soil characteristics(color and drainage) and conservation status. Also, it was notedif there was any E. alba present at the collection sites on thelower slopes (<500-m elevation) to explain observations of nat-ural introgression with E. urophylla in progeny trials. Therewere multiple trips to some islands over years to sample differ-ent provenances. Seeds were kept separate by individual treeand then sent to Camcore, North Carolina State University, forrepackaging and distribution. Seed distribution for tests occurredafter each year of seed collection, so all families are not presentat all test sites. In general, there were common control lots,typically multiprovenance bulks, used across years to maintainconnectedness among the test data sets. Details of the collectionsites and year of collection are presented in Pepe et al. (2004).Some latitude and longitude coordinates of various provenancessampled during the collections have been amended from earlierpublications because of improved GPS and mapping
Tree Genetics & Genomes (2015) 11: 57 Page 3 of 18 57

Table 1 Details for provenances of Eucalyptus urophylla
Code Provenance Island Yearcollected
Cons.statusa
Latitude Longitude Elevation Ann.precip.b
Trees bG prov
Min Max BRZ COL MEX SAF VEN
1 Doken Adonara 1996 V 08° 20′ S 123° 15′ E 600 1000 1452 20 −12.0 −9.7 −21.1 −5.8 −19.83 Muda Adonara 1996 V 08° 21′ S 123° 16′ E 600 900 1452 20 32.1 16.3 17.7 0.4 17.1
4 Lamalota Adonara 1996 V 08° 16′ S 123° 16′ E 650 820 1292 20 3.1 3.9 −7.4 −0.7 −6.853 Lamalota Barat Adonara 2002 V 08° 21′ S 123° 15′ E 866 866 1376 6 4.4 3.6 0.8 0.9 0.8
54 Dua Muda Adonara 2002 V 08° 20′ S 123° 15′ E 733 733 1348 16 −7.9 −8.0 −4.2 −2.1 −3.855 Watololong Adonara 2002 V 08° 20′ S 123° 15′ E 630 800 1292 14 −27.5 −26.5 −11.5 −6.7 −10.656 Gonehama Adonara 2002 V 08° 20′ S 123° 16′ E 687 687 1452 15 −20.2 −23.8 0.4 −5.3 −0.157 Lamahela Adonara 2002 V 08° 22′ S 123° 15′ E 856 856 1452 11 −4.7 −14.6 18.6 −2.1 16.4
58 Kawela Adonara 2003 CR 08° 21′ S 123° 04′ E 600 600 1398 20 15.9 7.9 20.6 3.2 18.6
13 Mainang Alor 1997 V 08° 14′ S 124° 39′ E 1100 1250 1577 20 11.8 11.6 14.7 5.9 12.9
14 Apui Alor 1997 V 08° 16′ S 124° 44′ E 1100 1300 1571 20 −13.9 −0.8 −9.6 3.7 −9.515 Pintu Mas Alor 1997 E 08° 17′ S 124° 33′ E 320 450 1301 20 26.7 11.6 14.4 −0.9 13.0
16 Watakika Alor 1997 CR 08° 18′ S 124° 30′ E 350 600 1434 20 19.8 11.9 3.2 −0.5 2.6
27 Manabai Alor 1999 E 08° 14′ S 124° 45′ E 400 400 1436 5 −6.6 −3.5 −10.1 −1.4 −8.128 Molpui Alor 1999 E 08° 15′ S 124° 44′ E 400 400 1436 15 −3.8 −2.3 −6.8 −0.9 −5.317 Ille Nggele Flores 1998 E 08° 39′ S 122° 27′ E 570 800 1381 23 16.0 11.5 20.3 4.0 18.1
18 Lere-Baukrenget Flores 1998 E 08° 39′ S 122° 23′ E 700 750 1415 20 2.7 4.6 5.0 1.8 4.7
19 Kilawair Flores 1998 E 08° 41′ S 122° 29′ E 225 530 1615 21 10.0 −3.3 32.7 1.9 28.6
20 Hokeng Flores 1998 E 08° 31′ S 122° 47′ E 350 800 1502 27 1.3 −13.6 7.9 −6.2 6.4
24 Ille Meak Flores 1999 E 08° 39′ S 122° 27′ E 680 680 1381 15 15.9 7.5 20.6 3.0 18.4
26 Hikong Flores 1999 E 08° 30′ S 122° 40′ E 680 680 1375 26 6.4 6.1 5.4 2.6 6.2
45 Koangao Flores 2001 E 08° 40′ S 122° 32′ E 220 220 1421 24 15.6 8.0 32.5 5.8 29.4
46 Kolibuluk/Waibeller
Flores 2001 E 08° 40′ S 122° 25′ E 648 648 1723 18 0.8 0.4 14.9 0.4 13.5
47 Natakoli Flores 2001 E 08° 37′ S 122° 24′ E 820 980 1415 16 −21.2 −18.4 −9.1 −4.7 −8.448 Palueh Flores 2001 CR 08° 28′ S 122° 42′ E 540 600 1532 21 22.5 25.6 28.1 7.5 25.1
2 Padekluwa Lembata 1996 E 08° 30′ S 123° 26′ E 700 900 1492 20 2.2 7.1 7.5 5.5 6.7
5 Jontona / IlleApe 1
Lembata 1996 V 08° 16′ S 123° 29′ E 675 900 1312 20 −4.0 1.8 6.9 4.9 5.9
6 Labalekan Lembata 1996 V 08° 32′ S 123° 31′ E 620 920 1346 20 8.1 5.6 16.3 4.2 14.9
31 Ille Kerbau Lembata 2000 V 08° 29′ S 123° 29′ E 730 750 1421 16 24.0 20.2 6.8 5.1 10.2
32 Puor Lembata 2000 E 08° 34′ S 123° 24′ E 900 980 1413 14 23.8 12.9 11.8 2.4 11.0
33 Jontona / IlleApe 2
Lembata 2000 E 08° 17′ S 123° 30′ E 840 880 1440 25 24.6 7.2 11.6 1.2 9.8
34 Bunga Muda Lembata 2000 V 08° 16′ S 123° 32′ E 600 700 1440 14 15.7 6.5 20.8 2.8 18.3
35 Lowokukung Lembata 2000 V 08° 16′ S 123° 30′ E 540 650 1312 8 −12.0 −17.5 1.0 −7.0 2.5
30 Wasbila Pantar 1999 E 08° 20′ S 124° 03′ E 380 380 1230 4 −1.8 −4.8 −1.8 −2.1 −0.336 Mauta Pantar 2000 E 08° 26′ S 124° 10′ E 600 640 1398 31 −8.9 −23.2 4.8 −6.9 3.0
37 Lalapang Pantar 2000 E 08° 19′ S 124° 16′ E 500 650 1429 17 −8.2 −11.4 14.4 −1.6 14.2
38 Delaki Pantar 2000 E 08° 31′ S 124° 06′ E 780 840 1390 20 −1.9 −11.3 10.8 −1.7 12.6
39 Beangonong Pantar 2000 E 08° 25′ S 123° 57′ E 450 680 1201 25 −9.1 −19.7 8.6 −4.0 5.4
7 Naususu Timor 1997 LR 09° 38′ S 124° 13′ E 1200 1450 1759 20 −26.1 −19.8 −29.2 −7.4 −26.58 Mollo Timor 1997 LR 09° 41′ S 124° 11′ E 1200 1600 1489 20 −27.3 −17.1 −30.8 −6.0 −29.59 Tutem Timor 1997 LR 09° 35′ S 124° 17′ E 1200 1400 1563 20 −7.3 −0.3 −17.6 −0.6 −15.610 Tune Timor 1997 LR 09° 33′ S 124° 19′ E 1100 1400 1481 20 −6.9 0.2 −23.6 −2.2 −20.811 Lelobatang Timor 1997 LR 09° 41′ S 124° 14′ E 1200 1400 1578 13 −20.2 −14.4 −23.6 −5.4 −21.712 Fatumnase Timor 1997 LR 09° 34′ S 124° 13′ E 1700 2000 1912 4 −14.1 −5.1 −20.6 −1.9 −19.221 Lelobatan Timor 1998 LR 09° 43′ S 124° 10′ E 1400 1650 1424 34 −22.9 −9.8 −24.3 −0.7 −22.722 Leloboko Timor 1998 LR 09° 37′ S 124° 10′ E 1400 1600 1467 23 −24.8 −10.2 −32.6 −2.8 −29.423 A’esrael Timor 1998 LR 09° 36′ S 124° 14′ E 1655 1655 1909 11 −34.9 −20.0 −50.4 −6.9 −46.325 Fatuneno Timor 1999 LR 09° 32′ S 124° 18′ E 1400 1400 1503 14 −5.0 −2.8 −7.6 −1.1 −7.129 Nenas Timor 1999 LR 09° 35′ S 124° 12′ E 1605 1605 1550 20
57 Page 4 of 18 Tree Genetics & Genomes (2015) 11: 57
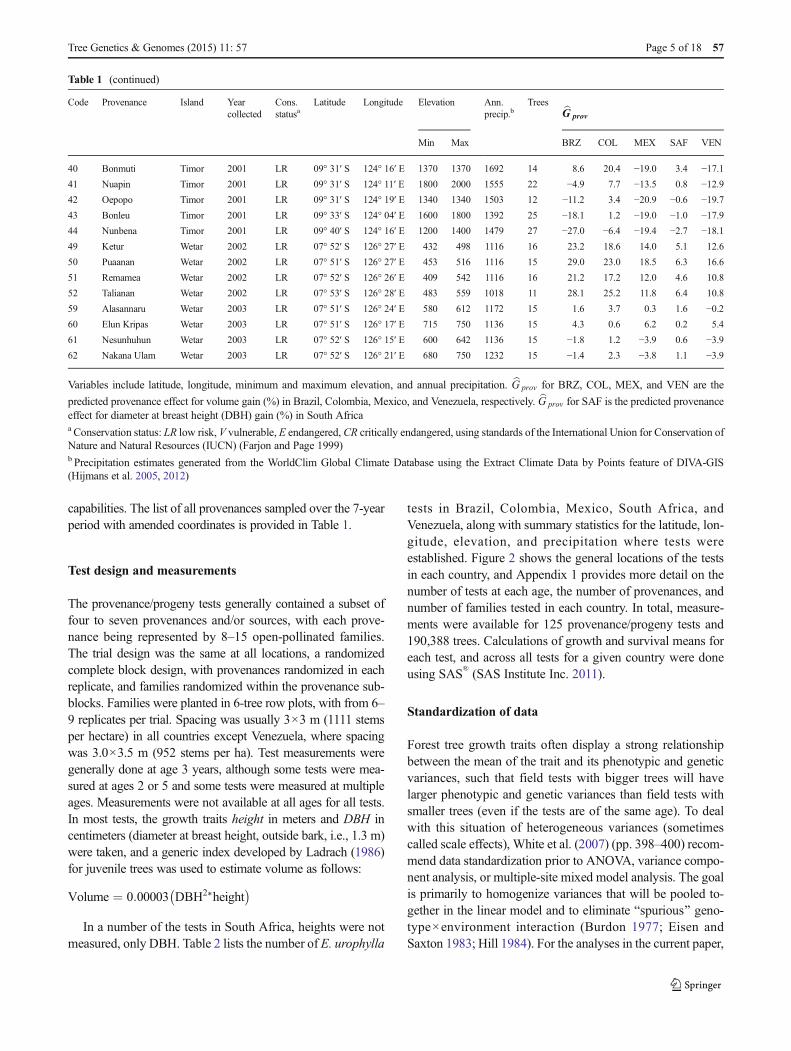
capabilities. The list of all provenances sampled over the 7-yearperiod with amended coordinates is provided in Table 1.
Test design and measurements
The provenance/progeny tests generally contained a subset offour to seven provenances and/or sources, with each prove-nance being represented by 8–15 open-pollinated families.The trial design was the same at all locations, a randomizedcomplete block design, with provenances randomized in eachreplicate, and families randomized within the provenance sub-blocks. Families were planted in 6-tree row plots, with from 6–9 replicates per trial. Spacing was usually 3×3 m (1111 stemsper hectare) in all countries except Venezuela, where spacingwas 3.0×3.5 m (952 stems per ha). Test measurements weregenerally done at age 3 years, although some tests were mea-sured at ages 2 or 5 and some tests were measured at multipleages. Measurements were not available at all ages for all tests.In most tests, the growth traits height in meters and DBH incentimeters (diameter at breast height, outside bark, i.e., 1.3 m)were taken, and a generic index developed by Ladrach (1986)for juvenile trees was used to estimate volume as follows:
Volume ¼ 0:00003 DBH2*height� �
In a number of the tests in South Africa, heights were notmeasured, only DBH. Table 2 lists the number of E. urophylla
tests in Brazil, Colombia, Mexico, South Africa, andVenezuela, along with summary statistics for the latitude, lon-gitude, elevation, and precipitation where tests wereestablished. Figure 2 shows the general locations of the testsin each country, and Appendix 1 provides more detail on thenumber of tests at each age, the number of provenances, andnumber of families tested in each country. In total, measure-ments were available for 125 provenance/progeny tests and190,388 trees. Calculations of growth and survival means foreach test, and across all tests for a given country were doneusing SAS® (SAS Institute Inc. 2011).
Standardization of data
Forest tree growth traits often display a strong relationshipbetween the mean of the trait and its phenotypic and geneticvariances, such that field tests with bigger trees will havelarger phenotypic and genetic variances than field tests withsmaller trees (even if the tests are of the same age). To dealwith this situation of heterogeneous variances (sometimescalled scale effects), White et al. (2007) (pp. 398–400) recom-mend data standardization prior to ANOVA, variance compo-nent analysis, or multiple-site mixed model analysis. The goalis primarily to homogenize variances that will be pooled to-gether in the linear model and to eliminate Bspurious^ geno-type×environment interaction (Burdon 1977; Eisen andSaxton 1983; Hill 1984). For the analyses in the current paper,
Table 1 (continued)
Code Provenance Island Yearcollected
Cons.statusa
Latitude Longitude Elevation Ann.precip.b
Trees bG prov
Min Max BRZ COL MEX SAF VEN
40 Bonmuti Timor 2001 LR 09° 31′ S 124° 16′ E 1370 1370 1692 14 8.6 20.4 −19.0 3.4 −17.141 Nuapin Timor 2001 LR 09° 31′ S 124° 11′ E 1800 2000 1555 22 −4.9 7.7 −13.5 0.8 −12.942 Oepopo Timor 2001 LR 09° 31′ S 124° 19′ E 1340 1340 1503 12 −11.2 3.4 −20.9 −0.6 −19.743 Bonleu Timor 2001 LR 09° 33′ S 124° 04′ E 1600 1800 1392 25 −18.1 1.2 −19.0 −1.0 −17.944 Nunbena Timor 2001 LR 09° 40′ S 124° 16′ E 1200 1400 1479 27 −27.0 −6.4 −19.4 −2.7 −18.149 Ketur Wetar 2002 LR 07° 52′ S 126° 27′ E 432 498 1116 16 23.2 18.6 14.0 5.1 12.6
50 Puaanan Wetar 2002 LR 07° 51′ S 126° 27′ E 453 516 1116 15 29.0 23.0 18.5 6.3 16.6
51 Remamea Wetar 2002 LR 07° 52′ S 126° 26′ E 409 542 1116 16 21.2 17.2 12.0 4.6 10.8
52 Talianan Wetar 2002 LR 07° 53′ S 126° 28′ E 483 559 1018 11 28.1 25.2 11.8 6.4 10.8
59 Alasannaru Wetar 2003 LR 07° 51′ S 126° 24′ E 580 612 1172 15 1.6 3.7 0.3 1.6 −0.260 Elun Kripas Wetar 2003 LR 07° 51′ S 126° 17′ E 715 750 1136 15 4.3 0.6 6.2 0.2 5.4
61 Nesunhuhun Wetar 2003 LR 07° 52′ S 126° 15′ E 600 642 1136 15 −1.8 1.2 −3.9 0.6 −3.962 Nakana Ulam Wetar 2003 LR 07° 52′ S 126° 21′ E 680 750 1232 15 −1.4 2.3 −3.8 1.1 −3.9
Variables include latitude, longitude, minimum and maximum elevation, and annual precipitation. bG prov for BRZ, COL, MEX, and VEN are the
predicted provenance effect for volume gain (%) in Brazil, Colombia, Mexico, and Venezuela, respectively. bG prov for SAF is the predicted provenanceeffect for diameter at breast height (DBH) gain (%) in South Africaa Conservation status: LR low risk, V vulnerable, E endangered, CR critically endangered, using standards of the International Union for Conservation ofNature and Natural Resources (IUCN) (Farjon and Page 1999)b Precipitation estimates generated from the WorldClim Global Climate Database using the Extract Climate Data by Points feature of DIVA-GIS(Hijmans et al. 2005, 2012)
Tree Genetics & Genomes (2015) 11: 57 Page 5 of 18 57

standardization was done as follows: The individual-tree phe-notypic coefficient of variation was calculated for each repli-cate for each growth trait, and a mean coefficient of variation(CVy) was calculated for each species-country-trait combina-tion. Phenotypic observations were then standardized in eachreplicate to a mean=100 and standard deviation=100 CVy
using PROC STANDARD in SAS®. Effectively, this is equiv-alent to dividing all observations by the phenotypic standarddeviation, as recommended by White et al. (2007) (pp 399–400), followed by multiplying by a constant (100 CVy) andadding a constant (100 %). The advantage of this standardiza-tion is that the population mean for the growth trait can beinterpreted as 100 %, and the associated variances and stan-dard deviations are the same size relative to the mean as in theraw data, thus all variance components and predicted breedingvalues can be directly interpreted in terms of percent gain(above or below 100 %) without any further need for back-transformation or rescaling.
Variance components and genetic parameters, by country
All variance component analyses were conducted usingASREML version 3.0 (Gilmour et al. 2006). Several variancecomponent analyses were run.
First, an examination of the age–age genetic correlations inVenezuela was done. There were 28 tests measured at age3 years in Venezuela. Among the 22 tests measured at age2 years, 16 tests were also measured at age 3. Among the 13tests measured at age 5, nine were also measured at age 3. Someof the age-2 and age-5 trials were also measured at age 3, soage–age correlations could be estimated. In the other countries,there were very few, if any tests measured at more than one age.For Venezuela, the age–age correlations (among ages 2, 3, and5 years) were examined using a multitrait analysis in ASREML. This program is well-suited for multitrait analyses, and itallows the user to specify the structure or form of the variance–covariance (or correlation) matrix for each random effect in thelinear model. Next, based on age–age correlation estimates near+1 (results discussed below), it was deemed reasonable to ag-gregate standardized growth trait data across the different ages,i.e., when data were not available for age 3, data from age 2 or
age 5 years were used as though they were age-3 data. For eachcountry, multisite, multitrait analyses for the three growth traits(height, DBH, volume) were conducted.
The linear model for all of the analyses was as follows:
yijklm ¼ μþ Ei þ B Eð Þi j þ Pk þ PEik þ F Pð Þklþ F Pð ÞEikl þ eijklm
where yijklm=phenotypic observation for the ijklmth tree,μ=overall mean,Ei=fixed effect of the ith test,B(E)ij=fixed effect of the jth block nested in the ith test,Pk=random effect of the kth provenance, E[Pk]=0,
Var[Pk]=σ2prov,
PEik=random interaction of the kth provenance and the ithtest, E[PEik]=0, Var[PEik]=σ
2pe,
F(P)kl=random effect across sites of the lth family in thekth provenance, E[F(P)kl]=0, Var[F(P)kl]=σ
2f,
F(P)Eikl= random interaction of the lth family inthe kth provenance and the ith test, E[F(P)Eikl]=0,Var[F(P)Eikl]=σ
2fe
eijklm=random error term associated with the ijklmth tree,E[eijklm]=0, Var[eijklm]=σ
2e.
Phenotypic variance within-provenance (σ2phen) wasestimated as
bσ2phen ¼ bσ2
f þ bσ2f e þ bσ2
e
Narrow-sense heritability within provenance (h2) wasestimated as
bh2 ¼ bσ2a=bσ2
phen
where bσ2a is the estimated additive variance, calculated as
bσ2a =3bσ2
f . The covariance among open-pollinated families
would typically be higher than one fourth of additive ge-netic variance; this could result from inbreeding and/orfrom a small number of effective male pollinators leadingto the presence of some percentage of full-sibs (and pos-sibly selfs) within the open-pollinated family (Squillace1974). Thus, an estimated family variance was multiplied
Table 2 Summary statistics for latitude, elevation, and precipitation for provenance/progeny tests of E. urophylla established in various countries.
Country Tests Latitude Elevation (m) Precipitation (mm)
Median Min Max Median Min Max Median Min Max
Brazil 6 21° 39′ S 0° 38′ S 22° 15′ S 690 50 750 1250 1200 2000
Colombia 29 3° 34′ N 2° 29′ N 4° 49′ N 1571 947 2034 2078 981 2761
Mexico 14 17° 47′ N 17° 40′ N 17° 50′ N 40 25 50 2328 2172 2560
South Africa 39 28° 33′ S 24° 57′ S 28° 38′ S 160 60 978 1084 954 1538
Venezuela 37 8° 25′ N 7° 48′ N 9° 40′ N 150 75 245 1369 900 1639
57 Page 6 of 18 Tree Genetics & Genomes (2015) 11: 57

by a coefficient of 3 instead of 4 to estimate additivevariance and heritability. This has been found to give bet-ter agreement between parameter estimates from open-pollinated and control-pollinated data sets for the samegenetic material (Dieters et al. 1995).
The amount of provenance variation was estimated as
bP ¼ bσ2prov=bσ2
phen
This allows a direct comparison of estimates of provenance
variance (bP2) and additive genetic variance (bσ2
A ). Standard
errors of bP2and ĥ2 were estimated using the standard errors
of bσ2prov and bσ2
f , respectively, as calculated by ASREML, and
treating bσ2phen as a constant according to Dickerson’s approx-
imation (Dickerson 1969).Type B genetic and provenance correlations (rBg and rBprov,
respectively) were estimated as
rBg ¼ bσ2f = bσ2
f þ bσ2f eÞ
�
rBprov ¼ bσ2prov = bσ2
prov þ bσ2peÞ
�
Type B correlations estimated as above measure the geneticor provenance correlation between the same trait expressed ontwo different sites (Burdon 1977). Assuming homogeneousvariances, the type B correlation will measure the type ofG×E interaction which is due to rank changes across environ-ments. It is this type of interaction that is of most interest totree breeders selecting provenances or families which will
perform well across the range of sites. Type B correlationsover multiple sites range between zero and one; rBg ≈ 1 indi-cates a near-perfect correlation between performance in differ-ent environments, or in other words, an absence of genotype(or provenance)×environment interaction. Standard errors of
rBgwere estimated using the standard errors of bσ2f and bσ2
f e and
Cov(bσ2f ; bσ2
f e) from ASREML and a first-order approximation
of a Taylor-series expansion (Lee and Forthofer 2006) andstandard errors of rBprov estimated in a similar manner. It isimportant to note that, using this approximation, the standarderror estimates will approach zero as the type B correlationestimate approaches a theoretical bound (i.e., zero or one).
The additive genetic coefficient of variation (GCV) wasestimated as
dGCV ¼ 100* bσa= x
where x is the trait mean. The GCV expresses the additivegenetic standard deviation in percentage and gives a breederan estimate of how much genetic improvement could be madein a trait.
Finally, ASREML was used to directly estimate geneticcorrelations among traits (height–DBH, height–volume,DBH–volume) and age–age genetic correlations for volume(VOL2–VOL3, VOL2–VOL5, and VOL3–VOL5) at theprovenance (rprov) and within-provenance (rg) levels. For eachrandom effect, ASREML can calculate the variance compo-nent for each trait and correlations among the traits, along withassociated standard errors (Gilmour et al. 2006).
Fig. 2 General locations of 125 provenance / progeny tests ofE. urophylla in the Camcore trial series. Test locations in Brazil (6 tests),Colombia (29 tests), Mexico (14 tests), and Venezuela (37 tests) (left).
Test locations in South Africa (39 tests) (right). Each circle may indicateseveral tests within 50 km of each other
Tree Genetics & Genomes (2015) 11: 57 Page 7 of 18 57

Across-country correlations and provenance BLUPs
When the individual-country analyses were completed, anacross-country analysis was done using individual-tree stan-dardized age-3 volume (VOL3) as the growth trait for Brazil,Colombia, Mexico, and Venezuela, and standardized age-3DBH (DBH3) as the growth trait for South Africa. ASREMLwas used to conduct the multitrait analyses, with the growthtrait in each country being treated as a distinct trait. Fixed andrandom effects in the models were the same as defined above.Country–country genetic correlations at the provenance (rprov)and within-provenance (rg) levels (and standard errors) wereestimated directly from the ASREML output. These analyseswere also used to produce best linear unbiased predictions(BLUPs) of provenance effects (Gprov) for VOL3 for eachcountry. To examine if there were any impacts of differentialsurvival, plot–volume sums were also analyzed, and BLUPs ofprovenance effects for this trait were also calculated.
Results
Growth results across countries
Mean survival, height, DBH, and volume/tree for E. urophyllain each country are presented in Table 3. Mean survival at age3 years ranged from 68.6% inMexico to 90.4 % in Colombia.Growth rates were quite good in all countries. Even inVenezuela, which had the slowest growth, average heightgrowth exceeded 3 m per year, with mean height of 9.8 mand mean DBH of 9.8 cm. In the other four countries, meanheights were generally around 12 m and mean DBH from 11to 12 cm (Table 3).
Age–age correlations, Venezuela
Estimates of age–age provenance and within-provenance ge-netic correlations and other genetic parameters for volumegrowth in Venezuela are presented in Table 4. Most important-ly, the age–age genetic correlations at the provenance andwithin-provenance levels across ages 2, 3, and 5 years are
uniformly high, with all estimates above 0.94. All correlationswith age-3 volume are 0.99 or above (with some estimatesbounded at 1.00 by the ASREML program). The heritabilityestimates at ages 2 and 5were slightly lower than at age 3 years(ĥ2=0.05 for ages 2 and 5 years vs ĥ2=0.09 for age 3).Similarly, ages 2 and 5 had slightly lower estimated type Bgenetic correlations than at age 3 (rBg=0.30 at age 2 and rBg=0.35 at age 5 vs rBg=0.45 at age 3). The measurements do notoverlap completely, for example, of the 22 tests with age-2data, and the 28 tests with age-3 data, only 16 tests had bothage-2 and age-3 data. Similarly, only nine tests had both age-3and age-5 data. Since the different ages had similar geneticparameter estimates and estimated genetic correlations near +1, it was deemed acceptable to aggregate age-3 standardizeddata with age-2 and age-5 standardized data; this resulted in atotal of 39 tests with growth data in Venezuela.
Genetic parameters and growth trait correlations,by country
Provenance variation for growth traits was substantial in all
five of the countries, with bP2=0.04 to 0.08 in Brazil,
Colombia, South Africa, and Venezuela. In Mexico, prove-
nance variance was very important, with bP2=0.16, 0.14,
and 0.20 for height, DBH, and volume, respectively.Provenance×environment interaction was also lower inMexico than in the other four countries. For example, forMexico, rBprov for volume was 0.94, indicating almost zeroprovenance×environment interaction variance, while in theother four countries, rBprov was moderate, ranging from 0.68to 0.83 (Table 5).
In every case, heritability estimates for the three growthtraits in a given country were all very similar, differing byno more than 0.02. In general, ĥ2 for growth traits was around0.15, ranging from 0.14 to 0.18 for Brazil, Colombia, Mexico,and South Africa. In Venezuela, estimated heritabilities forgrowth traits were substantially lower, with ĥ2=0.10, 0.08,and 0.09 for height, DBH, and volume, respectively. Theselower heritabilities might be expected, given the slowergrowth rates observed in the Venezuelan trials, mentioned
Table 3 Growth and survival in progeny tests of E. urophylla averaged across all available progeny tests in various countries
Country Age 2 Age 3 Age 5
Tests Surv(%)
Height(m)
DBH(cm)
Volume(m3)
Tests Surv(%)
Height(m)
DBH(cm)
Volume(m3)
Tests Surv(%)
Height(m)
DBH(cm)
Volume(m3)
Brazil . . . . . 2 76.9 14.7 11.3 0.0640 4 73.2 15.0 10.3 0.0617
Colombia 4 95.3 11.7 10.3 0.0419 29 90.4 11.9 11.3 0.0585 . . . . .
Mexico . . . . . 14 68.6 12.1 12.0 0.0617 . . . . .
South Africa 5 92.8 10.2 9.2 0.0312097993 35 90.0 12.4 12.4 0.0693 . . . . .
Venezuela 22 82.7 6.9 7.1 0.0147861759 28 80.0 9.8 9.8 0.0430 13 69.3 16.5 15.1 0.1442
57 Page 8 of 18 Tree Genetics & Genomes (2015) 11: 57

above. Also contributing to a lower heritability in Venezuela isa high level of genotype×environment interaction; rBg forage-3 volume in Venezuela was 0.52. Colombia had moderatelevels of genotype×environment interaction, with rBg=0.65for volume, while the other countries had fairly low levels(or near zero) genotype×environment interaction (rBg=0.76,0.79, and 1.00 for Mexico, South Africa, and Brazil, respec-tively) (Table 5).
Genetic correlations among the three different growth traits(height, DBH, and volume) for each country are also present-ed in Table 5. Regardless of trait pair or country, these corre-lation estimates are quite high. Estimates of height–volumegenetic correlations (within provenance) range from rg=0.89to 0.95, and DBH–volume correlations range from rg=0.97 to1.00. Similarly, height–volume provenance correlation esti-mates range from rprov=0.88 to 0.95, and DBH–volume prov-enance correlation estimates range from rprov=0.96 to 1.00. Inparticular, it was of interest to examine the relationship be-tween the genetic parameters for DBH and volume in South
Africa, since DBH was the only trait measured in many of theSouth African tests. Comparing the estimated parameters forDBH and volume, provenance variation (bP2
=0.04 vs 0.06),heritability (ĥ2=0.17 vs 0.18), and type B correlations(rBprov=0.72 vs 0.73 and rBg=0.82 vs 0.79) were all verysimilar (Table 5). The only parameter estimates that were sub-stantially different were the variance components themselves,e.g., the phenotypic variance (ĥphen2 ) or the genetic coefficient
of variation ( dGCV ) (Table 5). But in terms of ranking familiesand provenance in a BLUP analysis, one would produce near-ly identical rankings whether analyzing DBH or volume. Itwas therefore deemed acceptable in a multiple country analy-sis to analyze volume data for Brazil, Colombia, Mexico, andVenezuela, together with DBH data from South Africa.
Growth trait correlations between countries
Amultiple-country analysis for growth traits was done both toexamine between-country genetic correlation estimates and to
Table 4 Age–age genetic correlation estimates within provenance (rg, above diagonal) and at the provenance level (rprov below diagonal), and othergenetic parameter estimates for volume growth for E. urophylla at ages 2, 3, and 5 years in Venezuela
Country Trait Age-age gene�c correla�ons
With vol2 With vol3 With vol5
Venezuela vol2 1.00 na 0.94 ± 0.07 0.04 ± 0.01 0.61 ± 0.11 0.05 ± 0.01 0.35 ± 0.07 15.9 4677.7
Venezuela vol3 1.00 ± 0.02 1.00 na 0.08 ± 0.00 0.79 ± 0.07 0.09 ± 0.01 0.45 ± 0.06 20.8 4893.8
Venezuela vol5 0.97 ± 0.03 0.99 ± 0.01 0.08 ± 0.00 0.84 ± 0.08 0.05 ± 0.01 0.30 ± 0.08 16.0 4982.8
±Standard errors listed in italics
Table 5 Genetic correlation estimates within provenance (rg, above diagonal) and at the provenance level (rprov below diagonal), and other geneticparameter estimates for growth traits for E. urophylla at age 3 years in five countries
Country Trait Gene�c Correla�ons of growth traits
With ht3 With dbh3 With vol3
Brazil ht3 0.87 ± 0.02 0.89 ± 0.02 0.05 ± 0.01 0.82 ± 0.21 0.17 ± 0.02 1.00 ± 0.00 9.3 506.5
Brazil dbh3 0.85 ± 0.08 0.97 ± 0.01 0.04 ± 0.01 0.81 ± 0.20 0.15 ± 0.02 1.00 ± 0.00 11.8 912.6
Brazil vol3 0.88 ± 0.06 1.00 ± 0.01 0.06 ± 0.01 0.83 ± 0.17 0.15 ± 0.02 1.00 ± 0.00 26.3 4586.0
Colombia ht3 0.78 ± 0.03 0.85 ± 0.02 0.08 ± 0.01 0.70 ± 0.08 0.14 ± 0.01 0.62 ± 0.06 8.3 482.8
Colombia dbh3 0.83 ± 0.06 0.97 ± 0.00 0.05 ± 0.00 0.73 ± 0.08 0.16 ± 0.01 0.70 ± 0.06 11.0 744.3
Colombia vol3 0.91 ± 0.03 0.98 ± 0.01 0.06 ± 0.01 0.68 ± 0.08 0.16 ± 0.01 0.65 ± 0.06 24.7 3948.3
Mexico ht3 0.89 ± 0.02 0.92 ± 0.02 0.16 ± 0.01 0.89 ± 0.05 0.17 ± 0.02 0.77 ± 0.09 8.8 471.5
Mexico dbh3 0.97 ± 0.02 0.98 ± 0.00 0.14 ± 0.00 0.91 ± 0.05 0.16 ± 0.02 0.74 ± 0.09 10.4 675.0
Mexico vol3 0.95 ± 0.02 1.00 ± 0.00 0.20 ± 0.00 0.94 ± 0.04 0.17 ± 0.02 0.76 ± 0.09 25.0 3699.6
South Africa ht3 0.95 ± 0.01 0.95 ± 0.01 0.06 ± 0.01 0.63 ± 0.09 0.16 ± 0.01 0.77 ± 0.04 8.1 417.6
South Africa dbh3 0.78 ± 0.08 1.00 na 0.04 ± 0.00 0.72 ± 0.08 0.17 ± 0.01 0.82 ± 0.03 11.5 763.8
South Africa vol3 0.85 ± 0.06 0.96 ± 0.02 0.06 ± 0.00 0.73 ± 0.08 0.18 ± 0.01 0.79 ± 0.03 25.0 3472.7
Venezuela ht3 0.85 ± 0.02 0.94 ± 0.01 0.08 ± 0.01 0.71 ± 0.07 0.10 ± 0.01 0.51 ± 0.06 8.9 788.1
Venezuela dbh3 0.90 ± 0.04 0.98 ± 0.01 0.06 ± 0.00 0.69 ± 0.08 0.08 ± 0.01 0.58 ± 0.06 8.0 749.5
Venezuela vol3 0.94 ± 0.02 0.98 ± 0.01 0.08 ± 0.00 0.73 ± 0.07 0.09 ± 0.01 0.52 ± 0.06 20.9 4899.3
±Standard errors listed in italics
Tree Genetics & Genomes (2015) 11: 57 Page 9 of 18 57

predict provenance effects. For this analysis, the traits of in-terest were volume for Brazil, Colombia, Mexico, andVenezuela, and DBH for South Africa. Across all country-pairs, the average of both types of genetic correlation esti-mates was 0.72. The between-country provenance correlationestimates range from rprov=0.54 forMexico–Colombia to rprov=1.00 for Mexico–Venezuela (Table 6). The between-countrywithin-provenance genetic correlation estimates range fromrg=0.34 for Brazil–South Africa to rg=0.92 for Colombia–Venezuela. The country pair that has the highest correlationsof provenance and family performance is Mexico–Venezuela,with rprov=1.00 and rg=0.90. The country pair with the lowestcorrelations is probably South Africa–Brazil, with rprov=0.63and rg=0.34.
Provenance BLUPs
Best linear unbiased predictions (BLUPs) were made forGprov
(provenance effect for volume, expressed in units of % gainabove the unimproved population mean) for each country.Provenance rankings and BLUPs from the analysis using stan-dardized individual-tree volume and from the analysis usingplot volume were compared. Rankings and BLUPs were verysimilar, with correlations between provenance BLUPs fromthe two approaches ranging from 0.91 to 0.98 across the fivecountries. All results presented here are from the analysisusing standardized individual-tree volume as the unit ofobservation.
Predictions of Gprov were made for Brazil, Colombia,Mexico, South Africa, and Venezuela and are listed inTable 1. It is important to recall that for Brazil, Colombia,Mexico, and Venezuela, the growth trait was VOL3 and, forSouth Africa, the growth trait was DBH3. Thus, the BLUPsfor South Africa predict the percent gain in DBH, while the
BLUPs for all other countries predict the percent gain involume.
There was very large provenance variation for growth in allcountries. The largest variation was in Mexico, where the best
provenance had bGprov =+32.7 % (#19 Kilawair, Flores) and the
worst provenance had bGprov =−50.0% (#23 A’esrael, Timor), a
range of 82.7 %. Less provenance variation was observed in
Colombia, where the best provenance had bGprov =+25.6 %
(#48 Palueh, Flores) and the worst provenance had bGprov =
−26.2 % (#55 Watololong, Adonara), a range of 51.8 %. As
would be expected, the range of variation in bGprov corresponds
to the estimated provenance variation (bP2) for volume in
Table 5, where Mexico had bP2=0.20 and Colombia
had bP2=0.06. But even in Colombia, there were very im-
portant differences among provenances for volume growth.Provenance differences for DBH3 in South Africa ranged
from bGprov =+7.5 % (#48 Palueh, Flores) to −7.4 % (#7
Naususu, Timor). It was interesting that Palueh was the bestprovenance for growth in both Colombia and South Africa. To
estimate bGprov for VOL3 in South Africa, one could make a
rough conversion from bGprov for DBH3 as follows: bGprov VOL3ð Þ =
100×[1−(1+bGprov DBH 3ð Þ /100)
3]. This approximation would as-
sume that the percent gain in height is equivalent to the gain inDBH, a fairly reasonable assumption since age–age correla-tions are near unity, the heritabilities and type B genetic cor-relations for the two traits are nearly identical, and the estimat-ed GCV for height is only slightly lower than for DBH(Table 5). Using this approximation, the best provenance inSouth Africa, Palueh has an approximate provenance effect
for volume of bGprov VOL3ð Þ =+24.2 %, quite comparable to the
value of +25.6 % for the Palueh provenance in Colombia.
Table 6 Between-country genetic correlation estimates for 3-year volume growth of E. urophylla in five countries
In South Africa, DBH was measured in 39 tests, while height and volume were measured in only 22 tests. For estimates involving South Africa, thegenetic and provenance correlations are for DBH in South Africa and volume in the other country
Values above diagonal are within-provenance (rg) and values below diagonal are at the provenance level (rprov) (± standard errors listed in italics)
57 Page 10 of 18 Tree Genetics & Genomes (2015) 11: 57

General performance of provenances from the sevenislands
Across all sites, the performance of the 15 provenances fromTimor was generally slightly below to greatly below the aver-age of all provenances (Tables 1 and 7). Timor provenancesperformed somewhat better in Colombia and South Africathan in the other countries. Provenances from Pantar showedvariable performance, generally poor in Brazil, Colombia, andSouth Africa, but above average in Mexico and Venezuela.Provenances from Lembata were generally good, holding sec-ond place for growth among the seven islands in all countries.Provenances from Flores were very good in Mexico andVenezuela, and provenances from Wetar were generally verygood in Brazil, Colombia, and South Africa (Table 7). Morespecifically, the four collections in the eastern Ilwaki region ofsouthern Wetar (#49, #50, #51 # 52), several populations onMt. Egon and low-elevation sources close to the coast onFlores (#17, #19, #24, #26, #45, #48)), seven of the prove-nances on Lembata (exception # 33), and the three prove-nances in central and western Alor (#13, #15, #16) were gen-erally better than average at most of the locations (especiallyin the tropical lowlands of Mexico and Venezuela). The sevencollection sites on Mt. Boleng, Adonara (discussed below),were generally average to poor performers, except for onepopulation on the southeastern slope of the volcano (#3Muda) which was very good, and one other (#57 Lamahela)which was very good in Mexico and Venezuela (see discus-sion below).
Impact of conservation status
There is a strong impact of elevation on conservation status,with the lower-elevation provenances being at higher risk(Dvorak et al. 2008) (Table 8). Mean elevation for Low Riskprovenances was 1180 m, and for Critically Endangered
provenances was 548 m, with Vulnerable and Endangeredprovenances found at intermediate elevations. This makessense, as the lower-elevation provenances are generally closerto towns and roads and are much easier for access for timberharvest or agricultural expansion.
In Brazil, Mexico, and Venezuela, there is a very clearpattern of lower-risk (and higher-elevation) provenances tobe slower growing than higher-risk provenances. For exam-ple, for Mexico, moving from a conservation status of LowRisk to Vulnerable to Endangered to Critically Endangered,the mean predicted provenance effects go from –12.9 to +3.3to +9.8 to +17.3 %. The same pattern is observed for Braziland Venezuela and is similar, although less pronounced, inColombia and South Africa.
Discussion
Effect of elevation and island
There appears to be tendency for low-elevation provenancesto show faster growth than high-elevation provenances, andthis has been reported previously (e.g., Ngulube 1989; Vercoeand Clarke 1994; Maid and Bhumibhamon 2009). In the cur-rent study, there is a clear relationship between elevation of theoriginal provenance and volume growth, with lower-elevationprovenances having larger provenance effects for volume. For
Mexico, Brazil, and Venezuela, the correlation between bGprov
and elevation is moderate to strong, with r=−0.74 (p<0.0001)for both Mexico and Venezuela, and r=−0.56 (p<0.0001) forBrazil. For Colombia and South Africa, this correlation isstatistically significant, but it is not strong (r=−0.27, p<0.04for Colombia, and r=−0.21, p<0.09 for South Africa).However, the correlation between elevation and growth isconfounded somewhat by island. Timor has much higher ele-vations than all of the other islands (except eastern Alor), and
Table 7 Mean predicted provenance effects of the seven islands for 3-year volume growth of E. urophylla in five countries
Island Number Elevation Ann. precip. bG prov
BRZ COL MEX SAF VEN
Adonara 9 749 1390 −1.8 −5.7 1.5 −2.0 1.3
Alor 6 673 1459 5.7 4.8 1.0 1.0 0.9
Flores 10 606 1476 7.0 2.8 15.8 1.6 14.2
Lembata 8 768 1397 10.3 5.5 10.3 2.4 9.9
Pantar 5 590 1330 −6.0 −14.1 7.4 −3.3 7.0
Timor 16 1483 1580 −16.1 −4.9 −23.5 −2.3 −21.6Wetar 8 576 1130 13.0 11.5 6.9 3.2 6.0
BRZ, COL,MEX, and VEN are the predicted provenance effect (bG prov ) for volume gain (%) in Brazil, Colombia,Mexico, and Venezuela, respectively.
SAF is the predicted provenance effect (bG prov ) for diameter at breast height (DBH) gain (%) in South Africa
Tree Genetics & Genomes (2015) 11: 57 Page 11 of 18 57

when Timor provenances are removed from the data set, the
correlations between bGprov and elevation for Mexico and
Venezuela drop to r=−0.26 and −0.27, with nonsignificantp values (p<0.08 and 0.07, respectively). In general, one canprobably say that the higher-elevation provenances fromTimor do not grow as fast as lower-elevation provenancesfrom other islands, most likely because they originate in areaswith shorter growing seasons.
Provenance variation within island
There was substantial provenance variation within island. Forexample, consider the provenances from Adonara Island,
which had bGprov for Mexico ranging from +20.6 % (#58
Kawela) to −21.1 % (#1 Doken), a range of 41.7 %. From
Alor Island, bGprov for Mexico went from +14.7 % (#13
Mainang) to −6.8 % (#28 Molpui), a range of 21.5 %. Acrossall seven islands, themean range from best to worst provenance
for bGprov Mexico was 30.0 %. Patterns for bGprov in Brazil,
Colombia, Venezuela, and South Africa were very similar.This level of provenance variation within an island is large,
but perhaps more surprising is that large differences werefound even among near-neighbor provenances. For example,on the island of Lembata, we had collections from four prov-enances on the Lewotolo volcano: #5 Jontona/Ille Ape1, #33Jontona/Ille Ape2, #34 Bunga Muda, and #35 Lowokukung.All four of these provenances are within 3–5 km distance fromone another and occupy a narrow elevational range from about600 to 860 m (mid-elevation, see Table 1). One might expectthere to be relatively little provenance variation for growthamong these four provenances, but in fact, rather large differ-ences were observed. Bunga Muda and Jontona/Ille Ape2
were very good growers (e.g., +20.8 and +11.6 % for bGprov
Mexico, respectively), and Jontona/Ille Ape1 andLowokukung were substantially worse (e.g., +6.9 and +
1.0 % for bGprov Mexico, respectively). The range in bGprov
Mexico for these four near-neighbor provenances was 19.8 %.
Another example of large provenance effects observed innear-neighbor provenances was seen on Adonara Island. Asmentioned earlier, a group of seven provenances were collect-ed on Mt. Boleng, on the eastern side of the island, all within10 km of one another, and all from 687- to 866-m elevation(mid-elevation, see Table 1). To illustrate the provenance var-
iation, consider the bGprov Mexico values for the seven prove-
nances circling the volcano, beginning with provenance #1,Dokeng, and moving in a northwesterly direction (Fig. 3): #1Doken=−21.8 %, #55 Watolong=−11.5 %, #54 Dua Muda=−4.3 %, #53 Lamolota Barat=+0.8 %, #57 Lamahela=+18.6 %, #3 Muda=+17.7 %, and # 56 Gonehama=+0.4 %.
This is a range of 39.7 % in bGprov Mexico, in the distance of
just few kilometers. The exact numbers and patterns for bGprov
in the other countries vary, but in all cases, the range amongthese seven provenances is large, considering how near they
are to one another. For example, the range for bGprov VOL3ð Þ for
Colombia is 42.8 %, for Brazil is 59.6 %, and for Venezuela is
27.7 %. The range for bGprov DBH3ð Þ for South Africa is −6.7 to
0.4 %, and converting those to approximate values forbGprov VOL3ð Þ would be −18.8 and +1.2 %, a range of 20.0 %.
Numerous studies have reported on the good performanceof the Egon and/or Lewotobi sources from Flores Island(Vercoe and Clarke 1994; Wei and Borralho 1998; Maid andBhumibhamon 2009; Kien et al. 2009). Even though a num-ber of collectors have denoted Egon and Lewotobi with prov-enance designations, they are both massive volcanoes withpotentially many different collection sites on their slopes,some of which probably have different geologic and geneticlife histories. Therefore, comparisons of provenances resultsof collections made on the same volcano by various re-searchers over years need to be viewed cautiously unlessGPS coordinates are provided.
In the current study, there were six provenances col-lected on Mt. Egon,: (#17 Ille Ngele, #18 Lere-Bukrenget,#19 Kilawair, #24 Ille Meak, #46 Kolibuluk, and #47Natakoli). The most accessible of all of these provenances
Table 8 Mean predicted provenance effects for 3-year volume growth of E. urophylla for four different conservation status groups
Conservation status Number Elevation Ann. precip. bG prov
BRZ COL MEX SAF VEN
Low risk 23 1180 1424 −6.0 0.8 −12.9 −0.4 −12.0Vulnerable 15 804 1406 −0.2 −2.1 3.3 −0.1 3.2
Endangered 20 611 1420 4.2 −1.7 9.8 −0.1 8.9
Critically endangered 3 548 1455 19.4 15.1 17.3 3.4 15.4
BRZ, COL,MEX, and VEN are the predicted provenance effect (bG prov ) for volume gain (%) in Brazil, Colombia,Mexico, and Venezuela, respectively.
SAF is the predicted provenance effect (bG prov ) for diameter at breast height (DBH) gain (%) in South Africa. Conservation status using standards of theInternational Union for Conservation of Nature and Natural Resources (IUCN) (Farjon and Page 19)
57 Page 12 of 18 Tree Genetics & Genomes (2015) 11: 57

by road is Ille Ngele, which probably served as the sourceof seed labeled as BEgon^ by many collectors in the past.The reputation of Egon being a good source of seed prob-ably comes from this location, and in the Camcore trials,this source is also very productive (unfortunately, the nat-ural stands at this site are being destroyed by annual firesand agricultural encroachment). It is important to note,however, that there were some collection sites on Egonthat were poor in performance across most sites (# 18Lere-Baukrenget, #47 Natokoli) and others that were gen-erally good for volume growth in Mexico and Venezuelabut were just slightly above average in Brazil, Colombia,and Venezuela (Table 1).
In the current study, only one provenance was collectednear, but not on, the slopes of Mt. Lewotobi on FloresIsland, #20 Hokeng which possibly is the same site spelledBHoken^ by Vercoe and Clarke (1994). It may well be that, ingeneral, BLewotobi^ is a good source, as indicated by numer-ous authors. However, we would expect that complete sam-pling of Lewotobi would produce some excellent provenancesand some others that are very average or even poor, as is thecase on as on Lewotolo, Boleng, and Egon. In our study,Hokeng was above average for volume growth in Mexicoand Venezuela, but average or below average in Brazil,Colombia, and South Africa (Table 1). Progeny from this
provenance exhibited the highest percentage of white-barktrees in trials in Zululand, South Africa (51 % of the trees)suggesting high levels of introgression with E. alba in naturalstands (Dvorak et al. 2008). The low-elevation sources ofKoangao and Palueh on Flores Island, which as far as weknow had never been sampled in any collections before,showed excellent promise across all sites but probably donot exist anymore because of local human pressure. Theirfuture rests in our ability to conserve these populations ex situ(discussed later).
Interesting trends in provenance variation for volumewere also noted for provenances from Alor and Wetar. OnAlor, six provenances were sampled, three from the easternpart of the island, #14 Apui, #27 Manabai, and #28 Molpui,and three from the central to western side of the island #13Mainang, #15 Pintu Mas, and #16 Watakiki. The distancebetween the two groups is approximately 8 to 15 km. Theprovenances from the eastern side performed poorly acrossall locations where they were planted. However, prove-nances from the central to western side of the island per-formed above to greatly above average whereverestablished except in South Africa. We can find no reasonin our study for this geographical pattern based on year ofcollection, forest type (old-growth or secondary), or eleva-tion of the collection site. Vercoe and Clarke (1994), in their
Dokeng-21.8, -16.5
Gonehama+0.4, -15.1
Muda+17.7, + 1.2
Lamahela+18.6, -6.2
Dua Muda-4.3, -6.1
Watolong-11.5, -18.8
Lamalota Barat+0.8, +2.6
Kawela+20.6, +9.8
Lamalota-7.4, -2.1
ProvenanceMEX, SAF
Fig. 3 Provenance effects for volume growth at age 3 years forE. urophylla provenances from Adonara Island, Indonesia. Valuesshown are the predicted provenance effects (G ̂
prov ) for volume gain(%) in Mexico and South Africa, MEX and SAF, in normal font and
italics, respectively. Values for South Africa are approximate, convertedfrom the predicted provenance effect for diameter at breast height (DBH)gain (%)
Tree Genetics & Genomes (2015) 11: 57 Page 13 of 18 57
summary of international provenance trial results from earlycollections, also note the relatively different performance ofAlor provenances dependent on their geographic locationon the island. They found that on one site in Brazil, thetwo groups from Alor grew as described above, but eventu-ally, the western and central provenances fell in rank overtime, while the rank of the eastern provenance improved. Ona second site in Brazil and one in Colombia, the western andcentral provenances of E. urophylla maintained their excel-lent performance through ages 5 to 7 years (Vercoe andClarke 1994).
On Wetar, eight provenances were collected from thesouthern part of the island in 2002 and 2003. The 2002collection sampled four populations in the Ilwaki area:#49 Ketur, #50 Puaanan, #51 Remamea, and #52 Talianan.The 2003 collection was located 30 to 45 km west of Ilwakiwhere the 2002 collections occurred and included the prov-enances of #59 Alasannarua, #60 Elun Kripas, #61Nesunhuhun, and #62 Nakana Ulam. Results showed thatthe four provenances from the 2002 collection were muchsuperior to those collected further west on Wetar in 2003.The 2002 collections were geographically quite close toeach other and were approximately 160 to 200 m lower inelevation than those sources collected 30 km further west in2003. The 2002 and 2003 collections might thus representgenetically different groups. Another possibility is that thedifference is simply due to flowering differences in the yearof collection, discussed in more detail in the section below.
Possible causes of provenance effects
The presence of large differences in provenance effectsamong near-neighbor provenances is rather surprising.Eucalypts are known to exhibit inbreeding depression(e.g., Griffin and Cotterill 1988; Hardner and Potts 1995),and this factor might account for some of the observed dif-ferences. If only a small number of founders originally col-onized an area, possibly after a volcanic eruption and sub-sequent lava flow and fire on a specific side of the cone, theresulting population of trees may be relatively inbred; thiswould result in some provenances showing substantialgrowth loss due to inbreeding, while neighboring stands inthe vicinity colonized by a larger number of founders mightproduce much more vigorous progeny. Another possibleexplanation of some of the provenance differences couldbe differences in flowering percentage due to different yearsof collection, or different local climatic conditions amongprovenances. Differences in flowering percentage havebeen shown to have a large impact on the genetic qualityof seed orchard crops in E. nitens. Specifically, seedlotsfrom the same seed orchard, but collected in different years,were compared, and a 15 to 17 % volume advantage wasobserved for seedlots collected in years with prolific
flowering (40 to 47 % flowering) versus years with limitedflowering (15 % flowering) (Swain et al. 2013). For thecurrent study, it seems possible that low levels of floweringin some provenances in the specific collection year wouldlead to less outcrossing, more inbreeding, and some growthloss.
However, it is also possible that the observed differences inprovenance effects reflect true differences in the genetic qual-ity of the provenances, unrelated to differences in inbreedingor life history. These could also be related to founder effects,that is to say, by random chance, that the genetic quality of theoriginal genotypes to colonize an area was much better ormuch worse than the species mean. If so, this underscoresthe value of extensive provenance collections throughout therange of a species in order to ensure that the very best prove-nances are being captured.
Growth and yield
Provenance/progeny tests are designed to compare and rankgenetic entries such as families and in order to produce preciserankings are generally planted in row plots, as were the vastmajority of trials in this study. These data are also not full-rotation age but are somewhere on the order of one third ofrotation age. As such, the data were not intended to be used toproject growth and yield as in a formal mensurational or sil-vicultural study, but nevertheless, the data may have somevalue to at least obtain an estimate of MAI through 3 years.Assuming a spacing of 3×3 m (1111 stems per hectare) in allcountries except Venezuela (where spacing was 3.0×3.5 m=952 stems per ha) and multiplying by individual-tree volumeand species survival (Table 6), unimproved E. urophylla wasestimated to be growing about 19.6 m3/year in Colombia,15.7 m3/year in Mexico, 23.1 m3/year in South Africa, and10.9 m3/year in Venezuela. Our observations in the field trialssuggest that good growth of E. urophylla is dependent onadequate soil depth, excellent water drainage, and establish-ment in frost-free environments. The growth rates in the high-lands of southern Colombia might have been somewhat neg-atively influenced by the lack of a well-defined dry season andassociated excessive soil moisture, and furthermore, at lati-tudes 2–4°N, the test sites were probably too high in elevation(>1500m) for the lowland sources from Indonesia. InMexico,growth was affected by the high water tables, and in somecases poor weed control, resulting in poor survival and poorMAI in coastal Veracruz/Tabasco States. Had survival beenmaintained at 90 % rather than 69 %, MAI for unimprovedE. urophylla on these fertile soils would have been closer to20.5 m3/ha/year at age 3 years. The limiting factor for growthin Venezuela is an extended dry season of 7–8 months; inaddition, many of Venezuelan tests were established on heavyclays, although site preparation on these sites included rippingto improve water penetration and site quality. One might
57 Page 14 of 18 Tree Genetics & Genomes (2015) 11: 57

expect the MAI to increase as the plantations continue to growand put on diameter through pulp rotation age of 7–8 years.For example, in Venezuela, a substantial number of tests weremeasured at age 5 years, providing a reasonable estimate ofgrowth potential. These data indicate an increase in MAI from10.9 m3/year at age 3 years to 19.0 m3/year at age 5 years.
Genetic parameters
In the current study, heritability estimates (narrow-sense with-in-provenance) were generally around 0.15 for height and
DBH (as well as volume), with dGCV for height and diameteraround 8 to 12 %. These correspond nicely with genetic pa-rameter estimates from Kien et al. (2009) from two prove-nance–progeny trials in Vietnam, who estimated heritabilitiesof 0.19 to 0.22 for age 3 height and DBH, respectively, anddGCV around 7 to 12 %. Wei and Borralho (1998) also reportnarrow-sense within-provenance heritabilities for 3-yearheight and diameter of 0.23 and 0.18, respectively.
In this study, the ratio of provenance variance relative to
phenotypic variance (bP2) ranged from 0.04 to 0.08 for the
three growth traits in Brazil, Colombia, South Africa, andVenezuela (Table 5). These values are similar to those ob-served in four species of subtropical pines; for example, mean
bP2for age 8 volume was 0.04 (Hodge and Dvorak 2012). In
the current study, provenance variance for E. urophylla
growth traits in Mexico was very high, bP2ranging from 0.14
to 0.20 (Table 5). However, even the lower levels of prove-nance variation observed in Brazil, Colombia, South Africa,and Venezuela are clearly of biological and economic impor-tance, with substantial gains possible from selection of thebest provenances. Selection of the top six provenances (outof 61 reported in this study) for each of the five countrieswould produce expected volume gains of 27.4 % in Brazil,22.2 % in Colombia, 25.9 % in Mexico, 20.5 % in SouthAfrica, and 23.1 % in Venezuela.
In the current study, there were limited data to estimateage–age correlations, with the only good estimates availablefor Venezuela, but their provenance and within-provenancegenetic correlations among age 2, 3, and 5-year volume werenear unity (0.94≤r≤1.00). These values are probably repre-sentative of the age–age correlations in other countries, de-spite the fact that these tests had lower growth rates than ob-served in other countries (Table 3). For example, in a studyexamining 319 tests of four pine species, age–age correlationsat the provenance and genetic level were very high and nearunity for age 3, 5, and 8-year volume for all species (Hodgeand Dvorak 2012). No important differences in age–age cor-relations were observed between the two very fast-growingspecies (P. tecunumanii and P. maximinoi) and the twoslower-growing species (P. patula and P. greggii).
Potential for genetic gain
For almost every species–country combination, there wasimportant provenance variation for volume growth.Generally, the best provenance was 10 to 20 % better thanthe species mean, and there was a 20 to 35 % range fromthe best to worst provenance (Table 1). In addition togains from provenance selection, breeders could make ge-netic gain from selection of good progeny from the betterfamilies within provenances. The genetic coefficient ofvariation (GCV) provides an estimate of the amount ofwithin-provenance additive genetic variance, expressingthe genetic standard deviation relative to the trait mean.
For E. urophylla in these five countries, dGCV for 3-yearvolume averaged 24.4 and ranged from 20.9 (Venezuela)to 26.3 (Brazil). In other words, if selection among andwith families resulted in an improvement of one geneticstandard deviation for volume, this would be approxi-mately 25 % volume gain above the provenance mean.Clearly, tree breeders have tremendous opportunity tomake genetic gain even if making selections among fam-ilies and progeny from the very best provenances.
In situ conservation status and Ex situ conservation efforts
All of the provenances on Timor and Wetar are classifiedas Low Risk, and there are no Low Risk provenances onany of the other islands (Pepe et al. 2004; Dvorak et al.2008). All but one of the provenances on Adonara areVulnerable, and all but one of the provenances on Floresare Endangered. All five provenances collected on Pantarare Endangered, while Lembata and Alor have a mix ofconservation status.
The three highest-risk provenances, with CriticallyEndangered status, are #58 Kawela (Adonara) found at 600-m elevation, #16 Watakika (Alor) between 350- and 600-melevation, and #48 Palueh (Flores) between 540- and 600-melevation (Table 1). Most probably, the conservation status of#45 Koangau (Flores), the lowest elevation source sampled onFlores Island (220 m), should now be changed fromEndangered to Critically Endangered because of the immi-nent threat from agriculture first reported more than a decadeago. Kawela is the only population sampled on Adonora thatis not on Mt. Boleng (see Fig. 3). It is about 50 ha in size andconsists of old-growth trees that are continually being harvest-ed by locals to plant rice and vegetables. This provenanceexhibits good productivity when planted in tropical climates.Watatika, Alor Island, is predominantly an old-growth forest,but encroachment into the stand increases every year. As men-tioned above, Palueh is an excellent growing provenance in allfive countries but was scheduled to be harvested by the localcommunity for agricultural expansion in 2003. Most likely the
Tree Genetics & Genomes (2015) 11: 57 Page 15 of 18 57

old trees no longer exist. Koangau, a unique coastal prove-nance, was an outstanding performer in Brazil, Mexico, andVenezuela, and a good performer in the other two countriesalso probably no longer exists on Flores. It is interesting tonote that the populations of Kawela, Watakika, and Paluehwere predominantly remnants of old-growth forests. It leadsone to ask the question if inbreeding levels in these large old-growth forests are lower than in younger natural stands withpresumably a different history of disturbance.
The seed collection efforts and the establishment of 125trials represent a tremendous financial investment by themembers of the Camcore program over the years. There isimportant variation for growth among provenances, bothacross and within islands, and genetic variation within prove-nances. Even thoughmolecular assessment of a subset of pop-ulations across all seven islands shows that Wetar and Timorare the most genetically diverse (Payn et al. 2007, 2008),patterns in growth and adaptability would indicate that sam-ples from entire range (all seven islands) should be included inan ex situ conservation program (Dvorak et al. 2008).
Camcore member organizations are making provenance,family and within-family selections in this trial series for usein their own breeding programs. Some organizations useE. urophylla primarily as a hybrid partner, often withE. grandis. In this case, pollen will be collected from selectedtrees and used to make hybrid crosses, and the selections willbe conserved in clone banks. Other organizations are alreadyusing E. urophylla as a commercial species or have concludedthat some of the better provenances, families, and clones fromthe Camcore trial series can be competitive with their currentcommercial species, such as E. grandis or E. grandis×E. urophylla hybrids. In this case, the E. urophylla selectionswill be propagated and tested in single-tree plot and block-plotclonal trials. Regardless of whether the interest in E. urophyllais as a hybrid partner or pure species, there is broad generalinterest in refining the population selected for growth andadaptability with further selection focused on important woodtraits, such as density, pulp yield or lignin composition, orsolid-wood characteristics such as minimal splitting. Finally,all members are conserving some of their E. urophylla geneticbase in breeding orchards and clone banks in order to ensurethe ability to make long-term genetic gain in the species. Asource of ongoing discussion is whether we can keepE. urophylla free of contamination from other eucalypt pollensources (if we choose to use open-pollinated breeding strate-gies) and whether this is necessary for the future. In addition tothe clone banks used to archive selections in the breedingprograms, the South African Camcore members have commit-ted to long-term maintenance of genetic material frommost of61 E. urophylla provenances in the Camcore collections inpermanent conservation parks. A conservation park is an areaof land established in a specific climatic zone and ranges insize from approximately 20 to 35 ha. Each provenance plot is
¼ha in size and contains at least 50 genotypes from a mini-mum of 10 open-pollinated families established in at least twolocations. The objective is to maintain genetic diversity of thisimportant species, ensuring ability to adapt to new opportuni-ties, new disease, and insect threats, and changing climatic andeconomic conditions (Dvorak 2012).
Conclusions
We concur with Vercoe and Clarke (1994) that there is not oneprovenance or one island that is always superior over theothers in E. urophylla provenance testing. However, our inter-national trial series has identified populations on the island ofWetar and Lembata that are very productive and highlights thegood performance of coastal lowland provenances on Flores.Our results indicate that the general superiority of Mt. Egonand Mt. Lewotobi, Flores, might be overstated; there are goodand poor sources on these volcanoes, and some variationshould be expected. This points to the need for intensive prov-enance sampling and testing in E. urophylla to locate produc-tive sources. For the same reasons, it is probably an overstate-ment to say that the Mt. Boleng, Adonara, source is alwayspoor. The large provenance and family variation inE. urophylla set the stage for impressive gains through selec-tion and breeding; the amount of additive variation found forheight and DBH in our study is similar to that found in othercommercial tree species. The future prospects of in situ con-servation of populations on Flores, Adonara, Lembata, Pantar,and Alor are poor because of human population pressure andthe lack of any financial value for the native eucalypt forests inlocal markets. We have conserved representative samples ofmost populations in our collections on the seven islands exsitu in the Camcore program.
Acknowledgments Wewould like to recognize the contributions of theSumalindo researchers who supervised the various seed collections ofE. urophylla over the 7-year period from 1996 to 2003. These includeArif Purwanto, Bambang Pepe, Maurits Sipayung, Suhartono Wijoyo,Suyadi, Teddy Sahelangi, Tribowo Suwartono, and Widiyatno. Collec-tion trips would sometimes last 3 weeks and require hiking over difficultterrain for as much as 12 h/day to reach isolated stands. Without the helpof these dedicated foresters, none of the genetic material from theCamcore seed collections described in this manuscript would ever havebeen made available for others to test in field trials across the variouscountries.
Many thanks also to all of the Camcore membership and particularlythose research teams in Argentina, Brazil, Colombia, Mexico, South Af-rica, and Venezuela for establishing, measuring, and protecting these fieldtrials so that results could be shared with others in the forest community.
Finally, we want to recognize the contributions of Andy Whittier andRobert Jetton (Camcore) for their assistance in map making andextracting precipitation data from prediction models.
57 Page 16 of 18 Tree Genetics & Genomes (2015) 11: 57

Appendix
References
Burdon RD (1977) Genetic correlation as a concept for studyinggenotype-environment interaction in forest tree breeding. SilvaeGenet 26:168–175
Dickerson GE (1969) Techniques for research in quantitative animal ge-netics. In: Techniques and procedures in animal science research.Am Soc Anim Sci, Albany, N.Y., pp 36–79
DietersMJ, White TL, Hodge GR (1995) Genetic parameter estimates forvolume from full-sib tests of slash pine (Pinus elliottii). Can J ForRes 25:1397–1408
Dvorak WS (2012) The Strategic Importance of Applied TreeConservation Programs to the Forest Industry in South Africa.South For 73(1):1–6, 74
DvorakWS, Hodge GR, Payn KG (2008) The conservation and breedingof Eucalyptus urophylla: a case study to better protect importantpopulations and improve productivity. South For 70(2):77–85
Eisen EJ, Saxton AM (1983) Genotype x environment interactions andgenetic correlations involving two environment factors. Theor ApplGenet 67:75–86
FAO (1981) International provenance trials of Eucalyptus urophylla. ForGenet Resour Inf 10:40
Gilmour AR, Gogel BJ, Cullis BR, Thompson R (2006) ASReml UserGuide Release 2.0. VSN International Ltd, Hemel Hempstead, HP11ES, UK. ISBN 1-904375-23-5
Griffin AR, Cotterill PP (1988) Genetic variation in growth of outcrossed,selfed and open-pollinated progenies of Eucalyptus regnans andsome implications for breeding strategy. Silvae Genet 37:124–131
Gunn BV, McDonald MW (1991) Eucalyptus urophylla seed collections.FAO For Genet Res Inf 19:34–37
Hardner CM, Potts BM (1995) Inbreeding depression and changes invariation after selfing in Eucalyptus globulus ssp. globulus. SilvaeGenet 44:46–54
Hijmans RJ, Cameron SE, Parra JL, Jones PG, Jarvis A (2005) Very highresolution interpolated climate surfaces for global land areas. Int JClimatol 25:1965–1978
Hijmans RJ, Guarino L, Mathur P (2012) DIVA-GIS, version 5. Manual.International Potato Center, Lima, Peru
HillWG (1984) On selection among groupswith heterogeneous variance.Anim Prod 39:473–477
Hodge GR, Pepe B, Wijoyo FS, Dvorak WS (2001) Early results ofEucalyptus urophylla provenance/progeny trials in Colombia andVenezuela. In: Proc. IUFRO Developing the Eucalypt of theFuture. Working Party 2.08.03. Sept. 9–13 Valdivia, Chile
Hodge GR, Dvorak WS (2012) Growth potential and genetic parametersof four Mesoamerican pines planted in the Southern Hemisphere.Southern For 74:27–49
Jacobs MR (1981) Eucalypts for planting. FAO Forestry Series No. 11.FAO, Rome
Jones PG, Gladkov A (1999) FloraMapTM . Version 1. A computer toolfor predicting the distribution of plants and other organisms in thewild. Centro Internaciónal de Agricultura Tropical (CIAT), Cali,Colombia
Kien ND, Jansson G, Harwood C, Thinh HH (2009) Genetic control ofgrowth and form in Eucalyptus urophylla in Northern Vietnam.Journal of Trop Sci 21(1):50–56
Ladrach WE (1986) Thinning of Pinus patula by mechanical and selec-tive method: results at 10 years. In: Whitmore JL, de Barros NF,Salazar R (eds) Plantation Forests for Wood Production in theNeotropics, p 17. Abstracts of Three IUFRO/MAB Symposia,Costa Rica
Lee ES, Forthofer RN (2006) Analyzing complex survey data, 2nd edn.Sage Publications Inc., Thousand Oaks, California, 91 pp
Maid M, Bhumibhamon S (2009) Timor mountain gum improvementprogram in eastern Thailand. J Sust Dev 2(1):176–191
Martin B, Cossalter C (1975–1976) The Eucalypts of the Sunda Islands.Bois et Forêts des Tropiques. 163,3-25, 164, 3–14, 166, 3–22, 167,3–24, 168, 3–17, 169,3-13. Centre Technique Forestier Tropical.CTFT, France
Mitchell G (2010) Camcore protecting endangered populations ofimportant forest species. Wood SA & Timber Times, SouthAfrica, pp 8–9
Moura VPG (1981) Provenance trials of Eucalyptus urophylla in east-central Brazil. Boletim de Pesquisa, Centro de PesquisaAgropecuária dos Cerrados, EMBRAPA, Brazil (3) 22 pp
Ngulube MR (1989) Provenance variation in Eucalyptus urophylla inMalawi. For Ecol Manag 26(4):265–273
Payn K, Dvorak W, Janse B, Myburg A (2008) Microsatellite diversityand genetic structure of the commercially important tropical treespecies Eucalyptus urophylla, endemic to seven islands in easternIndonesia. Tree Genet Genomes 4(3):519–530
Payn KG, Dvorak WS, Myburg AA (2007) Chloroplast DNAphylogeography reveals the island colonisation route ofEucalyptus urophylla (Myrtaceae). Aust J Bot 55:673–683
Pepe B, Surata K, Suhartono R, Sipayung M, Purwanto A, Dvorak W(2004) Conservation status of natural populations of Eucalyptusurophylla in Indonesia & international efforts to protect dwindlinggene pools. FAO Forest Genetic Resources No.31:61–63
Table 9 Numbers of tests, provenances, and families of E. urophylla included in Camcore provenance/progeny tests in various countries
Country Age 2 Age 3 Age 5 All ages combined
Tests Provs Fams Tests Provs Fams Tests Provs Fams Tests Provs Fams Trees
Brazil 2 12 136 5 31 387 6 40 523 18,965
Colombia 4 6 118 29 49 876 29 49 876 43,540
Mexico 14 42 442 14 42 442 23,053
South Africa 5 31 268 35 23 448 39 40 586 60,097
Venezuela 22 40 562 28 53 752 13 44 617 37 53 834 46,839
Tree Genetics & Genomes (2015) 11: 57 Page 17 of 18 57

Rocha M, Pires IE, Xavier A, Cruz CD, Rocha RB (2006) Genetic eval-uation of half-sib Eucalyptus urophylla by the REML/BLUP andminimum squares procedure. Ciencia Florestal 16(3/4):369–379
SAS Institute Inc (2011) SAS/STAT® 9.3 User’s Guide. SAS InstituteInc., Cary, NC
Souza C, Freitas MLM, de Moraes MLT, Sebben AM (2011)Estimates of genetic parameters for quantitative traits inopen-pollinate families of Eucalyptus urophylla. Florestas41(4):847–856
Squillace AE (1974) Average genetic correlations among offspring fromopen-pollinated forest trees. Silvae Genet 23:149–156
Swain TL, Verryn SD, Laing MD (2013) A comparison of the effect ofgenetic improvement, seed source and seedling seed orchard vari-ables on progeny growth in Eucalyptus nitens in South Africa. TreeGenet Genomes 9:767–778
Turnbull JW, Brooker MIH (1978) Timor mountain gum Eucalyptusurophylla S. T. Blake. Forest Tree Leaflet No. 214. CSIRO,Melbourne
Vercoe T, Clarke B (1994) Trial growth performance of Eucalyptusurophylla S. T. Blake. Report to FAO Forestry Division on the
growth of Eucalyptus urophylla in international provenance trialsand other growth trials. CSIRO Division of Forestry
Vigneron, P, Bouvet J-M, Gouma R, Saya A, Gion J-M, Verhaegen D(2000) Eucalypt hybrids breeding in Congo. In: BHybrid Breedingand Genetics of Forest Trees^ Proceedings of QFRI/CRC-SPFSymposium, 9–14 April 2000, Noosa, Queensland, Australia. Eds.H.S. Dungey, M.J. Dieters, and D.G. Nikles, p.14-26
Wei X, Borralho NMG (1998) Genetic control of growth traits ofEucalyptus urophylla S. T. Blake in South East China. SilvaeGenetica 47:158–165
White TL, Adams WT, Neale DA. 2007. Forest Genetics. CABInternational. 704 pp.
Data Archiving Statement
Data used for this study are available on the public database Dryad(datadryad.org)
57 Page 18 of 18 Tree Genetics & Genomes (2015) 11: 57