Embed Size (px)
Citation preview

December 2012
Prostate Cancer
2010 Report on Cancer Statistics in Alberta
Cancer Care
Cancer Surveillance
2
Cancer Care Cancer Surveillance
Report on Cancer Statistics in Alberta Prostate Cancer
Acknowledgements
This report was made possible through Alberta Health Services, Cancer Care, Cancer Surveillance and the many contributions of staff and management across Alberta Health Services as well as external agencies and individuals.
The authors wish to thank individuals working in the following AHS departments and partner agencies for their contributions to this report: Alberta Cancer Registry, Surveillance and Health Status Assessment, Alberta Health and Statistics Canada. Contributions included provision of information, analysis and interpretation, and assistance with consultation sessions and communication of the report.
Report Editor: Dr. Juanita Hatcher, Director, Cancer Surveillance
Project Coordinator: Barry Obondo, Information Dissemination Coordinator
Analysis and Review: Amy Colquhoun, Epidemiologist Halim Elamy, Surveillance Analyst Li Huang, Senior Surveillance Analyst Anthony Karosas, Surveillance Analyst Dr. Fengxiao Li, Survey Analyst Andrew Min, Assistant Programmer Analyst Chris Normandeau, Project Lead Tyler Pittman, Survey Analyst Dr. Zhenguo Qiu, Biostatistician Marjan Rekabdar, Surveillance Analyst Janine Schouten, Environmental Exposure Analyst Mengzhe Wang, Manager, Analytical Team Jing Yang, Clinical Data Analyst Yufei Zheng, Surveillance Analyst Practicum Student
Design Assistance:
Ashley Lakusta, Administrative Support III
Suggested Citation: Cancer Surveillance: 2010 Report on Cancer Statistics in Alberta. Edmonton: Cancer Care, Alberta Health Services, 2012. For More Information: Visit our website: http://www.albertahealthservices.ca/1703.asp

3
Cancer Care Cancer Surveillance
Report on Cancer Statistics in Alberta Prostate Cancer
Table of Contents
Purpose of the Report 4
Navigating the Report 4
Data Notes 4
Summary 5
Demography 6
Probability of Developing and Dying from Prostate Cancer 7
Potential Years of Life Lost 8
Prevalence 9
Incidence and Mortality 10
Relative Survival 16
Geographic Variation 17
Further Information 19
References 20
Contact Information 20

4
Cancer Care Cancer Surveillance
Report on Cancer Statistics in Alberta Prostate Cancer
Purpose of the Report
Cancer Surveillance is a specialized team within Alberta Health Services,
Cancer Care, that actively contributes to Alberta Health Service’s goal of
creating the best-performing publicly funded health system in Canada. This
is accomplished by conducting cancer surveillance through the collection,
integration, analysis and dissemination of cancer related data and
information.
The report is designed to provide comprehensive and detailed information
regarding cancer in Alberta. It will help support health professionals,
researchers and policy makers in the planning, monitoring and evaluation of
cancer-related health programs and initiatives. It will also be a useful
education tool for the general public and media.
Navigating the Report
This document provides information on prostate cancer statistics in Alberta.
Details about other individual cancer types are available within separate
documents. The words highlighted in dark blue are terms described in detail
in the Glossary within the Appendix document.
Data Notes
In this document, the term “cancer” refers to invasive cancers unless
otherwise specified. It is important to note that this document contains
both actual and estimated data; distinctions are made where applicable.
The numbers published in this report should be considered provisional, as a
few cases and deaths may be registered in subsequent years. The data in
this report reflect the state of the Alberta Cancer Registry as of July 31,
2012.
For detailed descriptions about data sources and how they affect data
presented in this report, please see the Appendix document.

5
Cancer Care Cancer Surveillance
Report on Cancer Statistics in Alberta Prostate Cancer
Summary
Approximately 1 in 6 men will develop invasive prostate cancer within
their lifetime.
In 2010, 2,961 potential years of life were lost due to prostate cancer.
As of December 31, 2010, approximately 22,350 Albertans were alive
who had previously been diagnosed with prostate cancer.
From 2001-2010*, prostate cancer incidence rates have decreased.
From 1995 to 2010*, prostate cancer mortality rates have decreased.
In 2010, there were 2,073 new cases of prostate cancer in Alberta and
349 deaths due to the disease.
Approximately 2,700 cases of prostate cancer are expected to be
diagnosed in 2015.
The five-year relative survival ratio for prostate cancer in Alberta is
approximately 96% for those diagnosed between 2008 and 2010.
*Year range represents the period over which the most recent significant trend was observed.
In 2010, there were 2,073 new cases
of prostate cancer in Alberta and 349
deaths due to the disease.
The five-year relative survival ratio for
prostate cancer in Alberta is
approximately 96% for those
diagnosed between 2008 and 2010.

6
Cancer Care Cancer Surveillance
Report on Cancer Statistics in Alberta Prostate Cancer
Demography
The increase in the number of new cases of prostate cancer over the last
two decades is mainly attributable to changes in demography (aging of the
population and population growth), and the increase in the prostate cancer
incidence rate (Figure 3-1).
The horizontal black line indicating 878 new cases in Figure 3-1 represents
the number of prostate cancer cases that occurred in 1990. In 2015,
approximately 2,700 new prostate cancer cases are projected to occur,
accounting for a 211% increase in cases from 1990. The line at the top of the
dark purple-shaded area of the graph represents the number of new cases
that actually occurred between 1990 and 2009, projected to 2015. Between
these two lines, the three colored areas reflect the increase in prostate
cancer cases due to the impact of rate change, population growth and aging
population.
The light blue shaded area (lower) represents the total number of new
prostate cancer cases that would have occurred each year if prostate cancer
incidence rates alone had changed but the population size and age structure
had remained the same as in 1990. This will account for an approximately
82% in the total new prostate cancer cases in 2015.
The light purple shaded area (middle) represents the number of new
prostate cancer cases that would have occurred each year if the population
alone had grown larger, assuming the age distribution and prostate cancer
incidence rates had remained the same as in 1990. This will account for an
approximately 58% in the total new prostate cancer cases in 2015.
Figure 3-1: Trends in New Cases of Prostate Cancer Attributed to Aging
Population, Population Growth and Change in Prostate Cancer Rate, Alberta,
1990-2015
0
500
1,000
1,500
2,000
2,500
3,000
New
Cas
es
Year
Number of Cases in 1990 Change in Rate Population Growth Aging Population
Aging Population
(71%)
Population Growth(58%)
Change in Rate(82%)
878(0%)
2,724(211%)
Data Source: Alberta Cancer Registry, Alberta Health
The dark purple shaded area (top) represents the number of new prostate
cancer cases attributed to increases in the older adult population - the aging
population, assuming the population size and prostate cancer incidence rate
had remained the same as in 1990. This will account for an approximately
71% in the total new prostate cancer cases in 2015.
7
Cancer Care Cancer Surveillance
Report on Cancer Statistics in Alberta Prostate Cancer
Probability of Developing and Dying from Prostate Cancer
The probability of developing or dying of cancer measures the risk of an
individual in a given age range developing or dying of cancer, and is
conditional on the person being prostate cancer-free prior to the beginning
of that age range.
It is important to note that the probabilities of developing and dying of
cancer represent all of Alberta’s population on average and should be
interpreted with caution at the individual level as the probabilities will be
affected by the risk behaviours of the individual. In addition, someone
diagnosed with cancer has a higher probability of developing another cancer
in the future.1
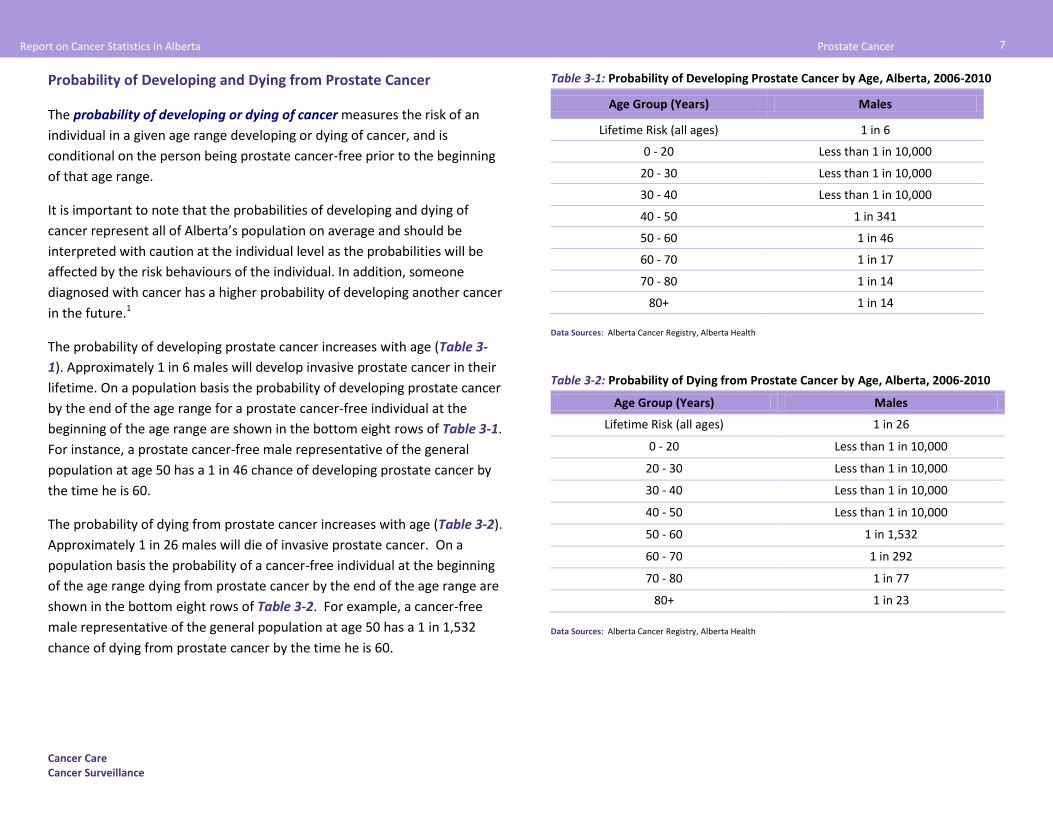
The probability of developing prostate cancer increases with age (Table 3-
1). Approximately 1 in 6 males will develop invasive prostate cancer in their
lifetime. On a population basis the probability of developing prostate cancer
by the end of the age range for a prostate cancer-free individual at the
beginning of the age range are shown in the bottom eight rows of Table 3-1.
For instance, a prostate cancer-free male representative of the general
population at age 50 has a 1 in 46 chance of developing prostate cancer by
the time he is 60.
The probability of dying from prostate cancer increases with age (Table 3-2).
Approximately 1 in 26 males will die of invasive prostate cancer. On a
population basis the probability of a cancer-free individual at the beginning
of the age range dying from prostate cancer by the end of the age range are
shown in the bottom eight rows of Table 3-2. For example, a cancer-free
male representative of the general population at age 50 has a 1 in 1,532
chance of dying from prostate cancer by the time he is 60.
Table 3-1: Probability of Developing Prostate Cancer by Age, Alberta, 2006-2010
Age Group (Years) Males
Lifetime Risk (all ages) 1 in 6
0 - 20 Less than 1 in 10,000
20 - 30 Less than 1 in 10,000
30 - 40 Less than 1 in 10,000
40 - 50 1 in 341
50 - 60 1 in 46
60 - 70 1 in 17
70 - 80 1 in 14
80+ 1 in 14
Data Sources: Alberta Cancer Registry, Alberta Health
Table 3-2: Probability of Dying from Prostate Cancer by Age, Alberta, 2006-2010
Age Group (Years) Males
Lifetime Risk (all ages) 1 in 26
0 - 20 Less than 1 in 10,000
20 - 30 Less than 1 in 10,000
30 - 40 Less than 1 in 10,000
40 - 50 Less than 1 in 10,000
50 - 60 1 in 1,532
60 - 70 1 in 292
70 - 80 1 in 77
80+ 1 in 23
Data Sources: Alberta Cancer Registry, Alberta Health

8
Cancer Care Cancer Surveillance
Report on Cancer Statistics in Alberta Prostate Cancer
Potential Years of Life Lost
One frequently used measure of premature death is potential years of life
lost (PYLL). PYLL due to cancer is an estimate of the number of years that
people would have lived had they not died from cancer. PYLL due to cancer
has been calculated by multiplying the number of deaths in each age group
and the absolute difference between the mid-point age of an age group and
the age-specific life expectancy. The age-specific life expectancy is
calculated by determining the age to which an individual would have been
expected to live had they not died from cancer. PYLL is one way to measure
the impact, or burden, of a disease on a population.
In 2010, 2,961 potential years of life were lost due to prostate cancer, which
constitutes about 4% of PYLL for all cancers (Figure 3-2).
Figure 3-2: Potential Years of Life Lost (PYLL) from Prostate Cancer Compared with
Lung†, Colorectal
† and Breast
‡ Cancer, Alberta, 2010
0
5,000
10,000
15,000
20,000
25,000
Lung Colorectal Breast Prostate
Pote
ntia
l Yea
rs o
f Li
fe L
ost
(PYL
L)
Cancer Type
† Male and Female‡ Female only
Data Source: Alberta Cancer Registry

9
Cancer Care Cancer Surveillance
Report on Cancer Statistics in Alberta Prostate Cancer
Prevalence
The prevalence of a disease is defined as the number of people alive at a
given time point who had been previously diagnosed with that disease.
Limited-duration prostate cancer prevalence represents the number of
people alive on a certain day who had previously been diagnosed with
prostate cancer within a specified time period (e.g. 2, 5, 10 or 20 years)
while complete prostate cancer prevalence represents the number of
people alive on a certain day who had previously been diagnosed with
prostate cancer, regardless of how long ago the diagnosis was.2
In this section of the report, both limited-duration and complete prostate
cancer prevalence are presented; the latter describing the number of
people alive as of December 31, 2010 who had ever been diagnosed with
prostate cancer.
Prevalence is a useful indicator of the impact of cancer on individuals, the
healthcare system and the community as a whole. Although many cancer
survivors lead healthy and productive lives, the experience can have a
strong impact on the physical and emotional well-being of individuals and
their families. The cancer experience can also result in the continued use of
the healthcare system through rehabilitation or support services, as well as
loss of work productivity that can affect the whole community.
Table 3-3: Limited-Duration and Complete Prevalence for Prostate Cancer,
Alberta, 2010
Duration Males
2-Year 4,055
5-Year 9,488
10-Year 16,923
20-Year 21,908
Complete 22,356
Data Source: Alberta Cancer Registry
As of December 31, 2010, approximately 22,350 Albertans were alive who
had previously been diagnosed with prostate cancer (Table 3-3) out of
which approximately 4,050 Albertans were alive on the same date who had
been diagnosed with prostate cancer in the previous two years, the period
during which cases are more likely to receive definitive treatments.
10
Cancer Care Cancer Surveillance
Report on Cancer Statistics in Alberta Prostate Cancer
Prostate Cancer Incidence and Mortality
Incidence counts are the number of new cancer cases diagnosed during a
specific time period in a specific population. In this section of the report,
incidence counts refer to the number of new prostate cancer diagnoses in
Albertan residents in a calendar year. Incidence rates are the number of
new prostate cancer cases diagnosed per 100,000 population in a specific
time period.
Mortality counts describe the number of deaths attributed to cancer during
a specific period of time in a specific population. In this section of the
report, mortality refers to the number of deaths due to prostate cancer in
Albertan residents in a calendar year, regardless of date of diagnosis.
Mortality rates are the number of deaths per 100,000 population in a
specific time period.
In order to compare cancer incidence or cancer mortality over time or
between populations, age-standardized incidence rates (ASIRs) or age-
standardized mortality rates (ASMRs) are presented. These are weighted
averages of age-specific rates using a standard population to determine the
weights. These rates are useful because they are adjusted for differences in
age distributions in a population over time, which permit comparisons of
cancer incidence or mortality among populations that differ in size,
structure and/or time period. ASIRs and ASMRs give the overall incidence
and mortality rates that would have occurred if the population of Alberta
had been the same as the standard population. In this report the Canadian
1991 population is used as the standard population.
Three-year moving averages are used to smooth out year-to-year
fluctuations so that the underlying trend may be more easily observed. They
are calculated based on aggregating three years of data by age group. Age-
standardized incidence rates (ASIRs) and age-standardized mortality rates
(ASMRs) are presented as three-year moving averages. This smoothing of
trends is especially important when the number of cancer cases per year is
relatively small, where year-to-year variability can be quite large.
Incidence and mortality can be affected by a variety of factors;
implementation of public health prevention or screening strategies that
either prevent disease or find cancer in its early stages when treatment is
generally more successful, the development of cancer treatment programs
that may impact chances of survival and research innovations.
The following figures show incidence and mortality trends for prostate
cancer in Alberta. Separate analyses for both incidence and mortality are
shown in subsequent sections. The statistical significance of the trends was
determined by using Joinpoint3 method and is described in the text
accompanying each graph. Joinpoint models are based on yearly rates;
hence there may be slight differences in the rates presented in the text
(from Joinpoint model) and the graphs (where ASIRs and ASMRs are shown
as three-year moving averages).

11
Cancer Care Cancer Surveillance
Report on Cancer Statistics in Alberta Prostate Cancer
Figure 3-3: Age-Standardized Incidence Rates (ASIRs)*†
and Mortality Rates
(ASMRs)*†
and 95% Confidence Intervals (CI) for Prostate Cancer, Alberta, 1990-
2010
0
20
40
60
80
100
120
140
160
180
1990 1992 1994 1996 1998 2000 2002 2004 2006 2008 2010
Rate
per
100
,000
Year
ASIR
ASMR
* Three-year moving average.† Standardized to 1991 Canadian population.
Data Sources: Alberta Cancer Registry, Alberta Health
Since 1990 there have been two peaks in prostate cancer ASIRs (Figure 3-3).
The peaks for prostate cancer incidence occurred in 1993 and 2002. The
first peak in incidence may be attributed to the introduction of prostate
specific antigen (PSA) testing for prostate cancer that occurred in the early
1990s4. It has also been speculated that the second peak was the result of
increased PSA screening test activity after the Federal Minister of Health,
Allan Rock, was diagnosed with prostate cancer in 20015. Prostate cancer
ASIRs increased significantly by 12.5% annually between 1990 and 1993,
remained stable between 1993 and 1997, and increased significantly again
by 8.0% annually between 1997 and 2001. However, from 2001 to 2010
prostate cancer ASIRs decreased significantly by 4.4% annually. In 2010, the
ASIR for prostate cancer was 108 per 100,000 male population.
Prostate cancer mortality rates have been much lower and more stable than
incidence rates. Prostate cancer mortality rates were stable between 1990
and 1995. However, from 1995 to 2010, prostate cancer ASMRs decreased
significantly by 3.1% annually (Figure 3-3). In 2010, the ASMR for prostate
cancer was 19 per 100,000 male population.
Prostate Cancer Incidence
The following three figures (Figures 3-4 to 3-6) provide information on
prostate cancer incidence in Alberta. The number of new cancer cases in
Alberta is affected not only by changes in the incidence rates, but also by
the changes in the age structure and growth of the population. In order to
compare trends over time, age-standardized incidence rates (ASIRs) are also
provided.
In Figure 3-4 observed age standardized incidence rates are shown for
1990-2009, and projected rates for 2010 -2015, and observed numbers of
new prostate cancer cases are shown for the years 1990-2010 and projected
numbers for 2011-2015.
The projected cancer numbers were calculated by applying the estimated
age-specific cancer incidence rates to the projected age-specific population
figures provided by Alberta Health6. These were observed up to 2009 and
estimated for 2010-2015. Caution should be exercised when comparing
Canada7 and Alberta rates as Canadian rates are yearly rates while Alberta
rates are three-year moving averages.
The estimated prostate cancer incidence rates were calculated by
extrapolating the historical trends in age-specific rate based on data for
1985-2009.

12
Cancer Care Cancer Surveillance
Report on Cancer Statistics in Alberta Prostate Cancer
Figure 3-4: Actual and Projected Number of New Cases and Age-Standardized
Incidence Rates (ASIRs)*†
for Prostate Cancer, Alberta, 1990-2015
878 10271175
14221316 1306
1423 13721517
16971821
2320
20572186
2011 19422125
20362200 2194
2073
2391 2467 2550 26362724
0
500
1000
1500
2000
2500
3000
3500
4000
4500
5000
0
20
40
60
80
100
120
140
160
180
1990 1992 1994 1996 1998 2000 2002 2004 2006 2008 2010 2012 2014
New
Cases
Rate
per
100
,000
Year
Alberta New Cases Alberta Projected New Cases
Alberta 3-Year Moving Average ASIR Alberta Projected ASIR
Canada ASIR Canada Projected ASIR
* Three-year moving average.† Standardized to 1991 Canadian population.
Data Sources: Alberta Cancer Registry, Alberta Health, Canadian Cancer Society
In 2010, 2,073 cases of prostate cancer were diagnosed in Alberta (Figure 3-
4). Overall, ASIRs for prostate cancer in Alberta were generally higher than
ASIRs in Canada over the period 1994 to 2009. However the ASIRs peaked in
the same time period for both Alberta and Canada.
Approximately 2,700 prostate cancer cases will be diagnosed in Alberta in
2015.
Figure 3-5: Age-Specific Incidence Rates for Prostate Cancer, Alberta, 2006-2010
0
100
200
300
400
500
600
700
800
0 20 40 60 80 100
Rat
e pe
r 10
0,00
0
Age (Years)
Male
Data Sources: Alberta Cancer Registry, Alberta Health
Age-specific prostate cancer incidence rates remain low until about the age
of 40, when they begin rising rapidly and peak at approximately age 65
(Figure 3-5) and then decrease slightly afterwards. The highest prostate
cancer incidence rates occur in the older age groups.

13
Cancer Care Cancer Surveillance
Report on Cancer Statistics in Alberta Prostate Cancer
Figure 3-6: Age-Standardized Incidence Rates (ASIRs)*†
and 95% Confidence
Intervals (CI) for Prostate Cancer, Age Groups <60, 60-69, 70-79, and 80+,Alberta,
1990-2010
0
200
400
600
800
1000
1200
1400
1990 1992 1994 1996 1998 2000 2002 2004 2006 2008 2010
Rate
per
100
,000
Year
<60 Years Old
60-69 Years Old
70-79 Years Old
80+ Years Old
* Three-year moving average.† Standardized to 1991 Canadian population.
Data Sources: Alberta Cancer Registry, Alberta Health
The trends in age-standardized prostate cancer incidence rates differ across
age groups (Figure 3-6).
Incidence rates for prostate cancer in the <60 year age group increased
significantly between 1990 and 2001 by 13.5% annually with no significant
change after 2001.
Prostate cancer incidence rates for the 60-69 year age group increased
significantly between 1990 and 2001 by 6.6% annually and decreased
significantly between 2001 and 2010 by 3.5% annually.
Prostate cancer incidence rates for the 70-79 year age group increased
significantly between 1990 and 1993 by 10.5% annually and did not
significantly change between 1993 and 1997. Between 1997 and 2001, the
rates increased significantly by 9.0% annually followed by a significant
decrease between 2001 and 2005 of 10.1% annually. The rates remained
stable between 2005 and 2010.
Prostate cancer incidence rates for the 80+ year age group remained stable
between 1990 and 1992, but decreased significantly between 1992 and
2008 by 3.4% annually followed by a sharp decrease from 2008 to 2010 by
18.7% annually.
The rates for the <60 year age group were lower than those for all other age
groups.

14
Cancer Care Cancer Surveillance
Report on Cancer Statistics in Alberta Prostate Cancer
Prostate Cancer Mortality
The following three figures (Figures 3-7 to 3-9) provide information on
prostate cancer mortality in Alberta. The number of deaths in Alberta is
affected not only by changes in the mortality rates, but also by the changes
in the age structure and growth of the population. In order to compare
trends over time, age-standardized mortality rates (ASMRs) are also
provided.
In Figure 3-7 observed age standardized mortality rates are shown for 1990-
2009, and projected rates for 2010 -2015, and observed numbers of cancer
deaths are shown for the years 1990-2010 and projected numbers for 2011-
2015.
The projected numbers of cancer deaths were calculated by applying the
estimated age-specific cancer mortality rates to the age-specific population
figures provided by Alberta Health6. These were observed up to 2009 and
estimated for 2010-2015. Caution should be exercised when comparing
Canada7 and Alberta rates as Canadian rates are yearly rates while Alberta
rates are three-year moving averages.
The estimated prostate cancer mortality rates were calculated by
extrapolating the historical trends in age-specific rate based on data in
1985-2009.
Figure 3-7: Actual and Projected Number of Deaths and Age-Standardized
Mortality Rates (ASMRs)*†
for Prostate Cancer, Alberta, 1990-2015
256 279 286 293 286344 310 310 325
273332 317 322 341 315 323 338 321 347 368 349 353 354 358 362 365
0
200
400
600
800
1000
1200
1400
1600
1800
2000
0
5
10
15
20
25
30
35
40
45
50
1990 1992 1994 1996 1998 2000 2002 2004 2006 2008 2010 2012 2014
Deaths
Rat
e pe
r 10
0,00
0
Year
Alberta Deaths Alberta Projected Deaths
Alberta 3-Year Moving Average ASMR Alberta Projected ASMR
Canada ASMR Canada Projected ASMR
* Three-year moving average.† Standardized to 1991 Canadian population.
Data Sources: Alberta Cancer Registry, Alberta Health, Canadian Cancer Society
In 2010, 349 males died of prostate cancer in Alberta (Figure 3-7). Alberta
ASMRs for prostate cancer were similar to those in Canada over the period
1991 to 1993 and were generally higher than ASMRs in Canada over the
period 1994 to 2008.
Approximately 360 males are expected to die from prostate cancer in
Alberta in 2015.

15
Cancer Care Cancer Surveillance
Report on Cancer Statistics in Alberta Prostate Cancer
Figure 3-8: Age-Specific Mortality Rates for Prostate Cancer, Alberta, 2006-2010
0
100
200
300
400
500
600
700
800
0 10 20 30 40 50 60 70 80 90
Rate
per
100
,000
Age (Years)
Male
Data Sources: Alberta Cancer Registry, Alberta Health
Prostate cancer mortality rates remain low until about the age of 55 and
begin to rise rapidly thereafter (Figure 3-8). The highest prostate cancer
mortality rates occur in the older age groups.
The trends in age-standardized prostate cancer mortality rates vary over
time and with age (Figure 3-9).
Figure 3-9: Age-Standardized Mortality Rates (ASMRs)*†
and 95% Confidence
Intervals (CI) for Prostate Cancer, Ages <60, 60-69, 70-79, and 80+, Alberta, 1990-
2010
0
100
200
300
400
500
600
700
800
900
1990 1992 1994 1996 1998 2000 2002 2004 2006 2008 2010
Rate
per
100
,000
Year
<60 Years Old
60-69 Years Old
70-79 Years Old
80+ Years Old
* Three-year moving average.† Standardized to 1991 Canadian population.
Data Sources: Alberta Cancer Registry, Alberta Health Prostate cancer mortality rates in the age
group <60 did not significantly change between 1990 and 2010.
Mortality rates for prostate cancer in the age group 60-69 decreased
significantly between 1990 and 2010 by 4.0% annually.
Mortality rates for prostate cancer in the age group 70-79 decreased
significantly between 1990 and 2010 by 3.0% annually.
Mortality rates for prostate cancer in the age group 80+ increased
significantly between 1990 and 1996 by 3.7% annually, but decreased
significantly by 2.7% annually between 1996 and 2010.
The older the age group, the higher the mortality rate.

16
Cancer Care Cancer Surveillance
Report on Cancer Statistics in Alberta Prostate Cancer
Prostate Cancer Survival
Cancer survival ratios indicate the proportion of people who will be alive at
a given time after they have been diagnosed with cancer. Survival is an
important outcome measure and is used for evaluating the effectiveness of
cancer control programs. Survival depends on several factors including the
cancer type (most importantly site, morphology and stage at diagnosis), sex,
age at diagnosis, health status and available treatments for that cancer.
While relative survival ratios (RSRs) give a general expectation of survival
over the whole province, these ratios may not apply to individual cases.
Individual survival outcomes depend on the stage at diagnosis, treatment
and other individual circumstances.
Relative survival ratios are estimated by comparing the survival of cancer
patients with that expected in the general population of Albertans of the
same age, sex and in the same calendar year. In this section of the report,
RSRs are standardized by the age structure in the standard cancer patient
population (i.e. all persons who were diagnosed with that cancer in Canada
between 1992 and 2001) to permit RSRs to be compared over time,
independent of differences in age distribution of cancer cases.
RSRs are estimated by the cohort method8 when complete follow-up data
(e.g., at least five years of follow-up to estimate five-year rate) after
diagnosis are available. For recently diagnosed cases, whose complete
follow-up data are not available, the up-to-date estimates are computed
using the period method.9 However, comparison between cohort and
period RSRs should be interpreted with caution because of the two different
methods used to derive the respective ratios.
The relative survival ratio is usually expressed as a percentage (%) and the
closer the value is to 100%, the more similar the survival pattern is to the
general population.
Figure 3-10: Age-Standardized One, Three and Five-Year Relative Survival Ratios
and 95% Confidence Intervals (CI) for Prostate Cancer, Alberta, 1991-1993*, 1998-
2000* and 2008-2010
0
10
20
30
40
50
60
70
80
90
100
1 year 3 year 5 year
Rel
ativ
e Su
rviv
al (
%)
Years After Diagnosis
1991-1993
1998-2000
2008-2010
* Ratios calculated by cohort method, where complete follow-up data are available. Ratios calculated by period method, where complete follow-up data are not available.
Data Sources: Alberta Cancer Registry, Statistics Canada
The five-year relative survival ratio for males diagnosed with prostate
cancer in the period 2008-2010 is an estimated 96% indicating that out of all
males diagnosed with this cancer between 2008 and 2010, around 96% are
as likely to be alive five years after diagnosis as males from the general
Alberta population of the same age.
The five-year relative survival ratio for males diagnosed with prostate
cancer in Alberta has improved in 2008-2010 compared to those diagnosed
in 1991-1993 (Figure 3-10).

17
Cancer Care Cancer Surveillance
Report on Cancer Statistics in Alberta Prostate Cancer
Geographic Variation
The geographic variation section illustrates how the observed prostate
cancer rates in each health zone compare with the provincial average. These
rates are three-year averages. The age standardized incidence and mortality
prostate cancer rates for each zone and the province are presented with
their corresponding 95% confidence intervals.10 Any observed differences in
rates may be due to several factors such as regional differences in:
risk factors such as smoking and obesity rates
prevention efforts
cancer screening
diagnostic activity
access to cancer care.11
Figure 3-11: Five Health Zones in Alberta, 2010
Source: Alberta Health Services

18
Cancer Care Cancer Surveillance
Report on Cancer Statistics in Alberta Prostate Cancer
Figure 3-12: Age-Standardized Incidence Rates (ASIRs)*†
and 95% Confidence
Intervals (CI) for Prostate Cancer by Zones, Alberta, 2008-2010
0
20
40
60
80
100
120
140
160
South Calgary Central Edmonton North
Rate
per
100
,000
Health Zone
Male ASIR
Alberta Male ASIR
Alberta 95% Confidence Interval
* Three-year average.† Standardized to 1991 Canadian population.
Data Sources: Alberta Cancer Registry, Alberta Health
There is no evidence that male prostate cancer ASIRs in each zone is
significantly higher or lower than the provincial average (Figure 3-12).
Figure 3-13: Age-Standardized Mortality Rates (ASMRs)*†
and 95% Confidence
Intervals (CI) for Prostate Cancer by Zones, Alberta, 2008-2010
0
20
40
60
80
100
120
140
160
South Calgary Central Edmonton North
Rate
per
100
,000
Health Zone
Male ASMR
Alberta Male ASMR
Alberta 95% Confidence Interval
* Three-year average.† Standardized to 1991 Canadian population.
Data Sources: Alberta Cancer Registry, Alberta Health
There is no evidence that male prostate cancer ASMRs in each zone is
significantly higher or lower than the provincial average (Figure 3-13).

19
Cancer Care Cancer Surveillance
Report on Cancer Statistics in Alberta Prostate Cancer
Further Information
Further information is available on a separate document, the Appendix:
Appendix 1: Glossary
Appendix 2: Cancer Definitions
Appendix 3: Data Notes
20
Cancer Care Cancer Surveillance
Report on Cancer Statistics in Alberta Prostate Cancer
References
1. Okamoto N, Morio S, Inoue R, Akiyama K. The risk of a second primary cancer occurring in five-year survivors of an initial cancer. Jpn. J Clin Oncol. 1987;17(3):205-213.
2. National Cancer Institute - Surveillance Epidemiology and End Results [Internet]. USA. National Institutes of Health; c2010.Cancer Prevalence Statistics Overview; 2010 [cited 2010 Nov 23]; Available from: http://surveillance.cancer.gov/prevalence/]
3. Kim H-J, Fay M, Feuer E. Permutation tests for JoinPoint regression with applications to cancer rates. Stat. Med. 2000; 19:335-351.
4. Neutel CI, Gao R, Blood PA, Gaudette LA. Trends in prostate cancer incidence, hospital utilization and surgical procedures, Canada, 1981-2000. Can J Public Health. 2010; 97(3):177–182.
5. Fradet Y, Klotz L, Trachtenberg J, Zlotta A. The burden of prostate cancer in Canada. Can Urol. Assoc J. 2009;3(3 suppl 2):S92–S100.
6. 2010 Alberta Population Data [Excel Spreadsheet]. Edmonton (Alberta): Alberta Health; 2009.
7. Canadian Cancer Society’s Steering Committee: Canadian Cancer Statistics 2012. Toronto: Canadian Cancer Society, 2012.
8. Ederer F, Axtell LM and Cutler SJ. The relative survival rate: a statistical methodology. Natl Cancer Inst Monogr, 1961; 6: 101–121
9. Brennera H, Gefellerb O and Hakulinen T. Period analysis for ‘up-to-date’ cancer survival data: theory, empirical evaluation, computational realisation and applications. European Journal of Cancer, 2004; 40: 326–335
10. Fay MP and Feuer EJ. Confidence intervals for directly standardized rates: a method based on the gamma distribution. Stat Med, 1997; 16: 791 – 801.
11. Levi F. Cancer Prevention: Epidemiology and Perspectives. Eur J Cancer. 1999;35(7):1046-1058.
Contact Information
If further information is required, please contact
Cancer Surveillance, Alberta Health Services as
follows:
Mailing Address:
Alberta Health Services Cancer Care
Cancer Surveillance 1400 - 10123-99 Street Edmonton, AB, Canada
T5J 3H1
Phone: 780-643-4347 Fax: 780-643-4380
Email: [email protected]