Embed Size (px)
Citation preview

GLOBAL RESTORATION INITIATIVE
Charles Barber | World Resources Institute
Prospects for a Regional Approach to Restoration in the Asia-Pacific Region:
Some Lessons from Latin America and Africa

2
FOREST
DEGRADED LAND/ABANDONED LAND/CRITICAL LAND
AGRO-FORESTRY
AGRICULTURE-FARMING
FORESTS ARE BEING CONVERTED INTOAGRICULTURE/FARMING LANDS
FORESTS, AGRICULTURE, AND AGRO-FORESTRY LANDS ARE NOT MANAGED PROPERLY AND TURNED INTO DEGRADED LANDS
FORESTS AND LANDSCAPE RESTORATION
ARE NOT JUST AFORESTATION OR REFORESTATION
CURRENT CONDITION
WITH NO INTERVENTION, WE WILL HAVE MORE DEGRADED, UNPRODUCTIVE LANDSCAPE IN THE FUTURE

FOREST
AGRO-FORESTRY
AGRICULTURE-FARMING
PRODUCTION INTENSIFICATION
STOPPING DEFORESTATION
FORESTS AND LANDSCAPE RESTORATION
ARE NOT JUST AFORESTATION OR REFORESTATION
VISION FOR THE FUTURE
DEGRADED LAND/ABANDONED LAND/CRITICAL LAND
FOREST
AGRICULTURE-FARMING
AGRO-FORESTRY
LANDSCAPERESTORATION
FUNCTIONING & PRODUCTIVE LANDSCAPE

Opportunity: Restore productivity and function to degraded and deforested lands
Agriculture
Forest
Degraded and Deforested Land
Agriculture
Forest
Agro-forestry
Today Vision for 2050
Intensify production
Avoid deforestation
Restore into mixed systems
Agro-forestry
4

Restore a balance of economic, ecological and social returns within the landscape
5

IT’S BEEN DONE BEFORE
South Korea, 1960
South Korea, 2000
• Forest cover from 35% to 64%• Forest density increased 14x,
population 2x, economy 25x

Loess PlateauBefore: 1999
Loess PlateauAfter: 2005
• ↓ soil erosion on 920,000 hectares• 99% ↓ in sediment in water • 2.5 million people out of poverty
IT’S BEEN DONE BEFORE…
7

Image: Flickr/CIFOR; Source: WRI
150mhectares under restoration by 2020
AMBITIOUS GLOBAL TARGETS EXIST
Bonn Challenge
350mhectares under restoration by 2030
NY Declaration
8

COMMITMENTS TO RESTORE ARE MOUNTING
Bonn Challenge Launch (2011)
total = 20 million
•USA: 15 million
•Rwanda: 2 million
•Costa Rica: 1 million
•El Salvador: 1 million
•PACTO: 1 million
UN Climate Summit (Sep 2014)
total = 48 million
•Ethiopia: 15 million
•DRC: 8 million
•Uganda: 2.5 million
•Guatemala: 1.2 million
•Colombia: 1 million
•Chile: 100,000
COP20 in Lima (Dec 2014)
total = 60 million
•Mexico: 8.5 million
•Peru: 3 million
•Panama: 1 million
•Ecuador: 500,000
•Argentina & Chile: 1 million via ConservacionPatagonica
COP21 in Paris (Dec 2015)
goal= 100 million
• India: 10 million
• China: 40 million
• Indonesia: 12 million
• Brazil: 12 million
• Kenya: 13 million
• Niger: 3.2 million
• Others…
9

WHAT IS NEEDED TO SPARK A GLOBAL
RESTORATION MOVEMENT?
Ambitious targets
- Bonn Challenge: 150 million hectares by 2020
- NY Declaration: 350 million hectares by 2030
People who want to restore
- Donors
- Governments
- Civil society organizations
- Businesses
- Landowners
Inputs
- Commitments
- Assessments
- Knowledge
- Approaches
- Materials
- Financing
- Monitoring
Supporting entities
- Global Partnership on Forest Landscape Restoration (GPFLR)
- Global Restoration Council
- Regional restoration initiatives
10

Promote good practices
Strategy & Management Support
Strategy
Africa (10)
LAC (12)
Asia (2)
Budgets &Finance
Comms Systems
Fundraising M&E
Countries Core Offers
Facilitatefinance
Monitorprogress
Support scaling strategies
DRC, Ethiopia, Kenya, Liberia, Madagascar, Malawi, Niger,
Rwanda, Togo, Uganda
India, Indonesia
Argentina, Brazil, Chile, Costa Rica, Colombia, Ecuador, El Salvador,
Guatemala, Honduras, Mexico, Nicaragua, Peru
AFR100(WRI lead)
Initiative 20x20 (WRI lead)
Asia(WRI not lead)
Partnerships
GLOBAL RESTORATION INITIATIVE

1. Encourage political commitments
2. Provide technical support for
implementation
3. Develop financial architecture and
secure financing
What needs to be done at the Regional Level?

SUPPORT GLOBAL AMBITION
POLITICAL – SETS THE AGENDA
TECHNICAL FINANCIAL
Brazil (ES)
Chile
Colombia
Costa Rica
Ecuador
El Salvador
Guatemala
Mexico
Nicaragua
Peru
New York
Declaration
on Forests

Secure financing
Private sector equity
($0.7 billion)
Debt finance (5X equity)
Partial Risk Guarantee ($0.1
billion) and Capitalization
Fund
Investment Readiness Fund($10 million)

Political• CAR
• DRC
• Ethiopia
• Ghana
• Kenya
• Liberia
• Madagascar
• Malawi
• Mozambique
• Niger
• Rwanda
• Togo
• Uganda15
Financial• BMZ
• World Bank
• Global Environment Facility (GEF)
• Moringa Partnership
• EcoPlanet Bamboo
• Green World Ventures
• Permian Global
• Terra Global Capital
• Form International
• NatureVest
Technical
• NEPAD Agency
• GIZ
• Green Belt Movement
• FAO
• ICRAF
• IUCN
• Jane Goodall Institute
• Clinton Foundation
• Kijani
• LPFN
• TNC
• WRI
13 countries41m hectares
$1.02bn development finance$545m impact investment 11 technical partners

• Core partners:– NEPAD Agency– BMZ– WRI
• Ambitious continental target of 100 million hectares by 2030– Formally adopted by the African Union– 31 million hectares from 10 countries committed at COP21
• Support committed thus far:– 1 multilateral bank (World Bank)– 7 impact investors (Moringa Partnership, Permian Global,
NatureVest, EcoPlanet Bamboo, Green World Ventures, Terra Global Capital, Form International)
– 11 technical partners (NEPAD, WRI, FAO, Clinton Foundation, IUCN, TNC, FAO, ICRAF, Jane Goodall Institute, LPFN, Kijani, The Greenbelt Movement)
AFR100
16
42.00
3.19 1.52
35.7632
5.0596 5.6064
2.9252
0.1191 1.8893
29.8368
9.496
50.4353
0
20
40
60
80
100
120
FOREST ESTATE CONVERTIBLE FORESTS NON-FOREST ESTATE
Mill
ions
HUTAN PRIMER
SECONDARY FOREST
PLANTATION FORESTS
NON-FORESTED
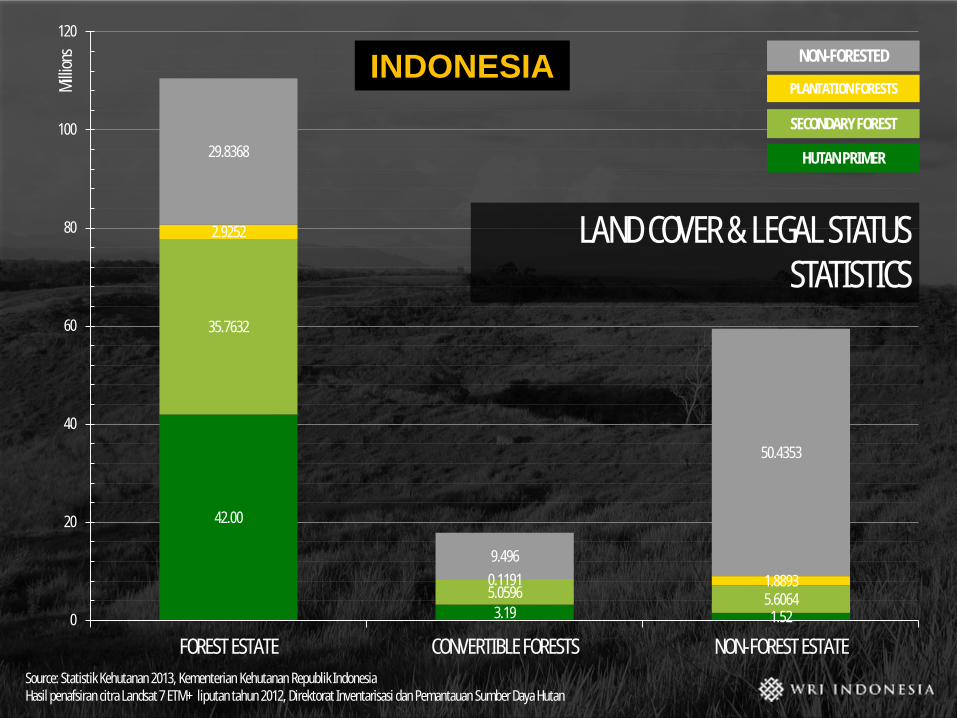
Source: Statistik Kehutanan 2013, Kementerian Kehutanan Republik IndonesiaHasil penafsiran citra Landsat 7 ETM+ liputan tahun 2012, Direktorat Inventarisasi dan Pemantauan Sumber Daya Hutan
LAND COVER & LEGAL STATUS STATISTICS
INDONESIA

42.00
3.19 1.52
35.7632
5.0596 5.6064
2.9252
0.1191 1.8893
29.8368
9.496
50.4353
0
20
40
60
80
100
120
FOREST ESTATE CONVERTIBLE FORESTS NON-FOREST ESTATE
Mill
ions
HUTAN PRIMER
SECONDARY FOREST
PLANTATION FORESTS
NON-FORESTED
Source: Statistik Kehutanan 2013, Kementerian Kehutanan Republik IndonesiaHasil penafsiran citra Landsat 7 ETM+ liputan tahun 2012, Direktorat Inventarisasi dan Pemantauan Sumber Daya Hutan
• 29 mil Ha non-forested area within forest estate
• Not allowed to be used for non-forestry activities
• 14 mil Ha forested area within non-forest estate
• Prone to be deforested and converted to non-forest land

42.00
3.19 1.52
35.7632
5.0596 5.6064
2.9252
0.1191 1.8893
29.8368
9.496
50.4353
0
20
40
60
80
100
120
FOREST ESTATE CONVERTIBLE FORESTS NON-FOREST ESTATE
Mill
ions
HUTAN PRIMER
SECONDARY FOREST
PLANTATION FORESTS
NON-FORESTED
Source: Statistik Kehutanan 2013, Kementerian Kehutanan Republik IndonesiaHasil penafsiran citra Landsat 7 ETM+ liputan tahun 2012, Direktorat Inventarisasi dan Pemantauan Sumber Daya Hutan
CONSERVATION EFFORTS

42.00
3.19 1.52
35.7632
5.0596 5.6064
2.9252
0.1191 1.8893
29.8368
9.496
50.4353
0
20
40
60
80
100
120
FOREST ESTATE CONVERTIBLE FORESTS NON-FOREST ESTATE
Mill
ions
HUTAN PRIMER
SECONDARY FOREST
PLANTATION FORESTS
NON-FORESTED
Source: Statistik Kehutanan 2013, Kementerian Kehutanan Republik IndonesiaHasil penafsiran citra Landsat 7 ETM+ liputan tahun 2012, Direktorat Inventarisasi dan Pemantauan Sumber Daya Hutan
RESTORATION EFFORTS
?