Embed Size (px)
Citation preview

PROSPECT OF IN-HOUSE RECYCLING OF GRAY
WATER
ABU SALEH MOHAMMAD WAHEDUL HAQUE
DEPARTMENT OF CIVIL ENGINEERING
BANGLADESH UNIVERSITY OF ENGINEERING AND TECHNOLOGY. DHAKA.

i
PROSPECT OF IN-HOUSE RECYCLING OF GRAY WATER
BY ABU SALEH MOHAMMAD WAHEDUL HAQUE
DEPARTMENT OF CIVIL ENGINEERING BANGLADESH UNIVERSITY OF ENGINEERING AND TECHNOLOGY,
DHAKA.
DECEMBER 2010

ii
PROSPECT OF IN-HOUSE RECYCLING OF GRAY WATER
BY ABU SALEH MOHAMMAD WAHEDUL HAQUE
A thesis submitted to the Department of Civil Engineering of Bangladesh University of Engineering and Technology, Dhaka, in partial
fulfillment of the requirements for the degree of
MASTER OF SCIENCE IN CIVIL ENGINEERING (ENVIRONMENTAL)
DECEMBER 2010

iii
The thesis titled PROSPECT OF IN-HOUSE RECYCLING OF GRAY WATER Submitted by ABU SALEH MOHAMMAD WAHEDUL HAQUE Roll No.: 040304503 (P) Session APRIL-03 has been accepted as satisfactory in partial fulfillment of the requirement for the degree of M.Sc. in Civil and Environmental Engineering.
BOARD OF EXAMINERS
Dr. Md. Abdul Jalil Professor Dept of Civil Engineering, BUET Dhaka-1000.
Chairman (Supervisor)
Dr. Md. Zoynul Abedin Professor & Head Dept of Civil Engineering, BUET Dhaka-1000.
Member (Ex-officio)
Dr. M Ashraf Ali Professor Dept of Civil Engineering, BUET Dhaka-1000.
Member
Mr. Shamsul Gafur Mahmud National Professional Officer World Health Organization DPHE Bhavan, Kakrail, Dhaka-1000.
Member (External)
December 2010
iv
DECLARATION
It is hereby declared that this thesis or any part of it has been submitted elsewhere for the award of any degree or diploma. December 2010 Abu Saleh Mohammad Wahedul Haque

v
ACKNOWLEDGEMENT
The author first acknowledges the blessing of Almighty Allah, the Beneficent, and
the Merciful for enabling him to complete this thesis successfully.
Secondly the author expresses his deepest and sincere gratitude and profound
indebtness to his supervisor Dr. M. A. Jalil Professor, Department of Civil
Engineering, BUET, for his constant supervision, continuous guidance,
encouragement and valuable suggestion at every stage of work.
The author is very grateful to all laboratory staff of Enviromental Engineering
Laboratory, BUET, Department of Civil Engineering, for their assistance during the
performance of the laboratory works and thanks to the staff of library of BUET, for
providing facility in using the library.
The author also wishes to convey honest gratefulness to S. K. Amzad Hossan
(Project Director), Hasan Kabir Khasru and Md. Shafiqur Rahman (Deputy Project
Director), and all the staff of STIFPP-2 Project LGED, for there help and support
during the thesis work.
The author acknowledges the sacrifice of his family that has enabled him to attain
this level. Heartfelt gratefulness extended to his Late mother Saleha Hoque and
father Md. Tafazzal Hoque for his continuous encouragement at every phase of this
study. Special thanks to Abu Saleh Mohammad Shahidul Haque, Khairunnahar
Ruby, Nilufa Parvin, Taslima Akhter, Farida Akhter, Tahmina Akhter, Sabira Tanjir
Tanha, Allah Hafiz, Abu Md Shahriar, Shahriar Mahmud Pavel for their invaluable
contribution, spirited encouragement in his thesis work.

vi
Abstract This thesis explored present Dhaka city’s situation in order to define the main factors surrounding gray water reuse in urban areas. Suitable treatment technologies that best address the defined gray water reuse factors were identified and clear, standardized and sustainable gray water reuse processes for their application were also established. The major objective of this study was to evaluate the viability of domestic reuse of gray water in Dhaka city for laundry and toilet flushing. The quantification of water uses for different domestic purposes was done mainly by questionnaire survey and by direct measurement in some cases. From the surveys the amount of gray water produced from households has been calculated. The quality of gray water generated from laundry, showers and basins was determined by laboratory analyses of representative samples. Turbidity, suspended solids, BOD, COD and Fecal Coliform (FC) of the collected samples were determined following standard procedure. The viability of reusing untreated gray water for toilet flushing was also evaluated. The treatment requirement of the gray water for in-house recycling for laundry and toilet flushing was determined by comparing its quality with the reuse criteria. A simple gray water treatment system for in-house recycling for laundry and toilet flushing was developed and its performance was tested. For quantification, the questionnaire survey was done on 100 families in different parts of Dhaka city. The average per capita water requirement was estimated at 150 l/day and the average of per capita gray water production was estimated at approximately 95 l/day. The average BOD5 values are 204, 65, 133, 108 and 13 mg/l; the average COD values are 270, 106, 200, 174 and 33 mg/l; the average turbidity values are 200, 98, 135, 86 and 1.5 NTU; the average FC values calculated are 3440, 2350, 2800, 2920 and 180 cfu/100 ml; the average S.S values calculated are 1296, 737, 978, 672 and 17 mg/l for black laundry water, mix laundry water, bath water, basin water and raw water respectively. The quality of gray water with respect to BOD, COD, Turbidity, S.S and F.C indicated that they are very high. But the results varied depending on methods used for washing, people’s choices of soap/detergent/shampoo use, the quantity of soap/detergent/ shampoo used, the time taken for washing or bathing, availability of water and amount of water used. The test results of tap water indicated that the fecal coliform content is very high and thus the quality of DWASA's supply water is very low. A treatment system that is acceptable to urban residents requires the storage of gray water and then simple treatment by disinfection, coagulation, flocculation, settling and sand filtration. The settling time is 30 minutes, optimum coagulant dose is determined 30 mg/l and optimum chlorine dose is determined 3mg/l.

vii
A simple bench scale treatment setup was established. Locally available materials were used to construct the experimental setup and it is very easy to use in household environment. The quality of the treated water sample has been compared with standards and criteria guidelines.
This study is targeted towards the building dwellers of Dhaka city having medium income status. This study is only a small step in forming a gray water management system. More studies considering technical feasibility, public health, social acceptability and sustainability should be undertaken. Skill and knowledge are the main concern for the installation and maintenance of gray water treatment systems. The long-term and broad implications of urban gray water systems are not yet fully understood and paramount to its acceptance is the protection of human health as well as community education and participation in community decision processes.
viii
CONTENTS
Page No.
Declaration iii Acknowledgement iv Abstruct v List of Tables x List of Figures xi
Chapter 1: INTRODUCTION
1.1 Background 2 1.2 Justification of the Study 3 1.3 Objectives of the Study 5 1.4 Methodology 6 1.5 Organization of the Thesis 7
Chapter 2: LITERATURE REVIEW
2.1 Introduction 8 2.2 Existing Water Crisis of Dhaka City 9 2.3 Existing Situation of Gray Water Reuse in the World 12 2.4 Gray Water Characteristics 15 2.4.1 What is Gray water 15 2.4.2 Gray water Quality 16 2.4.2.1 Microbial Quality 16 2.4.2.2 Chemical Quality 17 2.4.2.3 Physical Quality 17 2.5 Treatment 19 2.5.1 Coagulation and Flocculation 19 2.5.2 Chlorination 27 2.5.3 Sand Filtration 30 2.5.4 Urban Treatment 37 2.5.4.1 General Design Considerations 37 2.5.4.2 Technology-based Graywater Systems 38 2.5.4.3 Primary Treatment Systems 38 2.5.4.4 Secondary Treatment Systems 44 2.5.4.5 Tertiary Treatment Systems 47 2.5.4.6 Biological Treatment Systems 47 2.5.5 User-Defined Gray Water Systems 50 2.5.5.1 Single Dwellings 50

ix
2.5.5.2 Multi-dwellings 51 2.5.5.3 Community-Based 52 2.5.6 Gray Water Reuse Applications 53 2.5.6.1 Garden Watering/ Irrigation (External) Reuse Applications 53 2.5.6.2 Toilet Flushing/ Laundry Washing (Internal) Reuse Applications 56 2.5.6.3 Reusing Gray Water 58 2.6 Factors Affecting Gray Water Reuse 59 2.6.1 Political Factors 60 2.6.2 Social Factors 61 2.6.3 Environmental Factors 63
Chapter 3: QUANTIFICATION OF GRAY WATER
3.1 Introduction 67 3.2 Questionnaire Survey 67 3.2.1 Household Characteristics 68 3.2.2 Access to Hardware 69 3.2.3 Waste (Gray) Water Disposal 69 3.2.4 Level of Perception of the Risks 69 3.3 Questionnaire Survey Results on Different Parts of Dhaka City 70 3.3.1 Data Collection 70 3.3.2 Household’s Characteristics 70 3.3.3 Access to Hardware 71 3.3.4 Gray Water Production and Disposal 73 3.3.5 Level of Perception of the Risks 76 3.4 Conclusions 77
Chapter 4: CHARACTERIZATION OF GRAY WATER
4.1 Introduction 78 4.2 Testing of Gray Water Samples 78 4.2.1 Description of Gray Water Samples 78 4.3 Results and Discussion 79 4.3.1 Variation of BOD5 79 Results 4.3.2 Variation of COD Results 80 4.3.3 Variation of Turbidity Results 81 4.3.4 Variation of FC Results 82 4.3.5 Variation of Suspended Solids Results 83 4.3.6 Variation of BOD5 84 results Without Cleaning Agents 4.3.7 Variation of COD Results Without Cleaning Agents 85 4.3.8 Variation of Turbidity Results Without Cleaning Agents 86

x
4.3.9 Variation of F.C Results Without Cleaning Agents 87 4.3.10 Variation of S.S Results Without Cleaning Agents 88 4.4 Reusing Gray Water for Toilet Flushing and Laundry 89 4.5 Conclusions 91
Chapter 5: TREATMENT OF GRAY WATER
5.1 Introduction 93 5.1.1 Prepared Gray Water Sample 94 5.1.2 Preparation of Prepared Gray Water Sample 94 5.2 Determination of Chlorin and Coagulant Doses 96 5.2.1 Determination of Chlorin Dose 96 5.2.2 Determination of Coagulant Dose 97 5.3 Gray Water Treatment 99 5.4 Experimental Setup 100 5.5 Treatment Procedure 101 5.5.1 Treatment Procedure for Household Environment 102 5.5.2 Maintenance 103 5.5.3 Cost of Gray Water Treatment 103 5.5.4 User Acceptance 104 5.5.5 Recovery Rate 104 5.6 Results and Discussion 105 5.6.1 BOD5 105 Test Results Before and After Treatment 5.6.2 COD Test Results Before and After Treatment 107 5.6.3 Turbidity Test Results Before and After Treatment 108 5.6.4 F.C Test Results Before and After Treatment 110 5.6.5 S.S Test Results Before and After Treatment 112 5.7 Conclusions 114
Chapter 6: CONCLUSIONS AND RECOMMENDATIONS
6.1 General 116 6.2 Conclusion 116 6.3 Recommendation for further study 118
References
Appendix

xi
LIST OF TABLES Page
Table 2.1 Standards and criteria/guidelines for water reuse for toilet flushing and domestic water recycling (Surendum & Wheatly, 1998)
58
Table 3.1 Number of Family’s Surveyed in Different Areas 70
Table 3.2 Household characteristics 71
Table 3.3 Per capita water consumption per day 72
Table 3.4 Per capita gray water production per day 71
Table 5.1 Gray water production from household (All sources) 94
Table 5.2 Gray water production from household (Only laundry, bathing and basin) 95
Table 5.3 Prepared gray water sample 95
Table 5.4 Estimated cost of the household gray water treatment setup 103
Table 5.5 Cost of chemical per liter of treated water 104
Table 5.6 BOD5 105 test results before and after treatment
Table 5.7 COD test results before and after treatment 107
Table 5.8 Turbidity test results before and after treatment 108
Table 5.9 F.C test results before and after treatment 110
Table 5.10 S.S test results before and after treatment 112

xii
LIST OF FIGURES
Page
Figure 2.1 Graphical representation of DWASAs daily water demand water production in crore liters.(WASA, 2005)
11
Figure 2.2 Constituent parts of waste water (UNEP, 2000) 15
Figure 2.3 (a) Design consideration of conventional plants (Source: www.mrwa.com). 23
Figure 2.3 (b) Design consideration of conventional plants (Source: www.mrwa.com). 24
Figure 2.4 Simple gravity diversion (Van Dok, 2004) 39
Figure 2.5 Surge tank (Van Dok, 2004) 40
Figure 2.6 Primary treatment system with coarse filtration (Ludwing, 1994) 41
Figure 2.7 Soilbox design (Ludwing, 1994) 42
Figure 2.8 Secondary gray water treatment technology (Ludwing, 1994) 45
Figure 2.9 Rotating drum biological gray water treatment system (Thomas, 1997) 49
Figure 2.10 Mini-leach fields (Ludwig, 1994) 54
Figure 2.11 Gray water treatment sand filter arrangement (Ludwig, 1994) 55
Figure 2.12 Combined hand wash/ cistern system. 57
Figure 3.1 Per capita per day water consumption for different purposes at households 73
Figure 3.2 Gray water production from different sources of household per capita per day 75
Figure 3.3 Peoples perception towards gray water reuse 76
Figure 4.1 Graphical representation of BOD5 79 test results
Figure 4.2 Graphical representation of COD test results 80
Figure 4.3 Graphical representation of Turbidity test results 81
Figure 4.4 Graphical representation of FC test results 82
Figure 4.5 Graphical representation of S.S test results 83
Figure 4.6 Graphical representation of BOD5 84 test result without cleaning agents
Figure 4.7 Graphical representation of COD test result without cleaning agents 85
Figure 4.8 Graphical representation of turbidity test result without cleaning agents 86
Figure 4.9 Graphical representation of F.C test result without cleaning agents 87

xiii
Page
Figure 4.10 Graphical representation of S.S test result without cleaning agents 88
Figure 5.1 Simple design layout used for Gray water treatment 93
Figure 5.2 Determination of chlorine dose 96
Figure 5.3 Determination of chlorine dose for prepared gray water sample 97
Figure 5.4 Settling with time for prepared gray water sample 97
Figure 5.5 Determination of coagulant dose for prepared gray water sample 98
Figure 5.6 Simple Gray water treatment setup 100
Figure 5.7 Graphical representation of BOD5 105 test results before and after treatment
Figure 5.8 Graphical representation of COD test results before and after treatment 107
Figure 5.9 Graphical representation of turbidity test results before and after treatment 108
Figure 5.10 Graphical representation of FC test results before and after treatment 110
Figure 5.11 Graphical representation of S.S test results before and after treatment 112

1
1.1 Background
Chapter-1
INTRODUCTION
Rapid population growth in urban centers is creating enormous pressure on their
water supplies in the context of the scarcity of suitable freshwater resources and the
ever-increasing costs of the water supply systems. The problem is acute for Dhaka
city.
Water supply problem in some newly developed areas and some areas of the old city
is becoming more acute, because the existing facility of DWASA can not keep pace
with the growing demand for safe water supply. Both quantity of water produced
and water distribution facility are inadequate to serve the present population of the
city. The magnitude of the problem is greater during the extreme dry and hot season.
Most of the consumers do not get the required quantity of water.
The daily water demand for the city of about 9 million people is 165 crore liter at
present and will rise up to about 2.5 times by 2030 (IWM, 2007). DWASA demands
that it produces 144 crore liter daily (WASA, 2005). Currently, the physical leakage
in the water distribution system stands between 30-40% (IWM, 2007). The water
demand at the drought season grows roughly by 25%. Then the shortage becomes
about 100-120 crore liter daily. In the last 5 years, DWASA has managed to increase
the daily production by 3.5 crore by installing some deep tubewells. Due to poor
recharge of the aquifers of the city, heavy abstraction of the groundwater is causing
continuous declination at an alarming rate. As a result many deep tubewells have
become non-functional. DWASA is planning to augment the water supply by
implementing the second phase of Saidabad Surface Water Treatment Plant and by
establishing well fields outside the metropolitan area. Even after implementation of
these programs, water crisis will continue.
It has been reported that the daily gray water production from baths, showers, wash
basins and washing machines is about 56% of the total wastewater produced from

2
indoor uses (Almeida et al., 1999). Under the above circumstance, less polluted gray
water (wastewater from showers, basins and laundry) recycling in the individual
household will certainly reduce the pressure on the high-quality water supplies as it
is readily available throughout the year and lower grade of water can be used for
laundry and toilet flushing.
Many state governments of the world have already enacted their own interim
legislation and issued guidelines for gray water reuse in urban areas in response to
public opinion and their own rapidly depleting water sources (Surendran &
Wheatley, 1998). There is a general consensus from regulatory authorities that gray
water reuse guidelines must continue to protect human health, as per the traditional
guiding design philosophy for traditional centralized wastewater collection and
treatment systems. Identifying the likely effects and consequences of urban gray
water reuse guides the process of determining the most suitable technologies for
gray water treatment. The most effective and efficient treatment systems identified
then help to define and implement clear, standardized and sustainable processes for
gray water reuse. Current guidelines and policy frameworks now reflect another
evolutionary change through the inclusion of water recycling standards in urban
areas, of which gray water reuse systems can play an important role (Radcliffe,
2003).
1.2 Justification of the Study
At present no effective gray water treatment, recycle, reuse and management system
is available in Bangladesh. The selected study areas mainly constitute middle
income families of Dhaka City. No survey work has been done to determine
domestic gray water generation rates, its composition for any urban areas of
Bangladesh. In the drought season or when the water supply is acute some families
reuse the general gray water produced from laundry for toilet flushing and some
normally pour the laundry gray water in the garden to reuse. But most people neither
reuse gray water for any purpose nor have any idea that it can be reused. Some
people just do not like reusing gray water for aesthetic reasons.
3
This study and analysis can establish some important basic data, which will enable
one to design a cost –effective and socially acceptable future gray water
management system. The domestic gray water generation rate, total volume of gray
water, characteristics of gray water, treatment requirement, resource recovery and
recycling possibilities data will be determined.
The technologies that best address the factors that effect gray water reuse must
primarily consider the biological characteristics of gray water (Al-Jayyousi, 2003) in
order to ameliorate public health concerns. The level of treatment provided by gray
water reuse technologies will further vary according to the system’s scale and reuse
applications. Treatment technologies can be best described in either user-based or
technology-based terms.
The technology utilised in gray water reuse systems can be differentiated into
primary, secondary and tertiary levels (Jeppesen, 1994). These can then be further
characterised in terms of the number of users the gray water reuse system must
support (user-defined) and by their likely reuse applications.
Most of these technologies require considerable infrastructure and understanding to
operate. As most of the urban populations of Bangladesh obtain their water from
WASA/City Corporation/Pourasha, it is therefore necessary to develop a low-cost
simple technology that can be implemented on household levels to recycle and reuse
gray water, not for drinking or other necessary purposes but for household cleaning
works i.e. mainly for toilet flushing and gardening or irrigation.
Relative to wastewater gray water which is predominantly from bathroom and
laundry sources is high in dissolved solids (mostly salts) and turbidity, low in
nutrients and is likely to contain significant amounts of pathogens (Al-Jayyousi,
2003). The suspended solids that are present are mostly in the form of hair and lint
from bath and laundry waste (Jeppesen, 1996). If gray water is sourced from kitchen
wastewater it is likely to have a high BOD, high in organic suspended solids and
nutrients with low pH (Jeppesen, 1996). The reuse of gray water from bathroom and
laundry sources can be relatively simple for garden watering reuse applications up to
sophisticated treatments for toilet flushing and laundry applications. However,

4
treatment for kitchen wastewater will generally require more sophisticated
technologies and processes to address the high BOD and fatty solids generated (Al-
Jayyousi, 2003). In order to primarily address the likelihood of high pathogen
contamination and hence public health concerns, gray water must either be
disinfected or disposed of in a manner that does not allow human contact (Jeppesen,
1996). For gray water reuse applications where disposal only involves garden
watering, sub-surface irrigation systems would remove the possibility of human
contact and therefore reduce the level of treatment required (CSIRO, 2004).
However, if gray water reuse involved toilet flushing and/ or laundry water
applications disinfection would be required as there is a possibility for human
contact (Jefferson, 1998).
Finally, all gray water reuse systems must be connected to the centralised sewer
collection system as a precaution. If the gray water reuse system malfunctions or if
maintenance is to be carried, the system must be capable of being manually or
automatically diverted to the sewer line. This would avoid an unlikely event where
the gray water is not collected and disposed off which would increase the risk of
human contact and threaten public health.
However, there is still a need to develop design and operating criteria for an
effective field deployable household/community level treatment and delivery
system. Various factors such as gray water quality, volume, generation rate,
treatment procedure, recycle and reuse processes, disposal method and finally
people’s perception and acceptance influence gray water management system.
Knowledge on the effects of these factors on gray water management system needs
to be studied to develop design and operating criteria for an effective treatment
system for use at community and household levels.

5
1.3 Objectives of the Study
The major objective of this study is to evaluate the viability of domestic reuse of
gray water in Dhaka city for laundry and toilet flushing.
The specific objectives of this study are as follows:
• To quantify the classified uses of the supplied water in residential houses.
• To determine the quality of the gray water generated from showers, laundry
and basins.
• To evaluate the prospect of reusing untreated gray water for toilet flushing.
• To develop and test a simple gray water treatment system for in-house
recycling for laundry and toilet flushing.

6
1.4 Methodology
A brief description of the procedures followed in order to achieve the above-
mentioned objectives of the research is outlined below.
• The quantification of water uses for different domestic purposes was done
mainly by questionnaire survey and by direct measurement in some cases.
• The quality of gray water generated from laundry, showers and basins was
determined by laboratory analyses of representative samples. Turbidity,
suspended solids, BOD, COD, Total Coliform (TC) and Fecal Coliform (FC)
of the collected samples were determined following standard procedure.
• The possibility of reusing the untreated gray water generated from laundry
for toilet flushing was evaluated considering the quantity and quality of the
gray water.
• The treatment requirement of the gray water for in-house recycling for
laundry and toilet flushing was determined by comparing its quality with the
reuse criteria.
• A simple system for the gray water treatment was proposed based on the
treatment requirement of the gray water. Then a small scale treatment plant
was installed in Environmental Engineering Laboratory of Civil Engineering
Department, BUET and it was operated to evaluate its performance.
7
1.5 Organization of the Thesis
This thesis presents literature review, data collection method, data analysis and
findings of study in six chapters with appendixes. In addition a bibliography of
related publications has been presented. A brief description of the chapters is given
below.
Chapter 1. Introduction: This chapter explains the background and present state
of the problem, justification of the study, objectives and methodology of the study.
Chapter 2. Literature Review: The topics discussed in this chapter are the
existing situation of gray water reuse in the world, gray water characteristics, gray
water quality, gray water treatment and reuse processes and factors affecting gray
water reuse.
Chapter 3. Quantification of Gray Water: In this chapter the methodology for
quantifying the water use for different purposes in residential building are described
and peoples perception towards gray water reuse is also evaluated.
Chapter 4. Characterization of Gray Water: This chapter presents the quality of
different types of gray water determined by laboratory analysis and results are
discussed in detail.
Chapter 5. Treatment of Gray Water: This chapter describes the treatment
procedure and the simple system used for the treatment of domestic gray water. The
quality of the treated water is compared with the original samples.
Chapter 6. Conclusions and Recommendations: This chapter contains the major
conclusions of the study and provides a number of recommendations for future
study.

8
2.1 Introduction
Chapter-2
LITERATURE REVIEW
Gray water (wastewater from showers, basins, laundry, and possibly kitchen) can be
effectively and efficiently recycled for non-potable reuse applications such as
industrial, irrigation, toilet flushing and laundry washing depending on the
technologies utilized in the treatment process. Gray water recycling offers reductions
in urban potable water demand up to 30% - 70% (Radcliffe, 2003).
Gray water reuse offers indirect benefits to public infrastructure in the form of
reduced sewage flows, reduced treatment plant size, shorter distribution systems,
reduced potable water demand and can help to prolong the need for additional
potable water sources. Also, the economic benefits of gray water recycling in
relation to potable water savings are obscured by current non-transparent and
subsidized pricing mechanisms (Radcliffe, 2003).
Many country & state governments have already enacted their own interim
legislation and issued guidelines for gray water reuse in urban areas in response to
public opinion and their own rapidly depleting water storages. There is a general
consensus from regulatory authorities that gray water reuse guidelines must continue
to protect human health, as per the traditional guiding design philosophy for
traditional centralized wastewater collection and treatment systems. Identifying the
likely effects and consequences of urban gray water reuse, guide the process of
determining the most suitable treatment technologies. The most effective and
efficient treatment systems identified then help to define and implement clear,
standardized and sustainable processes for gray water reuse.
Economic factors are important for implementing gray water reuse systems
however, the social and environmental costs are also very important as the current
water shortages in many capital cities are alarming. The likely consequences from
indirect social and environmental costs of gray water reuse as well as externalities

9
are mostly identifiable, but largely unquantifiable at this stage, especially in
economic terms. As a result any cost benefit analysis for gray water reuse systems is
relatively incomplete. However there is consensus that any realization of these costs
would generally favor the economic case for gray water reuse in urban areas
(Jefferson, 1998).
Gray water is characterized as a dilute form of wastewater and makes up 68% of the
total domestic wastewater (Emmerson, 1998). It is distinguished from black water
by having high inorganic loads, low nutrients with low pathogenic bacterial
contamination, lighter gray color and has a sweeter smell (Al-Jayyousi, 2003). Gray
water quality is highly variable depending on the household’s social preferences (Al-
Jayyousi, 2003). The comparison of gray water with waste water quality indicates a
relatively low contamination of gray water (Beavers, 1995) and therefore lower
treatment requirements. Additionally, the relatively high proportion of gray water
generated shows a large potential source for water savings by reuse systems.
2.2 Existing Water Crisis of Dhaka City
The population of Dhaka city is growing rapidly. According to DWASA the
population of Dhaka city was 8.5 lac in 1963 (WASA, 2005) and at 2005 it was
121.5 lac. This growing population implies increasing demands for basic city
services - the most important one being the demand for a safe and reliable water
supply. Currently this growing demand is being met primarily by pumping water
from the local aquifers. However, the groundwater reserve is rapidly declining and
the progress in tapping surface water sources has been very slow. In other words, the
looming threat of a serious water crisis in the city is becoming a real one with each
passing day.
Water supply problems in some newly developed areas and some areas of the old
city are becoming more acute, because the existing facilities of DWASA can not
keep pace with the growing demand for safe water supply. Both quantity of water
produced and water distribution facility are inadequate to serve the present
population of the city. The magnitude of the problem is greater during the extreme
dry and hot season. Most of the consumers do not get the required quantity of water.

10
At the start of the hot and dry season there is water crisis in many areas of the capital
Dhaka. By a recent statistics of WASA the daily water shortage is 50Cr liter
(DWASA, 2005), but for this they accuse the irregular electricity supply. Due to the
fact that DWASA’s water supply is not up to the demand, many buildings in Dhaka
have a water pump tapped in the street water main and at the time of water crisis
they use this pump to fill their underground water reservoir to get water to meet their
need.
At one hand there is insufficient water supply, on the other hand the supplied water
is dirty and polluted at many areas. The people there are using this water
unwillingly. This causes serious health hazard for the residents. People in these areas
are suffering from skin and waterborne diseases.
Dhaka WASA is trying there best to meet the growing demand, fighting with old
pipe networks and wastage of supplied water through leakage in the system.
DWASA is abstracting water by 426 deep tube wells. The position of 18 wells is
deeper. Load shedding and low voltage of electricity does not permit the pumps to
work to their proper capacity.
The water demand is rapidly increasing and the productions of the existing wells are
decreasing with the lowering water level. In the coming years the demand will
surpass the production greatly. To abate this government doesn’t have any realistic
plans. Without establishing a few deep tube wells there are no other big steps taken
in the last five years.

11
0
50
100
150
200
250
1970
1980
1990
1996
1997
1998
1999
2000
2001
2002
2003
2004
2005
Cror
e Li
tres
Year
Water demand
Water produced
Figure 2.1: Graphical representation of DWASAs daily water demand water production in crore liters.(WASA, 2005)
The daily water demand for the city of about 9 million people is 165 crore liter at
present and will rise up to about 2.5 times by 2030 (IWM, 2007). DWASA demands
that it produces 144 crore liter daily (WASA, 2005). Currently, the physical leakage
in the water distribution system stands between 30-40% (IWM, 2007). The water
demand at the drought season grows roughly by 25%. Then the shortage becomes
about 100-120 crore liter daily. Besides this the water demand is increasing by 5% to
6% with the growing population every year. In the last 5 years, DWASA has
managed to increase the daily production by 3.5 crore liter by installing some deep
tubewells. Due to poor recharge of the aquifers of the city, heavy abstraction of the
groundwater is causing continuous declination at an alarming rate. As a result many
deep tubewells have become non-functional. DWASA is planning to augment the
water supply by implementing the second phase of Saidabad Surface Water
Treatment Plant and by establishing well fields outside the metropolitan area. Even
after implementation of these programs, water crisis will continue.
12
2.3 Existing Situation of Gray Water Reuse in the World
The main applications for gray water reuse are garden and park irrigation (external
uses) as well as toilet flushing and laundry (internal uses). Household gray water
systems that reuse gray water for toilet flushing and/ or laundry water must utilize a
treatment process that includes coarse suspended solid removal, turbidity reduction
and disinfection (Al-Jayyousi, 2003). Gray water reuse has been practiced in rural
areas where there are no centralized sewerage systems for many decades in Australia
and overseas. The systems used were usually simple crude designs used to irrigate
the landscape (Jeppesen, 1996). Gray water reuse systems in urban areas have been
used under the regulation of plumbing codes in the United States of America since
the 1990’s. This was in response to abating severe future water shortages in areas
such as California and Florida (Jeppesen, 1996) and they are in similar
circumstances under which Australia is now legalizing gray water reuse in urban
areas. Likewise in Japan, but more in response to the increased rates of urbanization
and population growth, gray water reuse systems have been in use for multi-
dwelling buildings since 1990’s. The promotion of wastewater reuse at policy level
and establishment of technical guidelines marks a change in the traditional view of
wastewater as being a waste and consequently is now being recognized as a resource
and a source of opportunity (Radcliffe, 2003).
Indeed wastewater is now noted as the only water resource that increases with urban
development and planning and design principles are beginning to embrace this as a
sustainable resource to reduce the ecological footprint of urban development
(Gardner, 2003). Many authorities have included gray water reuse systems into
overall water and resource planning strategies such as Water Sensitive Urban Design
(WSUD) which is an integral part of overall urban design and new development
planning (Melbourne Water, 2004). Under WSUD, gray water reuse systems are
investigated at the on-site and neighborhood unit levels and are seen as a tool for
conserving water use along with pollution control systems that include landscape
design and storm water reuse i.e. rainwater tanks (Melbourne Water, 2004). At the
neighborhood unit level, gray water can be collected via a storm water drainage
13
system, treated and re-distributed back to neighborhood homes for garden water use.
These systems are called Third Pipe systems.
Gray water comprises between 68% of total household wastewater on average
(Emmerson, 1998) and presents the largest potential source of water savings in
domestic residences. Most of the gray water systems proposed in urban areas are
closed-loop processes. That is, gray water is managed and reused in a decentralised
way within a household, neighbourhood or community (Al-Jayyousi, 2003). Gray
water systems are assessed in terms of technical feasibility, public health, social
acceptability and sustainability and these are reflected in Government policy and
guidelines. These criteria can be further contextualised into an environmental
framework of social, political and environmental factors.
Gray water has a constant supply and its reuse can provide water saving
opportunities that could lead to postponement of traditional planning techniques
such as building new dams and catchment diversion projects (Gardner, 2003). Gray
water reuse at individual, neighbourhood and community scales offers simpler and
more cost effective solutions (Ludwig, 1999) for Government water saving
initiatives as they strive for policies that encourage more sustainable use of
resources. Whilst there are no reported cases of human illness or disease directly
attributable to gray water reuse (Emmerson, 1998), the limited studies investigating
the levels of micro-biological contamination of gray water indicates the potential for
human infection is high. Also, the traditional centralised sewer collection and
treatment system that is currently used was successfully designed to protect human
health. On-site reuse of gray water marks a departure from this centralised health-
driven system and so attracts legitimate public concern. Additionally, the sensitive
public health concerns over gray water reuse systems make them vulnerable to wider
and more negative publicity caused from any specific health-related accidents
(Radcliffe, 2003). However, no such incidents have been reported to date
(Emmerson, 1998).
There is a higher acceptance for non-potable reuse applications for wastewater
(Radcliffe, 2003) and studies in the USA indicate greater acceptance as the degree of

14
human contact decreases (Marks, 2004). Also, these studies indicated that when
options for reuse are evaluated by the community, the most important factors in
order of priority are;
• Human health,
• The environment,
• Conservation,
• Treatment costs, and
• Distribution costs (mainly for third pipe systems). (Marks, 2004)
Decentralisation of the traditional wastewater collection and separate disposal
system is caused by using on-site gray water treatment systems in urban areas. As a
result, reusing gray water within the same space as it is generated highlights the
environmental consequences of user’s social habits directly (Al-Jayyousi, 2003).
Government gray water reuse guidelines also highlight and reinforce these
precautions. Therefore users must scrutinise the environmental effects of the
products and chemicals that they use as they become more environmentally aware
and responsible for their actions. This could have a flow-on effect to manufacturers
and businesses as consumer habits begin to change.
However, if gray water is used to substitute garden irrigation it is debatable whether
it will actually reduce overall water consumption habits. There are no studies to
investigate this area at present. The reduction in potable water demand generally
would contribute to postponing the requirement for developing new water sources
(Hunter, 2004). This is usually quantified in terms of extending the time by which
future new developments can be undertaken without an increase in public water
source and headworks infrastructure. Also, although the costs of the technologies
associated with gray water reuse systems have reduced considerably, further cost
savings may be realised in reduced or postponed public infrastructure and if the true
cost of potable water supply is realised (PWC, 2000).
Gray water is generally generated from domestic activities such as cooking, bathing,
doing the laundry and house cleaning. In low-income peri-urban communities
especially, existing practices consist of the unsafe disposal of gray water onto the

15
ground in their premises. The resulting surface ponds and gray water run-off often
add to an inefficient solid waste management system to endanger health or to create
environmental hazards (Salukazana et al., 2006).
2.4 Gray Water Characteristics
2.4.1 What is Gray Water?
Domestic wastewater consists of black water and gray water as shown in Figure 2.2 below.
Figure 2.2: Constituent parts of wastewater (UNEP, 2000)
Blackwater describes the sewage toilet waste and this form of wastewater is
collected via the sewer drain connection in urban areas and treated at centralised
wastewater treatment plants. Black water is characterised by having a very high
pathogenic bacterial contamination, high organic loads and nutrients, dark in colour
and foul smelling (Al-Jayyousi, 2003).
Gray water consists of other domestic sources such as the laundry and laundry sink,
bath and shower wastewater. The kitchen sink and dishwasher wastewater should
strictly be included with gray water; however this form of gray water usually
contains relatively higher organic nutrients and higher BOD loadings (Al-Jayyousi,
2003). This in turn significantly increases the treatment requirements of gray water
reuse systems.
16
Gray water is characterised as a dilute form of wastewater and makes up 68% of the
total domestic wastewater (Emmerson, 1998). It is distinguished from blackwater by
having high inorganic loads, low nutrients with low pathogenic bacterial
contamination, lighter gray colour and has a sweeter smell (Al-Jayyousi, 2003).
Gray water quality is highly variable depending on the household’s social
preferences (Al-Jayyousi, 2003).
2.4.2 Gray water Quality
Gray water quality is usually governed by the use of soap or soap products with
water for body and laundry washing. The quality and quantity of these contaminants
are highly variable and depend on the user’s social and product preferences,
geographical location, demographics and level of occupancy of the dwelling (Al-
Jayyousi, 2003).
The organic concentration of gray water is similar to wastewater; however their
chemical nature is different. Also gray water is relatively low in suspended solids
indicating that the contaminants are predominantly dissolved (Al-Jayyousi, 2003).
2.4.2.1 Microbial Quality
The presence of potentially harmful micro-organisms is indicated by measuring for
the faecal coliform group and more specifically E. Coli bacteria. These micro-
organisms indicate the presence of intestinal pathogens such as Salmonella or enteric
viruses and are used as a pollution indicator or safety factor (Emmerson, 1998 p13).
A high E. Coli count in a gray water sample indicates that there is a greater chance
of developing human illness from contact with gray water. However, a low E. Coli
count does not imply that there are no harmful micro-organisms present. E. Coli is
used as an indicator micro-organism only and other harmful micro-organisms may
still be present but not measured. They include other bacteria, viruses, protozoa and
Helminths (parasitic worms).
In specific studies of household gray water quality, shower water has faecal coliform
counts as high as 6000 colony forming units (cfu) per 100mL (Rose et al. 1991) and

17
bathroom water generally was found to contain up to 3300 most probable number
(MPN) cfu’s (Christova-Boal et al. 1995).
2.4.2.2 Chemical Quality
The COD: BOD ratio of gray water may be as high as 4:1, which is higher than
wastewater and is due to the low macro-nutrient (phosphorous and nitrogen) levels.
To further reinforce this the COD:NH3
2.4.2.3 Physical Quality
:P ratio for gray water has been measured at
1030: 2.7: 1 compared with 100: 5: 1 for wastewater, which also indicates relatively
low values of biodegradable organic matter in gray water (Jefferson et al. 1999).
The likelihood of high COD: BOD ratios in gray water along with the predominant
use of soaps and detergents in bath and laundry indicate a high concentration of
dissolved solids such as salts. Most of these will not be removed from gray water
before reuse unless treated to a relatively high standard.
Although low in suspended solids, hair and lint are common suspended solids in
gray water that is collected from laundry and bathroom sources and can potentially
foul treatment processes.
The use of mostly alkaline soaps and detergents can also greatly affect the pH of
gray water. The diversity of the products used varies the impact on pH and this also
depends on the social choices of the household. Similar to addressing the level of
dissolved solids, the high pH cannot be corrected without acid treatment. Therefore
gray water is generally discharged to the garden or park without treatment and the
soil treats the gray water.
Although the quality of gray water is highly variable, the possibility of significant
microbial contamination ensures that gray water reuse systems must strive to avoid,
minimise or abate human contact.
The generally low nutrient loads will limit biological treatment solutions (especially
for small systems) and the high dissolved solids content will require closer scrutiny
18
of their effect within the treatment process and on the soils and environment upon
which gray water is discharged (Al-Jayyousi, 2003). Suspended solids such as hair
and lint pose problems for gray water reuse systems involving pumps and drip
irrigation systems and must be filtered (Ludwig, 1994).
Following is a comparison of typical household wastewater and gray water
(Beavers, 1995):
• 63% of BOD load;
• 39% of the suspended solids load;
• 18% of the nitrogen;
• 70% of the phosphorous;
• 65% of the wastewater flow.
The comparison of gray water with wastewater quality indicates a relatively low
contamination of gray water (Beavers, 1995) and therefore lower treatment
requirements. Additionally, the relatively high proportion of gray water generated
shows a large potential source for water savings by reuse systems.
The main applications for gray water reuse are garden and park irrigation (external
uses) as well as toilet flushing and laundry (internal) use. Household gray water
systems that reuse gray water for toilet flushing and/ or laundry water must utilise a
treatment process that includes coarse suspended solid removal, turbidity reduction
and disinfection (Al-Jayyousi, 2003).
19
2.5 Treatment
The most simple and cost affective gray water treatment procedure for in-house
recycling is chlorination, coagulation and sand filtration to remove bacterial
substances and suspended solids. The process fundamentals of how this
Coagulation, Flocculation, Chlorination and Sand filtration tests helps to treat water
is given below.
2.5.1 Coagulation and Flocculation All waters, especially surface waters, contain both dissolved and suspended
particles. Coagulation and flocculation processes are used to separate the suspended
solids portion from the water.
The suspended particles vary considerably in source, composition charge, particle
size, shape, and density. Correct application of coagulation and flocculation
processes and selection of the coagulants depend upon understanding the interaction
between these factors. The small particles are stabilized (kept in suspension) by the
action of physical forces on the particles themselves. One of the forces playing a
dominant role in stabilization results from the surface charge present on the
particles. Most solids suspended in water possess a negative charge and, since they
have the same type of surface charge, repel each other when they come close
together. Therefore, they will remain in suspension rather than clump together and settle
out of the water.
Working Processes
Coagulation and flocculation occur in successive steps intended to overcome
the forces stabilizing the suspended particles, allowing particle collision and
growth of floc. If step one is incomplete, the following step will be
unsuccessful.
The first step destabilizes the particle’s charges. Coagulants with charges
opposite those of the suspended solids are added to the water to neutralize
the negative charges on dispersed non-settlable solids such as clay and color-
Coagulation

20
producing organic substances. Once the charge is neutralized, the small
suspended particles are capable of sticking together. The slightly larger
particles formed through this process and called microflocs, are not visible to
the naked eye. The water surrounding the newly formed microflocs should
be clear. If it is not, all the particles’ charges have not been neutralized, and
coagulation has not been carried to completion. More coagulant may need to
be added. A high-energy, rapid-mix to properly disperse the coagulant and
promote particle collisions is needed to achieve good coagulation. Over-
mixing does not affect coagulation, but insufficient mixing will leave this
step incomplete. Coagulants should be added where sufficient mixing will
occur. Proper contact time in the rapid-mix chamber is typically 1 to 3
minutes.
Coagulation Theory
In water treatment plants, chemical coagulation is usually accomplished by
the addition of trivalent metallic salts such as Al2(SO4)3 (aluminum sulfate)
or FeCl3
Ionic layer compression
(ferric chloride).Although the exact method by which coagulation is
accomplished cannot be determined, four mechanisms are thought to occur.
These include :
Adsorption and charge neutralization
Sweep coagulation
Inter-particle bridging
The quantity of ions in the water surrounding a colloid has an effect on the
decay function of the electrostatic potential. High ionic concentration
compresses the layers Prepared predominately of counter ions toward the
surface of the colloid. If this layer is sufficiently compressed, then the vander
waals force will be predominant across the entire area of influence, so that
the net force will be attractive and no energy barriers will exit. Although
Ionic Layer Compression

21
coagulation such as aluminium and ferric salts used in water treatment
ionize, at the concentration commonly used they would not increase the ionic
concentration sufficiently to affect ion layer compression.
Adsorption Charge Neutralization
The nature and rather than the quantity of the ions of prime importance in the
theory of adsorption and charge neutralization. Although aluminium sulphate
(alum) is used as in the example below, ferric chloride behaves similarly.
The ionization of aluminium sulphate in water produces sulphate anions
(SO42-) and aluminium cataions (Al3+). The sulfate ion may remain in this
from or combine with other cations. However, the Al3+ cataions react
immediately with to form a variety of aquometallic ions and hydrogen.
The aquometallic ions thus formed become part of the ionic cloud
surrounding the colloid and, because they have a great affinity for surfaces,
are adsorbed onto the surface of the colloid where they neutralize the surface
charge. Once the surface charge has been neutralized, the ionic cloud
dissipater, and the electrostatic potential disappears so that contact occurs
freely. Overdosing with coagulants can result in restabilizing the suspension.
If enough aquometallic ions ate formed and adsorbed, the charges on the
particles become reversed and the ionic clouds reform with negative ions
being the counter ions.
Sweep Coagulation
The last product formed in the hydrolysis of alum is aluminium hydroxide,
Al (OH)3. The Al (OH) 3 forms in amorphous, gelatinous flocs as it is
formed, or they may become enmeshed by it sticky surface as the flocs settle.
The process by colloids are swept from suspension in this manner is known
as sweep coagulation.

22
Inter-particle Bridging
Large molecules may be formed when aluminium or ferric salts dissociate in
water. Although lager ones are probably formed also synthetic polymers may
be used or branched and are highly surface reactive. Thus, several colloids
may become attached to one polymer and several of the polymer colloid
groups may become enmeshed resulting in settlable mass.
Flocculation
Following the first step of coagulation, a second process called flocculation
occurs. Flocculation, a gentle mixing stage, increases the particle size from
submicroscopic microfloc to visible suspended particles. The microflocs are
brought into contact with each other through the process of slow mixing.
Collisions of the microfloc particles cause them to bond to produce larger,
visible flocs called pinflocs. The floc size continues to build through
additional collisions and interaction with inorganic polymers formed by the
coagulant or with organic polymers added. Macroflocs are formed. High
molecular weight polymers, called coagulant aids, may be added during this
step to help bridge, bind, and strengthen the floc, add weight, and increase
settling rate. Once the floc has reached it optimum size and strength, the
water is ready for the sedimentation process. Design contact times for
flocculation range from 15 or 20 minutes to an hour or more.
Operational Considerations
Flocculation requires careful attention to the mixing velocity and amount of
mix energy. To prevent the floc from tearing apart or shearing, the mixing
velocity and energy input are usually tapered off as the size of the floc
increases. Once flocs are torn apart, it is difficult to get them to reform to
their optimum size and strength. The amount of operator control available in
flocculation is highly dependent upon the type and design of the equipment.

23
Figure 2.3(a): Design consideration of conventional plants
(Source: www.mrwa.com).

24

25
Figure 2.3(b): Design consideration of Conventional plants
(Source: www.mrwa.com).
Retention or detention time is the theoretical time in minutes that water
spends in a process. It is calculated by dividing the liquid volume, in gallons,
of a basin by the plant flow rate in gallons per minute. Actual detention time
in a basin will be less than the theoretical detention time because of “dead
areas” and short circuiting, which could be due to inadequate baffling.
Retention time = basin volume (gallons)
gpm flow
The rise rate is calculated by dividing the flow in gallons per minute by the
net upflow area of the basin in square feet.
Rise Rate = gpm flow
surface area
The choice of coagulant chemical depends upon the nature of the suspended
solid to be removed, the raw water conditions, the facility design, and the
Coagulant Selection:

26
cost of the amount of chemical necessary to produce the desired result. Final
selection of the coagulant (or coagulants) should be made following
thorough jar testing and plant scale evaluation. Considerations must be given
to required effluent quality, effect upon down stream treatment process
performance, cost, method and cost of sludge handling and disposal, and net
overall cost at the dose required for effective treatment.
Inorganic Coagulants
Inorganic coagulants such as aluminum and iron salts are the most
commonly used. When added to the water, they furnish highly charged ions
to neutralize the suspended particles. The inorganic hydroxides formed
produce short polymer chains which enhance microfloc formation. Inorganic
coagulants usually offer the lowest price per pound, are widely available,
and, when properly applied, are quite effective in removing most suspended
solids. They are also capable of removing a portion of the organic precursors
which may combine with chlorine to form disinfection by-products. They
produce large volumes of floc which can entrap bacteria as they settle.
However, they may alter the pH of the water since they consume alkalinity.
When applied in a lime soda ash softening process, alum and iron salts
generate demand for lime and soda ash. They require corrosion-resistant
storage and feed equipment. The large volumes of settled floc must be
disposed of in an environmentally acceptable manner.
Inorganic Coagulant Reactions
Common coagulant chemicals used are alum, ferric sulfate, ferric chloride,
ferrous sulfate, and sodium aluminate. The first four will lower the alkalinity
and pH of the solution while the sodium aluminate will add alkalinity and
raise the pH. The reactions of each follow:
ALUM
A12(SO
4)
3 + 3 Ca(HCO
3)
2 ------------> 2 Al(OH)
3 + 3CaSO
4 + 6
CO2
Aluminum + Calcium gives Aluminum + Calcium + Carbon
Sulfate Bicarbonate Hydroxide Sulfate Dioxide

27
(already in the water to treat) FERRIC SULFATE
Fe
2(SO
4)
3 + 3 Ca(HCO
3)
2 ------------> 2 Fe(OH)
3 + 3CaSO
4 +
6 CO2
Ferric + Calcium gives Ferric + Calcium + Carbon Sulfate Bicarbonate Hydroxide Sulfate Dioxide (present in the water to treat) FERRIC CHLORIDE 2 Fe Cl
3 + 3 Ca(HCO
3)
2 ------------> 2 Fe(OH)
3 + 3CaCl
2 +
6CO2
Ferric + Calcium gives Ferric + Calcium + Carbon Chloride Bicarbonate Hydroxide Chloride Dioxide (present in the water to treat) FERROUS SULFATE FeS0
4 + Ca(HCO
3)
2 ------------> Fe(OH)
2 + CaS04 +
2CO2
Ferrous + Calcium gives Ferrous + Calcium + Carbon
Sulfate Bicarbonate Hydroxide Sulfate Dioxide
(present in the water to treat) SODIUM ALUMINATE 2 Na
2A1
2O
4 + Ca(HCO
3)
2 ------------> 8 Al(OH)
3 + 3 Na
2CO
3 +
6 H20
Sodium + Calcium gives Aluminum + Sodium + Water
Aluminate Carbonate Hydroxide Carbonate (present in the water to treat)

28
Na2Al
2O
4 + CO
2 ------------> 2 Al(OH)
3 +
NaCO3
Sodium + Carbon gives Aluminum + Sodium
Aluminate Dioxide Hydroxide Carbonate
(present in the water to treat) Na
2Al
2O
4 + MgCo
3 ------------> MgAl
2O
4 +
Na2CO
2.5.2 Chlorination
3
Sodium + Magnesium gives Magnesium + Sodium
Aluminate Carbonate Aluminate Carbonate
(present in the water to treat)
Chlorination is a water treatment that destroys disease-causing bacteria, nuisance
bacteria, parasites and other organisms. Chlorination also oxidizes iron, manganese
and hydrogen sulfide so they can be filtered out. Disease-causing bacteria can infect
humans and animals in several ways. Fecal waste from an infected host frequently
carries organisms which cause diseases such as typhoid fever, paratyphoid fever,
bacillary dysentery, infectious hepatitis and others. Disease-causing organisms are
transmitted from host to host in many ways including through a contaminated water
supply. Chlorination is the process of adding the element chlorine to water as a
method of water purification to make it fit for human consumption as drinking
water. Water which has been treated with chlorine is effective in preventing the
spread of disease. The use of chlorine has greatly reduced the prevalence of
waterborne disease as it is effective against almost all bacteria and viruses.
Chlorination is also used to sterilize the water in swimming pools and as a
disinfection stage in sewage treatment.

29
When chlorine is added to water,
Chemistry in Water
hypochlorous and hydrochloric acids form:
Cl2 + H2
Depending on the pH, hypochlorous acid partly
O • HClO + HCl
dissociates to hydrogen and hypochlorite ions:
HClO • H+ + ClO-
The hypochlorite ion then most often degrades to a mixture of chloride and chlorate ions:
3 ClO– • 2 Cl– + ClO3–
1.
Advantages of Chlorination
Controls Disease-Causing Bacteria:
2.
Disease-causing bacteria may
enter your well during construction, repair, flooding or as a result of improper
construction. Proper chlorination will kill these bacteria. If disease-causing
bacteria enter your water supply on a continuous basis, you must eliminate the
source or construct a new water supply.
Controls Nuisance Organisms: Chlorine treatment will control
nuisance organisms such as iron, slime and sulfate-reducing bacteria. Iron
bacteria feed on the iron in the water. They may appear as a slimy, dark-red
mass in the toilet tank but microscopic examination is needed to confirm their
presence. Iron bacteria colonies may break loose from the inside of pipes and
flow through faucets to cause stains in laundry, plumbing fixtures, etc. A
thorough shock chlorination of the well and water system may destroy all iron
bacteria colonies. However, iron bacteria that have penetrated the water-
bearing formation will be difficult to eliminate and will likely re-infest the
system. In this situation you will need to repeat chlorination treatment
periodically. Other nuisance organisms include slime bacteria and sulfate
reducing bacteria which produce a rotten-egg odor. Chlorination will kill or
control these bacteria. Nuisance bacteria do not cause disease.

30
3. Mineral Removal: You can remove large amounts of iron from
water by adding chlorine to oxidize the clear soluble iron into the filterable
reddish insoluble form. Chlorine helps remove manganese and hydrogen
sulfide in the same way.
1.
Disadvantages of Chlorination
No Nitrate Removal: Chlorine will not remove nitrates from water.
The claims of some water treatment firms imply that nitrates can be removed
by chlorination. This is not true. Adding chlorine may prevent nitrates from
being reduced to the toxic nitrite form; however, nitrates are not removed from
water by chlorination
2.
.
Causes Smell and Bad Taste:
Trihalomethanes (THMs) are organic chemicals that may form when chlorine
is used to treat water supplies that contain humic compounds. Humic
compounds form as a part of the decomposition of organic materials such as
leaves, grass, wood or animal wastes. Because THMs are very seldom
associated with groundwater, they are primarily a concern where surface water
supplies are used.
Lifetime consumption of water supplies with THMs at a level greater than 0.10
milligrams per liter is considered by the Environmental Protection Agency to
be a potential cause of cancer. THMs can be removed from drinking water
through use of an activated carbon filter.
Chlorine in water is not poisonous to
humans or animals. However, if the concentration is great enough the water
will taste bad so consumption may be reduced. Some people object to the smell
and/or taste of very small amounts of chlorine. In those cases an activated
carbon or charcoal filter may be used to remove the chlorine from the drinking
water.

31
1.
The Chlorination Process
To chlorinate a water supply properly it is necessary to understand chlorine
demand, free available chlorine residual and contact time.
Chlorine demand
2.
is the amount of chlorine required to kill bacteria, oxidize
iron or other elements in the water, and oxidize any organic matter that may be
present. There is no easy way to determine the amount of chlorine required—
chlorine is added until the chlorine odor persists.
Free available chlorine residual
is the amount of chlorine remaining in the
water after the chlorine demand has been met. If the chlorine demand is greater
than the amount of chlorine introduced, there will be no free available chlorine
residual. Unless a chlorine residual is present, adequate amounts of chlorine have
not been added to the water.
3. Contact time
2.5.3 Sand Filtration
is the amount of time that the chlorine is present in the water.
The combination of chlorine residual and contact time determines the
effectiveness of the chlorination treatment. The bacterial "kill factor" is defined
as the product of free available chlorine residual and contact time. Thus the
greater the chlorine residual the shorter the required contact time for bacterial
kill.
Sand filters are used for water purification. There are three main types;
1. Rapid (gravity) sand filters
2. Upflow sand filters
3. Slow sand filters
All three methods are used extensively in the water industry throughout the world.
The first two require the use of flocculant chemicals to work effectively whilst slow

32
sand filters can produce very high quality water free from pathogens, taste and odour
without the need for chemical aids.
Passing flocculated water through a rapid gravity sand filter strains out the floc and
the particles trapped within it reducing numbers of bacteria and removing most of
the solids. The medium of the filter is sand of varying grades. Where taste and odour
may be a problem (organoleptic impacts), the sand filter may include a layer of
activated carbon to remove such taste and odour.
Sand filters become clogged with floc after a period in use and they are then
backwashed or pressure washed to remove the floc. This backwash water is run into
settling tanks so that the floc can settle out and it is then disposed of as waste
material. The supernatant water is then run back into the treatment process or
disposed off as a waste-water stream. In some countries the sludge may be used as a
soil conditioner. Inadequate filter maintenance has been the cause of occasional
drinking water contamination.
Sand filters are occasionally used in the treatment of sewage as a final polishing
stage (see Sewage treatment). In these filters the sand traps residual suspended
material and bacteria and provides a physical matrix for bacterial decomposition of
nitrogenous material, including ammonia and nitrates, into nitrogen gas.
Sand Bed Filtration
A sand bed filter is a kind of depth filter. Broadly, there are two types of filter for
separating particulate solids from fluids:
• Surface filters – where particulates are captured on a permeable surface
• Depth filters – where particulates are captured within a porous body of material
In addition, there are passive and active devices for causing solid liquid separation
such as settling tanks, hydrocyclones and centrifuges.

33
There are several kinds of depth filter some employing fibrous material and others
employing granular materials. Sand bed filters are an example of a granular lose
media depth filter. They are usually used to separate small amounts (<10 parts per
million or <10 g per cubic metre) of fine solids (<100 microns) from aqueous
solutions. In addition, they are usually used to purify the fluid rather than capture the
solids as a valuable material. They therefore find most of their uses in liquid effluent
treatment.
Sand bed filters work by providing the particulate solids with many opportunities to
be captured on the surface of a sand grain. As fluid flows through the porous sand
along a tortuous route, the particulates come close to sand grains. They can be
captured by one of several mechanisms:
• Direct collision
• Van der Waals or London force attraction
• Surface charge attraction
• Diffusion
In addition, particulate solids can be prevented from being captured by surface
charge repulsion if the surface charge of the sand is of the same sign (positive or
negative) as that of the particulate solid. Furthermore, it is possible to dislodge
captured particulates although they may be re-captured at a greater depth within the
bed. Finally, a sand grain that is already contaminated with particulate solids may
become more attractive or repel addition particulate solids. This can occur if by
adhering to the sand grain the particulate loses surface charge and becomes
attractive to additional particulates or the opposite and surface charge is retained
repelling further particulates from the sand grain.
Particulate Solids Capture Mechanisms
In some applications it is necessary to pre-treat the effluent flowing into a sand bed
to ensure that the particulate solids can be captured. This can be achieved by one of
several methods:
34
• Adjusting the surface charge on the particles and the sand by changing the pH
• Coagulation – adding small, highly charged cations (aluminium 3+ or calcium 2+ are usually used)
• Flocculation – adding small amounts of charge polymer chains which either form a bridge between the particulate solids (making them bigger) or between the particulate solids and the sand
They can be operated either with upward flowing fluids or downward flowing fluids
the latter being much more usual. For downward flowing devices the fluid can flow
under pressure or by gravity alone. Pressure sand bed filters tend to be used in
industrial applications and often referred to as rapid sand bed filters. Gravity fed
units are used in water purification especially drinking water and these filters have
found wide use in developing countries (slow sand filters).
Overall, there are several categories of sand bed filter:
1. rapid (gravity) sand filters
2. rapid (pressure) sand bed filters
3. upflow sand filters
4. slow sand filters
Operating Regimes
Smaller sand grains provide more surface area and therefore a higher
decontamination of the inlet water, but it also requires more pumping energy to
drive the fluid through the bed. A compromise is that most rapid pressure sand bed
filters use grains in the range 0.6 to 1.2 mm although for specialist applications other
sizes may be specified. Larger feed particles (>100 microns) will tend to block the
pores of the bed and turn it into a surface filter that blinds rapidly. Larger sand
grains can be used to overcome this problem, but if significant amounts of large
solids are in the feed they need to be removed upstream of the sand bed filter by a
procsss such as settling.
Rapid Pressure Sand Bed Filter Design

35
The depth of the sand bed is recommended to be around 0.6-1.8 m (2-6 ft) regardless
of the application. This is linked to the maximum throughput discussed below.
Guidance on the design of rapid sand bed filters suggests that they should be
operated with a maximum flow rate of 9 m3/m2/hr (220 USgal/ft2/hr – check calc).
Using the required throughput and the maximum flowrate the required area of the
bed can be calculated
The final key design point is to be sure that the fluid is properly distributed across
the bed and that there are no preferred fluid paths where the sand may be washed
away and the filter be compromised.
Rapid pressure sand bed filters are typically operated with a feed pressure of 2 to 5
bar(a) (28 to 70 psi(a)). The presssure drop across a clean sand bed is usually very
low. It builds as particulate solids are captured on the bed. Particulate solids are not
captured uniformly with depth, more are captured higher up with bed with the
concentration gradient decaying exponetially.
This filter type will capture particles down to very small sizes, and does not have a
true cut off size below which particles will always pass. The shape of the filter
particle size-efficiency curve is a U-shape with high rates of particle capture for the
smallest and largest particles with a dip in between for mid-sized particles.
Operating Parameters for Rapid Pressure Sand Bed Filters
The build up of particulate solids causes an increase in the pressure lost across the
bed for a given flow rate. For a gravity fed bed when the pressure available is
constant, the flow rate will fall. When the pressure loss or flow is unacceptable the
bed is back washed to remove the accumulated particles. For a pressurised rapid
sand bed filter this occurs when the pressure drop is around 0.5 bar. The back wash
fluid is pumped backwards through the bed until it is fluidised and has expanded by
up to about 30% (the sand grains start to mix and as they rub together they drive off
the particulate solids). The smaller particulate solids are washed away with the back
wash fluid and captured usually in a settling tank. The fluid flow required to fluidise

36
the bed is typically 3-10 m3/m2/hr but not run for long (a few minutes). Small
amounts of sand can be lost in the back washing process and the bed may need to be
topped up periodically.
All three methods are used extensively in the water industry throughout the world.
The first two and third in the list above require the use of flocculant chemicals to
work effectively whilst slow sand filters can produce very high quality water free
from pathogens, taste and odour without the need for chemical aids.
Passing flocculated water through a rapid gravity sand filter strains out the floc and
the particles trapped within it reducing numbers of bacteria and removing most of
the solids. The medium of the filter is sand of varying grades. Where taste and odour
may be a problem (organoleptic impacts), the sand filter may include a layer of
activated carbon to remove such taste and odour.
Sand filters become clogged with floc after a period in use and they are then
backwashed or pressure washed to remove the floc. This backwash water is run into
settling tanks so that the floc can settle out and it is then disposed of as waste
material. The supernatant water is then run back into the treatment process or
disposed off as a waste-water stream. In some countries the sludge may be used as a
soil conditioner. Inadequate filter maintenance has been the cause of occasional
drinking water contamination.
Sand filters are occasionally used in the treatment of sewage as a final polishing
stage. In these filters the sand traps residual suspended material and bacteria and
provides a physical matrix for bacterial decomposition of nitrogenous material,
including ammonia and nitrates, into nitrogen gas.
Uses in Water Treatment
Discussion of Mechanism of Alum for Waste water treatment
When Al2(SO4)3.18H2
Al(H
O (alum) is added to the waste water, the aluminum ion
hydrolyses by reactions that consume alkalinity in the water such as:
2O)63+ + 3HCO3-→ Al(OH)3 (s) + 3CO2 +6H2O

37
The gelation of hydroxide thus formed carries suspended materials with it as it
settles. Furthermore it is likely that positively charged hydroxyl-bridged dimmers or
higher polymers are formed that interact with colloidal particles bridging about
coagulation. Sodium silicate partly neutralized by aids of coagulation. Particularly
when used with alum. Metal ions in coagulation also react with virus proteins and
destroy viruses from water. This process remove large amount of suspended solid
particles which account large part of BOD in the effluent/waste water. Removal of
solid also reduced turbidity.
Use of chlorine/bleaching/chlorinedioxide for water treatment
Chlorine/chlorine dioxide is an effective water disinfectant employed for killing
bacteria in water. When chlorine is added to water, it rapidly hydrolyzed as follows
Cl2+H2O → H+ + Cl- + HOCL
Hypochlorous acid (HOCL) is a weak acid and dissociates as follows
HOCL↔ H+ + OCL-
Sometimes, hypochloride salts are substituted for chlorine gas as disinfectants. The
most important one is bleaching powder Ca(OCl)2 which is safer to handle than
gaseous chlorine.
When chlorine is dissolved in water it gives HOCl and OCl- which are known as free
available chlorine. Free available chlorine is very effective in killing bacteria which
can remove fecal colliform from waste water.

38
2.5.4 Urban Treatment
The technologies that best address the factors that effect gray water reuse must
primarily consider the biological characteristics of gray water (Al-Jayyousi, 2003) in
order to ameliorate public health concerns. The level of treatment provided by gray
water reuse technologies will further vary according to the system’s scale and reuse
applications. Treatment technologies can be best described in either user-based or
technology-based terms.
The technology utilised in gray water reuse systems can be differentiated into
primary, secondary and tertiary levels (Jeppesen, 1994). These can then be further
characterised in terms of the number of users the gray water reuse system must
support (user-defined) and by their likely reuse applications.
The main scales of use in user-defined terms are single dwellings, multi-dwellings
(Jeppesen, 1994) and community-based systems (Thomas, 1997) with the general
applications of gray water reuse being garden watering/ irrigation (external use) and
toilet flushing/laundry washing (internal use).
2.5.4.1 General Design Considerations
These main design factors are consistent with most Government guidelines as
present.
Relative to wastewater gray water which is predominantly from bathroom and
laundry sources is high in dissolved solids (mostly salts) and turbidity, low in
nutrients and is likely to contain significant amounts of pathogens (Al-Jayyousi,
2003). The suspended solids that are present are mostly in the form of hair and lint
from bath and laundry waste (Jeppesen, 1996). If gray water is sourced from kitchen
wastewater it is likely to have a high BOD, high in organic suspended solids and
nutrients with low pH (Jeppesen, 1996).
The reuse of gray water from bathroom and laundry sources can be relatively simple
for garden watering reuse applications up to some degree of treatments for toilet
flushing and laundry applications. However, treatment for kitchen wastewater will

39
generally require more sophisticated technologies and processes to address the high
BOD and fatty solids generated (Al-Jayyousi, 2003).
In order to primarily address the likelihood of high pathogen contamination and
hence public health concerns, gray water must either be disinfected or disposed of in
a manner that does not allow human contact (Jeppesen, 1996). For gray water reuse
applications where disposal only involves garden watering, sub-surface irrigation
systems would remove the possibility of human contact and therefore reduce the
level of treatment required (CSIRO, 2004). However, if gray water reuse involved
toilet flushing and/ or laundry water applications disinfection would be required as
there is a possibility for human contact (Jefferson, 1998).
Finally, all gray water reuse systems must be connected to the centralised sewer
collection system as a precaution. If the gray water reuse system malfunctions or if
maintenance is to be carried, the system must be capable of being manually or
automatically diverted to the sewer line. This would avoid an unlikely event where
the gray water is not collected and disposed of which would increase the risk of
human contact and threaten public health.
2.5.4.2 Technology-based Gray water Systems
Primary treatment systems are designed to convey the gray water to a garden
watering or irrigation application from its source and little refinement or treatment
of gray water quality occurs. However, secondary and tertiary treatment
technologies offer different and varying improvements in the treated gray water
quality.
2.5.4.3 Primary Treatment Systems
These systems do not store or treat gray water and as such are best to reuse gray
water for sub-surface applications.
The simplest forms of primary gray water reuse systems are best described as gray
water diversion devices (Ludwig, 1994) and are the most economical.

40
A simple plumbing device diverts gray water in the wastewater drainage line to a
sub-surface garden irrigation system via gravity without any external energy. This
system does not treat the gray water and as such the sub-surface garden irrigation
system must be able to cope with fouling material such as hair and lint (Ludwig,
1994). With this in consideration the irrigation pipe is usually oversized and outlets
to specific sub-surface points in the garden that contain mini-leachfields. These filter
the solids and allow sub-surface infiltration without gray water solids fouling tree
root zone. In these applications the soil treats the gray water and consideration must
be given to the type and depth of soil available to complete the process without
compromising the environment or public health.
Figure 2.4: Simple gravity diversion (Van Dok, 2004)
The diversion systems (shown in Figure 2.4) are always connected to the sewer
system as well as the irrigation drainage system and usually have a manual valve to
divert gray water back to the centralised sewer collection system if required.
Sub-surface irrigation reuse applications avoid human contact with untreated gray
water and diversion systems are simple to install and maintain, especially in
retrofitting to existing dwellings (Ludwig, 1994). However, these simple systems
rely upon gravity flow to apply the gray water and therefore are reliant upon
favourable topographical conditions, building and plumbing designs. Also, the

41
intermittent and relatively low flows provided by gray water sources can cause
incomplete draining of the sewer lines and cause fouling in some installations
(Ludwig, 1994).
To further stabilise flows and clarify gray water a surge tank can be incorporated
into the diversion gravity feed/ discharge system – as shown in figure 2.5. The surge
tank is usually no larger than 100L (Ludwig, 1994) and is sealed to avoid human
contact. The surge tank provides some primary clarification of the gray water solids
and provides a regulated flow through the irrigation lines, thus reducing the
likelihood of fouling. The relatively-low storage time is designed not to allow the
gray water to enter the anaerobic state, which would increase its pathogen
contamination and become foul smelling (Jeppesen, 1996).
Figure 2.5: Surge tank (Van Dok, 2004)
For applications where gravity flow is not workable or mini-leachfield point
irrigation is not preferred, a pumped surge tank system can be utilised (Ludwig,
1994 p17). These systems utilise external electrical energy and in order for this
system to work effectively, coarse and/ or fine filtration is desired in order to prevent
fouling of pumps and irrigation lines. Additionally, filtration will reduce organic
loads and solids levels which will inhibit microbial growth in the gray water (Al-
Jayyousi, 2003).

42
Coarse filtration will mainly prevent fouling of the surge tank pump and can take the
form of disposable “sock” or mesh-type filters. The geo-textile and nylon sock-type
filters (shown in Figure 2.6) are the most efficient and require low maintenance
(Christova-Boal et al, 1996). These coarse filters would typically be installed in the
gray water drain line when discharging into the surge tank prior to pumping. The
synthetic sock filters expand as they fill-up with filtered material which maintains
adequate flow and they require replacing or cleaning fortnightly on average
(Christova-Boal et al, 1996). Their removal and disposal is an acceptable health risk
provided adequate safety equipment is worn.
Other forms of coarse filters include disc or mesh filters that can be fitted with
automatic back-washing systems. They will utilise more external energy and have
high initial capital costs, however their operating costs are comparable to sock-type
filters (Christova-Boal et al, 1996). On average these filters must be cleaned or will
self-clean once a week and automating the filter cleaning process will simplify
operator maintenance and lessen the likelihood of human contact with gray water
(Christova-Boal et al, 1996). Disc-type filters operate more efficiently at coarser
settings (Christova-Boal et al, 1996) and therefore are better utilised as coarse filters.
Figure 2.6: Primary treatment system with coarse Filtration (Ludwig, 1994)
Fine filtration is utilised primarily to prevent fouling in irrigation lines and are
typically installed in-line just after the surge tank pump and before the irrigation

43
discharge line. Therefore they mostly operate under pressure and the most common
and cost effective form is a sand filter.
Sand filters will increase the pump design pressure and can also include automatic
back-washing systems that self-clean and are very effective at removing finer
particles that foul more intricately designed irrigation systems (Gardner & Millar,
2003). Therefore the most efficient gray water reuse applications that utilise drip
sub-surface irrigation systems require finer filtration and should incorporate a sand
filter as the fine filtration treatment step.
More natural forms of fine filtration such as the soil box (shown in Figure 2.7) or
infiltration bed (Ludwig, 1994) and the vertical swamp (Thomas & Zeisel, 1997) can
be utilised, but their filtration rates and overall effect in the hydraulic design must be
closely scrutinised in order to be successful.
Figure 2.7: Soilbox design (Ludwig, 1994)
The soil box or infiltration bed can be mounted above ground or in-ground and
consists of layers of gravel, sand, and a top layer of peat or mulch. In soil boxes a
top layer of soil can be utilised to support plants, whilst treatment takes place lower
down. As with the sand filter process, gray water is pumped or fed in via gravity at
one end, through the layers of natural material in the filter and is discharged at the
44
opposite end to other irrigation applications. Disinfection and dissolved solids
clarification treatments can also take place in the soil box (Ludwig, 1994).
The vertical swamp utilises a series of relatively large soil boxes mounted vertically
on a wall or similar structure. Gray water is pumped into the top box and is allowed
to flow via gravity through the series of cascading soil boxes until it is collected in a
sump at ground level and redistributed to other irrigation applications. Each soil box
supports plants that thrive in saturated soil states, such as reeds. The vertical swamp
is generally more effective for higher flows, where space is limited and where it can
be mounted in areas away from human contact. The vertical cascading flow created
between the soil boxes aerates gray water and further treats the gray water.
The soil boxes are natural filtration processes whereby the filtrate is broken down by
the soil or mulch microbes and can also be utilised for plant growth. By supporting
plant growth the filter has a positive energy balance in the process train – rather than
at the end of the process, i.e. plant growth after irrigation.
For small irrigation areas or relatively lower pressure irrigation systems a
submersible-type pump is most efficient. These constantly operate under a positive
suction head and are also easily connected to a float-type level switch which
automatically controls the pumping operation and surge tank levels (refer to Figure
2.4). This lowers the maintenance required to operate and maintain the pump in
service and can be mounted inside a sealed surge tank, which also dampens its
operating noise.
Centrifugal pumps provide greater pressure and flow capacities for larger gray water
reuse systems and must be mounted outside the surge tank. Whilst, these pumps
require constant priming, they can be mounted at ground level under a positive
suction head. However, a suction line must be mounted at the base of the surge tank
through its wall and the surge tank level control device must be mounted separately
in the surge tank. This makes the centrifugal pump set-up relatively more complex
and vulnerable to ongoing operating and maintenance problems compared to using a
submersible pump.

45
For gray water irrigation applications open-type pump impellers best suit as they are
unlikely to foul if filtration fails or is limited. However, open impeller-type pumps
have limited pressure requirements and may limit the size and type of irrigation
system utilised – within both the submersible and centrifugal pump ranges.
However, given the relatively small land areas of most urban blocks it is unlikely
that household gray water reuse systems will require pump pressures and flowrates
outside the range of submersible-type pumps and it is therefore more effective to use
submersible pumps generally for primary treatment systems.
2.5.4.4 Secondary Treatment Systems
These systems allow storage of gray water and therefore must include disinfection
treatment to avoid further contamination of gray water during storage.
In order to most efficiently disinfect, the gray water must be reasonably clarified
and/ or filtered and the filtration options are the same as for primary treatment
systems. Sand filtration can reduce the BOD5 and COD loadings as well as reducing
turbidity (Al-Jayyousi, 2003), which aids the disinfection process.
Generally, systems that store gray water seek to maximise the gray water reuse
applications available. That is, gray water is most likely to be reused under pressure
for garden irrigation, toilet flushing and/ or laundry water applications.
However, these systems can be used for gravity flow garden irrigation applications
as well, but this does not maximise the gray water reuse benefits available.
A typical secondary treatment system (refer to Figure 2.8) will comprise a surge
tank for primary clarification and diversion, a centrifugal pump that transports the
gray water from the surge tank through a fine filter and an in-line disinfection
system to a storage tank. From the storage tank the treated gray water can then be
applied under pressure via another centrifugal pump or under gravity flow to reuse
applications.
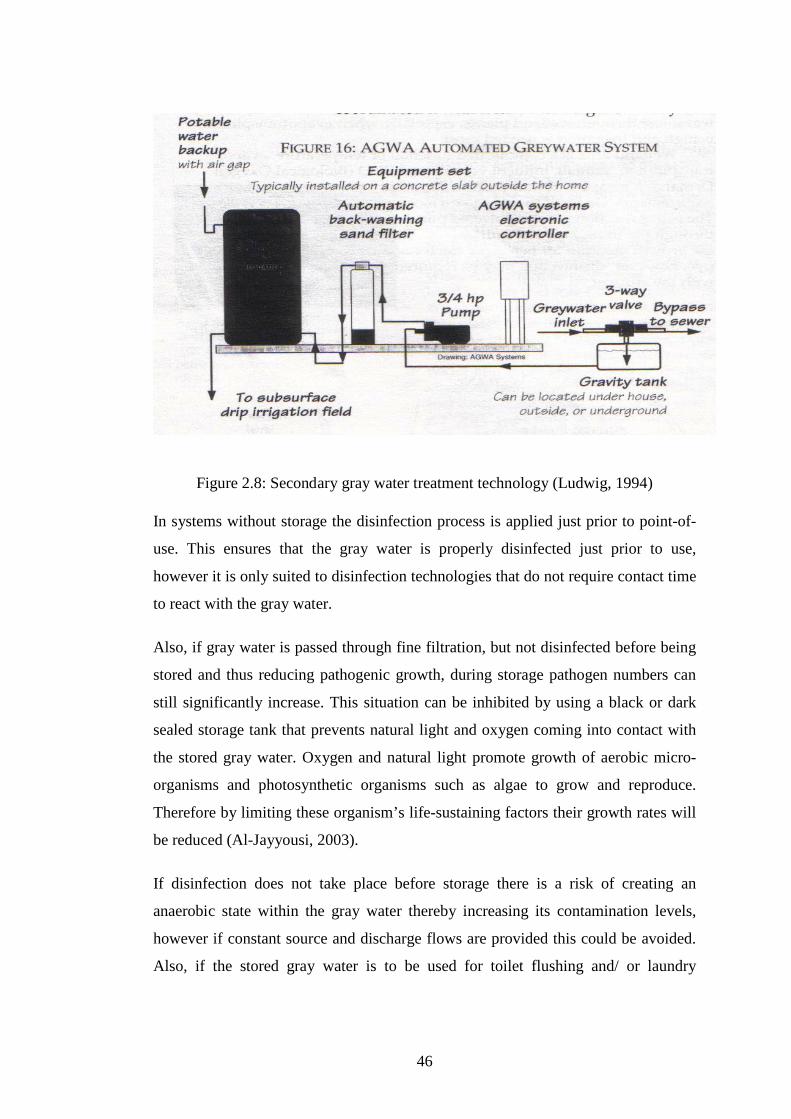
46
Figure 2.8: Secondary gray water treatment technology (Ludwig, 1994)
In systems without storage the disinfection process is applied just prior to point-of-
use. This ensures that the gray water is properly disinfected just prior to use,
however it is only suited to disinfection technologies that do not require contact time
to react with the gray water.
Also, if gray water is passed through fine filtration, but not disinfected before being
stored and thus reducing pathogenic growth, during storage pathogen numbers can
still significantly increase. This situation can be inhibited by using a black or dark
sealed storage tank that prevents natural light and oxygen coming into contact with
the stored gray water. Oxygen and natural light promote growth of aerobic micro-
organisms and photosynthetic organisms such as algae to grow and reproduce.
Therefore by limiting these organism’s life-sustaining factors their growth rates will
be reduced (Al-Jayyousi, 2003).
If disinfection does not take place before storage there is a risk of creating an
anaerobic state within the gray water thereby increasing its contamination levels,
however if constant source and discharge flows are provided this could be avoided.
Also, if the stored gray water is to be used for toilet flushing and/ or laundry

47
applications a larger sized point-of-use disinfection system may be required as
pathogen numbers may have significantly increased during storage.
UV disinfection is a favourable technology for gray water reuse and is most
advantageous for in-line operations. It does not require long contact times (just the
time taken to flow over the UV lamp) and it will not adversely change the chemical
structure of the gray water.
However, UV disinfection technology requires relatively low turbidity and
suspended solids in order to prevent shadowing of pathogens when the gray water
passes over the UV lamp (Tchobanoglous et al, 2003). Fine filtration will
significantly improve the turbidity and suspended solids levels in gray water and
will be further minimised after storage if microbial growth is restricted
(Tchobanoglous et al, 2003). Therefore it is preferred to use UV disinfection with
pre-filtration.
Using chemicals such as chlorine or bromine for disinfection would change the
chemical characteristics of the gray water and would require at least twenty (20)
minutes contact time (Clifford White, 1972). Further, it may react with certain waste
products in the gray water and form more toxic by-products (Christova-Boal et al,
1996). Additionally, overdosing the disinfectant would adversely affect the soil and
plants irrigated (Christova-Boal et al, 1996). Other forms of disinfection such as
ozone and chlorine dioxide are more complex and more costly technologies and
were not be considered for these reasons.
Whether applied in liquid, tablet or powder form, dosing of chemical disinfectants
would also require injection and/ or monitoring/ controlling equipment in order to
control the disinfection process. This would increase the complexity of the system
for maintenance and operating tasks and therefore chemical disinfection was not
generally accepted as a preferred disinfection process.
The preferred storage tank size would be from 200L to 500L (Ludwig, 1994) and
would comprise a surge tank, centrifugal pump, sand filter, storage tank and an in-
line UV disinfection unit. Figure 2 shows a similar system however the UV
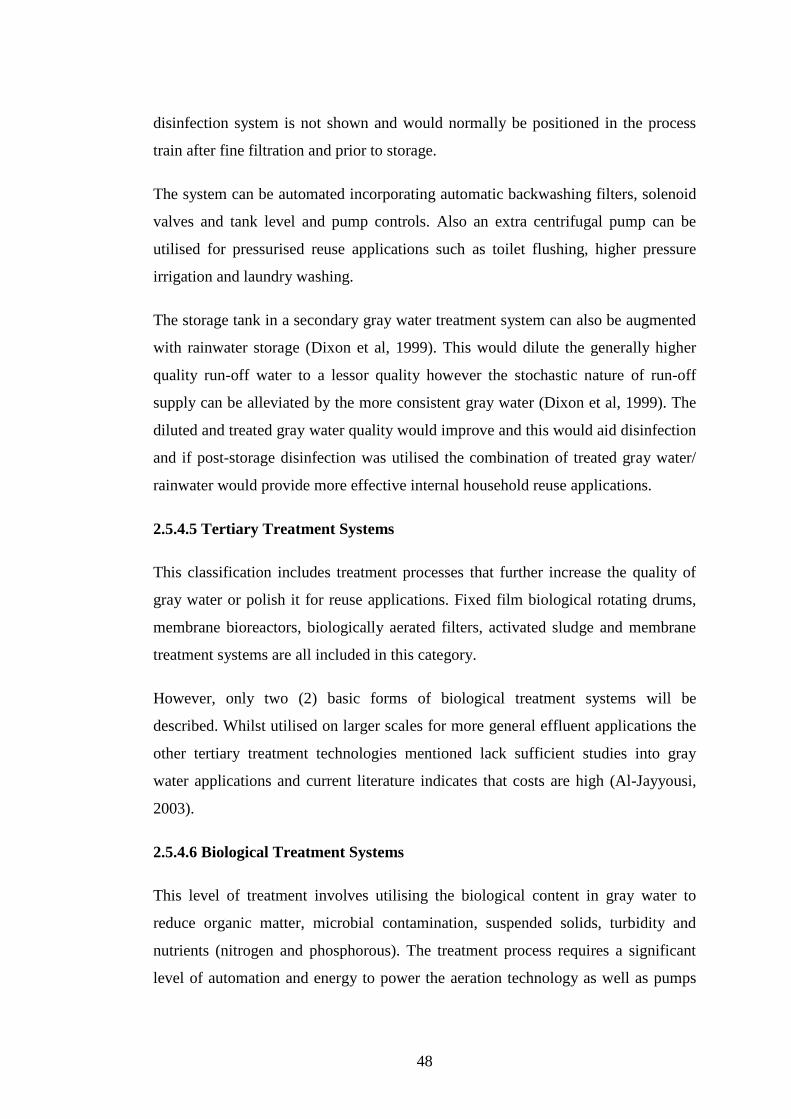
48
disinfection system is not shown and would normally be positioned in the process
train after fine filtration and prior to storage.
The system can be automated incorporating automatic backwashing filters, solenoid
valves and tank level and pump controls. Also an extra centrifugal pump can be
utilised for pressurised reuse applications such as toilet flushing, higher pressure
irrigation and laundry washing.
The storage tank in a secondary gray water treatment system can also be augmented
with rainwater storage (Dixon et al, 1999). This would dilute the generally higher
quality run-off water to a lessor quality however the stochastic nature of run-off
supply can be alleviated by the more consistent gray water (Dixon et al, 1999). The
diluted and treated gray water quality would improve and this would aid disinfection
and if post-storage disinfection was utilised the combination of treated gray water/
rainwater would provide more effective internal household reuse applications.
2.5.4.5 Tertiary Treatment Systems
This classification includes treatment processes that further increase the quality of
gray water or polish it for reuse applications. Fixed film biological rotating drums,
membrane bioreactors, biologically aerated filters, activated sludge and membrane
treatment systems are all included in this category.
However, only two (2) basic forms of biological treatment systems will be
described. Whilst utilised on larger scales for more general effluent applications the
other tertiary treatment technologies mentioned lack sufficient studies into gray
water applications and current literature indicates that costs are high (Al-Jayyousi,
2003).
2.5.4.6 Biological Treatment Systems
This level of treatment involves utilising the biological content in gray water to
reduce organic matter, microbial contamination, suspended solids, turbidity and
nutrients (nitrogen and phosphorous). The treatment process requires a significant
level of automation and energy to power the aeration technology as well as pumps

49
and disinfection systems. Kitchen waste may also be included in the gray water
biological treatment process.
Gray water is characteristically low in nutrients and this would inhibit the efficiency
of biological treatment systems for individual household systems. However, for
larger gray water treatment systems that incorporate gray water from multiple
households the nutrient levels would improve the overall biological treatment
efficiency. Consistency in treated gray water quality can also be achieved through
greater storage volumes which assist in the biological treatment process (Al-
Jayyousi, 2003).
However, the consistency of biological treatment systems could vary greatly
according to the types of chemicals used at gray water sources. Some substances or
products used such as laundry washing products, soaps or shampoos with high
amounts aluminium or zeolite could poison or hinder the biological process
(Christova-Boal et al, 1995).
Basic biological systems would involve simple aeration using a blower within the
storage tank for a set timeframe (batch operation) and then discharged through a UV
disinfection system to point of use. The aeration process could involve a system
vertical swamp type system.
Although gray water is generated frequently, the volume is variable and therefore a
batch system is more effective. The process would remain the same as for secondary
treatment systems prior to storage, except that fine filtration could be substituted for
coarse filtration and a second primary storage tank will most likely be required to
store incoming gray water generated while the batch aeration process takes place in
the other storage tank.
For systems with larger or more continuous gray water flows a continuous biological
system can be used. A rotating drum system can effectively process gray water by
creating a fixed biological film on the rotating drum and as it rotates above and
below the tank level. The organic content of the gray water remains in an aerobic
state and reacts with the biofilm on the drum as it submerges and re-emerges in and

50
out of the tank. This effectively aerates and dilutes the gray water continuously. The
processing speed and process effectiveness is determined by the speed of the
rotating drum (Thomas & Zeisel, 1997). However the drum must remain wet to keep
its biological film active and after retention in the rotating drum tank the
biologically-active gray water is clarified and stored for disinfection and then reuse
application as shown in figure 2.9.
Figure 2.9: Rotating drum biological gray water treatment system (Thomas, 1997)
The adjustable rotating drum speed can accommodate variable nutrient levels in the
gray water and the system can achieve reductions in organic loadings down to less
than 5mg BOD7/ L with loadings as little as 3g BOD7/ m2/ day without nutrient
enrichment (Thomas & Zeisel, 1997). However, the addition of nutrients (Nitrogen
and phosphorous) would improve the treatment quality (Thomas & Zeisel, 1997).
Although the relatively moderate nutrient load in gray water is considered generally
positive for single dwelling garden irrigation applications, it is likely that for multi-
dwellings the collected gray water would have significantly increased nutrient loads
(Thomas & Zeisel, 1997). If a gray water treatment system of this scale only utilised
secondary treatment processes the higher nutrient-rich processed gray water may
increase the likelihood of adverse environmental effects if applied to garden
irrigation.

51
Biological treatment systems are effective and efficient when storing and treating
large gray water volumes. The initial low nutrient levels of gray water require larger
storage volumes to increase organic loads, however the process is vulnerable to
shock loads caused by the variable quality of gray water and toxicity of household
products used (Thomas & Zeisel, 1997).
Biological treatment systems are more complex and require greater knowledge to
operate and maintain. They also require a considerable amount of energy to operate
and close attention must be paid to the types of chemicals used at source i.e. social
preferences of the users must be scrutinised.
2.5.5 User-Defined Gray Water Systems
The technologies used in gray water treatment systems can be further defined by the
scale of their design and there are three (3) distinct scales of systems identified;
• Single dwellings
• Multi-dwellings
• Community-based systems.
Primary, secondary and tertiary treatment levels can be characterised into these
identified gray water system scales.
2.5.5.1 Single Dwellings
This is the most popular gray water system scale in urban areas and involves on-site
reuse systems designed for single households/ dwellings.
Single dwellings are more likely to have gardens requiring irrigation, which offers
the greatest benefit of gray water reuse. Therefore significant reuse opportunities are
available at this scale. However, the level of technological understanding by gray
water reuse system operators is likely to be lower and therefore the level of

52
sophistication of systems on these scales would generally be low as well (Jeppesen,
1996). However, ownership of the system is high (Al-Jayyousi, 2003).
The relatively low volume of gray water produced from single dwellings most
benefits primary and secondary treatment designs, as biological treatment may not
achieve the organic loads required to work effectively. Also other tertiary treatment
systems would effectively polish the gray water to a very high standard, but at a
considerably higher cost because of the relatively low treatment volumes and these
would generally be above single dwelling requirements.
The level of reuse applications as well as cost budgets would be the main factors to
consider in determining the most appropriate level of treatment – a primary or
secondary treatment system for a single dwelling i.e. for internal and external reuse
disinfection would be required.
To then determine the level of sophistication of the identified treatment, factors such
as building layouts, scale of reuse and topography would be scrutinised i.e. if a
pump/ pressurised system is required.
2.5.5.2 Multi-dwellings
These are single land parcels supporting multiple buildings or households such as a
block of apartments or townhouses for typically residential, education, tourist or
commercial purposes.
The characteristics of gray water from multi-dwellings include high variability in
quality however this can be offset by the relatively high volumes produced (Thomas
& Zeisel, 1997). The volumes of gray water produced will also be greater relative to
the land or garden available for irrigation reuse applications.
For maintenance and operation the users are likely to employ a dedicated caretaker
of the system, however individually each user is likely to take less responsibility or
ownership in general.

53
Therefore parameters for a gray water treatment system would involve large volume
storage to dilute varying gray water quality and a high quality of treatment with safe
application to reduce public health concerns (Thomas & Zeisel, 1997).
Typically a gray water reuse system design would include storage, biological
treatment, filtration and disinfection. This system will be able to have the nutrient
loads required to treat and polish the gray water and can typically have a footprint
(physical size) of only a car space or two. With this level of treatment other
applications such as toilet flushing and laundry wash water are possible also, which
improves the systems cost benefit. However, whilst the gray water characteristics are
likely to improve the treatment process, costs per capita diminish as the levels of
users increase in multi-dwelling applications.
2.5.5.3 Community-Based
Gray water treatment and reuse on this scale involves centrally collecting, treating
and distributing gray water from small neighbourhoods or communities (i.e. sub-
division or residential street).
The relatively large gray water flows and more consistent quality would further
improve gray water treatment effectiveness at these larger scales and there will also
be more land available for irrigation applications such as public parks and sporting/
recreational areas.
The biological treatment of gray water naturally clarifies and filters the gray water
before disinfection and as a result utilises less energy and less space compared to
other treatment processes that rely on mechanical separation/ filtration. However,
collecting the gray water would require separate drainage lines in addition to sewer
and stormwater systems and additional return lines for reuse distribution. This would
be a significant cost and the additional plumbing would mostly suit new
developments.
Therefore, at this scale it is more efficient and effective to treat the total effluent
produced (blackwater and gray water) from the community and reuse it for non-

54
potable applications. Less plumbing and drainage is required, hence less
development cost and the concept can be retrofitted to existing systems i.e. existing
sewer lines can be utilised. Also nutrient loads are higher and this will help the
biological treatment process.
2.5.6 Gray Water Reuse Applications
The general applications that are most economically feasible and best reflect public
health concerns are garden watering and irrigation for external reuse and toilet
flushing and/ or laundry washing for internal reuse.
2.5.6.1 Garden Watering/ Irrigation (External) Reuse Applications
All levels of gray water treatment technologies - primary, secondary and tertiary
systems can be utilised for garden watering which are relatively small areas or
irrigation which refer to larger areas such as parks. The different levels of treatment
systems are determined mostly by the scale of use and landscape-based factors such
as topography, climate and building type. When small-scale garden watering is
desired as per most household applications, a simple gray water diversion or primary
treatment system will suffice and the watering system utilised will be a sub-surface
system in order to prevent human contact with untreated gray water. If the
topography of the land and building design is favourable, gravity discharge to the
sub-surface irrigation system may be possible otherwise a pressurised pump system
would have to be employed, which would also require filtration to prevent the pump
from shortening its service life. The choice of filtration, if desired at all will also be
determined by the choice of irrigation system employed.
If simple gray water diversion or surge tank control under gravity flow is desired,
then the only adequate reuse application is a sub-surface irrigation system – which is
the most efficient form of irrigation. This type of system would utilise a relatively
large diameter irrigation tube (25-100mm) to carry the untreated gray water to key
locations in the garden where sub-surface mini-leachfields or leaching chambers
disperse it within 200mm of the sub-soil surface (Ludwig, 1994) and is shown in
Figure 2.10. Sealed distribution boxes may also be incorporated in the irrigation
distribution lines.
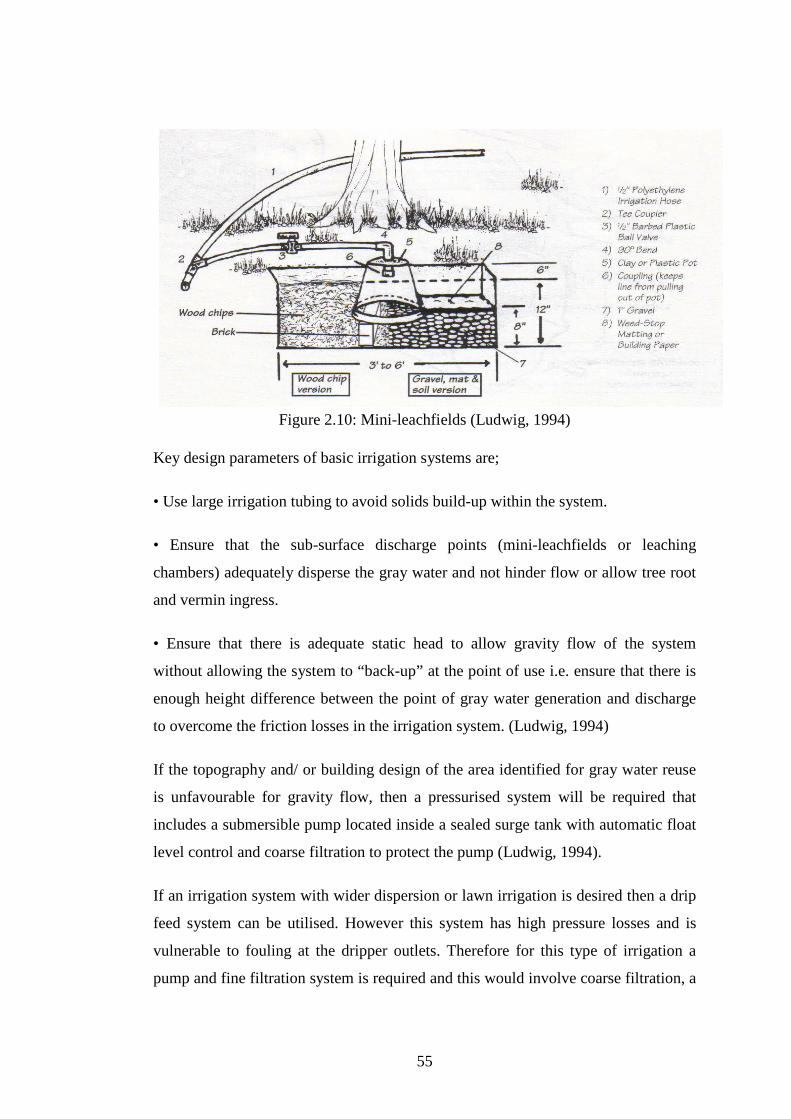
55
Figure 2.10: Mini-leachfields (Ludwig, 1994)
Key design parameters of basic irrigation systems are;
• Use large irrigation tubing to avoid solids build-up within the system.
• Ensure that the sub-surface discharge points (mini-leachfields or leaching
chambers) adequately disperse the gray water and not hinder flow or allow tree root
and vermin ingress.
• Ensure that there is adequate static head to allow gravity flow of the system
without allowing the system to “back-up” at the point of use i.e. ensure that there is
enough height difference between the point of gray water generation and discharge
to overcome the friction losses in the irrigation system. (Ludwig, 1994)
If the topography and/ or building design of the area identified for gray water reuse
is unfavourable for gravity flow, then a pressurised system will be required that
includes a submersible pump located inside a sealed surge tank with automatic float
level control and coarse filtration to protect the pump (Ludwig, 1994).
If an irrigation system with wider dispersion or lawn irrigation is desired then a drip
feed system can be utilised. However this system has high pressure losses and is
vulnerable to fouling at the dripper outlets. Therefore for this type of irrigation a
pump and fine filtration system is required and this would involve coarse filtration, a

56
pump and then a sand filter process. The sand filter would be located in-line after the
pump and is shown in Figure 2.11 (Ludwig, 1994).
Figure 2.11: Gray water treatment sand filter arrangement (Ludwig, 1994)
If surface dripper or spray system is desired the gray water must be disinfected and
this would involve locating an in-line UV disinfection system after the sand filter.
If large-scale irrigation is desired, then gray water storage may be required that will
in turn require filtration and disinfection – hence a secondary treatment system
would be a minimum standard. It is also likely that the irrigation system will be
required to be pressurised, therefore requiring pumped discharge. Also with
secondary treatment systems spray irrigation systems may be possible.
Large-scale irrigation applications of gray water reuse may also utilise combined
rainwater/ gray water storage systems. Whilst these systems lower the quality of
rainwater (Dixon et al, 1999), they compliment their respective storage capacities
when utilised for irrigation purposes.
Rainwater storage depending on climate will mostly be variable and unpredictable,
where as gray water is relatively constant and predictable. The dilution of polluted
gray water with relatively clean rainwater will aid the filtration, pump and

57
disinfection (if required) processes and hence improves the quality of the treated
gray water and the equipment service life.
2.5.6.2 Toilet Flushing/ Laundry Washing (Internal) Reuse Applications
Due to the high likelihood of human contact with these reuse applications,
disinfection is required, therefore secondary and tertiary systems are applicable.
However, for laundry washing it is more desirable to lower the turbidity and
neutralise the pH of the gray water during the treatment process. A tertiary treatment
system would provide this higher reuse quality, but the costs are higher and mostly
suits multi-dwelling scales where these higher costs can be shared.
Gray water reuse for toilet flushing offers significant water savings, however if a
gray water reuse system requires upgrading to a secondary treatment level only for
this purpose, it can be cost inhibitive.
An alternative from using or upgrading to a secondary gray water treatment system
is to use a combined handwash/ cistern system (Ludwig, 1994). This is a proprietary
product and is used extensively in Japan. It is shown in Figure 2.10 and involves
locating a wash basin that is supplied by mains water and located directly above the
toilet cistern. It is an integral part of the cistern structure and the gray water from the
wash basin drains directly into the cistern storage to be used for the next toilet flush.
The cistern also uses the mains to top-up if the washbasin gray water does not fill
the required flush storage.

58
Figure 2.12: Combined handwash/ cistern system.
Effective and efficient gray water treatment systems designed to Government
regulations and guidelines can be utilised for single and multi-dwellings. The variety
of treatment processes available allow site specific determining factors such as
topography, soil, climate and building designs as well as different cost budgets and
reuse applications to be accommodated. Single dwelling gray water reuse systems
are most adaptable for retrofitting to existing building sites.
Biological treatment processes can be more effectively utilised for multi-dwelling
gray water reuse systems and the occupants of these dwellings generally do not have
as much demand for garden watering/ irrigation. However, kitchen waste can be
included and the quality of the treated gray water produced from biological
treatment can be applied for toilet flushing and laundry applications in addition to
irrigation.
Maintenance is critical to ensuring that public health is kept a priority concern.
Whilst all gray water treatment processes include a sewer overflow/ diversion
system to guard against treatment and public health failure, all of the gray water
reuse systems defined requires regular maintenance to operate efficiently and
effectively for the applications they are designed.

59
To alleviate this key concern, maintenance should be carried out by trained operators
on a regular basis. The scope of this task would include gray water treatment system
and irrigation system maintenance as well as inspections of irrigated areas to ensure
adverse environmental impacts are noted and acted upon if required. This could be
undertaken in the form of a periodic contract with a specialist or experienced gray
water system supplier that operates within the Government policies and guidelines.
2.5.6.3 Reusing Gray Water
There are no Standards and criteria/guidelines for gray water reuse for toilet flushing
in Bangladesh. But at the time of crisis many people are already reusing gray water
for toilet flushing without treatment. The Standards and criteria/guidelines for water
reuse for toilet flushing and domestic water recycling for other countries is shown in
the Table 2.1.
Table 2.1: Standards and criteria/guidelines for water reuse for toilet flushing and
domestic water recycling (Surendum & Wheatly, 1998)
Parameter Toilet flushing Domestic water recycling
US Japan WHO US, EPA
USA, NSF
Australia UK (BSIRA)
Germany (g)
pH 6-9 5.8-8.6 6-9 6-9 BOD5 • 10 (mg/L) 10 20 20 Turbidity (NTU)
• 2 5 2 1-2
TC (no./100mL)
1000 (m) 200 (g)
< 10 < 1 ND 100
FC (no./100mL)
ND • 10 (E.Coli)
$ < 10 < 240
< 4 10
Residual Cl2 1 (mg/L)
Retained*
Odour Odourless NU £ Appearance NU
$ND = Not-detectable; £
The quality of different sources of gray water collected from household is
determined in the laboratory and the results were compared with the Standards of the
Table- 2.1.
NU = Not Unpleasant; (g) = guideline; (m) = mandatory; * at last holding tank in distribution line.

60
Then again there is a greater part of gray water that is generated without soap or
detergent powder during laundry washing, basin use and bathing. People sometimes
just wash and rinse their clothes in the bucket without using soap or detergent, they
also sometimes just have a bath without soap and wash of their hand and face in the
basin without using soap. This sort of gray water comprises between 30-60% of the
total volume of gray water that is generated from a household.
Comparison of quality of this kind of gray water with the Standards and criteria/
guideline represents that this water can be reused for toilet flushing without much
treatment. For reusing, addition of a little amount of bleaching powder for
disinfection is enough for the treatment of this kind of gray water and than it can be
reused for toilet flushing.
2.6 Factors Affecting Gray Water Reuse
Gray water comprises between 68% of total household wastewater on average
(Emmerson, 1998) and presents the largest potential source of water savings in
domestic residences. Most of the gray water systems proposed in urban areas are
closed-loop processes. That is, gray water is managed and reused in a decentralised
way within a household, neighbourhood or community (Al-Jayyousi, 2003).
Gray water systems are assessed in terms of technical feasibility, public health,
social acceptability and sustainability and these are reflected in Government policy
and guidelines. These criteria can be further contextualised into an environmental
framework of social, political and environmental factors.
From a broad catchment resource perspective, significant opportunities and
constraints of gray water reuse are;
• Availability of a non-potable water source.
• Local climate conditions.
• Development layouts and building/ landscaping designs.
• Local soil types.
• Community perceptions and concerns.

61
In the later part of the 19th
2.6.1 Political Factors
Century the largest increase in human life expectancy
(from about 30 years of age to over 50 years of age) occurred and was directly
attributed to the establishment of a reticulated potable water supply. This was the
creation of our current system and few changes have occurred since (Emmerson,
1998). The centralised system prevented a significant mode of transmission for
infectious disease epidemics and in urban areas this must remain the most important
factor for gray water reuse design (Al-Jayyousi, 2003).
Public concern for the environment has evolved over the past few decades.
Ecologically sustainable development (ESD) principles have been progressively
integrated with Government policies, planning and industry guidelines as well as
water resource planning. Organizations also recognize the growing environmental
concerns of the public by embracing “green” marketing and developing mission
statements and corporate goals around ESD principles (Dryzek & Schlosberg, 2003).
The recent droughts have caused Governments to re-evaluate the economic costs of
human development upon the environment in social terms. This along with positive
public opinion has provided political support for wastewater reuse systems as part of
water saving initiatives (Radcliffe, 2003). Additionally, the increased strains of
population growth and urbanisation have necessitated Governments to review and
investigate new ways of providing the additional water resources available to sustain
future growth. Gray water has a constant supply and its reuse can provide water
saving opportunities that could lead to postponement of traditional planning
techniques such as building new dams and catchment diversion projects (Gardner,
2003).
Gray water reuse at individual, neighbourhood and community scales offers simpler
and more cost effective solutions (Ludwig, 1999) for Government water saving
initiatives as they strive for policies that encourage more sustainable use of
resources.
Whilst Government policies promote and strive for profitable operation of the water
authorities, the Government must also support environmental conservation policies.

62
These policies fundamentally contradict each other and they are dualistic. Ultimately
they could hinder progress towards achieving each policy’s respective goals
(Radcliffe, 2003).
2.6.2 Social Factors
Whilst there are no reported cases of human illness or disease directly attributable to
gray water reuse (Emmerson, 1998), the limited studies investigating the levels of
micro-biological contamination of gray water indicates the potential for human
infection is high. Also, the traditional centralised sewer collection and treatment
system that is currently used was successfully designed to protect human health. On-
site reuse of gray water marks a departure from this centralised health-driven system
and so attracts legitimate public concern.
Public health concerns regarding the potential for gray water becoming a mode of
transmission for infectious diseases and viruses in high density urban areas is a
significant issue and must be addressed by gray water reuse system design.
Additionally, the sensitive public health concerns over gray water reuse systems
make them vulnerable to wider and more negative publicity caused from any
specific health-related accidents (Radcliffe, 2003). However, no such incidents have
been reported to date (Emmerson, 1998).
Community or public support for gray water reuse systems is critical to the success
of implementing policies and guidelines and is conditional upon:
• Community involvement in decision making processes.
• Public education.
• Community demographics.
• Trust in water authorities. (Marks, 2004)
Trust in water authorities was identified as the major factor in gaining public support
and historically strong public trust has always been given to all public utilities who
provide essential community services (Marks, 2004).
There is a higher acceptance for non-potable reuse applications for wastewater
(Radcliffe, 2003) and studies in the USA indicate greater acceptance as the degree of

63
human contact decreases (Marks, 2004). Also, these studies indicated that when
options for reuse are evaluated by the community, the most important factors in
order of priority are;
• Human health,
• The environment,
• Conservation,
• Treatment costs, and
• Distribution costs (mainly for third pipe systems). (Marks, 2004)
These are similar to in Bangladsh, however gray water reuse does not attract the
public caution that effluent reuse does (Radcliffe, 2003).
The global environmental issue such as population growth, urbanisation and climate
change is directly related to recent droughts and it affects the communities. This has
heightened public awareness of the natural water cycle which they are part of and
the environmental strains imposed by human development. This has encouraged
Governments and communities to consider their actions in respect to the
environmental effects imposed by them (Radcliffe, 2003).
Decentralisation of the traditional wastewater collection and separate disposal
system is caused by using on-site gray water treatment systems in urban areas. As a
result, reusing gray water within the same space as it is generated highlights the
environmental consequences of user’s social habits directly (Al-Jayyousi, 2003).
Government gray water reuse guidelines also highlight and reinforce these
precautions. Therefore users must scrutinise the environmental effects of the
products and chemicals that they use as they become more environmentally aware
and responsible for their actions. This could have a flow-on effect to manufacturers
and businesses as consumer habits begin to change.
However, if gray water is used to substitute garden irrigation it is debatable whether
it will actually reduce overall water consumption habits. There are no studies to
investigate this area at present.

64
2.6.3 Environmental Factors
Traditionally, new water resource planning involved the development of new dams
and catchment water diversion schemes. The link between the natural environmental
costs (such as loss of habitat, landscape and groundwater changes) and human health
from these developments was not given great consideration (Gardner, 2003).
However, the recent natural disasters in Bangladesh such as drought, fire and
flooding has highlighted the vulnerability of the environment and the costs to human
health as a consequence of these large projects (Radcliffe, 2003).
The importance of determining and monitoring the capacity of the environment to
sustain human activity is now more widely understood and is recognised in striving
to achieve more sustainable living practices. These environmental factors are
encapsulated in Ecologically Sustainable Development (ESD) principles (Gardner,
2003).
The commitment by Governments to integrate ESD principles into public planning
now ensures that factors such as resource allocation and environmental costs are
considered in development processes (Sydney Water, 2002).
As a result, policies that address future water resource requirements investigate the
environmental costs of new water sources such as building dams or diverting
catchment water for human use and in comparison, policies that promote water
saving solutions are more favourable (Sydney Water, 2002). Reusing gray water at
on-site, neighbourhood or community scales can in part abate or avoid the
environmental costs of new water resource projects.
By reusing gray water, households have the capacity to reduce potable water
demand by 30-70% (Radcliffe, 2003) and this in turn reduces the wastewater volume
to be collected and treated at wastewater treatment plants. This can then reduce the
overall nutrient load during treatment and on the environment when the treated
wastewater is returned to the environment.
New residential developments could then reduce infrastructure requirements by
reducing sewer collection pipe capacities and sizes and treatment plants could
65
reduce size (Emmerson, 1998). Additionally, the energy required to pump and treat
the wastewater would be reduced and considering most of the energy provided in
Bangladesh is from non-renewable sources such as coal, natural gas and oil,
reducing energy consumption would in turn reduce the environmental strains of
extracting and burning these fuels.
The higher nutrient loads and turbidity effects of polluted wastewater being returned
to the environment results in immediate and significant changes to the environment
it is being discharged into (Gardner, 2003). By reducing mainly the volume of this
pollution the environment in principle should improve, however studies on the
quality of the improvement are lacking and therefore difficult to quantify.
The reduction in potable water demand generally would contribute to postponing the
requirement for developing new water sources (Hunter, 2004). This is usually
quantified
in terms of extending the time by which future new developments can be undertaken
without an increase in public water source and head works infrastructure.
However, whilst reusing gray water can reduce the environmental effects of potable
water demand and wastewater collection and treatment on a broad scale, at the local
scale its use on gardens and recreational areas presents many more issues.
Watering gardens or irrigating grounds with gray water introduces a level of
pollution to the landscape which may change soil characteristics, effect nutrient
availability or poison plants (Al-Jayyousi, 2003). The nature of these potential
problems are mainly long-term and due to gray water reuse being only recently
embraced, these potential environmentally-related on-site issues are still largely
unknown as there is a lack of studies that verify them. Many guidelines promote
vigilant checking of adverse environmental impacts such as soil pH and plant
growth factors (Department of Health WA, 2002).
The high dissolved solid content in gray water indicates that it is mainly consists of
salts that could increase the salinity and/ or sodicity of soils (Al-Jayyousi, 2003). A
soil with high clay content can be more affected by gray water with a high salt

66
content and as a result may become sodic and increase the likelihood of erosion as
well as hinder a plant’s ability to securely anchor itself. Also a soil with high salinity
can severely reduce a plants’ ability to take up water and nutrients (Singer & Munns,
1996).
Additionally, the influence of gray water-related salinity and other pollution
problems in soil may also contaminate groundwater supplies and influence other
geographic locations far away from the source of the pollution, thus having a much
wider effect (Emmerson, 1998).
If many households within the same geographic location reuse gray water on
gardens then collectively the possible adverse environmental affects described above
will be more widely exacerbated if soil types and groundwater conditions were
greatly affected by the pollution levels in the gray water.
However, these adverse environmental consequences are highly variable as a result
of the variable quality and quantity of gray water reused, the variability of soil
conditions, the variability of groundwater conditions and the variability of climatic
conditions such as rainfall. These highly situational and geographic conditions make
the determination of these environmental factors very difficult and may only be
realised over the long term (Emmerson, 1998). Thus if a problem does occur, it may
be realised when it is too late or more difficult to abate.
The relatively low levels of microbial contamination of gray water can be effectively
processed by the bacteria within soil (Jeppesen, 1996). However, if untreated gray
water was stored on the soil surface (i.e. ponding) or were released as droplets to the
atmosphere, (i.e. spray irrigated) the high availability of oxygen could potentially
increase pathogen colony numbers rapidly and substantially increase the risk of
disease from human contact as well as become breeding areas for mosquitos and
other vermin.

67
The nitrogen and phosphorous levels in gray water will generally provide essential
nutrients for plants, having a positive environmental effect and may reduce or
ameliorate the requirement for fertiliser on many gardens and parks (EPA Victoria,
2004), which can create adverse affects such as toxic run-off during rainfall events.
The environmental strains caused from the recent Bangladesh droughts and the
generally accepted global climate changes have altered the political and social
factors that hinderes the acceptance of gray water reuse in urban areas. However,
public health must be addressed and maintained to gain general community
acceptance of gray water reuse as part of Government water saving policies and
guidelines.
Whilst gray water reuse has positive broad environmental sustainability affects, the
specific environmental consequences of its application are as yet not fully
determined.
Also, although the costs of the technologies associated with gray water reuse
systems have reduced considerably, further cost savings may be realised in reduced
or postponed public infrastructure and if the true cost of potable water supply is
realised (PWC, 2000).

68
Chapter-3
QUANTIFICATION OF GRAY WATER
3.1 Introduction
Initially, an understanding of the current factors surrounding the issues of gray water
and its reuse possibilities in urban environments were gained by reviewing relevant
overseas policy frameworks, guidelines and their supporting reports. To determine
the actual amount of gray water produced from households, questionnaire surveys
were performed at different parts of Dhaka city. This Chapter presents the structure
of the questionnaire, the procedure for the collection of household gray water related
data and the results of the questionnaire survey. In the questionnaire survey, the
household characteristics where survey was performed, water supply system in the
households and its problems, the sources and quantity of gray water and their
disposal method were determined and lastly peoples perception towards reuse of
gray water for toilet flushing and other simple household works was evaluated.
3.2 Questionnaire Survey
The questionnaire survey provides information relating to the possible design and
implementation of a system for treating gray water in the communities of the Dhaka
city. Semi-structured questionnaire interviews were undertaken in different areas of
the city. Rather than attempting to collect an exhaustive list of problems as already
determined in previous water crisis related studies, this sociological part of the study
was attempted to collect gray water related data and to identify the community’s
perception and choices to reuse gray water.
The semi-structured interviews were specifically aimed to:
Assess the current situation in terms of gray water generation and
management in different area of Dhaka city.
The quantification of water uses for different domestic purposes mainly by
questionnaire survey and by direct measurement in some cases.

69
Evaluate the community’s perception about environmental and health risks
linked to reuse of gray water for the selection of the treatment process.
The collection of information was done in different areas of Dhaka City. It combines
results from a series of about hundred interviews and from direct observations.
The questionnaire used in this survey is presented in Appendix-A. It combines
questions and observations used by the interviewer and were completed during the
time of the interviews. Four main themes constituted the questionnaire:
a) Household characteristics,
b) Access to hardware,
c) Waste (Gray) water disposal and
d) Level of perception of the risks.
For quantitative questions such as the amount of water consumed per day estimates
were made in terms of the number of buckets used per day. In order to highlight the
beneficial or inhibiting environment for a local gray water disposal system, the
occupants were asked about previous experiences of sensitization campaigns and
participation in any water association.
3.2.1 Household Characteristics
Survey was done mainly to gain knowledge about the families. The number of
residents, their economic status and general condition are determined in this section.
This survey was done in different areas of Dhaka city i.e. Bashabo, Motijheel,
Shahjahanpur, Madartek, Kallyanpur, Shyamoly, Uttara, Banani. This study
comprises data collected from people who live in buildings. Slum dwellers were not
included in this study. The number of children and there age is specially included in
this study, because little children’s wet clothes get washed and their faeces gets
mixed up with gray water which makes it difficult to treat.

70
3.2.2 Access to Hardware
In this section data was collected to know the source of water supply in the
household mainly to calculate the total amount of water required for each household
per day. Waste generation and disposal for each household; number of toilet, their
location; method of children faeces disposal data were also collected. This data
helped us to know about their status and if the gray water produced is contaminated
by this waste.
3.2.3 Waste (Gray) Water Disposal
This is the main and most important part of the survey. The total amount of gray
water production for each household, their sources, the time of most gray water
generation, their disposal method and their characteristics data are gathered in this
section. The amount of soap or washing powder used, to produce this gray water is
also determined. The quality of gray water depends on how much soap or washing
powder is used.
3.2.4 Level of Perception of the Risks
This study helped us to know if the people are aware of gray water related risks or
it’s reuse perspectives. The acceptance of gray water reuse and recycle to the people
is also evaluated in this section.

71
3.3 Questionnaire Survey Results on Different Areas of Dhaka City
3.3.1 Data Collection
The Questionnaire survey (Shown in Appendix-A) was done in different areas of
Dhaka city to asses the general condition of the city's water supply and gray water
management system. In this survey building dwellers with a medium income status
were mainly targeted to high light the general condition of Dhaka city. The survey
was done by door to door interviews and on some occasions by direct observations.
The data collected were gathered mostly from the mistresses of the houses who have
a clear understanding of their house and their family member’s behavior.
3.3.2 Household characteristics
The survey is done on different areas of Dhaka city. This survey comprises data on
the number of residents in each family, their occupation, and number of children in
the family their age and number of years they are living in the same area.
Table: 3.1 Number of Family’s Surveyed in Different Areas
Area Family’s Kallyanpur 28 Shyamoly 11 Uttara 9 Gulshan & Banani 14 Dhanmondi 7 Bashabo & Madartek 21 Shahjahanpur 10 Total 100
This data helps to understand the water requirement and the waste water produced
from each household along with their sources. If the family has more people with
job then the demand of water and production of waste water gets lower during the
daytime because most of the day they spent outside the house. And if the family has
babies of age less than 1 year then their water demand and waste water production
gets higher. This survey showed that for building dwellers with a medium status, the
average number of residence in each household is 4 that means usually every family
has at least 1 child to 3 children but more than 3 children is now a days very rare.

72
The number of children in each household is 2-3. As people's general habit is to live
in a friendly and known environment, the occupants were mostly living in the same
area for 7-12 years, this data was mainly collected because people who live in a
same area for a longer period of time has a clear knowledge about the merits and
demerits of water supply system of the area.
Table: 3.2 Household Characteristics
Item Number Total No. of Households Surveyed 100 Avg. No. of Residents in each Households 4 Avg. No. of Children in each Households 2-3 Avg. No. of Occupants with Job in each Households 1-2 Avg. No. of Years for the families living in the Same Area 10
The survey was done on 100 families in different part of Dhaka city. As shown in
Table: 3.1, the average number of occupants in each family is 4 including an average
number of children (under five years of age) are 1 and total no. of children is 2-3.
The occupants have been living in the area for an average of 10 years.
3.3.3 Access to Hardware
DWASA’s water supply pipe network was the main source of water for the
households. However because of some problems with leaks or broken pipes and
mainly the irregularities of WASA's water supply, tube wells also became an
important source of water for those with piped water. Moreover, due to the fact that
DWASA's water supply is not meeting the demand, most of the buildings in Dhaka
have a high horse power water pump tapped in their main water supply system and
at the time of water crisis they use this pump to fill their underground water tank to
get water for their requirement. This unreliability of the water source made it
difficult to determine accurately the water consumption for some of the households.
The reading of the water meters are also not accurate because during water crisis
most of the time people get water from hand pumps (every area has one or two hand
pumps installed in there area) or from neighbors.

73
Table: 3.3: Per Capita water consumption per day
Sources for Per capita water use each day.
Amount in liter Amount in %
Washing Dish 10 6.84 Laundry 22 15.04 Bathing and Washing 48.5 33.16 Cleaning house 7 4.78 Prayer 3 2.05 Cooking and Drinking 11 7.52 Basin 6.6 4.51 Car Wash 0.14 .097 Toilet 38 26.1 Total 146.24 100%
As shown in the Table: 3.2 the average quantity of water required for one person
calculated was approximately 146 l/day. The amount of water for each source shown
in the table is average amount calculated from the data collected during the survey.
Depending on availability of water and nature of a person this quantity can be as low
as 90 l/day to as high as 210 l/day. This water consumption calculated is not only for
drinking, bathing and toilet purposes but for all the uses for a person in a whole day.
Regarding sanitation, most of the families have two toilets in their house with some
exceptions. All the toilets were located inside their dwellings. Solid waste was
collected at regular intervals from houses by private companies. Comments about
the problems of smell and general unsightliness generated from waste dumping sites
on the street were added by the inhabitants. It is clear from the information gathered
that water supply service was not acceptable in terms of quality, quantity and access
in most of the cases.

74
10
22
48.5
73
116.6
0.15
38
0
10
20
30
40
50
60
WashingDish
Laundry Bathingand
Washing
CleaningHouse
Prayer Cookingand
Drinking
Basin Car Wash Toilet
Uses of water
Am
ount
of w
ater
con
sum
ptio
n in
lite
r
Figure-3.1: Per capita per day water consumption for different purposes at
households.
The graph above shows the per capita water consumption per day for different
purposes at households. The source of highest water used by one is bathing and
washing, then toilet followed by laundry. Car wash has the lowest amount because
only a few families own a Car. But the above graph is a average for all the family
members under survey.
3.3.4 Gray Water Production and Disposal
As for the quantification of gray water production it was very hard to get the actual
amount in liters because nobody could tell the real amount produced in liters. The
quantity was measured by just taking the number of buckets of water used for each
purpose and their sizes.
From the data collected under this section at first the residents of Dhaka city were
divided into two classes i.e. class-1 and class-2. The families who have a higher
economic status are in class-1 and families with a medium economic status are in
class-2. In this regard the average per capita gray water production is 82.5 l/day for
class-1 people and 98 l/day for class-2 people. The difference is because at higher
standard living people use washing machine, closed door air conditioned

75
environment and vacuum cleaners which requires less cleaning involving water. And
comprising both results for general condition the amount of per capita gray water
production for per person is 95 l/day. Again these results are calculated taking
average value of each gray water source this value can be as low as 50 l /day to as
high as 120 l /day depending on supply waters availability, weather condition and
each person’s hygienic behavior.
Table: 3.4 Per capita gray water production per day.
Sources for Per capita Groy water production each day.
Amount in liter Amount in %
Washing Dish 10 10.49 Laundry 22 23.10 Bathing and Washing 48.5 51.00 Cleaning house 7 7.35 Cooking 1 1.04 Basin 6.6 6.93 Car Wash 0.15 0.16 Total 95.25 100 %
The sources of gray water for households are washing dish, laundry, bathing, and
cleaning house, cooking, car washing and basin. The production of gray water from
each of these sources is shown in the chart below. It shows that bathing and washing
generates the highest amount of gray water followed by laundry and dish washing.
The time of most gray water produced from household is in the morning session and
before lunch. In responses to questions related to the disposal of their gray water (or
reuse) were relatively homogenous. All the gray water and waste water are disposed
in piped drains or septic tank. Average no. of soap used monthly is 4; Shampoo is
one bottle, Toothpaste one tube, washing powder 2-4 kg. The figures below show
results of the gray water survey.
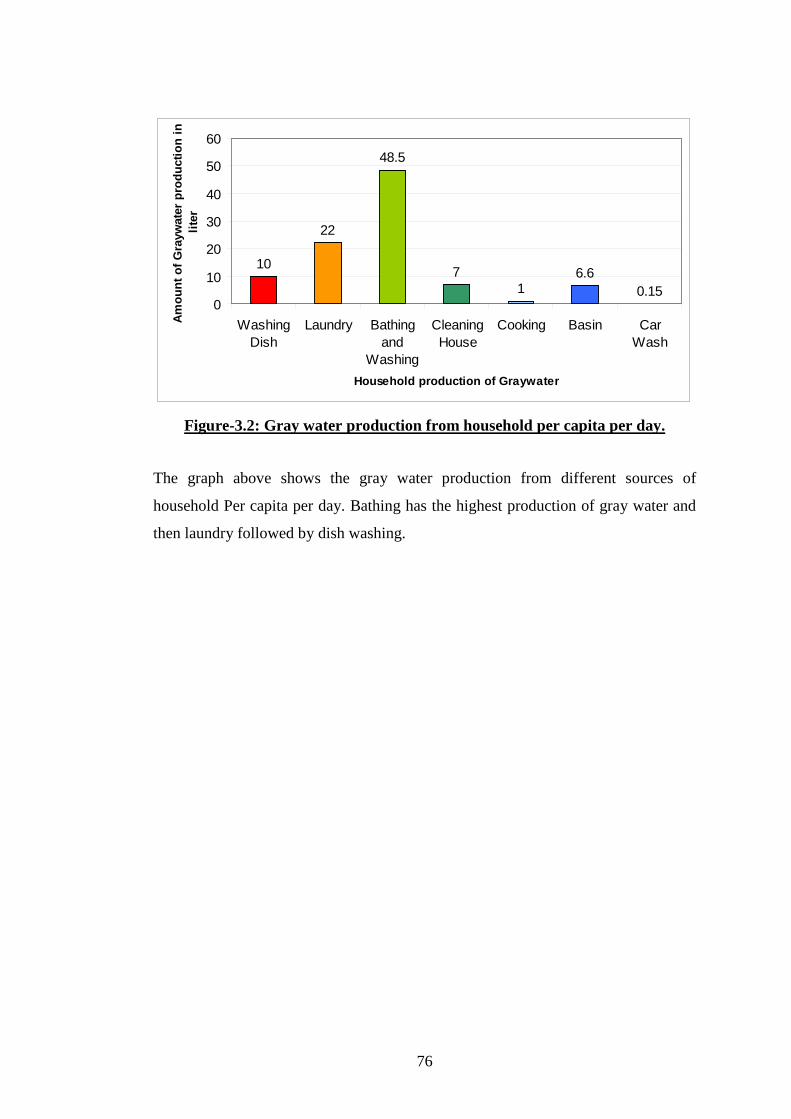
76
10
22
48.5
71
6.60.15
0
10
20
30
40
50
60
WashingDish
Laundry Bathingand
Washing
CleaningHouse
Cooking Basin CarWash
Household production of Graywater
Am
ou
nt
of
Gra
ywat
er p
rod
uct
ion
in
li
ter
Figure-3.2: Gray water production from household per capita per day.
The graph above shows the gray water production from different sources of
household Per capita per day. Bathing has the highest production of gray water and
then laundry followed by dish washing.

77
3.3.5 Level of Perception of the Risks
In this part people's knowledge about gray water and their perception towards gray
water reuse possibility is evaluated. Many people are aware of gray water related
risks or it’s reuse perspectives, but most of the people do not think gray water
related risks for the environment is a major thing. Some of them are really
knowledgeable about this prospect and knows how to reuse gray water for other
purposes. Generally most of the interviewees know that gray water contaminates
environment and harmful to health but they are not clear about this pollution. When
the crisis for supply water is acute then some people (about 35% of total family
surveyed) even reuse gray water produced from laundry for toilet flushing, some
people use this laundry gray water for gardening. Many interviewees asked the
method for treatment and reuse of gray water because they suffer greatly during
water crisis. Toilet flushing is the most acceptable reuse method for recycled gray
water. But if the water supply is adequate then none of them agreed to reuse gray
water for any purpose.
70
20
10
0
10
20
30
40
50
60
70
80
Yes No Maybe
Peoples choices for reusing graywater
Per
cent
age
of c
hoic
e
Figure-3.3: Peoples perception towards gray water reuse
About 70% of total people surveyed agreed and are willing to reuse gray water at the
time of acute water supply crisis, 20% said they do not want to reuse gray water for
any purposes and about 10% expressed their dilemma about reusing gray water. But
the fact remains that if the water supply is adequate they will not reuse gray water
for any purpose.

78
3.4. Conclusions Based on the questionnaire survey results, the following conclusions can be drawn:
1. DWASA's water supply is not at all adequate regarding consumers demand
and the water supply and drainage system in Dhaka city must be improved.
2. Concerning household characteristics as determined by the survey, the
average number of occupants in each family is 5 including an average
number of children (under five years of age) are 1 and total no. of children is
2-3. The occupants have been living in the area for an average of 10 years.
3. The average quantity of water required for one person is approximately 146
l/day and depending on availability of water and nature of a person this
amount can be as low as 90 l/day to as high as 210 l/day
4. The average quantity of gray water production for per person is
approximately 95 l/day. This value can be as low as 50 l /day to as high as
120 l /day depending on different causes.
5. Bathing and washing generates the highest quantity of gray water which is
approximately 50 l/day followed by laundry 22 l/day per person.
6. The time of most gray water produced from household is in the morning
session and before lunch.

79
Chapter-4
CHARACTERIZATION OF GRAY WATER
4.1 Introduction
After the quantification of gray water generated from household the quality of gray
water produced from different sources like laundry, bathing, basin was determined
by Turbidity, Total Dissolved Solid, Suspended Solid, Biochemical Oxygen
Demand, Chemical Oxygen Demand and Feacal Coliform tests. These tests were
also done using tap water from which this gray water was generated.
4.2 Testing of Gray Water Samples
Several tests were done to determine the quality of gray water from different
household sources. These tests were TDS, TSS, BOD, COD, Turbidity and FC. The
gray water samples collected during the experimental investigation were analyzed
for these parameters following Standard methods. The main sources of household
gray water were laundry, bathing and basin water which were taken for the
determination of quality and the other sources were excluded because either they
had little generation rate or their quality needed more complex treatment, i.e. like
washing dishes had oily and organic substances and laundry black water had more
mud or dusty substances, which made them difficult to treat in a simple setup. A
brief description of the gray water samples that were collected for quality testing is
as follows.
4.2.1 Description of Gray Water Samples
Laundry black water, is generated when the clothes are put in a bucket mixed with
washing powder and water that is kept for half to one hour onwards to wet the cloths
and clean properly. Laundry mix water, is produced during the whole process of
washing the clothes excluding the laundry black water. Bath water is produced from
bathing with soap or without soap. Basin water is simply the water generated from
basin use like brushing, hand and face washing but excluding other waters like dish
washing which contains oil in them.
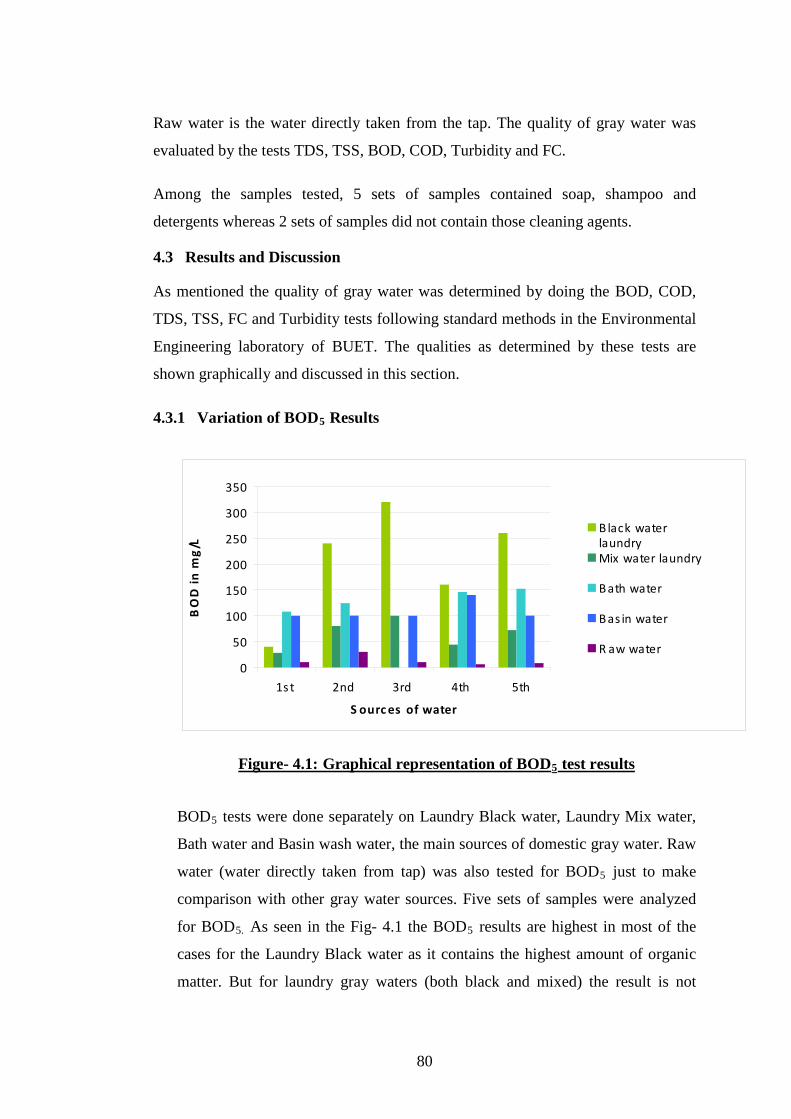
80
Raw water is the water directly taken from the tap. The quality of gray water was
evaluated by the tests TDS, TSS, BOD, COD, Turbidity and FC.
Among the samples tested, 5 sets of samples contained soap, shampoo and
detergents whereas 2 sets of samples did not contain those cleaning agents.
4.3 Results and Discussion
As mentioned the quality of gray water was determined by doing the BOD, COD,
TDS, TSS, FC and Turbidity tests following standard methods in the Environmental
Engineering laboratory of BUET. The qualities as determined by these tests are
shown graphically and discussed in this section.
4.3.1 Variation of BOD5
0
50
100
150
200
250
300
350
1s t 2nd 3rd 4th 5th
S ourc es of water
BO
D in
mg/
L
B lack waterlaundryMix water laundry
B ath water
B as in water
R aw water
Results
Figure- 4.1: Graphical representation of BOD5
BOD
test results
5 tests were done separately on Laundry Black water, Laundry Mix water,
Bath water and Basin wash water, the main sources of domestic gray water. Raw
water (water directly taken from tap) was also tested for BOD5 just to make
comparison with other gray water sources. Five sets of samples were analyzed
for BOD5. As seen in the Fig- 4.1 the BOD5 results are highest in most of the
cases for the Laundry Black water as it contains the highest amount of organic
matter. But for laundry gray waters (both black and mixed) the result is not

81
stable as it always varies with the type and no of clothes washed, the process of
washing clothes, the quantity of water used and also on the amount of soap or
detergent used. The Second highest BOD5 value is for the Bath water. In the
third test unfortunately there was some problem with the sample of Bath water
while performing tests and the BOD5 and COD result could not be taken. Unlike
laundry water, the BOD5 values of Bath water and Basin water are relatively
stable. Laundry Mix water has the fourth highest organic matters and as expected
Raw water has the lowest BOD5 results. The average BOD5
0
50
100
150
200
250
300
350
400
1s t 2nd 3rd 4th 5th
S ourc es of Water
CO
D in
mg/
L
B lack water laundry
Mix water laundry
B ath water
B as in water
R aw water
values are 204, 65,
133, 108 and 13 mg/l for black laundry water, mix laundry water, bath water,
basin water and raw water respectively.
4.3.2 Variation of COD Results
Figure- 4.2: Graphical representation of COD test results
COD tests as BOD5 were also done separately on Laundry Black water, Laundry
Mix water, Bath water, Basin wash water and Raw water. COD results are
related to BOD5 results and the graph is almost similar to that of BOD5 graph,
only the COD results are a little higher for each sample. The average COD
values are 270.5, 106, 200, 174 and 33 mg/l for black laundry water, mix
laundry water, bath water, basin water and raw water respectively.

82
4.3.3 Variation of Turbidity Results
0
100
200
300
400
500
600
700
1s t 2nd 3rd 4th 5th
S ourc es of Water
Turb
idity
in N
TU
B lack water laundry
Mix water laundry
B ath water
B as in water
R aw water
Figure- 4.3: Graphical representation of Turbidity test results
Again Turbidity tests were done on Laundry Black water, Laundry Mix water, Bath
water, Basin wash water (the main sources of domestic gray water) and on Raw
water. The results are shown in the Fig- 4.3. As seen in the Figure the turbidity
results are not at all stable or constant for any of the gray water samples. Depending
on the type and no of clothes washed, the process of washing clothes, the amount of
water used and also on the amount of soap or detergent used the turbidity results
change at every wash. As turbidity is caused by individual particles (Suspended
Solids), the results indicate that laundry waters and Bath water has the highest
particle contents followed by basin water and lastly raw water. The average turbidity
values are 200, 98, 135, 86 and 1.5 NTU for black laundry water, mix laundry water,
bath water, basin water and raw water respectively.

83
4.3.4 Variation of FC Results
0
1000
2000
3000
4000
5000
6000
7000
1s t 2nd 3rd 4th 5th
S ourc es of water
FC in
(cfu
/100
ml)
B lack waterlaundryMix water laundry
B ath water
B as in water
R aw water
Figure- 4.4: Graphical representation of FC test results
FC tests were also done on all the selected sources. The results are shown in the Fig.
4.4. As the results depend on the Fecal Coliform content, the graph represents that
laundry black water generally contains the highest fecal coliforms. The second is
bath water, laundry mix water is third highest then consecutively basin gray water is
fourth and raw water is at the bottom as expected. Again the results are not at all
stable or constant for any of the gray water sample, as we can see at the first set of
test the highest was basin gray water and in the second test bath water has the most
fecal coliform content. In the 1st set of samples the basin water that was collected
contained more FC then any of the other results because an amount of kitchen waste
water was added but in the other tastes the kitchen waste water was excluded. This
variation in results indicates that the gray water that mostly came in contact with
human contains the highest coliforms. The result that Raw water (collected directly
from the supply system) also contains fecal coliforms is very disturbing because the
data is not very small it goes as high as 370 (cfu/100 ml) and the average comes
(180 cfu/100 ml) which shows that the quality of our supply water is very poor. The
average FC values calculated are 3440, 2350, 2800, 2920 and 180 cfu/100 ml for
black laundry water, mix laundry water, bath water, basin water and raw water
respectively.

84
4.3.5 Variation of Suspended Solids Results
0
500
1000
1500
2000
2500
3000
1s t 2nd 3rd 4th 5th
S ourc es of water
SS
in m
g/l
B lack waterlaundry
Mix waterlaundry
B ath water
B as in water
R aw water
Figure- 4.5: Graphical representation of S.S test results
S.S tests were also performed on each selected sample, as suspended solids content
is related with turbidity, the resultant graph is similar to that of the turbidity graph.
The data collected shows that the results are not stable and changes at every wash.
Depending on the type and no of clothes washed, the process of washing clothes, the
amount of water used and also on the amount of soap or detergent used the S.S
results change at every wash. As caused by individual particles (Suspended Solids),
the average S.S values calculated are 1296, 737, 978, 672 and 17 mg/l for black
laundry water, mix laundry water, bath water, basin water and raw water
respectively.
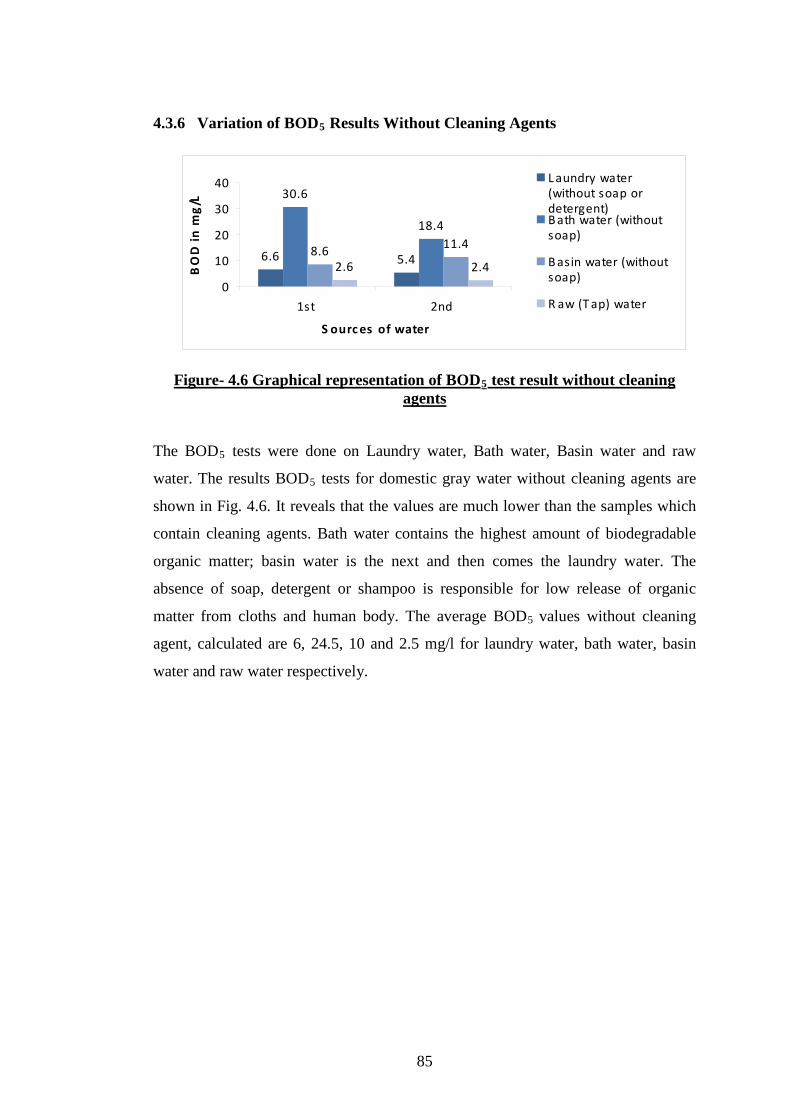
85
4.3.6 Variation of BOD5
6.6 5.4
30.6
18.4
8.6 11.4
2.6 2.40
10
20
30
40
1st 2nd
S ourc es of water
BO
D in
mg/
LL aundry water(without soap ordetergent)B ath water (withoutsoap)
B asin water (withoutsoap)
R aw (T ap) water
Results Without Cleaning Agents
Figure- 4.6 Graphical representation of BOD5 test result without cleaning
agents
The BOD5 tests were done on Laundry water, Bath water, Basin water and raw
water. The results BOD5 tests for domestic gray water without cleaning agents are
shown in Fig. 4.6. It reveals that the values are much lower than the samples which
contain cleaning agents. Bath water contains the highest amount of biodegradable
organic matter; basin water is the next and then comes the laundry water. The
absence of soap, detergent or shampoo is responsible for low release of organic
matter from cloths and human body. The average BOD5
values without cleaning
agent, calculated are 6, 24.5, 10 and 2.5 mg/l for laundry water, bath water, basin
water and raw water respectively.

86
4.3.7 Variation of COD Results Without Cleaning Agents
10 9.1
51
28
13.417.5
4 3.8
0
10
20
30
40
50
60
1s t 2nd
S ourc es of wa ter
CO
D in
mg/
LL aundry water (withouts oap or detergent)B ath water (withouts oap)B as in water (withouts oap)R aw (Tap) water
Figure- 4.7 Graphical representation of COD test result without cleaning agents
COD tests were also done on the samples. As COD results are related to BOD5
results and the graph is almost similar to that of BOD5 graph. The COD results for
the gray water samples without cleaning agents are shown in Fig. 4.7. Similar to the
BOD5 results the values are much lower than the samples which contain cleaning
agents. The average COD values without cleaning agents, calculated are 9.5, 40,
15.5 and 4 mg/l for laundry water, bath water, basin water and raw water
respectively.

87
4.3.8 Variation of Turbidity Results Without Cleaning Agents
13.1
8.89.2 8.7
4.56.6
1.28 2
02468
101214
1st 2nd
S ourc es of Water
Turb
idity
in N
TUL aundry water (withoutsoap or detergent)B ath water (without soap)
B asin water (withoutsoap)R aw (T ap) water
Figure- 4.8 Graphical representation of turbidity test result without
cleaning agents.
Turbidity tests were also done on Laundry water, Bath water, Basin water and Raw
water. The results are shown in the Fig- 4.8. As turbidity results are depended on the
solids content of the sample the results indicate that without the use of any kind of
cleaning agent the resultant washing cleans less effectively and thus contains very
low solids. The process of washing clothes, bathing and washing hand without any
cleaning agent is same so the results of the two sets of sample are very much similar.
Laundry water generally contains highest suspended solids so it has the highest
result for turbidity. After that bath water and basin water samples have the second
and third highest results. The average turbidity values without cleaning agents,
calculated are 11, 9, 5.5 and 2 NTU for laundry water, bath water, basin water and
raw water respectively.

88
4.3.9 Variation of F.C Results Without Cleaning Agents
1400 15001200
1900
900 1000
80 1200
500
1000
1500
2000
1st 2nd
S oures of water
FC in
cfu
/100
ml
L aundry water (withoutsoap or detergent)B ath water (withoutsoap)B asin water (withoutsoap)R aw (T ap) water
Figure- 4.9 Graphical representation of F.C test result without cleaning agents
The F.C tests were also done on Laundry water, Bath water, Basin water and raw
water. The graph shows that the results are different for the two set of tests done on
the samples. In the first test set the highest in fecal colifirm content is laundry water,
bath and basin water samples are second and third highest. But for the second set of
samples bath water is highest and laundry water is second highest. The duration time
for human contact and the presence of human body wastes usually determines the
fecal coliform content results. The result indicates that Laundry water, Bath water,
Basin water contains very high amount of the fecal colifirm regardless if the
washing process includes cleaning agent or not. The average F.C values without
cleaning agents, calculated are 1450, 1550, 950 and 100 cfu/100ml for laundry
water, bath water, basin water and raw water respectively.
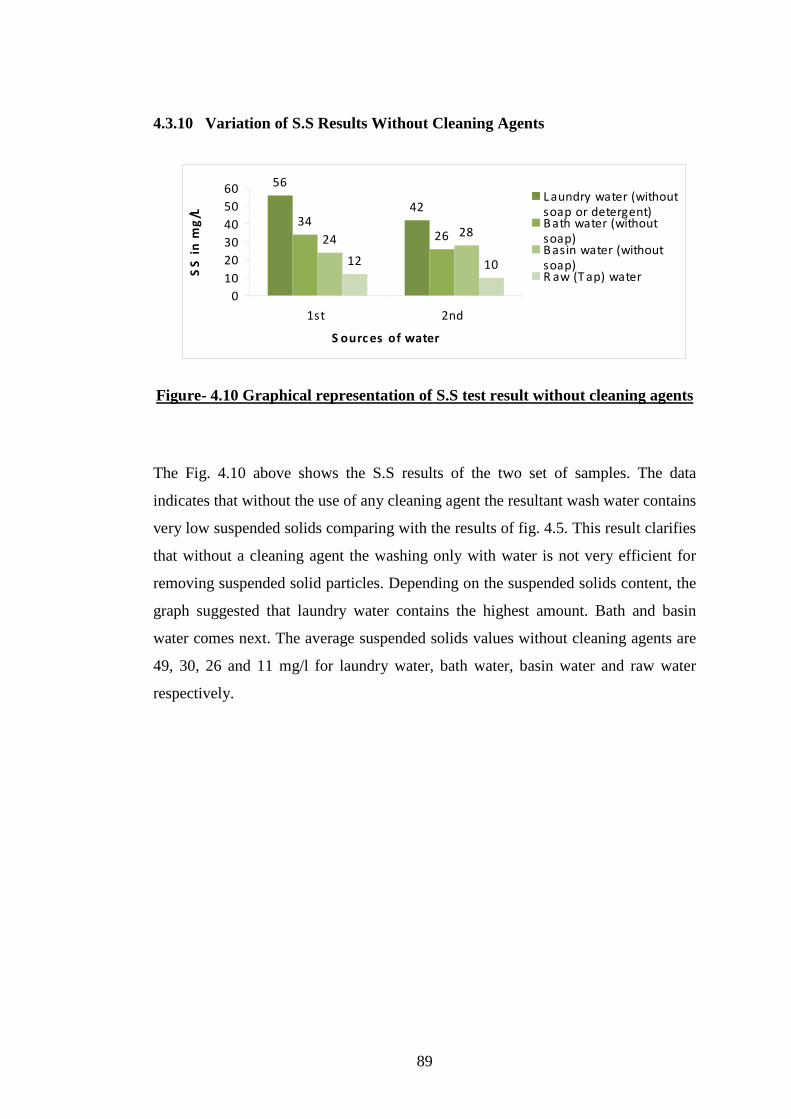
89
4.3.10 Variation of S.S Results Without Cleaning Agents
56
4234
2624 28
12 10
0102030405060
1st 2nd
S ourc es of water
SS
in m
g/L
L aundry water (withoutsoap or detergent)B ath water (withoutsoap)B asin water (withoutsoap)R aw (T ap) water
Figure- 4.10 Graphical representation of S.S test result without cleaning agents
The Fig. 4.10 above shows the S.S results of the two set of samples. The data
indicates that without the use of any cleaning agent the resultant wash water contains
very low suspended solids comparing with the results of fig. 4.5. This result clarifies
that without a cleaning agent the washing only with water is not very efficient for
removing suspended solid particles. Depending on the suspended solids content, the
graph suggested that laundry water contains the highest amount. Bath and basin
water comes next. The average suspended solids values without cleaning agents are
49, 30, 26 and 11 mg/l for laundry water, bath water, basin water and raw water
respectively.

90
4.4 Reusing Gray Water for Toilet Flushing and Laundry
The quality determined by tests showed that for Bangladeshi environment to reuse
gray water for toilet flushing the most simple and cost effective way is to disinfect
the gray water by using bleaching powder.
Due to high likelihood of human contact with this reuse application, disinfection is
required. However, for laundry washing it is more desirable to lower the turbidity
and neutralise the pH of the gray water during the treatment process. A tertiary
treatment system would provide this higher reuse quality, but the costs are higher
and mostly suits multi-dwelling scales where these higher costs can be shared.
Gray water reuse for toilet flushing offers significant water savings, however if a
gray water reuse system requires upgrading to a secondary treatment level only for
this purpose (i.e. only require a primary system for garden watering), it can be cost
inhibitive.
An alternative from using or upgrading to a secondary gray water treatment system
is to use a combined hand wash/ cistern system (Ludwig, 1994). This is a proprietary
product and is used extensively in Japan. It is shown in Figure 2.10 and involves
locating a wash basin that is supplied by mains water and located directly above the
toilet cistern. It is an integral part of the cistern structure and the gray water waste
from the wash basin drains directly into the cistern storage to be used for the next
toilet flush. The cistern also uses the mains to top-up if the washbasin gray water
does not fill the required flush storage.
Effective and efficient gray water treatment systems designed to Government
regulations and guidelines can be utilised for single and multi-dwellings. The variety
of treatment processes available allow site specific determining factors such as
topography, soil, climate and building designs a well as different cost budgets and
reuse applications to be accommodated. Single dwelling gray water reuse systems
are most adaptable for retrofitting to existing building sites.
Biological treatment processes can be more effectively utilised for multi-dwelling
gray water reuse systems and the occupants of these dwellings generally do not have

91
as much demand for garden watering/ irrigation. However, kitchen waste can be
included and the quality of the treated gray water produced from biological
treatment can be applied for toilet flushing and laundry applications in addition to
irrigation.
Maintenance is critical to ensure that public health is kept a priority concern. While
all gray water treatment processes include a sewer overflow/ diversion system to
guard against treatment and public health failure, all of the gray water reuse systems
defined requires regular maintenance to operate efficiently and effectively for the
applications they are designed.
To alleviate this key concern, maintenance should be carried out by trained operators
on a regular basis. The scope of this task would include gray water treatment system.

92
4.5 Conclusions
• The quality of gray water determined is not stable. It always varies
depending on a number of causes. The quality of bath water and basin water
is comparatively stable than the other sources. But the quality of laundry
water always varies. The quality of gray water changes almost at every wash.
• The average BOD5
• The average COD
values are 204, 65, 133, 108 and 13 mg/l for black
laundry water, mix laundry water, bath water, basin water and raw water
respectively.
• The average turbidity
values are 270.5, 106, 200, 174 and 33 mg/l for black
laundry water, mix laundry water, bath water, basin water and raw water
respectively.
• The average FC
values are 200, 98, 135, 86 and 1.5 NTU for black
laundry water, mix laundry water, bath water, basin water and raw water
respectively.
• The average S.S values calculated are 1296, 737, 978, 672 and 17 mg/l for
black laundry water, mix laundry water, bath water, basin water and raw
water respectively.
values calculated are 3440, 2350, 2800, 2920 and 180
cfu/100 ml for black laundry water, mix laundry water, bath water, basin
water and raw water respectively.
• The average BOD5
• The average COD
values without cleaning agent are 6, 24.5, 10 and 2.5
mg/l for laundry water, bath water, basin water and raw water respectively.
• The average turbidity
values without cleaning agents are 9.5, 40, 15.4 and 4
mg/l for laundry water, bath water, basin water and raw water respectively.
values without cleaning agents are 11, 9, 5.5 and 2
NTU for laundry water, bath water, basin water and raw water respectively.

93
• The average F.C
• The average suspended solids values without cleaning agents are 49, 30, 26
and 11 mg/l for laundry water, bath water, basin water and raw water
respectively.
values without cleaning agents are 1450, 1550, 950 and 100
cfu/100ml for laundry water, bath water, basin water and raw water
respectively.
• For bath and basin water it depends on certain factors like the time for
washing or bathing, surplus ness of water, the amount of water used and the
amount of soap and shampoo used for washing. If the amount of water used
is high in single wash then the quality of gray water regarding test values of
BOD, Turbidity, S.S and F.C will be low. On the other hand if less water is
used then the value will increase. Contrarily the quantity of gray water will
increase if the amount of soap/ shampoo used is higher and the value will be
lower if the amount of soap used is lower. For basin water if more oily
substances are washed then its quality will be more complicated to treat.
• Quality of gray water from laundry sources depends on the quantity of
clothes washed, quality of clothes like whether the clothes are cotton, linen,
silk, gabardine, jeans or mixed types etc. Some form of clothes attracts more
dust or gets dirtier than the other forms. The quantity of soap and detergent
powder used and their quality plays an important role in the quality of
laundry gray water.
• In general the quality of gray water always varies depending on the methods
used during washing, people’s choices of soap/ detergent/ shampoo use, the
quantity of soap/ detergent/ shampoo and the amount of water used in each
wash.
• The quality of the gray water produced without use of soap, shampoo or
detergent is better and does not changes as much as the other gray water
(using soap, shampoo or detergent) and it can be reused for simple purposes
like toilet flushing, and gardening.

94
Chapter-5
TREATMENT OF GRAY WATER 5.1 Introduction
The tests for determining the quality of gray water (FC, Turbidity, BOD, COD,
TDS, TSS, TS) yielded that it contains high amount of organic matter and large
number of fecal coliforms that needs to be treated before reusing.
For the treatment of gray water, our main objective was to develop and test a simple
cost effective gray water treatment system for in house recycling for laundry and
toilet flushing. The most simple and cost affective gray water treatment procedure is
chlorination and sand filtration to remove bacterial substances and suspended solids.
To determine the dosing of chlorination, tests were performed on different types of
gray water and prepared gray water samples and finally a rate was determined at
which gray water can be treated. The first consideration was to reduce the turbidity
of gray water by settling but no matter how long the settling time is taken the
turbidity of gray water does not come to the required level. So Coagulation and
Flocculation tests were done and a successful rate of coagulation and settling time
was determined to treat gray water.
Thus the most simple method used for treating gray water for house hold recycling
can be:
Coagulants & chlorine
Influent (Gray water)
Figure- 5.1: Simple design layout used for gray water treatment.
Rapid mix 60-90 secs. Slow mix 15 mins.
Flocculation & Settling 30mins.
Discharge (Filtered water)
Sand filtration

95
This simple system allows storage of gray water and includes disinfection and
coagulation treatment to avoid further contamination of gray water during storage.
In order to produce efficient disinfect, the gray water must be reasonably clarified
and/ or filtered. So the sand filtration is used. Sand filtration can reduce BOD5
5.1.1 Prepared Gray Water Sample
and
COD loading as well as reduces turbidity, which aids the disinfection process.
Our goal is to treat gray water from domestic households. To collect and treat
domestic gray water, at first a general sample is taken, which is a mixture of
different types of gray water. This prepared gray water sample is produced by
different sources based on their generation rate and quality. Experiments are
conducted on prepared gray water samples. The quality of this prepared gray water
sample is also determined to make further comparison with the filtered water.
5.1.2 Preparation of Prepared Gray Water Sample
The sample of prepared gray water is simply the mixture of bath water, laundry
water and basin water. Since the data collected during the questionnaire survey
shows that the bath, laundry and basin water is the main source of gray water
generated from a household. The sample is prepared by mixing this sources by the
percentage at which they are generated from the households. Table: 5.1 shows the
gray water production from households.
Table: 5.1 Gray water production from household (All sources) Source of G.W Amount in % Amount in liter Washing dish 10.39% 3893 Laundry 23.21% 8698 Bathing 51.00% 19109 Cleaning house 7.24% 2715 Cooking 1.04% 390 Basin 6.95% 2605 Car wash 0.15% 56 Total 100% 37466

96
Table: 5.2 Gray water production from household (Only laundry, bathing and
basin)
Source of G.W Amount in % Amount in liter Laundry 28.60% 8698 Bathing 62.94% 19109 Basin 8.56% 2605 Total 100% 30412
Now excluding the other sources and only taking the bath, laundry and basin water
(as shown in Table: 5.2) and assuming the production from this sources as 100% the
percentage becomes 64% of bath water, 28% of laundry water and 9% of basin
water. The experiments were conducted on 10 liter of prepared gray water sample;
therefore it comprises 6.5 liters of bath water, 2.5 liters of laundry water and 1 liter
of basin water (as shown in Table: 5.3).
Table: 5.3 Prepared Gray Water Sample
Source of G.W Amount in % Amount in liter Laundry 25.00% 2.50 Bathing 65.00% 6.50 Basin 10.00% 1.00 Total 100.00% 10.00

97
5.2 Determination of Chlorine and Coagulant Doses
Several Chlorination and Coagulation tests were done on gray water generation
sources which have higher coliform contamination or turbidity. So when a
successful rate is determined to treat this water, it is assumed that this rate will be
enough for prepared gray water sample to treat.
5.2.1 Determination of Chlorine Dose
To determine the chlorine dose several tests were performed on laundry black water
because the quality determined showed that fecal coliform content is highest for
laundry black water. Therefore a sample of laundry black water was taken to
evaluate the chlorine dosing to remove fecal coliforms. Chlorination tests were done
on this sample and a successful dosing was determined.
310
75
8 00
50
100
150
200
250
300
350
0.25 mg/l 0.50mg/l 0.75 mg/l 1 mg/l
Chlorine dosing for laundry black water mg/l
FC
val
ue
in c
fu/1
00m
l
Figure- 5.2: Determination of chlorine dose
The target was to determine chlorine dose which will satisfy the recycle criteria for
gray water shown in table 2.1, 0.75mg/l chlorine dosing treated the gray water
sample and the FC value content was below 10, therefore this dose was taken as the
treatment dosing for chlorine. But when prepared gray water sample was treated
with this rate it didn’t fulfill the required criteria because the FC content in prepared
gray water sample was much greater than laundry black water. Therefore the dosing
was increased and required rate was determined as 3mg/l chlorine dosing.

98
564
180
70
100
200
300
400
500
600
0.75 mg/l 1.5 mg/l 3mg/l
Chlorine dosing for prepared gray water sample
FC v
alue
in c
fu/1
00m
l
Figure- 5.3: Determination of chlorine dose for prepared gray water sample
5.2.2 Determination of Coagulant Dose
Similarly to determine a successful coagulant dosing to treat gray water several tests
were done directly on prepared gray water sample. At first settling test was done on
this sample but no matter how much time given the turbidity value never decreased
that much.
135
133132
130
128
124
126
128
130
132
134
136
15 mins 30 mins 45 mins 60 mins 1 hr 15 mins
Time
Tu
rbid
ity
valu
e in
NT
U
Figure- 5.4: Settling with time for prepared gray water sample
After that aelum Coagulation tests were done on prepared water to bring the
turbidity value at a required level. Jar test apparatus set in the BUET Environmental
laboratory was used for this purpose. Four tests were done on each sample of
prepared gray water. The original turbidity of the sample was first determined then

99
alum solution of 1mg/1ml was made and added in the four samples at different
doses. The four samples were then rotated at 45 rpm for 1 minute and 25 rpm for 15
minute in the Jar test apparatus and then settled for 15 minutes. After that the
turbidity of each value was measured. Several tests were performed on different
samples and a successful alum dose was evaluated.
Sample 1 (Original sample turbidity 147 NTU)
60
217 30
20
40
60
80
10 mg/l 20 mg/l 30 mg/l 40 mg/l
Coagulant Dose
Tu
rbid
ity
in N
TU
Sample 2 (Original Sample turbidity 130 NTU)
35
96.5 5
05
101520
2530
3540
20 mg/l 30 mg/l 40 mg/l 50 mg/l
Coagulant dose
Turb
idity
in N
TU
Figure- 5.5: Determination of coagulant dose for prepared gray water sample

100
5.3 Gray Water Treatment
A treatment system that will be most acceptable to Bangladeshi Urban residents
requires the storage of gray water and then simple treatment by disinfection,
coagulation, flocculation and sand filtration. The easiest way of disinfection of gray
water is applying bleaching powder in a known rate to lower the F.C content of the
gray water. To reduce the turbidity of gray water to reuse for laundry and toilet
flushing can be achieved by adding alum in the gray water during storage and just
stirring it to flocculate. The time gray water remains in the storage tank will help
settling the flocs in the bottom of the storage tank. After ½ to 1 hour will be enough
for settling and then the water from the tank excluding the bottom layer is passed
through a sand filter for additional reduction of turbidity and F.C of the gray water.
Using sand filtration the BOD, COD content of gray water is also reduced. The
removal of BOD, COD, F.C, S.S and Turbidity is achieved by using this simple
treatment setup.
The most simple gray water treatment procedure is coagulation, chlorination and
sand filtration. The F.M of sand in which the gray water sample is filtered is 2.37.
Rate of filtration is 1146ml/min/ft2. Settling time of gray water sample after
coagulation and chlorination and before filtration is 30 minutes. Contact time is 30
minutes.

101
5.4 Experimental Setup
After both chlorination and coagulation rates were determined, a simple test setup
was established in the Environmental Engineering Laboratory of Civil Engineering
Department, BUET. The experimental setup is shown in fig: 3.1. Locally available
materials were used to construct the experimental setup. It consists only a bowl, a
bucket, sand, pipe, filter pipe and tap. The bowl (feed tank) is about 25-liter capacity
and to obtain sufficient head it is placed on a high platform above the bucket.
Figure: 5.6 - Simple gray water treatment setup
The Bowl is a very important part of the treatment setup; it acts both as a feed tank
and storage tank. The treated gray water flows from the bowl to the lower bucket via
plastic pipe and the flow is controlled by a tap fitted slightly above the bottom of the
bowl to avoid inflow of settled flocs in the lower bucket in which sand filtration will
occur. The lower bucket is 25-liter capacity and consists (3/4th filled) sand for sand
filtration. At the bottom of the bucket a filter pipe is placed and a plastic pipe is
attached with this filter pipe to allow the filtered water flow out of the bucket. There
is another tap fitted slightly above the bottom of the bucket attached with the filter
pipe to initiate the flow of filtered water from the bucket. From this tap treated and
filtered water is collected.
Bowl with composed grey water sample for Coagulation Chlorination and Settling.
Tap
Tap
Bucket with Sand for sand filtration.
Pipe
Filter Pipe
Stand

102
5.5 Treatment Procedure
The sample of prepared gray water is at first taken in the bowl and the turbidity of
this sample is measured. Then for coagulation and disinfection both alum (1mg/1ml)
solution and chlorine (0.250 mg/1ml) solution is added in the sample at a rate of
30mg/l (30ml/l) and 3mg/l (12ml/l) (for laboratory) respectively. The alum and
chlorine solution are mixed manually with the sample water in the bowl by
vigorously stirring the sample water with a wooden stick for 60 to 90 seconds and
then by gentle stirring for about 15 minutes. The mixed water is then allowed to
settle for half an hour. During the time of settling the bowl must be covered so that
the sample should be untouched of any human contact and outside dust should not
get mixed with the sample. After settling the turbidity is measured because for sand
filtration the turbidity unit must be less then 30 NTU. When desired turbidity is
achieved then the tap attached with the bowl is opened and a pipe passes the settled
upper layer of the sample by gravity pressure to the lower bucket of sand for
filtration. The sand in the bucket must be clean and cleared of vegetation and other
harmful materials. The bucket is 3/4th full of sand at the bottom of the bucket there is
a filter pipe that is attached to the tap. The sample gray water is passed through this
sand filter bed and after filtration the filtered water was collected by opening the tap
attached with the bucket. Then the quality of this treated gray water is determined
and compared with the original sample.
After a couple of tests hot water must be passed through the sand to kill the fecal
coliforms remained in the sand and this method should be repeated to keep the sand
clean of coliforms.
Then BOD, COD, TDS, SS and FC tests were done on this collected filtered water,
and also this same tests were done on the sample gray water and tap water to
compare their quality. The quality of the treated sample is than compared with
standards and criteria guidelines given in table: 2.1. After several tests the quality
matched with the standards and a level of simple cost effective treatment system was
determined.

103
5.5.1 Treatment Procedure for Household Environment
The experimental setup shown in figure: 5.6 can be used in any household
environment. The material that comprises the setup is very easy to purchase from
any sanitary hardware store and can be easily build and operated. The chemicals like
alum used for treatment can be bought from chemical stores and for chlorination
bleaching powder is used which is available in all areas.
Step 1:- At first the setup should be established at an indoor space. The stands
shown in the figure is not that necessary because the collection bowl can be kept on
a higher level on any kind of unused furniture. Just keep the bowl at a higher level
connect a tap at the lower part of the bowl (2 inch above the bottom) and then
connect a flexible plastic pipe of small dia in this tap whose open end should
discharge the water at another bucket which should be kept lower than the bowl.
3/4th part of the bucket must be filled with sand preferably with Sylhet sand. A filter
pipe should be at the bottom of the bucket which is connected with another tap
attached at the lower part of the bucket (1.5 inch above the bottom) from which
filtered water can be collected.
Step 2:- Any person who wants to treat gray water have to take water at the bowl.
Alum and bleaching is found in powdered form. So 30 mg of alum and 10 mg of
bleaching powder should be added for each liter of gray water to be treated. After
adding the powder the gray water should be stirred or rotated to mix the chemicals
with the gray water thoroughly. A wooden stick or a big spoon can be used for this
purpose. First the gray water sample should be rotated very quickly for 60 to 90
seconds and then slowly rotated for 15 minutes; this will mix the sample with the
chemicals perfectly. After that the sample should be kept untouched for at least 30
minutes or more for settling. The alum will react and flocs will be settled at the
bottom. During the time of settling the bowl should be covered with a lid.
Step 3:- After settling and the water is much clear than before. The tap attached
with the bowl is opened and water is discharged (without the bottom layer of water
containing flocs in the bowl) to the sand filled bucket for sand filtration. After
discharging for about 1 minute the tap attached with the bucket is opened and
filtered and treated water can be collected.

104
5.5.2 Maintenance
The maintenance of the setup is very easy. The bowl where the treatment is done
must be clean and should be washed properly. The connection pipes should be kept
clean also. After a few treatment operation is done the sand filter bed gets clogged
and doesn't perform smoothly, so after a few operation hot water can be poured in
the sand bucket and passed through the sand this will make it clean and clear.
Scrapping the upper layer of the sand in the bucket and stirring the sand bed with
hand or with a stick will also remove the clogs. Backwashing can be done but this
operation is very complicated to perform in household level.
5.5.3 Cost of Gray Water Treatment
The total cost of constructing this unit is about Tk. 1700/- The cost of chemical per
liter is around Tk. 0.005/-. This cost calculated is only for a single household dweller
and if this setup is established in a wide range basis like at a building for all the
residents then the setup cost will be increased because plumbing, sanitary
construction and pump cost will be included with this estimate.
Detailed breakdown of the cost is provided in Table 5.4 and Table 5.5.
Table 5.4 Estimated cost of the household gray water treatment setup
Items Quantity Price (Tk.) Remarks 25 liter bucket+lid 2 pc. 320.00 Collection bowl 1 pc. 140.00 Tap 2 90.00 Spoon 1 pc. 10.00 Jam Nut 2 pc. 20.00 Washer 4 pc. 16.00 Strainer 1 ft 50.00 Stopper Cap 2 pc. 20.00 Connecting Pipe (1 cm dia) 2 ft 30.00 Sand (Sylhet sand) 1 cft 15.00 Wooden Stirrer 1 pc. 25.00 Others L. S. 100.00 Sub-total 836.00 Stand (Wooden- Optional) 850.00 Total 1686.00

105
Cost of Alum powder is 500 gm Tk. 60/- Cost of Bleaching powder is 500 gm Tk. 70/- Taking strength as approximately 33% it will take about 10mg/l of bleaching powder.
Table 5.5 Cost of chemical per liter of treated water
Items Quantity Price (Tk.) Remarks Alum (commercial grade) 30 mg/l 0.0036 Bleaching powder 10 mg/l 0.0014
The operating cost of treated water was Tk. 0.005 per liter.
5.5.4 User Acceptance
Information about user acceptance was gathered from discussion with people during
questionnaire survey. The questionnaire is presented in Appendix A. Many people
showed interest about this kind of setup and asked more about the treatment process
for reusing gray water and whether the quality of the treated water can be acceptable
for reusing. Most people reuse gray water at the time of water crisis for simple
purposes like toilet flushing and gardening. When we informed them about the
simple operation and maintenance of the setup and that gray water generated from
laundry or bathing can be reused for laundry again they were very willing to know
more. We assured that this treated water is not for drinking just for other household
purposes which made this setup very acceptable to them. About 70% of people that
we surveyed agreed to reuse gray water at the time of acute water supply crisis. But
the fact remains that if the water supply is adequate they will not reuse gray water
for any purpose.
5.5.5 Recovery Rate
From the survey data collected the total water consumed by 100 families is 57684
liter. The total gray water produced from 100 families is 37466 liter which is about
65% of total water consumed. Gray water generated from bathing, laundry and basin
which is targeted for the recycle and reuse purpose, comprises about 80% of total
gray water produced and about 50% of total water consumed. Therefore if this water
is treated and reused then the deficit between DWASA's water supply can be greatly
reduced and the DWASA's water

106
5.6 Results and Discussion
5.6.1 BOD5 Test Results Before and After Treatment Prepared Water = Mixture of domestic gray water (Bath water = 63%, Basin water = 9% and Laundry mix water = 28%). Treatment
Dosing Alum = 30mg/l. Dosing Cl2 for 1st Test = 0.75mg/l. Dosing Cl2 for 2nd to 5th Test = 3 mg/l. Settling time = 30 minutes before filtration.
Table-5.6: BOD5
Samples
test results before and after treatment
BOD5 in mg/l 1st 2 Test nd Test 3rd 4 Test ht 5 Test th Test
Prepared Water before treatment 129 104 113.4 96.6 224.4 Prepared Water after treatment 13 8 10.4 6.6 9.4 Tap Water 1.8 1 2.4 1.8 0.4
129104 113.4
96.6
224.4
13 8 10.4 6.6 9.41.8 1 2.4 1.8 0.40
50
100
150
200
250
1st Test 2nd Test 3rd Test 4ht Test 5th Test
BOD5
in m
g/L
Sample
Composed Water before treatment Composed Water after treatment Tap Water
Figure 5.7: Graphical representation of BOD5 test results before and after
treatment

107
The results above represents that the value of BOD5 of the Prepared gray water
sample is very high before the treatment and after the treatment procedure using
alum coagulation, flocculation, settling and sand filtration, it reduces to a very low
value, so thus indicates that it is very effective in reducing the BOD content of gray
water. This process remove large amount of suspended solid particles which account
large part of BOD in the effluent/waste water. When coagulation and flocculation
experiments were done in the gray water the BOD load content is reduced because at
the addition of alum in the gray water, it reacts with the dissolved solids of gray
water and creates flocs and by stirring this mixed gray water flocculation occurs and
the flocs get bigger. After half an hour of settling these flocs gets separated from the
gray water and accumulates in the bottom of the storage tank, thus the BOD load of
gray water is reduced. In addition to this when this gray water is passed through the
sand filtration bed the BOD load is more reduced because the organic contents gets
stuck in the sand and removed from the gray water. The average BOD5 values are
133.5, 9.5 and 1.5 mg/l for prepared gray water sample before treatment, prepared
gray water sample after treatment and raw tap water respectively.
As BOD is often used as a robust surrogate of the degree of organic pollution of
water the reduction of BOD of the gray waste water thus indicates that this process
can be very effective for controlling water pollution also.

108
5.6.2 COD Test Results Before and After Treatment Prepared Water = Mixture of domestic gray water (Bath water = 63%, Basin water = 9% and Laundry mix water = 28%).
Treatment
Dosing Alum = 30mg/l. Dosing Cl2 for 1st Test = 0.75mg/l. Dosing Cl2 for 2nd to 5th Test = 3 mg/l. Settling time = 30 minutes before filtration.
Table-5.7 COD test results before and after treatment Sample COD in mg/l
1st Test 2nd Test 3rd Test 4ht Test 5th Test
Prepared Water before treatment 188 175 200 127 158 Tap Water 9 7 8 7 5 Prepared Water after treatment 36 24 52 13 27
188 175200
127158
36 2452
13 279 7 8 7 5
0
50
100
150
200
250
1st Test 2nd Test 3rd Test 4ht Test 5th Test
COD
in m
g/L
Sample
Composed Water before treatment Composed Water after treatment Tap Water
Figure 5.8: Graphical representation of COD test results before and after
treatment.
BOD and COD results are related and the graphs are similar. As like BOD5, the
results above represents that COD value was very high before the treatment and after
it reduced to a very low value, so the experiment showed that it is very effective in
reducing the COD content of gray water also. The average COD values are 170,
30.4 and 7.2 mg/l for prepared gray water sample before treatment, prepared gray
water sample after treatment and raw tap water respectively.

109
5.6.3 Turbidity Test Results Before and After Treatment
Prepared Water = Mixture of domestic gray water (Bath water = 63%, Basin water = 9% and Laundry mix water = 28%). Treatment
Dosing Alum = 30mg/l. Dosing Cl2 for 1st Test = 0.75mg/l. Dosing Cl2 for 2nd to 5th Test = 3 mg/l. Settling time = 30 minutes before filtration.
Table-5.8: Turbidity test results before and after treatment
Sample Turbidity in NTU 1st Test 2nd Test 3rd Test 4th Test 5th Test
Prepared Water before treatment 80 70 87 73 110 Prepared Water Before filtration After Settling
16 9 20 15 19
Prepared Water After filtration 3.5 2.6 7 5.4 4.8 Tap Water 2.6 2 1.7 1.5 1.7
8070
87
73
110
169
2015 19
3.5 2.6 7 5.4 4.82.6 2 1.7 1.5 1.70
20
40
60
80
100
120
1st 2nd 3rd 4th 5th
S ourc es of Water
Turb
idity
in N
TU
C omposed water before treatmentC omposed water before filter After settlingC omposed Water After filterT ap Water
Figure 5.9: Graphical representation of turbidity test results before and after
treatment.

110
The graph shows that the value of turbidity is high before the treatment and after the
treatment procedure using alum coagulation, flocculation, settling and sand
filtration, it reduces to a very low value. Gray water samples contain suspended solid
matter consisting of particles of many different sizes. While some suspended
material will be large enough and heavy enough to settle rapidly to the bottom of the
container if a liquid sample is left to stand (the settable solids), very small particles
will settle only very slowly or not at all if the sample is regularly agitated or the
particles are colloidal. These small solid particles cause the liquid to appear turbid.
When alum is added to the prepared gray water sample, the aluminum ion
hydrolyses by reactions that consume alkalinity in the water. The gelation of
hydroxide thus formed carries suspended materials with it as it settles. The turbidity
should be less than 30 NTU before it is passed through the sand filter bed therefore
turbidity results were measured just before filtration. This process remove large
amount of suspended solid particles. Removal of solid also reduces turbidity and
from the results it can be seen that the turbidity was reduced less then 30 NTU.
Furthermore when this gray water is passed through the sand filtration bed the solid
particles is more reduced because the particles the sand acts as filter and removes
them from gray water. Thus turbidity is much more reduced. The average turbidity
values are 84, 16, 3.3 and 2 mg/l for prepared gray water sample before filtration
and settling, prepared gray water sample before filtration and after settling, prepared
gray water sample after treatment and filtration and raw tap water respectively.
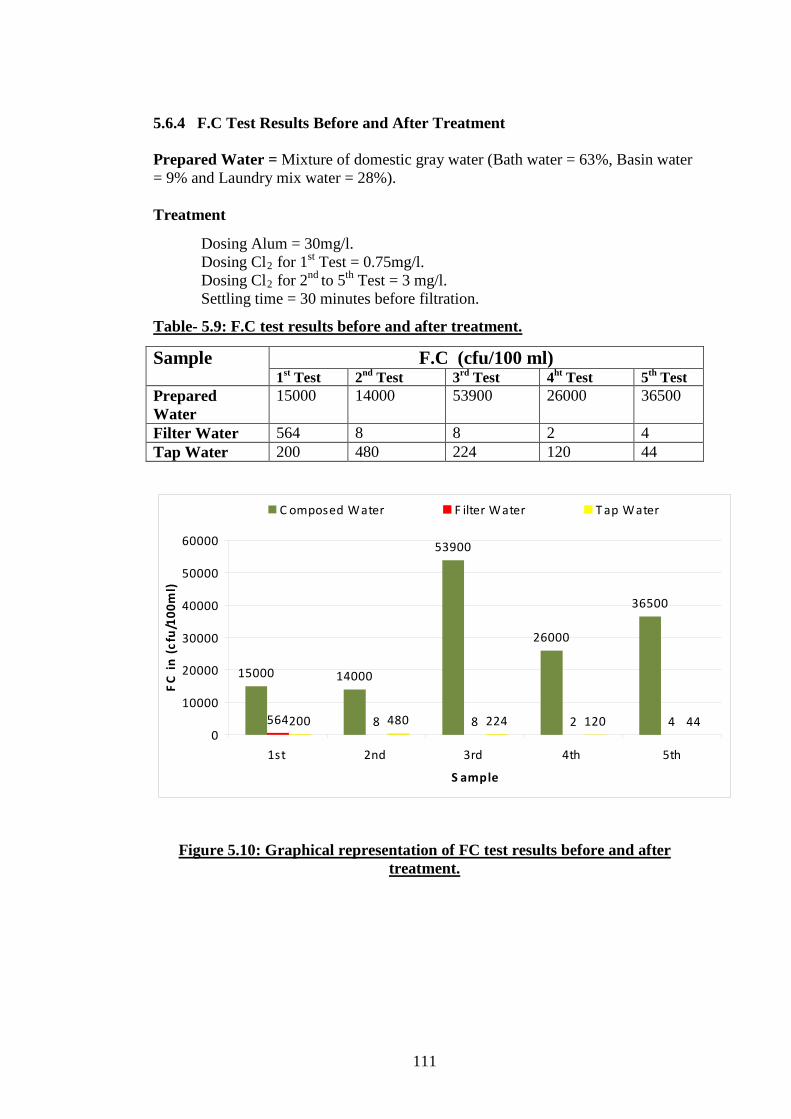
111
5.6.4 F.C Test Results Before and After Treatment Prepared Water = Mixture of domestic gray water (Bath water = 63%, Basin water = 9% and Laundry mix water = 28%). Treatment
Dosing Alum = 30mg/l. Dosing Cl2 for 1st Test = 0.75mg/l. Dosing Cl2 for 2nd to 5th Test = 3 mg/l. Settling time = 30 minutes before filtration.
Table- 5.9: F.C test results before and after treatment.
Sample F.C (cfu/100 ml) 1st Test 2nd Test 3rd Test 4ht Test 5th Test
Prepared Water
15000 14000 53900 26000 36500
Filter Water 564 8 8 2 4 Tap Water 200 480 224 120 44
15000 14000
53900
26000
36500
564 8 8 2 4200 480 224 120 440
10000
20000
30000
40000
50000
60000
1st 2nd 3rd 4th 5th
S ample
FC in
(cfu
/100
ml)
C omposed Water F ilter Water T ap Water
Figure 5.10: Graphical representation of FC test results before and after
treatment.

112
FC tests were also done on all the selected sources. The results are shown in the
graph. As the results depend on the Fecal Coliform content, the graph above
represents that the value of F.C was very high before the treatment and after it
reduced to a very low value, so the experiment was a success in reducing the F.C
content of gray water. When Alum is added in the prepared gray water sample,
metal ions in coagulation react with virus proteins and destroy viruses from water.
When chlorine is dissolved in water it gives HOCl and OCl- which are known as free
available chlorine. Free available chlorine is very effective in killing bacteria which
can remove fecal colliform from waste water. When chlorination is done in the gray
water the F.C content is reduced because at the addition of chlorine in the gray water
it reacts with the pathogens/ coliforms of gray water and kills them. After half an
hour of settling these pathogens/ coliforms is reduced and gets clear as the time
passes. In addition to this when this gray water is passed through the sand filtration
bed the F.C is more reduced because the sand bed helps to reduce the fecal coliforms
of gray water. In the 1st test the dosing of Cl2 was low so after treatment the required
level couldn’t be reached therefore the dosing of Cl2 was increased in remaining sets
of tests and the resultant data fulfilled the treatment criteria. The FC values for the
first 1st set of samples are 15000, 564 and 200 and the average FC values for the
first 2nd to 5th set of samples are 32600, 5.5 and 217 cfu/100ml for prepared gray
water sample before treatment, prepared gray water sample after treatment and raw
tap water respectively.

113
5.6.5 S.S Test Results Before and After Treatment Prepared Water = Mixture of domestic gray water (Bath water = 63%, Basin water = 9% and Laundry mix water = 28%). Treatment
Dosing Alum = 30mg/l. Dosing Cl2 for 1st Test = 0.75mg/l. Dosing Cl2 for 2nd to 5th
Sample
Test = 3 mg/l. Settling time = 30 minutes before filtration.
Table- 5.10: S.S test results before and after treatment.
S.S in mg/l 1st 2 Test nd 3 Test rd 4 Test ht 5 Test th Test
Prepared Water 110 130 138 108 266 Tap Water 14 22 40 26 22 Filter Water 10 48 44 30 28
110130 138
108
266
14 2240 26 2210
48 44 30 28
0
50
100
150
200
250
300
1st Test 2nd Test 3rd Test 4ht Test 5th Test
SS in
mg/
L
Sample
Composed Water Tap Water Filter Water
Figure 5.11: Graphical representation of S.S test results before and after treatment.

114
Turbidity of waste water is depended on suspended solids present in the water. As
discussed the reasons of turbidity reduction is exactly similar for reducing SS
content of prepared gray water sample. This is followed by disinfection by chlorine
to ensure that any free floating pathogens, or pathogens associated with the small
remaining amount of suspended solids, are rendered ineffective. The results above
shows that the value of S.S was very high before the treatment and after the
treatment procedure using alum coagulation, flocculation, settling and sand
filtration, it reduces to a very low value, so thus indicates that it is very effective in
reducing the suspended solid content of gray water. This was notable that the SS
values of tap water and the treated filter water was very similar to one another. The
average suspended solids value are 752, 32 and 25 mg/l for prepared gray water
sample before treatment, prepared gray water sample after treatment and raw tap
water respectively.

115
5.7 Conclusions
• A treatment system that will be most cost effective and acceptable to
Bangladeshi Urban residents requires the storage of gray water and then
simple treatment by disinfection, coagulation, flocculation and sand
filtration.
• To treat gray water from domestic household, a general sample is taken
comprising mixture of different types of gray water. This prepared gray
water sample is produced by different sources based on there generation rate
and quality.
• Several Chlorination and Coagulation tests were done on bath water because
it has the highest generation rate among the gray water sources and also
coliform contamination of bath water is higher than others. So when a
successful rate is determined to treat bath water it is assumed that this rate
will be enough for prepared gray water sample to treat. The rate for Alum
Dosing is 30ml/l or 30mg/l. (1mg/1ml solution) and for disinfection dosing
Cl2 is 12 ml/l or 3 mg/l. (0.250mg/1ml solution).
• After both chlorination and coagulation rates were determined, a simple test
setup was established in the Environmental Engineering Laboratory of Civil
Engineering Department, BUET. The experimental setup is shown in fig:
5.1. Locally available materials were used to construct the experimental
setup and it is very easy to use in household environment.
• BOD, COD, TDS, SS and FC tests were done on this collected filtered water,
and also these same tests were done on the sample gray water and tap water
to compare their quality. The quality of the treated sample is than compared
with standards and criteria guidelines given in table: 2.1. After several tests
the quality matched with the standards and a level of simple cost effective
treatment system was determined.
116
• The average BOD5
• The average COD
values are 133.5, 9.5 and 1.5 mg/l for prepared gray
water sample before treatment, prepared gray water sample after treatment
and raw tap water respectively.
• The average turbidity
values are 170, 30.4 and 7.2 mg/l for prepared gray water
sample before treatment, prepared gray water sample after treatment and raw
tap water respectively.
• The average FC
values are 84, 16, 3.3 and 2 mg/l for prepared gray
water sample before filtration and settling, prepared gray water sample
before filtration and after settling, prepared gray water sample after treatment
and filtration and raw tap water respectively.
• The average suspended solids
values are 32600, 5.5 and 217 cfu/100ml for prepared gray
water sample before treatment, prepared gray water sample after treatment
and raw tap water respectively.
• Gray water generated from bathing, laundry and basin which is targeted for
the recycle and reuse purpose, comprises about 80% of total gray water
produced and about 50% of total water consumed. Therefore if this water is
treated and reused then the deficit between DWASA's water supply and
demand can be greatly reduced.
value are 752, 32 and 25 mg/l for prepared
gray water sample before treatment, prepared gray water sample after
treatment and raw tap water respectively.

117
Chapter -6
CONCLUSIONS AND RECOMMENDATIONS
6.1 General
The present study focused on developing a simple cost effective gray water
treatment system for in-house recycling for laundry and toilet flushing. In order to
achieve this, questionnaire interviews were undertaken in different areas of Dhaka
city to quantify the classified uses of the supplied water in residential houses. Also
the quality of different sources of gray water was determined by laboratory
experiments. A simple setup was established in the Environmental Engineering
Laboratory, BUET for the treatment of gray water and the experimental data was
collected.
6.2 Conclusion:
Based on the results of the present study the following conclusion can be drawn:
1. Average quantity of water required for one person was calculated at 146
l/day. This water consumption rate does not only include drinking, bathing
and toilet purposes but also for other uses for a person in a whole day.
2. The quantity of per capita gray water production for per person is 95 l/day.
3. The main source of gray water for per person per day from households are
washing dish (9.88 l/day), laundry (21.52 l/day), bathing (49.13 l/day),
cleaning house (6.89 l/day), cooking (1.0 l/day), car washing (0.142 l/day)
and basin (6.61 l/day).
4. The time of most gray water produced from household is in the morning
session and before lunch.
5. The quality determined for domestic prepared gray water sample (Bath water
= 63%, Basin water = 9% and Laundry mix water = 28%) shows that average
value of BOD is 133.54 mg/l, COD is 169.6 mg/l, Turbidity is 84 NTU, F.C
is 32600 nos./100ml and S.S is 150.4 mg/l respectively.

118
6. For treating gray water, the rate for Alum Dosing is 30ml/l or 30mg/l
(1mg/1ml solution) and for disinfection Cl2
7. The quality determined for this domestic prepared gray water sample after
treatment shows that average value of BOD
dosing is 12 ml/l or 3 mg/l
(0.250mg/1ml solution). Settling time is 30 minutes before filtration.
5
8. The process of treatment is very effective in the removal of BOD, COD, F.C,
S.S and Turbidity of gray water. This process is also very simple and cost
effective to be used at household environment.
is 9.48 mg/l, COD is 30.4 mg/l,
Turbidity is 4.654 NTU, F.C is 6.4 nos./100ml and S.S is 32 mg/l
respectively.
9. The quality determined by tests showed that for Bangladeshi environment to
reuse gray water for toilet flushing, the most simple and cost effective way is
to disinfect the gray water by using bleaching powder.
10. Presently, the deficit between DWASA's water supply and demand is high
and growing day by day, so if we can introduce this kind of setup the deficit
will be reduced significantly.

119
6.3 Recommendations for further study
Based on the findings and experiences of the research work presented in this thesis
the following recommendations can be forwarded for future study.
1. This study is targeted towards the building dwellers of Dhaka city having
medium income status. It is only a small step in forming a gray water
management system. A broad study based on Bangladeshi environment on
factors affecting the gray water reuse system like technical feasibility, public
health, social acceptability and sustainability can be conducted. These
factors can be further contextualized into an environmental framework and
can be discussed under social, political and environmental characteristics.
2. Proper storage of gray water is a very important part of gray water treatment
system. It is very important that gray water remains untouched of any
human contact or any kind of outside particles like air or dust. The design of
sanitation system of a building, third pipe system, design of storage tank,
their discharge these criteria based on Bangladeshi environment should be
well studied and the possibility of improvement of the design can be
evaluated.
3. Commercial products (soaps and laundry powders etc) affect gray water
quality and can have great effect on garden health, groundwater, soil and the
type of gray water treatment technology used. More research can be
undertaken on the quality of different kinds of soaps and laundry powders
and their effect on gray water quality for reuse.
4. Generally, long-term and broad implications of urban gray water systems
are not yet fully understood and paramount to its acceptance is the
protection of human health as well as community education and
participation in community decision processes. So, further study can be
undertaken to understand this matters also.

120
5. The prolonged application of garden watering and irrigation with gray water
on relatively-small urban blocks may have significant environmental effects.
The relatively-new acceptance of gray water reuse in urban areas has
resulted in a deficiency of long-term studies and therefore an incomplete
understanding of the long-term environmental consequences of gray water
reuse.
6. The cost calculated in this study is only for a single household dweller and if
this setup is established in a wide range basis like at a building for all the
residents then the setup cost will be increased because plumbing, sanitary
construction and pump cost will be included with this estimate. Further
study is required into identifying and quantifying the significance of indirect
costs and externalities that result from gray water reuse in urban areas.
Although direct costs are identified in the study, there may be additional
costs and they must be quantified in order to be realised. Analysis of these
costs would complete the full cost benefit analysis and form a suitable basis
for a framework to pass these costs back to consumers.
7. Gray water reuse is generally described as a resource conservation strategy
by Governments and regulators. However, if gray water is used to
supplement current potable water demands and applications, will it result in
consumer behavior changes in demand management, which is also the goal
of resources conservation? Work should be undertaken to characterize and
determine the changes in potable water consumer behavior and the effect of
gray water substitution.

References

References :
1. Al-Jayyousi, Odeh R. (2003). “Greywater Reuse: Towards sustainable Water Management”. Desalination 156: 181-192
2. Almeida M.C., Butler D. and Friedler E. (1999) : At-source domestic wastewater quality. Urban Water, 1 (1999), 49-55.
3. Australia. Dept of Environment, Sport and Territories. (1996). Australia: state of the environment 1996. Canberra: CSIRO Publishing.
4. Beavers, P. (1995) Greywater, An Alternative Water Source, Townsville: Effluent Reuse and Alternative Treatment Seminar.
5. BUET, CE 332: Environmental Engineering Sessional 1. Bangladesh University of Engineering Technology.
6. Christova-Boal, D. Eden, R.E. & McFarlane, S. (1995) “An Investigation into Greywater Reuse for Urban Residential Properties”. Desalination 106: 391-397
7. Clifford White, G. (1972). Handbook of Chlorine. USA: Van Nostrand Reinhold Company.
8. Davey Pumps, nd. Commercial Product Selection Guide No. 2. Promotional Booklet. Davey Products Pty Ltd.
9. Department of Health WA, (2002) Draft Guidelines for the Reuse of Greywater in Western Australia. Perth: Department of Health.
10. Dillon, P J. (2000). Water Reuse in Australia: Current Status, Projections and Research, Adelaide: AWA Water Recycling Forum, Proceedings of the first Symposium, 99-104
11. Dixon, A., Butler, D. & Fewkes, A. (1999). “Water Saving Potential of Domestic Water Reuse Systems Using Greywater and Rainwater in Combination”. Water Science Technology 39[5]: 25-32
12. Dryzek, J.S. & Schlosberg, D. (2003) Debating the Earth. New York: Oxford University Press Inc.
13. DWASA (2005) : Management Information Report for the Month of February, 2005, Dhaka Water Supply and Sewerage Authority.
14. Emmerson, G. (1998). Every Drop is Precious: Greywater as an Alternative Water Source. Brisbane: Research Bulletin No 4/98, Queensland Parliamentary Library.
15. EPA Victoria, (2001) Domestic Wastewater Management Series: Reuse Options for Household Wastewater. Victoria: Publication 812.

16. Gardner, E. A. (2003) “Some Examples of Water Recycling in Australian Urban Environments: A Step Towards Environmental Sustainability”. Water Science and Technology 3[4]: 21-31
17. Gardner, T. & Millar, G. (2003). The Performance of a Greywater System at the Healthy Home in South East Queensland – Three Years of Data. UNE: Proceedings of On-site 03 Conference: Future Directions for On-site systems, Best Management Practice.
18. Hunter, D. (2003). Potable Substitution and Externalities: How to Make Recycling Economic. Melbourne: Proceedings from Managing the Changing Colours of Water AWA/ SIAV Joint Seminar.
19. IWM (2007) : Draft Final Report on Demand Management, Water Abstraction Strategy and Monitoring System, Part II, Institute of Water Modelling, Dhaka.
20. Jefferson, B. Laine, A. Parsons, S. et al. (1999). “Technologies for Domestic Wastewater Recycling”. Urban Water 1: 285-292
21. Jeppesen, B. (1996) “Domestic Greywater Reuse: Australia’s Challenge for the Future”. Desalination 106: 311-315
22. Jeppesen, B. & Solley, D. (1994). Domestic Greywater Reuse – Overseas Practice and its Applicability to Australia. Brisbane: Res. Report 73 Urban Water Research Association of Australia.
23. Ludwig, A. (1994) Create an Oasis with Greywater. Santa Barbara: Oasis Design.
24. Marks, J S. (2004), “Advancing Community Acceptance of Reclaimed Water”. Water Journal of the Australian Water Association 31[5]: 46-51
25. Melbourne Water, (2004) “Water Sensitive Urban Design: Integrated Water Cycle Tools”.
26. Price Waterhouse Coopers (PWC), (2000) Economic Aspects of Water Recycling in Queensland. Queensland: Department of Natural Resources.
http://wsud.melbournewater.com.au/system
27. Radcliffe, J. (2003). Water Recycling in Australia. Victoria: The Australian Academy of Technological Sciences and Engineering.
28. Rose, J.B. Sun, G-S, Gerba, C.P. et al. 1991. “Microbial Quality and Persistence of Enteric Pathogens in Greywater from Various Household Sources”, Water Res. 25[1]: 37
29. Salukazana, L., Jackson, S., Rodda, N., Smith, M., Gounden, T., McLeod, N., et al. (2006). Re-use of grey water for agricultural irrigation. Paper presented at the Third international conference on ecological sanitation
30. Singer, M.J. & Munns, D.N. (1996). Soils and Introduction. New York: Prentice Hall, Inc.

31. Shouler, M., Griggs, J. and Hall, J. (1998). Water conservation. British Research Establishment (BRE)Information Paper, IP 15/98.
32. Surendran S. and Wheatley A. D. (1998) : Gray water reclamation for non-potable reuse. J. CIWEM, 12, 406-413.
33. Sydney Water, 2002. Towards Sustainability Report (2002) Summary. Sydney: Sydney Water.
34. Tchobanoglous, G., Burton, F.L. & Stensel, H.D. (2003). Wastewater Engineering Treatment and Reuse. New York: McGraw-Hill.
35. Thomas, P. & Zeisel, J. (1997). “Greywater Recycling in Urban Areas”. Ecological Engineering for Wastewater Treatment. USA: CRC Press, Inc.
36. United Nations Environmental Program (UNEP), (2000). Environmental Sound Technologies in Wastewater Treatment for the Implementation of the UNEP Global Program of Action (GPA) “Guidance on Municipal Wastewater”. New York: United Nations.
36. Van Dok, W. (2004). “Case Study: The Van Dok Home”.
http://savewater.com.au/default.asp?SectionId=562&sortTag=680&mode=print


Questionnaire Survey Information
Appendix - A

Questionnaire used for gray water interviews in Dhaka city. Along the following questions asked during the interviews a series of observations are indicated in capital letters. I - HOUSELHOLD’S CHARACTERISTICS QUESTIONS 1). Name of the area and unit and House area:
2). House number, or interviewee’s name:
3). Relation to the Head of the Household:
4). Number of people in the household:
5). Number of children, age: NAME AGE 6). How long have you and your family been living in this area? II - ACCESS TO HARDWARE Water Supply System 7). What is the main source of drinking water for members of the household? 1. Piped water 5. Unprotected dug well 9. Small water vendor 2. Stand pipe 6. Protected spring 10. Peddler 3.Tubewell/borehole 7. Unprotected 11. Tanker water spring 4.Protected dugwell 8. Gutter. 8). Other sources for other uses of water 9). What type of containers and in what capacity do you use in your home? 1. Gallon……..L 2 Jarry can……L 3 Bucket……..L 4 Jerkin………L 5 Drum/barrel ……L 6. Other……… 7. Don’t know 10). How many of those containers do you fill per day?…………

11). What is the distance between your house and the water point? 1. <10m 4. 100 – 200m 2. 10 – 50m 5. 200 – 500m Not applicable………. 3. 50 – 100 m 6. > 500m Quality of the water supplied (and indication of a potential source of contamination of the waste water) 12). Do you store water for drinking in the household? YES NO 13). OBSERVATION OF CONTAINERS (PLEASE OBSERVE THE CONTAINERS AND FILL IN THE TABLE BELOW) Narrow mouthed Wide mouthed Of both types 14). ARE THE CONTAINERS COVERED? 1. All of them 2. Some of them 3. None Sanitation and Solid Waste 15). What kind of toilet facility does this household use? (please observe)No. 1. Poor flush 2. Flush 3. VIP
4. Pit latrine 5. Composting latrine 6. Bucket latrine
7. Hanging latrine 8. No latrine 9. Other 16). HOW FAR IS THE TOILET FACILITY FROM YOUR LIVING QUARTERS? (IF FEASIBLE, OBSERVE)
1. < 10 meters 3. > 50 meters Not applicable
2. 10-50 meters 4. Don’t know? 17). Where are children faeces disposed off? 1. Dropped into the toilet facility 7. Buried
2. Rinsed, water discarded into the sink or tub 8. Left lying on the ground
connected to drainage system
3. Rinsed, water discarded into a toilet 9. Don’t know
4. Rinsed, water discarded outside
5. Disposed, outside the yard

6. Disposed, into solid waste/trash 18). OBSERVE, IF WASHED OR RINSED, WHERE THE WATER DISPOSED OFF . 19). How do you dispose of your garbage? OBSERVE ANY VISIBLE DUMPING AREAS.
Collected from home by
Collected at neighbourhood box by
Disposed within premises
Disposed outside premise
1. Community association
1. Community association
1. In waste pit 1. In waste pit/dump site
2. Private company 2. Private company 2. No pit 2. Anywhere
3. Government 3. Government OR
1. Burn (where)…………………….
2. Bury (where)…………………….
3. Compost (where)…………………….
4. Recycle (where)……………………….
5. Feed animals (where)………………
6. Other…………………….
7. Don’t know. III - WASTE (GRAY) WATER DISPOSAL 20). What do you use your water for? 1. Washing dishes 5. Cleaning the house 8.Basin
2. Doing laundry 6. Cooking
3. Bathing 7. Car washing
4. Other……………………………………………………………… 21). When do you think you use the most of water?
1. Early morning
2. Morning
3. Lunchtime
4. Afternoon
5. Evening
6. Don’t know

22). How do you dispose the following gray water? Where does the water go?
Washing dishes
Laundry Bathing Cleaning the house
Cooking Other (specify)
1.Drain (Piped or not)
1. Drain (Piped or not)
1. Drain (Piped or not)
1. Drain (Piped or not)
1. Drain (Piped or not)
1. Drain (Piped or not)
2. Soak- away, septic, cesspit system
2. Soak- away, septic, cesspit system
2. Soak- away, septic, cesspit system
2. Soak- away, septic, cesspit system
2. Soak- away, septic, cesspit system
2. Soak- away, septic, cesspit system
3. Street surface
3. Street 3. Street 3. Street 3. Street 3. Street
4. Inside the yard
4. Inside the yard
4. Inside the yard
4. Inside the yard
4. Inside the yard
4. Inside the yard
5. Into garden 5. Into garden 5. Into garden 5. Into garden 5. Into garden 5. Into garden
6. In the toilet 6. In the toilet 6. In the toilet 6. In the toilet 6. In the toilet 6. In the toilet
7. Re-use 7. Re-use 7. Re-use 7. Re-use 7. Re-use 7. Re-use
8. ……… 8. ……… 8. ……… 8. ……… 8. ……… 8. ……… 23). For each activity, could you estimate how much water you use each day? (Indicate the amount) Daily.
Washing dishes
Laundry Bathing Cleaning the house
Cooking Basin
Other…………. (specify)
24). If re-use water, give examples of which gray water is re-used. (e.g. bathing water for gardening) 25). How many soaps do you use for the following activities that produces gray water? Monthly. Washing dishes. Laundry Bathing Cleaning the house Basin 1. ………. 1. ………… 1. …….. 1. ………… 1……. How often? How often? How often? How often? Shampoo & Paste 2. …………. 2. …….. 2. ……… 2. …….. No. … No….. 26). DOES THE STANDPIPE HAVE THE FOLLOWING: 1. Soak-away 6. Storm water manhole 2. Concrete slab 7. Communal washing/ablution facilities 3. Gulley 8. Gray water sand filters 4. Wash through 9. Grease traps.

5. Storm water channel 27). DO YOU OBSERVE ANY CHANGES ON THE SURFACE DUE TO DISPOSING OF GRAY WATER? YES NO 28). COULD YOU ESTIMATE THE LOCATION OF THE STANDPIPE RELATIVE TO WITHDRAWAL POINT? (ANY POSSIBLE CONTAMINATION) IV - LEVEL OF PERCEPTION OF THE RISKS - TOWARDS A SAFE GRAY WATER DISCHARGE SYSTEM 29). Do you think gray water is a major health problem in the community? YES NO 30). If yes, in what sense? (What could be the risks of stagnant waste water, infiltrating the ground anywhere or badly manipulated?) Viruses transmission by direct contact with water
Virus transmission by ingestion of crops
Soil clogging
Soil degradation
Groundwater contamination
Other 31). What would you like to do with your gray water?
Recycling, Reuse (What for?)
Discharge in a ‘safe’ place
Water plants
Other 32). What choices would you make to resolve the problem of gray water disposal?

Appendix- B
Household Data

Per Capita Water Consumption.
Class 1 (High Income People):
22 Family 69 people, total water consumption per day is 9369 liter. Per capita water consumption = 9369/69
= 136 liter/day.
% of water use for different house works (liters):
605(6.46%) Washing dish
1273(21.64%) Laundry Bathing
2851(49.37%)
543(9.231%) Cleaning house
252(4.284%) Prayer
Cooking and Drinking 687(11.679%)
Basin349(5.933%)
42(0.714%) Car wash Toilet
2767(47.039)
Class 2 (General Income people):
78 Family 325 people, total water consumption per day is 48314.5 liter. Per capita water consumption = 48314.5/325.
= 150 liter/day.
% of water use for different house works (liters):
3288(6.90%) Washing dish
7425(15.59%) Laundry Bathing
16258(34.14%)
2172(4.56%) Cleaning house
902(1.89%) Prayer
Cooking and Drinking3657.5(7.68%)
Basin2256(4.73%)
14(0.088%) Car wash Toilet
12342(25.91%)
Class 1 + Class 2:
100 Family 394 people, total water consumption per day is 57683.50 liter. Per capita water consumption = 57683.50/394
= 146 liter/day.
% of water use for different house works (liters):
3893 liter (6.73%) Washing dish
8698 liter (15.04%) Laundry Bathing
19109 liter (33.05%)
2715 liter (4.69%)
Cleaning house 1154 liter (1.99%)
Prayer
Cooking and Drinking4344.5 liter (7.51%)
Basin2605 liter (4.50%)
56 liter (0.096%)
Car wash Toilet15109 liter (26.14)
% of per person water use for different house works (liters):
9.88 liter (6.73%) Washing dish
22.07 liter (15.04%)
Laundry Bathing48.5 liter (33.05%)
6.89 liter (4.69%)
Cleaning house 2.92 liter (1.99%)
Prayer
Cooking and Drinking11.02 liter (7.51%)
Basin6.61 liter (4.50%)
0.142 liter (0.096%)
Car wash Toilet38.34 liter (26.14)
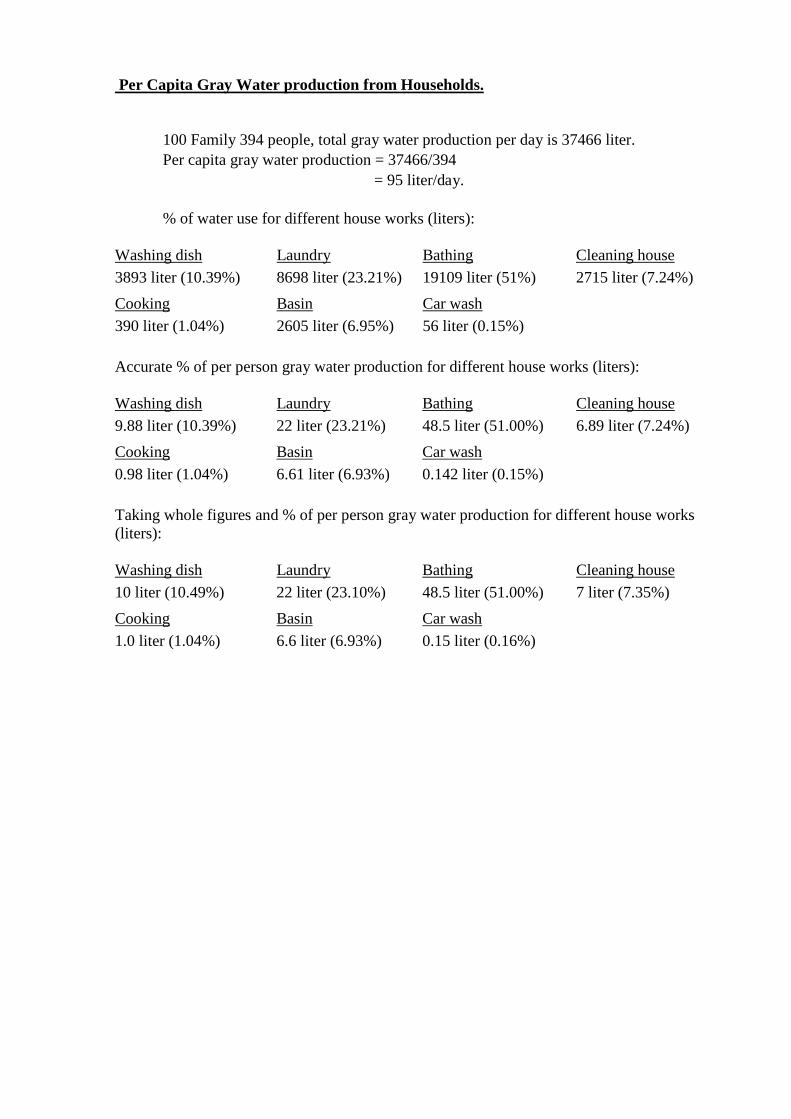
Per Capita Gray Water production from Households.
100 Family 394 people, total gray water production per day is 37466 liter. Per capita gray water production = 37466/394
= 95 liter/day.
% of water use for different house works (liters):
3893 liter (10.39%) Washing dish
8698 liter (23.21%) Laundry Bathing
19109 liter (51%)
2715 liter (7.24%) Cleaning house
390 liter (1.04%) Cooking Basin
2605 liter (6.95%)
56 liter (0.15%) Car wash
Accurate % of per person gray water production for different house works (liters):
9.88 liter (10.39%) Washing dish
22 liter (23.21%) Laundry Bathing
48.5 liter (51.00%)
6.89 liter (7.24%) Cleaning house
0.98 liter (1.04%) Cooking Basin
6.61 liter (6.93%)
0.142 liter (0.15%) Car wash
Taking whole figures and % of per person gray water production for different house works (liters):
10 liter (10.49%) Washing dish
22 liter (23.10%) Laundry Bathing
48.5 liter (51.00%)
7 liter (7.35%) Cleaning house
1.0 liter (1.04%) Cooking Basin
6.6 liter (6.93%)
0.15 liter (0.16%) Car wash

Appendix - C
DWASAs Daily Water Demand, Supply and Deficit.

0
50
100
150
200
250
1970
1980
1990
1996
1997
1998
1999
2000
2001
2002
2003
2004
2005
Waterdemand
Waterproduced
Figure: Graphical Representation of DWASAs Daily Water Demand Water Production in Crore Litres.
Year Water Produced Water Demand 1970 18 26 1980 30 55 1990 51 100 1996 81 130 1997 87 135 1998 93 140 1999 107 144 2000 113 150 2001 122 160 2002 130 168 2003 140 176 2004 146 185 2005 160 194
Table: DWASAs Daily Water Demand Water Production in Crore Litres.

DWASAs Daily Water Demand, Supply and Deficit.
Year Population (Lac)
Water Demand (Cr. ltr )
Water Supply Capacity (Cr. ltr)
Deficit (Cr. ltr)
1963 8.5 15 13 2 1970 14.6 26 18 8 1980 30.3 55 30 25 1990 55.6 100 51 49 1996 75.5 130 81 49 1997 80 135 87 48 1998 85 140 93 47 1999 90 144 107 37 2000 95 150 113 37 2001 100 160 122 38 2002 105 168 130 38 2003 110.25 176 140 36 2004 115.76 185 146 39 2005 121.5 194 160 34

Washing Dish
Laundry Bathing and Washing
Cleaning House
Prayer Cooking and Drinking
Basin Car Wash Toilet
10 22 48.5 7 3 11 6.6 0.15 38
10
22
48.5
7
0
10
20
30
40
50
60
Washing Dish
Laundry Bathing and
Washing
Cleaning House
Pr
Am
ou
nt
of
wat
er c
on
sum
pti
on
in li
ter
Uses o

3
116.6
0.15
38
rayer Cooking and
Drinking
Basin Car Wash Toilet
of water