Embed Size (px)
Citation preview

1
Promoting Sustainable Development through Natural Rubber Tree Plantations in Guatemala
Document Prepared by Econegocios
Project Title Promoting Sustainable Development through Natural Rubber Tree
Plantations in Guatemala
Version CCB Standards Second Edition
Date of Issue 13/09/2013
Prepared By Econegocios Occidente
Contact 7a Avenida 7-33, Zona 9. Edificio Occidente PBX: 22799000;
www.occidente.com.gt

2
Table of Contents 1 GENERAL SECTION ................................................................................................................................. 3 G.1 Original Conditions in the Project Area ............................................................................................... 3 General Information ............................................................................................................................................... 3 Climate Information ............................................................................................................................................. 13 Community Information ..................................................................................................................................... 16 Biodiversity Information ..................................................................................................................................... 20 G2 Baseline Projections .................................................................................................................................... 24 G3 Project Design and Goals ......................................................................................................................... 41 G4 Management Capacity and Best Practices ..................................................................................... 52 G5 Legal Status and Property Rights ........................................................................................................ 61 2 CLIMATE SECTION ................................................................................................................................ 65 CL1. Net Positive Climate Impacts .............................................................................................................. 65 CL2. Offsite Climate Impacts (‘Leakage’) ................................................................................................ 79 CL3. Climate Impact Monitoring ................................................................................................................... 84 3 COMMUNITY SECTION ........................................................................................................................ 91 CM1. Net Positive Community Impacts .................................................................................................... 91 CM2. Offsite Stakeholder Impacts ............................................................................................................... 92 CM3. Community Impact Monitoring .......................................................................................................... 92 4 BIODIVERSITY SECTION .................................................................................................................... 95 B1. Net Positive Biodiversity Impacts ........................................................................................................ 95 B2. Offsite Biodiversity Impacts .................................................................................................................... 96 B3. Biodiversity Impact Monitoring .............................................................................................................. 96 5 GOLD LEVEL SECTION ....................................................................................................................... 99 GL3. Exceptional Biodiversity Benefits...................................................................................................... 99 WORK CITED ..................................................................................................................................................... 101
3
1 GENERAL SECTION
G.1 Original Conditions in the Project Area
General Information
G1.1. Location of the project and basic physical parameters (hydrology, geology, soil, climate) Location of the project The project area consists of seven different farms comprising discrete areas located in two different regions of Guatemala, as seen in Figure 1. The farms situated in the North of Guatemala along the Atlantic Coast are located in the Departments of Izabal and Alta Verapaz. The farms situated in the South of Guatemala along the Pacific Coast are located in the Department of Suchitepéquez. The coordinates of each farm are listed in Table 1. KML files with project locations can also be found in Annex VIII.

4
Figure 1 Macro location of the project sites within Guatemala

5
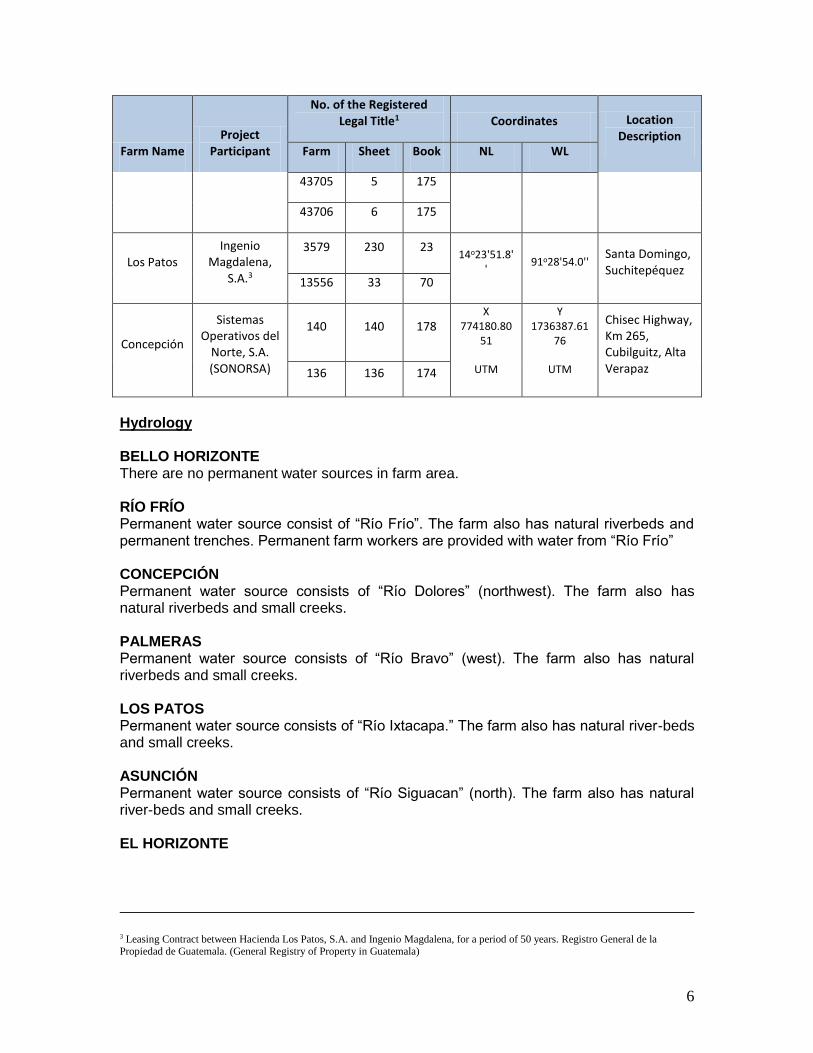
Table 1. Identification of the seven farms included in the project boundary
Farm Name Project
Participant
No. of the Registered Legal Title1 Coordinates Location
Description Farm Sheet Book NL WL
Palmeras Agropalmeras,
S.A. 14559 40 75
14o26'0.8.14''
91o17'26.78''
Santa Bárbara and Río Bravo, Km 124.5, Suchitepéquez, Guatemala
Bello Horizonte
Inversiones Agrícolas
Palafox, S.A.
1618 370 23
15o36'13.43''
88o57'7.01''
Route CA-13, Km 265, Río Dulce, Livingston, Izabal, Guatemala
1572 790 22
2350 59 31
Río Frio Agropalmeras,
S.A.
2541 41 26E
15o40'31.96''
88o55'5.64''
Route CA-13, Km 265, Río Dulce, Livingston, Izabal, Guatemala
2542 42 26E
2546 43 26E
1601 230 23
1532 504 22
1533 510 22
1494 6 16
El Horizonte
Ingenio Magdalena,
S.A.
175 68 260 14o20'49.4'
' 91o10'56''
Patulul, Suchitepéquez
167 167 260
Asunción Ingenio
Magdalena, S.A.2
43703 3 175
14o28'35.10''
91o13'34.2'' Santa Bárbara, Suchitepéquez 43704 4 175
43702 2 175
1 Annex F: Proof of Title 2 Leasing Contract between Agropecuaria Asunción, S.A. and Ingenio Magdalena for a period of 50 years. Registro General de la Propiedad de Guatemala. (General Registry of Property in Guatemala)
6
Farm Name Project
Participant
No. of the Registered Legal Title1 Coordinates Location
Description Farm Sheet Book NL WL
43705 5 175
43706 6 175
Los Patos Ingenio
Magdalena, S.A.3
3579 230 23 14o23'51.8'
' 91o28'54.0''
Santa Domingo, Suchitepéquez
13556 33 70
Concepción
Sistemas Operativos del
Norte, S.A. (SONORSA)
140 140 178 X
774180.8051
Y 1736387.61
76
Chisec Highway, Km 265, Cubilguitz, Alta Verapaz 136 136 174 UTM UTM
Hydrology BELLO HORIZONTE There are no permanent water sources in farm area. RÍO FRÍO Permanent water source consist of “Río Frío”. The farm also has natural riverbeds and permanent trenches. Permanent farm workers are provided with water from “Río Frío” CONCEPCIÓN Permanent water source consists of “Río Dolores” (northwest). The farm also has natural riverbeds and small creeks. PALMERAS Permanent water source consists of “Río Bravo” (west). The farm also has natural riverbeds and small creeks. LOS PATOS Permanent water source consists of “Río Ixtacapa.” The farm also has natural river-beds and small creeks. ASUNCIÓN Permanent water source consists of “Río Siguacan” (north). The farm also has natural river-beds and small creeks. EL HORIZONTE
3 Leasing Contract between Hacienda Los Patos, S.A. and Ingenio Magdalena, for a period of 50 years. Registro General de la Propiedad de Guatemala. (General Registry of Property in Guatemala)

7
Permanent water source consists of “Rio Mapan” (north). The farm also has natural riverbeds and small creeks. Detailed hydrological information can be found in the Management Plants (Annex B: Management Plans) Geology North: The project area in the North is characterized by flat to undulating topography with slopes less than or equal to 45%. South: The project area in the South is characterized by flat to undulating topography with slopes less than or equal to 35%. Soil North: Soils are well-drained, acidic soils. South: Soils are well drained and acidic, characterized by high risk for erosion. The severity of human induced soil degradation in the region of the project area in both the South and the North has been classified as light to severe according to FAO (2008) National Soil Degradation Maps4 and national studies.5 In the North, severe soil degradation is evident from the severity and extent of soil compaction and soil erosion, as determined by the presence of exposed sub-soil horizons. The project area in the North and South is defined by the Holdridge Life Zone “Moist Subtropical Forest”. BELLO HORIZONTE Bello Horizonte Project zone includes one soil type under Simmons et. Al (1959) classification: Chacon (Chc): Soil that has been developed on top of ancient marine deposits. These soils have good internal drainage, a brown superficial color, grayish brown or yellowish brown. The texture is muddy of medium grain size with an underground texture that is muddy or clayey. These soils are of large depth with an acidic pH and low risk of erosion. The equivalent UNESCO-FAO taxonomical classification is Udults-Udepts generally found in the department of Izabal. RÍO FRÍO Rio Frio project zone includes two soil types under Simmons et. Al (1959) classification: Chacalte (Cha): Soil originating from calcerous material, with karst relief and good drainage. The superficial soil is of dark brown color with a clayey texture. The interior layer is brown with the same texture. The soil is of medium depth of 50 cm, with neutral pH and high risk of erosion.
4 FAO (2008) National Soil Degradation Maps: http://fao.org/landwater/agll/glasod/glasodmaps.jsp 5 Annex O: Additionality Documents/Perfil Ambiental de Guatemala. (IARNA. 2006.)
8
Chacon (Chc): Soil that has been developed on top of ancient marine deposits. These soils have good internal drainage, a brown superficial color, grayish brown or yellowish brown. The texture is muddy of medium grain size with an underground texture that is muddy or clayey. These soils are of large depth with an acidic pH and low risk of erosion. The equivalent UNESCO-FAO taxonomical classifications are Udults-Udepts and Udalfs-Udepts-Udults generally found in the departments of Sacatepéquez, Chimaltenango, Sololá, Totonicapán, Suchitepéquez, Escuintla, Izabal, and Baja Verapaz. CONCEPCIÓN: The soil quality of the municipality is sandy- clayey, muck clay, and sandy. The soils are heterogeneously above calcareous rock with high to medium depth. The zone is sub-tropical and extremely moist. The land is calcareous according to Simmons and Pinto classification; there is a tendency for various soils, Amay soils, Cobán soils, Tamahu soils, Chacalte soils Tzoja soils. According to the Guatemalan Ministry of Food and Agriculture’s (2000) First Approximation to the Taxonomical Classification of Soils in the Guatemalan Republic, to the scale of 1:250,000, the equivalent UNESCO-FAO taxonomical classifications are: Udults, Udults-Orthents, Orthents- Rendolls, and Rendolls-Udalfs-Udepts. These soils are typical of the areas of Alta Verapaz, Baja Verapaz, El Quiche, Huehuetenango, and Petén. PALMERAS Palmeras Project zone includes two soil types under Simmons et. Al (1959) classification: Panan Soil (Pn): soil originated from mafic material, with a slight incline and good drainage. The superficial soil is of brown color, with a sandy loam texture. The interior cap is of a yellowish brown color with the same texture. It consists of a medium depth of 50 cm, an acidic pH and with risk of erosion. Guatalon Soil (Gn): Soil originating from volcanic sand, with an almost leveled inclination, and excessive drainage. The coloration of the superficial layer is dark to very dark brown, with a sandy loam texture and the inferior layer has a yellowish brown color with sandy loam or thick loam texture. It consists of a medium depth of approximately 80 cm with an acidic pH. It has high erosion risk due to the texture. The equivalent UNESCO-FAO taxonomical classification is Vitrands-Psamments generally found in the departments of Sacatepéquez, Chimaltenango, Sololá, Totonicapán, Suchitepéquez, and Escuintla. LOS PATOS Los Patos project zone includes two soil types under Simmons, et. Al (1959) classification: Panan Soil (Pn) and Guatalon Soil (Gn). The equivalent UNESCO-FAO taxonomical classification is Vitrands-Psamments generally found in the departments of Sacatepéquez, Chimaltenando, Sololá, Totonicapán, Suchitepéquez, and Escuintla. LA ASUNCIÓN La Asuncion Project zone includes two soil types under Simmons, et. Al (1959) classification: Panan Soil (Pn) and Guatalon Soil (Gn). The equivalent UNESCO-FAO taxonomical classification is Vitrands-Psamments generally found in the departments of Sacatepéquez, Chimaltenando, Sololá, Totonicapán, Suchitepéquez, and Escuintla.

9
EL HORIZONTE El Horizonte Project zone includes two soil types under Simmons, et. Al (1959) classification: Panan Soil (Pn) and Guatalon Soil (Gn). The equivalent UNESCO-FAO taxonomical classification is Vitrands-Psamments generally found in the departments of Sacatepéquez, Chimaltenando, Sololá, Totonicapán, Suchitepéquez, and Escuintla. All soil classifications can be found in the Management Plans (Annex B: Management Plans) Climate North: The mean annual temperature in the project area in the North is 25oC, with an average maximum temperature of 33.7oC and an average minimum temperature of 22.3oC. The mean annual rainfall is between 3,000 and 3,500 mm per year. Evapotranspiration is 1800 mm per year with an average relative humidity of 80%. South: The mean annual temperature in the project area in the South is 26oC with an average maximum temperature of 32.5oC and an average minimum temperature of 20.5oC. The mean annual rainfall is 4,146 mm per year. Rainfall is concentrated in the months of May to January, with a dry season from July to August. G1.2. The types and conditions of vegetation within the project area: The major vegetation types present in the baseline conditions for the North and South were determined through land use and cover maps, satellite and areal imagery, literature reviews of site information as well as field observations and measurements. The baseline conditions on each farm are described in the Management Plans (Annex B).
Although some trees are present within the project boundary, in both the north and south these are shade trees for grazing animals scattered throughout the landscape and isolated live fences. Land use and cover maps for 1990 and 2006 of the project areas have been stored in a GIS environment (Annex H: Eligibility Analysis and Project Boundary\Maps). BELLO HORIZONTE Vegetation coverage consists of peppers in small proportions of the land, grasslands and some infrastructure. Surrounding area vegetation consists of rubber plantations, melina plantations, teak plantations, pasture for cattle, and nurseries among others. RÍO FRÍO Within the farm “Río Frío,” the main soil coverage consists of grasslands, broadleaf forest with an 8 to 10 meter total average height, and some infrastructure. The surrounding area is predominately used for: melina plantations, cattle grasslands, nurseries, and tree plantations of native and exotic species. CONCEPCIÓN Vegetation coverage consists of natural forest, grassland, coffee and cattle grazing land. Surrounding area vegetation consists of rubber plantations, sugar plantations, cattle grasslands, nurseries, ornamental plants, African palm, and tree plantations of exotic and native species. Areas that are currently planted with rubber trees were used previously for cattle grazing.
10
PALMERAS Vegetation coverage consists of peppers in small proportions of the land, grasslands and some infrastructure. Surrounding area vegetation consists of rubber plantations, sugar plantations, corn plantations, cattle grasslands, nurseries, ornamental plants, African palm, and tree plantations of exotic and native species. Areas that are currently planted with rubber trees were previously used for cattle grazing. LOS PATOS Vegetation coverage consists of sugar plantations, corn coverage, peppers in small proportions of the land, grasslands and some infrastructure. Surrounding area vegetation consists of rubber plantations, sugar plantations, corn plantations, cattle grasslands, nurseries, ornamental plants, African palm, and tree plantations of exotic and native species. LA ASUNCIÓN The main soil coverage consists of peppers in small proportions of the land, grasslands and some infrastructure. In the surrounding areas the main usage of soil in the region consists of rubber plantations, sugar plantations, corn plantations, cattle grasslands, nurseries, ornamental plants, African palm, and tree plantations of exotic and native species. EL HORIZONTE Vegetation coverage consists of peppers in small proportions of the land and grasslands. Surrounding area vegetation consists of rubber plantations, sugar plantations, corn plantations, cattle grasslands, nurseries, ornamental plants, and tree plantations of exotic and native species. All vegetation information can be found in the Management Plans (Annex B: Management Plans) G1.3. The boundaries of the project area and project zone Detailed maps delineating project boundary and zone have been defined and stored in a GIS environment and can be found in Annex H: Eligibility Analysis and Project Boundary\Maps.
11
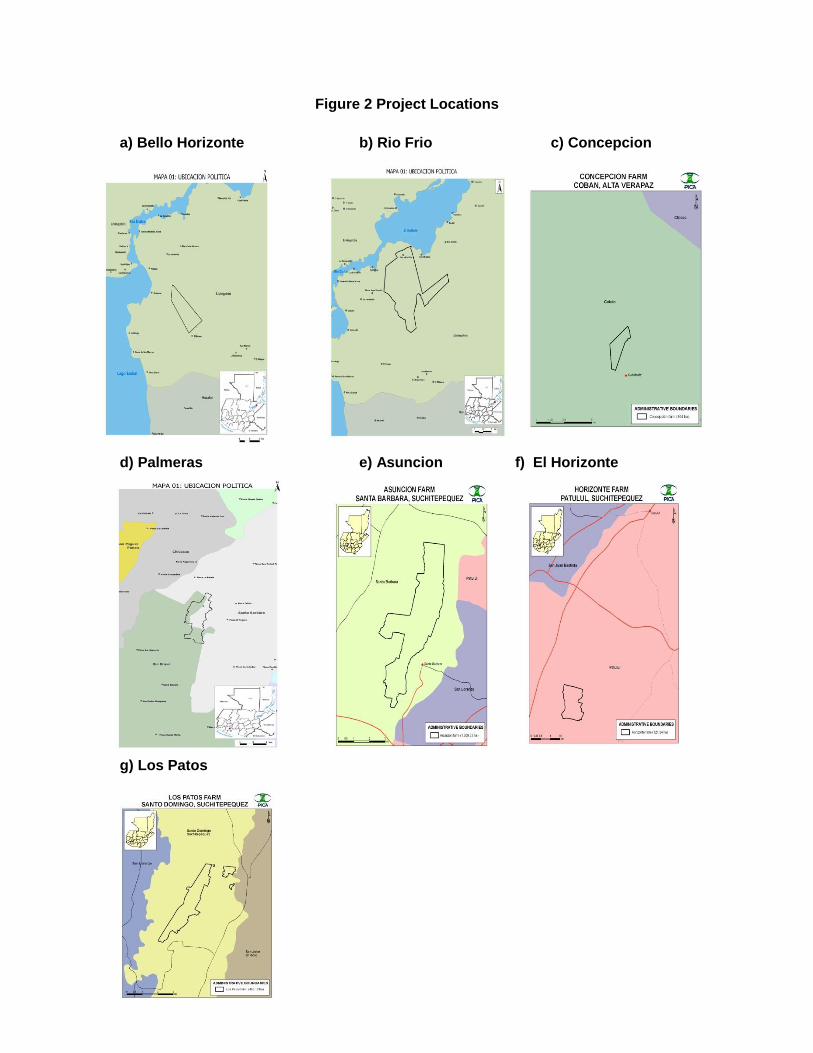
Figure 2 Project Locations
a) Bello Horizonte b) Rio Frio c) Concepcion d) Palmeras e) Asuncion f) El Horizonte g) Los Patos

12
BELLO HORIZONTE The farm Bello Horizonte is located under the jurisdiction of the municipality of Livingston, Department of Izabal, Guatemala. It is located 265 km northeast of the city of Guatemala and 6 km southeast of Rio Dulce, Livingston, Izabal. The farm covers 455.25 ha and the project boundary covers 454 ha. Its surroundings include: North: paved road CA-9 South: Private farm East: Private farm and paved road CA-9 West: Private farm RIO FRIO The farm Río Frío is located under the jurisdiction of the municipality of Livingston, Department of Izabal, Guatemala. It is located 265 km northeast of the city of Guatemala. The farm covers 2,610 ha and the project boundary covers 624 ha. Its surroundings include: North: La Providencia, and the Río Dulce Gulf South: Private farm East: Manantiales Cerro San Gil Reserve West: Ojo de Agua village, Chapas, the Rio Dulce Gulf and Private farms CONCEPCION The farm Concepcion is located under the jurisdiction of the Cubilguitz farm in the municipality of Coban, Department of Alta Verapaz, Guatemala. It is located 265 km northwest of the city of Guatemala. The farm covers 305 ha and the project boundary covers 305 ha. Its surroundings include: North: Cubilguitz farm South: Road to Chisec East: Dolores River and Cubilguitz farm West: Cubilguitz farm PALMERAS The farm Palmeras is located under the jurisdiction of the municipality of Santa Barbara and Rio Bravo, Department of Suchitepéquez, Guatemala. It is located 124.5 km southwest of the city of Guatemala and 46 km southeast of the capital of the Department of Mazatenango, Suchitepéquez. The farm covers 500 ha and the project boundary covers 500 ha. Its surroundings include: North: La Concordia farm, Conjuviteo farm and Santa Fe farm South: La Capital farm and Moldado farm East: Concordia farm, San Francisco River, El Tesoro farm an La Capital farm West: Bravo River, Providencia farm and Santa Leonor farm LOS PATOS The farm Los Patos is located under the jurisdiction of the municipality of Santo Domingo, Department of Suchitepéquez, Guatemala. It is located 158 km southwest of the city of Guatemala and 18 km southeast of the capital of the Department of Mazatenango, Suchitepéquez. The farm covers 479.07 ha and the project boundary covers 371 ha. Its surroundings include: North: Santa Emiliana farm and San Juan la Gloria farm South: Morenas farm East: Camampo farm, Ponderosa farm, La Selva farm and La Palma farm West: Los Patos (sugar plantation) and Escondida farm
13
LA ASUNCION The farm La Asuncion is located under the jurisdiction of the municipality of Santa Barbara, Department of Suchitepéquez, Guatemala. It is located 130 km southwest of the city of Guatemala and 44 km southeast of the capital of the Department of Mazatenango, Suchitepéquez. The farm covers 515.85 ha and the project boundary covers all the farm area. Its surroundings include: North: La Zona farm, Panama farm and El Esfuerzo farm South: Verapaz farm, La Concha farm and El Solitario farm East: San Jose el Carmen farm, Panorama farm, Ofelia farm and Maria el Carmen farm West: Santa Barbara, Conchitas farm and San Agustin Farm EL HORIZONTE The farm El Horizonte is located under the jurisdiction of the municipality of Patulul, Department of Suchitepéquez, Guatemala. It is located 119 km southwest of the city of Guatemala and 52 km southeast of the capital of the Department of Mazatenango, Suchitepéquez. The farm covers 102.46 ha and the project boundary covers all the farm area. Its surroundings include: North: San Antonio Mapan farm and La Esperanza farm South: Mixqueño farm and Marias Mapan farm East: The "Seco" River, Madre Vieja River and El Paraiso farm West: La Soledad farm and San Antonio Mapan farm
Climate Information
G1.4 Current carbon stocks within the project area(s), using stratification by land-use or vegetation type and methods of carbon calculation (such as biomass plots, formulae, default values) from the Intergovernmental Panel on Climate Change’s 2006 Guidelines for National GHG Inventories for Agriculture, Forestry and Other Land Use5 (IPCC 2006 GL for AFOLU) or a more robust and detailed methodology. AR-ACM0001 V 03 ‘Afforestation and reforestation of degraded land’ The project area contains degraded and degrading lands that are currently being grazed at a low level. No other pre-project activities are taking place in the project area. The project activities will lead to the sale of grazing animals to an entity not involved in the CDM activity and to slaughter of grazing animals as well as the displacement of animals to identified grazing lands outside of the project boundary. The establishment of the project will not decrease the availability of fuel wood. The project is fully applicable to methodology AR-ACM0001 V 03. Baseline net GHG removals by sinks Prior to the start of the project, the project area contained few scattered trees used for shade and live fences as part of the cattle grassing activities. Under the applicability conditions of AR-ACM0001 V 03, changes in carbon stock of above-ground biomass of non-tree vegetation may be conservatively assumed to be zero for all strata in the baseline scenario as well the changes in carbon stocks in dead wood, litter, and soil organic pools. Therefore the baseline net GHG removals by sinks will be determined as: ∆CBSL = ∆CBSL, tree Where:

14
∆CBSL = Baseline net greenhouse gas removals by sinks; t CO2-e ∆CBSL, tree = Sum of the carbon stock changes in above-ground and below-
ground biomass of trees in the baseline; t CO Field measurements were conducted to estimate the average biomass, trees per hectare, and average diameter of the existing trees at the start of the project and can be found in the PICA baseline report.6 To estimate aboveground biomass, biomass allometric equations were used. With trees for which it was not possible to measure actual height, the following equation was used to estimate above-ground biomass7: AG = (WD * exp(-1.499 + (2.148 * ln(DBH)) + (0.207 * (ln(DBH))2) – 0.0281 * (ln(DBH))3))) * CF * 44/12 Where AG = Total live tree above-ground biomass; kg WD = Wood density8; g/cm3 DBH = Diameter at breast height, conservatively measured at 0.4 m; cm CF = Carbon fraction of dry biomass in tree vegetation; t C (IPCC default 0.5) With trees for which was possible to measure actual height, the following equation was used to estimate above-ground biomass9: AG = (-2.977 + ln((WD * (DBH2) * H))) * CF * 44/12 AG = Total live tree above-ground biomass; kg WD = Wood density10; g/cm3 DBH = Diameter at breast height, measured at 1.3 m; cm H = Height, m CF = Carbon fraction of dry biomass in tree vegetation; t C (IPCC default 0.5) To estimate the existing below-ground biomass, the IPCC default ratio of below-ground biomass to above-ground biomass in tropical moist deciduous forest (0.22) was used.11 In each farm, measurements were taken in two management units to estimate baseline carbon reservoirs. The average live tree biomass for each stratum was calculated as the weighted mean of the live tree biomass stocks determined for each management block sampled and can be found in the PICA baseline report. 12
Table 2 Existing tree biomass at the start of the project
6 Annex I: Baseline Report
7 Chave et al. 2005 8 Reyes et al. 1992 9 Chave et al. 2005 10 Reyes et al. 1992 11 2006 IPCC Guidelines for National Greenhouse Gas Inventories Chapter 4, Table 4.4: http://www.ipcc-
nggip.iges.or.jp/public/2006gl/pdf/4_Volume4/V4_04_Ch4_Forest_Land.pdf 12 Annex I: Baseline Report

15
Strata Average Live Tree Biomass (t CO2-e/ha)
North 10.31
South 16.22
As required by AR-ACM0001 V 03, the estimation of carbon stock changes in above-ground and below-ground tree biomass in the baseline is calculated by summing the baseline annual net carbon stock changes in above-ground and below-ground tree biomass across all baseline strata to obtain the value for the whole project. The carbon gain-loss method is used to calculate baseline annual carbon stock net change in aboveground and belowground biomass. As allowed by AR-ACM0001 V 03, the annual decrease in aboveground and belowground carbon stock of living trees due to biomass loss is conservatively assumed to be zero. Therefore the annual carbon stock net change in the baseline is the annual increase in aboveground and belowground carbon due to biomass growth of living trees. To estimate the change in existing tree biomass over time, the growth rate of a typical Tropical American secondary forest species Simarouba amara (Marupa)13 was used. Marupa Growth Model: DBH = 3.482t0.6836
Where: DBH = Diameter at breast height (1.3 m); cm T = Time; years
Table 3 Baseline carbon stocks in existing trees
North South
Project Year
Year Estimated
Growth Rate per Year
Total Biomass (t CO2-e)
Estimated Growth Rate per Year –
South
Total Biomass (t
CO2-e)
0 2007 10,505 20,005
1 2008 1.06 11,101 1.06 21,224
2 2009 1.05 11,710 1.06 22,472
3 2010 1.05 12,333 1.06 23,748
4 2011 1.05 12,967 1.05 25,052
5 2012 1.05 13,614 1.05 26,383
6 2013 1.05 14,273 1.05 27,740
7 2014 1.05 14,944 1.05 29,125
8 2015 1.05 15,627 1.05 30,535
9 2016 1.04 16,322 1.05 31,970
10 2017 1.04 17,028 1.05 33,431
13 Recavarren, P. 2007. Marupa plantation volume accumulation study in the Loreto Region.

16
North South
Project Year
Year Estimated
Growth Rate per Year
Total Biomass (t CO2-e)
Estimated Growth Rate per Year –
South
Total Biomass (t
CO2-e)
11 2018 1.04 17,745 1.04 34,917
12 2019 1.04 18,474 1.04 36,428
13 2020 1.04 19,213 1.04 37,962
14 2021 1.04 19,964 1.04 39,521
15 2022 1.04 20,725 1.04 41,103
16 2023 1.04 21,497 1.04 42,708
17 2024 1.04 22,279 1.04 44,337
18 2025 1.04 23,072 1.04 45,988
19 2026 1.03 23,875 1.04 47,661
20 2027 1.03 24,688 1.04 49,357
Community Information
G1.5 A description of communities located in the project zone, including basic socio-economic and cultural information that describes the social, economic and cultural diversity within communities (wealth, gender, age, ethnicity etc.), identifies specific groups such as Indigenous Peoples and describes any community characteristics. There are no local communities living within the project area since the area is private property. The owner of each farm included in the project and the number of the legal title to the land can be found in Annex F: Proof of Title.
Table 4: Ethnic and Gender Distribution 2002 and 2011 from the Institute of National Statistics, Guatemala. 14
BELLO HORIZONTE
In the region surrounding the farm “Bello Horizonte” there are diverse villages and communities, of which “Rio Dulce” has the largest population. Also, there are plots and adjacent private farms. The main economic activity of the surrounding inhabitants consists of agriculture and livestock: with respect to livestock activities, the self-subsistent production of chickens, turkeys, pigs, and other yard animals. The production of bovine occurs in lower
14 Institution National de Estadística, Guatemala C.A. Ethnic and gender distribution in the departments of Suchitepéquez, Alta
Verapaz, and Izabal. 2011. Retrieved from http://www.ine.gob.gt/np/poblacion/
Total population 2011
maya garifuna xinka ladino mujeres hombres mujeres hombres
SUCHITEPEQUEZ 189,558 110 391 209,949 204,395 199,550 263,773 252,694 516,467
ALTA VERAPAZ 718,223 26 22 57,692 389,027 387,219 558,607 554,174 1,112,781
IZABAL 68,504 2,958 84 242,292 157,747 156,559 209,028 204,371 413,399
Ethnic Belongings population 2002 population 2011departamento
17
proportions. Cattle ranching farms, which are used extensively, occupied a large area of land. Some cattle ranching farms develop the production of cattle with grasslands and few disperse trees for shade. The common species composition of cattle farms includes madre cacao (Glricidia sepium), pito (Eritrina sp.), corozo (Orbignya guacuyule), san juan (Vochysia hondurensis), irayol (Genipa americana) and ceiba (Ceiba pentandra). Commerce is very important for the Rio Dulce village, which hosts a wide range of formal and informal businesses. This development has been made possible due to the village’s location, making it a tourist destination with national relevance. Forestry production includes the use of native species such as the santa maria (Calophyllum brasiliense), sangre (Virola koschnyi) and mapola (Sterculia apetala); and, to a lesser degree the commercial production of species with rapid growth such as melina (Gmelina arborea), teak (Tectona grandis) and pine (Pinus caribea). Agriculture is the main economic activity, used for subsistence and semi commercially. According to Rosales (1996), each farmer has on average three hectares of able land for cultivation. The traditional crops include corn (Zea mays) and beans (Phaseolus vulgaris). The cultivation of tubers such as cassava (Manihote sculenta) and yam (Discorea sculenta) is also common. Family gardens also cultivate taro (Colocassia sculenta) and (Xanthosoma violaceum), plantains (Musa paradisiaca), Cananas (Musa sapientum), sugar Cane (Sacharum oficinarum), citruses (Citrus spp.), and coffee (Coffea arabica). Part of the agriculture production is for subsistence but the rest is sold to intermediaries at relatively low costs (FUNDAECO, 2005). According to farmers, the income generated from agriculture does not cover basic family needs. In Los Angeles village pineapple (Ananas comosus) has become an important crop. The Samaria, Nueva Jerusalen, Pacayas and Lote B communities have coffee (Coffea arabica) and cardamom (Elettaria cardamomun) plantations. Fishing activities are also important in the nearby communities located on the boarders of the “Rio Dulce” River. The products obtained are commercially sold to the hotel industry and nearby restaurants. While 90% of the economically active population is involved in agriculture activities (Lopez, 1997); in certain communities where agriculture is not predominant, the head of the house acquires a salary from state or private institutions such as the port industry, the naval base, TELGUA, television channels, hotels, etc. (CATIE/PNUMA/Asdi, 2005). Natural forests have been reduced to provide grassland for cattle and for agricultural production. (A detailed report of the corresponding community each worker belongs to can be found in the 2013 GAO Statistics Report) RÍO FRÍO The surrounding region of the farm “Río Frío” has many diverse villages and communities, which includes: Los Angeles, La Providencia, San Gil, El Nacimiento, Los Laureles, Chapas, Las Brisas, and Nuevo Río Frío. Also, there are plots and surrounding private farms. The majority of the inhabitants in the nearby communities have common roots in the department of Alta Verapaz, especially from the municipality of Cahabon. This is of direct result from the dynamic movement form the q’eqchi population in the last 120 years, whom fled the coffee expansions in both Verapaz regions. They initiated their expansion towards the north from Quiche, towards the Livingston municipality in the west, making their way to Petén (IGN, 1981). The communities that surround the “Rio Frío” farm are active in many activities, such as:

18
Agriculture is the main economic activity, used for subsistence and semi commercially. According to Rosales (1996), each farmer has on average three hectares of able land for cultivation. The traditional crops include corn (Zea mays) and beans (Phaseolus vulgaris). The cultivation of tubers such as cassava (Manihote sculenta) and yam (Discorea sculenta) is also common. Family gardens also cultivate taro (Colocassia sculenta and Xanthosoma biolasium), plantains (Musa paradisiaca), bananas (M. sapientum), sugar cane (Sacharum oficinarum), citric (Citrus spp.), and coffee (Coffea arabica). Part of the agriculture production is for subsistence but the rest is sold to intermediaries at relatively low costs (FUNDAECO, 2005). According to farmers, the income generated from agriculture does not cover basic family needs. In Los Angeles village pineapple (Ananas comosus) has become an important crop. The Samaria, Nueva Jerusalen, Pacayas and Sector B communities have coffee (Coffea arabica) and cardamom (Elettaria cardamomun) plantations. The main economic activity of the surrounding inhabitants consists of agriculture and livestock: with respect to livestock activities, the self-subsistent production of chickens, turkeys, pigs, and other yard animals. The production of bovine occurs in lower proportions. Extensive areas of agriculture are occupied by cattle ranching farms for extensive use. Some cattle farms develop the production of bovine in fields that also contain disperse trees for shade and live fences. The most common trees used are: madre cacao (Glricidia sepium), pito (Eritrina sp.), corozo (Orbignya guacuyule), san juan (Vochysia hondurensis), irayol (Genipa americana) and ceiba (Ceiba pentandra). Forestry production includes the use of native species such as the santa maria (Calophyllum brasiliensise), sangre (Virola koschnyi) and mapola (Sterculia apetala); and, to a lesser degree the commercial production of species with rapid growth melina (Gmelina arborea), teak (Tectona grandis) and pine (Pinus caribea). While communities near larger cities such as Puerto Barrios have access to salaries from state or private institutions such as the port industry, the naval base, TELGUA, television channels, hotels, etc. (CATIE/PNUMA/Asdi, 2005), 90% of the economically active population is involved in agriculture activities (Lopez, 1997). (A detailed report of the corresponding community each worker belongs to can be found in the 2013 GAO Statistics Report) CONCEPCIÓN In the region surrounding the farm “Concepcion” there are diverse villages and communities, of which the inhabitants of the Cubilguitz community are a majority. Also, there are plots and neighboring private farms. The socio cultural organizations that are of interest within the municipality are: Club Rotario, Sociedad de Beneficencia, Casa de la Cultura, Camara de Comercio, Pastoral Social, and Asoc. Amigos de La Marimba. The main economic activity of the local inhabitants is agriculture, cattle farming, coffee, beans, pepper and cardamom, which has had a strong acceptance in the international market. There is also production of sugar, corn, bananas, pepper and tea, among others. Many of the locals from the community are laborers and benefit from the labor opportunities that the farm “Concepcion” generates during the maintenance and harvest of the rubber tree products. This is of particular importance since rubber production generates many permanent jobs and reduces dependence on temporal or unstable work.
19
Among the crafts that are of special importance there are tapestries, saddler objects, specialty wood products, furniture and masks, hay hats, game, pyrotechnics and handicraft industry of goldsmiths and works of silver. Main languages are: Spanish and Q’eqchí’. PALMERAS In the region surrounding the farm “Palmeras” there are diverse villages and communities, including the Río Bravo municipality, Las Flores village, and the Santa Barbara municipality. Also, there are plots and adjacent private farms such as La Patria, El Tesoro, and others. The main economic activity of the local inhabitants is agriculture, cattle farming and agro industry, and to a lesser degree there is also production of sugar cane, rubber, corn, beans, sorghum, bananas and plantains. Many of the locals from the community are laborers and benefit from the labor opportunities that the farm “Palmeras” generates during the maintenance and harvest of the rubber tree products. This is of particular importance since rubber production generates many permanent jobs and reduces dependence on temporal or unstable work. Natural forests have been reduced in the region for agricultural production, fire wood and construction. (A detailed report of the corresponding community each worker belongs to can be found in the 2013 GAO Statistics Report) LOS PATOS In the region surrounding the farm “Los Patos” there are diverse villages and communities, of which San Jose El Idolo, Belen, and the Santo Domingo municipalities are of most importance. Also, there are plots and adjacent private farms such as “Camampo”, “El Rosario”, among others. The main economic activity of the local inhabitants is agriculture, cattle farming, agroindustry, and of smaller importance handicraft products. The main crops consist of sugar, rubber, corn, bean, sorghum, and banana. Many of the locals from the community are laborers and benefit from the labor opportunities that the farm “Los Patos” generates during the maintenance and harvest of the rubber tree products. This is of particular importance since rubber production generates many permanent jobs and reduces dependence on temporal or unstable work. The naturals forests have been reduced to produce agricultural products, for use as fire wood and for construction. LA ASUNCION
In the region surrounding the farm “La Asuncion” there are diverse villages and communities, of which the Santa Barbara municipality is of most importance. Also, there are plots and adjacent private farms such as “Panama”, “Los Andes”, among others. The main economic activity of the local inhabitants is agriculture, cattle farming, agroindustry, and of smaller importance hand crafted products. The main crops consist of sugar, rubber, corn, bean, sorghum, and African palm. Many of the locals from the community are laborers and benefit from the labor opportunities that the farm “La Asuncion” generates during the maintenance and harvest of the rubber tree products. This is of particular importance since rubber production
20
generates many permanent jobs and reduces dependence on temporal or unstable work. The natural forests have been reduced to produce agricultural products, for use as fire wood and for construction. EL HORIZONTE In the region surrounding the farm “El Horizonte” there are diverse villages and communities, of which “Patulul” and “Barrio San Rufino” municipalities are of most importance. Also, there are plots and adjacent private farms such as “San Antonio Mapan”, “El Paraíso”, among others. The main economic activity of the local inhabitants is agriculture, cattle farming, agroindustry, and of smaller importance hand crafted products. The main crops consist of sugar, rubber, corn, and bean. Many of the locals from the community are laborers and benefit from the labor opportunities that the farm “El Horizonte” generates during the maintenance and harvest of the rubber tree products. This is of particular importance since rubber production generates many permanent jobs and reduces dependence on temporal or unstable work. The natural forests have been reduced to produce agricultural products, for use as fire wood and for construction. Detailed community and socio economic information for the seven farms can be found in the Management Plans (Annex B: Management Plans)
Biodiversity Information
G1. 7 A description of current biodiversity within the project zone (diversity of species and ecosystems) and threats to that biodiversity, using appropriate methodologies, substantiated where possible with appropriate reference material. Biodiversity within the project area is low since the land was previously used for cattle and was highly degraded. There are areas of high diversity in natural forests within the project area and zone that will benefit from the project, however degradation is high in the surrounding area15. Workers in the project area have already noticed increases in biodiversity as a result of the rubber plantations. CONCEPCIÓN The farm “Concepcion” is found in a region that is rich in flora, having a large variety of plants and orquids, which includes the monja blanca (Lycaste skinneri alba), the Guatemalan national flower, as well as azaleas (Rhododendron), dahlias (Dahlia), and others. Fauna is also rich and includes animals such as: tigrillo (Leopardus pardalis), venado cola blanca (Odocoileus virginianus), cabros de monte (Mazama americana), tigre (Panthera onca), ocelote (Leopartus pardalis), chachas (Ortalis vetula), coche de monte (Dicotyles pecari), jabalí (Tayassu tajacu), cotuza (Felis concolor), puerco-espin (Erethizon dorsatum), tepezcuintle (Agouti paca), pizote (Nasua narica), ardilla (Sciurus deppei), mapache (Procyon lotor), loro (Amazona farinosa), guacamaya (Ara macao),
15 FAO (2008) National Soil Degradation Maps: http://fao.org/landwater/agll/glasod/glasodmaps.jsp
21
senzontle (Mimus polyglottos), guardabarranco (Eumomota superciliosa), perico (Aratinga sp.) and sulula. The Guatemalan national bird “el quetzal” (Pharomachrus sp) also finds refuge in areas such as Sierra de Chama, Xucaneb, Samac and Seacte, located near the project. (Concepcion Management Plan, Annex B: Management Plans) RÍO FRÍO The natural forest area within the “Rio Frio” farm is of special importance due to its proximity with the Natural Reserve “Cerro San Gil,” which makes it critical to environmental services generated for society and for biodiversity by the reserve. Therefore, the appropriate management and conservation of the farms natural forest is vital for the reserves to reach the goals that were set upon its creation. The Natural Reserve “Cerro San Gil” has is of high importance in terms of flora and fauna since it is the largest remaining humid tropical forest in Guatemala and hosts an extensive biological variety with rare endemic species. The “Rio Frio” farm’s forest is located within the buffer zone and natural reserve zone, all the way to the multiple use zone, with a small part within the National Rio Dulce Park. Due to its location, in the natural forest of the Cerro San Gil there are threatened and endangered species that include: Mammals: Agouti paca, Alouatta palliata, Mazama americana, Odocoileus virginiana, Chinecters minimus, Herpailurus yaguaroundi, Leopardus pardales, Panthera onca, Puma concolor, Pteronotus dhabi, Tylomys nudicaudatus, Eira barba, Tamandua mexicana, Chrotopterus avritus, Potos flavus, Tapirus bairdii, and Tayassu tajacu (CONAP/FUNDAECO/TNC, 2006). Amphibians: Bolitoglossa odonnelli, Oedipina elongata, Eleutherodactylus chac, Eeleutherodactylus laticeps, Eleutherodactylus psephosypharus, eleutherodactylus rhoopics, Eleutheordactylus sanderonsi, and Ptychohyla panchoi (Campbell and Bucklin, 1998; Campbell in FUNDAECO, 2005; Campell, 1998) The majority of the species on this list are listed in the Red list of Threatened Species (CONAP, 2001). Reptiles: Iguana iguana, Boa constrictor, Amastridium veliferum, Imantodes cenchoa, Oxybelis aeneus, O fulgidus, Oxyrhopus petola, Pseustes poecilonotus, Rhadinaea decorata, Scaphiodontophis annulatus, Sibon dimidiata, Xenodon rabdocephalus, Clelia clelia, and Micrurus hippocrepis (Campbell 1998) All of the species on this list are listed in the Red list of Threatened Species (FUNDAECO, 2005) Birds: Among the variety of avifauna found in the Reserve there can be found: Electron carinatum, Tinamus major, Ramphastus sulfuratus, Psaracalius wagleri, Spizaetus melanoleucus, Spizaetus ornatos, Vireo leucophvys, and Sorcoramphus papa. (Bucklin, 1990 and Cerezo et al. 2005). Endemic Species: There are also high concentrations of endemic species, especially in the low lands near the water basins of the Las Escobas and Tameja rivers. Endemic trees and palms include: Rondeletia izabalensis, R. linguiformes, R. macrocalix, Cytharaxylum guatemalense, Chamaedorea castillo‐ montii, C. falcifera, C. nationsiana, and C. stenocarpa

22
Temporal Species: There are also temporal concentrations of animals. Studies show that there is a large diversity of birds within the protected area. The “Cerro San Gil’s” habitat maintains 407 species of birds, of which 24 species are considered regionally endemic and 59 species or sub-species are considered endemic to Mesoamerica. The species observed within the reserve represent 58% of the total species reported for Guatemala (Cerezo et al., 2005). Migratory species reported for Cerro San Gil represent the 28.7% of the protected areas avifauna, with 114 species (Cerezo and Ramirez, s.f.) In accordance with the 1,255 registered captures since 1993, the majority of species are represented by the family Tyrannidae with 47 species; followed by the family Parulidae with 35 species, Accipitridae with 27 species, and Trochilidae with 23 species (FUNDAECO, 2005; Cerezo et al., 2005). Of the species observed in the Reserve, residential and migratory, approximately 92 have been included in the list of threatened or endangered species. These species are part National Council of Protected Areas (CONAP) List of Endangered Species. In regards to migratory species, at least 17 of the 29 species of the family Parulidae have been reported as endangered species of with reducing populations (Cerezo, 2004) Endangered Ecosystems: According to the Cerro San Gil Reserve’s management plan the natural forest found within the “Rio Frio” farm can be classified as Very Humid Tropical Forest. This type of forest corresponds to one of 14 zones of live described by Holdridge (1964) for Guatemala. In the country, this zone extends over 2,651 km2 (URL/IIA/IARNA, 2004); which represents approximately 2.44% of the countries surface. In Izabal, this forest type makes up 33% of the department. Emmel (1983), states that tropical humid forest serves as the largest storage of germplasm and the habitat for 60% of living beings. According to the author, one hectare of this forest can house up to 200 species of trees, compared to 10 or 20 species/hectare found in template forests. A tropical Guatemalan forest can have no less than 4,000 species of plants. (Plan de Manejo Rio Frio BAVC, Annex B: Management Plans) A detailed plan of the Cerro San Gil Reserve located in the area surrounding Rio Frio and Bello Horizonte can be found in the 2006 Master Plan developed by CONAP, FUNDAECO and TNC. G1. 8 An evaluation of whether the project zone includes any of the following High Conservation Values (HCVs) and a description of the qualifying attributes: 8.1. Globally, regionally or nationally significant concentrations of biodiversity values; 8.1.1 Protected areas 8.1.2 Threatened species 8.1.3 Endemic species 8.1.4 Areas that support significant concentrations of a species during any time in their lifecycle (e.g. migrations, feeding grounds, breeding areas) 8.2. Globally, regionally or nationally significant large landscape-level areas where viable populations of most if not all naturally occurring species exist in natural patterns of distribution and abundance; 8.3. Threatened or rare ecosystems 8.4. Areas that provide critical ecosystem services (e.g., hydrological services, erosion control, fire control); 8.5. Areas that are fundamental for meeting the basic needs of local communities (e.g., for essential food, fuel, fodder, medicines or building materials without readily available alternatives); and

23
8.6. Areas that are critical for the traditional cultural identity of communities (e.g., areas of cultural, ecological, economic or religious significance identified in collaboration with the communities).
All project areas maintain sustainable and/or sustainable responsible forest management and are therefore committed to maintaining high conservation values (HCV). Forest operations have identified areas or elements of high conservation value and designated the areas necessary for conservation. HCV maps have been stored in a GIS environment (Annex H: Eligibility Analysis and Project Boundary/Maps/HCVA). BELLO HORIZONTE Bello Horizonte has internal rivers necessary to protect water resources for forest, especially broad-leaved tree species. These classify as a High Conservation Value 4(HCV). RIO FRIO The Rio Frio farm has natural forest area within the buffer and natural reserve zone of the Cerro San Gil Reserve, all the way to the multiple use zone. A small area of the farm is within the National Rio Dulce Park. Within the natural forest of the Cerro San Gil there are threatened and endangered species as well as temporal and endemic species that include that are listed in the G1.7. These values classify as HCV 1. According to the Cerro San Gil Reserve’s management plan the natural forest found within the “Rio Frio” farm can be classified as Very Humid Tropical Forest. This type of forest corresponds to one of 14 zones of live described by Holdridge (1964) for Guatemala. In the country, this zone extends over 2,651 km2 (URL/IIA/IARNA, 2004); which represents approximately 2.44% of the countries surface. In Izabal, this forest type makes up 33% of the department. Emmel (1983), states that tropical humid forest serves as the largest storage of germplasm and the habitat for 60% of living beings. According to the author, one hectare of this forest can house up to 200 species of trees, compared to 10 or 20 species/hectare found in template forests. A tropical Guatemalan forest can have no less than 4,000 species of plants. This area classifies as HCV 3. The farm’s forest is found within the watershed determined as Rio Frio and is located in the middle of this watershed making it a HCV 4. For this reason, the natural forest within the farm is considered to have an important function in the recollection of water for the watershed. The forest is also found in an area with large breaks in the land and high slopes. The precipitation in this zone is also very high, between 3,000 and 3, 5000 mm/year. Under these conditions the forest cover is considered critical for the conservation of the soil, prevention of erosion, and the mitigation of contamination in the Rio Frio water by sediments. The natural forests that protect these HCV in this region, especially in the Cerro San Gil Reserve, face a wide range of threats. Among the most important threats found for the natural elements of this area are: Cerro San Gil is the source of the potable water for the population of the Izabal Department making it a HCV 5 (Rosales, 1996). The 17 most important rivers of the Reserve have an accumulated length of 612 km. The inhabitants of Santo Tomas de

24
Castilla and Puerto Barrios, as well as 40 communities that are located within the community, depend on this water source daily. There are approximately 50,000 inhabitants that rely on this ecosystem service. One of the main objectives of the reserve is therefore to manage and protect its hydrological basins. The forest in Rio Frio plays an important role in protecting this water source and is of high conservation value since it protects the Rio Frio basin. More than 50% of the length of this river is located within the farm and it is the second largest river bed of the Cerro San Gil Reserve. The Rio Frio River also showed the lowest concentration of fecal coliform and E. coli FUNDAECO’s water quality tests. (This information can be found in the Rio Frio High Conservation Values Management Plan) CONCEPCION FARM Conception farm has HCV 4 since it includes watersheds with a forested surrounding, necessary for the control of erosion and to avoid floods and landslides. Concepcion also includes HCV 5 since it has forested watersheds that are critical for the provision of clean water to local habitants PALMERAS The project area of Palmeras has internal rivers that serve as protection for water sources with native forest areas made up of broad-leaved trees. These areas are also critical for the continued production of agriculture and fishing. (Annex B: Management Plans) Palmeras has forested areas necessary for the control of erosion as well as to control floods and land falls. Palmeras also has areas with an accented topography, with steep slopes (45 degrees and above) that are subject to great precipitation (greater than 200mm), formed by clays and meteorized conglomerates. This classifies as a HCV 4. Palmeras has forested watersheds that are critical for the provision of clean water to local habitants. Palmeras also has forests that provide ecosystem services important for the continued production of nearby agriculture and fisheries. These values are classified as HCV 5. LOS PATOS, LA ASUNCIÓN, and EL HORIZONTE are currently undergoing the processes necessary to obtain sustainable and/or responsible forest management certifications. These farms have HCV 4, consisting of banks of rivers and creeks that will remain forested, observed in Annex H: Eligibility Analysis and Project Boundary\Maps Detailed information regarding High Conservation Values for the farms can be found in the Management Plans (Annex B: Management Plans) G2 Baseline Projections
G2. 1 Describe the most likely land-use scenario in the absence of the project following IPCC 2006 GL for AFOLU or a more robust and detailed methodology, describing the range of potential land- use scenarios and the associated drivers of GHG emissions and justifying why the land-use scenario selected is most likely.

25
Most likely land-use scenarios in the absence of the project were identified for VCS to assess and demonstrate additionality using the five-step Methodological Tool “Combined tool to identify the baseline scenario and demonstrate additionality in A/R CDM project activities (Version 01)”16. Step 1. Identification of alternative land use scenarios to the proposed A/R CDM project activity Sub-step 1a. Identify credible alternative land use scenarios to the proposed CDM project activity The lands on which rubber plantations are to be established are degraded and degrading pastures with herbaceous vegetation, a few existing trees and live fences. If the current land use continues, the project area in the North and in the South will remain in its current condition as it has since the 1980’s. In the South of Guatemala, livestock grazing is the traditional land use. In the North of Guatemala, soils are largely unproductive for crop cultivation, and the land has been used extensively for cattle grazing. In the North project area soils are compacted from continuous cattle grazing to the point that it is impossible to cultivate crops in the project area. In this context, the continuation of the current situation and historical land use (no project activity or other alternatives undertaken) represents the only alternative to the project activity. Land use scenario a: Continuation of pre-project land use: pastureland As detailed above, the project area is pasture with herbaceous vegetation, a few existing trees, and live fences. The project area has remained in a state of degraded or degrading pastureland since the 1980’s. Without a change in land use practices for pasture land the project area will remain in this state. This activity is widespread, especially in the North. The lands neighboring the project area in the North are also being used for pasture. Land use scenario b: Crop production In the North, although the project area might have supported crop production before grazing activities began, the soil is now too degraded for crop production. Attempts by the Project to interplant rows of rubber trees with corn were unsuccessful in the North. Agricultural production in the North would result in low or no yields. In the South sugar cane production is widespread in the lands surrounding the project area however the rocky soils and/or slopes of the project area in the South make it unsuitable for sugar cane production17. Land use scenario c: FSC certified rubber cultivation without registration as a VCS-CCB project There is no legal requirement to reforest in the project area, and no FSC certified rubber plantations exist in Guatemala. The risk associated with the establishment of rubber plantations is high due to substantial requirements for up-front investment and price fluctuations in the natural rubber market. Although incentives for the establishment of rubber plantations in some areas of the country (Verapaces and Izabal) are available from the Forest Incentive Plan (PINFOR) under Law No 101-61, these incentives do not
16 “Combined tool to identify the baseline scenario and demonstrate additionality in A/R CDM project activities (Version 01)”
http://cdm.unfccc.int/methodologies/ARmethodologies/tools/ar-am-tool-02-v1.pdf 17 Ministerio de Agricultura, Ganaderia y Alimentacion de Guatemala. 2006. Mapa de cobertura vegetal y uso de la tierra República
de Guatemala Año 2003.; Ministerio de Agricultura, Ganaderia y Alimentacion de Guatemala. 2006. Memoria Tecnica: Mapa de
cobertura vegetal y uso de la tierra República de Guatemala Año 2003.

26
cover a significant portion of the huge costs associated with rubber plantation establishment. As such they are insufficient to encourage the expansion of rubber plantations in the region. Land use scenario d: Non FSC certified rubber cultivation without registration as a CCB project The traditional and common practice land use is crop production (see Land use scenario b); pasture lands (see land use scenario a) and small scale natural rubber tree plantations (Non FSC certified and without Registration as a CCB project). The project proponent was committed since 200718 to lead the creation of incentives to responsibly increase the rate of rubber plantation’s establishment. In order to do so, the need to create diversified sources of revenue that allows rubber plantations to compete, under a financial perspective, with traditional land use scenarios, was identified. In addition, the historical high fluctuation of rubber prices introduces uncertainty to financial models and expected future profits19. This situation marks the need to diversify revenues from rubber plantations different from rubber production. This scenario in the south is prevented because the all PICA’s new model here explained is different from the traditional and common practice land use scenario, which is coincident with Land use scenario d. Although rubber production in the south exists, almost all rubber production in southern Guatemala is produced by smallholders with plantations of less than 50 ha in size. Only 5% of the plantations associated with the Rubber Producers Association of Guatemala (Gremial de Huleros de Guatemala) are greater than 200 ha in size20. The size of each proposed project plantation in the South is at least double the most common size of rubber plantations in Guatemala (50 ha)21 up to seven or twelve times the size of typical rubber plantations. Therefore, the project will lead to an increased rate of reforestation in southern Guatemala that would not occur in the absence of the project activity and that this results from direct intervention by the project activity, and can be considered additional. Land use scenario e: Reforestation through direct planting of timber species without registration as a CCB Project There is no legal requirement to reforest in the project area. Although incentives for the establishment of timber plantations are available from the Forest Incentive Plan (PINFOR) under Law No 101-61, these incentives have not been successful in promoting more than a low rate of forestation across the country, which the country-wide rate of deforestation far outstrips. The annual rate of forest plantation in Guatemala is 8,560 ha/yr22 representing less than 0.08% of the total land area of Guatemala. Approximately 70% of lumber processed in Guatemala originates in native conifer forests23. Outcome of Sub-step 1a: List of credible alternative land use scenarios that would have occurred on the land within the project boundary of the A/R CDM project activity Land Use Scenario a: Pastureland Land Use Scenario b: Crop production
18 Annex O: Aditionality documents/Statement of Intent 19 Annex N: Calculations Spreadsheets/Financial Analysis/Variables Riesgo, ModF 20 Gremial de Huleros de Guatemala: http://www.gremialdehuleros.org/ 21 Annex O: Additionality documents/Calculation Spreadsheets/Planting Records and Projections 22 Instituto de Agricultura, Recursos Naturales y Ambiente – Universidad Rafael Landívar e Instituto de Incidencia Ambiental. 2006.
Perfil Ambiental de Guatemala 2006. 23 Instituto de Agricultura, Recursos Naturales y Ambiente – Universidad Rafael Landívar e Instituto de Incidencia Ambiental. 2006. Perfil Ambiental de Guatemala 2006.

27
Land Use Scenario c: FSC certified rubber cultivation without registration as a VCS-CCB project Land Use Scenario d: non-FSC certified rubber cultivation without registration as VCS- CCB project Land Use Scenario e: Reforestation through direct planting of timber species without registration as a VCS-CCB Project
Sub-step 1b. Consistency of credible alternative land use scenarios with enforced mandatory applicable laws and regulation
Land Use Scenario a: Pastureland The current land use is in compliance with all legal and regulatory requirements.
Land Use Scenario b: Crop production There are no legal or regulatory requirements blocking or requiring crop production in the proposed project area Land Use Scenario c: FSC certified rubber cultivation without registration as a VCS-CCB project Afforestation/Reforestation is not mandated by any enforced law, statute, or other regulatory framework.24 Land Use Scenario d: non-FSC certified rubber cultivation without registration as a VCS-CCB project Afforestation/Reforestation is not mandated by any enforced law, statute, or other regulatory framework.25 Land Use Scenario d: Reforestation through direct planting without registration as a VCS-CCB Project Afforestation/Reforestation is not mandated by any enforced law, statute, or other regulatory framework.26
Outcome of Substep 1b: List of plausible alternative land use scenarios to the A/R project activity that are in compliance with mandatory legislation and regulations taking into account their enforcement in the region or country and EB decisions on national and/or sectoral policies and regulations.
Land Use Scenario a: Pastureland Land Use Scenario b: Crop production
Land Use Scenario c: FSC certified rubber cultivation without registration as a VCS-CCB project Land Use Scenario d: Non- FSC certified rubber cultivation without registration as a VCS-CCB project Land Use Scenario e: Reforestation through direct planting without registration as a VCS-CCB Project
Step 2. Barrier analysis This step serves to identify barriers and to assess which of the land use scenarios identified in the sub-step 1b are not prevented by these barriers.
24 VCS Additionality Project Test: Step 2: Regulatory Surplus (Section 5.8 of VCS 2007.1) 25 VCS Additionality Project Test: Step 2: Regulatory Surplus (Section 5.8 of VCS 2007.1) 26 VCS Additionality Project Test: Step 2: Regulatory Surplus (Section 5.8 of VCS 2007.1)

28
Sub-step 2a. Identification of barriers that would prevent the implementation of at least one alternative land use scenarios The proposed project activities face barriers that prevent the implementation of the proposed project activity. Pastureland is the only alternative land use scenario that does not face any barriers to implementation. The barriers analysis for crop production, FSC certified rubber cultivation, and direct planting of timber species is considered separately. Land Use Scenario b: Barrier analysis for crop production Barriers due to local ecological conditions More than 60% of Guatemala’s land is suitable for forestry activities27. However, based on the land use classification map of the country, the project area is not recommended for intensive agricultural crops28. The project's land use recommendation is for forestry and agroforestry activities. Ecological conditions in the North and in the South present a barrier to crop production. Attempts by the Project to interplant rows of rubber trees with corn were unsuccessful in the North. In the South, the soil is too rocky to support sugar cane, which is the major agricultural product in the South29. Land Use Scenario c: Barriers analysis for FSC certified rubber cultivation without registration as a VCS-CCB project Investment barriers There is no private capital available for the proposed project activities given Guatemala’s high country risk. Guatemala is rated BB+ for investment risk30. Debt funding is not available for the proposed project activities because there is no access to credit for rubber plantations and financial products are not available in commercial banking. A study by the Inter-American Development Bank (IADB) found that there is no credit available for forestry activities in Guatemala31. Group Financier de Occident32 is leading the development of the first financial fund for forest and rubber plantations in Guatemala in partnership with IADB, and the main justification for the fund was the lack of credit access for these activities. Similar activities in other countries have only been implemented with grants or other non-commercial finance terms. In Guatemala, incentives for rubber are available in only a few areas of the country, and these incentives are insufficient to promote the establishment of rubber plantations, mainly because the initial investments are so large. To establish a hectare with rubber the initial investment is US$5,000, and the incentive provided by the government is US$625/ha, available only during the first year of
27 Instituto de Agricultura, Recursos Naturales y Ambiente – Universidad Rafael Landívar e Instituto de Incidencia Ambiental. 2006.
Perfil Ambiental de Guatemala 2006. 28 Instituto de Agricultura, Recursos Naturales y Ambiente – Universidad Rafael Landívar e Instituto de Incidencia Ambiental. 2006.
Perfil Ambiental de Guatemala 2006. 29 Ministerio de Agricultura, Ganaderia y Alimentacion de Guatemala. 2006. Mapa de cobertura vegetal y uso de la tierra República de Guatemala Año 2003.; Ministerio de Agricultura, Ganaderia y Alimentacion de Guatemala. 2006. Memoria Tecnica: Mapa de
cobertura vegetal y uso de la tierra República de Guatemala Año 2003. 30 Fitch Ratings http://www.centralamericadata.com/en/article/home/Fitch_Reaffirms_BB__Rating_for_Guatemala 31 Executive Summary of the financial fund project –Confidential Document- – available to validator at time of validation. 32 Grupo Financiero de Occidente (GFO) is a private financial group operating since 1882, with headquarters office in Guatemala City,
provides different financial services, investment banking and debt finance between others. Financiera de Occidente Sociedad Anónima (FIDOSA) is part of GFO and leads this partnership with IADB.

29
plantation establishment33. The scale of rubber plantation establishment proposed by the project has only been implemented on special grants and programs with massive subsidies in Asia34. Land Use Scenario d: non- FSC certified rubber cultivation without registration as a VCS-CCB project This scenario is prevented given the decision to make those plantations based on sustainability management and carbon finance35. In Guatemala there is no record of FSC rubber plantations as proposed within this project. Implementing sustainability management is not a common practice. Barriers related to prevailing practice The proposed project activity faces technological barriers in the North related to the lack of access to necessary materials as well as lack of knowledge related to rubber planting and its management. Rubber planting and management is not common in the north of Guatemala, thus there is a lack of skilled and/or properly trained labor force. Given that, investment is required for the training of local people in order to have access to the skilled labor force essential for rubber production. The northern region of Guatemala including Verapaces, Izabal, and Petén are departments dedicated to extensive agriculture and livestock. It is not traditionally a rubber plantation site. Given that the original genetic and vegetative material is not available in situ, clonal gardens and nurseries are needed. The National Forest Service of Guatemala has an incentive program in place (PINFOR) to establish rubber plantations, but not a sufficient amount in terms of cash flow relative to the amount needed in the first year of investment. Furthermore, given that the Northern region is not a traditional rubber area, there is no established infrastructure available for this kind of productive activity. In the case of the project, project participants are investing in creating the infrastructure, but are only doing so because of the potential for large-scale program partially funded through carbon revenue. Although rubber production in the south exists, almost all rubber production in southern Guatemala is produced by smallholders with plantations of less than 50 ha in size. Only 5% of the plantations associated with the Rubber Producers Association of Guatemala (Gremial de Huleros de Guatemala) are greater than 200 ha in size36. The rate and scale of rubber plantation establishment proposed by the project has not previously been implemented in the South. The size of each proposed project plantation plot is at least double the most common size of rubber plantations in Guatemala (50 ha)37. The proposed project activity is the “first of its kind” in Guatemala. Therefore, the technology and management knowledge required to implement industrial scale production does not exist because the rate and scale of rubber plantation establishment proposed by the project has not previously been implemented in the South. PICA will develop existing infrastructure and management capacity for marketing, transport, processing, and storage to accommodate the greatly increased rate of rubber production. Furthermore, the supply of skilled labor for rubber plantation management and tapping is not sufficient
33 Resolución JD.01.01.2007 PINFOR 34 http://www.thestar.com.my/story.aspx?file=%2F2009%2F3%2F31%2Fbusiness%2F3593377&sec=business 35 Annex O: Aditionality documents/Statement of Intent. 36 Gremial de Huleros de Guatemala: http://www.gremialdehuleros.org/ 37 Annex O: Aditionality documents/Calculation Spreadsheets/Planting Records and Projections

30
to meet the requirements of such rapid and large-scale expansion of plantations. Therefore, PICA must invest resources in training future workers. As evidenced by the statement of intent, PICA’s determined to establish large scale FSC certified rubber plantations with financing from the sale of carbon offsets. If it were not for this financial incentive to offset the cost of infrastructure development, PICA would not have chosen to undertake reforestation activities, as the establishment of small-scale rubber plantations would not have been financially attractive. Additionally, there are no FSC certified rubber plantations in Guatemala38. To this point rubber cultivation has only been implemented with traditional methods. Sustainable management will change several common aspects of rubber cultivation such as the use of chemicals, integrated pest management, and the implementation of a long term management plan – under common practice the rubber trees are burned once their productive life span comes to an end, but under FSC management they will be harvested for wood products. Because this is a new practice, it will require large investments to master this management approach. Rubber plantation certification is also relatively new to FSC, and the Project is working with Rainforest Alliance to develop a specific addendum to the FSC standard for rubber plantations in Guatemala. Barriers related to market, transport, and storage There is a possibility of large price risk due to the fluctuations in the market value of natural rubber over the project period, in the absence of efficient markets and insurance mechanisms. Historical prices of rubber have been sufficiently low as not to cover fixed costs39; during 2001 many people shut down plantations in Guatemala given the rubber market and low rubber values. The project proposes to modify the rubber business model by integrating carbon and wood into the products and services that plantations can produce, so the risk of low prices related to rubber can be reduced. Lack of facilities to convert, store, and add value to rubber limits the possibilities to generate revenue from the proposed activity, especially in the North. Land Use Scenario e: Barrier analysis for reforestation through direct planting of timber species without registration as a VCS-CCB Project Investment barriers There is no private capital available for the planting of trees for timber or rubber given Guatemala’s high country risk. Guatemala is rated BB+ for investment risk40. Debt funding is not available because there is no access to credit for plantations and financial products are not available in commercial banking. A study by the Inter-American Development Bank (IADB) found that there is no credit available for forestry activities in Guatemala41. Barriers related to prevailing practice The proposed project activity faces technological barriers in the North related to the lack of access to necessary materials. The northern region of Guatemala including Verapaces, Izabal, and Petén are departments dedicated to extensive agriculture and
38 http://info.fsc.org/ 39 http://www.sicom.com.sg/ 40 Fitch Ratings: http://www.centralamericadata.com/en/article/home/Fitch_Reaffirms_BB__Rating_for_Guatemala 41 Executive Summary of the financial fund project –Confidential Document- – available to validator at time of validation

31
livestock. It is not traditionally a timber production site. In the sub-region of Izabal, where the activity will be implemented, there are only 3,029 ha of forest plantation42. In the North and the South there is a lack of knowledge in sustainable management of plantations and FSC principles and criteria accomplishment. Furthermore, the majority of timber produced in Guatemala comes from native managed forest and not timber plantations. Approximately 70% of lumber processed in Guatemala originates in native conifer forests43. Given that the original genetic and vegetative material is not available in situ, nurseries are needed. Barriers related to market, transport, and storage Lack of facilities to convert, store, and add value to timber limits the possibilities to generate revenue from the proposed activity in the North. Given that the Northern region is not a traditional timber production area, there is insufficient infrastructure available for this kind of productive activity. In the case of the project, the Project is investing in creating the infrastructure but is only doing so because of the potential for funding through carbon, wood and rubber revenues. Outcome of Step 2a: List of barriers that may prevent one or more land use scenarios identified in the Step 1b.
Investment barriers Barriers related to prevailing practice Barriers due to local ecological conditions Barriers related to market, transport, and storage
Sub-step 2b. Elimination of land use scenarios that are prevented by the identified barriers. The identified barriers prevent the implementation of the proposed project activities without registration as a VCS-CCB project as well as timber and crop production: Land Use Scenario b: Crop production Land Use Scenario c: FSC certified rubber cultivation without registration as a VCS-CCB project
Land Use scenario d: Non-FSC rubber cultivation Land Use Scenario e: Reforestation through direct planting without registration as a VCS-CCB Project
Outcome of Sub-step 2b: List of land use scenarios that are not prevented by any barrier.
Land Use Scenario a: Pastureland The identified barriers do not affect the continuation of pastureland. The continuation of existing land use requires no investment capital or technological inputs. It is one of the main prevailing practices in the area, especially in the North where the majority of the landowners surrounding the project area practice low-input grazing on their lands; therefore there is no lack of labor experience with this low technology grazing practice. The infrastructure and trained labor force for this practice already exists.
42 Annex O:Additionality Documents/INAB. Area bajo manejo agrupado por region. 43 Instituto de Agricultura, Recursos Naturales y Ambiente – Universidad Rafael Landívar y Instituto de Incidencia Ambiental. 2006. Perfil Ambiental de Guatemala 2006.

32
Sub-step 2c. Determination of baseline scenario Forestation without being registered as an A/R CDM project activity is not included in the list of land use scenarios that are not prevented by any barrier. The list contains only one land use scenario: pastureland. This remaining land use is the baseline scenario. Step 3. Investment analysis Sub-step 3a. Determine appropriate analysis method The benchmark analysis was chosen. Sub-step 3b. – Option III. Apply benchmark analysis The Required Rate of Return was chosen as the financial indicator most suitable for the project type and decision context. Given the previously described situation in which the project is securing finance, the most suitable assumption for financial calculations is that the project proponents should look for an Equity Investor Required Rate of Return on Comparable Projects. Benchmarking research was necessary to establish the most suitable RRR for the project analysis. Studies carried out by the Global Environment Fund44, Ecotrust45, and the last Hastings Hancock International Timber Fund46 consistently show that the average rate of return expected for forestland investments are 12% per year. Given that 12% is the rate of return obtained by investors in similar investments (forestlands) through equity funds/corporations, a RRR of 12% is used as the benchmark in this additionality analysis. The Internal Rate of Return for the project is compared with a Required Rate of Return (RRR) obtained from a benchmark done in Equity Funds for Timberland, which is the average expected rate of return that investors will ask for in projects related to forest plantations. Sub-step 3c. Calculation and comparison of financial indicators
a) Calculation of financial indicators The Rate of Return was calculated for the proposed A/R CDM project activity without the financial benefits from carbon Revenues. Refer to the document Financial Analysis47 for full details of the calculations of financial indicator and sources of parameter values. The following economic parameters and assumptions were applied in the calculation of the financial indicator:
No. Parameter Description
1 Planting density 550 rubber tree plants are planted per hectare of land.
2 Plants genetic origin
Mix of different, but most common, rubber clones in Guatemala. This information is important for establishing the potential rubber production to be obtained from the plantation
3 Rubber productivity
Expressed in Kilograms of dried rubber per hectare of plantation. Every clone has different productivity, so the
44 Global Environment Fund and International Forestry Investment Advisors. 2005. A Global Emerging Markets Forestry Investment
Strategy. 45 Ecotrust. 2006. An Ecosystem-based Forestry Investment Strategy for the Coastal Temperate Rainforests of North America. 46 Hastings Fund Management. 2009. Hastings Hancock International Timberland Fund Annual Report. 47 Annex N: Calculation Spreadsheets/Financial Analysis

33
No. Parameter Description
average observed production in the project manager’s existing rubber plantation areas was used from year 8 to year 17. From year 18 to 36 the data was estimated according to previous experience of technicians. From year 1 to 7 the plantation doesn’t produce rubber, this stage is named growing stage, no income from rubber production is generated by the plantation during that stage.
4 Timeline Investment analysis was done for a 36 years period, the total expected rotation length.
5 Tapping system The tapping model used in Guatemala is that every tree is tapped every three days, given that a certain hectare of rubber tree plantation will be tapped twice a week when it reaches mature productivity.
6 Labor force intensity
One person is able to tap and manage 3 hectares of rubber plantation, once the plantation starts production and needs to be tapped (twice a week). During the plantation growing stage one person is able to manage 5 hectares (no tapping is required).
7 Interest rate The interest rate used to calculate debt service payment was calculated at eight percent per year (8%).
8 Inflation rate Given that the investment analysis was done in USD, the inflation rate used is the average rate seen in the US. This rate was found to be 2.72% per year.
9 Cost of land acquisition
The cost of land was established conservatively in USD 150,000 per “caballeria” (equivalent to 45 hectares), in the areas where the project is establishing rubber tree plantations. The cost of land is the amount of money required to acquire the amount of area here mentioned. Caballeria is a measure unit of normal use for land area in Guatemala, equivalent to 45 hectares.
10 Cost of new plants at planting stage
The cost per new plant of rubber tree to be planted in Guatemala is USD 2.50 per plant.
11 Cost of labor Established according to local law minimum cost of labor for the agriculture sector in rural areas. All the required additional costs as social security and incentives established by national law were included in the calculation of an annual cost per employee48.
12 Rate of annual salary increase
Rate of annual salary increase was calculated to be 8.22% per year, which is the average found for the last 10 years in Guatemala according to Ministry of Labor. (Departamento de Salarios, Dirección de Estadísticas laborales, Ministerio de Trabajo y Previsión Social. See also attached Sensitivity
48 Departamento de Salarios, Dirección de Estadísticas Laborales, Ministerio de Trabajo y Previsión Social. 2009. Informe del
Dirección de Estadísticas Laborales, Conteniendo Datos Estadísticos Recopilados Sobre Salarios, Periodo 2006, 2007 y 2008.
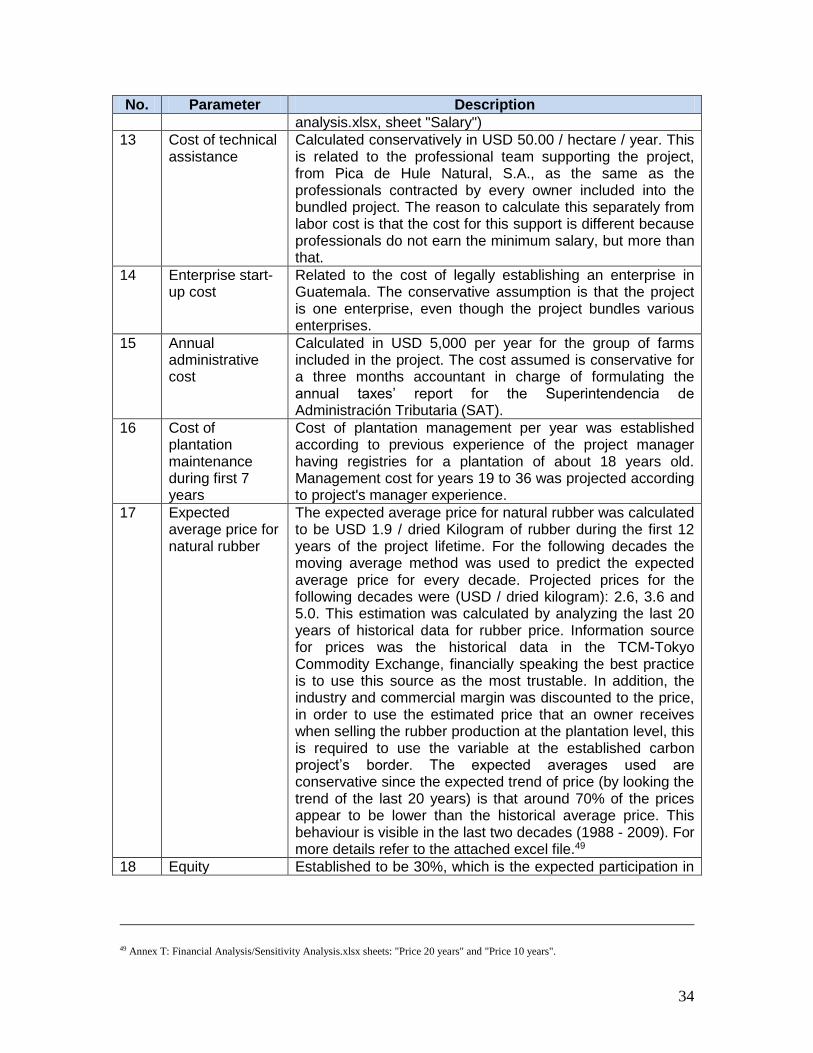
34
No. Parameter Description
analysis.xlsx, sheet "Salary")
13 Cost of technical assistance
Calculated conservatively in USD 50.00 / hectare / year. This is related to the professional team supporting the project, from Pica de Hule Natural, S.A., as the same as the professionals contracted by every owner included into the bundled project. The reason to calculate this separately from labor cost is that the cost for this support is different because professionals do not earn the minimum salary, but more than that.
14 Enterprise start-up cost
Related to the cost of legally establishing an enterprise in Guatemala. The conservative assumption is that the project is one enterprise, even though the project bundles various enterprises.
15 Annual administrative cost
Calculated in USD 5,000 per year for the group of farms included in the project. The cost assumed is conservative for a three months accountant in charge of formulating the annual taxes’ report for the Superintendencia de Administración Tributaria (SAT).
16 Cost of plantation maintenance during first 7 years
Cost of plantation management per year was established according to previous experience of the project manager having registries for a plantation of about 18 years old. Management cost for years 19 to 36 was projected according to project's manager experience.
17 Expected average price for natural rubber
The expected average price for natural rubber was calculated to be USD 1.9 / dried Kilogram of rubber during the first 12 years of the project lifetime. For the following decades the moving average method was used to predict the expected average price for every decade. Projected prices for the following decades were (USD / dried kilogram): 2.6, 3.6 and 5.0. This estimation was calculated by analyzing the last 20 years of historical data for rubber price. Information source for prices was the historical data in the TCM-Tokyo Commodity Exchange, financially speaking the best practice is to use this source as the most trustable. In addition, the industry and commercial margin was discounted to the price, in order to use the estimated price that an owner receives when selling the rubber production at the plantation level, this is required to use the variable at the established carbon project’s border. The expected averages used are conservative since the expected trend of price (by looking the trend of the last 20 years) is that around 70% of the prices appear to be lower than the historical average price. This behaviour is visible in the last two decades (1988 - 2009). For more details refer to the attached excel file.49
18 Equity Established to be 30%, which is the expected participation in
49 Annex T: Financial Analysis/Sensitivity Analysis.xlsx sheets: "Price 20 years" and "Price 10 years".
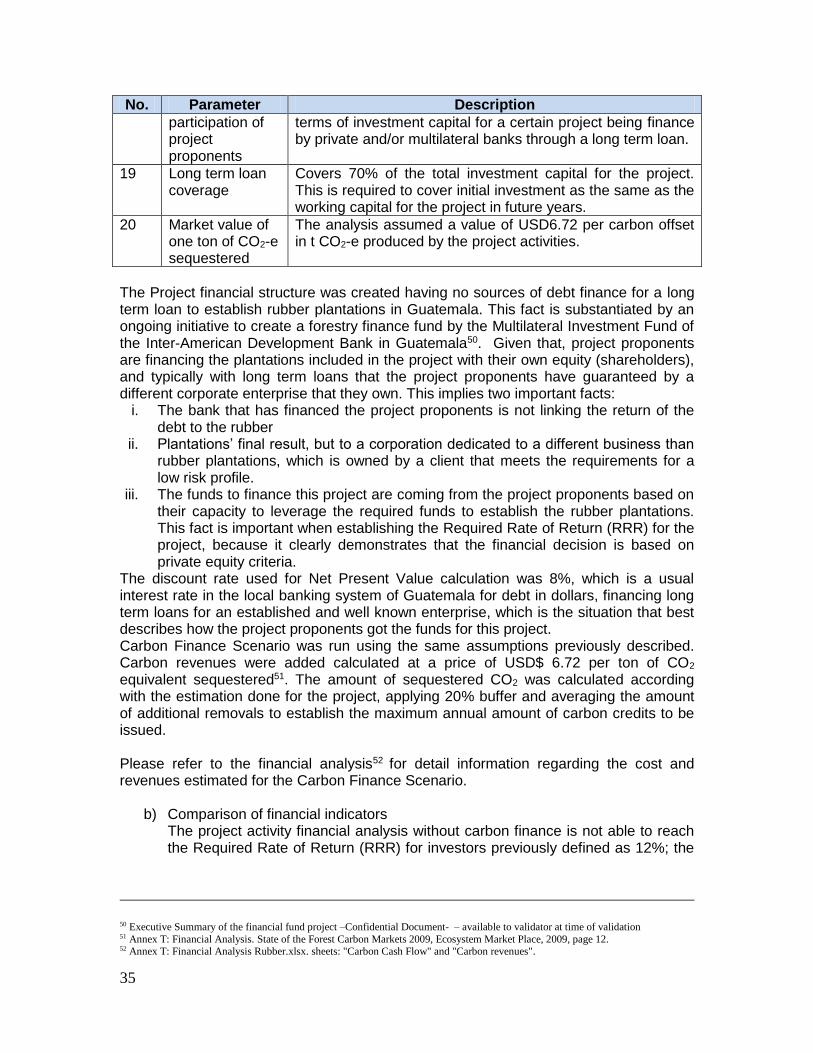
35
No. Parameter Description
participation of project proponents
terms of investment capital for a certain project being finance by private and/or multilateral banks through a long term loan.
19 Long term loan coverage
Covers 70% of the total investment capital for the project. This is required to cover initial investment as the same as the working capital for the project in future years.
20 Market value of one ton of CO2-e sequestered
The analysis assumed a value of USD6.72 per carbon offset in t CO2-e produced by the project activities.
The Project financial structure was created having no sources of debt finance for a long term loan to establish rubber plantations in Guatemala. This fact is substantiated by an ongoing initiative to create a forestry finance fund by the Multilateral Investment Fund of the Inter-American Development Bank in Guatemala50. Given that, project proponents are financing the plantations included in the project with their own equity (shareholders), and typically with long term loans that the project proponents have guaranteed by a different corporate enterprise that they own. This implies two important facts:
i. The bank that has financed the project proponents is not linking the return of the debt to the rubber
ii. Plantations’ final result, but to a corporation dedicated to a different business than rubber plantations, which is owned by a client that meets the requirements for a low risk profile.
iii. The funds to finance this project are coming from the project proponents based on their capacity to leverage the required funds to establish the rubber plantations. This fact is important when establishing the Required Rate of Return (RRR) for the project, because it clearly demonstrates that the financial decision is based on private equity criteria.
The discount rate used for Net Present Value calculation was 8%, which is a usual interest rate in the local banking system of Guatemala for debt in dollars, financing long term loans for an established and well known enterprise, which is the situation that best describes how the project proponents got the funds for this project. Carbon Finance Scenario was run using the same assumptions previously described. Carbon revenues were added calculated at a price of USD$ 6.72 per ton of CO2 equivalent sequestered51. The amount of sequestered CO2 was calculated according with the estimation done for the project, applying 20% buffer and averaging the amount of additional removals to establish the maximum annual amount of carbon credits to be issued.
Please refer to the financial analysis52 for detail information regarding the cost and revenues estimated for the Carbon Finance Scenario.
b) Comparison of financial indicators The project activity financial analysis without carbon finance is not able to reach the Required Rate of Return (RRR) for investors previously defined as 12%; the
50 Executive Summary of the financial fund project –Confidential Document- – available to validator at time of validation 51 Annex T: Financial Analysis. State of the Forest Carbon Markets 2009, Ecosystem Market Place, 2009, page 12. 52 Annex T: Financial Analysis Rubber.xlsx. sheets: "Carbon Cash Flow" and "Carbon revenues".
36
project without carbon finance reaches 11.2% rate of return. When introducing carbon finance, the project is able to reach 12.2% rate of return, meeting the RRR benchmark established for the project. Forestation without being registered as a VCS-CCB project activity is not included in the list of land use scenarios that are not prevented by any barrier. The financial indicators of the proposed project activity does not meet the benchmark therefore the baseline scenario is the continuation of the pre-project land use, pastureland.
Sub-step 3d. Sensitivity analysis A sensitivity analysis was conducted to assess whether the initial conclusion regarding the financial attractiveness of the baseline scenario is robust to reasonable variations in the critical assumptions. The financial variables that greatly influence the final financial result in terms of rate of return, which is the benchmark used in this analysis were identified. These variables are typically out of the project proponent’s control; this justifies their inclusion as variables for the model. Furthermore, these are variables that significantly impact the final result, even when the project proponent implements best practices during the project lifecycle. Refer to the document Sensitivity Analysis53 for full details of calculations. Analysis of costs composition shows that the main variable influencing the financial projections is labor cost, representing 93% of the total project costs. Almost any disturbance related to increase salaries at a rate higher than the average will produce an IRR below the expected RRR. The sensitivity was calculated as a function of this variable by changing salary increase rate from 7% to 8%. This change produced an IRR of 8.22%, even when securing carbon finance. The result of a 1% change in the rate of salary increase causes the project to fail to reach the RRR, something that clearly shows the need for the project to secure additional revenues in order to decrease the probability of not reaching the RRR. Carbon revenues are necessary to improve the rate of return and reduce the previously described risk. The same analysis was applied to revenues. Rubber sales produce 96% of the total income. Besides productivity, which is under the control of the project proponent, the key variable that could change the final financial result of the project is the international price of rubber. An analysis was carried out on the last 20 years rubber prices’ behavior. The result shows that rubber prices have a large range of variability, and that from 60% (last 10 years) to 72% (last 20 years) of the data (price) frequency is below the arithmetic average of price54. The projected average price for the next decades, based on moving average method, was the price data used for the financial projections. Moreover, the total range of possible variability for the projected price in the first decade is USD 4.12, with a mean of USD 1.90 and an average possible minimum value of USD 0.51. The trend here described shows that the expected price behavior is that 60% of the expected prices in the next decades will be below the average projected price in which the project reaches the RRR. Once again, the model shows that the project needs to secure additional revenues, different from the one obtained by selling rubber, in order to reduce the risk of not
53 Annex T: Financial Analysis: Sensitivity Analysis.xlsx 54 Annex T: Financial Analysis: Sensitivity Analysis.xlsx
37
achieving the RRR. The sensitivity analysis is conclusive and the selection of the baseline scenario is valid. Step 4. Common practice analysis The barriers and investment analysis are complemented by the results of common practice analysis. In the North of Guatemala, rubber cultivation is not common practice. Rubber plantations are few and widely dispersed in the geographic region of the project area in the North. Of the 541 plantations associated with the Rubber Producers Association of Guatemala (Gremial de Huleros de Guatemala) only 15% are located in the northern Departments of Izabal, Alta Verapaz, Quiché and Petén55. In the South there are existing rubber plantations in the geographic region of the project area but the activity proposed by the Project, establishment of large scale FSC certified rubber plantations, is not common practice. Currently there are no FSC certified rubber plantations in Guatemala56, and the historical rate of rubber plantation expansion in the region is below that which is proposed by the project. The majority of natural rubber produced in Guatemala is produced by smallholders with plantations of less than 50 ha in size. Only 5% of the plantations associated with the Gremial de Huleros de Guatemala are greater than 200 ha in size57. The size of each proposed plantation is at least double this figure58. The elements that distinguish FSC rubber cultivation from the common practice of conventional rubber cultivation are previously detailed in Step 0. In addition to the considerable financial resources required to establish large scale rubber plantations, the proposed project activity faces financial barriers and barriers related to prevailing practice that conventional rubber cultivation does not face. FSC rubber cultivation is a new practice in Guatemala, and the development of the necessary technology and expertise requires a significant investment of resources that would not be required for conventional rubber production. G2.2 Document that project benefits would not have occurred in the absence of the project, explaining how existing laws or regulations would likely affect land use and justifying that the benefits being claimed by the project are truly ‘additional’ and would be unlikely to occur without the project. As stated in G2.1, the project benefits would not have occurred in the absence of the project due to the various barriers that reforestation faces in the project areas, including investment barriers, barriers related to prevailing practice, and barriers related to market, transport and storage. The proposed registration of the project area as a VCS-CCB project would remove the investment and technological barriers here described. According with the initial statement of the project proponent59, by securing carbon finance and VCS-CCB registration the investors for the project will remain engaged and committed to invest in this innovative project obtaining the Required Rate of Return (RRR) and moving forward
55 Gremial de Huleros de Guatemala: http://www.gremialdehuleros.org/ 56 http://info.fsc.org/ 57 Gremial de Huleros de Guatemala: http://www.gremialdehuleros.org/ 58 Annex O: Aditionality documents/Calculation Spreadsheets/Planting Records and Projections 59 Annex O: Additionality documents/Statement of Intent/Statement of Intent PICA 2007.pdf
38
on building a diversified income model for rubber plantations based on rubber, carbon and wood under the highest environmental, social and economic standards of sustainable and/or responsible forest management. Given that the project is securing finance from private equity of the bundle project’s participants by reaching the RRR, based on carbon revenues, the funding for the project will remain committed. The addition of carbon revenues will allow the funding of labor force training, capability development, and technology access. Particularly in the Northern areas, the project will invest in creating local storage, market logistics, and infrastructure development to allow for market access. The project registration under the VCS-CCB and secure carbon revenues, will allow the project to invest in creating the required market, transport and storage facilities and infrastructure. Carbon revenues will help finance the development of the Required Management Activities to develop best practices according to sustainable and/or responsible standard and principles. G2.3 Calculate the estimated carbon stock changes associated with the ‘without project’ reference scenario described above. This requires estimation of carbon stocks for each of the land-use classes of concern and a definition of the carbon pools included, among the classes defined in the IPCC 2006 GL for AFOLU. The timeframe for this analysis can be either the project lifetime (see G3) or the project GHG accounting period, whichever is more appropriate. Estimate the net change in the emissions of non-CO2 GHG emissions such as CH4 and N2O in the ‘without project’ scenario. Non-CO2 gases must be included if they are likely to account for more than 5% (in terms of CO2-equivalent) of the project’s overall GHG impact over each monitoring period. GHG Emission Reduction Explanation of methodological choice: The project area contains degraded and degrading lands that are currently being grazed at a low level. No other pre-project activities are taking place within the project boundaries. Project activities will lead to the displacement of grazing animals outside the project area. For the reasons outlined here and detailed in Section 2.2, the project meets all applicability conditions relevant to the methodology AR-ACM0001 V 03. Quantifying GHG removals for the baseline scenario: Applying AR-ACM0001 V 03, the baseline net GHG removals by sinks is determined as the sum of the carbon stock changes in above-ground and below-ground biomass of trees in the baseline. For the purpose of estimating GHG removals by trees in the baseline, it is conservatively assumed that the trees will grow at a rate similar to that of a common Tropical America secondary forest species60. 4.2.1 Summary of baseline GHG sources, sinks, and reservoirs The land within the project boundary is covered by degraded and degrading pasture. Grasses and scattered trees and some live fences in the North characterize the vegetation. In accordance with guidance found in paragraph 35 of EB 42, GHG emissions due to the removal of herbaceous vegetation as a result of project activities is neglected in AR-ACM0001 V 03. Furthermore, under the applicability conditions of the
60 Annex N: Calculation Spreadsheets/Marupa Growth Model
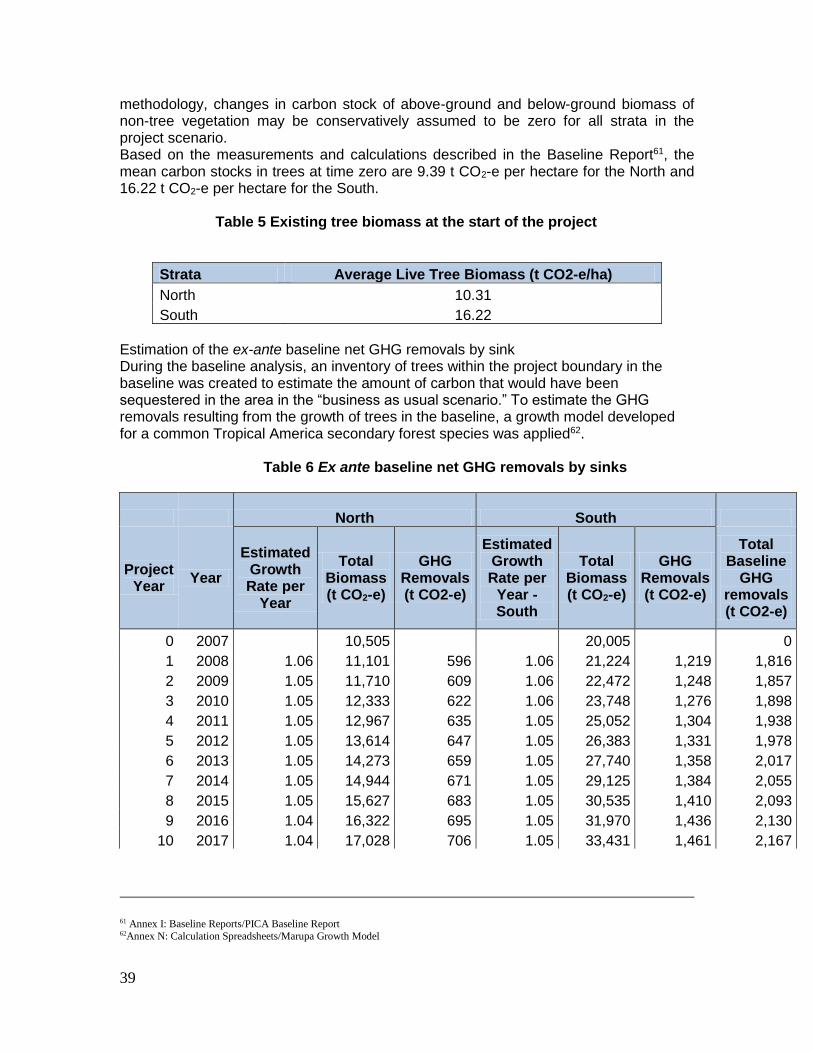
39
methodology, changes in carbon stock of above-ground and below-ground biomass of non-tree vegetation may be conservatively assumed to be zero for all strata in the project scenario. Based on the measurements and calculations described in the Baseline Report61, the mean carbon stocks in trees at time zero are 9.39 t CO2-e per hectare for the North and 16.22 t CO2-e per hectare for the South.
Table 5 Existing tree biomass at the start of the project
Strata Average Live Tree Biomass (t CO2-e/ha)
North 10.31
South 16.22
Estimation of the ex-ante baseline net GHG removals by sink During the baseline analysis, an inventory of trees within the project boundary in the baseline was created to estimate the amount of carbon that would have been sequestered in the area in the “business as usual scenario.” To estimate the GHG removals resulting from the growth of trees in the baseline, a growth model developed for a common Tropical America secondary forest species was applied62.
Table 6 Ex ante baseline net GHG removals by sinks
North South
Project Year
Year
Estimated Growth Rate per
Year
Total Biomass (t CO2-e)
GHG Removals (t CO2-e)
Estimated Growth Rate per
Year - South
Total Biomass (t CO2-e)
GHG Removals (t CO2-e)
Total Baseline
GHG removals (t CO2-e)
0 2007 10,505 20,005 0
1 2008 1.06 11,101 596 1.06 21,224 1,219 1,816
2 2009 1.05 11,710 609 1.06 22,472 1,248 1,857
3 2010 1.05 12,333 622 1.06 23,748 1,276 1,898
4 2011 1.05 12,967 635 1.05 25,052 1,304 1,938
5 2012 1.05 13,614 647 1.05 26,383 1,331 1,978
6 2013 1.05 14,273 659 1.05 27,740 1,358 2,017
7 2014 1.05 14,944 671 1.05 29,125 1,384 2,055
8 2015 1.05 15,627 683 1.05 30,535 1,410 2,093
9 2016 1.04 16,322 695 1.05 31,970 1,436 2,130
10 2017 1.04 17,028 706 1.05 33,431 1,461 2,167
61 Annex I: Baseline Reports/PICA Baseline Report 62Annex N: Calculation Spreadsheets/Marupa Growth Model
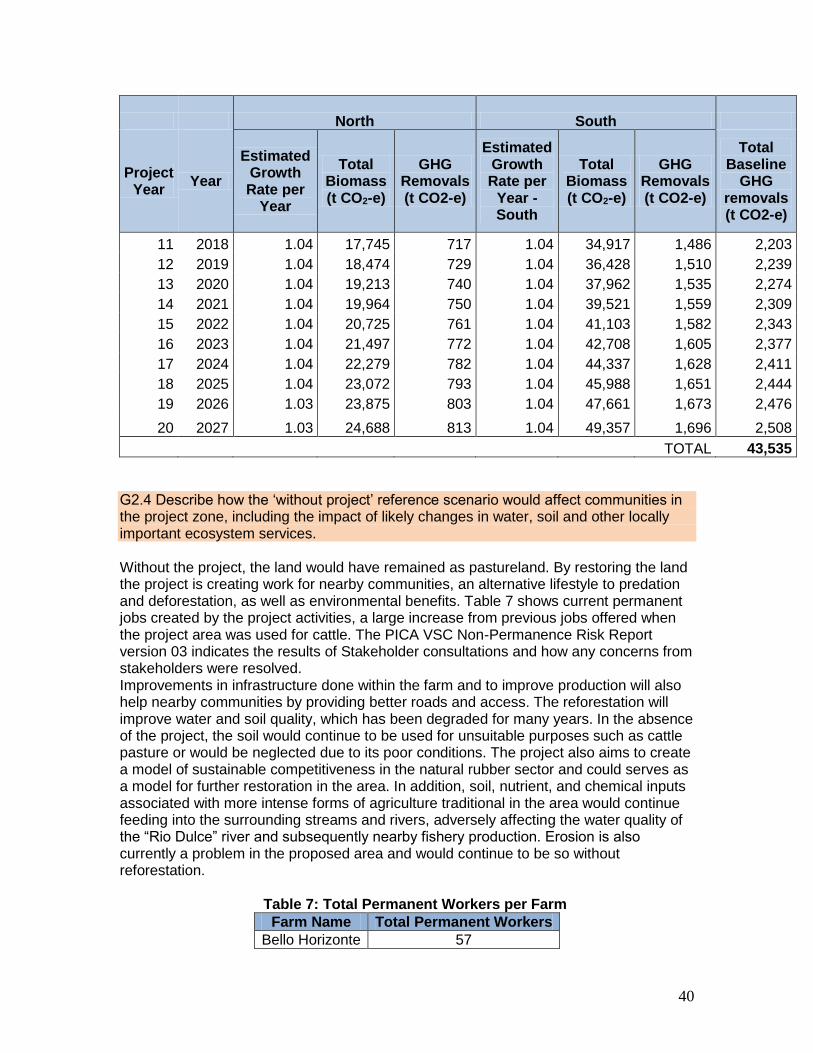
40
North South
Project Year
Year
Estimated Growth Rate per
Year
Total Biomass (t CO2-e)
GHG Removals (t CO2-e)
Estimated Growth Rate per
Year - South
Total Biomass (t CO2-e)
GHG Removals (t CO2-e)
Total Baseline
GHG removals (t CO2-e)
11 2018 1.04 17,745 717 1.04 34,917 1,486 2,203
12 2019 1.04 18,474 729 1.04 36,428 1,510 2,239
13 2020 1.04 19,213 740 1.04 37,962 1,535 2,274
14 2021 1.04 19,964 750 1.04 39,521 1,559 2,309
15 2022 1.04 20,725 761 1.04 41,103 1,582 2,343
16 2023 1.04 21,497 772 1.04 42,708 1,605 2,377
17 2024 1.04 22,279 782 1.04 44,337 1,628 2,411
18 2025 1.04 23,072 793 1.04 45,988 1,651 2,444
19 2026 1.03 23,875 803 1.04 47,661 1,673 2,476
20 2027 1.03 24,688 813 1.04 49,357 1,696 2,508
TOTAL 43,535
G2.4 Describe how the ‘without project’ reference scenario would affect communities in the project zone, including the impact of likely changes in water, soil and other locally important ecosystem services. Without the project, the land would have remained as pastureland. By restoring the land the project is creating work for nearby communities, an alternative lifestyle to predation and deforestation, as well as environmental benefits. Table 7 shows current permanent jobs created by the project activities, a large increase from previous jobs offered when the project area was used for cattle. The PICA VSC Non-Permanence Risk Report version 03 indicates the results of Stakeholder consultations and how any concerns from stakeholders were resolved. Improvements in infrastructure done within the farm and to improve production will also help nearby communities by providing better roads and access. The reforestation will improve water and soil quality, which has been degraded for many years. In the absence of the project, the soil would continue to be used for unsuitable purposes such as cattle pasture or would be neglected due to its poor conditions. The project also aims to create a model of sustainable competitiveness in the natural rubber sector and could serves as a model for further restoration in the area. In addition, soil, nutrient, and chemical inputs associated with more intense forms of agriculture traditional in the area would continue feeding into the surrounding streams and rivers, adversely affecting the water quality of the “Rio Dulce” river and subsequently nearby fishery production. Erosion is also currently a problem in the proposed area and would continue to be so without reforestation. Table 7: Total Permanent Workers per Farm
Farm Name Total Permanent Workers
Bello Horizonte 57

41
Río Frío 139
Concepción 46
Palmeras 55
Los Patos 76
Al Asunción 100
El Horizonte 22
Total 495
G2.5 Describe how the ‘without project’ reference scenario would affect biodiversity in the project zone (e.g., habitat availability, landscape connectivity and threatened species). Without the project, the land would remain as pastureland and continue to be overgrazed and degraded, which would have an adverse effect on biodiversity. As required by sustainable and responsible forest management, new plantations will not cause deforestation or degradation of existing forests. Also, farms that include areas of HCV or natural reserves will serve as buffer areas and biological corridors. Without the project, biodiversity within these reserves is at a higher risk of predation and degradation. Due to their position next to important reserves, such as the Mantiales de Cerro San Gil, the project areas will also raise awareness of illegal hunting in the area. Since the land is private property, there will be signs that warn incoming visitors that hunting is illegal and that the property is private land. Plantations will also enhance the degraded landscape’s aesthetic appeal with rubber trees, originally from the tropical forests of America, creating a more beautiful landscape. G3 Project Design and Goals
G3.1 Provide a summary of the project’s major climate, community and biodiversity objectives + impacts and relevance to achieving the project’s objectives The project plans to establish rubber tree plantations on 2,366.6 hectares of degraded and degrading lands where the traditional use has been cattle grazing. The rubber tree plantations will serve as a buffer zone and biological corridor for the natural forests and areas of High Conservation Value that are located within and next to the project area. Main goal:
To create a model of sustainable competitiveness, unique of its kinds worldwide, in the natural rubber sector and could serve as a model for further restoration in the area. This project will be both a financial and best practice model that integrates income from rubber products as well as carbon through proper technical management. In order to create this model, secondary goals are created to meet the projects main goal.
Secondary Goals:
Decrease adverse effects of climate change via carbon sequestration The project will have a positive impact on the surrounding population by providing a long-term jobs, legal benefits, training, and health benefits (Details on jobs created can be found under G2.4; information about
42
worker training can be found under G4.3; and information about worker benefits can be found in the 2013 GAO Statistics Report). The project will also provide the necessary investment to overcome financial, technological and knowledge barriers. In the North the project will relieve barriers related to the lack of access to necessary materials as well as knowledge related to rubber planting and its management, teaching the nearby communities the skills essential for rubber production. The project will also provide the original genetic and vegetative material and infrastructure needed. The North and South also lack knowledge about sustainable management of plantations and sustainable and responsible forest management, which the project will provide. The project will allow sustainable management to be implemented to change several common aspects of rubber cultivation such as chemicals, integrated pest management, and the implementation of a long term management plan – under common practice the rubber trees are burned once their productive life span comes to an end, but under FSC management they will be harvested for wood products. Approximately 70% of lumber processed in Guatemala originates in native conifer forests63. The project proposes to modify the rubber business model by integrating wood into the biomass processing industry as high value product or energy generation, reducing pressure on native forests The project is expected to have a net positive impact on the environment
given the change of 2,366 hectares from pasture to natural rubber tree
plantations; this also implies recovery of degraded soil and mitigates the
effects by wind and water.
The project area will function as a buffer zone to rivers and natural
reserve, mitigating some of the negative impacts of flooding in the area.
Forest cover will also help water recharge areas.
The project will protect high conservation value zones and mitigate
degradation and depredation of those areas by providing buffer zones
and biological corridors.
The project will also have an aesthetic positive impact on the landscape
as vegetation is recovered since rubber trees are native to tropical forests
in America.
G3.2 Describe each project activity with expected climate, community and biodiversity impacts and its relevance to achieving the projects objectives.
63 Instituto de Agricultura, Recursos Naturales y Ambiente – Universidad Rafael Landívar y Instituto de Incidencia Ambiental. 2006. Perfil Ambiental de Guatemala 2006.

43
Nursery practice Due to the large volume of seedlings required, the production of seedlings will be carried-out in the projects own nurseries. Seeds will be sown in germination beds; following germination seedlings will be transplanted in polyethylene bags. The growth medium, comprised of sand and soil, is obtained onsite. Material for clonation with root stock is produced in the project’s clonal gardens. Plants stay at nurseries at least one year before going to final field. This will minimize costs and contamination related to transportation, while generating permanent jobs and training since seeds need to be sown, transplanted to polyethylene bags, and monitored (additional job information can be found in G2.4 and G4.3)
Figure 3 Nursery and clonal gardens
Site preparation and establishment Due to differences in soil quality, soil preparation practices differ in the North and South. Nevertheless, a common practice in the entire country is to use fire with every crop establishment. As part of the commitment to this project, burning will be a practice to be avoided. In Guatemala the use of fire in site preparation is a common practice64 for several agricultural crops, this is allowed under the concept of “control fires” based on de Forestry Law (Decree 101-96)65, Article 38. Even though fire is a common practice in Guatemala, PICA is aware of the fire uses implies a great responsibility and because of that is part of the project’s commitment is to avoid its use. The projects avoidance of fire during site preparation and establishment will serve as a best practice model for other farms. Soil preparation in the North Prior to soil preparation existing vegetation, primarily grasses, is cleared from the planting area by mechanical means. Where the land is sloping, complete elimination of existing vegetation is avoided to prevent soil erosion.
64 Annex S: Soil preparation/Official Information regarding fire. 65 Annex L: Legislation references/Ley Forestal.pdf.
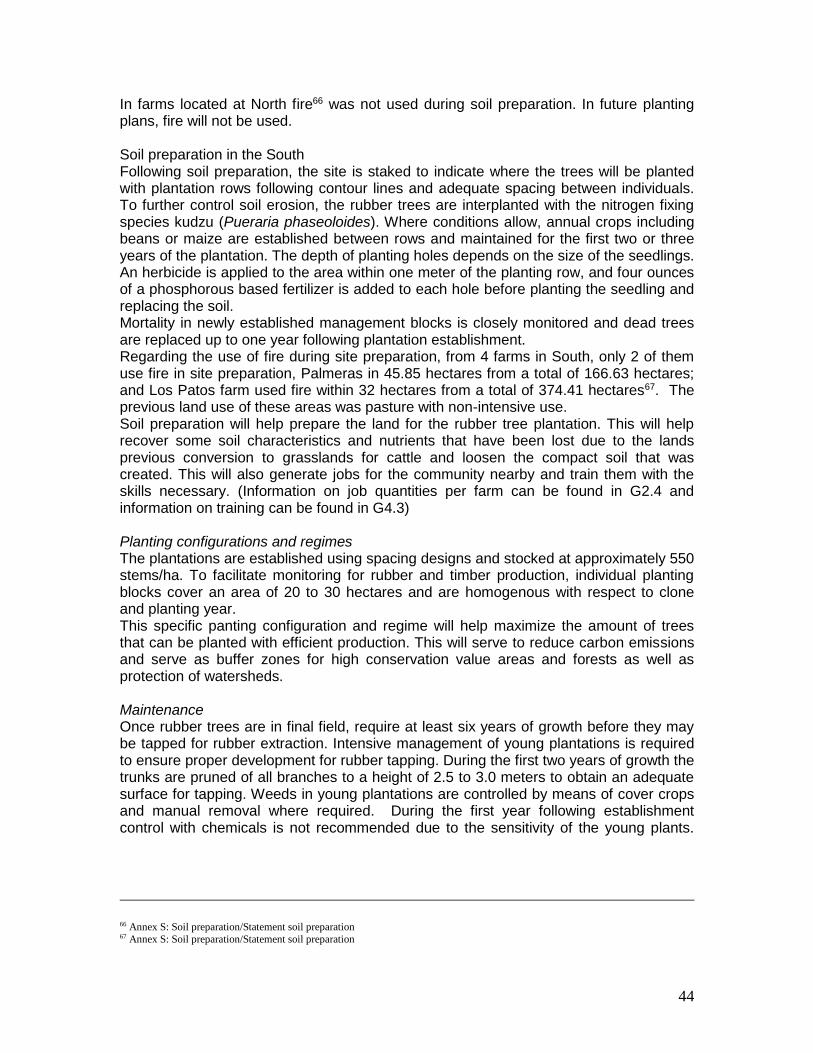
44
In farms located at North fire66 was not used during soil preparation. In future planting plans, fire will not be used. Soil preparation in the South Following soil preparation, the site is staked to indicate where the trees will be planted with plantation rows following contour lines and adequate spacing between individuals. To further control soil erosion, the rubber trees are interplanted with the nitrogen fixing species kudzu (Pueraria phaseoloides). Where conditions allow, annual crops including beans or maize are established between rows and maintained for the first two or three years of the plantation. The depth of planting holes depends on the size of the seedlings. An herbicide is applied to the area within one meter of the planting row, and four ounces of a phosphorous based fertilizer is added to each hole before planting the seedling and replacing the soil. Mortality in newly established management blocks is closely monitored and dead trees are replaced up to one year following plantation establishment. Regarding the use of fire during site preparation, from 4 farms in South, only 2 of them use fire in site preparation, Palmeras in 45.85 hectares from a total of 166.63 hectares; and Los Patos farm used fire within 32 hectares from a total of 374.41 hectares67. The previous land use of these areas was pasture with non-intensive use. Soil preparation will help prepare the land for the rubber tree plantation. This will help recover some soil characteristics and nutrients that have been lost due to the lands previous conversion to grasslands for cattle and loosen the compact soil that was created. This will also generate jobs for the community nearby and train them with the skills necessary. (Information on job quantities per farm can be found in G2.4 and information on training can be found in G4.3) Planting configurations and regimes The plantations are established using spacing designs and stocked at approximately 550 stems/ha. To facilitate monitoring for rubber and timber production, individual planting blocks cover an area of 20 to 30 hectares and are homogenous with respect to clone and planting year. This specific panting configuration and regime will help maximize the amount of trees that can be planted with efficient production. This will serve to reduce carbon emissions and serve as buffer zones for high conservation value areas and forests as well as protection of watersheds. Maintenance Once rubber trees are in final field, require at least six years of growth before they may be tapped for rubber extraction. Intensive management of young plantations is required to ensure proper development for rubber tapping. During the first two years of growth the trunks are pruned of all branches to a height of 2.5 to 3.0 meters to obtain an adequate surface for tapping. Weeds in young plantations are controlled by means of cover crops and manual removal where required. During the first year following establishment control with chemicals is not recommended due to the sensitivity of the young plants.
66 Annex S: Soil preparation/Statement soil preparation 67 Annex S: Soil preparation/Statement soil preparation
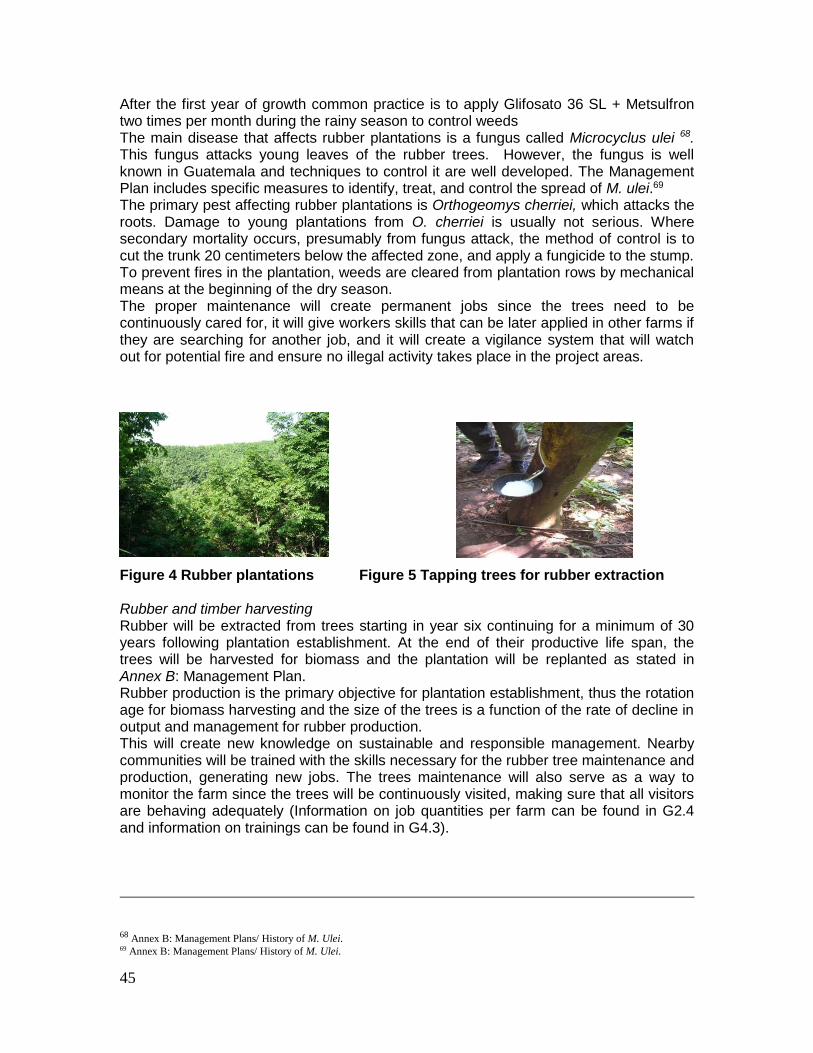
45
After the first year of growth common practice is to apply Glifosato 36 SL + Metsulfron two times per month during the rainy season to control weeds The main disease that affects rubber plantations is a fungus called Microcyclus ulei 68. This fungus attacks young leaves of the rubber trees. However, the fungus is well known in Guatemala and techniques to control it are well developed. The Management Plan includes specific measures to identify, treat, and control the spread of M. ulei.69 The primary pest affecting rubber plantations is Orthogeomys cherriei, which attacks the roots. Damage to young plantations from O. cherriei is usually not serious. Where secondary mortality occurs, presumably from fungus attack, the method of control is to cut the trunk 20 centimeters below the affected zone, and apply a fungicide to the stump. To prevent fires in the plantation, weeds are cleared from plantation rows by mechanical means at the beginning of the dry season. The proper maintenance will create permanent jobs since the trees need to be continuously cared for, it will give workers skills that can be later applied in other farms if they are searching for another job, and it will create a vigilance system that will watch out for potential fire and ensure no illegal activity takes place in the project areas.
Figure 4 Rubber plantations Figure 5 Tapping trees for rubber extraction Rubber and timber harvesting Rubber will be extracted from trees starting in year six continuing for a minimum of 30 years following plantation establishment. At the end of their productive life span, the trees will be harvested for biomass and the plantation will be replanted as stated in Annex B: Management Plan. Rubber production is the primary objective for plantation establishment, thus the rotation age for biomass harvesting and the size of the trees is a function of the rate of decline in output and management for rubber production. This will create new knowledge on sustainable and responsible management. Nearby communities will be trained with the skills necessary for the rubber tree maintenance and production, generating new jobs. The trees maintenance will also serve as a way to monitor the farm since the trees will be continuously visited, making sure that all visitors are behaving adequately (Information on job quantities per farm can be found in G2.4 and information on trainings can be found in G4.3).
68 Annex B: Management Plans/ History of M. Ulei. 69 Annex B: Management Plans/ History of M. Ulei.
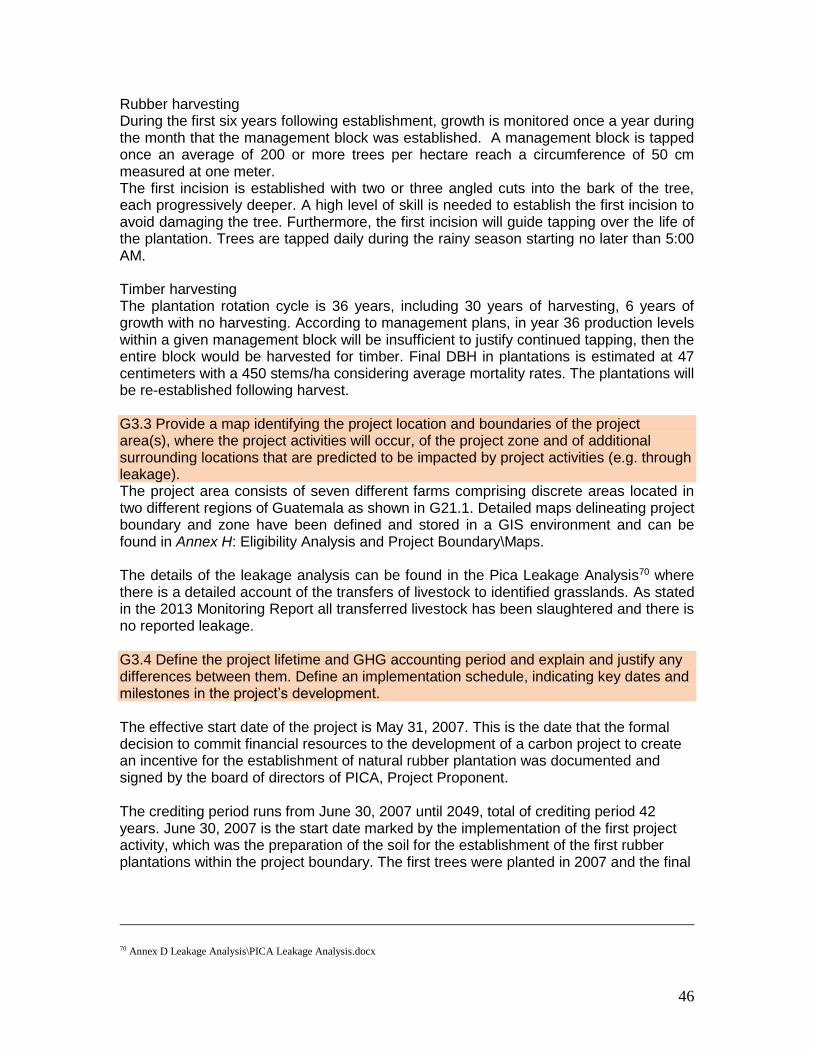
46
Rubber harvesting During the first six years following establishment, growth is monitored once a year during the month that the management block was established. A management block is tapped once an average of 200 or more trees per hectare reach a circumference of 50 cm measured at one meter. The first incision is established with two or three angled cuts into the bark of the tree, each progressively deeper. A high level of skill is needed to establish the first incision to avoid damaging the tree. Furthermore, the first incision will guide tapping over the life of the plantation. Trees are tapped daily during the rainy season starting no later than 5:00 AM.
Timber harvesting The plantation rotation cycle is 36 years, including 30 years of harvesting, 6 years of growth with no harvesting. According to management plans, in year 36 production levels within a given management block will be insufficient to justify continued tapping, then the entire block would be harvested for timber. Final DBH in plantations is estimated at 47 centimeters with a 450 stems/ha considering average mortality rates. The plantations will be re-established following harvest. G3.3 Provide a map identifying the project location and boundaries of the project area(s), where the project activities will occur, of the project zone and of additional surrounding locations that are predicted to be impacted by project activities (e.g. through leakage). The project area consists of seven different farms comprising discrete areas located in two different regions of Guatemala as shown in G21.1. Detailed maps delineating project boundary and zone have been defined and stored in a GIS environment and can be found in Annex H: Eligibility Analysis and Project Boundary\Maps. The details of the leakage analysis can be found in the Pica Leakage Analysis70 where there is a detailed account of the transfers of livestock to identified grasslands. As stated in the 2013 Monitoring Report all transferred livestock has been slaughtered and there is no reported leakage. G3.4 Define the project lifetime and GHG accounting period and explain and justify any differences between them. Define an implementation schedule, indicating key dates and milestones in the project’s development. The effective start date of the project is May 31, 2007. This is the date that the formal decision to commit financial resources to the development of a carbon project to create an incentive for the establishment of natural rubber plantation was documented and signed by the board of directors of PICA, Project Proponent. The crediting period runs from June 30, 2007 until 2049, total of crediting period 42 years. June 30, 2007 is the start date marked by the implementation of the first project activity, which was the preparation of the soil for the establishment of the first rubber plantations within the project boundary. The first trees were planted in 2007 and the final
70 Annex D Leakage Analysis\PICA Leakage Analysis.docx
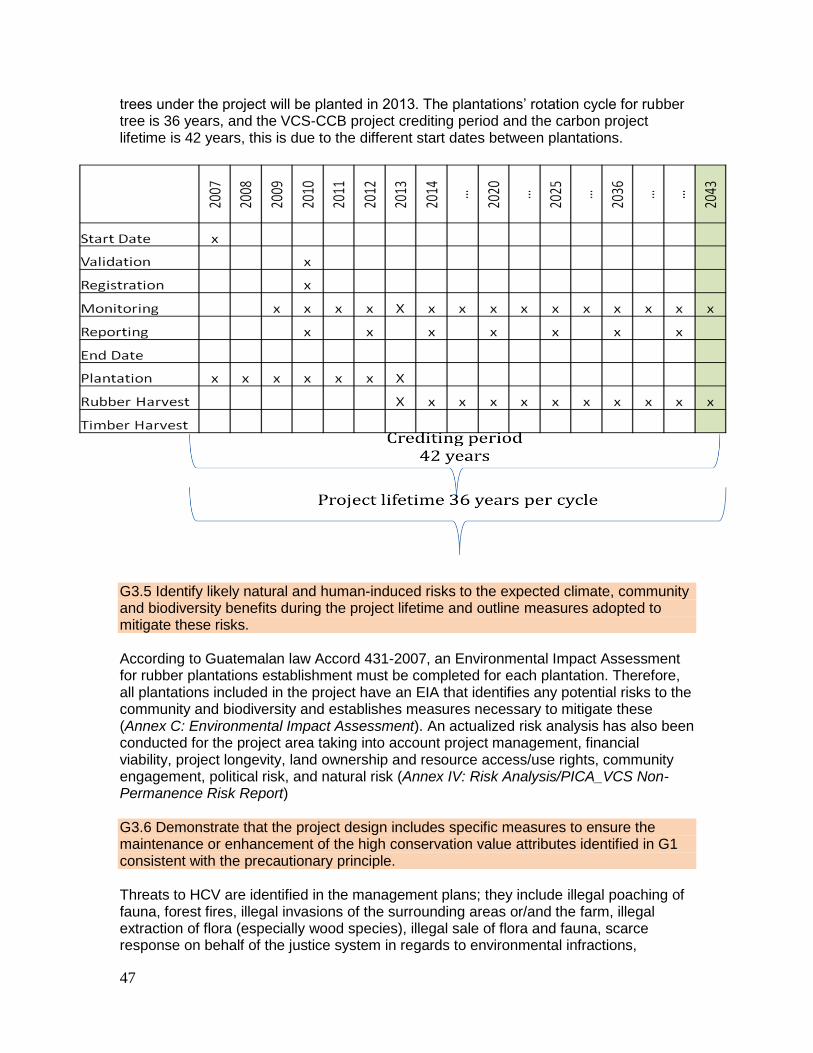
47
trees under the project will be planted in 2013. The plantations’ rotation cycle for rubber tree is 36 years, and the VCS-CCB project crediting period and the carbon project lifetime is 42 years, this is due to the different start dates between plantations.
G3.5 Identify likely natural and human-induced risks to the expected climate, community and biodiversity benefits during the project lifetime and outline measures adopted to mitigate these risks. According to Guatemalan law Accord 431-2007, an Environmental Impact Assessment for rubber plantations establishment must be completed for each plantation. Therefore, all plantations included in the project have an EIA that identifies any potential risks to the community and biodiversity and establishes measures necessary to mitigate these (Annex C: Environmental Impact Assessment). An actualized risk analysis has also been conducted for the project area taking into account project management, financial viability, project longevity, land ownership and resource access/use rights, community engagement, political risk, and natural risk (Annex IV: Risk Analysis/PICA_VCS Non-Permanence Risk Report) G3.6 Demonstrate that the project design includes specific measures to ensure the maintenance or enhancement of the high conservation value attributes identified in G1 consistent with the precautionary principle. Threats to HCV are identified in the management plans; they include illegal poaching of fauna, forest fires, illegal invasions of the surrounding areas or/and the farm, illegal extraction of flora (especially wood species), illegal sale of flora and fauna, scarce response on behalf of the justice system in regards to environmental infractions,

48
deforestation of surrounding forests, insufficient information about migratory species, and contamination of water sources. In order to minimize the occurrence of these, the project will:
Table 8 HCV Proposed Mitigation Efforts
Threat Proposed Mitigation Effort
Illegal poaching of fauna
Elaborate and implement a patrolling plan
Coordination between the patrolling guards and FUNDAECO, CONAP, and the national police
Place signs around the farm that raise environmental awareness and warn against illegal activity
Forest fires
Elaborate and implement fire patrolling units in the beginning of the dry season with special concern in vulnerable areas
Create a vigilance system in strategic areas
Coordinate with neighbors if they plan to burn on their farms
Give support to neighbors during any burning on lands
Place signs around the farm that raise environmental awareness and warn against illegal activity
Invasion of nearby areas or/and the farm
Elaborate and implement a patrolling plan
Place signs around the farm that indicate its status as private property
Inform local authorities or specialized environmental groups of any invasion in nearby areas
Extraction and commercialization of illegal flora and fauna
Elaborate and implement a patrolling plan
Place signs around the farm that raise environmental awareness and warn against illegal activity
Establish a mechanism of control for people that enter any areas of HCV in the farm, be they workers of the company or visitors
Scarce response from the justice system to environmental infractions
Support local environmental justice forums such as the one in Izabal
Support local environmental advocates that protect natural reserves in their follow up of environmental infractions
Document and report any illegal activity within the farm, such as illegal extractions

49
Deforestation of surrounding forests
Promote the sustainable and responsible development of economic activities in the surrounding forests
Encourage surrounding areas to enter forest incentive programs
Contamination of water sources
Avoid any forest cover loss
Avoid the construction of infrastructure on sites near the borders of water sources
Create a waste disposal policy with the farms personnel.
These are all listed in the farms management plans (Annex B: Management Plans) G3.7 Describe the measures that will be taken to maintain and enhance the climate, community and biodiversity benefits beyond the project lifetime. At the end of the project rubber trees will be harvested for timber and the plantation will be replanted as stated in the Management Plans71. The projects main goal is to create a model of sustainable competitiveness in the natural rubber sector that can serve as a model for further restoration in the area replicating these additional benefits in the future. Also, all of the projects workers will be capacitated in their respective fields and will have the opportunity to use their learned skill in the future if they decide to search for another job. G3.8 Document and defend how communities and other stakeholders potentially affected by the project activities have been identified and have been involved in project design through effective consultation, particularly with a view to optimizing community and stakeholder benefits, respecting local customs and values and maintaining high conservation values. Project developers must document stakeholder dialogues and indicate if and how the project proposal was revised based on such input. A plan must be developed to continue communication and consultation between project managers and all community groups about the project and its impacts to facilitate adaptive management throughout the life of the project. In the initial analysis of the farms, communities and stakeholders that could potentially be affected where identified. According to the Governmental Accord No. 89-2008, Article 74 by the Ministry of Environment and Natural Resources, a public participation plan must be created for the entirety of the projects cycle. This includes: Identification of the group or community affected and a plan to incentivize public participation, and a way for the community to participate; describing the way the solicitude of information is conducted and demonstrate the response if any is obtained. Stakeholder consultations were carried out in December of 2009 by a representative from the project proponent as well as a neutral party to give communities information about the project as well as provide the opportunity for stakeholders to provide feedback regarding the impact of
71 Annex B: Management Plans

50
project activities on the communities. In the South, two stakeholder consultation meetings were held to include communities around the farms of Palmeras, Los Patos, El Horizonte, and Asuncion. A total of 91 persons from 26 communities participated in the meetings. In the North, one meeting was held to include communities around the farms of Bello Horizonte and Rio Frio. A total of 53 persons participated representing four communities. The stakeholder consultations were carried out in the form of workshops with presentations using videos and other visual support to provide participants information about the project. Written material describing the project was also distributed to participants during the workshop. Following the presentations, participants were invited to provide feedback, giving them the opportunity to ask questions about the project as well as to express their perceptions and concerns. The purpose of the stakeholder consultations was to identify potential conflicts between the project and the surrounding community and to characterize community needs. Over the course of the workshop, the facilitators worked with the participants to resolve any identified problems. Facilitators reviewed videotapes of the workshops to create a report that was used to integrate stakeholder feedback into project design. Overall the surrounding communities have a positive perception of the project because it provides employment opportunities to local people. The plantation workers expressed concern that the project takes the necessary precautions to ensure the safety on the job72. In regards to this concern, stakeholders were informed that a full training is given with regards to worker safety as well as necessary equipment, as stated in G4.3. Stakeholder consultations are currently being held (11/19/13 – 11/21/13) to inform communities and workers near the farms about the project’s plans to incorporate a Climate Community and Biodiversity Alliance certification. The project’s strategy for ongoing communication with stakeholders and incorporation of feedback into project design is outlined in the document “Stakeholder Communication Strategy” 73. G3.9 Describe what specific steps have been taken, and communications methods used, to publicize the CCBA public comment period to communities and other stakeholders and to facilitate their submission of comments to CCBA. Project proponents must play an active role in distributing key project documents to affected communities and stakeholders and hold widely publicized information meetings in relevant local or regional languages. Informative meetings are currently being hosted with involved communities and other stakeholders as it was done with the initial consultation. These meetings will inform involved parties about the projects efforts to become certified under CCBA and how they can submit comments either directly or through the internet. Informative brochures will also be given to help spread any key information on the projects activities.
The following steps will be taken to publicize the CCBA public comment period to all project stakeholders:
72 Annex IV/Risk analysis/6) Community Engagement/Folders: Stakeholder
consultation-North; Stakeholders consultation-South1 and Stakeholders consultation-South2. 73 Annex IV\Risk analysis\6) Community Engagement\Document: Estrategia de Comunicación-Stakeholder.pdf.
51
A Summary Brief of the projects activities will be distributed to all stakeholders in Spanish.
During the CCBA public comment period, all stakeholders will be informed about the CCBA public comment period, told that a copy of the PDD will be available online, and will be instructed on how they can submit comments to CCBA.
If the stakeholders have any additional questions or concerns they will be able to voice them at the moment for further explanation or for facilitation on submitting their comment.
G3. 10 Formalize a clear process for handling unresolved conflicts and grievances that arise during project planning and implementation. The project design must include a process for hearing, responding to and resolving community and other stakeholder grievances within a reasonable time period. This grievance process must be publicized to communities and other stakeholders and must be managed by a third party or mediator to prevent any conflict of interest. Project management must attempt to resolve all reasonable grievances raised, and provide a written response to grievances within 30 days. Grievances and project responses must be documented. The project proponent will identify a qualified third party to manage grievances. This will mostly likely be a non-profit organization with a specific focus in conservation and natural resources that is well known and has a strong reputation within the regions. Once the proposal is set communities will be informed about the conflict resolution process and will be given clear verbal and written guidance on how grievances can be raised to the proponent through the third-party intermediary. Once a conflict is drafted the community conflict resolution process is as follows:
1. Each community will be provided with a method and contact details for a third-party intermediary who represents the project proponent. 2. When a grievance has been lodged, the third-party intermediary will notify the project proponent and invite stakeholders with the grievance within one week after submission to discuss their concerns.
The stakeholder lodging the grievance will meet independently with a designated representative of the third party intermediary organization to identify concerns and discuss potential solutions. The intermediary will document the nature of the grievance, the actions being requested and the list of potential solutions that were discussed at the meeting with the stakeholder.
4. Where a significant grievance is lodged, the third-party intermediary will then report to the project proponent about the grievance. 5. The third-party intermediary and the project proponent will meet to decide on the appropriate course of action to address the issue. This may take many forms, such as:
o Directly addressing the grievance in a way that solves the problem as requested stakeholder,
o Making suggestions that arrive at a middle ground between what is being requested by the stakeholder and what is feasible from the perspective of the project proponent, and
o Outright rejection of the grievance with a written explanation as to the reasonable basis of the decision.

52
6. The third-party intermediary will then report back to the stakeholder with the
proposed solution. 7. This exchange of information should continue until the dispute has been
resolved. The time frame should be no longer than 30 days. 8. Project proponents will prepare a report on the resolution process, which will
be made accessible to stakeholders
In some situations it may be appropriate for a representative from the project proponent meet with the stakeholder and the third-party intermediary to resolve the problem.
G3. 11 Demonstrate that financial mechanisms adopted, including projected revenues from emissions reductions and other sources, are likely to provide an adequate flow of funds for project implementation and to achieve the anticipated climate, community and biodiversity benefits. Since the project also aims to create a model of sustainable competitiveness, it will be both a financial and best practice model that integrates income from rubber products as well as carbon through proper technical management. Project revenues will allow the plantations to be grown providing climate, community and biodiversity benefits. Please refer to the financial analysis (Annex T: Financial Analysis Rubber.xlsx. sheets: "Carbon Cash Flow" and "Carbon revenues”) for detail information regarding the cost and revenues estimated for the Carbon Finance Scenario. An Executive Summary of the financial fund project –Confidential Document – is available to the validator at time of validation.
G4 Management Capacity and Best Practices
G4.1 Identify a single project proponent, which is responsible for the project’s design and implementation. If multiple organizations or individuals are involved in the project’s development and implementation the governance structure, roles and responsibilities of each of the organizations or individuals involved must also be described.
Roles and responsibilities
Activities Role Responsible
Activities related to rubber cultivation which take place in field, such as:
Soil preparation,
Planting,
Growth
monitoring,
Tapping,
Weeds
management
Develop and update the management plan of each farm.
Technical managers of each participating farm in the North and South
SOUTH
Palmeras, César Chávez under the supervision of Francisco Andicoechea

53
Activities Role Responsible
Plantations
renewals
Los Patos, Asunción and El Horizonte, Waldemar Dell under the supervision of Juan Pablo Falla
NORTH
Rio Frio and Bello Horizonte, Ronaldo Pazos under the supervision of Francisco Andicoechea
Concepción, Gustavo Gonzalez, under the supervision of José Pivaral.
Carbon monitoring Implement a carbon-
monitoring plan every
year and supervise it
within each participating
farm based on the
approved monitoring plan.
Train personnel of each
participating farm on data
collection and in field
activities, such as DBH
and height measurements
Lead the monitoring
process with personnel
assigned in each
participating farm
participants.
Technical Coordinating Unit Project Proponent–PICA-, Pablo Dominguez
Measure the monitoring
variables with personnel
properly trained by Project
Proponent
Project Participants
Data processing, Monitoring Report creation and follow through with Verification
Manage biomass and
carbon database for each
farm of Project
Participants.
Technical Coordinating Unit, Project Proponent–PICA-, Pablo Dominguez, Glenda Lee, and Isabel Aguirre with additional

54
Activities Role Responsible
process Calculate carbon offset
generation for each
participating farm.
Calculate GHG emissions
for each participating farm
Create the annual
monitoring report
Contract and coordinate
verification process
support from in house legal and administrative personnel
Emissions reductions issuance and trading
Coordinate registration
process with a VCS-CCB
approved registry
Contract and manage
issuance and delivery of
the Verified Emission
Reductions in a VCS-CCB
approved registry
Identify potential buyers of
the Verified Emission
Reductions to be
produced by the project
Negotiate commercial
terms
Negotiate legal
agreements
Follow up on all issues
regarding carbon trade.
Project Proponent –PICA-, Luis Alejandro Mejía and Glenda Lee with support from in house legal personnel
Implement CCB-VCS PD Coordinate information
and data flows with
Technical Managers of
each Project Participant.
Evaluate and assure
fulfillment of commitments
within PD of each Project
Participant
Provide technical training
to fulfill VCS-CCB
requirements
Manage all administrative
Project Proponent –PICA-, Pablo Dominguez

55
Activities Role Responsible
matters with VCS-CCB’
Verifiers
Community engagement and monitoring
Coordinate stakeholder
consultations
Create surveys that can
be disseminated to
stakeholders for input
Analyze stakeholder
concerns and comments
Glenda Lee
Biodiversity monitoring and analysis
Conduct field surveys of
flora and fauna
Coordinate worker
consultations to gather
information regarding
observations in the field
Technical managers of each participating farm in the North and South
SOUTH
Palmeras, César Chávez under the supervision of Francisco Andicoechea
Los Patos, Asunción and El Horizonte, Waldemar Dell under the supervision of Juan Pablo Falla
NORTH
Rio Frio and Bello Horizonte, Ronaldo Pazos under the supervision of Francisco Andicoechea
Concepción, Gustavo Gonzalez, under the supervision of José Pivaral.

56
G4.2 Document key technical skills that will be required to implement the project successfully, including community engagement, biodiversity assessment and carbon measurement and monitoring skills. Document the management team’s expertise and prior experience implementing land management projects at the scale of this project. If relevant experience is lacking, the proponents must either demonstrate how other organizations will be partnered with to support the project or have a recruitment strategy to fill the gaps. The managers of the project's farms have extensive experience with rubber cultivation, as well as experience fulfilling the requirements for FSC certification, as demonstrated by the project management role descriptions described in the Management Plans and the CVs74 submitted to the third party at VCS validation. PICA has substantial previous project experience with on-site management team. PICA has been working closely with rubber producers for more than 50 years. PICA’s knowledge of rubber plantations as well as all of the relevant tools and techniques has been applied to the project activity. Additionally, PICA has ready access to the relevant and necessary expertise in rubber production due to its long-term relationship with rubber producers. A service agreement was granted between PICA and every project participant, assigning PICA this role as Project Proponent and Coordinator Unit. FSC certified rubber cultivation is a new practice in Guatemala and therefore innovative. Although FSC certified rubber cultivation in large plantations is a new practice in the region, natural rubber cultivation at a small scale is well-established in Guatemala and traditional techniques can be adapted for FSC rubber production. However, the project Proponent with its experience of more than 50 years in rubber cultivation in Guatemala has been able to transfer their knowledge, skills, and techniques to the whole project participants in this project. Given that, PICA has contracted professionals highly skilled in agriculture and forestry to advice on sustainable management of plantations for FSC certified rubber production. Moreover, the professional team is highly specialized on FSC Certification and carbon development and monitoring. As a proof of this, in May 2011, PICA obtained the FSC Forest Management Certification75 as a group manager. The first three participants included in the group certification are Bello Horizonte, Rio Frio and Palmeras. In the near future, the rest of participants will be included in sustainable or responsible forest management as well. In relation to carbon monitoring, PICA’s team also has experience on developing biomass equations to estimate carbon in natural forest in Guatemala. The Eco Business Senior Forest Specialist developed a thesis on allometric equation on three broadleaves species in Guatemala in 200276 and before working in PICA, worked in a long-term project under the Supervision of Del Valle University77 doing carbon stocks monitoring in
74 Annex IV\Risk analysis\1) Project Management\Risk factor c) ; Document:
PICA - Experience of Project participants.pdf. 75 Annex IV\Risk analysis\1) Project Management\Risk factor c); Document:� Allometric Broadleaves Equations, GLEE.pdf. 76 Annex IV\Risk analysis\1) Project Management\Risk factor c); Document:
Carbon Estimation in Highlands Forest, Guatemala, 2004.pdf 77 Annex IV\Risk analysis\1) Project Management\Risk factor c); Document: Curricula of individual experience of PICA’s Project participants.pdf.

57
highlands78. The Eco Business Monitoring Coordinator has extended experience in forest monitoring for more than 11 years and in 2010 conducted the develop of a new allometric equation for PICA’s Carbon Project (Developing a new equation to estimate Carbon stock in rubber trees (Hevea brasiliensis) below 5cms of diameter at breast height (DBH) in Guatemala). In addition, as PICA’s monitoring coordinator, successfully obtain the first verification for carbon credits in 2010. Additional proof of individual experience on carbon measurements can be found in Annex Q. In regards to community engagement, Glenda Lee has been coordinating stakeholder consultations with positive results. She received a certificate of completion from Wageningen Internation in Bogor, Indonesia on “Governance for forests, nature and International people” in 2010. This certificate can se found in Annex IV: Risk Analysis/Project Management/Risk factor c)/GLEE diploma. The technical managers of each participating farm will conduct biodiversity assessment since they are familiar with the farms surroundings, have constant contact with the farm workers and are familiar with the flora and fauna of the area. Additional information on the projects proponents can be found in Annex IV: Risk Analysis/Project Management/Risk factor c)/ 1) PICA - Experience of Project participants.
G4.3 Include a plan to provide orientation and training for the project’s employees and relevant people from the communities with an objective of building locally useful skills and knowledge to increase local participation in project implementation. These capacity building efforts should target a wide range of people in the communities, including minority and underrepresented groups. Identify how training will be passed on to new workers when there is staff turnover, so that local capacity will not be lost. Capacity building is critical for the operation of the Promoting Sustainable Development through Natural Rubber Tree Plantations in Guatemala Project. In order for the projects initiatives to succeed, members of the community need the skills necessary to effectively implement their tasks. Therefore the project cannot only create additional employment but must provide the necessary training in the skills required to maximize production. For this a necessary general training is given to all workers where they are informed about the organization that they work for, the values the company upholds, the ethics code, benefits offered to workers, and the internal workplace policy so they can be aware about the benefits they poses as workers and what they can and cannot due within the farms. A specific training for each job is later given to workers depending on the job that they will carry out in the farm. In this induction each worker is told their jobs responsibilities and what skills he needs to use. Table 8 lists specific training themes that are given to workers depending on their job requirements.
78 Annex IV\Risk analysis\1) Project Management\Risk factor c); Document: PICA FM cert IN-2011-1.pdf.
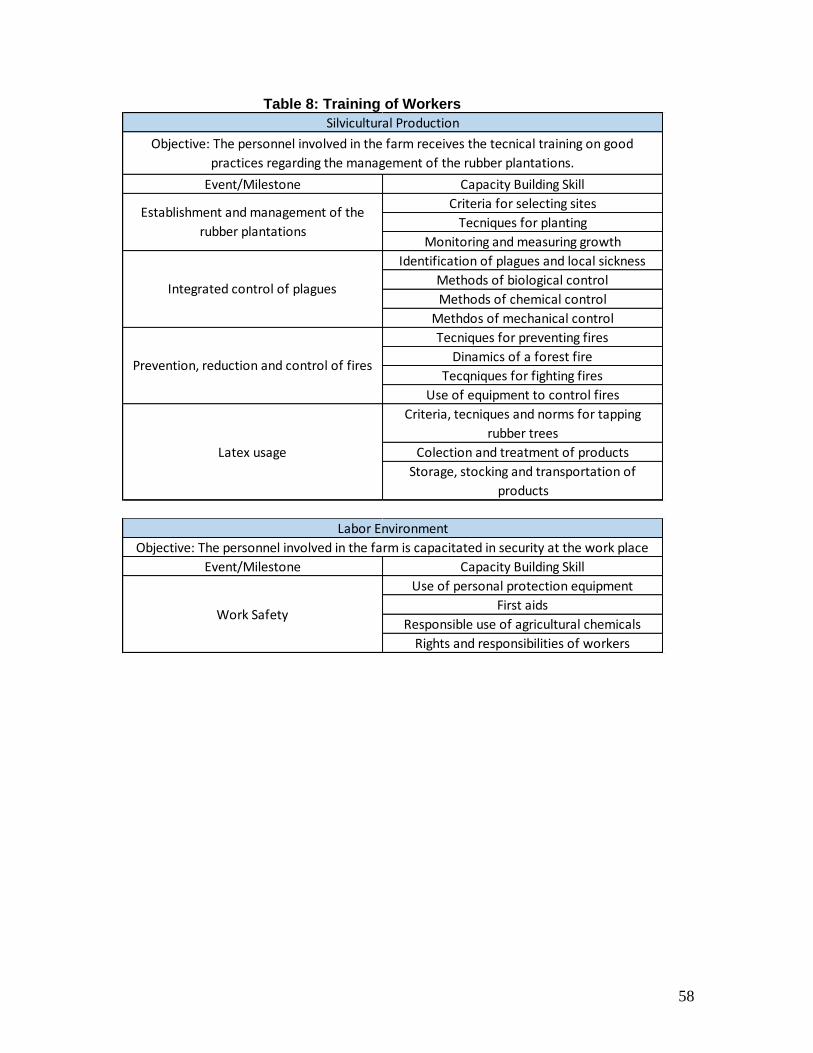
58
Table 8: Training of Workers
Event/Milestone Capacity Building Skill
Criteria for selecting sites
Tecniques for planting
Monitoring and measuring growth
Identification of plagues and local sickness
Methods of biological control
Methods of chemical control
Methdos of mechanical control
Tecniques for preventing fires
Dinamics of a forest fire
Tecqniques for fighting fires
Use of equipment to control fires
Criteria, tecniques and norms for tapping
rubber trees
Colection and treatment of products
Storage, stocking and transportation of
products
Silvicultural Production
Objective: The personnel involved in the farm receives the tecnical training on good
practices regarding the management of the rubber plantations.
Establishment and management of the
rubber plantations
Integrated control of plagues
Prevention, reduction and control of fires
Latex usage
Event/Milestone Capacity Building Skill
Use of personal protection equipment
First aids
Responsible use of agricultural chemicals
Rights and responsibilities of workers
Labor Environment
Objective: The personnel involved in the farm is capacitated in security at the work place
Work Safety
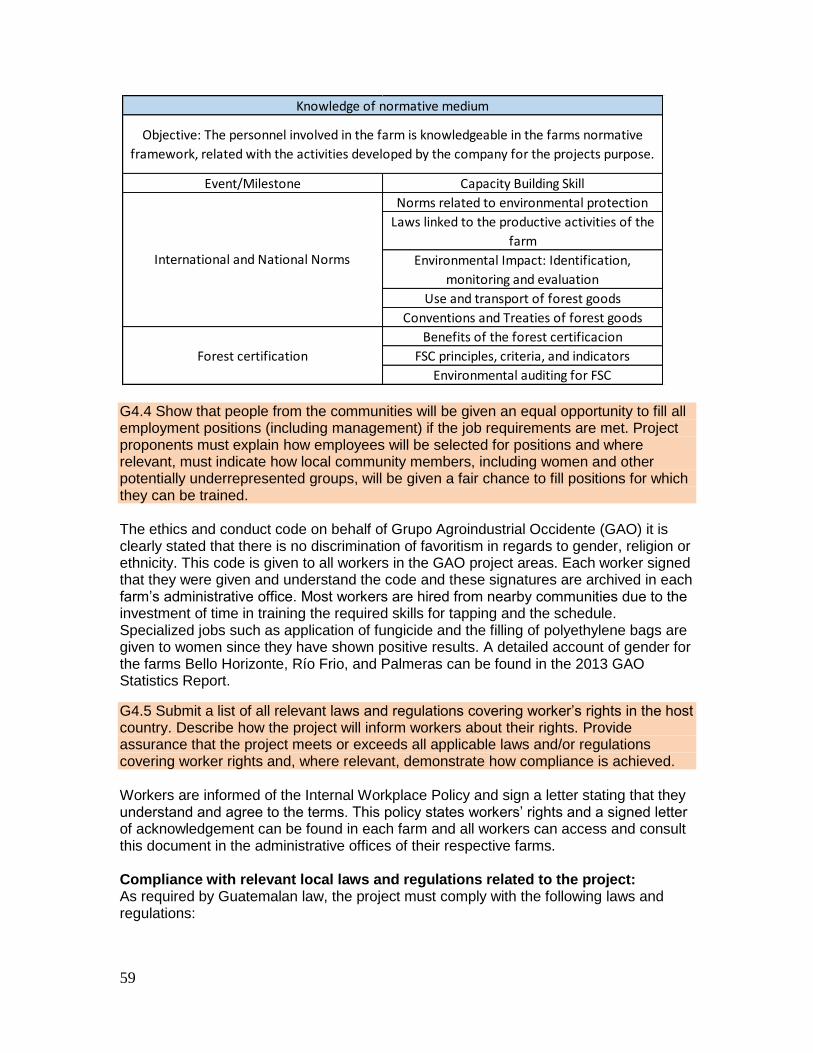
59
G4.4 Show that people from the communities will be given an equal opportunity to fill all employment positions (including management) if the job requirements are met. Project proponents must explain how employees will be selected for positions and where relevant, must indicate how local community members, including women and other potentially underrepresented groups, will be given a fair chance to fill positions for which they can be trained. The ethics and conduct code on behalf of Grupo Agroindustrial Occidente (GAO) it is clearly stated that there is no discrimination of favoritism in regards to gender, religion or ethnicity. This code is given to all workers in the GAO project areas. Each worker signed that they were given and understand the code and these signatures are archived in each farm’s administrative office. Most workers are hired from nearby communities due to the investment of time in training the required skills for tapping and the schedule. Specialized jobs such as application of fungicide and the filling of polyethylene bags are given to women since they have shown positive results. A detailed account of gender for the farms Bello Horizonte, Río Frio, and Palmeras can be found in the 2013 GAO Statistics Report.
G4.5 Submit a list of all relevant laws and regulations covering worker’s rights in the host country. Describe how the project will inform workers about their rights. Provide assurance that the project meets or exceeds all applicable laws and/or regulations covering worker rights and, where relevant, demonstrate how compliance is achieved. Workers are informed of the Internal Workplace Policy and sign a letter stating that they understand and agree to the terms. This policy states workers’ rights and a signed letter of acknowledgement can be found in each farm and all workers can access and consult this document in the administrative offices of their respective farms. Compliance with relevant local laws and regulations related to the project: As required by Guatemalan law, the project must comply with the following laws and regulations:
Event/Milestone Capacity Building Skill
Norms related to environmental protection
Laws linked to the productive activities of the
farm
Environmental Impact: Identification,
monitoring and evaluation
Use and transport of forest goods
Conventions and Treaties of forest goods
Benefits of the forest certificacion
FSC principles, criteria, and indicators
Environmental auditing for FSC
Forest certification
Knowledge of normative medium
Objective: The personnel involved in the farm is knowledgeable in the farms normative
framework, related with the activities developed by the company for the projects purpose.
International and National Norms

60
Law Compliance Issues Demonstration of Project Compliance
Código de Salud – Decree 90-97
Regulates relationship between worker and contracting party
In order to obtain FSC certification, the project will follow strict standards regarding employee rights and safety on the job.
Código de Trabajo, Decree 1441
Regulates treatment of farm workers, particularly articles 138 to 145 which regulate matters relating to agriculture and livestock work
Environmental Impact Assessments completed for each plantation.79
Reglamento sobre Higiene y Seguridad en el Trabajo, Presidential Accord 21-12-1957
Regulates general conditions of hygiene and safety in the workplace regardless of the nature of the work
G4.6 Comprehensively assess situations and occupations that pose a substantial risk to worker safety. A plan must be in place to inform workers of risks and to explain how to minimize such risks. Where worker safety cannot be guaranteed, project proponents must show how the risks will be minimized using best work practices. In order to ensure the health and safety of plantation workers and project staff, the Management Plan includes the following measures:
Provision of appropriate and adequate equipment to workers
Supply of first aid kits
Prohibit the consumption of alcoholic beverages during work hours
Ensure that vehicles are available for emergencies
Maintain list of emergency telephone numbers
Emergency action plan
All workers sign that they received a personal protection kit as well as a first aid kit.
These files are archived in each farm. Appropriate training on worker safety is also given
to workers.
G4.7 Document the financial health of the implementing organization(s) to demonstrate that financial resources budgeted will be adequate to implement the project.
79 Annex C: PICA Environmental Impact Assessment
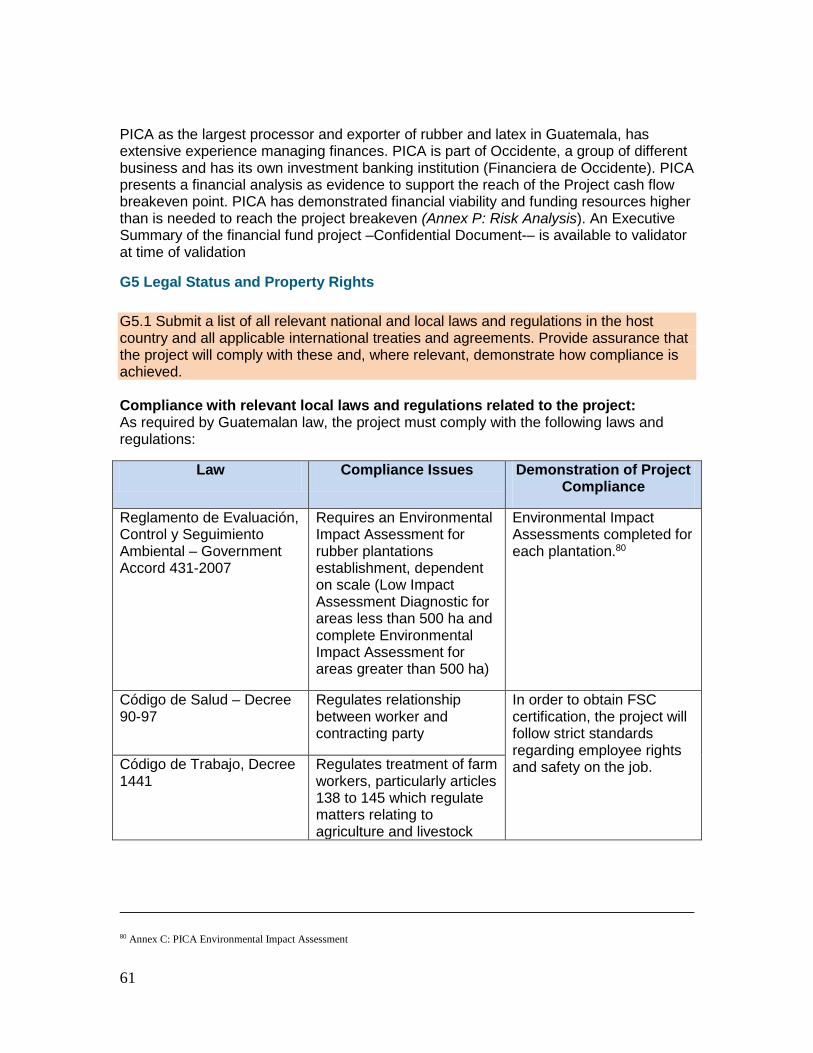
61
PICA as the largest processor and exporter of rubber and latex in Guatemala, has extensive experience managing finances. PICA is part of Occidente, a group of different business and has its own investment banking institution (Financiera de Occidente). PICA presents a financial analysis as evidence to support the reach of the Project cash flow breakeven point. PICA has demonstrated financial viability and funding resources higher than is needed to reach the project breakeven (Annex P: Risk Analysis). An Executive Summary of the financial fund project –Confidential Document-– is available to validator at time of validation
G5 Legal Status and Property Rights
G5.1 Submit a list of all relevant national and local laws and regulations in the host country and all applicable international treaties and agreements. Provide assurance that the project will comply with these and, where relevant, demonstrate how compliance is achieved. Compliance with relevant local laws and regulations related to the project: As required by Guatemalan law, the project must comply with the following laws and regulations:
Law Compliance Issues Demonstration of Project Compliance
Reglamento de Evaluación, Control y Seguimiento Ambiental – Government Accord 431-2007
Requires an Environmental Impact Assessment for rubber plantations establishment, dependent on scale (Low Impact Assessment Diagnostic for areas less than 500 ha and complete Environmental Impact Assessment for areas greater than 500 ha)
Environmental Impact Assessments completed for each plantation.80
Código de Salud – Decree 90-97
Regulates relationship between worker and contracting party
In order to obtain FSC certification, the project will follow strict standards regarding employee rights and safety on the job. Código de Trabajo, Decree
1441 Regulates treatment of farm workers, particularly articles 138 to 145 which regulate matters relating to agriculture and livestock
80 Annex C: PICA Environmental Impact Assessment
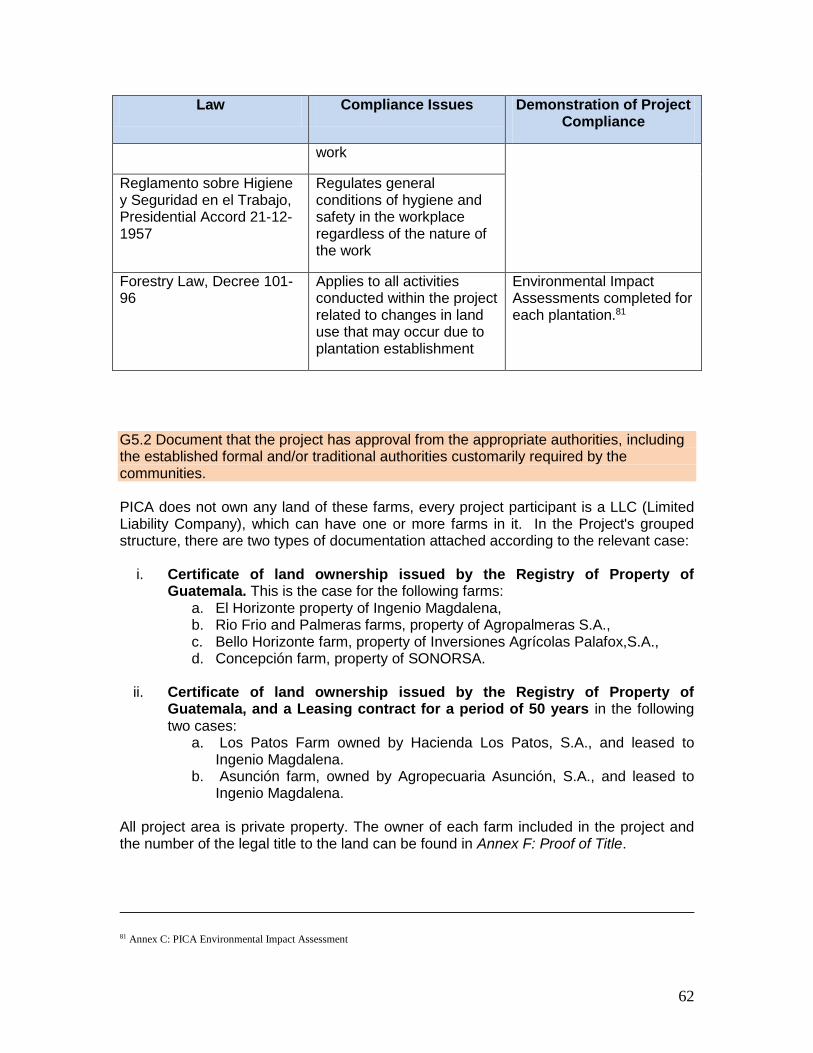
62
Law Compliance Issues Demonstration of Project Compliance
work
Reglamento sobre Higiene y Seguridad en el Trabajo, Presidential Accord 21-12-1957
Regulates general conditions of hygiene and safety in the workplace regardless of the nature of the work
Forestry Law, Decree 101-96
Applies to all activities conducted within the project related to changes in land use that may occur due to plantation establishment
Environmental Impact Assessments completed for each plantation.81
G5.2 Document that the project has approval from the appropriate authorities, including the established formal and/or traditional authorities customarily required by the communities. PICA does not own any land of these farms, every project participant is a LLC (Limited Liability Company), which can have one or more farms in it. In the Project's grouped structure, there are two types of documentation attached according to the relevant case:
i. Certificate of land ownership issued by the Registry of Property of Guatemala. This is the case for the following farms:
a. El Horizonte property of Ingenio Magdalena, b. Rio Frio and Palmeras farms, property of Agropalmeras S.A., c. Bello Horizonte farm, property of Inversiones Agrícolas Palafox,S.A., d. Concepción farm, property of SONORSA.
ii. Certificate of land ownership issued by the Registry of Property of
Guatemala, and a Leasing contract for a period of 50 years in the following two cases:
a. Los Patos Farm owned by Hacienda Los Patos, S.A., and leased to Ingenio Magdalena.
b. Asunción farm, owned by Agropecuaria Asunción, S.A., and leased to Ingenio Magdalena.
All project area is private property. The owner of each farm included in the project and the number of the legal title to the land can be found in Annex F: Proof of Title.
81 Annex C: PICA Environmental Impact Assessment
63
Project participants own 5 of the 7 farms and the rest are legally leased. PICA does not lease any lands within the project, every farm has its ownership, which is a legal document demonstrating proof of title.
G5.3 Demonstrate with documented consultations and agreements that the project will not encroach uninvited on private property, community property, or government property and has obtained the free, prior, and informed consent of those whose rights will be affected by the project. As stated in G5.2 all project area is private property and has been obtained with free, prior, and informed consent of those who’s right where affected with no private, community or government property being encroached uninvited. G5.4 Demonstrate that the project does not require the involuntary relocation of people or of the activities important for the livelihoods and culture of the communities. If any relocation of habitation or activities is undertaken within the terms of an agreement, the project proponents must demonstrate that the agreement was made with the free, prior, and informed consent of those concerned and includes provisions for just and fair compensation.
The project Promoting Sustainable Development through Natural Rubber Tree Plantations in Guatemala does not require the involuntary relocation of people or activities. As stated in G5.2, the project area is private property. G5.5 Identify any illegal activities that could affect the project’s climate, community or biodiversity impacts (e.g., logging) taking place in the project zone and describe how the project will help to reduce these activities so that project benefits are not derived from illegal activities. Unlawful hunting and logging are identified as potential illegal activities that could affect the project’s climate, community and biodiversity impacts. In order to mitigate these, the project zone will have signs that inform any person within the area about the legal status of the land, “private property,” as well as signs that warm any person about the activities that should be avoided or are considered illegal such as, “no trespassing” and “hunting forbidden.” The project will also implement security measures to ensure that any individual within the project area complies with the laws. Nearby communities will be informed about the value of preserving biodiversity within the area and the projects located near natural reserves such as Rio Frio will coordinate with NGO’s such as FUNDAECO to improve mitigation methods. G5.6 Demonstrate that the project proponents have clear, uncontested title to the carbon rights, or provide legal documentation demonstrating that the project is undertaken on behalf of the carbon owners with their full consent. Where local or national conditions preclude clear title to the carbon rights at the time of validation against the Standards, the project proponents must provide evidence that their ownership of carbon rights is likely to be established before they enter into any transactions concerning the project’s carbon assets.

64
In every monitoring report PICA present to the VCS a Registration Deed of Representation in order to prove that the project proponents have the clear, uncontested title to the carbon rights. 82
82 2012 PICA VCS Registration and Issuance Representation

65
2 CLIMATE SECTION
CL1. Net Positive Climate Impacts
CL1. 1 Estimate the net change in carbon stocks due to the project activities using the methods of calculation, formulae and default values of the IPCC 2006 GL for AFOLU or using a more robust and detailed methodology. The net change is equal to carbon stock changes with the project minus carbon stock changes without the project (the latter having been estimated in G2). This estimate must be based on clearly defined and defendable assumptions about how project activities will alter GHG emissions or carbon stocks over the duration of the project or the project GHG accounting period. Without the project: 43,535 (t CO2-e) will be sequestered by existing vegetation (As
estimated in G2) Quantifying GHG emissions and/or removals for the project: Actual net GHG removals by sinks Applying AR-ACM0003 V 01, the actual net greenhouse gas removals by sinks is estimated using the following equation:
∆CACTUAL= ∆CP- GHGE
Where:
∆CACTUAL = Actual net greenhouse gas removals by sinks; t CO2-e
∆CP = Sum of the changes in above-ground and below-ground tree biomass, dead wood, litter and soil organic carbon stocks in the project scenario; t CO2-e
GHGE = Increase in GHG emissions as a result of the implementation of the proposed A/R CDM project activity within the project boundary; t CO2-e
Estimation of changes in the carbon stocks
Applying the methodology AR-ACM0003 V 01, the verifiable changes in the carbon stock in tree aboveground biomass and belowground biomass, litter, dead wood, and soil organic carbon within the project boundary are estimated using Eq. 13 of the methodology.
The increase in CO2 emissions from loss of existing woody biomass due to site-preparation is estimated using V 03 of the approved methodological tool: “Estimation of

66
emissions from clearing, burning and decay of existing vegetation due to implementation of an A/R CDM project activity”83
As allowed by AR-ACM0001 V 03, the change in carbon stocks in the litter and deadwood is conservatively neglected. Therefore, the changes in these carbon pools are set equal to zero.
GHG emissions resulting from removal of herbaceous vegetation, combustion of fossil fuel, fertilizer application, use of wood, decomposition of litter and fine roots of N-fixing trees, construction of access roads within the project boundary, and transportation attributable to the project activity shall be considered insignificant and therefore accounted as zero.
Estimation of changes in tree biomass
The mean carbon stock in aboveground and below-ground biomass per hectare is estimated on the basis of field measurements in permanent sample plots. The methods for gathering these field measurements are described in the PICA Monitoring Plan84. The allometric equation method of AR-ACM0001 V 03 is used to estimate changes in tree biomass as follows:
Step 1: To exclude the tapping surface of the rubber trees from measurement, the diameter at breast height (DBH) is conservatively measured at 1.30 m above “elephant foot” (area where graft is done) through field measurements of all trees above 5 cm DBH in permanent sample plots.
Step 2: Appropriate allometric equations linking DBH to above-ground biomass of living trees developed for H. brasiliensis in Guatemala is used to estimate above-ground biomass of the trees in permanent sample plots.85 The equations are shown below:
For trees above 5 cm DBH:
AG = 0.75*(DBH)2
Where:
AG = Above-ground live tree biomass; kg
DBH = Diameter at breast height measured at 1.3 m; m
For trees below 5 cm DBH:
AG = e (-2.547 + 0.913 DBH)
Where:
AG = Carbon in above-ground live tree biomass; kg
83 http://cdm.unfccc.int/methodologies/ARmethodologies/tools/ar-am-tool-08-v3.pdf 84 Annex M: Monitoring Forms and Procedures/PICA Monitoring Plan.pdf 85 Annex K: Scientific Literature references/Morales 2000

67
e = e number, base of natural logarithmic
Step 3: The carbon stock in above-ground biomass for each individual tree l of species j in the sample plot located in stratum I is estimated using the selected allometric equation applied to DBH determined in Step 1 and multiplying by the carbon fraction of dry matter for species j, and the carbon stocks are summed for the sample plot according to Eq. 19 of AR-ACM0001 V 03.
Step 4: The carbon stock in above-ground biomass is converted to the carbon stock in below-ground biomass via a root-shoot ratio according to Eq. 20 of AR-ACM0001 V 03.
Step 5: The total carbon stock in the biomass of all trees present in the sample plot sp in stratum i at time t is calculated according to Eq. 21 of AR-ACM0001 V 03.
Step 6: The mean carbon stock in tree biomass for each stratum is calculated according to Eq. 18 of AR-ACM0001 V 03.
The growth rate of H. brasiliensis for the project area was calculated based on measurements gathered from existing plantations86. This growth rate was applied to the plantation establishment plans detailed in the Management Plan87 to estimate changes in living tree carbon stocks in the project scenario88.
Table 9 Sum of the changes in living tree carbon stocks in the project scenario
Project Year
Year Sum of the project changes in living tree biomass per year (t
CO2-e)
Cumulative project changes in living tree biomass carbon
stocks (t CO2-e)
0 2007 0 -6,843
1 2008 0 -14,241
2 2009 0 -12,677
3 2010 0 -4,352
4 2011 10,303 17,812
5 2012 24,652 44,442
6 2013 38,532 84,991
7 2014 51,437 138,483
8 2015 63,061 203,637
86 Annex N: Calculation Spreadsheets/PICA_Annual biomass accumulation and net GHG Removals_august 25 87 Annex B: Management Plans 88 Annex N: Calculation Spreadsheets/PICA_Annual biomass accumulation and net GHG Removals_august 25

68
Project Year
Year Sum of the project changes in living tree biomass per year (t
CO2-e)
Cumulative project changes in living tree biomass carbon
stocks (t CO2-e)
9 2016 73,803 279,570
10 2017 83,635 365,372
11 2018 92,579 460,155
12 2019 100,660 563,053
13 2020 107,898 673,225
14 2021 114,317 789,852
15 2022 119,940 912,135
16 2023 124,789 1,039,301
17 2024 128,887 1,170,599
18 2025 132,257 1,305,300
19 2026 134,921 1,442,698
20 2027 136,903 1,582,109
21 2028 183,579 1,722,153
22 2029 139,967 1,862,121
23 2030 139,833 2,001,954
24 2031 138,826 2,140,781
25 2032 137,765 2,278,545
26 2033 136,156 2,414,702
27 2034 134,024 2,548,726
28 2035 131,390 2,680,116
29 2036 128,277 2,808,393
30 2037 124,708 2,933,101
31 2038 120,706 3,053,807
32 2039 116,294 3,170,101
33 2040 111,494 3,281,595
34 2041 106,328 3,387,923
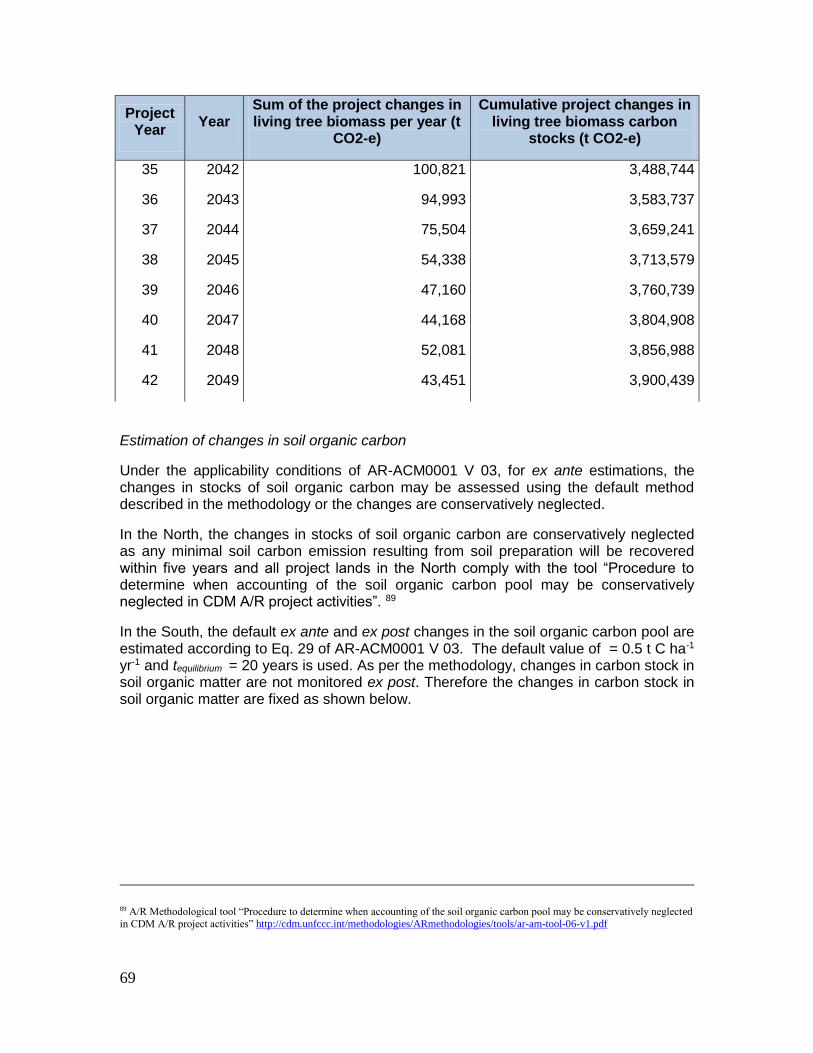
69
Project Year
Year Sum of the project changes in living tree biomass per year (t
CO2-e)
Cumulative project changes in living tree biomass carbon
stocks (t CO2-e)
35 2042 100,821 3,488,744
36 2043 94,993 3,583,737
37 2044 75,504 3,659,241
38 2045 54,338 3,713,579
39 2046 47,160 3,760,739
40 2047 44,168 3,804,908
41 2048 52,081 3,856,988
42 2049 43,451 3,900,439
Estimation of changes in soil organic carbon
Under the applicability conditions of AR-ACM0001 V 03, for ex ante estimations, the changes in stocks of soil organic carbon may be assessed using the default method described in the methodology or the changes are conservatively neglected.
In the North, the changes in stocks of soil organic carbon are conservatively neglected as any minimal soil carbon emission resulting from soil preparation will be recovered within five years and all project lands in the North comply with the tool “Procedure to determine when accounting of the soil organic carbon pool may be conservatively neglected in CDM A/R project activities”. 89
In the South, the default ex ante and ex post changes in the soil organic carbon pool are estimated according to Eq. 29 of AR-ACM0001 V 03. The default value of = 0.5 t C ha-1 yr-1 and tequilibrium = 20 years is used. As per the methodology, changes in carbon stock in soil organic matter are not monitored ex post. Therefore the changes in carbon stock in soil organic matter are fixed as shown below.
89 A/R Methodological tool “Procedure to determine when accounting of the soil organic carbon pool may be conservatively neglected
in CDM A/R project activities” http://cdm.unfccc.int/methodologies/ARmethodologies/tools/ar-am-tool-06-v1.pdf

70
Table 10 Sum of the changes in soil organic carbon in the South in the project scenario
Project Year
Year
Area Planted (ha)
Total Area
Planted (ha)
Change in soil
organic
carbon stocks (t CO2-e/ha)
Farm
Palmeras Los Patos Asunción El Horizonte
0 2007 25 339 29 393 0
1 2008 141 31 221 40 825 720
2 2009 94 33 953 1,513
3 2010 281 1,234 1,747
4 2011 1,234 2,262
5 2012 1,234 2,262
6 2013 1,234 2,262
7 2014 1,234 2,262
8 2015 1,234 2,262
9 2016 1,234 2,262
10 2017 1,234 2,262
11 2018 1,234 2,262
12 2019 1,234 2,262
13 2020 1,234 2,262
14 2021 1,234 2,262
15 2022 1,234 2,262
16 2023 1,234 2,262
17 2024 1,234 2,262
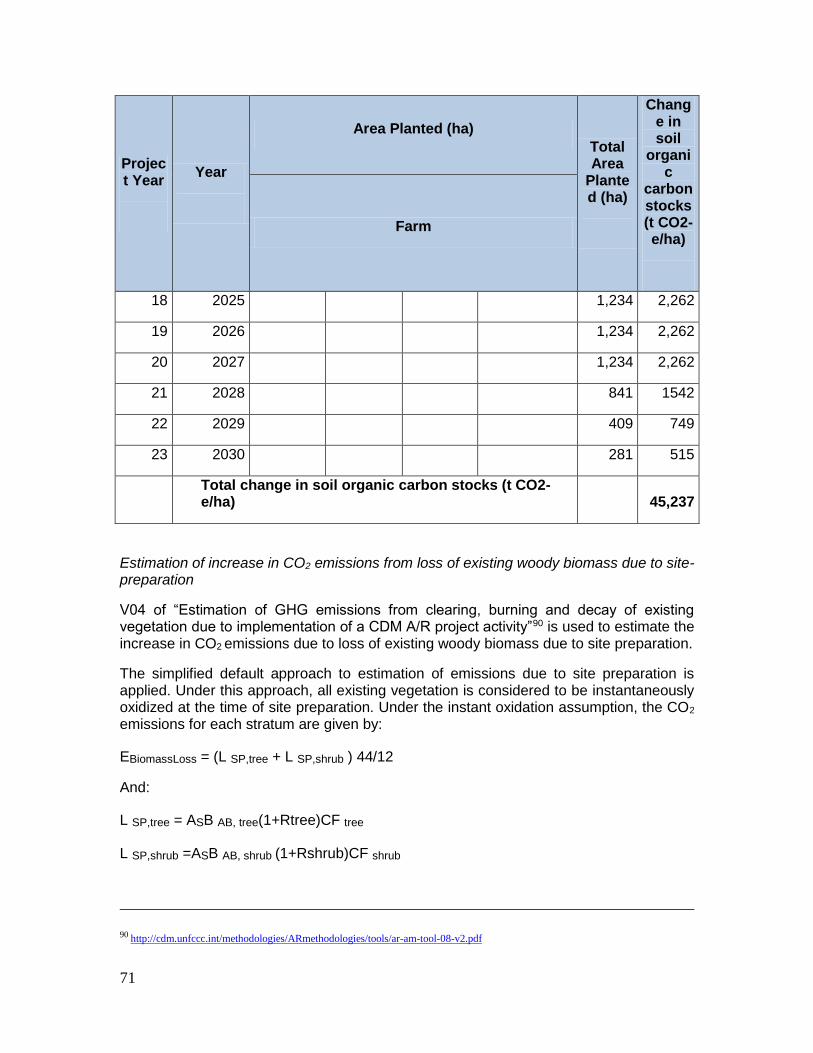
71
Project Year
Year
Area Planted (ha)
Total Area
Planted (ha)
Change in soil
organic
carbon stocks (t CO2-e/ha)
Farm
18 2025 1,234 2,262
19 2026 1,234 2,262
20 2027 1,234 2,262
21 2028 841 1542
22 2029 409 749
23 2030 281 515
Total change in soil organic carbon stocks (t CO2-e/ha) 45,237
Estimation of increase in CO2 emissions from loss of existing woody biomass due to site-preparation
V04 of “Estimation of GHG emissions from clearing, burning and decay of existing vegetation due to implementation of a CDM A/R project activity”90 is used to estimate the increase in CO2 emissions due to loss of existing woody biomass due to site preparation.
The simplified default approach to estimation of emissions due to site preparation is applied. Under this approach, all existing vegetation is considered to be instantaneously oxidized at the time of site preparation. Under the instant oxidation assumption, the CO2
emissions for each stratum are given by:
EBiomassLoss = (L SP,tree + L SP,shrub ) 44/12
And:
L SP,tree = ASB AB, tree(1+Rtree)CF tree
L SP,shrub =ASB AB, shrub (1+Rshrub)CF shrub
90 http://cdm.unfccc.int/methodologies/ARmethodologies/tools/ar-am-tool-08-v2.pdf

72
Where:
E BiomassLoss = Increase in CO2 emissions from loss of biomass in existing
vegetation as a result of site preparation; t CO2
L SP,tree = Carbon stock loss in existing tree vegetation as a result of site
preparation; t C
L SP,shrub = Carbon stock loss in existing shrub vegetation as a result of site
preparation; t C
AS = Area of stratum; ha
BAB = Average above-ground biomass stock of tree vegetation; t d.m. ha-1
R = Average root:shoot ratio appropriate for biomass stocks for tree vegetation; t d.m. ha-1
CF = Average carbon fraction of biomass for tree vegetation: IPCC default value for tree vegetation is 0.50
44/12 = Conversion factor: ratio of molecular weights of CO2 and C
No shrubs were found during the baseline measurements. Therefore, the sum of increases in GHG emissions from loss of biomass in existing vegetation as a result of site preparation is the carbon stock loss in existing tree vegetation. The sum of increases in GHG emissions from loss of biomass is given below.
Table 11 Sum of the increases in GHG emissions within the project boundary
Project Year
Year EBiomassloss (t CO2-e)
0 2007 6,991
1 2008 8,733
2 2009 4,123
3 2010 4,554
4 2011 0
5 2012 5,229
6 2013 1,155
7 2014 0
8 2015 0

73
Project Year
Year EBiomassloss (t CO2-e)
9 2016 0
10 2017 0
11 2018 0
12 2019 0
13 2020 0
14 2021 0
15 2022 0
16 2023 0
17 2024 0
18 2025 0
19 2026 0
20 2027 0
21 2028 0
22 2029 0
23 2030 0
24 2031 0
25 2032 0
26 2033 0
27 2034 0
28 2035 0
29 2036 0
30 2037 0
31 2038 0
32 2039 0
33 2040 0
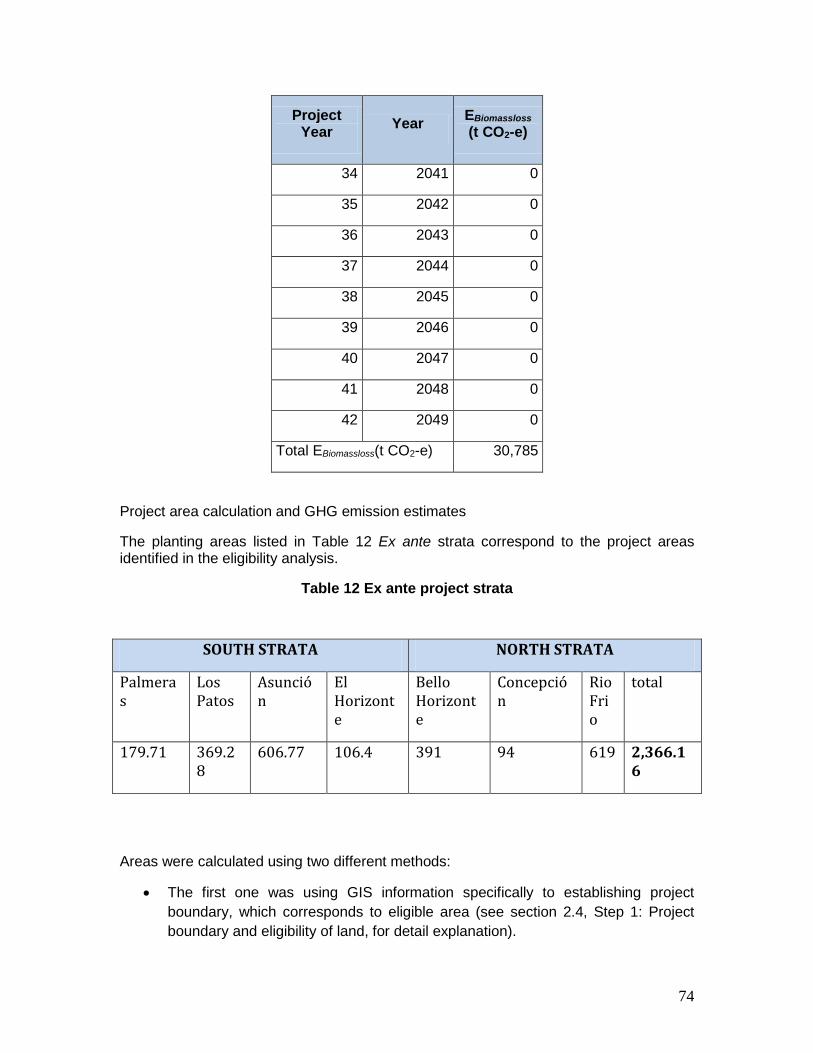
74
Project Year
Year EBiomassloss (t CO2-e)
34 2041 0
35 2042 0
36 2043 0
37 2044 0
38 2045 0
39 2046 0
40 2047 0
41 2048 0
42 2049 0
Total EBiomassloss(t CO2-e) 30,785
Project area calculation and GHG emission estimates
The planting areas listed in Table 12 Ex ante strata correspond to the project areas identified in the eligibility analysis.
Table 12 Ex ante project strata
SOUTH STRATA NORTH STRATA
Palmeras
Los Patos
Asunción
El Horizonte
Bello Horizonte
Concepción
Rio Frio
total
179.71 369.28
606.77 106.4 391 94 619 2,366.16
Areas were calculated using two different methods:
The first one was using GIS information specifically to establishing project
boundary, which corresponds to eligible area (see section 2.4, Step 1: Project
boundary and eligibility of land, for detail explanation).
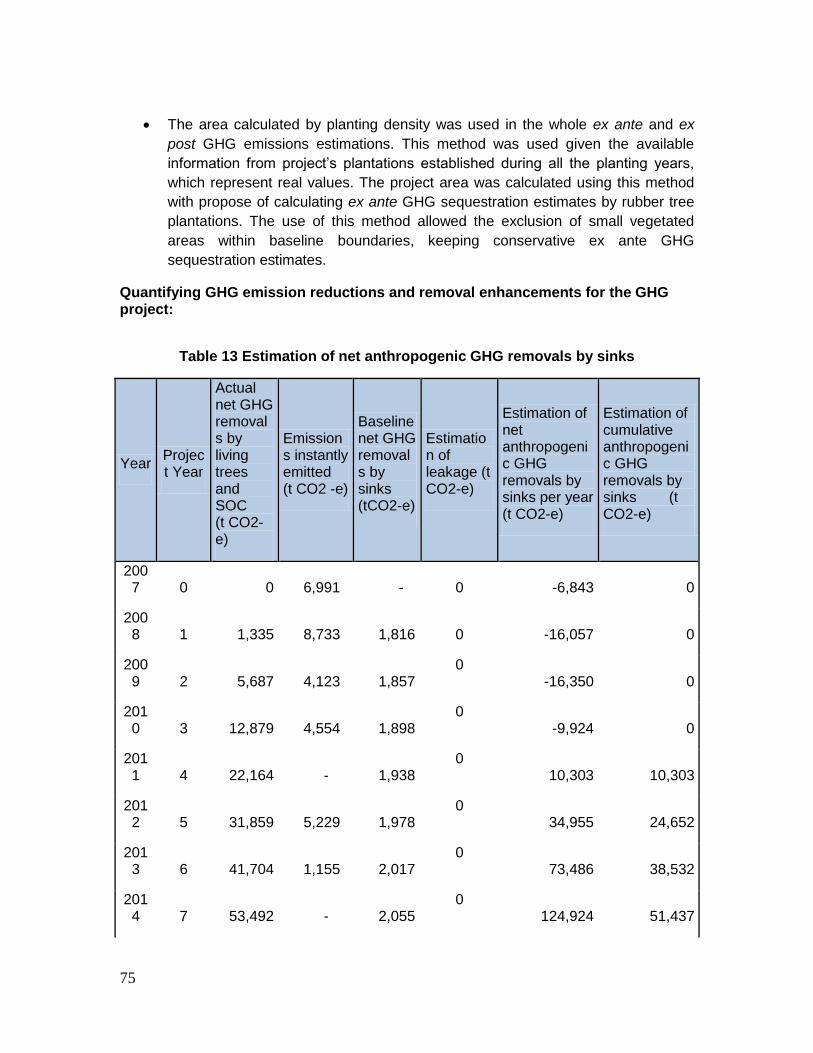
75
The area calculated by planting density was used in the whole ex ante and ex
post GHG emissions estimations. This method was used given the available
information from project’s plantations established during all the planting years,
which represent real values. The project area was calculated using this method
with propose of calculating ex ante GHG sequestration estimates by rubber tree
plantations. The use of this method allowed the exclusion of small vegetated
areas within baseline boundaries, keeping conservative ex ante GHG
sequestration estimates.
Quantifying GHG emission reductions and removal enhancements for the GHG project:
Table 13 Estimation of net anthropogenic GHG removals by sinks
Year Project Year
Actual net GHG removals by living trees and SOC (t CO2-e)
Emissions instantly emitted (t CO2 -e)
Baseline net GHG removals by sinks (tCO2-e)
Estimation of leakage (t CO2-e)
Estimation of net anthropogenic GHG removals by sinks per year (t CO2-e)
Estimation of cumulative anthropogenic GHG removals by sinks (t CO2-e)
2007 0 0 6,991 - 0 -6,843 0
2008 1 1,335 8,733 1,816 0 -16,057 0
2009 2 5,687 4,123 1,857
0 -16,350 0
2010 3 12,879 4,554 1,898
0 -9,924 0
2011 4 22,164 - 1,938
0 10,303 10,303
2012 5 31,859 5,229 1,978
0 34,955 24,652
2013 6 41,704 1,155 2,017
0 73,486 38,532
2014 7 53,492 - 2,055
0 124,924 51,437

76
Year Project Year
Actual net GHG removals by living trees and SOC (t CO2-e)
Emissions instantly emitted (t CO2 -e)
Baseline net GHG removals by sinks (tCO2-e)
Estimation of leakage (t CO2-e)
Estimation of net anthropogenic GHG removals by sinks per year (t CO2-e)
Estimation of cumulative anthropogenic GHG removals by sinks (t CO2-e)
2015 8 65,154 - 2,093
0 187,985 63,061
2016 9 75,933 - 2,130
0 261,787 73,803
2017 10 85,802 - 2,167
0 345,422 83,635
2018 11 94,783 - 2,203
0 438,002 92,579
2019 12 102,899 - 2,239
0 538,661 100,660
2020 13 110,172 - 2,274
0 646,559 107,898
2021 14 116,626 - 2,309
0 760,876 114,317
2022 15 122,283 - 2,343
0 880,816 119,940
2023 16 127,166 - 2,377
0 1,005,605 124,789
2024 17 131,298 - 2,411
0 1,134,493 128,887
2025 18 134,701 - 2,444
0 1,266,750 132,257
2026 19 137,398 - 2,476
0 1,401,671 134,921
2027 20 139,411 - 2,508
0 1,538,574 136,903
2028 21 140,044
0 1,722,153 183,579

77
Year Project Year
Actual net GHG removals by living trees and SOC (t CO2-e)
Emissions instantly emitted (t CO2 -e)
Baseline net GHG removals by sinks (tCO2-e)
Estimation of leakage (t CO2-e)
Estimation of net anthropogenic GHG removals by sinks per year (t CO2-e)
Estimation of cumulative anthropogenic GHG removals by sinks (t CO2-e)
2029 22 139,967
0 1,862,121 139,967
2030 23 139,833
0 2,001,954 139,833
2031 24 138,826
0 2,140,781 138,826
2032 25 137,765
0 2,278,545 137,765
2033 26 136,156
0 2,414,702 136,156
2034 27 134,024
0 2,548,726 134,024
2035 28 131,390
0 2,680,116 131,390
2036 29 128,277
0 2,808,393 128,277
2037 30 124,708
0 2,933,101 124,708
2038 31 120,706
0 3,053,807 120,706
2039 32 116,294
0 3,170,101 116,294
2040 33 111,494
0 3,281,595 111,494
2041 34 106,328
0 3,387,923 106,328
2042 35 100,821
0 3,488,744 100,821

78
Year Project Year
Actual net GHG removals by living trees and SOC (t CO2-e)
Emissions instantly emitted (t CO2 -e)
Baseline net GHG removals by sinks (tCO2-e)
Estimation of leakage (t CO2-e)
Estimation of net anthropogenic GHG removals by sinks per year (t CO2-e)
Estimation of cumulative anthropogenic GHG removals by sinks (t CO2-e)
2043 36 94,993
0 3,583,737 94,993
2044 37 75,504
0 3,659,241 75,504
2045 38 54,338
0 3,713,579 54,338
2046 39 47,160
0 3,760,739 47,160
2047 40 44,168
0 3,804,908 44,168
2048 41 52,081
0 3,856,988 52,081
2049 42 43,451
0 3,900,439 43,451
3,900,439
The project plans to sequester a total of 3,900,439 t CO2-e over 42 years through the reforestation of 2,366.16 ha with rubber trees.
CL1.2 Estimate the net change in the emissions of non-CO2 GHG emissions such as CH4 and N2O in the with and without project scenarios if those gases are likely to account for more than a 5% increase or decrease (in terms of CO2-equivalent) of the project’s overall GHG emissions reductions or removals over each monitoring period. Considering the limited combustible material in degraded lands, under the applicability condition of AR-ACM0001 V 03 fire is not likely to be a major source of GHG emissions in the site preparation. Furthermore, as defined in the Management Plans, burning will not be applied as a part of site preparation activities, and non-CO2 GHG emissions are assumed to be equal to zero in most of the farms. However it is important to state that

79
burning at site preparation is a common practice in Guatemala.91 Given that, isolated cases of burning occurred during site preparation in Palmeras and Los Patos farms. All project participants are working as part of a sustainable or responsible forest management certification commitment to reduce and avoid burning practice. An estimation of the sum of increases in GHG emissions within the project boundary is given in Table 11 under CL1.1 and it does not account for more than a 5% increase or decrease of the project’s overall GHG emission reductions or removals over each monitoring period. CL1.3 Estimate any other GHG emissions resulting from project activities. Emissions sources include, but are not limited to, emissions from biomass burning during site preparation, emissions from fossil fuel combustion, direct emissions from the use of synthetic fertilizers, and emissions from the decomposition of N-fixing species. Not applicable. All emissions have been added to the estimation of net anthropogenic GHG removals by sink in Table 9. CL1.4 Demonstrate that the net climate impact of the project is positive. The net climate impact of the project is the net change in carbon stocks plus net change in non-CO2 GHGs where appropriate minus any other GHG emissions resulting from project activities minus any likely project-related unmitigated negative offsite climate impacts (see CL2.3). A comprehensive estimate of net changes in carbon stocks due to project activities has been calculated in Table 9, CL1.1 showing the net climate impact of the project to be positive. CL1.5 Specify how double counting of GHG emissions reductions or removals will be avoided, particularly for offsets sold on the voluntary market and generated in a country with an emissions cap. The project is not seeking to generate any other environmental credits other than carbon credits associated with the VCS. FSC certification for project activities will not generate environmental credits.
CL2. Offsite Climate Impacts (‘Leakage’)
CL2.1 Determine the types of leakage that are expected and estimate potential offsite increases in GHGs (increases in emissions or decreases in sequestration) due to project activities. Where relevant, define and justify where leakage is most likely to take place. Methodology AR-ACM0001 V 03 allows accounting for leakage from the displacement of pre-project grazing activities. According to Eq. 32 of AR-ACM0001 V 03:
LK ActivityDisplacement = LK Conversion
91 Annex S: Site Preparation/Official information regarding fire.
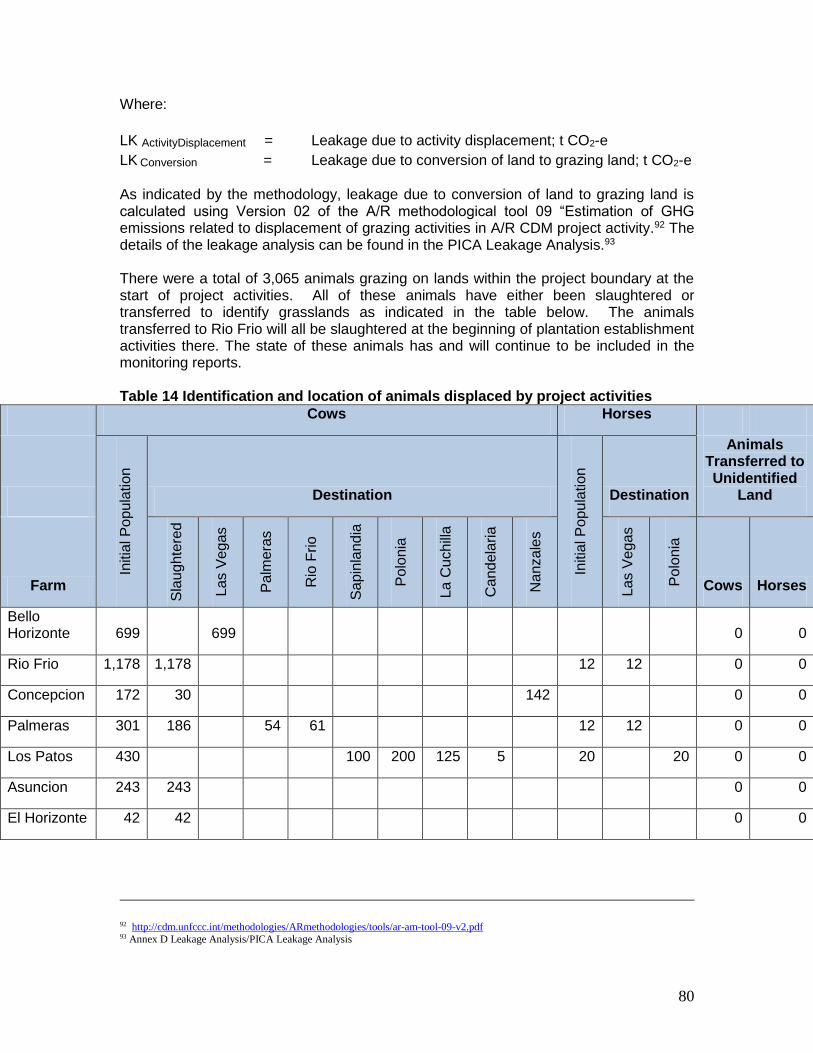
80
Where:
LK ActivityDisplacement = Leakage due to activity displacement; t CO2-e
LK Conversion = Leakage due to conversion of land to grazing land; t CO2-e
As indicated by the methodology, leakage due to conversion of land to grazing land is calculated using Version 02 of the A/R methodological tool 09 “Estimation of GHG emissions related to displacement of grazing activities in A/R CDM project activity.92 The details of the leakage analysis can be found in the PICA Leakage Analysis.93 There were a total of 3,065 animals grazing on lands within the project boundary at the start of project activities. All of these animals have either been slaughtered or transferred to identify grasslands as indicated in the table below. The animals transferred to Rio Frio will all be slaughtered at the beginning of plantation establishment activities there. The state of these animals has and will continue to be included in the monitoring reports. Table 14 Identification and location of animals displaced by project activities
Cows Horses
Initia
l P
opu
lation
Destination
Initia
l P
opu
lation
Destination
Animals Transferred to Unidentified
Land
Farm
Sla
ug
hte
red
Las V
ega
s
Pa
lme
ras
Rio
Frio
Sa
pin
land
ia
Po
lonia
La C
uchill
a
Ca
nd
ela
ria
Na
nza
les
Las V
ega
s
Po
lonia
Cows Horses
Bello Horizonte 699 699 0 0
Rio Frio 1,178 1,178 12 12 0 0
Concepcion 172 30 142 0 0
Palmeras 301 186 54 61 12 12 0 0
Los Patos 430 100 200 125 5 20 20 0 0
Asuncion 243 243 0 0
El Horizonte 42 42 0 0
92 http://cdm.unfccc.int/methodologies/ARmethodologies/tools/ar-am-tool-09-v2.pdf 93 Annex D Leakage Analysis/PICA Leakage Analysis

81
Total 3065 1679 699 54 61 100 200 125 5 44 24 20 0 0
As verified by records of animal sales, 186 cattle that were grazing within the project boundary at Palmeras farm at the start of the project activity were slaughtered.94 In the case of Concepción, Asunción, and El Horizonte, the sale of grazing animals to the slaughterhouse was verified through interviews with farm employees. In the case of Rio Frío farm, the animals currently grazing there will be sold to a slaughterhouse once plantation establishment begins in 2012. The state of these animals has and will continue to be included in monitoring report. As allowed by the methodology, it is assumed that the slaughter of these grazing animals does not result in leakage. The remaining animals have been transferred to identify grasslands outside of the project area.95 Therefore the estimated leakage resulting from the transfer of the grazing is determined using Step 4 of A/R Methodological Tool 09 V02 as follows: Each parcel of grassland that will receive displaced grazing activities in year t is identified and its area is determined using records maintained by the landowner. For each parcel, the number and type of grazing animals received in year t is also determined. Details on parcel areas and displaced animals are found in the PICA Leakage Analysis96. The total dry matter intake requirement of the displaced grazing animals was calculated using Eq. 4 of Tool 09 V02. The value provided in Table 3 of Annex D to Tool 09 V02 is used for cattle. For horses, was obtained from a study of DMIg of horses of comparable size to those found in the project area, as determined by interviews with land owners97. The area required to sustain the grazing activities displaced to each parcel in year t is calculated using Eq. 4 of Tool 09 V02. IPCC default values for ANPP were used to calculate the area required to sustain displaced grazing activities.98
94 Annex D: Leakage Analysis/Palmeras – Cattle Sale Receipts.pdf 95 Annex D: Leakage Analysisis/Los Patos – Transfer of Grazing Animals.pdf 96 Annex D Leakage Analysis\PICA Leakage Analysis 97 Annex K: Scientific Literature References/Dulphy et al. 1997 98 Table 3.4.2 IPCC GPG guidance

82
Table 15 Calculation of total GHG emissions related to overgrazing
Receiving Farm
Cows Horses
Tota
l A
rea R
equ
ire
d to
Gra
zin
g A
ctivitie
s (
ha)
Are
a o
f R
eceiv
ing P
arc
els
(ha)
An
nu
al L
ea
kag
e D
ue to
Ove
rgra
zin
g (
t C
O2-e
)
Nu
mb
er
of A
nim
als
Exis
tin
g in
Pa
rce
l
Nu
mb
er
of A
nim
als
Dis
pla
ced
to
Pa
rce
l T
ota
l A
nnu
al D
ry
Ma
tte
r In
take o
f
An
ima
ls in
Pa
rce
l (t
d.m
./yr.
) A
rea R
equ
ire
d to
Su
sta
in D
isp
laced
Gra
zin
g A
ctivitie
s
(ha)
Nu
mb
er
of A
nim
als
Exis
tin
g in
Pa
rce
l
Nu
mb
er
of A
nim
als
Dis
pla
ced
to
Pa
rce
l T
ota
l A
nnu
al D
ry
Matte
r In
take o
f
Dis
pla
ced
An
ima
ls (
t
d.m
./yr.
) A
rea R
equ
ire
d to
Su
sta
in D
isp
laced
Gra
zin
g A
ctivitie
s
(ha)
Las Vegas 0 699 6,506 793 0 24 88 11 804 1,080 0
Palmeras 0 54 503 61 0 61 98 0
Sapinlandia 0 100 931 114 0 114 290 0
Polonia 0 200 1,862 227 0 20 73 9 236 270 0
La Cuchilla 0 125 1,163 142 0 142 450 0
Candelaria 0 5 47 6 0 6 45 0
Nanzales 0 142 1,322 161 0 161 217 0
The total annual dry matter intake of animals, the area required to sustain displaced grazing activities, and the total leakage due to overgrazing resulting from displacement are calculated using the following default values. Table 16 Default values used to calculate leakage related to overgrazing
Description Value
Total Dry matter intake of grazing animal (kg d.m./head/day)
Cow29 9925.5
Horse 101
100Above-ground net primary productivity for Tropical - Moist & Wet Climate Zone (t d.m./ha/yr.) 8.21
99 CDM A/R methodological tool “Estimation of GHG emissions related to displacement of grazing activities in A/R CDM project
activity” 100 Annex K: Scientific Literature References/Dulphy et al. 1997

83
Description Value
101Reference soil organic carbon stocks for tropical moist volcanic soils (t C/ha) 701
102Stock change factor for management regime for severely degraded grassland 0.7
Conversion factor from C to CO2-e (t CO2-e/t C) 44/12
In none of the farms receiving grazing animals does the area required to sustain grazing activities exceed the total area of the receiving parcel. Therefore, the methodology allows the assumption that displacement of animals to these parcels does not result in leakage. CL2.2 Document how any leakage will be mitigated and estimate the extent to which such impacts will be reduced by these mitigation activities. As stated above most leakage will be mitigated through the slaughter of the displaced animals that were grazing before the establishment of the project. The remaining animals have been transferred to the identified grasslands outside of the project area.103 In none of the farms receiving grazing animals does the area required to sustain grazing activities exceed the total area of the receiving parcel. Therefore, the methodology allows the assumption that displacement of animals to these parcels does not result in leakage. Leakage due to grazing will be monitored ex post according to the monitoring plan. CL2.3 Subtract any likely project-related unmitigated negative offsite climate impacts from the climate benefits being claimed by the project and demonstrate that this has been included in the evaluation of net climate impact of the project (as calculated in CL1.4).
There were no identifiable unmitigated offsite climate impacts resulting from project activities. Positive climate impacts do not produce emissions in such a way that unmitigated primary or secondary leakage is likely to occur. Grazing animal displacement will be monitored in order to avoid any unexpected offsite impacts. Given this, unmitigated leakage has a value of “0” and net climate impacts remain unchanged. Net climate impacts continue to be defined as stated in CL. 1.4.
101 Table 3.4.2 IPCC GPG LULUCF 102Table 3.4.4 IPCC GPG LULUCF 103Los Patos – Transfer of Grazing Animals.pdf

84
CL2.4 Non-CO2 gases must be included if they are likely to account for more than a 5% increase or decrease (in terms of CO2-equivalent) of the net change calculations (above) of the project’s overall off-site GHG emissions reductions or removals over each monitoring period. No non-CO2 gases are expected to account for more than a 5% increase or decrease of the project’s overall offsite GHG emissions.
CL3. Climate Impact Monitoring
CL3.1 Develop an initial plan for selecting carbon pools and non-CO2 GHGs to be monitored, and determine the frequency of monitoring. Potential pools include aboveground biomass, litter, dead wood, belowground biomass, wood products, soil carbon and peat. Pools to monitor must include any pools expected to decrease as a result of project activities, including those in the region outside the project boundaries resulting from all types of leakage identified in CL2. A plan must be in place to continue leakage monitoring for at least five years after all activity displacement or other leakage causing activity has taken place. Individual GHG sources may be considered ‘insignificant’ and do not have to be accounted for if together such omitted decreases in carbon pools and increases in GHG emissions amount to less than 5% of the total CO2-equivalent benefits generated by the project.39 Non-CO2 gases must be included if they are likely to account for more than 5% (in terms of CO2-equivalent) of the project’s overall GHG impact over each monitoring period. Direct field measurements using scientifically robust sampling must be used to measure more significant elements of the project’s carbon stocks. Other data must be suitable to the project site and specific forest type. The purpose of monitoring is to gather information on plantation growth and project activities that will allow the estimation of VERs at the end of an accreditation period. As required by AR-ACM0001 V 03, monitoring activities include both gathering information from direct and indirect sources and performing calculations and making estimations to establish that commonly accepted principles of forest inventory and management are implemented as well as to determine GHG removals and emissions resulting from project activities. Monitoring of plantation establishment will occur continuously during the planting phase, gathering information from nurseries, clonal gardens, and plantation areas. Monitoring of plantation management will occur simultaneously and throughout the life of the plantations according to the occurrence of management activities. Leakage due to grazing will also be monitored ex post according to the monitoring plan. Monitoring of project and strata boundaries will occur annually. As allowed by AR-ACM0001 V 03, established project strata may be merged after future monitoring events if it is determined that the reasons for their establishment do not exist. Monitoring of permanent sample plots to determine GHG removals resulting from project activities will occur once at the beginning of the project following plantation establishment. Monitoring for timber production will take place every year. A professional team consisting of a coordinator, a field technician and a data analyst will conduct the monitoring. The coordinator will report directly to the Project Manager.

85
All monitoring activities will be implemented according to the Monitoring Plan,104 and personnel will be trained to ensure compliance with Standard Operating Procedures described in the Plan. Table 17: Data and parameters monitored / selecting relevant GHG sources, sinks
and reservoirs for monitoring or estimating GHG emissions and removals:
Data / Paramete
r:
Data unit:
Description:
Source of data to be used:
Monitoring
Frequency:
Description of
measurement methods
to be applied:
QA/QC procedures to be applied:
Plot ID Alpha-numeric
Identified and mapped for each stratum and for monitoring changes in carbon stocks
Measured
Once in the lifetime of the project, and check every five years for status.
Assign a code for each plot
Use SOP for permanent sample plots described in Monitoring Plan
Plot location
Geographic
Geographic coordinates
Measured
Once in the lifetime of the project
Measure point with a GPS unit and register in GIS database
Random verification of field data
Plot area Ha Area of permanent sample plots
Calculated
Once in the lifetime of the project
Calculated based on tree area
Random verification of field data
Total area of sample plots
Ha Total area of permanent sample plots
Calculated
Once in the lifetime of the project
Calculated based on tree area
Random verification of field data
DBH Cm Diameter at 1.3 m of trees in permanent sample plots
Measured
Annually Register in paper form and record values in project database
Use SOP for permanent sample plots described
104Annex M: Monitoring Forms and Procedures/PICA Monitoring Plan

86
Data / Paramete
r:
Data unit:
Description:
Source of data to be used:
Monitoring
Frequency:
Description of
measurement methods
to be applied:
QA/QC procedures to be applied:
in Monitoring Plan Train personnel in application of SOPs
Height m Height of trees in permanent sample plots
Measured
Annually Register in paper form and record values in project database
Use SOP for permanent sample plots described in Monitoring Plan Train personnel in application of SOPs
Year of monitoring activity
Number 1, 2, 3,...years following time zero
Measured
Annually
Register in paper form and record value in project database
Apply SOPs described in Monitoring Plan Train personnel in application of SOPs
Project area coordinates
Geographic
Geographic polygon coordinates to calculate the project area
Measured
Once at the beginning of the project
Measure points with a GPS unit and compare them with the VCS-CCB PD
Apply SOPs described in Monitoring Plan Train

87
Data / Paramete
r:
Data unit:
Description:
Source of data to be used:
Monitoring
Frequency:
Description of
measurement methods
to be applied:
QA/QC procedures to be applied:
personnel in application of SOPs
Stratum area coordinates
Geographic
Geographic polygon coordinates to calculate the project area
Measured
Once at the beginning of the project
Measure points with a GPS unit and compare them with the VCS-CCB PD
Apply SOPs described in Monitoring Plan Train personnel in application of SOPs
Area of project strata
ha Area of project strata defined by planting year and geographic location
Calculated
Once in the lifetime of the project
Calculated from GIS Analysis
Apply SOPs described in Monitoring Plan Train personnel in application of SOPs
Disturbed area
ha Any areas effected due to deforestation or plantation failure
Measured
Every five years
Field verification of project area, measurement of geographic coordinates with GPS, registration of geographic coordinates in GIS database, and
Apply SOPs described in Monitoring Plan

88
Data / Paramete
r:
Data unit:
Description:
Source of data to be used:
Monitoring
Frequency:
Description of
measurement methods
to be applied:
QA/QC procedures to be applied:
calculation of area from the GPS coordinates
Description of the monitoring plan Monitoring of project implementation: forest establishment and management Project boundary According to AR-ACM0001 V 03, the geographic coordinates of the project boundary and any stratification inside the boundary are established, recorded, and archived before the start of the project. As allowed by the methodology, this is achieved by using georeferenced spatial data in the form of Landsat images and orthorectified aerial photography. The project boundary will be monitored annually to verify that the project boundary remains the same. If any disturbance in the plantation occurs, the exact location of this area will be recorded to update the project boundaries and recalculate the project area. Plantation management Commonly accepted rubber plantation management techniques will be used by the project and the following practices will be monitored:
Weeding: date, planting block
Fertilizer application: date, planting block, type of fertilizer
Pruning: date, planting block. Pruning is done only with young lateral apical
steams up to 3 meters height. This is important to give a cylindrical basal trunk
for best tapping results. Pruning is done every week during the first year of the
plantation. This practice allows creating an incentive for the tree to grow vertically
as much as possible.
Disease and pest control: date, planting block, number of trees, type of disease
or pest, control method
Rubber harvest: date, volume, type of product, tapping quality
Fire control: date, planting block, associated area and number of trees
Sampling design and stratification The stratification strategy is presented in each Monitoring Plan. The two project strata of North and South will be further stratified by planting year and clone as appropriate. Post-stratification of the project area will be carried out after monitoring events if the change in carbon stocks is more or less variable than expected. Multiple strata may be grouped together in one combined stratum if it is determined that they have similar carbon stocks
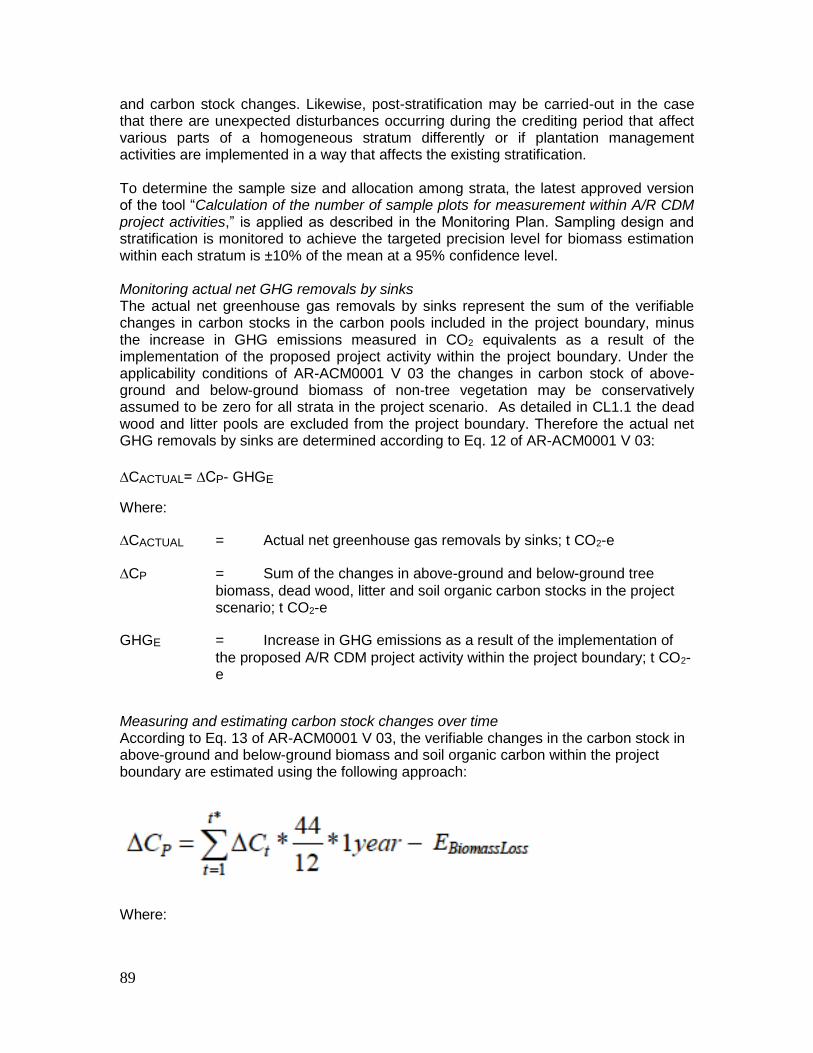
89
and carbon stock changes. Likewise, post-stratification may be carried-out in the case that there are unexpected disturbances occurring during the crediting period that affect various parts of a homogeneous stratum differently or if plantation management activities are implemented in a way that affects the existing stratification. To determine the sample size and allocation among strata, the latest approved version of the tool “Calculation of the number of sample plots for measurement within A/R CDM project activities,” is applied as described in the Monitoring Plan. Sampling design and stratification is monitored to achieve the targeted precision level for biomass estimation within each stratum is ±10% of the mean at a 95% confidence level. Monitoring actual net GHG removals by sinks The actual net greenhouse gas removals by sinks represent the sum of the verifiable changes in carbon stocks in the carbon pools included in the project boundary, minus the increase in GHG emissions measured in CO2 equivalents as a result of the implementation of the proposed project activity within the project boundary. Under the applicability conditions of AR-ACM0001 V 03 the changes in carbon stock of above-ground and below-ground biomass of non-tree vegetation may be conservatively assumed to be zero for all strata in the project scenario. As detailed in CL1.1 the dead wood and litter pools are excluded from the project boundary. Therefore the actual net GHG removals by sinks are determined according to Eq. 12 of AR-ACM0001 V 03:
∆CACTUAL= ∆CP- GHGE
Where:
∆CACTUAL = Actual net greenhouse gas removals by sinks; t CO2-e
∆CP = Sum of the changes in above-ground and below-ground tree
biomass, dead wood, litter and soil organic carbon stocks in the project scenario; t CO2-e
GHGE = Increase in GHG emissions as a result of the implementation of
the proposed A/R CDM project activity within the project boundary; t CO2-e
Measuring and estimating carbon stock changes over time According to Eq. 13 of AR-ACM0001 V 03, the verifiable changes in the carbon stock in above-ground and below-ground biomass and soil organic carbon within the project boundary are estimated using the following approach:
Where:

90
∆CP = Sum of the changes in carbon pools in above-ground and below-ground tree biomass and soil organic carbon in the project scenario; t CO2-e
∆Ct = Annual change in carbon stock in selected carbon pools for year t;
EBiomassLoss = Increase in CO2 emissions from loss of existing woody biomass
due to site-preparation and competition from forest planted as part of the project activity; t CO2-e
t = 1, 2, 3 ...t* years elapsed since the start of the project activity; yr.
44/12 = Ratio of molecular weights of CO2 and carbon; t CO2-e (1C)-1
For all project strata, the procedures described in “SOP Measurement of Carbon Stock Changes” will be used to determine the changes in above-ground and below-ground tree biomass using the allometric method allowed by AR-ACM0001 V 03.
For project strata in the South, changes in the carbon stock in the soil organic carbon pool will be estimated using the default method allowed by AR-ACM0001 V 03. For project strata in the North, changes in the soil organic carbon pool will be conservatively neglected.
Estimation of GHG emissions within the project boundary
Emissions from biomass burning and biomass loss as part of site preparation were estimated using the CDM methodological tool “Estimation of emissions from clearing, burning and decay of existing vegetation due to implementation of an A/R CDM project activity.” as prescribed by AR-ACM0001 V03.
Monitoring leakage
The A/R methodological tool “Estimation of GHG emissions related to displacement of grazing activities in A/R CDM project activity” was applied to determine leakage resulting from the displacement of grazing activities caused by implementation of project activities. The fate of the animals displaced from Rio Frio farm in 2012 with the commencement of planting activities will be monitored as stated in the monitoring plan to verify that they are in fact slaughtered or sold to an entity not involved in the A/R activity so that they do not cause leakage.
CL3.2 Commit to developing a full monitoring plan within six months of the project start date or within twelve months of validation against the Standards and to disseminate this plan and the results of monitoring, ensuring that they are made publicly available on the internet and are communicated to the communities and other stakeholders. A full monitoring plan, as per the accepted CDM A/R methodology has been created and can be seen in Annex M: Monitoring Forms and Procedures. A public summary of the monitoring plan was published in 2012 and can also be found in Annex M.

91
3 COMMUNITY SECTION
CM1. Net Positive Community Impacts
CM1.1 Use appropriate methodologies to estimate the impacts on communities, including all constituent socio-economic or cultural groups such as indigenous peoples (defined in G1), resulting from planned project activities. A credible estimate of impacts must include changes in community wellbeing due to project activities and an evaluation of the impacts by the affected groups. This estimate must be based on clearly defined and defendable assumptions about how project activities will alter social and economic wellbeing, including potential impacts of changes in natural resources and ecosystem services identified as important by the communities (including water and soil resources), over the duration of the project. The ‘with project’ scenario must then be compared with the ‘without project’ scenario of social and economic wellbeing in the absence of the project (completed in G2). The difference (i.e., the community benefit) must be positive for all community groups. As stated in section G1.5, there are no local communities living within the project area since the area is private property. In regards to the project zone, project activities have been evaluated so that they do not alter social and economic wellbeing, and avoid negative impacts on natural resources and ecosystem services that are identified as important by the communities. A ‘without project’ scenario consists of the project area’s continuation as pasture where the land would continue to degrade, as detailed in section G2.1. The project will improve soil conditions, provide jobs and worker benefits, will provide buffers and maintenance of zones with high conservation value, providing a positive impact for all community members. As detailed in the 2013 GAO Statistic Report, many jobs are created from the rubber plantations that employee nearby communities. These jobs provide at least minimum salary to all workers while providing them with specific training for their job and additional benefits such as life insurance and the option of belonging to a solidarity association that allows them to increase their savings and request loans at a lower interest rate. These benefits are not common practice in all Guatemala and will therefore create a positive difference for all affected community members. Details on community variables that will be monitored in order to ensure positive impacts can be found in section CM3.1. CM1.2 Demonstrate that no High Conservation Values identified in G1.8.4-6 will be negatively affected by the project. None of the planned project activities will have a negative impact on HCVs 4-6 and their associated sub-values in the Project Zone, as described and identified under section G1.8.4-6. The key threats to these HCVs are contamination of local water sources and vulnerability to forest fires. Recommended project activities have been created to address threats within the framework of the project including: preventing the loss of forest cover near water sources; preventing the construction of infrastructure near water source; creating a water management policy for personal waste; cleaning internal trails, especially in fire prone areas; patrolling the farm during seasons with high fire vulnerability; and placing signs around the farm perimeter with warning and precaution themes. None of the planned project activities will have a negative impact on HCVs in the Project Zone. Project activities are heavily focused on maintaining and enhancing forests and natural ecosystems, and thus the environmental, social, and cultural benefits derived from them. Such activities will have a strong positive impact on HCVs 4-6.

92
CM2. Offsite Stakeholder Impacts
CM2.1 Identify any potential negative offsite stakeholder impacts that the project activities are likely to cause. There are various communities located in the surrounding areas that could be impacted by the project. Stakeholder consultations were carried out in December of 2009 by a representative from the projects proponents as well as a neutral party to give communities information about the project as well as provide the opportunity for stakeholders to provide feedback regarding the impact of project activities on the communities. In the South, two stakeholder consultation meetings were held to include communities around the farms of Palmeras, Los Patos, El Horizonte, and Asuncion. A total of 91 persons from 26 communities participated in the meetings. In the North, one meetings as held to include communities around the farms of Bello Horizonte and Rio Frio. A total of 53 persons participated representing four communities. Following stakeholder consultations no potential negative impacts from project activities were identified. Most of the land was previously privately owned and used as pastureland for cattle. Therefore, any job lost due to the change in land use will be replaced due to the higher job demand from the rubber plantations. CM2.2 Describe how the project plans to mitigate these negative offsite social and economic impacts. There are no anticipated negative impacts. As stated above all jobs lost will be replaced due with the lands new use. CM2.3 Demonstrate that the project is not likely to result in net negative impacts on the wellbeing of other stakeholder groups. As described above in CM2.1, there are no anticipated negative stakeholder impacts caused by the project and the net effect on the community is projected to be positive. Also, all project proponents strive to have sustainable and/or responsible forest management and therefore maintain or enhance the long-term social and economic well being of forest workers and local communities. Management Plans are also open to changing environmental, social and economic circumstances. CM3. Community Impact Monitoring
CM3.1 Develop an initial plan for selecting community variables to be monitored and the frequency of monitoring and reporting to ensure that monitoring variables are directly linked to the project’s community development objectives and to anticipated impacts (positive and negative). An initial monitoring plan model has already been created in which certain variables where identified as well as frequency and reporting in order to monitor community impact. Such variables include employment, training, additional benefits, health, security, the existence of representative groups from the company, community benefits, and stakeholder communication. A detailed list of indicators for each variable can be found in

93
Annex M: Monitoring Forms and Procedures/Monitoring Impact/”Sistema de Monitoreo y Evaluación del Manejo Forestal Rio Frio”. Verification of community impact will be conducted every six months or once a year in the neighboring communities in the area of influence. Any supporting secondary data provided by the municipal government, the governmental institutions in the projects municipalities, as well as social advocates will also be considered. Community management plans will assess whether there are changes to baseline parameters, if the changes are related to the project activities and if mitigation measures are appropriate.
Table 18 Indicators of social impact monitoring
VARIABLE INDICATOR FORM OF
VERIFICATION
FREQUENCY OF
VERIFICATION
EMPLOYMENT
# of jobs generated Company payrolls Every 6 months
# of skilled jobs created Company payroll
determines skill by rank and pay
Every 6 months
At least 80% of workers are from the region
List of workers and graphs
Every 6 months
Classification of gender Classification by gender Every 6 months
EQUAL EMPLOYMENT OPPORTUNITY
HR Policies of equal opportunity employment
Policies available in the companies office
Every year
% of women employed Company records and
payroll Every 6 months
TRAINING
# of employees that received training
List of participation in training
Every 6 months
% of execution of Training Plan
Balance in training plans execution
Every 6 months
Level of knowledge acquired by the employees that
received training
Interviews with employees to wee level of training knowledge
Every 6 months
OTHER SERVICES
# and quality of additional benefits received by the farms
surrounding neighborhoods
Documents that prove requests and donations
were completed Every 6 months
# and quality of additional benefits received by
employees from company
Documents that prove requests and donations
were completed Every 6 months
# of workers who feel their lives have improved since
working in project area Interviews and surveys Every year
HEALTH
# of employees that count with life and health insurance
List of employees with insurance
Every 6 months
Life and health insurance cover direct family members
List of employees with insurance, insurance
contract Every 6 months
SECURITY % of workers that have and use work safety equipment
Records of control and visual verification
Every 6 months
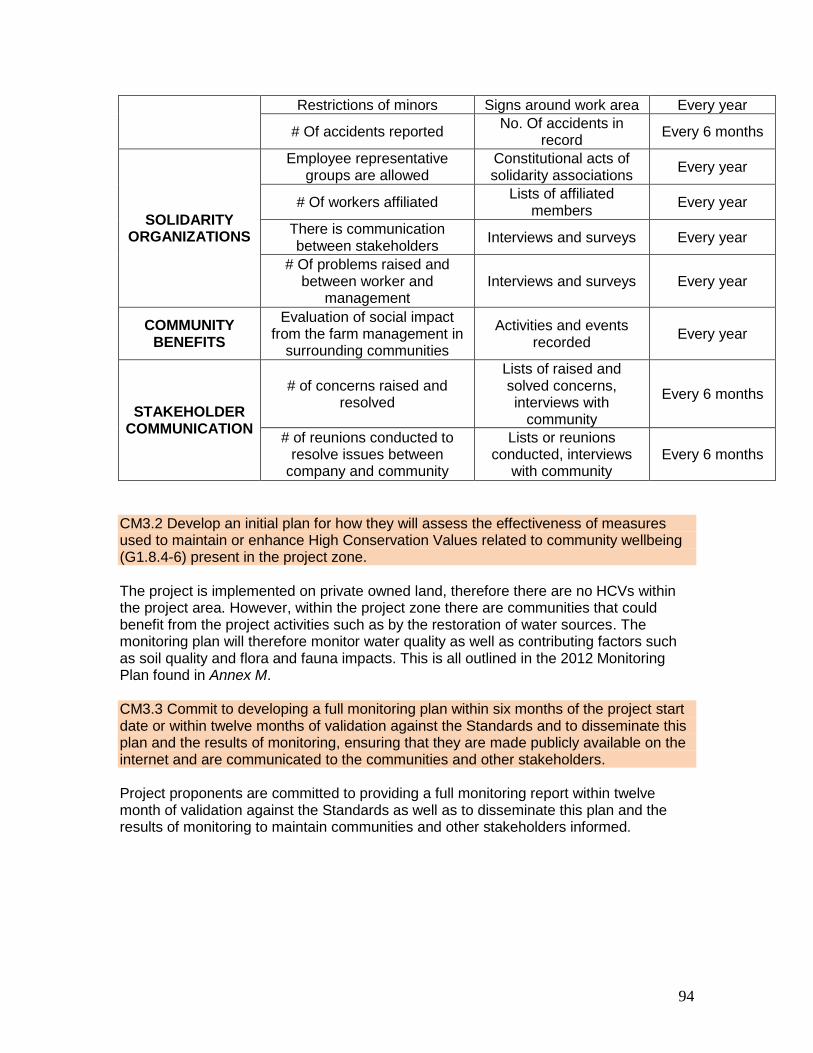
94
Restrictions of minors Signs around work area Every year
# Of accidents reported No. Of accidents in
record Every 6 months
SOLIDARITY ORGANIZATIONS
Employee representative groups are allowed
Constitutional acts of solidarity associations
Every year
# Of workers affiliated Lists of affiliated
members Every year
There is communication between stakeholders
Interviews and surveys Every year
# Of problems raised and between worker and
management Interviews and surveys Every year
COMMUNITY BENEFITS
Evaluation of social impact from the farm management in
surrounding communities
Activities and events recorded
Every year
STAKEHOLDER COMMUNICATION
# of concerns raised and resolved
Lists of raised and solved concerns, interviews with
community
Every 6 months
# of reunions conducted to resolve issues between
company and community
Lists or reunions conducted, interviews
with community Every 6 months
CM3.2 Develop an initial plan for how they will assess the effectiveness of measures used to maintain or enhance High Conservation Values related to community wellbeing (G1.8.4-6) present in the project zone. The project is implemented on private owned land, therefore there are no HCVs within the project area. However, within the project zone there are communities that could benefit from the project activities such as by the restoration of water sources. The monitoring plan will therefore monitor water quality as well as contributing factors such as soil quality and flora and fauna impacts. This is all outlined in the 2012 Monitoring Plan found in Annex M. CM3.3 Commit to developing a full monitoring plan within six months of the project start date or within twelve months of validation against the Standards and to disseminate this plan and the results of monitoring, ensuring that they are made publicly available on the internet and are communicated to the communities and other stakeholders. Project proponents are committed to providing a full monitoring report within twelve month of validation against the Standards as well as to disseminate this plan and the results of monitoring to maintain communities and other stakeholders informed.

95
4 BIODIVERSITY SECTION
B1. Net Positive Biodiversity Impacts
B1.1 Use appropriate methodologies to estimate changes in biodiversity as a result of the project in the project zone and in the project lifetime. This estimate must be based on clearly defined and defendable assumptions. The ‘with project’ scenario should then be compared with the baseline ‘without project’ biodiversity scenario completed in G2. The difference (i.e., the net biodiversity benefit) must be positive. Without the project, the land would remain as pastureland for cattle, which would have an adverse impact on biodiversity. As stated in the EIA (Annex C: Environmental Impact Assessment), project activities will allow regeneration and formation of habitats. Since the project area will have minimal disturbances, reforested areas will serve as refuge for birds and mammals. The project activities are designed around the existing remaining biodiversity and areas of HCV in order to enhance biodiversity. The project proponents believe that once the rubber cultivation has matured and serves as an adequate buffer and corridor, biodiversity within the project area will continue to increase over time. Efforts will also be made to support projects that seek improvements in biodiversity, such as the COLORES project that is raising awareness or the indicator species Amazona auropalliata near the southern farms of the project. This effort seeks to preserve and improve the environment by using this parrot as a symbol and indicator species. This species is also commonly taken captive and sold in the area. The project proponents will inform workers and nearby communities of this effort and how they can contribute. B1.2 Demonstrate that no High Conservation Values identified in G1.8.1-348 will be negatively affected by the project. All high conservation areas are clearly marked in the project maps and will be adequately labeled with numerous signs around the area in order to avoid any trespassing or illegal activity. More details can be found in section G3.6. B1.3 Identify all species to be used by the project and show that no known invasive species will be introduced into any area affected by the project and that the population of any invasive species will not increase as a result of the project. The project proponents will not use invasive species and the population of any invasive species will not increase as a result of the project. Reforestation will be achieved with the establishment of Hevea brasiliensis plantations. To further control soil erosion, the rubber trees are interplanted with the soil cover crop kudzu (Pueraria phaseoloides). Where conditions allow, annual crops including maize (Zea mays) and beans (Phaseolus vulgaris) are established between rows and maintained for the first three years of the plantation As stated in the 2013 VCS monitoring report, the project area under the farm Río Frío is not suitable for rubber and Eucalyptus will be planted instead. The Eucalyptus specie is more tolerant to seasonal flooding. B1.4 Describe possible adverse effects of non-native species used by the project on the region’s environment, including impacts on native species and disease introduction or
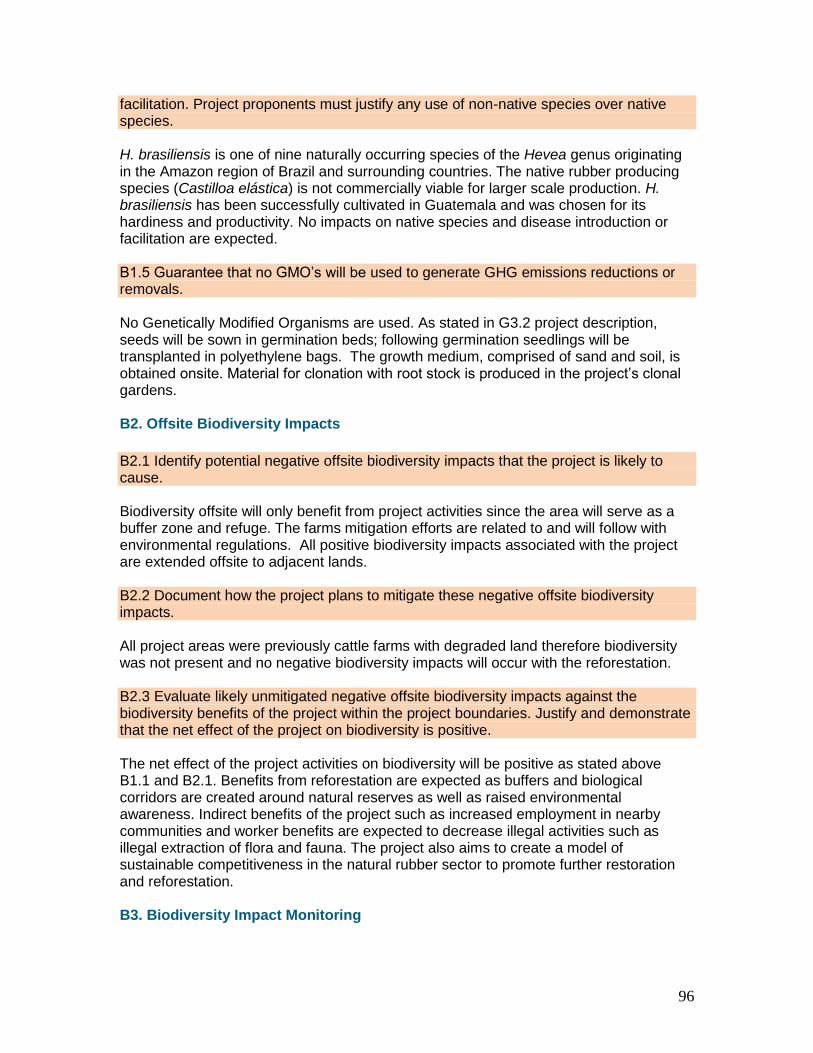
96
facilitation. Project proponents must justify any use of non-native species over native species. H. brasiliensis is one of nine naturally occurring species of the Hevea genus originating in the Amazon region of Brazil and surrounding countries. The native rubber producing species (Castilloa elástica) is not commercially viable for larger scale production. H. brasiliensis has been successfully cultivated in Guatemala and was chosen for its hardiness and productivity. No impacts on native species and disease introduction or facilitation are expected. B1.5 Guarantee that no GMO’s will be used to generate GHG emissions reductions or removals. No Genetically Modified Organisms are used. As stated in G3.2 project description, seeds will be sown in germination beds; following germination seedlings will be transplanted in polyethylene bags. The growth medium, comprised of sand and soil, is obtained onsite. Material for clonation with root stock is produced in the project’s clonal gardens. B2. Offsite Biodiversity Impacts
B2.1 Identify potential negative offsite biodiversity impacts that the project is likely to cause. Biodiversity offsite will only benefit from project activities since the area will serve as a buffer zone and refuge. The farms mitigation efforts are related to and will follow with environmental regulations. All positive biodiversity impacts associated with the project are extended offsite to adjacent lands. B2.2 Document how the project plans to mitigate these negative offsite biodiversity impacts. All project areas were previously cattle farms with degraded land therefore biodiversity was not present and no negative biodiversity impacts will occur with the reforestation. B2.3 Evaluate likely unmitigated negative offsite biodiversity impacts against the biodiversity benefits of the project within the project boundaries. Justify and demonstrate that the net effect of the project on biodiversity is positive. The net effect of the project activities on biodiversity will be positive as stated above B1.1 and B2.1. Benefits from reforestation are expected as buffers and biological corridors are created around natural reserves as well as raised environmental awareness. Indirect benefits of the project such as increased employment in nearby communities and worker benefits are expected to decrease illegal activities such as illegal extraction of flora and fauna. The project also aims to create a model of sustainable competitiveness in the natural rubber sector to promote further restoration and reforestation. B3. Biodiversity Impact Monitoring

97
B3.1Develop an initial plan for selecting biodiversity variables to be monitored and the frequency of monitoring and reporting to ensure that monitoring variables are directly linked to the project’s biodiversity objectives and to anticipated impacts (positive and negative). An initial monitoring plan model has already been created in which certain variables where identified as well as frequency and reporting in order to monitor biodiversity impact. Such variables include use of chemicals on the farm, use of exotic species, changes in land use in forested areas, areas of high conservation value, impacts on flora, impacts on fauna, impacts on the landscape, areas of protection, impacts on the soil, impacts on the water, and written guidelines on management. A detailed list of indicators for each variable can be found in Annex M: Monitoring Forms and Procedures/Monitoring Impact/”Sistema de Monitoreo y Evaluación del Manejo Forestal Rio Frio”. Verification of biodiversity impact will be conducted once a year. Any supporting secondary data provided by the municipal government, the governmental institutions in the projects municipalities, as well as environmental advocates will be considered. Environmental management plans will assess whether there are changes to baseline parameters, if the changes are related to the project activities and if mitigation measures are appropriate.
Table 18 Indicators of environmental impact monitoring
VARIABLE INDICATOR FORM OF
VERIFICATION
FREQUENCY OF
VERIFICATION
USE OF CHEMICALS
Type of chemicals used Results from registered unexpected inspections
Every year
USE OF EXOTIC SPECIES
No exotic species are introduced in the rubber
plantation
Field visits and results from inspections
Every year
CHANGES IN LAND USE OF
FOREST
There is no conversion of natural forest to rubber or other use
Field visits and results from inspections
Every year
FOREST OF HIGH
CONSERVATION VALUE
Results from maintenance measures of HCV forests outlined
in management plan
Summaries of results, activities or measures of execution according to
HCV management plans
Every year
IMPACTS ON FLORA
# of trees impacted by wind
Field visits Every year
Impacts on the natural flora from activities related to the use of
rubber trees
Field visits during use of rubber plantations
Every year
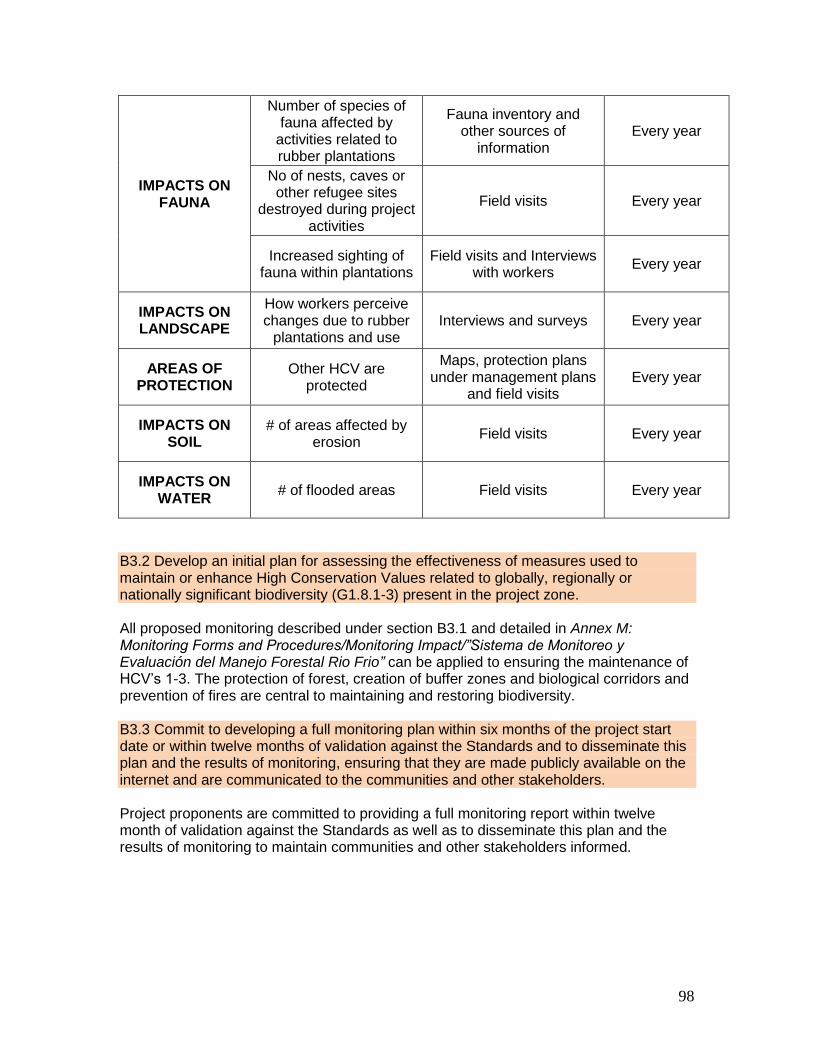
98
IMPACTS ON FAUNA
Number of species of fauna affected by
activities related to rubber plantations
Fauna inventory and other sources of
information Every year
No of nests, caves or other refugee sites
destroyed during project activities
Field visits Every year
Increased sighting of fauna within plantations
Field visits and Interviews with workers
Every year
IMPACTS ON LANDSCAPE
How workers perceive changes due to rubber
plantations and use Interviews and surveys Every year
AREAS OF PROTECTION
Other HCV are protected
Maps, protection plans under management plans
and field visits Every year
IMPACTS ON SOIL
# of areas affected by erosion
Field visits Every year
IMPACTS ON WATER
# of flooded areas Field visits Every year
B3.2 Develop an initial plan for assessing the effectiveness of measures used to maintain or enhance High Conservation Values related to globally, regionally or nationally significant biodiversity (G1.8.1-3) present in the project zone. All proposed monitoring described under section B3.1 and detailed in Annex M: Monitoring Forms and Procedures/Monitoring Impact/”Sistema de Monitoreo y Evaluación del Manejo Forestal Rio Frio” can be applied to ensuring the maintenance of HCV’s 1-3. The protection of forest, creation of buffer zones and biological corridors and prevention of fires are central to maintaining and restoring biodiversity. B3.3 Commit to developing a full monitoring plan within six months of the project start date or within twelve months of validation against the Standards and to disseminate this plan and the results of monitoring, ensuring that they are made publicly available on the internet and are communicated to the communities and other stakeholders. Project proponents are committed to providing a full monitoring report within twelve month of validation against the Standards as well as to disseminate this plan and the results of monitoring to maintain communities and other stakeholders informed.

99
5 GOLD LEVEL SECTION
GL3. Exceptional Biodiversity Benefits
GL3.1 Vulnerability Regular occurrence of a globally threatened species (according to the IUCN Red List) at the site: 1.1. Critically Endangered (CR) and Endangered (EN) species - presence of at least a single individual As stated in G1.7, the natural forest area within the “Rio Frio” farm is of special importance due to its proximity with the Natural Reserve “Cerro San Gil,” which makes it critical to environmental services generated for society and for biodiversity by the reserve. The Natural Reserve “Cerro San Gil” has is of high importance in terms of flora and fauna since it is the largest remaining humid tropical forest in Guatemala and hosts an extensive biological variety with rare endemic species. The “Rio Frio” farm’s forest is located within the buffer zone and natural reserve zone, all the way to the multiple use zone, with a small part within the National Rio Dulce Park. Due to its location, in the natural forest of the Cerro San Gil there are threatened and endangered species that were identified by FUNDAECO in a study of that area in September 2009. These species include: Mammals: Agouti paca, Alouatta palliata, Mazama americana, Odocoileus virginiana, Chinecters minimus, Herpailurus yaguaroundi, Leopardus pardales, Panthera onca, Puma concolor, Pteronotus dhabi, Tylomys nudicaudatus, Eira barba, Tamandua mexicana, Chrotopterus avritus, Potos flavus, Tapirus bairdii, and Tayassu tajacu (CONAP/FUNDAECO/TNC, 2006). Amphibians: Bolitoglossa odonnelli, Oedipina elongata, Eleutherodactylus chac, Eeleutherodactylus laticeps, Eleutherodactylus psephosypharus, eleutherodactylus rhoopics, Eleutheordactylus sanderonsi, and Ptychohyla panchoi (Campbell and Bucklin, 1998; Campbell in FUNDAECO, 2005; Campell, 1998) The majority of the species on this list are listed in the Red list of Threatened Species (CONAP, 2001). Reptiles: Iguana iguana, Boa constrictor, Amastridium veliferum, Imantodes cenchoa, Oxybelis aeneus, O fulgidus, Oxyrhopus petola, Pseustes poecilonotus, Rhadinaea decorata, Scaphiodontophis annulatus, Sibon dimidiata, Xenodon rabdocephalus, Clelia clelia, and Micrurus hippocrepis (Campbell 1998) All of the species on this list are listed in the Red list of Threatened Species (FUNDAECO, 2005) Birds: Among the variety of avifauna found in the Reserve there can be found: Electron carinatum, Tinamus major, Ramphastus sulfuratus, Psaracalius wagleri, Spizaetus melanoleucus, Spizaetus ornatos, Vireo leucophvys, and Sorcoramphus papa. (Bucklin, 1990 and Cerezo et al. 2005). Endemic Species: There are also high concentrations of endemic species, especially in the low lands near the water basins of the Las Escobas and Tameja rivers. Endemic trees and palms include: Rondeletia izabalensis, R. linguiformes, R. macrocalix,

100
Cytharaxylum guatemalense, Chamaedorea castillo‐ montii, C. falcifera, C. nationsiana, and C. stenocarpa Temporal Species: There are also temporal concentrations of animals. Studies show that there is a large diversity of birds within the protected area. The “Cerro San Gil’s” habitat maintains 407 species of birds, of which 24 species are considered regionally endemic and 59 species or sub-species are considered endemic to Mesoamerica. The species observed within the reserve represent 58% of the total species reported for Guatemala (Cerezo et al., 2005). Migratory species reported for Cerro San Gil represent the 28.7% of the protected areas avifauna, with 114 species (Cerezo and Ramirez, s.f.) In accordance with the 1,255 registered captures since 1993, the majority of species are represented by the family Tyrannidae with 47 species; followed by the family Parulidae with 35 species, Accipitridae with 27 species, and Trochilidae with 23 species (FUNDAECO, 2005; Cerezo et al., 2005). Of the species observed in the Reserve, residential and migratory, approximately 92 have been included in the list of threatened or endangered species. These species are part National Council of Protected Areas (CONAP) List of Endangered Species. In regards to migratory species, at least 17 of the 29 species of the family Parulidae have been reported as endangered species of with reducing populations (Cerezo, 2004)
101
WORK CITED
1. Bucklin. J. (1990). Studio Tétnico del Área de Protección Especial Cerro San Gil.
Guatemala. 181 pp. 2. Campbell, J. (1998) Amphibians and reptiles of Northern Guatemala, the
Yucatan, and Belize. University of Oklahoma Press, The Animal Natural History Series volume 4. United States of America. 400 pp
3. CATIE/PNUMA/Asdi. (2005). Plan de Manejo Integrado. Micorcuenca del Río Las Escobas. Proyecto: Planificación de la Rehabilitación, Manejo Ambiental y Desarrollo Costero en Nicaragua, Hondras y Guatemala después del Huracán Mitch. Guatemala, Guatemala. 84
4. Cerezo, A., y M. Ramírez (s.f.). Evaluación de la aifauna del area protectora de manantiales Cerro San Gil (enero 2000 a mayo 2001). Fundación para el Ecodesarrollo y la Conservación (FUNDAECO). Eco resultados parcial 1.4.3. Informe. 24 pp
5. Cerezo, A (2004). Parámetros demográficos y tendencias poblacioales de las ves de un bosque tropical de la region Caribeña de Guatemala. Fundación para el Ecodesarollo y la Conservación. Primera Exposición de/Taller de Investigacion Biológicas. Guatemala, Guatemala. 11-12 p.
6. Cerezo, A., M. Ramírez & H. Enriquez. (2005). Listado de aves de Cerro San Gil. Fundación para el Ecodesarrollo y la Conservación (FUNDAECO). Ciudad de Guatemala, Guatemala, Guatemala.
7. Chave et al. (2005). Tree allometry and improved estimation of carbon stosk and balance in tropical forests. Ecosystem Ecology
8. Consejo Nacional de Áreas Protegidas (CONAP). (2001). Listado de Especies de Fauna y Flora Silvestre Amenazadas de Extinción (Lista Roja de Fauna) (Lista Roja de Flora). Resolucion No. ALC/032-99 y Resolución No. ALC/033-99 55 pp.
9. CONAP, FUNDAECO, TNC. (2006). Plan Maestro de la Reserva de Manantiales Cerro San Gil. Guatemala. 208 pp.
10. Departamento de Salarios, Dirección de Estadísticas Laborales, Ministerio de Trabajo y Previsión Social. (2009). Informe del Dirección de Estadísticas Laborales, Conteniendo Datos Estadísticos Recopilados Sobre Salarios, Periodo 2006, 2007 y 2008.
11. Dulphy et al. (1997). Compared feeding patterns in ad libitum intake of dry forages by horses and sheep
12. Ecotrust. (2006). An Ecosystem-based Forestry Investment Strategy for the Coastal Temperate Rainforests of North America.
13. Emmel, T. (1983). Ecología y biología de poblaciones. Editoraial Interamericano. México, D.F., México. 40 pp
14. Fundación para el Ecodesarrollo y la Conservación (FUNDAECO). (2005) Plan Maestro 2004-2008 de la Reserva Protctora de Mananctiales Cerro San Gil. Documento Borrador. Izabal, Guatemala. 75 pp
15. Global Environment Fund and International Forestry Investment Advisors. (2005). A Global Emerging Markets Forestry Investment Strategy.
16. Hastings Fund Management. (2009). Hastings Hancock International Timberland Fund Annual Report.
17. Holdridge, L.R. (1964). Life Zone Ecology. Trop. Scie. Center, San José, Costa Rica.
18. IARNA/URL, and IIA. (2004). Informe sobre el estado del ambiente y bases para su evaluación sistemática. Perfil Ambiental de Guatemala. Guatemala:

102
Universidad Rafael Landívar, Instituto de Agricultura Recursos Naturales, Instituto de Incidencia Ambiental.
19. Instituto Geográfico Nacional (IGN).Copilación crítica, Francis Fall. Guatemala. CA-1981 Tomo II. Los datos poblacionales responden al VII Censo general de la población, realizado por la dirección general de estadística. 1 abril 1964
20. Instituto de Agricultura, Recursos Naturales y Ambiente – Universidad Rafael Landívar e Instituto de Incidencia Ambiental. (2006). Perfil Ambiental de Guatemala 2006
21. Institution National de Estadística, Guatemala C.A. Ethnic and gender distribution in the departments of Suchitepéquez, Alta Verapaz, and Izabal. (2011). Retrieved from http://www.ine.gob.gt/np/poblacion/
22. López, C.M. (197). Informe Final de Ejercicio Profesional Supervisado (EPS). Universided San Carlos de Guatemala (USAC). Facultad de Ciencias Químicas y Farmacia. Escuela de Biología. Guatemala, Guatemala. 105 pp.
23. Ministerio de Agricultura, Ganaderia y Alimentacion de Guatemala. (2006). Mapa de cobertura vegetal y uso de la tierra República de Guatemala Año 2003.
24. Morales, F.A. (2000). Estimación de ecuación de biomasa para cuantificar el barbono que fija el árbol de hule (Hevea brasilensis) en las plantaciones de la costa sur de Guatemala. Universidad de San Carlos de Guatemala, Centro Universitario de Occidente, Division de Ciencia y Tecnologia, Facultad de Agronomia
25. Recavarren, P. (2007). Marupa plantation volume accumulation study in the Loreto Region.
26. Reyes et al. (1992). Wood densities of tropical tree species. United States Department of Agriculture.
27. Rosales, O. (1996). Propuesta de manejo de tierras de uso agrícola en la zona de uso multiple del area de protección especial del Cerro San Gil, Departamento de Izabal. Universidad de San Carlos de Guatemala (USAC). Faultd de Agronomía. Instituto de Investigaciones Agronómicas. Tesis de grado. Guatemala, Guatemala. 97 pp.
28. Simmons, C; Tarano, JM; Pinto, JH. (1959). Clasificación de reconocimiento de los suelos de la República de Guatemala. Guatemala, José de Pineda Ibarra. 1000 p.