Embed Size (px)
Citation preview
NEW YORK UNIVERSITY
SUMMER INTERN - 2018
PROJECT REPORT
CAPACITY ANALYSIS OF 5G SYSTEMS Submitted by
Agrim Bari Roll No. 150057
Department of Electrical Engineering Indian Institute of Technology
Kanpur – 208016 Email id: [email protected]
Under Guidance of Prof. Shivendra Panwar
Department of Electrical and Computer Engineering New York University
Tandon School of Engineering – 11201 Phone No: 1.646.997.3740
Email id.: [email protected]

Capacity analysis of 5G systems
CERTIFICATE This is to certify that the project entitled “Capacity analysis of 5G systems” submitted by Agrim Bari as part
of Summer Internship-2018 at offered by the NYU Tandon School of Engineering, is a bonafide record of the
work done by him under my guidance and supervision of Prof. Shivendra Panwar at the New York University,
Tandon School of Engineering from 21st May 2018 to 15th July 2018
Prof. Shivendra Panwar
2
Capacity analysis of 5G systems
TABLE OF CONTENTS Headings ……………………………………………………………………………………………………………………page. ABSTRACT 4 INTRODUCTION 5-7 SIMULATION SETUP 8 WORK DONE 9-14 SIMULATION RESULTS 15-19 FUTURE WORK 20 CONCLUSION 21 REFERENCES 22
3

Capacity analysis of 5G systems
ABSTRACT
Millimeter-wave (mmWave) propagation is known to be severely affected by the blockage of the
line-of-sight (LOS) path. In contrast to microwave systems at shorter mmWave wavelengths, such
blockages may be due to mobile blockers and the user's own body. This blockage results in the
wireless channel to alternate between the blocked and non-blocked LOS states, which ultimately
results in reduced data rates. For the same, Macro-diversity of base stations (BSs) has been
considered a promising solution, where the user equipment (UE) can handover to other available
BSs. However, any analytical model or simulation for blockage events in this setting is unknown. This
is what we explore in this project, whereby using the Random Way-Point Mobility Model, the effect of
mobile blockers can be understood. Since a single blocker can block multiple LOS links
simultaneously, there is also a need to consider the correlation factor in the model. However, the
gains in the capacity will come at the expense of increased handover (HO) rates which need to be
modelled based on Received Signal Strength along with Hysteresis and threshold, and at the same
time outage in such handoff scenarios will be modelled as the reception of low data rate at the UE
end. To append, we have also included the effect of self-blockage in our study. As a result, we have
tried to understand in the scenarios of low latency applications what will be a limiting factor in
deciding the minimum density of BS.
4

Capacity analysis of 5G systems
INTRODUCTION BLOCKING objects – blockages – in the form of moving cars, trucks, and people can severely impact the
performance of cellular networks by reducing the signal strength and thus SNR. Blockage’s effect is more
severe at higher frequencies including mm-wave, due to higher penetration losses and reduced diffraction.
Therefore, Los connections are highly desirable for mm-wave. In addition, a user can block the otherwise Los
signals due to its own body, hurting the overall reliability of the communication links, and the effect is more
pronounced when dynamic blockers with correlation are being considered along with the self blockage. To
overcome blockage effects, macro-diversity can be leveraged whereby a user is connected to multiple BSs
simultaneously, which clearly increases the chance for a Los connection.. m
This work presents a blockage model for Los using stochastic geometry. In particular, our contributions are as
follows:
1. We developed a model based on random waypoint mobility for dynamic blockers, where the blockers
can be simultaneously blocking more than one link at the same instance.
2. We incorporated the effect of path loss as the signal is transmitted, and then is being received by the
UE, based on the 3GPP Technical Report.
3. We have made use of the shadow fading in the NLoS links based on the number of blockers, instead of
making use of a log-normal distribution
4. We have inculcated the effect of handoffs which is based on the rule of Received Signal Strength with
hysteresis and threshold
5. We have incorporated the effect of handoff delays by assuming that the UE is in an outage when such a
handoff is being initiated.
A. Background and Related Work: The importance of dynamic blockage of the Los path in mmWave
deployments has recently been shown to be one of the critical design factors that affect system performance
[1]–[3]. Dynamic blockage by small mobile objects within the environment, such as moving people, cars, trucks,
etc., introduces additional uncertainty in the channel, which may eventually result in sharp drops (up to 30 ∼
40 dB) in the received signal strength [5] The blockage frequency, duration, and the resultant degradation of
signal strength affect the performance of a mmWave system.
Recent work has studied the impact of Los blockage in urban microwave systems [6]. However, the results do
not directly apply to mmWave systems as the objects of interest in mmWave and microwave systems are of
fundamentally different nature and hence would require different models for their accurate representation.
5

Capacity analysis of 5G systems
Indeed, in addition to self blockage by a dynamic blocker, one also needs to take into account the self blockage
by the user itself.
The Los blockage by humans in mmWave systems has been evaluated through simulation studies in [7]. In [8],
a Los blockage model where humans are represented as cylinders of random width and height was proposed.
However, there the authors assumed that both the users and the blockers are stationary. In addition to
academic work, the 3GPP community is currently exploring various options for modelling the impact of human
blockage appropriately [6] as though in the current work we have assumed the signal to be completely
blocked.
B. System Model: Our System Model consists of the following settings:
● BS Model: The mmWave BS locations are modelled as a homogeneous Poisson Point Process(PPP) with
density λT. Consider a disc of Radius R with UE located at the center of the disc. Thus, the number of
BSs M inside the disc follows a Poisson distribution with parameter λTπR2
Fig-1: Ref: Limited by Capacity or Blockage? A millimetre-wave Blockage Analysis by Ish Kumar Jain et al.
Given the number of BSs M inside the disc, we have a uniform distribution of BS locations.
● Self Blockage Model: The user blocks a fraction of BSs due to his/her own body. The self Blockage Zone
defined as a sector of the disc making an angle ω. Thus all the BSs in the self blockage zone are
considered blocked.
6

Capacity analysis of 5G systems
Fig-2: Self Blockage zone: Ref: Limited by Capacity or Blockage? A millimetre-wave Blockage Analysis by Ish Kumar Jain et al.
● Dynamic Blockage Model: The blockers are distributed according to a homogeneous PPP with
parameter ΛB , where they are assumed to follow a random waypoint mobility model, and it is assumed
that they can simultaneously block more than one Los link.
Fig-3: Dynamic Blockage: Ref: Limited by Capacity or Blockage? A millimetre-wave Blockage Analysis by Ish Kumar Jain et al.
SIMULATION SETUP
7

Capacity analysis of 5G systems
1. Matlab Simulations 2. Random Waypoint Mobility Model (blockers) 3. Random Number of Base Stations and random Locations
Parameters Values
Radius R 100m
Velocity of Blockers 10m/s
Height of Blockers 1.8m
Height of User Equipment hR 1.5m
Height of APs hT 5m
Density of Blockers 0.05 bl/m2
Density of AP 200*10^-6 AP/m2
Frequency of operation 28Ghz
Self Blockage Angle 60 degrees
Table 1: Simulation Parameters
8

Capacity analysis of 5G systems
WORK DONE Dynamic Blockage with the effect being correlated
We have implemented the effect of dynamic blockage by making use of the Random Waypoint Mobility model, for the blocker being modelled as a truck in motion with blocker parameters being:
Length of the Blocker(L): 13.6m The velocity of the Blocker(V): 10m/s Duration of Blockage: D = (L)/( V*cos(Ѱ-Θ) )
Fig- 4: Blockage Model for computing the duration of blockage
Fig:5: Typical Number of Blockages as time proceeds for each of the base station with the inclusion of Correlation
Incorporated a model for Path loss
9

Capacity analysis of 5G systems
Based on the 3GPP technical report, a channel model is being simulated in order to evaluate the path loss the
signal suffers as it moves from the transmitter end to the UE end, but at the same time the shadowing effect
for the NLoS path is based on the number of blockers[4]
PLUMi−LOS = PL1 10m≤d2D ≤d′BP and σSF =4 for LOS
PLUMi−LOS = PL2 d′BP ≤d ≤5km where the parameter d′BP Is as explained in [6]
With PL1 =32.4+21*log10(d3D)+20*log10(fc) and
PL2 =32.4+40*log10(d3D)+20*log10(fc) −9.5log ((d′BP)2 +(hBS −hUT )2)
PLUMi−NLOS = max(PLUMi−LOS , PL′UMi−NLOS ) for 10m≤d2D ≤5km and SF=Pt*uniform(0,1)*(No. Of Blockers)
With PL′UMi − NLOS = 35.3log10(d3D)+ 22.4+21.3log10(fc)−0.3(hUT −1.5)
Fig6::The channel Model
Effect of Handoffs is being considered
10
Capacity analysis of 5G systems
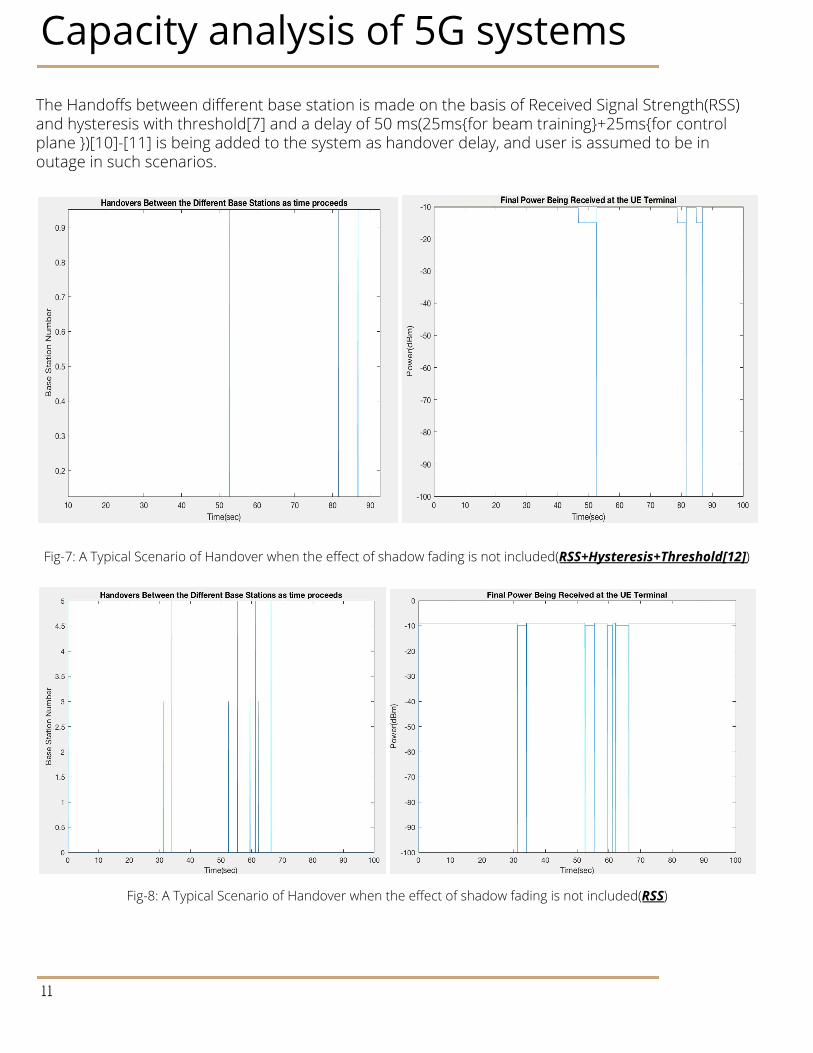
The Handoffs between different base station is made on the basis of Received Signal Strength(RSS) and hysteresis with threshold[7] and a delay of 50 ms(25ms{for beam training}+25ms{for control plane })[10]-[11] is being added to the system as handover delay, and user is assumed to be in outage in such scenarios.
Fig-7: A Typical Scenario of Handover when the effect of shadow fading is not included(RSS+Hysteresis+Threshold[12])
Fig-8: A Typical Scenario of Handover when the effect of shadow fading is not included(RSS)
11
Capacity analysis of 5G systems
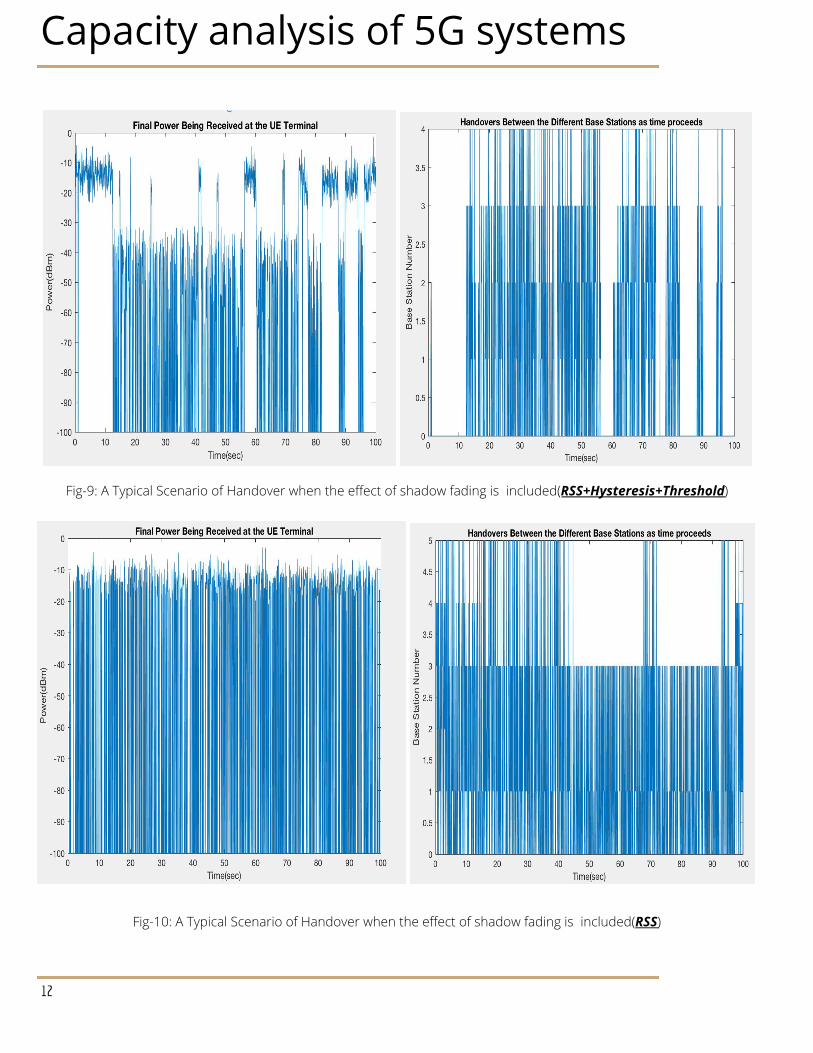
Fig-9: A Typical Scenario of Handover when the effect of shadow fading is included(RSS+Hysteresis+Threshold)
Fig-10: A Typical Scenario of Handover when the effect of shadow fading is included(RSS)
12
Capacity analysis of 5G systems
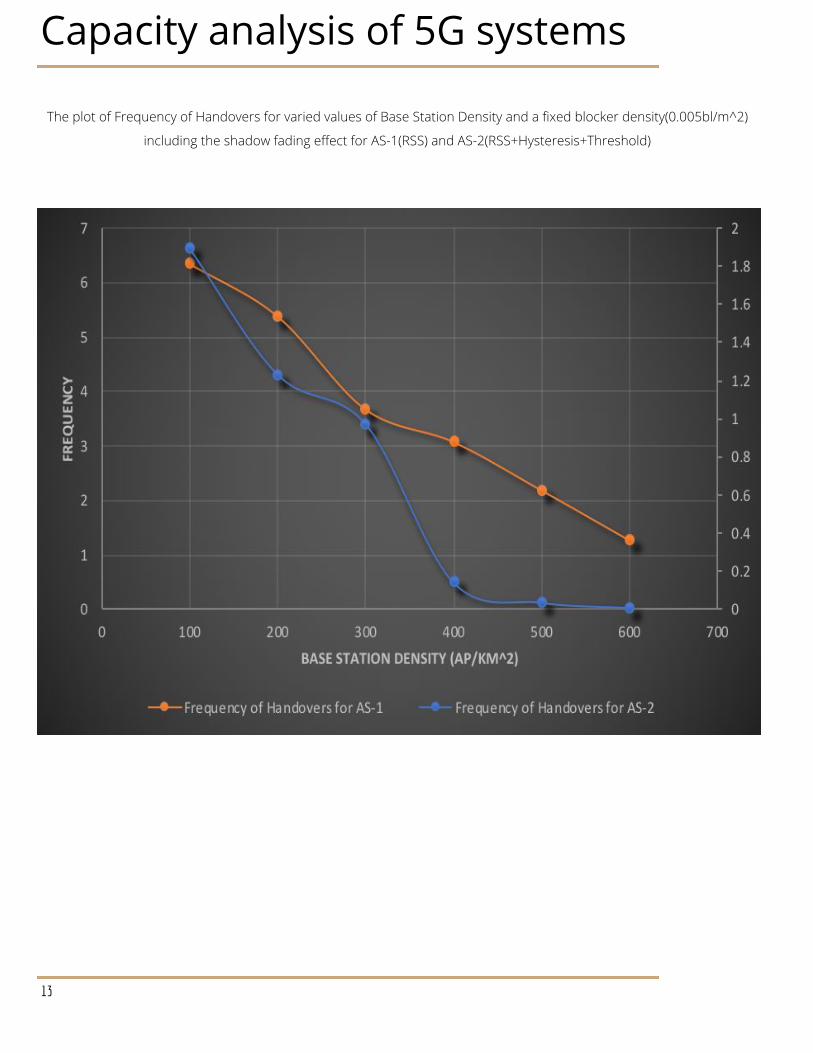
The plot of Frequency of Handovers for varied values of Base Station Density and a fixed blocker density(0.005bl/m^2)
including the shadow fading effect for AS-1(RSS) and AS-2(RSS+Hysteresis+Threshold)
13
Capacity analysis of 5G systems
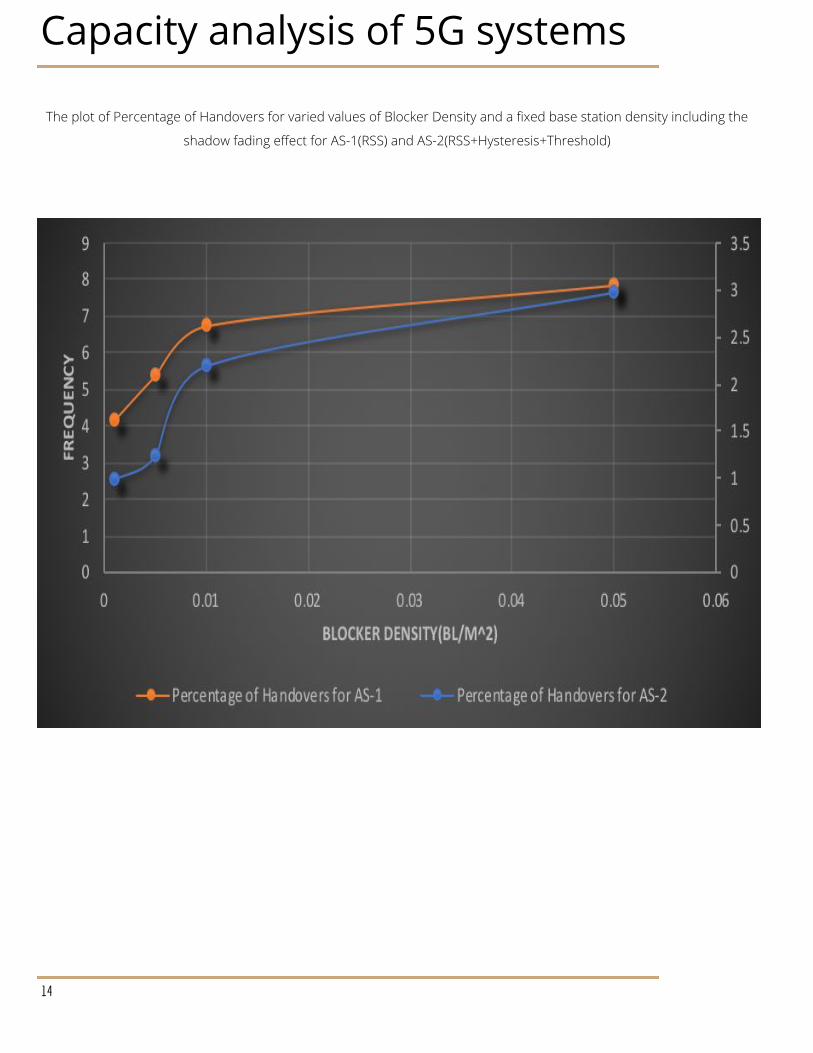
The plot of Percentage of Handovers for varied values of Blocker Density and a fixed base station density including the
shadow fading effect for AS-1(RSS) and AS-2(RSS+Hysteresis+Threshold)
14
Capacity analysis of 5G systems
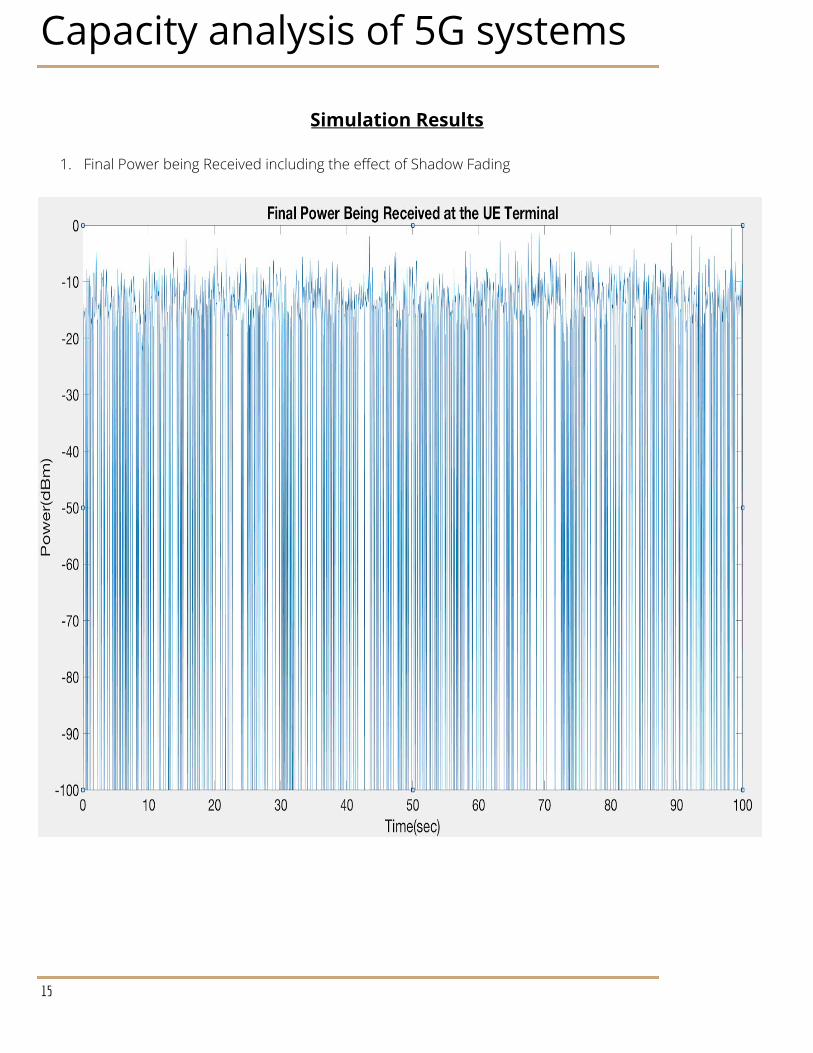
Simulation Results
1. Final Power being Received including the effect of Shadow Fading
15
Capacity analysis of 5G systems
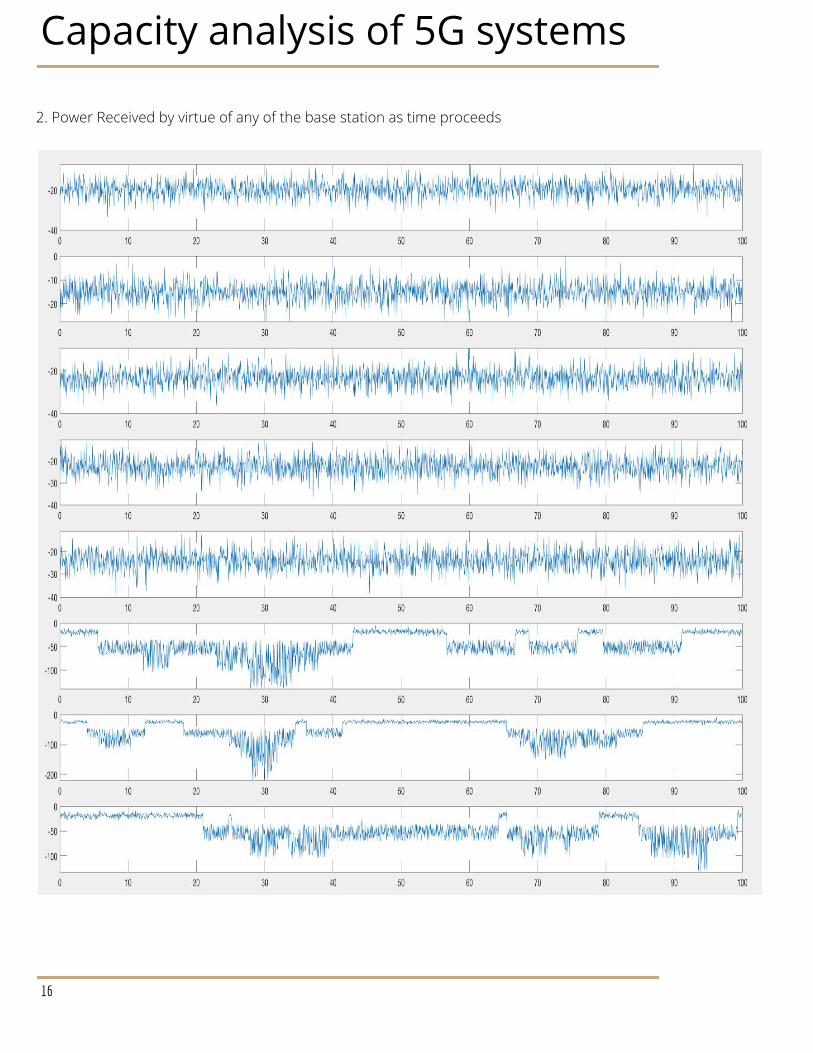
2. Power Received by virtue of any of the base station as time proceeds
16

Capacity analysis of 5G systems
3. Final Power being Received without including the effect of Shadow Fading
17
Capacity analysis of 5G systems
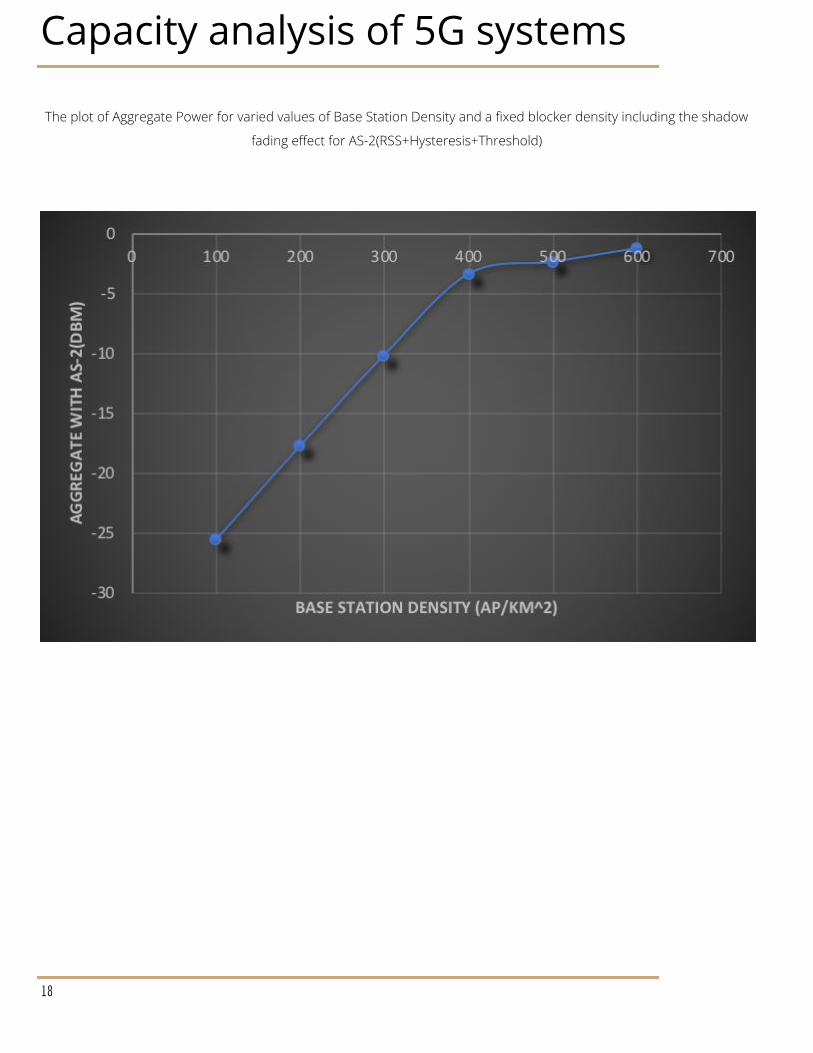
The plot of Aggregate Power for varied values of Base Station Density and a fixed blocker density including the shadow
fading effect for AS-2(RSS+Hysteresis+Threshold)
18

Capacity analysis of 5G systems
The plot of Aggregate Power for varied values of Blocker Density and a fixed base station density including the shadow
fading effect for AS-2(RSS+Hysteresis+Threshold)
19

Capacity analysis of 5G systems
FUTURE WORKS
● All the base stations are assumed to be of the same efficiency ● User is assumed to be fixed thus not inculcating any frequency change, thus not affecting our
channel model ● No consideration is being made for a time-varying channel ● Multiple UE’s and how they will affect the whole system ● Effects of Interference are not included in the study so far ● Developing the theory behind it ● Making the NLoS paths more descriptive
20

Capacity analysis of 5G systems
CONCLUSION
● Developed a dynamic blockage model for the UE-BS LOS link considering mobile blockers with the
effect being correlated.
● Considered BS macro-diversity (Cooperation among multiple BSs to serve the UE)
● We need to have high antenna gains along with other technologies to have significant capacity for the case considered
● Average power received decreases as a result of an increase in the blocker density, increase in the mean blockage duration and with an increase in the self blockage angle
● Increasing the access point density increases the average power received ● Increasing the height of the access point also results in an increase in the average power being
received ● We need to include other technologies like Small cell, MIMO, Beam Training and Full-Duplex to have a
significant because of the 5G system
21
Capacity analysis of 5G systems
REFERENCES
1. Limited by Capacity or Blockage? A millimetre-wave Blockage Analysis by Ish Kumar Jain et al.
2. millimetre-wave Channel Modeling and Cellular Capacity Evaluation by Mustafa Riza Akdeniz et al.
3. On the Temporal Effects of Mobile Blockers in Urban Millimeter-Wave Cellular Scenarios By Margarita
Gapeyenko et al.
4. Analysis of Blockage Effects on Urban Cellular Networks by Tianyang Bai et al. 5. K. Haneda et al., “5G 3GPP-like channel models for outdoor urban microcellular and macrocellular
environments,” in Proc. IEEE 83rd Veh. Technol. Conf., May 2016, pp. 1–7. 6. Study on channel model for frequencies from 0.5 to 100 GHz (3GPP TR 38.901 version 14.0.0 Release
14) 7. M. Abouelseoud and G. Charlton, “The effect of human blockage on the performance of
millimetre-wave access link for outdoor coverage,” inProc. IEEE Veh. Technol. Conf., Jun. 2013, pp. 1–5. 8. M. Gapeyenko et al., “Analysis of human-body blockage in urban millimetre-wave cellular
communications,” in Proc. IEEE Int. Conf. Com- mun., May 2016, pp. 1–7. 9. Evaluation of optimal handoff parameters using the method of the threshold with hysteresis by
Maksum Pinem et.al 10. Improved Handover Through Dual Connectivity in 5G mmWave Mobile Networks, by Sundeep Rangan
et.al 11. Maximum Time delays between handover, Ref. Paper by Samsung 12. Evaluation of optimal handoff parameters using the method of the threshold with hysteresis by
Maksum Pinem et.al
22