Embed Size (px)
Citation preview

Project #10093
Key findings from a statewide survey of 500 likely voters in Nevada,
conducted February 15-16, 2010

Public Opinion Strategies is pleased to present the key findings of a statewide telephone survey conducted in Nevada. The survey was completed February 15-16, 2010 among 500 likely voters and has a margin of error of +4.38%.
Glen Bolger was the principal researcher on this project. Jim Hobart was the project director, and Bryan Kitz provided analytical support.


4
Right Direction
18%
Wrong Track73%
No Opinion/Ref9%
Right Direction11%
Wrong Track80%
No Opinion/Ref9%
“And, would you say that things in Nevada are going in the right direction, or have they pretty seriously gotten off on the wrong track?”
Nevada voters are even more pessimistic about the direction of the state than they were in May.
May 2009 February 2010

5
Men 18-49
(21%)
Men 50+
(26%)
Women 18-49
(27%)
Women 50+
(24%)
65+
(21%)
39% 40%
26%
36%
31%
20% 21%
35% 34%
29%
Republican Candidate Democratic Candidate
Repub-lican
Candi-date34%
Democratic Can-didate28%
Unde-cided/Ref
38%
“And, if the election for state legislature in your district were being held today, for whom would you vote...the Republican candidate....OR....the Democratic candidate ...for state legislature from this district?”
The GOP leads the generic ballot among all gender/age groups except younger women, but many are undecided.
+19% +19% -9% +2% +2%
Overall By Gender/Age + Seniors


7
Brian Sandoval Jim Gibbons Rory Reid Mike Montandon
71%
97%
79%
28%
37%
29%23%
10%10%
58%
37%
5%
Total Heard Of Total Favorable Total Unfavorable
Governor Candidates Name ID/Image Ranked by % Favorable
Both Jim Gibbons’ and Rory Reid’s images are upside down. Brian Sandoval’s image is solid.

8
79%
97%
79%
47%
26% 26%22%
39%35% 35%
18%
8% 7%3%
17%
58%
17%
8%5% 5% 4%
Total Heard Of Total Favorable Total Unfavorable
US Senate Candidates Name ID/Image Ranked by % Favorable
The early ads did not help. Senator Reid’s image is terrible.

10
“And, do you think your state legislator has performed their job well enough to deserve reelection,or do you think it's time to give a new person a chance to do a better job?”
Anti-incumbent sentiment is strong across party lines.
Base GOP
(26%)
Soft GOP
(11%)
Ind
(18%)
Soft Dem (16%)
Base Dem
(26%)
7%11%
7%
15%
26%
79% 81% 82%
71%
55%
Total Re-Elect Total New Person
Definitely Re-Elect6% Probably
Re-Elect8%
Probably New Per-
son22%
Definitely New Per-
son49%
Depends/DK
15%
-72% -70% -75% -56% -29%Total Re-Elect: 14%Total New Person: 71%
Overall By Party

11
“If the Republican primary election for U.S. Senate were being held today, for whom would youvote if the candidates were...”
Total Lowden35%
Total Tarkanian28%
Total Angle8%
Total Chris-tensen
4%
Total Amodei1%
Total Un-decided
24%
Lowden and Tarkanian lead the GOP primary ballot, but many voters are undecided.

12
“If the Republican primary election for Governor were being held today, for whom would youvote if the candidates were...”
Definitely Gibbons
17%
Probably Gibbons
15%
Definitely Sandoval
18%
Probably Sandoval
20%
Definitely Mon-tandon
5%
Probably Mon-tandon
4%
Undecided/Ref21%
Sandoval leads incumbent Governor Jim Gibbons on the primary ballot.
Total Gibbons: 32%Total Sandoval: 38%Total Montandon: 9%

13
42%
37%
9%
40%39%
11%
21%
39%
22%
32%
37%
16%
25%
40%
19%
“And, if the election for U.S. Senate were being held today, for whom would you vote if the candidates were...”
Reid fails to top 40% against any potential opponent.

14
Tea Party Candidate Vote – Low and HighTeas Party Candidate
vs. LowdenTea Party Candidate
vs. Chachas
Base GOP (26%) 11% 28%
Soft GOP (11%) 16% 36%
Ind (18%) 19% 34%
Soft Dem (16%) 4% 12%
Base Dem (26%) 2% 6%
Clark (66%) 11% 23%
Washoe (20%) 8% 20%
Rural (14%) 7% 19%
White (77%) 10% 23%
Total Minority (19%) 5% 14%
Af Am (8%) 3% 6%
Hispanic (8%) 6% 13%

15
Tea Party Candidate Vote – Low and High cont.Teas Party Candidate
vs. LowdenTea Party Candidate
vs. Chachas
Men 18-49 (21%) 14% 31%
Men 50+ (26%) 11% 25%
Women 18-49 (27%) 7% 18%
Women 50+ (24%) 6% 16%
65+ (21%) 5% 16%
Very Cons (22%) 17% 33%
Smwt Cons (19%) 9% 27%
Mod (36%) 10% 19%
Total Lib (21%) 2% 11%
Mod/Lib GOP (9%) 5% 22%
Cons Dem/Ind (12%) 10% 25%

16
“Thinking now about the race for Governor…And, if the election for Governor were being held today, for whom would you vote if the candidates were...”
Brian San-doval, Repub-
lican50%
Rory Reid, Democrat
34%
Undecided16% Jim Gibbons,
Republican36%
Rory Reid, Democrat
47%
Undecided17%
Mike Mon-tandon, Re-
publican40%
Rory Reid, Democrat
40%
Undecided20%
Jim Gibbons is the weakest GOP candidate against Reid.

18
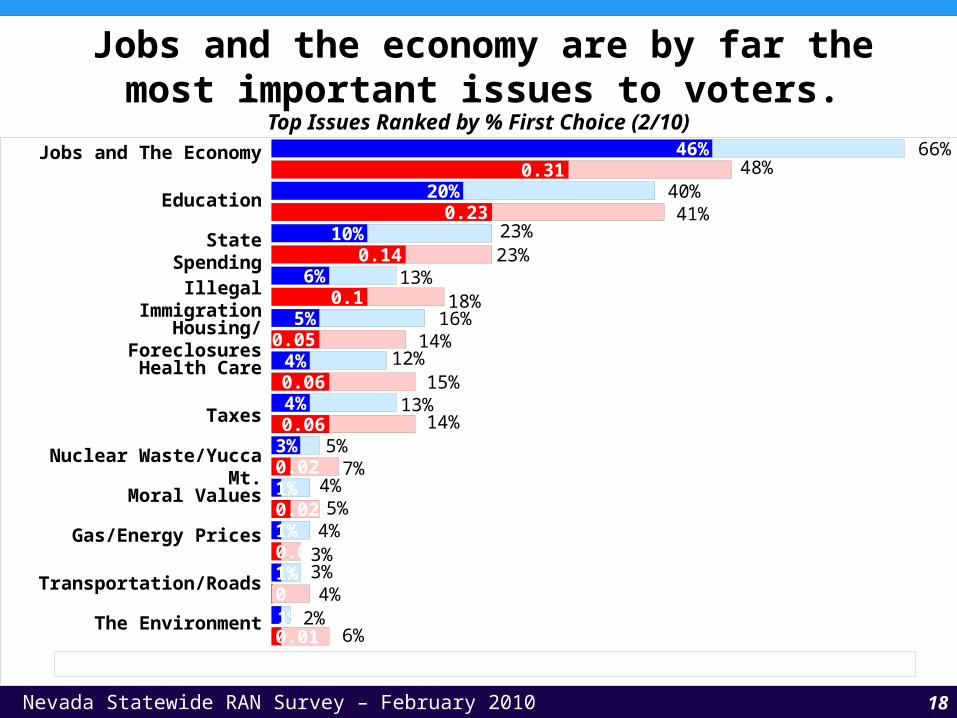
Top Issues Ranked by % First Choice (2/10)
Jobs and the economy are by far the most important issues to voters.
0.01
0
0.01
0.02
0.02
0.06
0.06
0.05
0.1
0.14
0.23
0.31
6%
4%
3%
5%
7%
14%
15%
14%
18%
23%
41%
48%
1%
1%
1%
1%
3%
4%
4%
5%
6%
10%
20%
46%
2%
3%
4%
4%
5%
13%
12%
16%
13%
23%
40%
66%
2/10 First Choice 2/10 Combined Choice 5/09 First Choice 5/09 Combined Choice
Jobs and The Economy
Education
State Spending
Illegal Immigration
Housing/Foreclosures
Health Care
Taxes
Nuclear Waste/Yucca Mt.
Moral Values
Gas/Energy Prices
Transportation/Roads
The Environment

19
“Now I would like to talk to you about the state of the economy...Nevada has recently been going through a difficult time. Do you feel that the worst is over or is the worst is still to come?”
Worst is Over32%
Worst is Still to Come62%
DK/Ref6% Worst is
Over30%
Worst is Still to Come64%
DK/Ref6%
May 2009 February 2010
Nevada voters remain pessimistic about the state of the economy.

20
“And, as you may know Nevada’s unemployment rate is the highest it has been in decades. Overthe next year, do you think Nevada’s unemployment will...”
Increase 45%
Decrease19%
Stay About the
Same35%
DK1%
Increase36%
Decrease16%
Stay About the
Same47%
DK1%
May 2009 February 2010
Fewer Nevadans think that unemployment will continue to rise in the state.

21
“Many people in Nevada have lost their jobs, lost their homes, or been forced to take pay cutsduring this economic downturn. Have you or someone you know suffered from one of these?”
The number of voters who have personally lost jobs, lost homes, or taken pay cuts has increased since May.
Lost Job Lost Home Pay Cut
15%
3%
12%
39%
18%26%
May 2009
February 2010
Total Self: 25%Total Someone Else: 54%Total No: 29%
Total Self: 31%Total Someone Else: 56%Total No: 24%
Lost Job Lost Home Pay Cut
16%
7%
17%
43%
24%31%
Self Someone Else

22
“As you may know, Nevada currently has a state budget shortfall...would you say the state budget shortfall is”
Very Se-rious62%
Somewhat Serious
32%
Not Very Serious3%
Not at All Serious1% DK/Ref
2%
Very Se-rious79%
Somewhat Serious
18%
Not Very Serious1%
DK/Ref2%
May 2009 February 2010
Voters think the state budget shortfall is very serious.
Total Serious: 95%*Total Not Serious: 4%
Total Serious: 97%Total Not Serious: 1%

23
“Thinking about the state taxes you pay, do you consider the overall amount of state taxes you pay to be...”
Too High17%
Too Low13%
About Right65%
DK/Ref5%
May 2009 February 2010
Though down since May, a majority of Nevadans still consider the state’s current level of taxation about right.
Too High22%
Too Low18%About
Right54%
DK/Ref6%

24
“And, thinking some more about the budget shortfall, would you rather the Governor and State Legislature CUT SPENDING for state employee salaries and government services such as education and
health care, or RAISE YOUR TAXES to avoid these cuts?”
Cut Spending40%
Raise Your Taxes47%
Both/Primarily Cut Spending
3%
Both/Primarily Raise Your
Taxes1%
DK/Ref9%
May 2009 February 2010
Voter opinions about how to address the budget shortfall have not changed since May.
Cut Spending38%
Raise Your Taxes47%
Both/Primarily Cut Spending
5%
Both/Primarily Raise Your
Taxes2%
DK/Ref9%

25
“And, if the Governor and State Legislature were to raise taxes, who do you think should be paying increased taxes?”
Nevada voters increasingly feel that everyone should bear the burden of increased taxes.
61%
53%
17%
23%
16%
18%
12%
13%
9%
6%
4%
3%
1%
2%
61%
53%
17%
23%
16%
18%
12%
13%
9%
6%
4%
3%
1%
2%
May 2009 February 2010
Casinos
Everyone
The Rich
Large Businesses
Mining Companies
The Middle Class
Small Businesses

26
“And, if taxes are increased as part of a plan to end the budget shortfall, do you think any tax increases should be temporary until the state’s economy and budget improve, or do you think those tax increases
should be permanent?”
A large majority believe that any tax increase undertaken to address the budget shortfall should be temporary.
83%
13%
May 2009
February 201079%
15%
Temporary Permanent

27
“Some members of the Legislature say that tax increases will harm our economy but, at the same time, they are calling for an increase in fees to cover some of the budget shortfall. Do you
believe that fee increases are essentially the same as tax increases?”
Yes, Fee Increases Are Essen-tially the Same as Tax In-
creases74%
No, Fee Increases Are Not Essentially the Same as Tax
Increases20%
DK/Ref6%
Most Nevada voters think fee increases are the same as tax increases.

28
“Over the past 10 years, our economy created one-hundred fifty thousand jobs, but since the beginning of the recession the economy has lost one-hundred thirty-nine thousand jobs. Do you believe that increased
taxes or fees on businesses will result in additional job losses?”
Yes, Increased Taxes or Fees Will Result in Additional Job
Losses60%
No, Increased Taxes or Fees Will Not Result in Additional
Job Losses33%
DK7%
A majority of Nevada voters think that increased taxes or fees will result in additional job losses.

29
“As you may know, because of the economy, Nevada’s two-year general fund budget has been cut from approximately six point eight billion dollars in 07-09 to just over six point five billion
dollars for the 2009-2011 years, which is a decrease of three point seven percent. Do you believe that there is still a lot of waste, fraud, and abuse in the state budget, or do you believe that
future spending cuts will hurt important programs?”
Still a Lot of Waste, Fraud, and Abuse in the State Budget
69%
Future Spending Cuts Will Hurt Important Programs
26%
DK5%
Over two-thirds of Nevadans believe the state budget contains waste, fraud, and abuse.

30
“Some people have proposed that the Nevada should institute an income tax on individuals.
Would you favor or oppose instituting an income tax on individuals?”
Strongly Favor6%
Somewhat Favor10%
Somewhat Oppose
16%
Strongly Oppose
63%
DK5%
Voters are strongly opposed to increased personal income taxes, but are split on corporate income tax hikes.
Total Favor: 16%Total Oppose: 79%
Total Favor: 43%Total Oppose: 49%
“Some people have proposed that the Nevada should institute an income tax on corporations.
Would you favor or oppose instituting an income tax on corporations?”
Strongly Favor25%
Somewhat Favor18%Somewhat Oppose
12%
Strongly Oppose
37%
DK8%

31
“Which of the following statements comes closest to expressing your overall view of the tax system in Nevada?”
On the whole, Nevada’s tax system works pretty well and the Governor and State Legislature should make only minor changes to make it work better. Nevada attracts business and jobs with the current system and the system typically generates enough taxes to meet our needs.
…or…
Nevada’s tax system is so unfair that the Governor and State Legislature should completely change it. Nevada never takes in as much as the state needs to properly fund government programs.
May 2009 Feb 2010
66% 59%
31% 33%
Voters only support making minor changes to Nevada’s tax system.

32
“Thinking some more about Nevada’s tax system...”
Some people say that Nevada needs to significantly change its tax system to become less dependent on gaming and sales taxes and more stable because other businesses would pay more. They say every time there is a downturn in the national economy, the casinos are hurt and consumers spend less money, which ends up hurting the state budget.
Other people say that Nevada’s tax system generally works well. They say times are unusually hard across the country, as forty-five other states have major budget problems too. Making all businesses pay more in taxes will only end up increasing the state’s unemployment rate and budget shortfall.
May 2009 Feb 2010
39% 43%
56% 48%
Voters are increasingly polarized about the tax system’s dependence on gaming and sales taxes.
…while…

33
“As you may know, the State Legislature voted to override the Governor’s veto of tax increases. Will you be more likely or less likely to vote for a State Legislator who voted to override the
Governor’s veto of tax increases, or will it make no difference to your vote?”
Much More Likely19%
Somewhat More Likely14%
Somewhat Less Likely8%
Much Less Likely17%
No Difference39%
DK3%
It makes no difference to a plurality of Nevadans whether their state legislator voted to override the veto.
Total More Likely: 33%Total Less Likely: 24%*
* Denotes Rounding

34
“Thinking now about the salaries of some state and local employees...Currently, state worker salary reductions have taken the form of a requirement that state workers take an unpaid day off each month,
which reduces their income by approximately four point six percent. However, this requirement does not apply to all state workers. Would you favor or oppose the state replacing the unpaid day approach with a
flat salary cut of six to eight percent that applies to all state workers?”
A majority of voters favor a flat salary cut for state workers. Only base Dems oppose this approach.
Strongly Favor32%
Somewhat Favor21%
Somewhat Oppose16%
Strongly Oppose23%
DK/Ref8%
Total Favor: 53%Total Oppose: 39%
Overall By Party
Base GOP
(26%)
Soft GOP
(11%)
Ind (18%)
Soft Dem
(16%)
Base Dem (26%)
63% 64%
53%50%
42%
32%
25%
36%41%
51%
Total Favor Total Oppose
+31% +39% +17% +9% -9%

35
“As you may know, local governments are also under budget pressures and have revenueshortfalls, but many local government workers have still received raises. Would you favor or
oppose local government workers being subject to salary decreases in line with what stateworkers are given?”
Strongly Favor51%
Somewhat Favor22%
Somewhat Oppose12%
Strongly Oppose8%
DK/Ref7%
Voters strongly support salary cuts for local government workers to address budget concerns.
Total Favor: 73%Total Oppose: 20%

36
“So far, teacher salaries and benefits have seen little or no reduction during this recession. Most teachers have received cost of living adjustments and step increases during the past two years. I’m going to read you
two statements, and please tell me which statement comes closest to your opinion...”
A plurality of voters support reducing or eliminating teacher development days.
Some people say that teacher devel-opment days, which are days that
students are not in class but teachers are, should be reduced or eliminated to save nearly ten million dollars per
day per cut.40%
Other people say teacher salaries should be reduced by the same percentage as other
state workers13%
Agree w/ both statements15%
Agree w/ neither statement29%
DK/Ref3%


38
“Now, turning out attention to Governor Jim Gibbons’ recent State of the State Address...Did you
watch Governor Jim Gibbon’s State of the State Address on Monday of last week?”
Yes29%
No70%
DK1%
Most voters did not watch the State of the State Address.
And, during the State of the State speech, Governor Gibbons made the case that the state must cut
spending and not increase taxes to meet the budget deficit. Do you believe he made his case well or not
or do you think he did not make his case well?
Yes, Made His Case Well*
No, Did Not Make His Case
Well*
DK*
9%
19%
2%
* Among Total Base N=500

39
“Do you think the Nevada Governor understands the problems facing people like yourself, or do you think he does not understand the problems facing
people like your self?”
Yes, Under-stands the Problems
Facing People Like Yourself
40%
No, Does Not Understand
the Problems Facing People Like Yourself
51%
DK9%
A majority of voters do not believe the Governor or state legislators understand the problems they are facing.
“Do you think your state legislators understand the problems facing people like yourself, or do you
think they do not understand the problems facing people like your self?”
Yes, Under-stands the Problems
Facing People Like Yourself
37%
No, Does Not Understand
the Problems Facing People Like Yourself
58%
DK5%
N=256 N=244


41
KEY FINDINGS
C Nevada voters are angry with the direction of the state and disappointed with their elected leaders.
C The state’s leading political figures – Harry Reid, Jim Gibbons, and Rory Reid, are held in contempt by the electorate.
C The Tea Party candidate may play the spoiler in the U.S. Senate race, or, like the Independent candidate in the New Jersey Governor’s race last November, may end up polling better than he performs at the ballot box.
C Voters clearly perceive the economy and jobs to be the overwhelmingly dominant issue facing the state.
C Nevadans have become even more pessimistic about the jobs and economic picture since May 2009, and they do not hold out much hope for the future.
C There is no clarity of opinion on how to best deal with the budget shortfall. Elected officials looking for guidance from the electorate will be only be viewing a muddied picture.
Tax increases are seen as harmful to jobs. Tax increases are seen as harmful to jobs. But, there is not much appetite for spending cuts either.
For more information about this presentation or about Public Opinion Strategies, please give us a call.
214 N. Fayette St.Alexandria, Virginia 22314
(703) 836-7655 - Phone (703) 836-8117 - Fax
Turning Questions Into Answers


![PROPOSED] ORDER DENYING MOTION FOR ... statewide, computerized database of registered voters. (Doc. 85-5 3.) 3. Some applications received by the Supervisors or BVRS are delivered,](https://img.dokumen.tips/doc/110x75/5d00541588c99394038b8195/proposed-order-denying-motion-for-statewide-computerized-database-of-registered.jpg)