Embed Size (px)
Citation preview
www.krcresearch.com
Texas Library Association
Prepared for:
November 2008
Perceptions of Public and School Libraries:Statewide Survey of Texas Voters

2
pageResearch Framework 3Objectives 4Methodology 5
Executive Summary 6
Detailed Findings 10Public Libraries 10School Libraries 28Library Funding 41
Respondent Profile 50
Table of Contents

www.krcresearch.com
Research Framework
4
Research Objectives• To gauge perceptions of public and school libraries and
librarians among Texas voters;
• To determine levels of support for and satisfaction with public and school libraries;
• To understand drivers of support and desire for library services;
• To measure voter support for a greater public commitment to community libraries; and,
• To serve as set of benchmark measures.

5
Methodology
METHOD: Texas statewide telephone survey
DATA COLLECTION: October 17 to November 2, 2008
SAMPLE SIZE: 1,201 interviews total
SAMPLE: A “random-digit dial” sample was used, whereby every household in our defined geographic region has an equal probability of being reached. Participants were then screened by age (adults 18 and older) and voter registration status (currently registered to vote in Texas at the address where they received the call).
WEIGHTING: Data were weighted to reflect the proper demographic and geographic distribution of the adult voter population (guided by 2008 exit polls and Texas Secretary of State registered voter data). Age and Party affiliation were weighted.
MARGIN OF ERROR: Estimated margin of error at the 95% confidence level for proportions near 50% is ±2.8%.
www.krcresearch.com
Executive Summary

7
Executive Summary: Public Libraries• Public libraries enjoy strong and intense support from Texas voters. Overwhelming
majorities across every demographic and geographic sub-group of voters believe public libraries are important to their community and report being satisfied with their public library
– Personal interaction with libraries is critical – the more frequently voters use their public library the more important they believe it is to the community and the more satisfied they are with their library
– While all voters are supportive and satisfied, female, less affluent, African American and Hispanic voters feel most intensely positive
• Texas voters are nearly unanimous in their belief that public libraries create educational opportunities for all citizens and improve the quality of life in their community
• Public libraries are also valuable to Texans and their communities in these turbulent economic times – providing important resources to families and job seekers, and supporting the economy through job skills training, career and job information and resources for local businesses
• Texans say library services are very important to the community, particularly providing access to information and resources and reading programs and activities for children, teens and adults. Every service asked about was rated very important by at least six in ten voters

8
Executive Summary: School Libraries
• As with public libraries, school libraries also enjoy strong and intense voter support – regardless of parental status or any other demographic or regional variance
• School libraries and professional librarians are viewed as essential to the education of Texas children. Texas voters say school libraries are as important as classroom education and more than eight in ten believe that school libraries make a major contribution to children’s education
• While positive feelings are high across every subgroup, women, older and Hispanic voters – as well as frequent public library users – are the most intensely supportive of school libraries compared to their counterparts
• School libraries are viewed as essential because they provide opportunities for children to develop reading and research skills and voters see a link between academic success and strong libraries
• Texas voters are willing to take their support of school libraries to the legislature. More than nine in ten voters support statewide legislation to require access to a school library and professional librarian
9
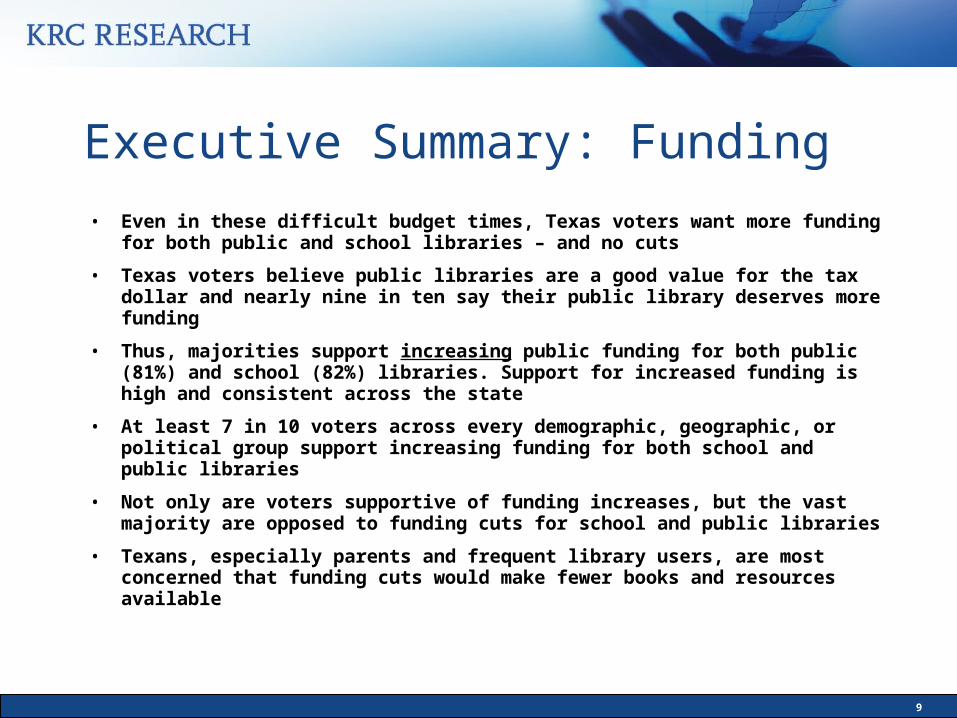
Executive Summary: Funding
• Even in these difficult budget times, Texas voters want more funding for both public and school libraries – and no cuts
• Texas voters believe public libraries are a good value for the tax dollar and nearly nine in ten say their public library deserves more funding
• Thus, majorities support increasing public funding for both public (81%) and school (82%) libraries. Support for increased funding is high and consistent across the state
• At least 7 in 10 voters across every demographic, geographic, or political group support increasing funding for both school and public libraries
• Not only are voters supportive of funding increases, but the vast majority are opposed to funding cuts for school and public libraries
• Texans, especially parents and frequent library users, are most concerned that funding cuts would make fewer books and resources available

www.krcresearch.com
Public Libraries
11
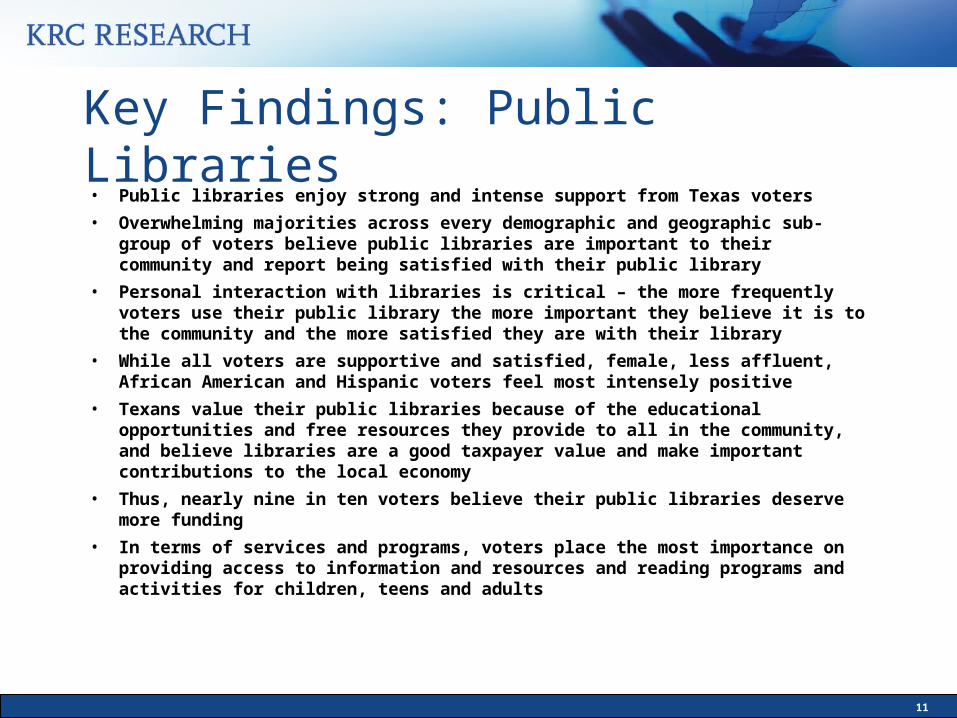
Key Findings: Public Libraries• Public libraries enjoy strong and intense support from Texas voters
• Overwhelming majorities across every demographic and geographic sub-group of voters believe public libraries are important to their community and report being satisfied with their public library
• Personal interaction with libraries is critical – the more frequently voters use their public library the more important they believe it is to the community and the more satisfied they are with their library
• While all voters are supportive and satisfied, female, less affluent, African American and Hispanic voters feel most intensely positive
• Texans value their public libraries because of the educational opportunities and free resources they provide to all in the community, and believe libraries are a good taxpayer value and make important contributions to the local economy
• Thus, nearly nine in ten voters believe their public libraries deserve more funding
• In terms of services and programs, voters place the most importance on providing access to information and resources and reading programs and activities for children, teens and adults
12
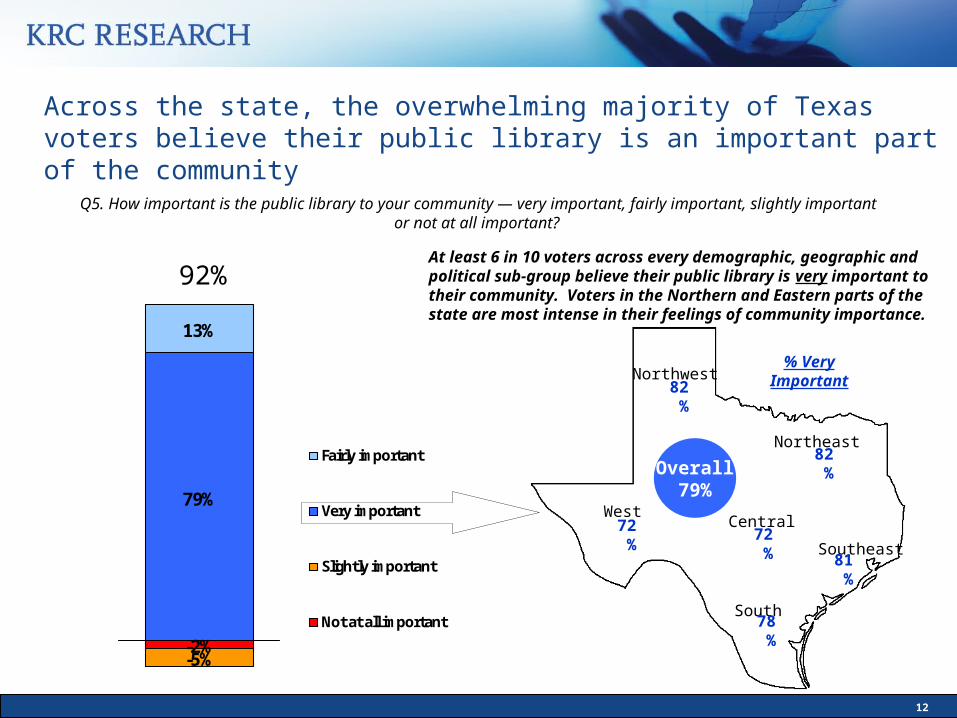
Q5. How important is the public library to your community — very important, fairly important, slightly important or not at all important?
Across the state, the overwhelming majority of Texas voters believe their public library is an important part of the community
92%
-5%
79%
13%
-2%
Fairly important
Very important
Slightly important
Not at all important
Southeast
South
Central
Northeast
Northwest
West
82%
72% 72%
78%
81%
82%
% VeryImportant
Overall79%
At least 6 in 10 voters across every demographic, geographic and political sub-group believe their public library is very important to their community. Voters in the Northern and Eastern parts of the state are most intense in their feelings of community importance.

13
Q5. How important is the public library to your community — very important, fairly important, slightly important or not at all important?
Although all groups assert their library is very important, women show more intensity while younger and more educated men trail slightly
-1% -3% -3%-2% -2%-10% -6%
84% 86%67% 74%
11% 8%
18%15%
-1%
Education Age
-1% -4% -2%-2% -2%-9% -6%
84% 88%68% 75%
12% 7%
17%15%
-1%
Women Men Women Men
95% 95% 86% 89% 95% 95% 85% 91%
Texans of different ages vary in how important they think their library is. Those aged 50-64 are significantly more likely to say their library is very important (87%)
than other age groups (under 30, 75%; 30-39, 77%; 40-49, 75%; and 65+, 78%)
College degree No degree College degree No degree Under 45 45+ Under 45 45+
Not at all important Slightly unimportantVery important Fairly important
14
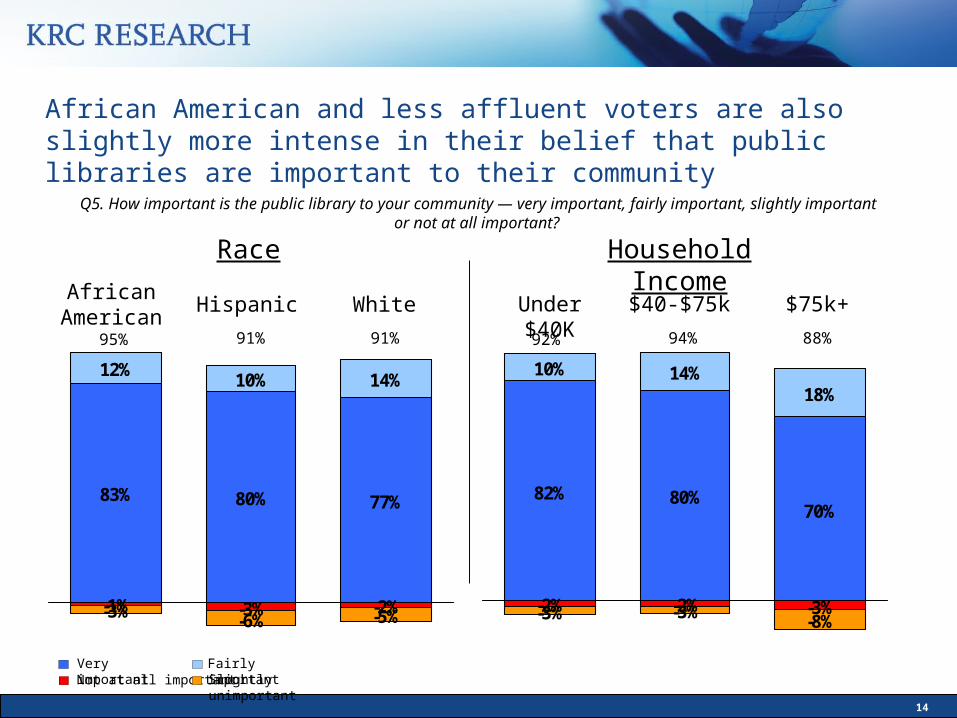
Q5. How important is the public library to your community — very important, fairly important, slightly important or not at all important?
African American and less affluent voters are also slightly more intense in their belief that public libraries are important to their community
-3% -2%-3% -6% -5%
83% 80% 77%
12% 10% 14%
-1%
Race Household Income
-2%-2%-8%-3%-3%
70%80%82%
18%14%10%
-3%
African American White
95% 91% 91%
Hispanic $75k+Under $40K
92% 94% 88%
$40-$75k
Not at all important Slightly unimportantVery important Fairly important
15
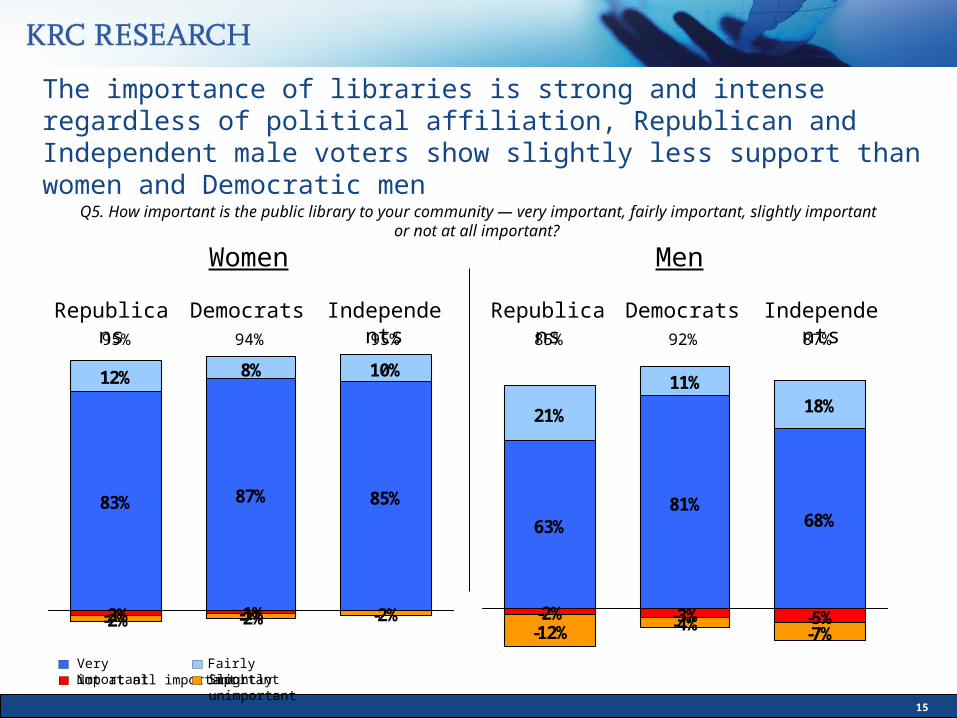
Q5. How important is the public library to your community — very important, fairly important, slightly important or not at all important?
The importance of libraries is strong and intense regardless of political affiliation, Republican and Independent male voters show slightly less support than women and Democratic men
-1%-2% -2% -2%
83% 87% 85%
12% 8% 10%
-2%
Women Men
-3% -5%-12% -4% -7%
63%81%
68%
21%
11%18%
-2%
Republicans IndependentsDemocrats Republicans IndependentsDemocrats95% 94% 95% 85% 92% 87%
Not at all important Slightly unimportantVery important Fairly important
16
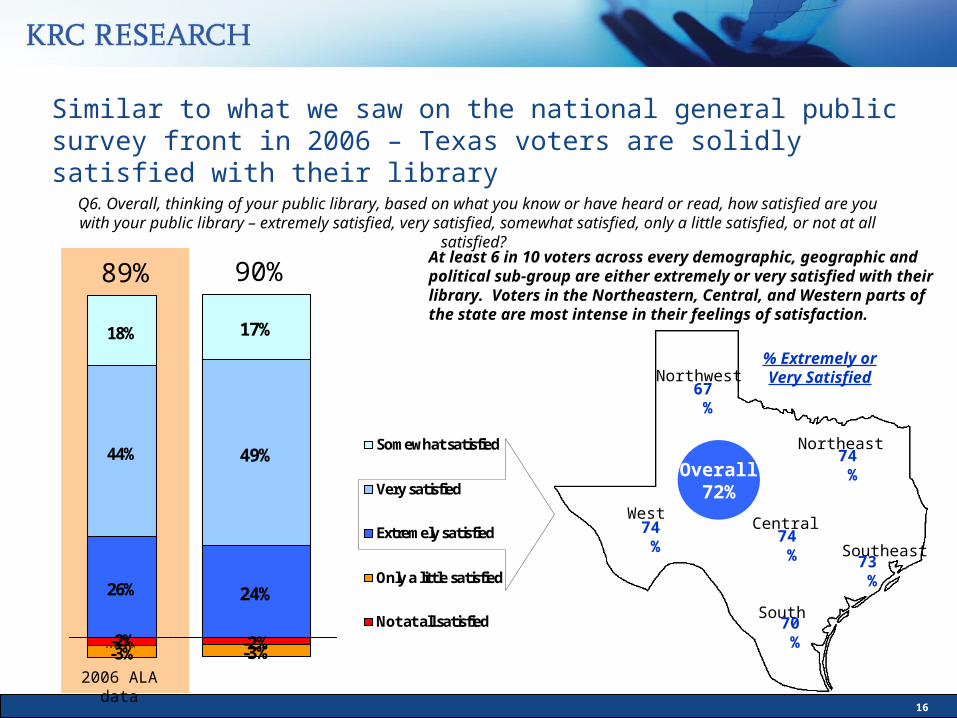
Similar to what we saw on the national general public survey front in 2006 – Texas voters are solidly satisfied with their library
90%
-3%
24%
49%
17%
-2%
Somewhat satisfied
Very satisfied
Extremely satisfied
Only a little satisfied
Not at all satisfied
Q6. Overall, thinking of your public library, based on what you know or have heard or read, how satisfied are you with your public library – extremely satisfied, very satisfied, somewhat satisfied, only a little satisfied, or not at all
satisfied?
Southeast
South
Central
Northeast
Northwest
West
67%
74% 74%
70%
73%
74%
% Extremely or Very Satisfied
-3%
26%
44%
18%
-2%-2%2 0 0 6 A LA
2006 ALA data
89%
Overall72%
At least 6 in 10 voters across every demographic, geographic and political sub-group are either extremely or very satisfied with their library. Voters in the Northeastern, Central, and Western parts of the state are most intense in their feelings of satisfaction.

17
Frequently (37%) Infrequently (41%) Rarely or not at all (21%)Use at least once every three weeks Use at least a few times a year Use once a year or less
Women (40%) vs. Men (34%) Democrats (42%) and Republicans (46%) vs. Independents (33%)
Republican men (26%) and Independent men (27%) vs. Democrat men (13%)
Democrats (38%) and Independents (45%) vs. Republicans (31%)
Those whose kids use the library infrequently (80%) vs. frequently (20%) or not at all (40%)
Those without a high school education or less (27%) vs. those with a college degree (20%)
Parents (43%) vs. non-parents (34%) Those making over $50k (44%) vs. under (37%)
Non-parents (25%) vs. parents (13%)
Those making less than $40K (41%) vs. $40-75k (36%) and $75K+ (33%)
Those living in urban areas (41%) and suburban (45%) vs. rural (31%)
Those whose kids don’t use the library (55%) vs. use frequently (5%) or infrequently (8%)
Younger Texans – under 30 (46%), 30-39 (42%), 40-49 (34%), 50-64 (36%), 65+ (26%)
Those over 45 (26%) vs. under (16%)
Those whose kids use the library frequently (75%) vs. those whose kids use infrequently (13%) or not at all (6%)
Those living in rural areas (31%) vs. urban (18%)
Non-Caucasian Texans (41%) vs. Caucasians (34%)
Those living in urban areas (41%) vs. suburban (31%)
Who is most likely to use the public library…

18
Not surprisingly, frequency of use impacts attitudes – the more voters interact with their public library, the more intense their ratings on community importance and personal satisfaction
Importance (Q5) Satisfaction (Q6)
Frequent user (at least once every three weeks), less frequent user (use at least a few times a year) and non-users (use once a year or less)
Frequent library user
Infrequent user
Nonuser
-1% -5%-2% -2%-5%
34%20% 13%
45%55%
43%
16% 19%18%
-2%
Frequent library user
Infrequent user
Nonuser
-8%-1% -6%-8%
92%75%
63%
6%17%
15%
-1%
How frequently the kids of voters use the library also plays a role in perceptions. Those whose kids use the library frequently are more likely to say their library is very important (88% vs. those whose kids who use the library less frequently, 64%, or not at all, 60%) and are more likely to be extremely or very satisfied with their library (74% frequent users and 75% infrequent users vs. those whose kids do not use the library, 53%)
98% 93% 79% 95% 94% 74%
19
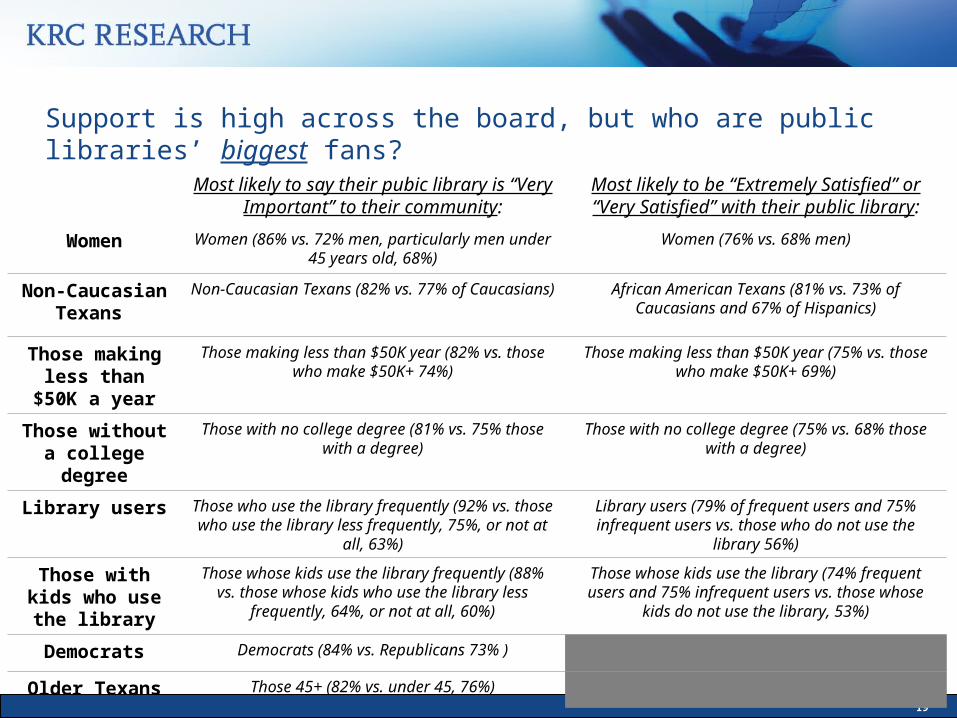
Support is high across the board, but who are public libraries’ biggest fans?
Most likely to say their pubic library is “Very Important” to their community:
Most likely to be “Extremely Satisfied” or “Very Satisfied” with their public library:
Women Women (86% vs. 72% men, particularly men under 45 years old, 68%)
Women (76% vs. 68% men)
Non-Caucasian Texans
Non-Caucasian Texans (82% vs. 77% of Caucasians) African American Texans (81% vs. 73% of Caucasians and 67% of Hispanics)
Those making less than $50K a year
Those making less than $50K year (82% vs. those who make $50K+ 74%)
Those making less than $50K year (75% vs. those who make $50K+ 69%)
Those without a college degree
Those with no college degree (81% vs. 75% those with a degree)
Those with no college degree (75% vs. 68% those with a degree)
Library users Those who use the library frequently (92% vs. those who use the library less frequently, 75%, or not at all, 63%)
Library users (79% of frequent users and 75% infrequent users vs. those who do not use the library 56%)
Those with kids who use the library
Those whose kids use the library frequently (88% vs. those whose kids who use the library less frequently,
64%, or not at all, 60%)
Those whose kids use the library (74% frequent users and 75% infrequent users vs. those whose kids do not
use the library, 53%)
Democrats Democrats (84% vs. Republicans 73% )
Older Texans Those 45+ (82% vs. under 45, 76%)
20
78%
77%
77%
74%
72%
19%
20%
19%
22%
23%
Strongly Agree Somewhat Agree
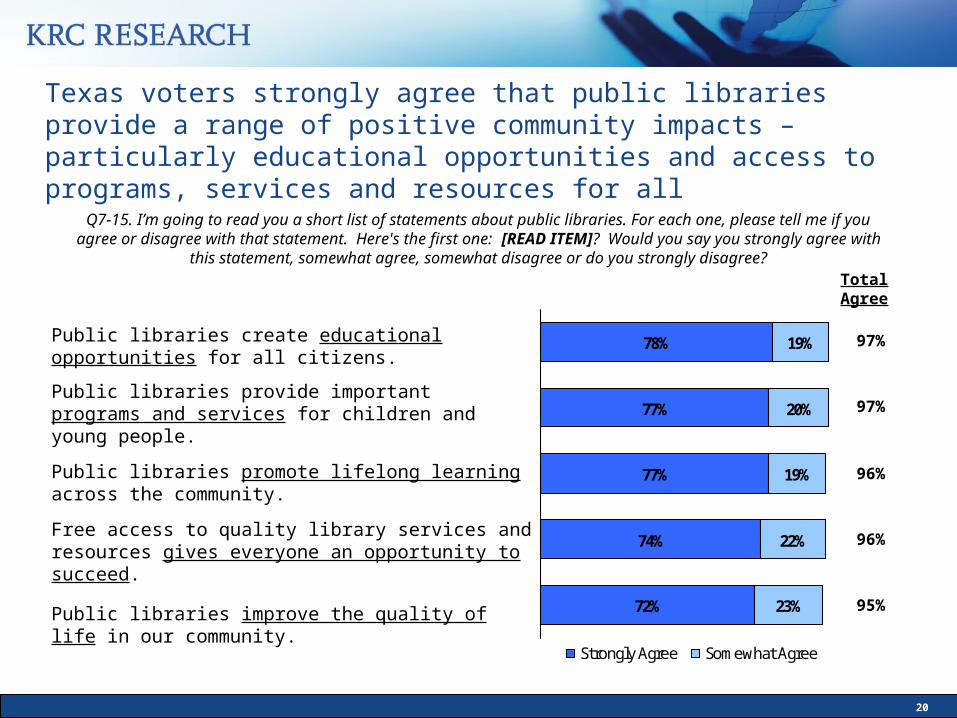
Q7-15. I’m going to read you a short list of statements about public libraries. For each one, please tell me if you agree or disagree with that statement. Here's the first one: [READ ITEM]? Would you say you strongly agree
with this statement, somewhat agree, somewhat disagree or do you strongly disagree?
Texas voters strongly agree that public libraries provide a range of positive community impacts – particularly educational opportunities and access to programs, services and resources for all
Total Agree
97%
97%
96%
95%
96%
Public libraries create educational opportunities for all citizens.
Public libraries provide important programs and services for children and young people.
Public libraries promote lifelong learning across the community.
Free access to quality library services and resources gives everyone an opportunity to succeed.
Public libraries improve the quality of life in our community.
21
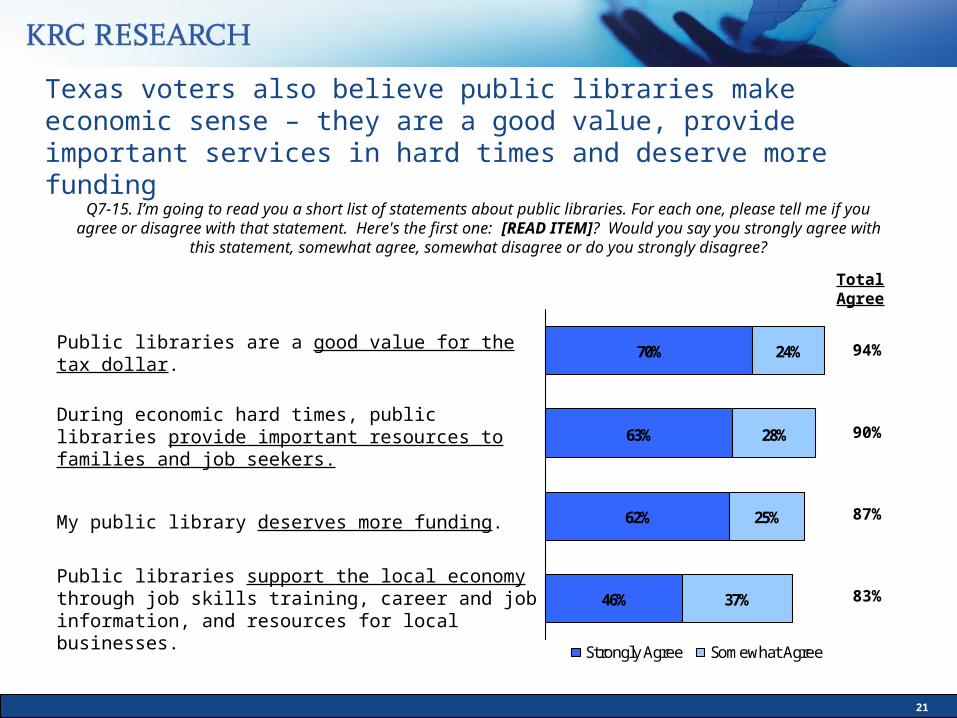
70%
63%
62%
46%
24%
28%
25%
37%
Strongly Agree Somewhat Agree
Q7-15. I’m going to read you a short list of statements about public libraries. For each one, please tell me if you agree or disagree with that statement. Here's the first one: [READ ITEM]? Would you say you strongly agree
with this statement, somewhat agree, somewhat disagree or do you strongly disagree?
Texas voters also believe public libraries make economic sense – they are a good value, provide important services in hard times and deserve more funding
Total Agree
94%
87%
83%
90%
Public libraries are a good value for the tax dollar.
During economic hard times, public libraries provide important resources to families and job seekers.
My public library deserves more funding.
Public libraries support the local economy through job skills training, career and job information, and resources for local businesses.
22
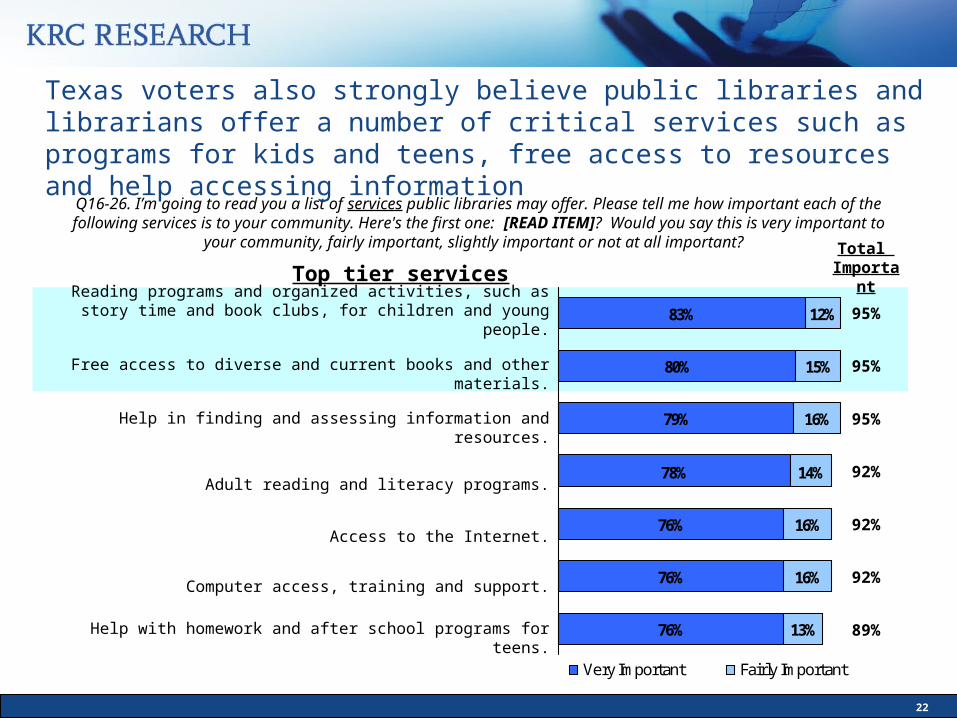
Q16-26. I’m going to read you a list of services public libraries may offer. Please tell me how important each of the following services is to your community. Here's the first one: [READ ITEM]? Would you say this is very important
to your community, fairly important, slightly important or not at all important?
Texas voters also strongly believe public libraries and librarians offer a number of critical services such as programs for kids and teens, free access to resources and help accessing information
Total Important
83%
80%
79%
78%
76%
76%
76%
12%
15%
16%
14%
16%
16%
13%
Very Important Fairly Important
Reading programs and organized activities, such as story time and book clubs, for children and young people.
Free access to diverse and current books and other materials.
Help in finding and assessing information and resources.
Adult reading and literacy programs.
Access to the Internet.
Computer access, training and support.
Help with homework and after school programs for teens.
95%
95%
95%
92%
92%
92%
89%
Top tier services
23
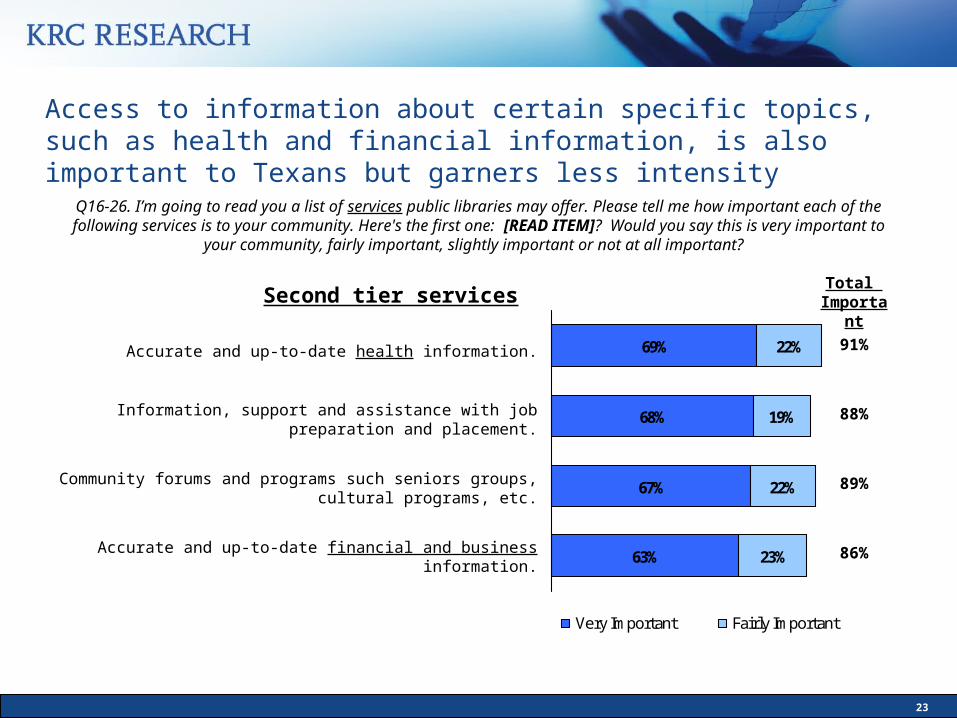
Q16-26. I’m going to read you a list of services public libraries may offer. Please tell me how important each of the following services is to your community. Here's the first one: [READ ITEM]? Would you say this is very important
to your community, fairly important, slightly important or not at all important?
Access to information about certain specific topics, such as health and financial information, is also important to Texans but garners less intensity
Total Important
69%
68%
67%
63%
22%
19%
22%
23%
Very Important Fairly Important
Accurate and up-to-date health information.
Information, support and assistance with job preparation and placement.
Community forums and programs such seniors groups, cultural programs, etc.
Accurate and up-to-date financial and business information.
91%
88%
89%
86%
Second tier services
24
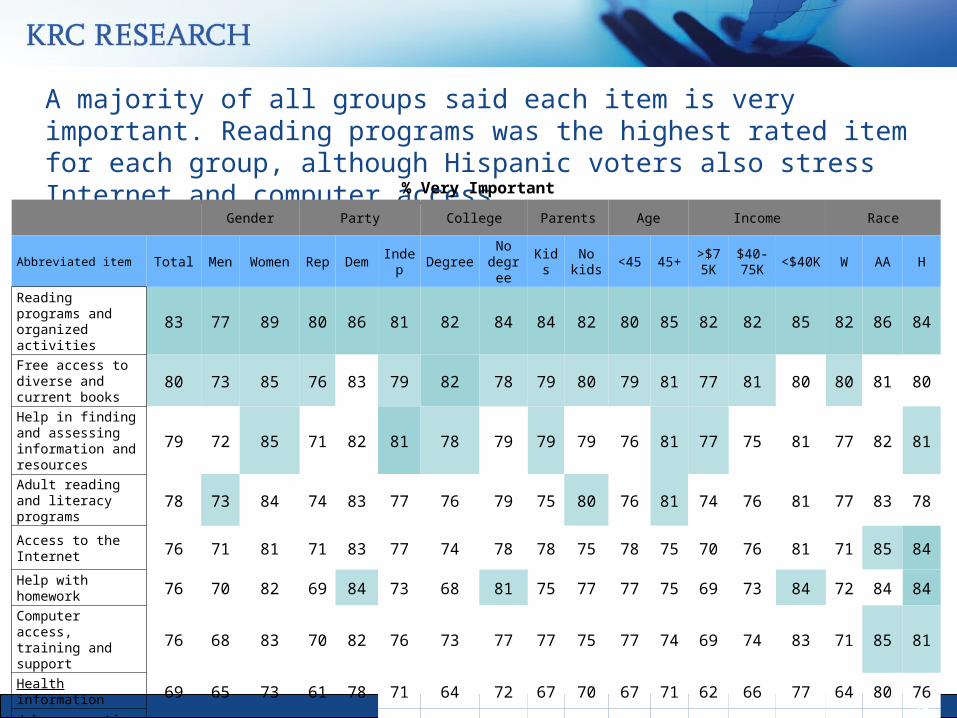
A majority of all groups said each item is very important. Reading programs was the highest rated item for each group, although Hispanic voters also stress Internet and computer access
Gender Party College Parents Age Income Race
Abbreviated item Total Men Women Rep Dem Indep Degree No degree Kids No
kids <45 45+ >$75K
$40-75K <$40K W AA H
Reading programs and organized activities 83 77 89 80 86 81 82 84 84 82 80 85 82 82 85 82 86 84
Free access to diverse and current books 80 73 85 76 83 79 82 78 79 80 79 81 77 81 80 80 81 80
Help in finding and assessing information and resources
79 72 85 71 82 81 78 79 79 79 76 81 77 75 81 77 82 81
Adult reading and literacy programs 78 73 84 74 83 77 76 79 75 80 76 81 74 76 81 77 83 78
Access to the Internet 76 71 81 71 83 77 74 78 78 75 78 75 70 76 81 71 85 84
Help with homework 76 70 82 69 84 73 68 81 75 77 77 75 69 73 84 72 84 84Computer access, training and support 76 68 83 70 82 76 73 77 77 75 77 74 69 74 83 71 85 81
Health information 69 65 73 61 78 71 64 72 67 70 67 71 62 66 77 64 80 76Job preparation and placement 68 63 73 58 77 70 61 72 66 70 68 68 57 67 77 62 78 77
Community forums and programs 67 60 74 58 72 72 63 69 68 67 66 68 65 63 71 63 79 72
Financial and business information 63 55 70 60 67 63 57 66 62 63 64 62 57 63 68 58 74 69
% Very Important

25
In terms of priorities less affluent voters rank help with homework more highly, while the range of adult programs and services is of particular importance to older voters
Gender Party College Parents Age Income Race
Abbreviated item Total Men Women Rep Dem Indep Degree No degree Kids No
kids <45 45+ >$75K
$40-75K <$40K W AA H
Reading programs and organized activities 1 1 1 1 1 1t 1t 1 1 1 1 1 1 1 1 1 1 1t
Free access to diverse and current books 2 2t 2t 2 3t 2 1t 4t 2t 2t 2 2t 2t 2 5 2 6 3
Help in finding and assessing information and resources
3 3 2t 4t 4t 1t 2 3t 2t 3 5t 2t 2t 4 4t 3t 5 2t
Adult reading and literacy programs 4 2t 3 3 3t 3t 3 3t 5t 2t 5t 2t 3 3t 4t 3t 4 4
Access to the Internet 5t 4 6 4t 3t 3t 4 4t 3 5t 3 3t 4 3t 4t 5t 2t 1t
Help with homework 5t 5 5 6 2 5 6 2 5t 4 4t 3t 5t 6 2 4 3 1tComputer access, training and support 5t 6 4 5 4t 4 5 5 4 5t 4t 4 5t 5 3 5t 2t 2t
Health information 6 7 8t 7 5 7 7 6t 7 6t 7 5 7 8 6t 6 7 6Job preparation and placement 7 8 8t 9t 6 8 9 6t 8 6t 6 6t 8t 7 6t 8 9 5
Community forums and programs 8 9 7 9t 7 6 8 8 6 7 8 6t 6 9t 7 7 8 7
Financial and business information 9 10 9 8 8 9 10 7 9 8 9 7 8t 9t 8 9 10 8
The table below ranks each group. Ranks were determined based on the proportion of respondents that said Very Important. The service with the highest proportion of respondents saying it was a very important received a rank of 1, the second largest received a rank of 2, etc. Ranks 1-3 are highlighted. Tied rankings are indicated with a “t”.
26
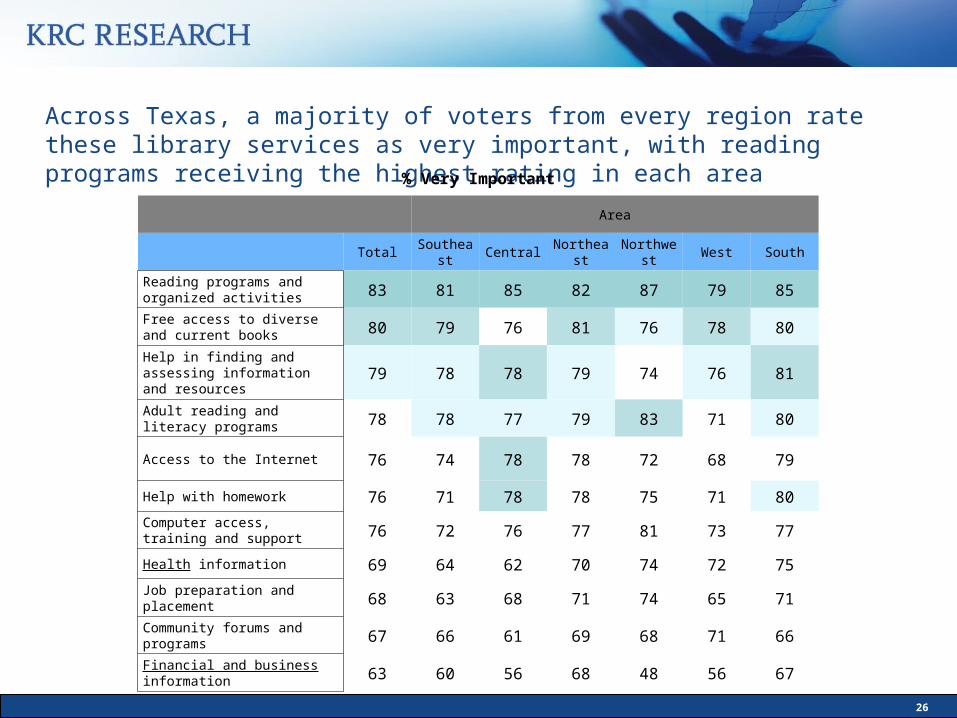
Across Texas, a majority of voters from every region rate these library services as very important, with reading programs receiving the highest rating in each area
Area
Total Southeast Central Northeast Northwest West South
Reading programs and organized activities 83 81 85 82 87 79 85
Free access to diverse and current books 80 79 76 81 76 78 80
Help in finding and assessing information and resources 79 78 78 79 74 76 81
Adult reading and literacy programs 78 78 77 79 83 71 80
Access to the Internet 76 74 78 78 72 68 79
Help with homework 76 71 78 78 75 71 80
Computer access, training and support 76 72 76 77 81 73 77
Health information 69 64 62 70 74 72 75
Job preparation and placement 68 63 68 71 74 65 71
Community forums and programs 67 66 61 69 68 71 66
Financial and business information 63 60 56 68 48 56 67
% Very Important
27
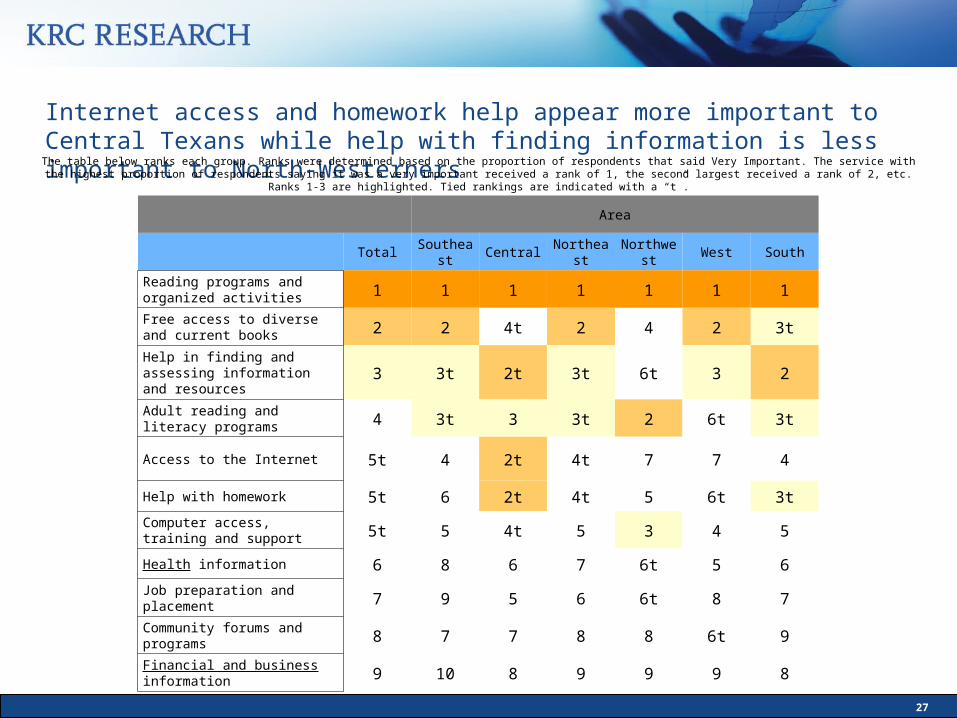
Internet access and homework help appear more important to Central Texans while help with finding information is less important to North-Westerners
Area
Total Southeast Central Northeast Northwest West South
Reading programs and organized activities 1 1 1 1 1 1 1
Free access to diverse and current books 2 2 4t 2 4 2 3t
Help in finding and assessing information and resources 3 3t 2t 3t 6t 3 2
Adult reading and literacy programs 4 3t 3 3t 2 6t 3t
Access to the Internet 5t 4 2t 4t 7 7 4
Help with homework 5t 6 2t 4t 5 6t 3t
Computer access, training and support 5t 5 4t 5 3 4 5
Health information 6 8 6 7 6t 5 6
Job preparation and placement 7 9 5 6 6t 8 7
Community forums and programs 8 7 7 8 8 6t 9
Financial and business information 9 10 8 9 9 9 8
The table below ranks each group. Ranks were determined based on the proportion of respondents that said Very Important. The service with the highest proportion of respondents saying it was a very important received a rank of 1, the second largest received a rank of 2, etc. Ranks 1-3 are highlighted. Tied rankings are indicated with a “t”.

www.krcresearch.com
School Libraries

29
Key Findings: School Libraries• As with public libraries, school libraries also enjoy strong and intense voter
support – regardless of parental status or any other demographic or regional variance
• In fact, Texas voters say school libraries are as important as classroom education and more than eight in ten believe that school libraries make a major contribution to children’s education
• These patterns are similar across the state, although voters in the Southern and Central regions are slightly more intense in their support of school libraries
• Overall, women, older and Hispanic voters are the most intensely supportive of school libraries compared to their counterparts
• School libraries are viewed as essential because they provide opportunities for children to develop reading and research skills and voters see a link between academic success and strong libraries
• Not surprisingly given the level of positive feelings, Texas voters express overwhelming support for statewide legislation to require access to a school library and professional librarian
30
92%
90%
74%
65%
57%
55%
5%
8%
17%
24%
29%
28%
-2%
-2%
-8%
-10%
-14%
-17%
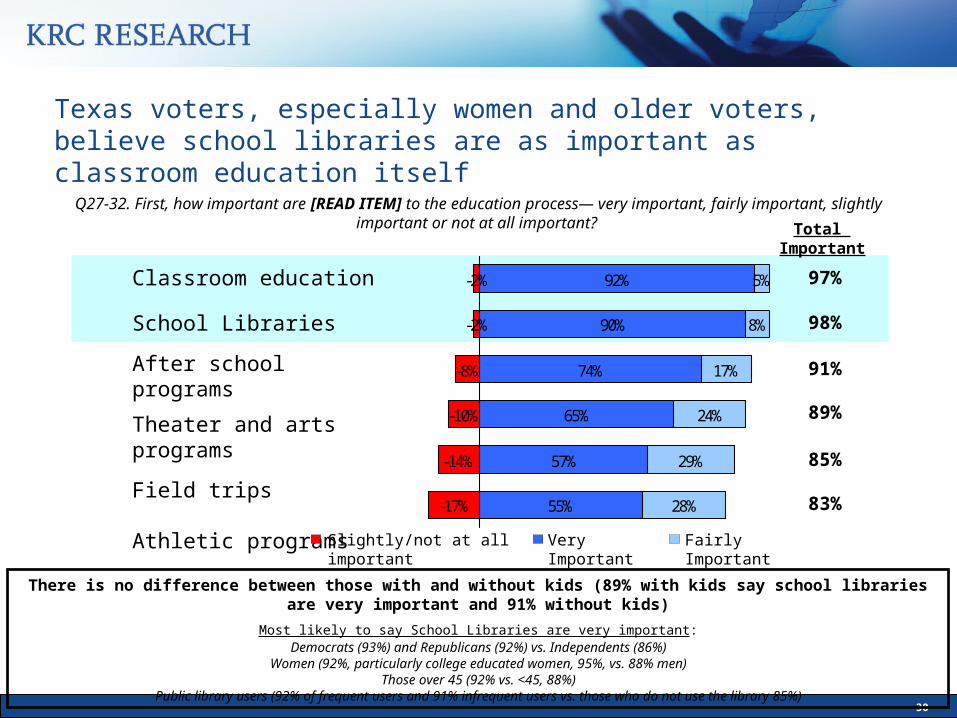
Q27-32. First, how important are [READ ITEM] to the education process— very important, fairly important, slightly important or not at all important?
Texas voters, especially women and older voters, believe school libraries are as important as classroom education itself
Total Important
97%
98%
91%
89%
83%
85%
Classroom education
School Libraries
After school programs
Theater and arts programs
Field trips
Athletic programs
There is no difference between those with and without kids (89% with kids say school libraries are very important and 91% without kids)
Most likely to say School Libraries are very important:Democrats (93%) and Republicans (92%) vs. Independents (86%)
Women (92%, particularly college educated women, 95%, vs. 88% men)Those over 45 (92% vs. <45, 88%)
Public library users (92% of frequent users and 91% infrequent users vs. those who do not use the library 85%)
Very Important Fairly ImportantSlightly/not at all important
31
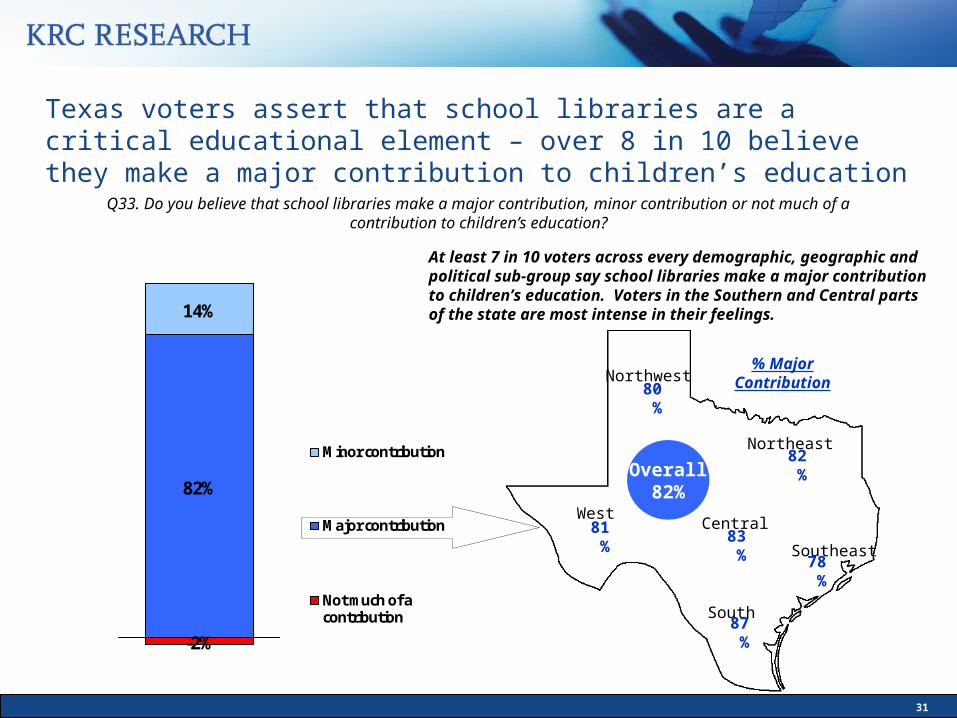
82%
14%
-2%
Minor contribution
Major contribution
Not much of acontribution
Texas voters assert that school libraries are a critical educational element – over 8 in 10 believe they make a major contribution to children’s education
Southeast
South
Central
Northeast
Northwest
West
80%
81% 83%
87%
78%
82%
% Major Contribution
Q33. Do you believe that school libraries make a major contribution, minor contribution or not much of a contribution to children’s education?
Overall82%
At least 7 in 10 voters across every demographic, geographic and political sub-group say school libraries make a major contribution to children’s education. Voters in the Southern and Central parts of the state are most intense in their feelings.

32
-2%
77%
15%
-2%
Somewhat support
Strongly support
Somewhat oppose
Strongly oppose
Thus, not surprisingly, nearly all Texas voters say they would support legislation to require schools to provide libraries and librarians that meet statewide standards
Southeast
South
Central
Northeast
Northwest
West
75%
75% 82%
79%
77%
76%
% Strongly Support
Q41. Currently public schools in Texas are not required to provide students with a school library or librarian. Would you support or oppose legislation that requires public schools to provide students with a school library and
librarian that meet statewide standards? FOLLOW-UP: And, would you strongly (support/oppose) this, or somewhat (support/oppose) this? 93%
Overall77%
33
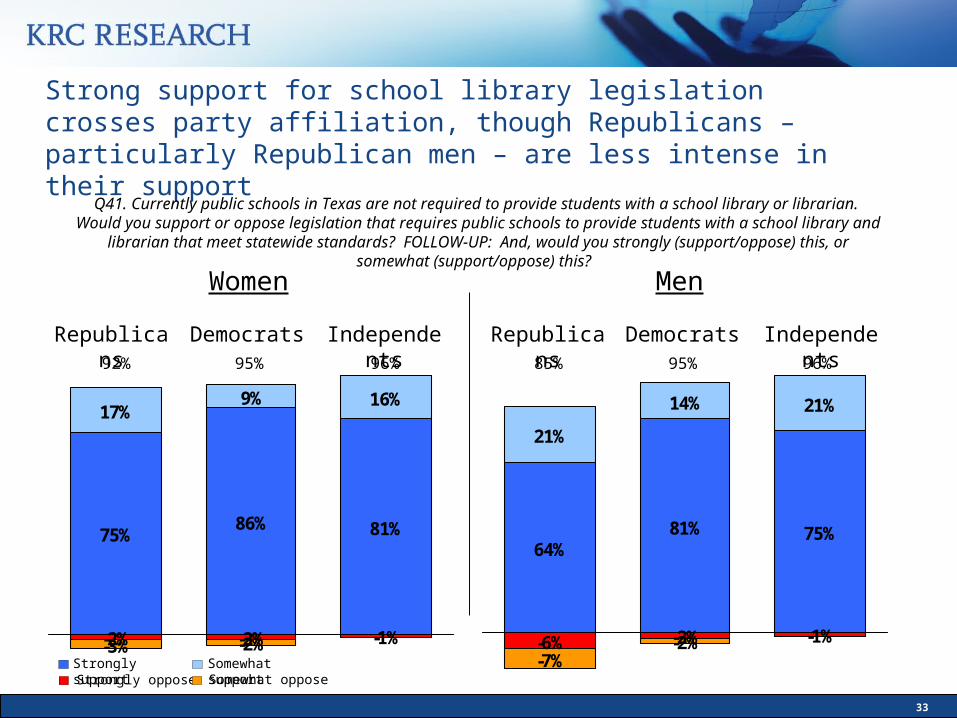
Strong support for school library legislation crosses party affiliation, though Republicans – particularly Republican men – are less intense in their support
-2% -1%-3% -2%
75%86% 81%
17%9% 16%
-2%
Women Men
-2% -1%-7%
-2%
64%81% 75%
21%
14% 21%
-6%
Republicans IndependentsDemocrats Republicans IndependentsDemocrats92% 95% 96% 85% 95% 96%
Q41. Currently public schools in Texas are not required to provide students with a school library or librarian. Would you support or oppose legislation that requires public schools to provide students with a school library and
librarian that meet statewide standards? FOLLOW-UP: And, would you strongly (support/oppose) this, or somewhat (support/oppose) this?
Strongly support Somewhat supportStrongly oppose Somewhat oppose
34
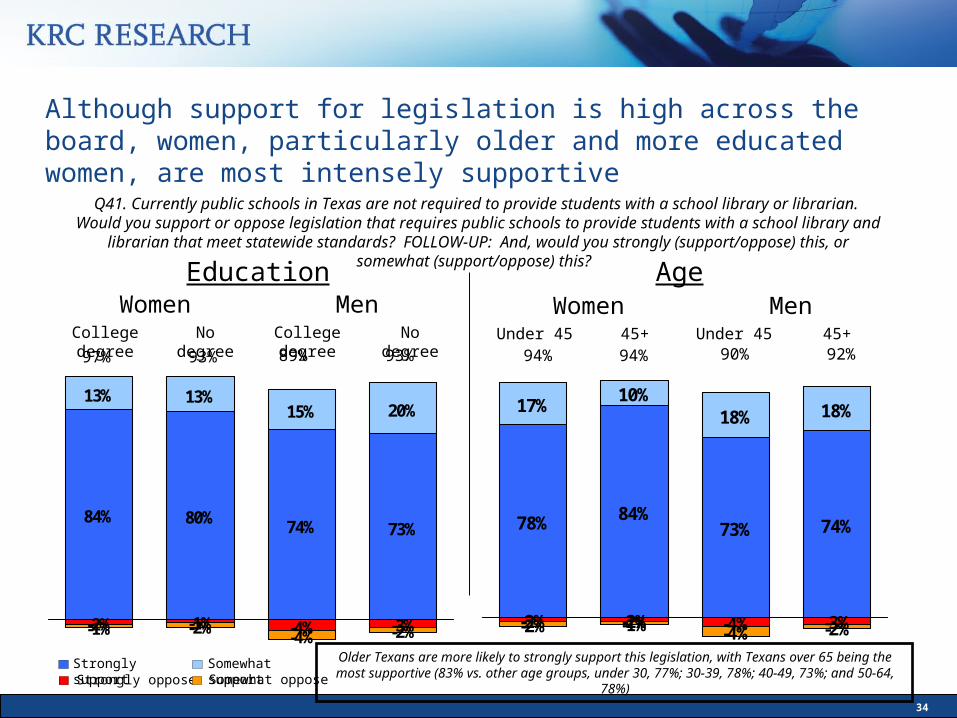
Although support for legislation is high across the board, women, particularly older and more educated women, are most intensely supportive
-1% -4% -3%-1% -2% -4% -2%
84% 80% 74% 73%
13% 13%15% 20%
-2%
Education Age
-2% -4% -3%-2% -1% -4% -2%
78% 84%73% 74%
17% 10%18% 18%
-2%
Women Men Women Men
97% 93% 89% 93%College degree No degree College degree No degree Under 45 45+ Under 45 45+
Q41. Currently public schools in Texas are not required to provide students with a school library or librarian. Would you support or oppose legislation that requires public schools to provide students with a school library and
librarian that meet statewide standards? FOLLOW-UP: And, would you strongly (support/oppose) this, or somewhat (support/oppose) this?
94% 94% 90% 92%
Older Texans are more likely to strongly support this legislation, with Texans over 65 being the most supportive (83% vs. other age groups, under 30, 77%; 30-39, 78%; 40-49, 73%; and 50-64, 78%)
Strongly support Somewhat supportStrongly oppose Somewhat oppose

35
Hispanic and frequent library user voters are also particularly intense in their support for school library legislation compared to their cohorts
-2% -2%-2% -1% -3%
79% 84% 75%
17%11%
17%
-3% -2% -4%-2% -2% -4%
81% 80%66%
13% 15%20%
-2%
Q41. Currently public schools in Texas are not required to provide students with a school library or librarian. Would you support or oppose legislation that requires public schools to provide students with a school library and
librarian that meet statewide standards? FOLLOW-UP: And, would you strongly (support/oppose) this, or somewhat (support/oppose) this?
Race Public Library UseAfrican
American White
95% 95% 92%
Hispanic
95% 95% 87%
Frequent user (at least once every three weeks), less frequent user (use at least a few times a year) and non-users (use once a year or less)
How frequently their kids use the library also plays a role in support. Those whose kids use the library are more likely to strongly support legislation (78% frequent users and 77% infrequent users vs. those whose kids do not use the library, 66%)
Frequent user Nonuser
Infrequent user
Strongly support Somewhat supportStrongly oppose Somewhat oppose
36
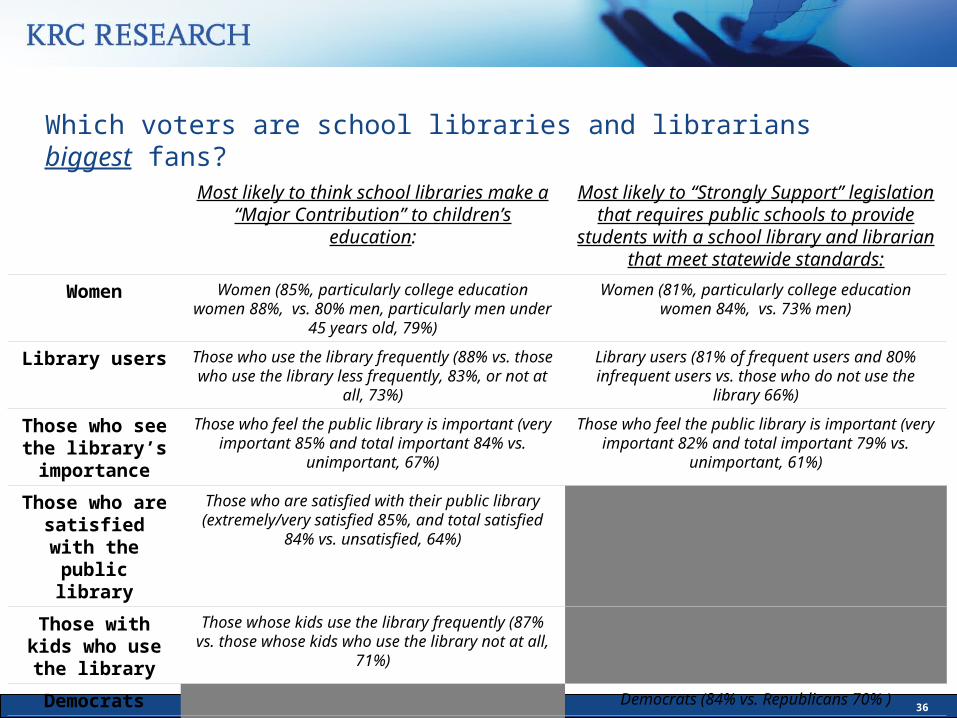
Which voters are school libraries and librarians biggest fans?
Most likely to think school libraries make a “Major Contribution” to children’s education:
Most likely to “Strongly Support” legislation that requires public schools to provide students
with a school library and librarian that meet statewide standards:
Women Women (85%, particularly college education women 88%, vs. 80% men, particularly men under 45 years old,
79%)
Women (81%, particularly college education women 84%, vs. 73% men)
Library users Those who use the library frequently (88% vs. those who use the library less frequently, 83%, or not at all, 73%)
Library users (81% of frequent users and 80% infrequent users vs. those who do not use the library 66%)
Those who see the library’s
importance
Those who feel the public library is important (very important 85% and total important 84% vs.
unimportant, 67%)
Those who feel the public library is important (very important 82% and total important 79% vs.
unimportant, 61%)
Those who are satisfied with the
public library
Those who are satisfied with their public library (extremely/very satisfied 85%, and total satisfied 84%
vs. unsatisfied, 64%)
Those with kids who use the library
Those whose kids use the library frequently (87% vs. those whose kids who use the library not at all, 71%)
Democrats Democrats (84% vs. Republicans 70% )
Non-Caucasian Texans
Non-Caucasian Texans (81% vs. 75% of Caucasians)
37
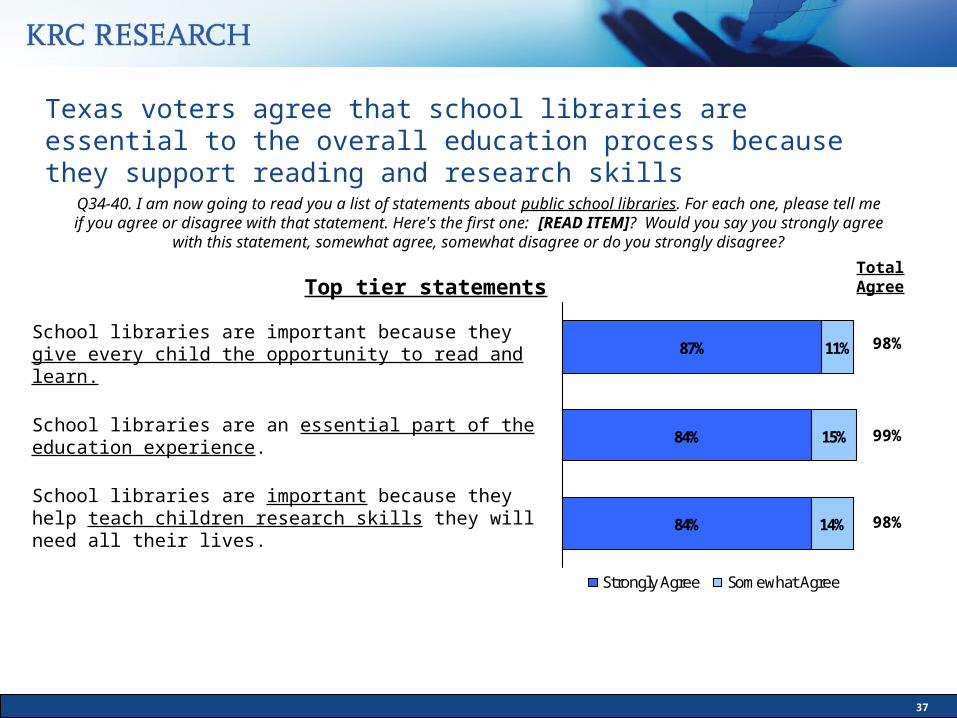
87%
84%
84%
11%
15%
14%
Strongly Agree Somewhat Agree
Texas voters agree that school libraries are essential to the overall education process because they support reading and research skills
Total Agree
98%
99%
98%
Q34-40. I am now going to read you a list of statements about public school libraries. For each one, please tell me if you agree or disagree with that statement. Here's the first one: [READ ITEM]? Would you say you strongly
agree with this statement, somewhat agree, somewhat disagree or do you strongly disagree?
School libraries are important because they give every child the opportunity to read and learn.
School libraries are an essential part of the education experience.
School libraries are important because they help teach children research skills they will need all their lives.
Top tier statements

38
77%
71%
70%
63%
20%
23%
23%
26%
Strongly Agree Somewhat Agree
Texans also agree that school libraries are critical to student achievement and strong school libraries produce students with better problem solving and job skills, although with less intensity
Total Agree
97%
94%
Q34-40. I am now going to read you a list of statements about public school libraries. For each one, please tell me if you agree or disagree with that statement. Here's the first one: [READ ITEM]? Would you say you strongly
agree with this statement, somewhat agree, somewhat disagree or do you strongly disagree?
School libraries are important because they help students do better in school.
Professional school librarians are critical to student achievement.
School libraries serve as another classroom for students.
Students from schools with strong libraries have better problem-solving and job skills.
93%
89%
Second tier statements
39
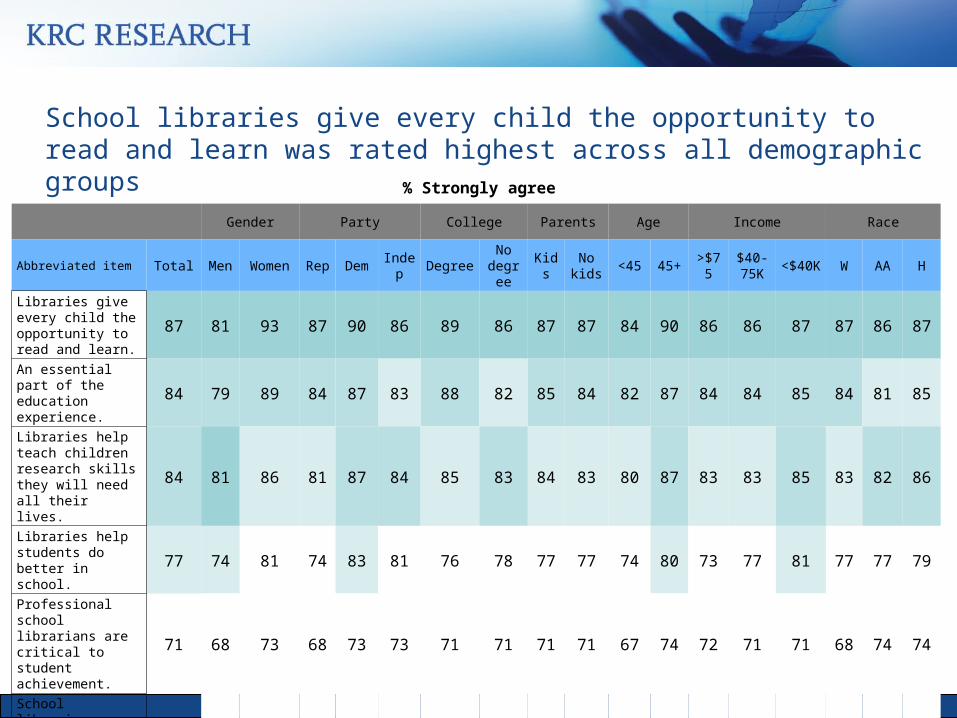
School libraries give every child the opportunity to read and learn was rated highest across all demographic groups
Gender Party College Parents Age Income Race
Abbreviated item Total Men Women Rep Dem Indep Degree No degree Kids No
kids <45 45+ >$75 $40-75K <$40K W AA H
Libraries give every child the opportunity to read and learn.
87 81 93 87 90 86 89 86 87 87 84 90 86 86 87 87 86 87
An essential part of the education experience.
84 79 89 84 87 83 88 82 85 84 82 87 84 84 85 84 81 85
Libraries help teach children research skills they will need all their lives.
84 81 86 81 87 84 85 83 84 83 80 87 83 83 85 83 82 86
Libraries help students do better in school. 77 74 81 74 83 81 76 78 77 77 74 80 73 77 81 77 77 79
Professional school librarians are critical to student achievement.
71 68 73 68 73 73 71 71 71 71 67 74 72 71 71 68 74 74
School libraries serve as another classroom for students.
70 69 71 67 72 79 71 70 68 71 68 72 67 70 74 69 72 72
Students from schools with strong libraries have better problem-solving and job skills.
63 60 66 59 66 68 58 66 58 65 61 65 53 66 68 62 62 67
% Strongly agree

40
Teaching children research skills garnered the strongest agreement in the Western side of the state
Area
Abbreviated item Total Southeast Central Northeast Northwest West South
Libraries give every child the opportunity to read and learn. 87 88 88 87 86 81 88
An essential part of the education experience. 84 84 85 84 80 81 87
Libraries help teach children research skills they will need all their lives.
84 84 83 81 91 85 85
Libraries help students do better in school. 77 76 76 75 70 77 84
Professional school librarians are critical to student achievement.
71 71 68 70 65 71 73
School libraries serve as another classroom for students.
70 67 77 68 68 78 74
Students from schools with strong libraries have better problem-solving and job skills.
63 58 62 64 54 69 69
% Strongly agree

www.krcresearch.com
Library Funding
42
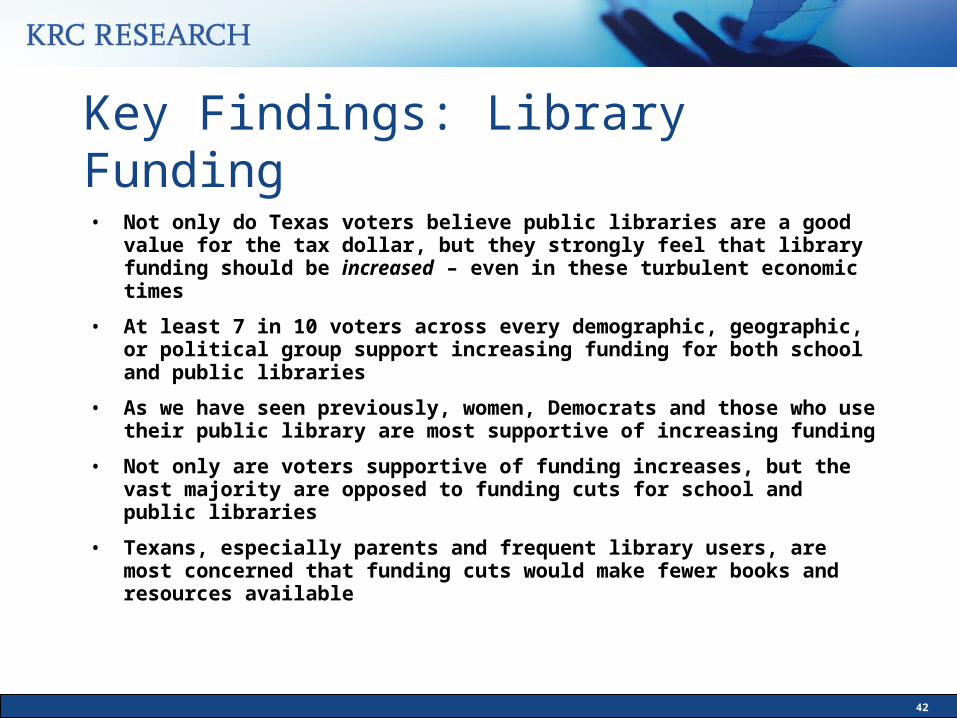
Key Findings: Library Funding
• Not only do Texas voters believe public libraries are a good value for the tax dollar, but they strongly feel that library funding should be increased – even in these turbulent economic times
• At least 7 in 10 voters across every demographic, geographic, or political group support increasing funding for both school and public libraries
• As we have seen previously, women, Democrats and those who use their public library are most supportive of increasing funding
• Not only are voters supportive of funding increases, but the vast majority are opposed to funding cuts for school and public libraries
• Texans, especially parents and frequent library users, are most concerned that funding cuts would make fewer books and resources available

43
Q42. On a scale from 0 to 10, where 0 is “not at all supportive” and a 10 is “very supportive,” how
supportive are you personally of increasing public funding for the public library in your community?
Libraries are so important to Texas voters that strong majorities support increasing public funding for both public and school libraries, even in these tough economic times. Support is higher than we saw nationally in 2006
81%Total Supportive of increasing funding
Q45. On a scale from 0 to 10, where 0 is “not at all supportive” and a 10 is “very supportive,” how
supportive are you personally of increasing public funding for the school libraries in your community?
10% 19%
14%
62%
69%
4%
4% 3%
3%
8%
Public LibraryFunding
School LibraryFunding
Not at all supportive (0,1,2) Not too supportive (3,4) Neutral (5) Somewhat supportive (6,7) Very supportive (8,9,10)
8%Total Not
Supportive
82%Total Supportive of increasing funding
7%Total Not
Supportive
Average Rating
7.82
8.10
At least seven in ten voters across
every demographic,
geographic and political segment support increased funding for both public and school
libraries.
2006 ALA
68% Supportive

44
Q42. On a scale from 0 to 10, where 0 is “not at all supportive” and a 10 is “very supportive,” how
supportive are you personally of increasing public funding for the public library in your community?
Support for increasing both public and school funding is high statewide – with Western, Southern, and Eastern parts of the state being most supportive
Q45. On a scale from 0 to 10, where 0 is “not at all supportive” and a 10 is “very supportive,” how
supportive are you personally of increasing public funding for the school libraries in your community?
Southeast
South
Central
Northeast
Northwest
West
61% Very81% Total
63% Very81% Total
63% Very 76% Total
59% Very 83% Total 63% Very
79% Total
64% Very81% Total
Overall62% Very81% Total
Public Library Funding School Library Funding
Southeast
South
Central
Northeast
Northwest
West
65% Very82% Total
72% Very84% Total
61 % Very 77% Total
77% Very 87% Total 68% Very
81% Total
71% Very82% Total
Overall69% Very82% Total
% Very supportive of increasing funding (ratings 8-10)
% Total supportive of increasing funding (rating 6-10)
45
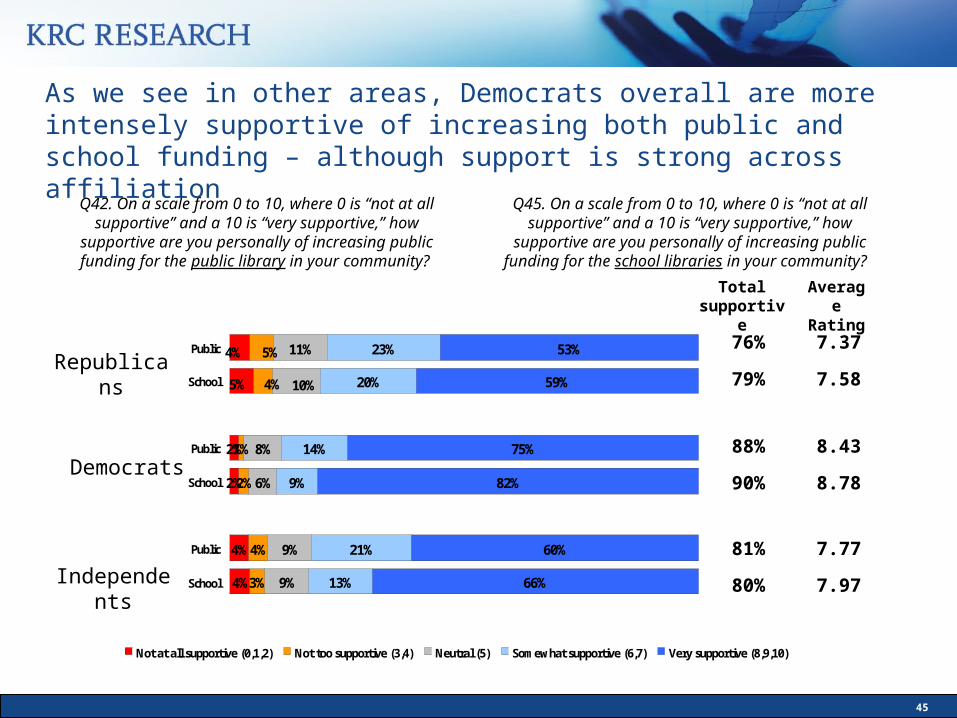
Q42. On a scale from 0 to 10, where 0 is “not at all supportive” and a 10 is “very supportive,” how
supportive are you personally of increasing public funding for the public library in your community?
As we see in other areas, Democrats overall are more intensely supportive of increasing both public and school funding – although support is strong across affiliation
Q45. On a scale from 0 to 10, where 0 is “not at all supportive” and a 10 is “very supportive,” how
supportive are you personally of increasing public funding for the school libraries in your community?
2%
2%
4%
4%
1%
2%
4%
3%
11%
8%
6%
9%
9%
23%
20%
14%
9%
21%
13%
53%
59%
75%
82%
60%
66%
4%
5%
5%
4% 10%
Public
School
Public
School
Public
School
Not at all supportive (0,1,2) Not too supportive (3,4) Neutral (5) Somewhat supportive (6,7) Very supportive (8,9,10)
Republicans
Independents
Democrats
Average Rating
7.37
7.58
8.43
8.78
7.77
7.97
Total supportive
76%
79%
88%
90%
81%
80%
46
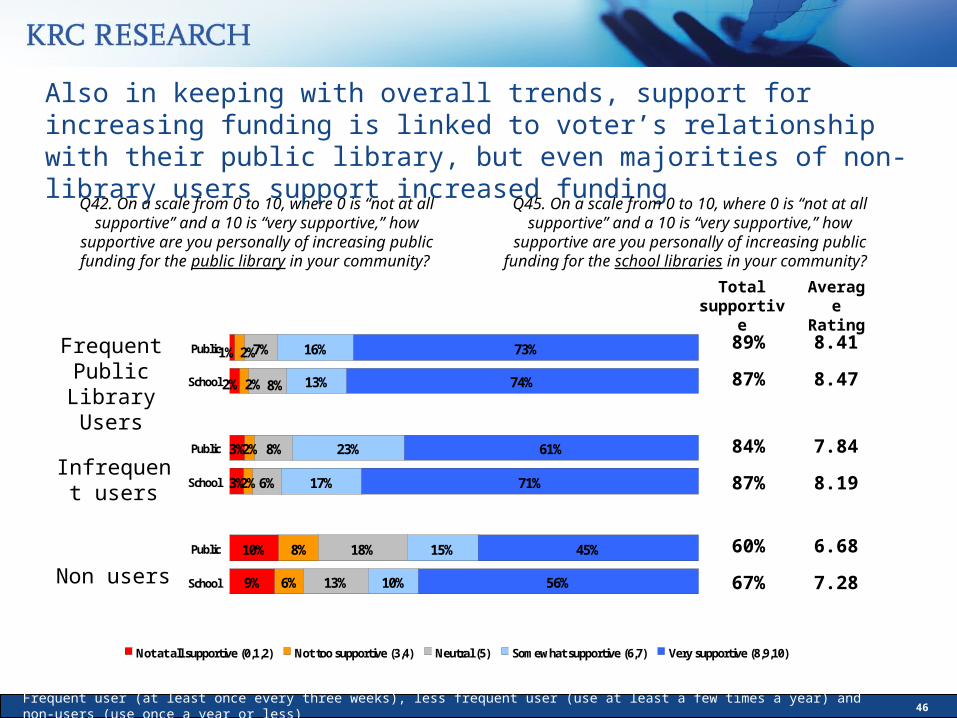
Q42. On a scale from 0 to 10, where 0 is “not at all supportive” and a 10 is “very supportive,” how
supportive are you personally of increasing public funding for the public library in your community?
Also in keeping with overall trends, support for increasing funding is linked to voter’s relationship with their public library, but even majorities of non-library users support increased funding
Q45. On a scale from 0 to 10, where 0 is “not at all supportive” and a 10 is “very supportive,” how
supportive are you personally of increasing public funding for the school libraries in your community?
Frequent Public Library
Users
Non users
Infrequent users
3%
3%
10%
9%
2%
2%
8%
6%
7%
8%
6%
18%
13%
16%
13%
23%
17%
15%
10%
73%
74%
61%
71%
45%
56%
1%
2%
2%
2% 8%
Public
School
Public
School
Public
School
Not at all supportive (0,1,2) Not too supportive (3,4) Neutral (5) Somewhat supportive (6,7) Very supportive (8,9,10)
8.41
8.47
7.84
8.19
6.68
7.28
Frequent user (at least once every three weeks), less frequent user (use at least a few times a year) and non-users (use once a year or less)
Average Rating
Total supportive
89%
87%
84%
87%
60%
67%
47
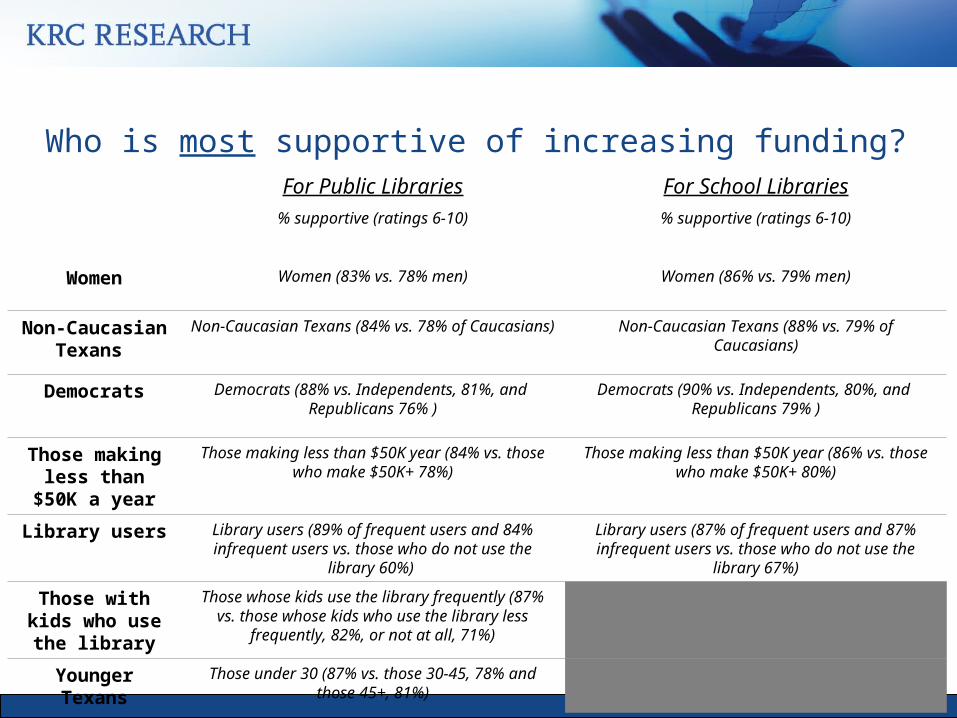
Who is most supportive of increasing funding?For Public Libraries
% supportive (ratings 6-10)
For School Libraries% supportive (ratings 6-10)
Women Women (83% vs. 78% men) Women (86% vs. 79% men)
Non-Caucasian Texans
Non-Caucasian Texans (84% vs. 78% of Caucasians) Non-Caucasian Texans (88% vs. 79% of Caucasians)
Democrats Democrats (88% vs. Independents, 81%, and Republicans 76% )
Democrats (90% vs. Independents, 80%, and Republicans 79% )
Those making less than $50K a year
Those making less than $50K year (84% vs. those who make $50K+ 78%)
Those making less than $50K year (86% vs. those who make $50K+ 80%)
Library users Library users (89% of frequent users and 84% infrequent users vs. those who do not use the library 60%)
Library users (87% of frequent users and 87% infrequent users vs. those who do not use the library 67%)
Those with kids who use the library
Those whose kids use the library frequently (87% vs. those whose kids who use the library less frequently,
82%, or not at all, 71%)
Younger Texans Those under 30 (87% vs. those 30-45, 78% and those 45+, 81%)
48
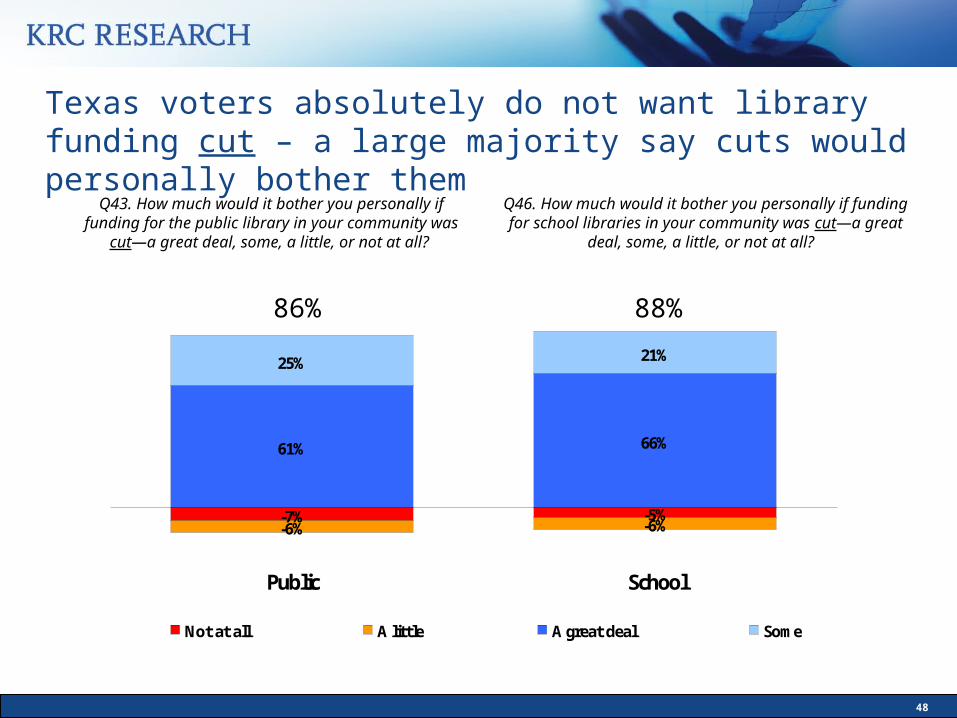
Q43. How much would it bother you personally if funding for the public library in your community was cut
—a great deal, some, a little, or not at all?
Texas voters absolutely do not want library funding cut – a large majority say cuts would personally bother them
-5%-6% -6%
66%
25% 21%
-7%
61%
Public School
Not at all A little A great deal Some
Q46. How much would it bother you personally if funding for school libraries in your community was cut—a great
deal, some, a little, or not at all?
86% 88%
49
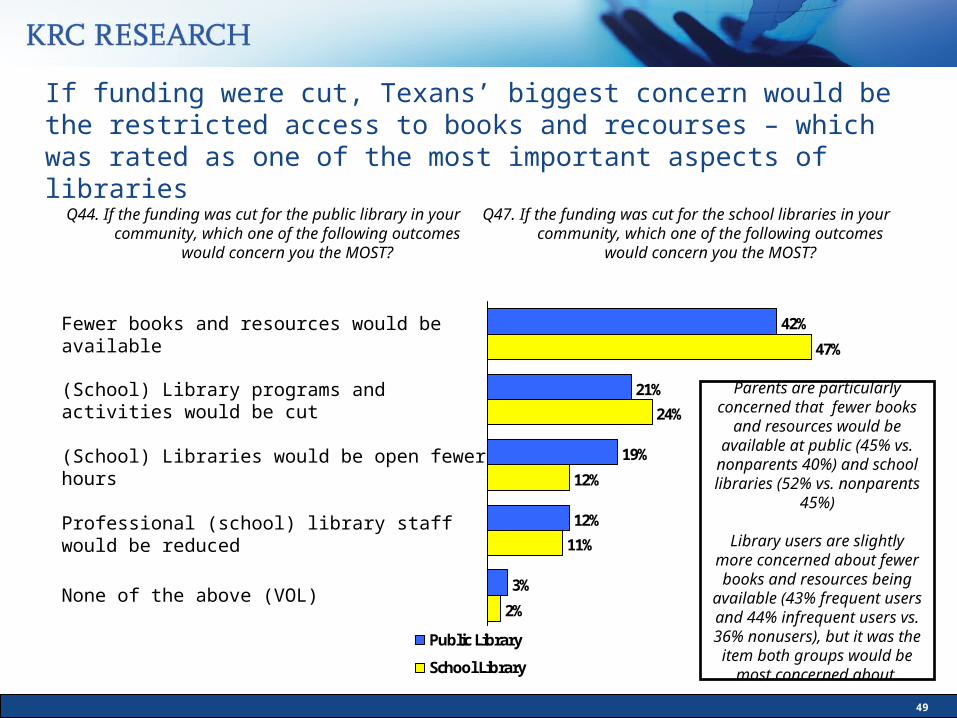
Q44. If the funding was cut for the public library in your community, which one of the following outcomes
would concern you the MOST?
If funding were cut, Texans’ biggest concern would be the restricted access to books and recourses – which was rated as one of the most important aspects of libraries
42%
21%
19%
12%
3%
47%
24%
12%
11%
2%
Public Library
School Library
Q47. If the funding was cut for the school libraries in your community, which one of the following outcomes
would concern you the MOST?
Fewer books and resources would be available
(School) Library programs and activities would be cut
(School) Libraries would be open fewer hours
Professional (school) library staff would be reduced
None of the above (VOL)
Parents are particularly concerned that fewer books and resources would be available at public (45% vs. nonparents 40%)
and school libraries (52% vs. nonparents 45%)
Library users are slightly more concerned about fewer books and resources being available (43% frequent users and 44%
infrequent users vs. 36% nonusers), but it was the item
both groups would be most concerned about.

www.krcresearch.com
Respondent Profile
51
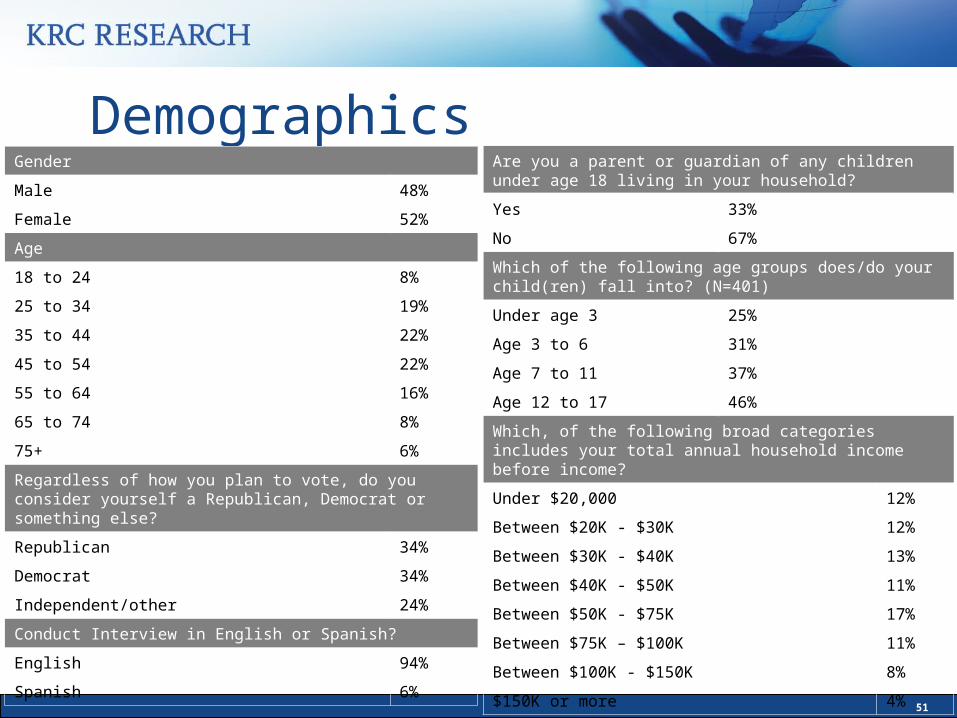
DemographicsGender
Male 48%
Female 52%
Age
18 to 24 8%
25 to 34 19%
35 to 44 22%
45 to 54 22%
55 to 64 16%
65 to 74 8%
75+ 6%
Regardless of how you plan to vote, do you consider yourself a Republican, Democrat or something else?
Republican 34%
Democrat 34%
Independent/other 24%
Conduct Interview in English or Spanish?
English 94%
Spanish 6%
Are you a parent or guardian of any children under age 18 living in your household?
Yes 33%
No 67%
Which of the following age groups does/do your child(ren) fall into? (N=401)
Under age 3 25%
Age 3 to 6 31%
Age 7 to 11 37%
Age 12 to 17 46%
Which, of the following broad categories includes your total annual household income before income?
Under $20,000 12%
Between $20K - $30K 12%
Between $30K - $40K 13%
Between $40K - $50K 11%
Between $50K - $75K 17%
Between $75K – $100K 11%
Between $100K - $150K 8%
$150K or more 4%
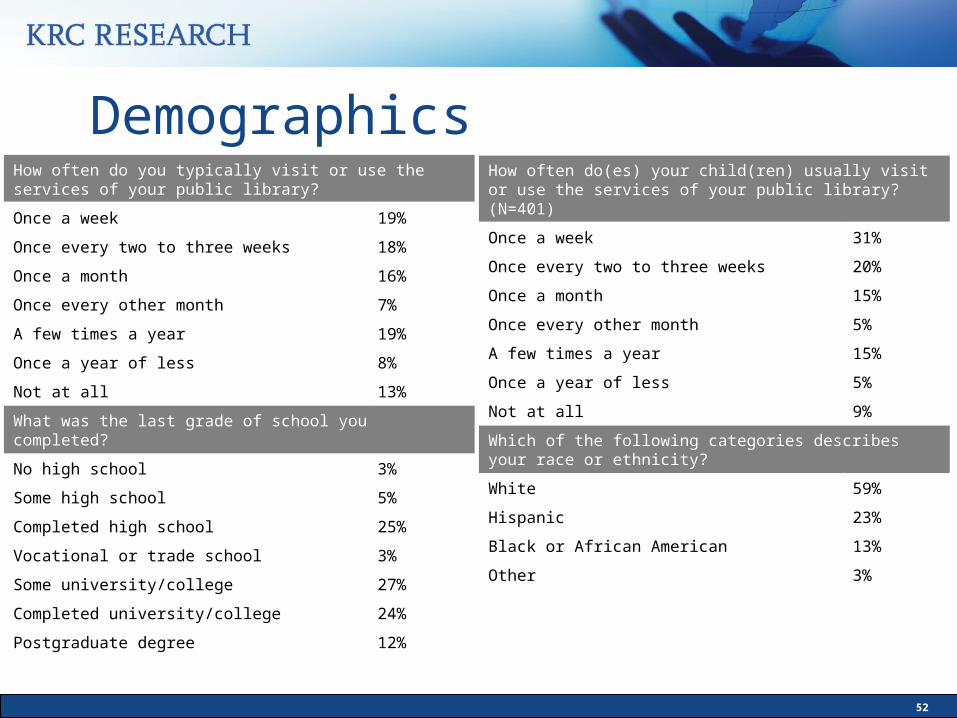
52
DemographicsHow often do you typically visit or use the services of your public library?
Once a week 19%
Once every two to three weeks 18%
Once a month 16%
Once every other month 7%
A few times a year 19%
Once a year of less 8%
Not at all 13%
What was the last grade of school you completed?
No high school 3%
Some high school 5%
Completed high school 25%
Vocational or trade school 3%
Some university/college 27%
Completed university/college 24%
Postgraduate degree 12%
How often do(es) your child(ren) usually visit or use the services of your public library? (N=401)
Once a week 31%
Once every two to three weeks 20%
Once a month 15%
Once every other month 5%
A few times a year 15%
Once a year of less 5%
Not at all 9%
Which of the following categories describes your race or ethnicity?
White 59%
Hispanic 23%
Black or African American 13%
Other 3%
53
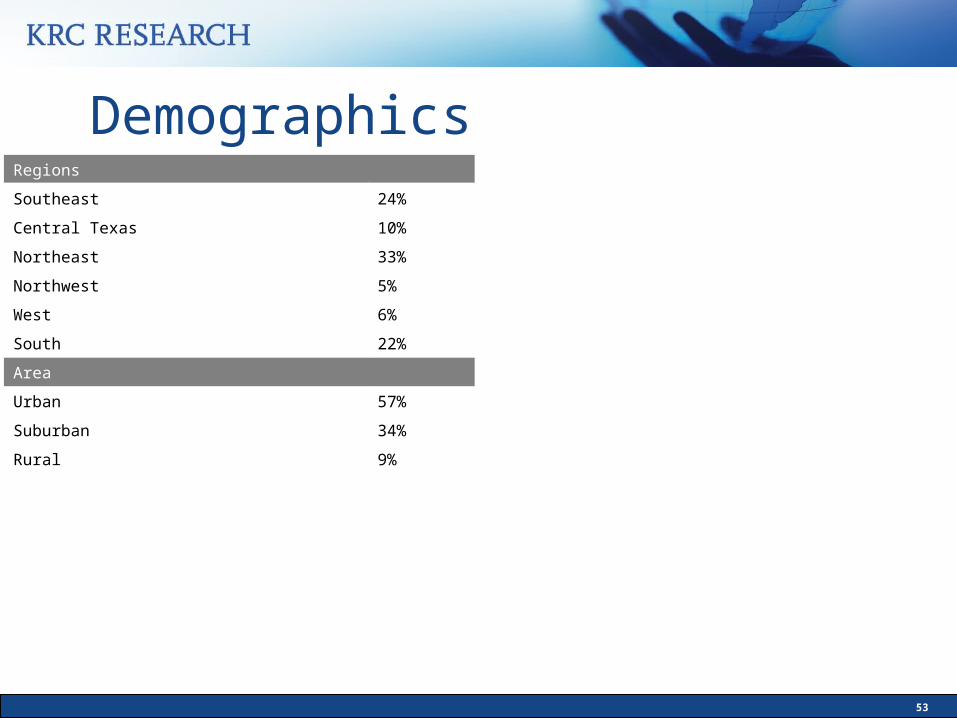
DemographicsRegions
Southeast 24%
Central Texas 10%
Northeast 33%
Northwest 5%
West 6%
South 22%
Area
Urban 57%
Suburban 34%
Rural 9%
54
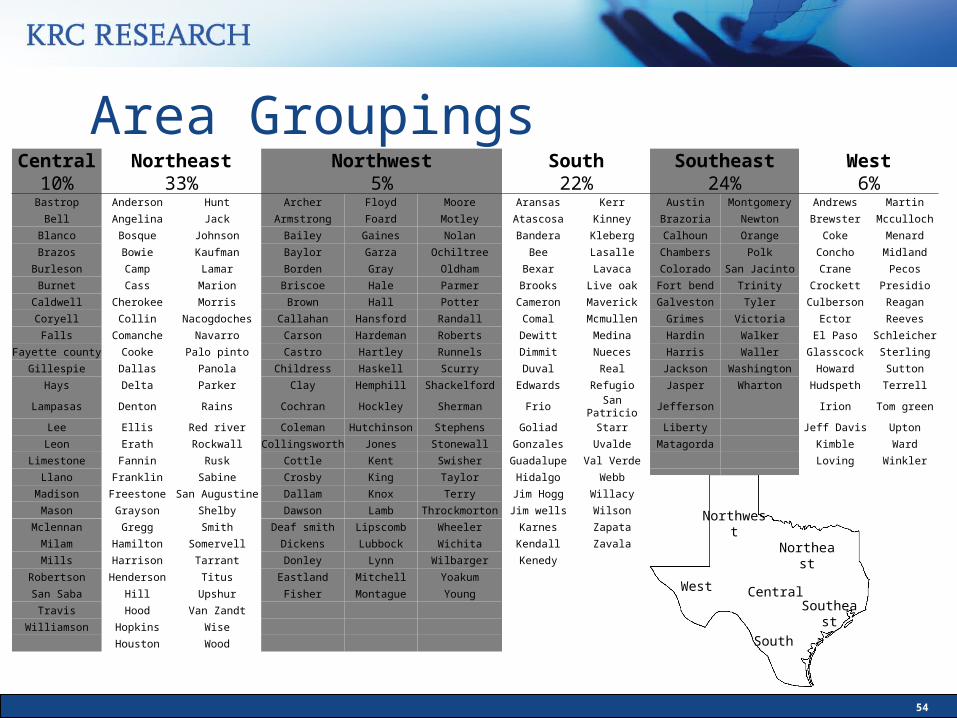
Area GroupingsCentral Northeast Northwest South Southeast West
10% 33% 5% 22% 24% 6%Bastrop Anderson Hunt Archer Floyd Moore Aransas Kerr Austin Montgomery Andrews Martin
Bell Angelina Jack Armstrong Foard Motley Atascosa Kinney Brazoria Newton Brewster Mcculloch
Blanco Bosque Johnson Bailey Gaines Nolan Bandera Kleberg Calhoun Orange Coke Menard
Brazos Bowie Kaufman Baylor Garza Ochiltree Bee Lasalle Chambers Polk Concho Midland
Burleson Camp Lamar Borden Gray Oldham Bexar Lavaca Colorado San Jacinto Crane Pecos
Burnet Cass Marion Briscoe Hale Parmer Brooks Live oak Fort bend Trinity Crockett Presidio
Caldwell Cherokee Morris Brown Hall Potter Cameron Maverick Galveston Tyler Culberson Reagan
Coryell Collin Nacogdoches Callahan Hansford Randall Comal Mcmullen Grimes Victoria Ector Reeves
Falls Comanche Navarro Carson Hardeman Roberts Dewitt Medina Hardin Walker El Paso Schleicher
Fayette county Cooke Palo pinto Castro Hartley Runnels Dimmit Nueces Harris Waller Glasscock Sterling
Gillespie Dallas Panola Childress Haskell Scurry Duval Real Jackson Washington Howard Sutton
Hays Delta Parker Clay Hemphill Shackelford Edwards Refugio Jasper Wharton Hudspeth Terrell
Lampasas Denton Rains Cochran Hockley Sherman Frio San Patricio Jefferson Irion Tom green
Lee Ellis Red river Coleman Hutchinson Stephens Goliad Starr Liberty Jeff Davis Upton
Leon Erath Rockwall Collingsworth Jones Stonewall Gonzales Uvalde Matagorda Kimble Ward
Limestone Fannin Rusk Cottle Kent Swisher Guadalupe Val Verde Loving Winkler
Llano Franklin Sabine Crosby King Taylor Hidalgo Webb
Madison Freestone San Augustine Dallam Knox Terry Jim Hogg Willacy
Mason Grayson Shelby Dawson Lamb Throckmorton Jim wells Wilson
Mclennan Gregg Smith Deaf smith Lipscomb Wheeler Karnes Zapata
Milam Hamilton Somervell Dickens Lubbock Wichita Kendall Zavala
Mills Harrison Tarrant Donley Lynn Wilbarger Kenedy
Robertson Henderson Titus Eastland Mitchell Yoakum
San Saba Hill Upshur Fisher Montague Young
Travis Hood Van Zandt
Williamson Hopkins Wise
Houston Wood
Southeast
South
Central
Northeast
Northwest
West

www.krcresearch.com
For more information:
Victoria SneedExecutive Vice President
Tanya FeinsteinDirector
KRC Research700 13th Street NW
Washington, DC 20005+1 202 628 1118


![University of Texas / Texas Tribune Texas Statewide Survey...Oct 01, 2014 · [RANDOMIZE 1-4] Among likely voters (n=866, MOE is +/-3.33%; 3.60+/-% adjusted for weighting) 1. Ken](https://img.dokumen.tips/doc/110x75/604deafbba11cf58192ba6a2/university-of-texas-texas-tribune-texas-statewide-survey-oct-01-2014-randomize.jpg)