Embed Size (px)
Citation preview

PRODUCTION IMPROVEMENT IN A SMALL AND MEDIUM SIZED
ENTERPRISE (SME) USING LEAN PRODUCTION APPROACH
MOHD HAFIZ BIN HASSAN
UNIVERSITI TUN HUSSEIN ONN MALAYSIA

PRODUCTION IMPROVEMENT IN A SMALL AND MEDIUM SIZED
ENTERPRISE (SME) USING LEAN PRODUCTION APPROACH
MOHD HAFIZ BIN HASSAN
A project report submitted in partial fulfilment of the requirement for the award of the
Degree of Master of Mechanical Engineering
Faculty of Mechanical and Manufacturing Engineering
Universiti Tun Hussein Onn Malaysia
APRIL 2014

iii
This Project Report is lovingly dedicated to my respective parents and in-laws; my
beloved wife, Roselinda and my childrens, Hariz Husaini and Hana Arissa who have
been my constant source of inspiration. They have given me the drive and discipline to
tackle any task with enthusiasm and determination. Without their love and support this
project would not have been made possible.

iv
ACKNOWLEDGEMENT
All praise to Allah the Al-Mighty for his blessing and benevolence.
With a deep sense of gratitude, i would like to express my deepest appreciation to:
My supervisor: Dr. Musli bin Mohammad for his precious advice, proficient
guidance, sharing of experience and continuous encouragement throughout this
project.
Faculty of Mechanical and Manufacturing Engineering, University Tun Hussein
Onn.
Siding Klasik Enterprise manager Mrs. Maznah binti Ahmad her husband Mr.
Shahidi bin Razali and all the employees for their cooperation, giving me the
permission to do necessary research work and collect some data.
My parents and in-laws; my beloved wife, Roselinda and my childrens, Hariz
Husaini and Hana Arissafor their limitless of caring and spiritual through their love
and endless encouragement.
All my friends other individuals who have been involved, directly and indirectly.
Thank you for all your contribution and assistance.
v
ABSTRACT
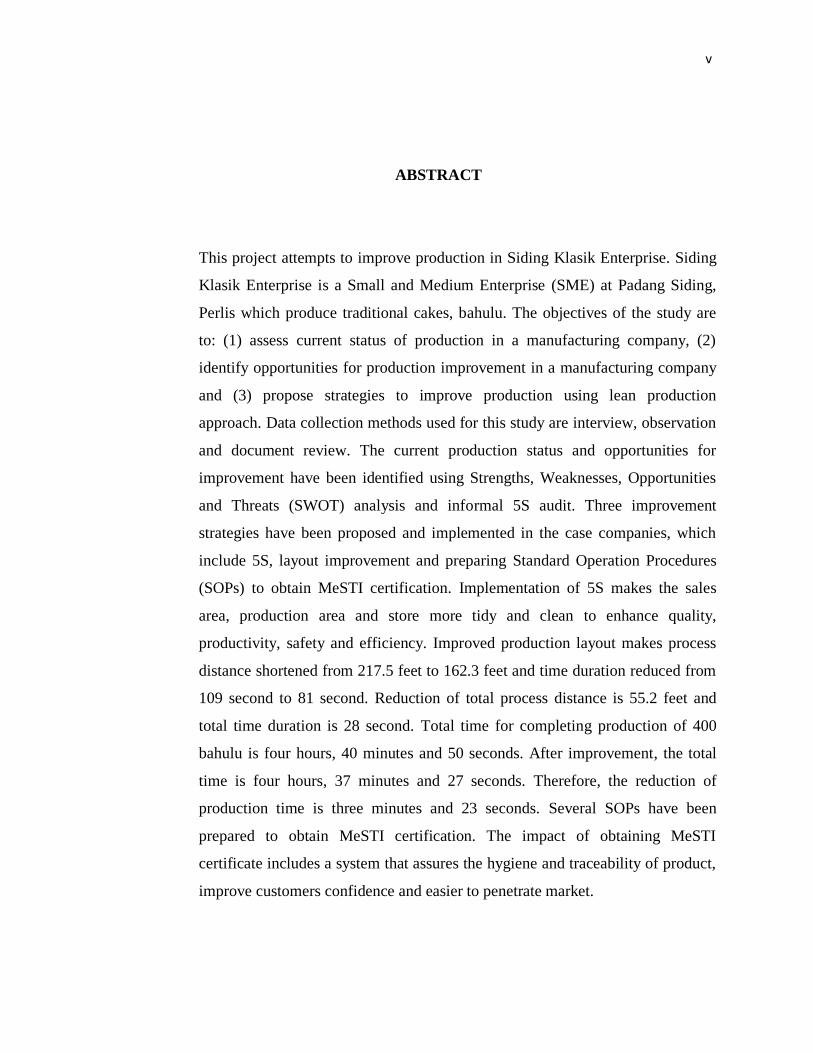
This project attempts to improve production in Siding Klasik Enterprise. Siding
Klasik Enterprise is a Small and Medium Enterprise (SME) at Padang Siding,
Perlis which produce traditional cakes, bahulu. The objectives of the study are
to: (1) assess current status of production in a manufacturing company, (2)
identify opportunities for production improvement in a manufacturing company
and (3) propose strategies to improve production using lean production
approach. Data collection methods used for this study are interview, observation
and document review. The current production status and opportunities for
improvement have been identified using Strengths, Weaknesses, Opportunities
and Threats (SWOT) analysis and informal 5S audit. Three improvement
strategies have been proposed and implemented in the case companies, which
include 5S, layout improvement and preparing Standard Operation Procedures
(SOPs) to obtain MeSTI certification. Implementation of 5S makes the sales
area, production area and store more tidy and clean to enhance quality,
productivity, safety and efficiency. Improved production layout makes process
distance shortened from 217.5 feet to 162.3 feet and time duration reduced from
109 second to 81 second. Reduction of total process distance is 55.2 feet and
total time duration is 28 second. Total time for completing production of 400
bahulu is four hours, 40 minutes and 50 seconds. After improvement, the total
time is four hours, 37 minutes and 27 seconds. Therefore, the reduction of
production time is three minutes and 23 seconds. Several SOPs have been
prepared to obtain MeSTI certification. The impact of obtaining MeSTI
certificate includes a system that assures the hygiene and traceability of product,
improve customers confidence and easier to penetrate market.

vi
ABSTRAK
Projek kajian ini bertujuan untuk meningkatkan pengeluaran di Siding Klasik Enterprise.
Siding Klasik Enterprise adalah Perusahaan Kecil dan Sederhana (PKS) di Padang
Siding, Perlis yang mengeluarkan kek tradisional, bahulu. Objektif kajian ini adalah
untuk: (1) menilai status semasa pengeluaran di syarikat, (2) mengenal pasti peluang-
peluang penambahbaikan pengeluaran di sebuah syarikat dan (3) mencadangkan strategi
untuk meningkatkan pengeluaran menggunakan pendekatan pengeluaran bersandar.
Kaedah pengumpulan data yang digunakan untuk kajian ini adalah melalui temu bual,
pemerhatian dan kajian dokumen. Status pengeluaran semasa dan peluang-peluang
penambahbaikan yang telah dikenal pasti menggunakan analisa Kekuatan, Kelemahan,
Peluang dan Ancaman (SWOT) dan audit 5S secara tidak formal. Tiga strategi
penambahbaikan telah dicadangkan dan dilaksanakan dalam syarikat kes, termasuk 5S,
penambahbaikan susun atur dan penyediaan Prosedur Operasi Standard (SOP) untuk
mendapatkan pensijilan MeSTI. Pelaksanaan 5S menjadikan kawasan jualan, pengeluaran
dan penyimpanan lebih kemas dan bersih untuk meningkatkan kualiti, produktiviti,
keselamatan dan kecekapan. Susun atur yang ditambah baik menjadikan jarak proses
dipendekkan daripada 217.5 kaki kepada 162.3 kaki dan tempoh masa dikurangkan
daripada 109 saat kepada 81 saat. Pengurangan jumlah jarak proses adalah 55.2 kaki dan
tempoh masa keseluruhan adalah 28 saat. Jumlah masa untuk melengkapkan pengeluaran
400 biji bahulu adalah empat jam, 40 minit dan 50 saat. Selepas penambahbaikan, jumlah
masa adalah empat jam, 37 minit dan 27 saat. Oleh itu, pengurangan masa pengeluaran
adalah sebanyak tiga minit dan 23 saat. Beberapa SOP telah disediakan untuk
mendapatkan pensijilan MeSTI. Impak memperolehi sijil MeSTI termasuk sistem yang
menjamin kebersihan dan kebolehkesanan produk, meningkatkan keyakinan pelanggan
dan lebih mudah untuk menembusi pasaran.

vii
CONTENTS
TITLE i
DECLARATION ii
DEDICATION iii
ACKNOWLEDGEMENT iv
ABSTRACT v
ABSTRAK vi
TABLE OF CONTENT vii
LIST OF TABLES x
LIST OF FIGURES xii
LIST OF ABBREVIATIONS xiii
CHAPTER 1 INTRODUCTION 1
1.0 Introduction to the chapter 1
1.1 Background of the study 1
1.2 Problem statement 2
1.3 Objectives of the study 2
1.4 Scope of study 3
1.5 Importance of the study 3

viii
CHAPTER 2 LITERATURE REVIEW 4
2.0 Introduction to the chapter 4
2.1 Lean production system 4
2.2 Tools for lean manufacturing 6
2.3 SWOT analysis 13
2.4 5S 14
2.5 Standard Operation Procedure (SOP) 15
2.6 Previous studies related to lean production 17
2.7 Summary 20
CHAPTER 3 METHODOLOGY 21
3.0 Introduction to the chapter 21
3.1 Case study 21
3.2 Data collection method 24
3.2.1 Interview 24
3.2.2 Observation 25
3.2.3 Document review 25
3.3 Summary 26
CHAPTER 4 RESULTS AND DISCUSSION 27
4.0 Introduction to the chapter 27
4.1 Profiles of the case company 27
4.2 Profiles of the interviewees 28
4.3 Current status of production in the case company 29
4.4 Opportunities for production improvement 31
4.5 Proposed strategies to improve production 33

ix
4.5.1 Implement 5S 34
4.5.2 Improve production layout 39
4.5.2.1 Current and improved production 41
layout
4.5.2.2 Current and improved production layout 44
with process distance
4.5.3 Prepare SOP to obtain MeSTI certificate 51
4.6 Summary 73
CHAPTER 5 CONCLUSIONS AND RECOMMENDATIONS 74
5.0 Introduction to the chapter 74
5.1 Summary of the main research findings in relations 74
to the research objectives
5.2 Recommendations for future research 76
5.3 Conclusion 76
REFERENCES 77

x
LIST OF TABLES
2.1 25 essential lean tools (Vorne Industries, 2010) 6
2.2 Previous studies related to lean manufacturing in industries 17
4.1 Brief Information about case company 28
4.2 Profile of the interviewees 28
4.3 5S audit scorecard (Healthcare Performance Partners, 2009) 32
4.4 Comparison between current layout and improved layout 44
4.5 Comparison between process distance and time duration in current 50
layout and improved layout
4.6 Procedure for employee health inspection 54
4.7 Procedure for infection decease control 55
4.8 Procedure for employee hygiene practices 56
4.9 Procedure for uniform and comply with the requirements 57
4.10 Procedure for training program 58
4.11 Procedure for maintenance and sanitation 59
4.12 Procedure for pest control 61
4.13 Procedure for waste and litter control 62
4.14 Procedure for raw material controls 63
4.15 Procedure for microbiological control 64

xi
4.16 Procedure for chemical control 65
4.17 Procedure for food processing 66
4.18 Procedure for food packaging 68
4.19 Procedure for food storage (end product) 69
4.20 Procedure for food storage (raw materials) 70
4.21 Procedure for food distribution and transportation 71
4.22 Procedure for traceability 72

xii
LIST OF FIGURES
3.1 Research procedure 23
4.1 Siding Klasik Enterprise product logo 27
4.2 Switch with labelling 35
4.3 Fire extinguisher with labelling 35
4.4 Display rack with labelling 36
4.5 Sealer and Scales together with SOP 36
4.6 Mixer with labelling and SOP 37
4.7 Oven with marking and SOP 37
4.8 Flour fried machine with floor marking and SOP 38
4.9 Flour sieve machine with floor marking and SOP 38
4.10 Rack with labelling and tidy arrangement of product 39
4.11 Bahulu process flow chart 41
4.12 Current production layout 42
4.13 Improved production layout 43
4.14 Current production layout with process distance 46
4.15 Improved production layout with process distance 49
4.16 MeSTI guideline book 52
4.17 DeeMaz production layout 53

xiii
LIST OF ABREVIATIONS
CSM - Current State Map
FSM - Future State Map
NVA - Non-Value Adding
NNVA - Necessary but non-value adding
VA - Value Adding
MeSTI - Makanan Selamat Tanggungjawab Industri
CHAPTER 1
INTRODUCTION
1.0 Introduction to the chapter
The chapter explains and focuses on the background of the study, problem statement,
objectives of the study, scope of study and the importance of the study.
1.1 Background of the study
Small and medium sized enterprises (SMEs) have played tremendous role in
manufacturing sector in Malaysia. In the year 2007, Malaysia has 96% of
establishments of SMEs which contributed 30.7% of total manufacturing output and
26.3% of total value added (SME Annual Report, 2007). In addition more than 400,000
or 31% of total Malaysian workforces were employed by SMEs. SME in Malaysia was
defined as a company with full time employees between 5 to 150 and annual sales
turnover between RM251k to RM25 million (SMECORP). The most important issue
faced by Malaysian manufacturing company nowadays is to constantly improve the
quality and productivity of its processes and products. Various lean production tools and
techniques can be used to identify areas for improvement and eventually improve the
production, such as 5S, Kanban System, 7 Waste, Value Stream Mapping, Gemba

2
Walk, SWOT Analysis and standard operating procedures. This project aims to provide
suggestions on how to improve production in a SME using lean production approach.
Previous studies showed total lean practices could help manufacturing organisation to
gain full benefits such as reduction in inventory, lead time and set up time. As the
resources constraint to SMEs, the selected practices should be feasible to the company
problem and involve acceptable amount of investment.
1.2 Problem statement
This project attempts to improve production in Siding Klasik Enterprise. Siding
Klasik Enterprise is a Small and Medium Enterprise (SME) at Padang Siding, Perlis
which produce traditional cakes, Bahulu. SMEs need to be competitive to compete in
the era of globalisation. However, many SMEs in Malaysia are facing problems in the
production such as waiting time, long lead time and unnecessary motion were identified
during the production in order to improve production. To tackle this, lean production
methods such as SWOT analysis, 5S, SOP and process flowchart were used to improve
the production system.
1.3 Objectives of the study
The objectives of the study are:
i. Assess current status of production in a manufacturing company.
ii. Identify opportunities for production improvement in a manufacturing company.
iii. Propose strategies to improve production using lean production approach.

3
1.4 Scope of the study
The scopes of the study are as follows:
i. This study is carried out at one small food manufacturing company. The case
company is Siding Klasik Enterprise.
ii. The main outcome of this project involves suggestions and initial
implementation of several Lean production tools and techniques that can be used
to improve the production in the case company.
1.5 Importance of the study
The important of the study are as follows:
i. To enrich the pool of case study reference materials related to the production
improvement in Malaysian manufacturing industry.
ii. To promote the use of lean tools and technique such as SWOT analysis, 5S, SOP
and process flowchart.
iii. To identify the problems and wastes in the case company.
iv. To assist case company to improve production and reduce costs.

CHAPTER 2
LITERATURE REVIEW
2.0 Introduction to the chapter
This chapter discuss about literature review on lean production. This study focuses on
the lean tools and techniques such as SWOT analysis, 5S and Standard Operation
Procedure (SOP). The review of journals, articles and books have been done to increase
the understanding of this tools.
2.1 Lean production system
The global industry in 21st century has forced most of the leaders in several sectors to
implement more competitive production system. One of the option available as found in
the journals is lean production. Initially it was started at Toyota plant, Japan, which is
known Toyota Production System (TPS). It has been widely known and implemented
since 1960. According to (Rineheart, 1997) lean production will be the standard
production mode of the 21st century. There is no alternative to lean production
(Dankbaar, 1997). Researchers agreed that lean production could be a cost reduction
mechanism and if well implemented it will be a guideline to be world class organization
(Papadopoulu & Ozbayrak, 2005). Theoretically, lean production can be applied to all
industries (Billesbach, 1991 and Womack, 1990). Meier & Forrester (2001) found lean
production was successfully implemented in the tableware industry.
5
This system is comprised of universal set management principles which could be
implemented anywhere and in any company, it doesn’t mean in Japan only (Womack &
Jones, 1990). Therefore, SMEs have been encouraged to apply it (Achanga, 2006;
Womack, 1990; Womack, 1996). It is now widely recognized that organizations that
have mastered lean production methods have substantial cost and quality advantages
over those who still practicing traditional mass production (Pavnaskar, 2003). Lean
production combines the best features of both mass production and craft production, the
ability to reduce costs per unit and dramatically improve quality while at the same time
providing an ever wider range of products and more challenging work (Womack, 1990).
The goal of lean production is to reduce the waste in human effort, inventory,
time to market and production space to become highly responsive to customer demand
while producing world-class quality products in the most efficient and economical
manner (Pavnaskar, 2003). Lean production is known as production without waste (Taj,
2005). The waste is consisting of non added value. There are seven type of waste as
follows: overproduction, waiting time, transportation, inventory, inappropriate
processing, excess motion and product defects (Melton, 2005; Womack & Jones, 2003;
Ohno, 1988). Most of the companies waste about 70%~90% of their available resources
(Taj, 2005). The Lean Enterprise Research Centre (LERC, 2004) at Cardiff Business
School highlighted that for most production operations, the added value and non added
value are as follows
5% of activities add value
35% are necessary non value added activities
60% add no value at all
It shows that the organization no matter the sizes, large or small is crucial to eliminate
waste, in order to increase the profit or return on investment (ROI).

6
2.2 Tools for lean production
In order to reduce or eliminate the above wastes, Lean practitioners utilize many tools
(Plenert, 2012). Successful practitioners recognize that, although most of these may be
implemented as stand-alone programs, few have significant impact when used alone.
Additionally, the sequence of implementation affects the overall impact, and
implementing some out of order may actually produce negative results.
Table 2.1: 25 essential lean tools (Vorne Industries, 2010)
Lean Tool What is it? How does it helps?
5S Organize the work area:
Sort (eliminate that which
is not needed)
Set In Order (organize
remaining items)
Shine (clean and inspect
work area)
Standardize (write
standards for above)
Sustain (regularly apply
the standards)
Eliminates waste that results
from a poorly organized work
area (e.g. wasting time looking
for a tool).
Andon Visual feedback system for the
plant floor that indicates
production status alerts when
assistance is needed, and
empowers operators to stop the
Acts as a real-time
communication tool for the
plant floor that brings
immediate attention to problems
as they occur – so they can be

7
production process. instantly addressed.
Bottleneck
Analysis
Identify which part of the
manufacturing process limits the
overall throughput and improve
the performance of that part of the
process.
Improves throughput by
strengthening the weakest link
in the manufacturing process.
Continuous
Flow
Manufacturing where work-in-
process smoothly flows through
production with minimal (or no)
buffers between steps of the
manufacturing process.
Eliminates many forms of waste
(e.g. inventory, waiting time,
and transport).
Gemba (The
Real Place)
A philosophy that reminds us to
get out of our offices and spend
time on the plant floor – the place
where real action occurs.
Promotes a deep and thorough
understanding of real-world
manufacturing issues – by first-
hand observation and by talking
with plant floor employees.
Heijunka (Level
Scheduling)
A form of production scheduling
that purposely manufactures in
much smaller batches by
sequencing (mixing) product
variants within the same process.
Reduces lead times (since each
product or variant is
manufactured more frequently)
and inventory (since batches are
smaller).
Hoshin Kanri
(Policy
Deployment)
Align the goals of the company
(Strategy), with the plans of
middle management (Tactics) and
the work performed on the plant
floor (Action).
Ensures that progress towards
strategic goals is consistent and
thorough – eliminating the
waste that comes from poor
communication and inconsistent
direction.

8
Jidoka
(Automation)
Design equipment to partially
automate the manufacturing
process (partial automation is
typically much less expensive
than full automation) and to
automatically stop when defects
are detected.
After Jidoka, workers can
frequently monitor multiple
stations (reducing labour costs)
and many quality issues can be
detected immediately
(improving quality).
Just-In-Time
(JIT)
Pull parts through production
based on customer demand
instead of pushing parts through
production based on projected
demand. Relies on many lean
tools, such as Continuous Flow,
Heijunka, Kanban, Standardized
Work and Takt Time.
Highly effective in reducing
inventory levels. Improves cash
flow and reduces space
requirements.
Kaizen
(Continuous
Improvement)
A strategy where employees work
together proactively to achieve
regular, incremental
improvements in the
manufacturing process.
Combines the collective talents
of a company to create an
engine for continually
eliminating waste from
manufacturing processes.
Kanban (Pull
System)
A method of regulating the flow
of goods both within the factory
and with outside suppliers and
customers. Based on automatic
replenishment through signal
cards that indicate when more
goods are needed.
Eliminates waste from inventory
and overproduction. Can
eliminate the need for physical
inventories (instead relying on
signal cards to indicate when
more goods need to be ordered).

9
KPI (Key
Performance
Indicator)
Metrics designed to track and
encourage progress towards
critical goals of the organization.
Strongly promoted KPIs can be
extremely powerful drivers of
behaviour – so it is important to
carefully select KPIs that will
drive desired behaviour.
The best manufacturing KPIs:
Are aligned with top-
level strategic goals
(thus helping to achieve
those goals)
Are effective at exposing
and quantifying waste
(OEE is a good example)
Are readily influenced
by plant floor employees
(so they can drive
results)
Muda (Waste) Anything in the manufacturing
process that does not add value
from the customer’s perspective.
Eliminating Muda (waste) is the
primary focus of lean
production.
Overall
Equipment
Effectiveness
(OEE)
Framework for measuring
productivity loss for a given
manufacturing process. Three
categories of loss are tracked:
Availability (e.g. down
time)
Performance (e.g. slow
cycles)
Quality (e.g. rejects)
Provides a benchmark/baseline
and a means to track progress in
eliminating waste from a
manufacturing process. 100%
OEE means perfect production
(manufacturing only good parts,
as fast as possible, with no
down time).
PDCA (Plan,
Do, Check, Act)
An iterative methodology for
implementing improvements:
Plan (establish plan and
Applies a scientific approach to
making improvements:
Plan (develop a

10
expected results)
Do (implement plan)
Check (verify expected
results achieved)
Act (review and assess; do
it again)
hypothesis)
Do (run experiment)
Check (evaluate results)
Act (refine your
experiment; try again)
Poka-Yoke
(Error Proofing)
Design error detection and
prevention into production
processes with the goal of
achieving zero defects.
It is difficult (and expensive) to
find all defects through
inspection, and correcting
defects typically gets
significantly more expensive at
each stage of production.
Root Cause
Analysis
A problem solving methodology
that focuses on resolving the
underlying problem instead of
applying quick fixes that only
treat immediate symptoms of the
problem. A common approach is
to ask ‘why’ five times – each
time moving a step closer to
discovering the true underlying
problem.
Helps to ensure that a problem
is truly eliminated by applying
corrective action to the root
cause of the problem.
Single Minute
Exchange of
Die (SMED)
Reduce setup (changeover) time
to less than 10 minutes.
Techniques include:
Convert setup steps to be
external (performed while
Enables manufacturing in
smaller lots, reduces inventory,
and improves customer
responsiveness.

11
the process is running)
Simplify internal setup
(e.g. replace bolts with
knobs and levers)
Eliminate non-essential
operations
Create standardized work
instructions
Six Big Losses Six categories of productivity
losses that are almost universally
experienced in manufacturing:
Breakdowns
Setup/Adjustments
Small Stops
Reduced Speed
Start up Rejects
Production Rejects
Provides a framework for
attacking the most common
causes of waste in
manufacturing.
SMART Goals Goals that are: Specific,
Measurable, Attainable, Relevant,
and Time-Specific.
Helps to ensure that goals are
effective.
Standardized
Work
Documented procedures for
manufacturing that capture best
practices (including the time to
complete each task). Must be
“living” documentation that is
easy to change.
Eliminates waste by consistently
applying best practices. Forms a
baseline for future improvement
activities.

12
Takt Time The pace of production (e.g.
manufacturing one piece every 34
seconds) that aligns production
with customer demand.
Calculated as Planned Production
Time / Customer Demand.
Provides a simple, consistent
and intuitive method of pacing
production. Is easily extended to
provide an efficiency goal for
the plant floor (Actual Pieces /
Target Pieces).
Total
Productive
Maintenance
(TPM)
A holistic approach to
maintenance that focuses on
proactive and preventative
maintenance to maximize the
operational time of equipment.
TPM blurs the distinction between
maintenance and production by
placing a strong emphasis on
empowering operators to help
maintain their equipment.
Creates a shared responsibility
for equipment that encourages
greater involvement by plant
floor workers. In the right
environment this can be very
effective in improving
productivity (increasing up time,
reducing cycle times, and
eliminating defects).
Value Stream
Mapping
A tool used to visually map the
flow of production. Shows the
current and future state of
processes in a way that highlights
opportunities for improvement.
Exposes waste in the current
processes and provides a
roadmap for improvement
through the future state.
Visual Factory Visual indicators, displays and
controls used throughout the
manufacturing plants to improve
communication of information.
Makes the state and condition of
manufacturing processes easily
accessible and very clear – to
everyone.
Table 2.1 is a collection of 25 essential lean tools. Each tool is distilled into a simple
description of what it is and how it helps. Some are used only in manufacturing

13
organizations, but most apply equally to service industries. Lean tools that focused in
this project are SWOT analysis, 5S and Standard Operation Procedure (SOP).
2.3 SWOT analysis
SWOT is one of those acronyms that many business people use, few understand what it
means, and even fewer understand how to use it. Yet an effective SWOT analysis is
essential to the continued success of any business.
A SWOT analysis for business should be conducted at least every year (Scott,
2004). SWOT results shape a company's marketing plan, strategies and tactics.
The elements of SWOT are as follows (Scott, 2004):
(a) Strengths
These are defined as positive factors within company that may enhance its
ability to win future business. Examples of these factors might include specific
skills or products, exclusive knowledge or experience, strong customer
relationships, special resources, manufacturing advantages, delivery advantages,
marketing advantages and monetary advantages.
(b) Weaknesses
These are defined as negative factors within company that may impede its
ability to win future business. Examples might include the lack of a specific
product, capability, experience or skill-set. Weaknesses might also include
deficient knowledge of a customer or a competitor, an unproven product or
business in market, lacking the monetary resources of larger competitors or
insufficient resources to overcome existing barriers to market entry.
(c) Opportunities
These are defined as positive factors outside company that could possibly be
developed an advantage and result in additional future business. Examples of
these factors include inexperienced competition, greater-than-predicted
expansion of product market, possible tactics to increase product profitability,
unexpected opportunities to increase company's visibility, other competitors
14
going out of business, additional markets opening up, unforeseen favourable
publicity and customer demand growing at a greater-than-predicted rate.
(d) Threats
These are defined as negative factors outside company which could result in a
negative impact on company ability to achieve sales projections. Examples
include being faced with an unanticipated decrease in customer base, perceived
obsolescence of product, unexpected new competitors that are experienced or
well-financed, an economic downturn, skyrocketing interest rates, or sudden
scarcity of a material required for product.
To achieve maximum results, conduct a SWOT analysis every six to 12 months,
depending on the changing dynamics of marketplace.
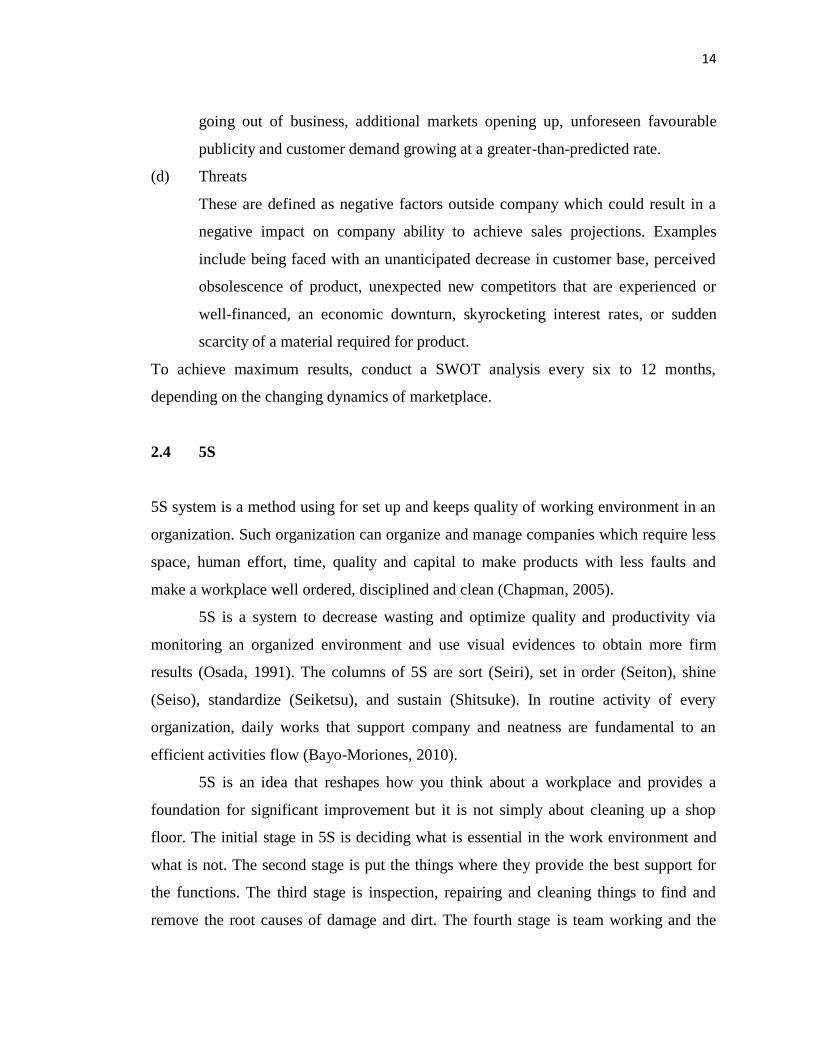
2.4 5S
5S system is a method using for set up and keeps quality of working environment in an
organization. Such organization can organize and manage companies which require less
space, human effort, time, quality and capital to make products with less faults and
make a workplace well ordered, disciplined and clean (Chapman, 2005).
5S is a system to decrease wasting and optimize quality and productivity via
monitoring an organized environment and use visual evidences to obtain more firm
results (Osada, 1991). The columns of 5S are sort (Seiri), set in order (Seiton), shine
(Seiso), standardize (Seiketsu), and sustain (Shitsuke). In routine activity of every
organization, daily works that support company and neatness are fundamental to an
efficient activities flow (Bayo-Moriones, 2010).
5S is an idea that reshapes how you think about a workplace and provides a
foundation for significant improvement but it is not simply about cleaning up a shop
floor. The initial stage in 5S is deciding what is essential in the work environment and
what is not. The second stage is put the things where they provide the best support for
the functions. The third stage is inspection, repairing and cleaning things to find and
remove the root causes of damage and dirt. The fourth stage is team working and the

15
members must have consensus on normal and new way of work. The fifth stage is
personal discipline to follow the standards and to perform the personal characteristics,
cleanliness and neatness of the organization.
2.5 Standard Operation Procedure (SOP)
Standardization is defined as an activity that gives rise to solutions for repetitive
application to problems in various disciplines. Generally, the activity constitutes the
process of establishing (determining, formulating, and issuing) and implementing
standards. Thus, standards are the perfect result of a standardization activity and inside
the context of quality systems consist of quality documents or documents related to the
quality system. High levels of quality are important to accomplish company business
objectives. Quality, a source of competitive benefit, should stay a symbol of company
products and services. High quality is not an additional value; it is an important
elementary necessity. Each employee in all organizational units is responsible for
guaranteeing that their work processes are effective and continually getting better. Top
management should provide the training and an appropriate motivating environment to
support teamwork both inside and across organizational units for employees to advance
processes. Ultimately, everyone in an institution is responsible for the quality of its
products and services. An institution in the role of a sponsor of clinical trials can best
achieve its business objectives by establishing and managing robust quality systems
with their integral quality documents including standard operating procedures (SOPs)
(Manghani, 2011). The quality management system must evolve by trial and error, with
enlarging experience, by group discussions and with changing understanding. In the
beginning, attention will be focused on basic operational SOPs, afterwards moving to
record keeping (as more and more SOPs are issued) and filling gaps as practice admits
missing links in the chain of quality assurance. Essentially problems will turn up. One
way to react to them is to talk with people in other laboratories who have faced similar
problems. It should not be forgotten that quality management is a tool rather than a goal.
The goal is quality performance of the laboratory. The autonomy is the self-government

16
that originated from morality, with morality proceeding from knowledge and self-
discipline. An appropriate level of authority, discretion, formalization, and rule structure
is a requirement for worker empowerment, which we see as consistent with the concept
of self-government. Autonomy is the quality or state of being self-governing; especially:
the right of self-government; self-directing freedom and especially moral
independence’. Necessitated SOP use will be absolutely related to the sense of self-
determination experienced by workers. Worker participation in SOP advancement and
clarification controls the affiliation between required SOP use and the sense of self-
determination experienced by workers.
Standard Operating Procedures (SOP) is a process document that describes in
detail the way that an operator should perform a given operation. SOPs involve the
purpose of the operation, the equipment and materials required, how to perform the set-
up and operations required for the process, how to perform the maintenance and
shutdown operations carried out by the worker, a description of safety issues, trouble-
shooting, a list of spare parts and where to find them, illustrations, and checklists. The
SOP is one of many process documents which are needed for consistent operation of a
given process, with other documents involving process flow charts, material
specifications, and so forth.
The purpose of SOPs today is to guarantee that all workers are performing tasks
in the same way, which is a needed for condition to get expected output from the
process. When all workers perform their tasks constantly, it becomes possible to run
controlled experiments to test the impact of changing various process parameters. When
a process change is shown to improve process performance, SOPs are updated and
workers are trained to the new procedures. All over the process, it is adorable to involve
workers in SOP development and to praise worker ideas for the SOP improvement. For
constant organizational advance, organized processes need to be constantly improved,
hence necessitating ideas from those workers using those procedures. Ideas are not
creative simply because they deviate from organized knowledge; ideas are creative
when they are novel and suitable to the task at hand. Workers may have many ideas;
nevertheless, what they choose to do with their ideas will depend on various

17
organizational and individual-difference factors. The most important factor, however,
for the advancement of creative behaviours is worker intrinsic motivation– a sine qua
non of worker creative contribution. By the help of confirmatory factor analysis, the
Spreitzer construct validated the four dimensions of intrinsic motivation such as
psychological authorization: (a) Competence (example item includes ‘I am confident
about my ability to do my job’); (b) Meaning (example item includes ‘The work I do is
very important to me’; (c) Impact (example item includes ‘I have a great deal of control
over what happens in my department’; (d) Self-determination (example item includes ‘I
can decide on my own how to go about doing my work’). Furthermore, Spreitzer argued
and empirically established that an antecedent condition to innovation such as creativity
and effectiveness is intrinsic motivation (De Trevil, 2005).
2.6 Previous studies related to lean production
Table 2.2 below summaries previous studies related to lean production.
Table 2.2: Previous studies related to lean production in industries.
Author Description
1. Daud (2008) Objective:-
i. To investigate the implementation of lean production system at
the case company.
ii. To compare the implementation of lean production system
between two case companies.
iii. To propose a guideline based on the findings of the company.
Result:-
Successful implemented Lean Production System but the
company have different strategies and techniques. Achieve
second objective to compare the implementation of lean

18
production system between two companies which cover the
strategies of implementation, method and tools utilized, critical
success factor and benefits of the implementation.
2. Shahram
(2008)
Objective:-
i. To investigate the adaptation of lean production and assess its
current state of practice in selected plants in electronics,
telecommunication, wireless, computer, food/beverage, garment,
pharmaceutical, chemical, petroleum, printing, A/C and heating,
and a few others in China.
ii. An assessment tool is used to evaluate actual manufacturing
practice related to key areas of inventory; team approach;
processes; maintenance; layout/handling; suppliers; setups;
quality; and scheduling and control. Manufacturing executives at
manufacturing plants answered 40 questions in the assessment.
Each response in the assessment is scored and a total score for
each plant is recorded by adding average scores for all areas.
Result:-
The results of assessments show that the petroleum industry is in
lead among all industries, followed by computer,
telecommunication/wireless, and electronics industries. The
findings from lean production system design-related questions
show low scores in layout design, volume/mix flexibility, setup,
visual factory, and point-of-use delivery. However, plants earned
high scores in materials flow, scheduling/control, on-time
delivery of finished goods, and overall defect rate. The findings
have some similarity with recent studies about Chinese
manufacturing firms' performance and competitiveness.
3. Kai (2009) Objective:-
i. Identify the appropriate Value Stream Mapping tool.

19
ii. Develop Value Stream Map for the plastic manufacturing
industry to improve the production.
Result:-
Value stream mapping (VSM) has shown to be practical and
being the feasible solution to decrease no added and increase the
added value for the company. Hence, they had implemented
directly the future state map that had been created.
4. Heinavara
(2010)
i. Objective:-
ii. i. Obtain new practical layout yielding area saving solutions.
iii. ii. Undertaken case study as a rehearsals of lean method.
iv. Results:-
The new layout was accomplished; many task and improvement
which occurred during the process still awaited execution.
5. Yunos (2010) Objective:-
i. Identify an appropriate value stream mapping tool.
ii. Develop Value Stream Map for the Paper Based
Manufacturing Industry to improve the productivity.
Result:-
The study was achieved the objective set it the early stage of
study. VSM method has shown to be practical and easy to
develop.
Succeed to identify where the waste occurs at the system level
and then develop a comprehensive plan to improve it.
Previous studies showed total lean production practices could help
manufacturing organization to gain full benefits i.e. reduction in inventory, lead time,
set up time, and etc., provided they’re adopting all practices. As the resources constraint
20
to SMEs, the selected practices should be feasible to the company problem and low
investment.
2.7 Summary
Lean is a way of thinking about the manufacturing process with a specific focus on
steps that add value to the end product. In lean companies, any step that doesn't add
value is considered. There are many benefits that are associated with lean production
such as improved customer service; delivering exactly what the customer wants when
they want it, improved productivity; improvements in throughput and value add per
person, quality; reductions in defects and rework, Innovation; staff are fully involved so
improved morale and participation in the business, reduced waste; less transport,
moving, waiting, space, and physical waste, improved lead times; business able to
respond quicker, quicker set ups, fewer delay and improved stock turns; less work in
progress and Inventory, so less capital tied up. SWOT analysis, 5S system, SOP and
process flowchart are some examples of tools that can be used to improve production in
SME.

CHAPTER 3
METHODOLOGY
3.0 Introduction to the chapter
Methodology involves a set of procedure in order to complete the study. Therefore, it
described the method used to collect data and gather information to reach the aim and
the scope of this study.
3.1 Case study
This study used case study approach. Yin (1994) suggested four stages of case study
approach:
(i) Design the case study,
(ii) Conduct the case study,
(iii) Analyze the case study evidence, and
(iv) Developed the conclusions, recommendations and implications.
Yin (1994) also listed six sources of evidence for data collection in the case
study protocol: documentation, archival records, interviews, direct observation,
participant observation, and physical artefacts. Not all of these sources of evidence need
to be used in every case study (Yin, 1994). Research procedures for this study are

22
summarized in Figure 3.1. It started with determine case company by collecting data
from observation and interviews by review document of company profile, operator
profile, current state map, process flow, production time and current lean applications.
All data collected were analyzed to identify opportunities for improvement. SWOT
analysis, 5S, SOP and process flowchart as lean tools were recommended to the
company and implement if the company agreed. Data were collected after implement
and analyzed as improvement in the company.

23
NO
YES
Figure 3.1: Research procedure
START
DETERMINE CASE COMPANY
Data Collection: Observation Data Collection: Interview
ANALYSIS DATA
(before improvement)
Document
Review:
- Company
profile
- Operator
profile
- Current state
map
- Process flow
- Production
time
- Current lean
application
SWOT Analysis SOP
SUGGESTION
IMPLEMENTATION
END
Is there any opportunity
for improvement?
5S Process Flowchart
DATA ANALYSIS
(after improvement)

24
3.2 Data collection method
There are three main data collection methods used for this study; (1) Interview, (2)
Observation and (3) Document review. Yin (1994) suggested using multiple sources of
evidence as the way to ensure construct validity. The current study used multiple
sources of evidence; survey instruments, interviews, and documents.
3.2.1 Interview
Interview is one of the most widely used methods to gain information about a company,
industry or any specific work task. Interview was conducted with Manager of Siding
Klasik Enterprise; Mrs. Maznah bt Ahmad and Shahidi bin Razali and their operators;
Noor Azura bt Othman and Siti Aida bt Ramle. For instance, based on interview it is
significant medium to built cooperation and collaboration between two parties. Thus,
interview were conducted to extract rich data from small sample to aid the development
of concept and deepen the researcher understanding of the research topic (Mohammad,
2012). Thus interview is useful method to investigate issues that have been occurs in
depth way and discover how individuals think and feel about an issues and hold certain
opinions. The main objectives for this interview are as follows:
i. Gather detailed information and data about the whole company or
organization.
ii. Investigate the process flow of the production.
iii. Identify the problems or issues that have been faced or occurred in
organization.
iv. Identify customer requirements.
v. Define method of delivery.

77
REFERENCES
Achanga, P., Shehab, E., Roy, R. & Nelder, G. (2006). Critical success factors for
lean implementation within SMEs. Journal of Manufacturing
Technology Management. 17 (4): 460-471.
Bayo-Moriones, A., A. Bello-Pintado, & J.M.D. de Cerio. (2010). 5S use in
manufacturing plants: contextual factors and impact on operating
performance. International Journal of Quality & Reliability
Management. 27(2): p. 217-230.
Bergren, C. (1994). The Volvo experience: Alternative to Lean Production in the
Swedish auto industry.
Bhasin, S. & Bucher, P. (2006). Lean viewed as a philosophy. Journal of
Manufacturing Technology Management., 17(1), 56-72.
Billesbach, T.J. (1991). A study of the implementation of just in time in the United
States. Production and Inventory Management Journal. 32(3): 1-4.
Burton, T. T. (2003). The Lean Extended Enterprise, J. Ross Publishing.
Chapman, C.D.(2005). Clean house with lean 5S. Quality progress. 38(6): p. 27-32.
Dankbaar, B. (1997). Lean production: denial, confirmation or extension of
////////sociotechnical systems design?. Human Relations. 50(5).
Daud, S. H. B. M. (2008). Case Study of Lean Production system implementation at
small and medium enterprise (SME’s). Unpublished thesis, Faculty of
Mechanical Engineering and Manufacturing. Batu Pahat, Universiti Tun
Hussein Onn Malaysia.
De Trevil, Suzanne., Antonakis, John & Edelson, Norman. (2005). Can Standard
Operating Procedures be Motivating? Reconciling Process Variability
Issues and Behavioural Outcomes. Total Quality Management. 16(2),
231-41.
Golicic, S.I & Medland, S, (2007). Size Might Matter: A Case Study of Lean
Implementation in an SME. Society for Marketing Advance
Proceedings, 261-264.
Healthcare Performance Partner (HPP). (2009). MedAssets Company.
78
Heinavara, M. (2010). Layout an Application in Shop Floor Design Technology
Competence Management. Unpublished thesis, Turku University of
Applied Sciences.
Kai, K. M. (2009). Developing Value Stream Map for Plastic Manufacturing
Industry. Batu Pahat, Universiti Tun Hussein Onn Malaysia.
Karlsson, C. Ahlstrom, P. (1996). Assessing changes towards lean production.
International Journal of operation and production Management.
21(11), 1433-1452.
Kovach, E. A. C. (2011). The use of continuous improvement techniques.
International Journal Engineering Science and Technology 3(7). 89-
100.
Lean Enterprise Research Centre (LERC). (2004). Cardiff Business School.
Lee, S. M. & Ibrahimpour, M. (1984). Just In Time Production System: Some
Requirements for Implementing. International Journal of Operation
Management. 4(4), 3-15.
Liker. (2006). The Toyota Way Fieldbook. New York, The McGraw-Hill Companies.
Manghani, Kishu. (2011). Quality assurance: Importance of systems and standard
Operating procedures. Perspectives in Clinical Research. 2(1), 34-37,
Doi:10.4103/2229-485.76288.
Meier, H. & Forrester, P. (2001). A model for evaluating the degree of leanness of
manufacturing firms. Integrated Manufacturing Systems. 13:104-109.
Melton, T. (2005). The benefits of lean manufacturing. What lean thinking has to
offer the process industries. 83(A6): 662–673.
Mohammad, M. (2012). Development of a Guidance Model for the Selection of
Organisational Improvement Initiatives. Unpublished PhD thesis,
Massey University, Palmerston North, New Zealand.
Monden, Y. (1993). Toyota Production System. 2nd Edition, Industrial Engineering
And Management Press, Norcross, GA.
Murman, E. M. (2002). Lean Enterprise Value. Simon & Schuter.
Nichlolas, J., Ed. (2011). Lean Production for Competitive Advantage. (A
Comprehensive Guide to Lean Methodologies and Management
Principles).
Ohno, T. (1988). The Toyota Production System, English translation. Productivity
////////Press.

79
Osada, T. (1991). The 5S's: five keys to a total quality environment. Asian
////////Productivity Organization Tokyo.
Papadopoulu, T.C. & Ozbayrak, M. (2005). Leanness: experiences from the
/////////journey to date. Journal of Manufacturing Technology Management
////////16(7):784-806.
Pavnaskar, S.J., Gershenson, J.K. & Jambekar, A.B. (2003). Classification scheme
for lean manufacturing tools. International Journal Production
Research 41(13): 3075–3090.
Plenert, Gerhard J. (2012). Lean Management Principles for Information
Technology. Boca Raton, Fla. : CRC
Rajenthirakumar, R. S. (2012). Lean Manufacturing. International Journal of Lean
Thinking. 3(1): 21-26.
Ricondo, I., & Viles, E. (2005). Six sigma and its link to TQM, BPR. Lean and the
Learning Organisation. International Journal of Six Sigma and
Competitive Advantage, 1(3), 323-354.
Rineheart, J., Huxley, C., Robertson, D. (1997). Just Another Car Factory? Lean
Production and its Contents. Cornell University Press.
Rose, A. M. N., Deros, B. Md, Rahman, M. N. A. B., Nordin (2011). Lean
Manufacturing. Proceeding of the 2011 International Conference of
Industrial Engineering and Operation Management Kuala Lumpur,
Malaysia.
Sanchez, A. M. & Perez, P. (2001). Lean Indicators and Manufacturing Strategies.
International Journal of Operations and Production Management.
21(11), 1433-1452.
Scott C. (2004). Undertaking a SWOT Analysis Can Help Grow Your Company. The
Company Doctor.
Shah, R. & Ward P. T. (2007). Defining and Developing measures of Lean
Production. Journal of Operations Management, 19(1), 81-96.
Shahram Taj, (2008). Lean manufacturing performance in China: assessment of 65
manufacturing plants. Journal of Manufacturing Technology
Management. 19(2), 217 – 234.
SME Annual Report .(2007). National SME Development Council. BNM, Malaysia.
Span, S. M. (2000). Tools in Lean Production. Hunstville, University of Alabama.

80
Spann, Ms, Adams, M., Rahman, M., Czarnecki, H. & Schroer, B. J. (1999).
Transferring Lean Manufacturing to all Small Manufacturers: States
Association for Small Business and Entrepreneurship, The Role of Nist-
Mep. Proceedings of the United States Association for Small Business
and Entrepreneurship 691-705.
Sopadang, J. W. A. A. (2010). A framework for Implementing Lean Manufacturing
System in Small and Medium Enterprise. Unpublished thesis, Industrial
Engineering. Thailand, Engineering Chiang Mai University.
Taj, S. (2005). Applying lean assessment tools in Chinese hi-tech industries.
Management Decision. 43(4):628-643.
Vorne Industries, Inc. (2010). Top 25 Lean Tools. Retrieved November 30, 2013,
from http://www.leanproduction.com/top-25-lean-tools.html
Womack, J., Jones, D.T. & Roos, D. (1990). The machine that changed the world.
Rawson Associates. New York, NY.
Womack, J.P., Jones, D.T. (1996). Lean Thinking: Banish Waste and Create Wealth
in Your Corporation. Simon & Schuster, New York.
Womack, J. & Jones, D. 2003. Lean Thinking. Simon & Schuster, London.
Wong, Y. C., Wong, K. Y. & Ali. (2009). A Study of Lean Implementation in the
Malaysia Electrical and Electronics Industries. European Journal of
Specific Research. 38(4), 662-673.
Yunos, L. B. M. (2010). Developing Value Stream Map for Paper Based
Manufacturing Industries. Unpublished thesis, Engineering
Mechanical, Universiti Tun Hussein Onn Malaysia.
Yin, R. (1993). Applications of case study research. Newbury Park, CA: Sage
Publishing.
Yin, R. (1994). Case study research: Design and methods (2nd ed.). Thousand Oaks,
CA: Sage Publishing.