Embed Size (px)
Citation preview

IMPROVEMENT OF A PRODUCTION SYSTEM:
A SIMULATION MODELLING APPROACH
MARIA FRANCISCA GRANWEHR DE SOUSA BARROS MARINHO DISSERTAÇÃO DE MESTRADO APRESENTADA À FACULDADE DE ENGENHARIA DA UNIVERSIDADE DO PORTO EM ENGENHARIA INDUSTRIAL E GESTÃO
M 2014

Improvement of a Production System:
A Simulation Modelling Approach
Maria Francisca Granwehr de Sousa Barros Marinho
Master’s Thesis
Advisor at FEUP: Jorge Freire de Sousa
Faculdade de Engenharia da Universidade do Porto
Mestrado Integrado em Engenharia Industrial e Gestão
July, 2014

Improvement at a Production System: A Simulation Modelling Approach
ii
“Two roads diverged in a wood, and I- I took the one less traveled by,
And that has made all the difference.”
Robert Frost

Improvement at a Production System: A Simulation Modelling Approach
iii
Abstract
Farfetch, a seven year old luxury e-commerce fashion empire, has experienced an enormous
growth. This means that the number of partner boutiques has exponentially increased and so
did the number of products sent to be processed. This necessarily implies continuous
adjustments in order to fulfill the new requirements. Since the space for production is not the
most appropriate or flexible, as it is quite restricted and also C-shaped, the search for process
improvement has been a constant and consistent concern. Evidently, the testing of new
methodologies and procedures results in entropy on the system and might or might not be
successful. In order to overcome this problem, the objective of this project was to create a tool
that could be used to experiment different scenarios and understand its main impacts.
To tackle this issue, an Arena Production Simulator and a Microsoft Excel platform were
developed. The latter will allow, on one hand, to insert new parameters to be analyzed and, on
the other, to examine the main impacts both on a process level detail and on a wider view, i.e.
the department’s Key Performance Indicators. To assist in its implementation and to promote
its use throughout the Production Process, a User’s Manual was created.
The Simulator is also useful to explore different combinations of resources when external
circumstances change, such as the quantity of the items arrived. This tool allows the user to
test resource quantities for the various workstations and understand which might be the best
mix. To assist in this matter, it was developed a Resource Suggestion Algorithm, based on
budget and capacity limitations and product arrival characteristics, able to recommend
different resource quantities and also the possible need for additional work shifts.
Different scenarios were analyzed, in order to understand the main impacts on the system.
This resulted in several process changes and on the elimination of a minimum of three
workstations, which meant capital savings of at least three annual paychecks. Those savings
can now be channeled to investments in other areas, contributing to the improvement of the
production process.
This project was of utmost importance to the company and provided very positive results,
such that the next step will be to implement this tool on the different production offices of
Farfetch.

Improvement at a Production System: A Simulation Modelling Approach
iv
Resumo
Farfetch, um império e-commerce de moda de luxo com apenas sete anos de existência, tem
registado um crescimento exponencial ao longo dos anos. Isto significa que o número de
boutiques parceiras aumentou, assim como os produtos enviados para processamento. Isto
implica necessariamente ajustes contínuos, de forma a cumprir os novos requisitos. Uma vez
que o espaço destinado ao processo produtivo não é o mais apropriado ou o mais flexível
dado o facto de ser limitado, a busca de melhorias no processo tem sido uma preocupação
constante. Evidentemente, o teste de novas metodologias e procedimentos resulta em entropia
no sistema e pode ou não ser bem sucedido. De forma a ultrapassar esta dificuldade, o
objetivo do projeto foi criar uma ferramenta que pudesse ser utilizada para experimentar
diferentes cenários e compreender os seus principais impactos.
Foi assim desenvolvido um Simulador de Produção, no software Arena, e uma plataforma em
Microsoft Excel através da qual fosse possível, por um lado, inserir novos parâmetros a
avaliar e, por outro, examinar os principais impactos, tanto ao nível do processo como dos
indicadores de performance do departamento – esta, numa visão mais abrangente.
De forma a apoiar a implementação e promover o uso do simulador por toda a Produção, foi
criado um Manual de Utilização.
O Simulador mostra-se também muito útil para explorar diferentes combinações de recursos.
Quando condições externas sofrem alterações, como a quantidade de items recebidos, esta
ferramenta permite testar quantidades diferentes para as várias posições de trabalho e
compreender qual será a melhor combinação. No sentido de auxiliar esta decisão, foi
desenvolvido um Algoritmo de Sugestão de Recursos que, baseado em limitações orçamentais
e de capacidade e nas características dos produtos recebidos, recomenda uma deteminada
quantidade para cada posto e, adicionalmente, a eventual utilização de turnos.
Foram analisados vários cenários, de forma a compreender os principais impactos que a
variação de determinados fatores poderia ter no processo produtivo. Tal resultou em diversas
alterações no processo e na eliminação de, no mínimo, três postos de trabalho, o que se
refletiu na poupança de, pelo menos, três salários anuais. Este capital pode agora ser investido
em outras áreas, contribuindo para a melhoria do processo.
Face aos resultados obtidos, foi decidido pela Direção que o próximo passo será implementar
esta ferramenta em todos os sistemas de produção da Farfetch.

Improvement at a Production System: A Simulation Modelling Approach
v
Acknowledgements
Firstly and above all, I want to express the most loving Thank You to my parents and my
sister. Mãe, Pai, Lénix, without your unconditional love and support, I wouldn’t be who I am
today and I would unquestionably have not achieved all the good things that I have. You
constantly inspire me to be better. Thank you for always being there for me, not only on this
critical, stressful and workaholic phase, but on every moment of my life.
To my boyfriend, Chico, I thank you for all your love, friendship, support and motivational
pep talks that helped me throughout, not only this Project, but also this now ending college
journey.
To my dear Family for all their love and support, especially my grandparents, Gina and Zé,
who mean the world to me and who have always bent over backwards the world to see me
happy.
To my supervisor, Prof. Jorge Freire de Sousa, for all his support, availability and guidance
throughout this project.
To my Arena Buddy, Vera, who taught me to be patient with this nerve-racking software and
helped me so very much.
To my supervisor, Vitor Ferreira, for the opportunity and trust from the very beginning.
To Sara Guerreiro, for her friendship and support throughout this Project.
To Ana Vasconcelos, Joana Fernandes and Nuno Borges for all their care.
Last, but not least, I want to thank everyone I have not mentioned, who have helped me on
this journey, specially to the Production Team, without whom this project wouldn’t be
possible.

Improvement at a Production System: A Simulation Modelling Approach
vi
Contents
1 Introduction.. ........................................................................................................................................ 1
Motivations and Objectives .................................................................................................................. 1 1.1
Accomplishments ................................................................................................................................. 1 1.2
Report Structure ................................................................................................................................... 1 1.3
2 Farfetch Portugal ................................................................................................................................. 2
Mission, Vision and Values .................................................................................................................. 3 2.1
The Production Department ................................................................................................................. 4 2.2
2.2.1 The Production Model ........................................................................................................ 5
Proposed Problem ............................................................................................................................... 8 2.3
3 Literature Review ................................................................................................................................ 9
The Kaizen Philosophy......................................................................................................................... 9 3.1
3.1.1 Value Stream Mapping .................................................................................................... 10
The Simulation Concept ..................................................................................................................... 13 3.2
3.2.1 Brief Historical Introduction .............................................................................................. 14
3.2.2 Advantages of Simulation ................................................................................................ 14
3.2.3 Main Challenges of Simulation ........................................................................................ 15
3.2.4 Simulation Tools Available on the Market ........................................................................ 16
3.2.5 Arena Simulation Software .............................................................................................. 17
Simulation Supporting of Value Stream Mapping ............................................................................... 17 3.3
3.3.1 Simulation on the Healthcare System .............................................................................. 18
3.3.2 Simulation on the Industry Sector .................................................................................... 19
3.3.3 Simulation as Support for Decision Making ..................................................................... 19
Key Performance Indicators ............................................................................................................... 19 3.4
3.4.1 Key Performance Indicators as Metrics for Simulation..................................................... 21
4 Project Development ......................................................................................................................... 22
Methodology ....................................................................................................................................... 22 4.1
4.1.1 Arena Simulator ............................................................................................................... 22
4.1.2 Data Analysis Algorithm ................................................................................................... 24
5 Production Simulator ......................................................................................................................... 27
Features ............................................................................................................................................. 27 5.1
5.1.1 Inputs ............................................................................................................................... 27
5.1.2 Output – By Process ........................................................................................................ 28
5.1.3 Overall Analysis ............................................................................................................... 29
Implementation ................................................................................................................................... 29 5.2
5.2.1 Structural Alterations........................................................................................................ 30
5.2.2 Resource Combination Analysis ...................................................................................... 42
5.2.3 Other developments......................................................................................................... 44
6 Conclusions and Future Projects ...................................................................................................... 48
7 References... ..................................................................................................................................... 50
ANNEX A: Production Value Stream Map ........................................................................................... A53
ANNEX B: Input Analyzer Example..................................................................................................... A56

Improvement at a Production System: A Simulation Modelling Approach
vii
ANNEX C: Production Flow in Arena Software ................................................................................... A57
ANNEX D: User’s Manual.................................................................................................................... A59
ANNEX E: Initial Scenario Information ................................................................................................ A71
ANNEX F: Initial Layout ....................................................................................................................... A72
ANNEX G: Final Layout ....................................................................................................................... A73
ANNEX H: Box and Rail Identification ................................................................................................. A74
ANNEX I: Quality Calendar ................................................................................................................. A75
ANNEX J: Quality Report .................................................................................................................... A76
ANNEX K: Simulation Approach to a Fashion E-commerce: a Case Study ....................................... A78

Improvement at a Production System: A Simulation Modelling Approach
viii
Equation Index
Equation 1 - Resource Calculation ........................................................................................... 25
Equation 2 - Resource Calculation ........................................................................................... 25
Equation 3 - Parts Per Person Calculation ................................................................................ 26
Equation 4 - Lead Time Calculation......................................................................................... 26

Improvement at a Production System: A Simulation Modelling Approach
ix
Figure Index
Figure 1 - Farfetch Concept ........................................................................................................ 2
Figure 2 - Farfetch Stores ........................................................................................................... 3
Figure 3 - Production Process Overview .................................................................................... 4
Figure 4 - Production Process Women's Clothing ...................................................................... 6
Figure 5 - Production Process Men's Clothing ........................................................................... 6
Figure 6 - Production Process Live Model Women Accessories ............................................... 6
Figure 7 - Production Process Live Model Men Accessories .................................................... 7
Figure 8 - Production Process Accessories................................................................................. 7
Figure 9 - Onion Analogy (Paramenter, 2007) ......................................................................... 20
Figure 10 - Input Sheet ............................................................................................................. 27
Figure 11 - Error Notification ................................................................................................... 28
Figure 12 - Product Tracking Tool ........................................................................................... 44
Figure 13 - Slot Defect Application ......................................................................................... 45
Figure 14 - New Target Implementation Proposal ................................................................... 46
Figure 15 - Step 1 and Scan Out Application ........................................................................... 47

Improvement at a Production System: A Simulation Modelling Approach
x
Table Index
Table 1 - Product Categories ...................................................................................................... 4
Table 2 - Report Package Comparison ..................................................................................... 16
Table 3 - Areas of Application Comparison ............................................................................. 17
Table 4 - Arena Blocks ............................................................................................................. 23
Table 5 - Arrival Probabilities for Each Station ....................................................................... 25
Table 6 - Shift information ....................................................................................................... 30
Table 7 - Resource Combination Initial State .......................................................................... 31
Table 8 - Layouts analyzed (Hypothesis 1) .............................................................................. 33
Table 9 - Results on Scan In Workstation (Hypothesis 1) ....................................................... 33
Table 10 - Results on Duplicate Validation Workstation (Hypothesis 1) ................................ 34
Table 11 -Results on Scan In Workstation (Hypothesis 2) ...................................................... 34
Table 12 - Results on Duplicate Validation Workstation (Hypothesis 2) ................................ 34
Table 13 - Layouts analyzed (Hypothesis 3) ............................................................................ 35
Table 14 - Results on Scan In Workstation (Hypothesis 3) ..................................................... 36
Table 15 - Results on Duplicate Validation Workstation (Hypothesis 3) ................................ 37
Table 16 - Results on Scan In Workstation (Hypothesis 4) ..................................................... 37
Table 17 - Overall Impact of First Alteration ........................................................................... 38
Table 18 - Impact Summary ..................................................................................................... 39
Table 19- Overall Impact of Second Alteration ....................................................................... 40
Table 20 - Styling Alterations Hypothesis 1 ............................................................................ 41
Table 21- Styling Alterations Hypothesis 2 ............................................................................. 41
Table 22 - Jewelry Process Alteration ...................................................................................... 42
Table 23 - Resource Suggestion ............................................................................................... 43
Table 24 - Overall Result from Resource Suggestion .............................................................. 43

Implementation and analysis of a production simulation model
1
1 Introduction
Motivations and Objectives 1.1
The use of Simulation to test impacts on value chains and production systems has been
experiencing an increasing growth, benefiting from the technological advances in the field.
The possibility to test changes and understand quickly their main consequences before
implementing them on the real system was the central motivation for this project. The
available space in Farfetch offices is rather reduced and the assessment of an alteration would
necessarily imply the real implementation. Needless to say, it takes time to comprehend its
impact and it is possible that it damages the system. To solve this issue, the Company decided
that it was time to implement the simulation concept.
The major objective was to design a tool able to provide information both on the effects of
structural changes in the production process and on simple resource adjustments to alterations
in external factors. The main goal was always to improve the system.
The present thesis describes the development and implementation of an Arena Simulation
Software tool. It also reports a number of tools designed to improve the process.
Accomplishments 1.2
The objectives were fulfilled, as a reliable Production Simulator, able to test both simple and
complex changes, was developed. Additionally, it was created a Microsoft Excel platform, in
which the user can modify the desired parameters and import the main results, such as the
Department’s Key Performance Indicators.
It was possible to save capital for further investment, since three positions were eliminated, to
improve the Styling methodology to favor the imagery Quality and to test a new process to
potentiate the sales of Jewelry items. Several other processes were also improved and the
amount of valuable information regarding the process was increased.
Also, to potentiate and encourage the utilization of this tool, a User’s Manual was created.
Finally, the paper “Simulation Approach to a Fashion E-commerce: a Case Study” that
describes this study was written and submitted to the Journal of Simulation.
Report Structure 1.3
This thesis is composed of six chapters. The first one’s objective is to present the underlying
project, as well as its motivations and major accomplishments. As for the second, it
introduces the Company, its Production Department and the proposed problem.
The third chapter offers a review of the main concepts used to develop this project, such as
the Value Stream Mapping, and the increasing use of Simulation as a decision making support
tool.
The next one provides information regarding the methodology used for the development of
the final solution, this being the Arena Simulator and the Data Analysis Algorithm. The fifth
chapter describes the tools designed and also their implementation at the Department.
The final chapter summarizes the conclusions and accomplishments and highlights some
ideas for future research.

Implementation and analysis of a production simulation model
2
2 Farfetch Portugal
On the e-commerce luxurious world, there is a company that has, over the years, registered an
enormous growth and visibility: Farfetch Portugal. Aged 32 in 2007, José Neves has created a
new and out of the box fashion concept, which immediately positioned itself at the vanguard
of e-commerce.
After Paris Fashion Week, in 2007, José chatted with some independent stores and they
agreed that the e-commerce – which has exponentially grown, being 1,5 trillion dollars
(Hebbar 2014) the expected sales value for the present year – was slowly damaging their own
sales. At this point, the thought that came to his mind was “Why not create a single platform
that could join all the best stores in the world?” This was the million dollar question for the
million dollar answer: Farfetch, a platform that showcases the best products of the best
boutiques in the world.
The created concept is completely unique, when compared with the competition, as Farfetch
does not buy any product; it only earns commission on products sold. This erases all the risks
of stock accumulation, as the idea was only to showcase and promote the products.
Figure 1 clarifies Farfetch’s basic process.
Figure 1 - Farfetch Concept
As one can easily understand, the business is composed of 3 simple steps: (i) the customer
visits Farfetch.com; (ii) purchases a product, which triggers an order sent to the respective
store; (iii) the store receives the order and sends the product to the customer.
Farfetch is divided into seven departments:
1. Account Management, responsible for managing the relations between the stores and
the company;
2. Customer Service, handling the relationship between the customer and the company;
3. Finance;
4. Human Resources;
5. Information Technologies (IT), comprehending all the activities related both to the
online platform developments and the IT support;
6. Office Management;

Implementation and analysis of a production simulation model
3
7. Operations, including all the activities related to the orders, fraud and payments,
transports and merchandising; and
8. Production, responsible for the creation of all the media contents uploaded on the
website.
Based on London, Farfetch has now five offices in four countries: Portugal (Guimarães),
England (London), United States of America (Los Angeles and New York) and Brazil (São
Paulo).
As for the boutiques, there are now more than 300 all over the world, as shown on Figure 2.
Figure 2 - Farfetch Stores
Mission, Vision and Values 2.1
According to Kaplan and Norton (2008), before thinking about the strategy, the company has
to define its purpose, which can be defined as the Mission; the final goals, the Vision; and the
internal attributes that will rule on the road to achieve those goals, the Values.
In Farfetch’s case, these can be identified as:
Mission
“Change the way the world shops for fashion.”
Vision
“Make the world more exciting by nurturing creativity and diversity.”
Values
“Be Brilliant” – to be world class in everything we do;
“Be Human” – as treating everyone honestly and fairly will make us feel better;
“Todos Juntos1” (All Together) – as the whole is stronger than the sum of the parts;
“Be Revolutionary” – because we want to shape the future;
1 This value, on the contrary to the others that can be translated, was chosen to be in Portuguese as, upon the
value definition, the elements involved appreciated its sound.

Implementation and analysis of a production simulation model
4
“Think Global” – since the essence of our business from the very beginning is being
“a global fashion community”.
The Production Department 2.2
The Production Department is responsible for the production of media contents: photography
and videos. Figure 3 shows an overview of the department’s operation.
Figure 3 - Production Process Overview
Contrary to most e-commerce companies, such as Net-a-Porter and Asus, Farfetch doesn’t
produce or buy any item, and therefore doesn’t keep any stock.
This department is composed by five teams:
(i) Logistics, everyone responsible for the product handling and characterization since its
arrival to its departure, i.e. every activity involved on the upload of information that
will be displayed on the website and on the unpacking and packing of the goods;
(ii) Photography, it includes all the media content production, meaning photography and
video;
(iii) Styling, concerning all teams involved on styling: the models, the stylists and the
styling assistants;
(iv) Photo Edition, the imagery treatment, i.e. the photography and video retouch; and
(v) Quality, which covers the photo, video and edition quality control as well as the
duplicate management teams.
The products arrive at Farfetch in batches - the Slots, with a maximum size of 50 units. Those
Slots, throughout the process, cannot be separated and, upon the devolution, must be grouped
according to its number. There are six different product main categories represented in Table
1 together with some examples.
Table 1 - Product Categories
Main Category Examples
Accessories Belts, Cufflinks, Gloves, Hats,
Ties
Bags Backpacks, Clutches, Satchel, Shoulder
Bags, Totes
Clothing Coats, Denim, Dresses, Jackets,
Shirts
Jewelry Bracelets, Necklaces, Pendants,
Rings, Watches
Lifestyle Books, Magazines, Music, Pets
accessories, Umbrellas
Shoes Ballerinas, Boots, Sandals, Slippers,
Trainers

Implementation and analysis of a production simulation model
5
On a low season the arrival rate is approximately 600 items per day, which represents about
13 Slots; on the peaks, it can reach the 1200 items (around 27 slots). Farfetch has committed
to return the Slots in a maximum of three days, i.e. the product shouldn’t remain on the
premises for more than three overnights.
2.2.1 The Production Model
First of all, it is important to understand some concepts and principles intrinsic to the process.
1. Duplicate products – as the products are sent from boutiques and not from brands, it is
possible that they buy the same items. Evidently, they do not know what products the
other stores send. So, when a product is identified as a duplicate, it is not processed,
meaning that it is not categorized or photographed again. In this case, the stock
quantity is updated and the new store is introduced on the website, together with its
price. All different prices (if affirmative) are available on the site and the customer is
the one that decides from which store he wants to buy from.
2. Rail – a rail is a mean of transportation of bags and clothing. This can only have a
maximum of 25 units in order not to damage or crease the items.
3. Box – all the other products, such as accessories and shoes, are transported in boxes.
4. Tool kit – if the product is a women’s clothing or bag, it can be combined with pieces
from the store type or from items provided by Farfetch. This set of items, which varies
with the different seasons, is called Tool Kit.
5. Defective product – as the products that arrive on Farfetch are so valuable, all the item
handling has to be done very carefully. If a product arrives defective, it is immediately
photographed and sent to the logistics support to prove that the damage was not made
by an employee. Also, the boxes in which the products arrive are shot before being
opened.
Before sending the products, the boutiques have to insert the data on an online platform so the
proper planning can be done. With this information, the Duplicate Identification Team is able
to verify if the products may be potential duplicates.
Having the above concepts clarified, the next step is to understand the production model.
To better explain it, which can be quite complex, several flow models were developed. As
different product categories follow different production paths, there will be presented five
different schemes: Women’s Clothing, Men’s Clothing, Live Model Women Accessories
(Women’s Bags), Live Model Men Accessories (Men’s Bags) and Accessories (Accessories,
Jewelry, Lifestyle and Shoes), followed by a brief description of each workstation’s objective.
So as to offer a more detailed description, the Value Stream Map of each Category’s Process
is available on Annex A.

Implementation and analysis of a production simulation model
6
Figure 4 - Production Process Women's Clothing
Figure 5 - Production Process Men's Clothing
Figure 6 - Production Process Live Model Women Accessories

Implementation and analysis of a production simulation model
7
Figure 7 - Production Process Live Model Men Accessories
Figure 8 - Production Process Accessories
At Scan In, the products are inserted in the system and searched for defects. This validates
their arrival and protects Farfetch from liabilities. At this stage, the product, upon scanning,
can be identified as a potential duplicate. It then goes to the Duplicate Validation Station. If it
is confirmed duplicate, it goes straight to the end of the process to be packed. On the other
hand, if it is not, it enters the process on Step 1 (Normal or Accessories, depending on its
Category) and runs the normal route.
The Step 1 resource is responsible for introducing the first product categorization (Brand,
Designer ID, Season, Gender, Category, Price, Material, Color and Expedition Box) on the
online platform.
The Styling Preparation position only occurs for Women’s Bags and Clothing. The products
can be combined with each other or with the tool kit, by Farfetch Stylists. The stores can also
send styling notes to assist this stage. The objective is to prepare the outfits that will be shot at
the next station: Live Model Women. Here, the items are photographed on a live model and
20% of the Clothing has to be filmed for a short video.
The Men’s Clothing and Bags pass straight to Live Model Men. They are photographed on a
live model and, in this case, only 10% of the Clothing is filmed.

Implementation and analysis of a production simulation model
8
Women and Men’s clothing are then transferred to Flat and the Bags to Stills. In parallel, all
the other accessories, such as Accessories, Jewelry, Lifestyle and Shoes, go directly to the
latter. On this station, the items are shot solo and this image will be the item’s cover on the
website. As for the Clothing products, they are shot on plastic mannequin, on Flat and,
similarly, this will be the cover photo.
Then, all the images must be evaluated by the Photo Quality Team that assesses the imagery
quality and is able to ask for the photography to be repeated.
The next step is the Photo Edition. All the images are manipulated by this team in order to
correct small imperfections and to prepare the photography to be uploaded on the website.
Again, the image goes to Editing Quality Control to assess if the edition fulfills all the
requirements.
Finally, when all the items of the Slot are processed, including repetitions concluded, it’s time
for the last product characterization, on Scan Out. On this station, information regarding
measurements, creation of labels, size and washing instructions is introduced and the product
is packed.
When all the items of the Slot are packed, they can now be boxed and dispatched. On the
latter position, the employee has to create the store on the system, print the label pack and
issue the airway bill.
Proposed Problem 2.3
Process can be described as a mechanism to create and deliver value to a customer (Madison,
2005). According to the same source, 85% of problems that occur on companies are due to
process reasons, such as the process itself, control mechanism and structure, being the
remaining 15% associated with people.
Bearing this in mind, the ability to tame or to control those 85% will make a colossal
difference in the company’s performance, giving the controller the possibility to avoid or to
predict and act upon the complications.
As previously explained, Farfetch’s production process is a bit different from the usual
concept of production; however, it can be treated as such.
This company’s production depends on the oscillations on the fashion calendar; however, its
accuracy has progressively decreased, as this luxury fashion market’s constant growth, despite
the world’s financial crisis, compels it to reduce the period between new collections and
novelties. As the layout available is not the most traditional for production processes,
throughout the course of the year, the changes have been mostly resource related.
Additionally, since every layout change, as small as it may be, will necessarily imply a
stoppage on the production line and that change will not necessarily bring the expected
results, those alterations should be well thought.
Therefore, the Simulation is, no doubt, the logical step to take. With this simulation model, it
will be possible to understand the impact of internal aspects, such as the change of layouts,
the increase or decrease of resources, and external ones, as the arrival of different product
categories. This is the main objective of this tool: the possibility to analyze the impact of
voluntary and involuntary changes to the system. Additionally, the simulation model will also
be a reliable instrument to point out changes that may need to be done and to test different
production scenarios.

Implementation and analysis of a production simulation model
9
3 Literature Review
As Farfetch’s production model is such an interesting and different approach to the traditional
process, it is of great value to explore the value stream mapping language. Firstly, in this
chapter, the origin of this theme will be explored, as well as its implementation steps. In order
to better understand the process to implement the simulator, it was crucial to learn about this,
so that every important detail of this tool would be taken into account.
Further in this chapter, it will be presented the simulation concept, as well as some advantages
that result from the implementation of a process simulator on a company. Afterwards, the link
between Value Stream Mapping and Simulation will be presented. The main tools regarding
software simulation will also be evaluated, as well as the reason why Arena Simulator was
chosen.
Finally, as the objective of the developed tool is to evaluate the performance of the system
when confronted with modifications, the Key Performance Indicators (KPIs) subject is also
explored.
The Kaizen Philosophy 3.1
The buzz word Kaizen, which combines the continuous improvement every day, everywhere
for everybody, with the change for the better, is nowadays a concept that has been more and
more implemented by organizations worldwide, aiming to survive the ever-increasing
competition and to overcome the challenges that are present on a daily basis.
As it is well known, this philosophy was the basis of Taiichi Ohno’s discoveries at Toyota, on
the 1950s, resulting in the Toyota Production System (TPS), commonly referred as Lean
Transformation. The designation emerges from the idea of using less material, less
investment, less inventory, less space and less people, therefore, financial and physically
leaner (Wilson 2010). Even though these two concepts have become synonyms over the years,
according to the same author, there are two main aspects that define them apart: first, while
TPS has a sole focus on quantity control, Lean adds the quality control aspect to the table;
secondly, as the reason why TPS is Lean and not all Lean in TPS, Lean is achieved by simply
following its main steps, which is not the hard part: the difficulty is not getting there, but
staying there. TPS implies the culture management consciously, continuously, and
consistently, meaning that the lack of this part can make an organization Lean below the
standards of the TPS. Therefore, so that the Lean excellence can be achieved, the Lean culture
must be implemented every day to sustain the gains through every kind of change and
challenge, following the logic:
If we want to survive, we must improve;
If we want to improve, we must change;
If we want to change, we need a culture that not only:
o Accepts the change, but…
o Embraces and encourages change as well. (Wilson 2010)
Both systems are focused on finding the sources of waste (muda), defined in seven kinds,
targeting their elimination as the approach to achieve competitiveness and excellence
(Coimbra 2009). These sources are:

Implementation and analysis of a production simulation model
10
1. Defects (internal or external);
2. People waiting;
3. People moving;
4. Over processing;
5. Material waiting;
6. Material moving;
7. Overproduction.
The most common tools to eliminate these wastes are (Abdulmalek and Rajgopal 2007):
Cellular manufacturing, which means organizing the process for a specific product or
for a family of similar products, having all machines and necessary materials and
resources set in a way that potentiates the operations;
Just-in-time, being this a system in which the customer’s request gives the production
the signal, making the raw materials arrive and the tasks start exactly when they are
needed;
Kanban, which is the signaling system mentioned in a Just-in-Time production;
Total Preventive Maintenance, meaning the workers themselves are responsible for
executing maintenance tasks on their machines, as to detect anomalies and prevent
breakdowns;
Single Minute Exchange of Die (SMED), which means reducing the setup time in
order to increase flexibility in product changeover (Coimbra 2009);
Total Quality Management, a system of continuous improvement with the focus on the
customer’s needs;
5S, which translates to the organization the standardization of the workplace in order
to increase productivity; these 5S are five Japanese words which represent this
technique’s five steps: Seiri (Sort), Seiton (Set in Order), Seison (Shine), Seikestu
(Standardize) and Shitsuke (Sustain).
Value Stream Mapping was also born from Toyota Production System; a standardized visual
tool for analyzing material and information flows of a value chain (Fontes 2013). In order to
better understand the process flow, which will later be represented in the computational
model, it was crucial to study this language.
3.1.1 Value Stream Mapping
Whenever there is a product for a customer, there is a value stream (Rother and Shook 1999).
Regardless of the input and the outcome, according to the literature on value stream mapping,
this concept includes all the activities involved in bringing the product to the customer, either
value added or non-value added actions. This means looking at the process as a whole,
improving it as a set of parts and not just the parts of a set. By considering this approach, the
controller will be able to visualize the production flow, comprehending not only the wastes,
but also the sources of these wastes, avoiding “cherry picking”, which means looking at data
to confirm a certain position and ignoring information that can contradict that point.

Implementation and analysis of a production simulation model
11
Despite the fact that it is not the first thing that comes to mind, when thinking about the value
stream, as previously stated, the information flow is just as important as the production’s (the
movement of material throughout the production line) which informs each process what
happens next. According to the same source, material and information are two sides of the
same coin, Therefore, mapping one will necessary imply the inclusion of the other.
In order that the Value Stream Mapping can be a reliable picture of the actual system, there
are four key steps that must be followed (Fontes 2013):
1. Go to the shop floor to draw the current state of the value chain. The objective is to
gather all the information to really understand the flow and the sequence of tasks
(Rother and Shook 1999);
2. Focus on the Client and its impact on the Organization, meaning the mapping should
be developed from the client to the raw material (this is, downstream to upstream);
3. The information collected on the shop floor must be validated with the information
systems, as to ratify if they match;
4. Draw the flows in a piece of paper, putting aside the formal aspect of the mapping
itself. The goal here is to focus on the movements and the corresponding problems and
wastes.
Finished the initial phase, i.e., being familiar with the process and all its characteristics, it is
imperative not to forget the formal structure of the Value Stream Mapping draw. This should
include (Fontes 2013):
1. Suppliers;
2. Inputs;
3. Information and Material Flows;
4. Deliverables;
5. Clients;
6. Planning.
It is crucial, at this point, to understand how the process relates to its suppliers, so that they
provide the necessary materials and resources
(i) to its clients, as to all the information is disclosed; and
(ii) to what the deliverables are and how the teams should work and be organized in order
to achieve the expected results.
There is also a Lean version of value stream mapping, structurally similar to the traditional
one, but more visual. Moreover, the objective is always to get one process to make only what
the next process needs when it needs it, always seeking the smoothest flow, with the shortest
lead time, the lowest cost and the highest quality.
The authors of Leaning to See, Rother and Skook (1999) gathered Toyota’s guidelines to
better construct this map:
1. production to the takt time,
2. (when possible) development of continuous flow,
3. utilization of Supermarkets to control the production,

Implementation and analysis of a production simulation model
12
4. definition of the pacemaker process,
5. leveling the production mix,
6. leveling the production volume, and
7. developing the ability to make every product every day on processes upstream of the
pacemaker .
These guidelines will be explored in the following sub chapters.
3.1.1.1 Production to the Takt Time
The takt time represents the unitary production rate in order to match the pace of sales. It is
essentially the time that the product should take to produce in order to meet the demand. This
tool is particularly important both to synchronize the referred paces and to understand how the
production is doing and what may need to be improved.
As simple as it might seem, according to the authors, it is very important not to lose track of :
1. The time to respond to problems, which has to be under the takt time;
2. The search and elimination of unintentional downtime;
3. The reduction and elimination of changeover time.
3.1.1.2 Development of Continuous Flow
Whenever possible, it is advisable that the production flow is continuous, meaning that the
production of a unitary batch is promptly passed to the next task, avoiding any stoppage on
the system. According to Rother and Shook (1999), this is the most efficient production
method and a lot of creativity is needed upon its implementation.
Despite the fact that, according to these authors, this should be applied as much as possible, it
must be drawn a limit to the extent of a pure continuous flow, as it will mean the merger of
different processes with all their particular characteristics, regarding lead and down times.
Furthermore, it cannot always be possible to implement this as the creation of batches is
needed. The approach should be gradual and adjusted to the specifications of each production
system.
3.1.1.3 Utilization of Supermarkets to Control the Production
As previously mentioned, the need for batching can prevent the implementation of a
continuous flow, namely, when there are changeover times for several numbers of families or
when the unitary shipping is not possible.
The solution to this problem will be to introduce supermarkets, which are essentially buffers
or storage, before the process in which the continuous flow was interrupted. Thus, it will be
possible to supply and control the processes that need to operate in a batch mode (Rother and
Shook 1999).
3.1.1.4 Definition of the Pacemaker Process
Jacobs (2011) defines pacing as the fixed timing of the movement of items through the
process; consequently this pace will coordinate the movements of the production. According
to Rother and Shook (1999), ideally, the pacemaker process is the one that is controlled by the
customer’s orders. The same logic tells us that the selected process will distinguish which

Implementation and analysis of a production simulation model
13
activities of the value stream will be a part of the lead time between the customer order and
the finished goods.
3.1.1.5 Leveling the Production Mix
When having to produce different products, the complete production of one followed by the
complete production of the other may be appealing; but unwise. Grouping the production of
one single product at a time will decrease ability to respond to the variations of the customer’s
needs.
Leveling the production mix will increase that flexibility: by producing different types evenly,
it will be possible to respond to different customer requirements in less time and also to hold
less inventory and to supply the supermarkets with less material. Although this will
necessarily imply an increase on the number of changeovers, it will allow the elimination of
wastes in the value stream (Rother and Shook 1999).
3.1.1.6 Leveling the Production Volume
The batch size is a crucial measure.
An excessive size will necessarily be prejudicial to the process, as it will cause problems, such
as (i) difficulty to monitor the production, (ii) larger amounts of work can increase the
probability of human error and (iii) increase on the complexity of the information flow, which
will reduce the capacity to respond to changes in customer requirements (Rother and Shook
1999).
Leveling the production volume will eliminate these problems, enabling the possibility to
control the production by creating a predictable flow and also to quickly find and correct
problems that may arise.
3.1.1.7 Development of the Ability to Make Every Product Every Day on Processes Upstream
of the Pacemaker
This seventh guideline is almost as conclusion of every aspect previously explored. The
ability to shorten changeover times combined with the existence of small batches will allow
the processes upstream the pacemaker process to respond more quickly to changes
downstream. Once again, the changes and adaptation required to achieve the possibility to
produce every part every day must be made gradually in order to keep up with the system’s
particular requirements (Rother and Shook 1999).
The Simulation Concept 3.2
The world is in constant evolution; the necessity to foresee and to act, instead of reacting,
assumes the utmost importance and, with it, the use of simulation.
Simulation is the imitation of the operation of a real-world process or system over time.
Simulation involves the generation of an artificial history of the system, and the observation
of that artificial history to draw inferences concerning the operating characteristics of the real
system that is represented (Banks 1999).
Bearing this in mind, the utility of simulating an event appears as evident. The exponential
growth of the technological industry resulted in notorious advances in various fields,
contributing to the increase of power, accuracy, speed and easiness to use the different
computer software. According to J. Banks (1999), on his article on Discrete Event Simulation,
the Simulation-Software industry, in particular, has greatly benefited from these

Implementation and analysis of a production simulation model
14
developments. Moreover, these advances have gone so far, that simulation is truly suitable for
more than remodeling a facility, and is now incorporated into daily operations.
3.2.1 Brief Historical Introduction
The utilization of simulation to portray reality has clearly grown, and so has the computer
technology. Since a simulation model is nothing more than a set of computer features, one can
conclude that these developments were responsible for the advances in the simulation field,
and of its methodologies and applications (Domonkos 2010). The critical progresses
happened in the last fifty years.
The demands emerged from a world at war, which incited the computer development in the
1940s (Jenkins and Rice 2009). The Ballistic Research Laboratory at the US Army Ordnance
Department and the University of Pennsylvania joined forces to accelerate the creation of
artillery range tables. However, they had difficulties in meeting the demand.
This was the first trigger for the creation of the Electronic Numerical Integrator and
Computer, which was the first electronic general-purpose computer, programmed to solve a
large class of numerical problems (Goldstine 1946) which in turn drew the attention of many
theoreticians working on the US atomic weapon programs.
According to Nance (1996) the first credited simulator, General Simulation Program, was
developed through the Period of Search, which occurred from 1955 to 1960, as the result of a
large number of experimentations on the simulation field.
The next four years, The Advent, were responsible for the development of the most important
simulation languages which are still the foundation of todays’, introducing the object-oriented
paradigm, which gives the object individual data and behaviors (Wegner 1994). From 1966 to
1970, the Formative Period, the hardware improvement allowed investigators to concentrate
on the development and expansion of the simulation concept instead of the programming
languages. Further on, from 1971 to 1978, through the Expansion Period, GPSS/Norden was
created, presenting a new over the top feature: the possibility to form a model in an interactive
visual environment. On the Period of Consolidation and Regeneration, from 1979 to 1986, the
simulation programs were adjusted to personal computers, removing the necessity to adapt the
language.
Finally, since 1987, major developments have been made in the field of simulation programs,
namely the creation of 2D or even 3D models and the statistical analysis of input and output
reports for process optimization.
3.2.2 Advantages of Simulation
According to Banks (1999), it is possible to enumerate a great deal of advantages which
clearly show that these go far beyond providing a good look of the future:
1. by testing every aspect of a change or a new acquisition, simulation empowers the
company both to comprehend the impact it will have on the system without
compromising human or material resources, and, should the situation arise, to prepare
the system for the change; secondly,
2. regarding internal issues, it allows the company to understand the why questions, by
reconstructing the scene and taking a microscopic examination of the system to
determine why the phenomenon occurs;

Implementation and analysis of a production simulation model
15
3. the interactions between resources, the bottlenecks, among other important variables
of the process, enable the user to understand the performance of the overall system;
finally,
4. it enables the company to explore the possibility to investigate external phenomenon
so to understand it and to investigate internal changes, without disrupting the real
system. This is crucial for a company, such as Farfetch, in which the external
dynamics greatly affect the internal ones.
Evidently, when apprehending the advantages that can result from these kinds of tools, the
number of businesses using simulation is rapidly increasing (Banks 1999). The importance of
simulation has grown as, according to Banks and Gibson (2007), it became a vital tool for
analyzing anticipated performances, validating designs, demonstrating and visualizing
operations, testing hypotheses, and performing many other analyses.
3.2.3 Main Challenges of Simulation
According to Carrillo and Centeno (2001), despite the constant technological advances and
the growth of the Organizations’ belief in simulation models to observe the behavior of
systems, there are challenges on the introduction of Simulation on a company.
Firstly, there may be unrealistic expectations from the top management that, when not met,
can lead to the abandonment of this tool and their belief in it. The simulation model is not
able to optimize the system’s performance: it can only produce what if scenarios for
comparisons. Additionally, it cannot solve problems, but only provide information from
which solutions can be concluded.
Secondly, based on this study and the participants’ experience, there are four different
attitudes one can find when introducing simulation on a company:
1. Total Skepticism - the staff shows no belief in the method, using excuses such as the
complexity of the system and the impossibility to create rules or patterns;
2. Magical Excitement - the team members show unrealistic expectations, as the
simulator is able to solve all problems;
3. Uncommitted support - the staff believes in the simulation and its potential, but
considers there is no time or resources to develop it;
4. Supportive - the ideal attitude, referring to when the staff understands the value of the
simulator and is willing to support the development as much as they can.
Finally, there are the complex aspects regarding the development of the Simulation: the data
collection, the modelling design, the search for the right simulation package versus the
investment needed and the certification of the model: the verification, which is the
confirmation if the model was developed as intended, and the validation, to assure that it
represents the real world.
The Simulation is a very powerful instrument for the Company to analyze different scenarios,
assisting in the decision making process.
However, in addition to the critical first study of the system and implementation, the power
and limitations of this tool have to be properly clarified.

Implementation and analysis of a production simulation model
16
3.2.4 Simulation Tools Available on the Market
Dias et al. (2011) identified Arena, Simul8, WITNESS, ProModel and ExtendSim as the most
popular commercial simulation packages.
This paper aimed at understanding, from a company’s perspective, which were the tools with
the most technical support in terms of the number of people with that specific know-how and,
from a technician’s point of view, which were the most requested tools from the market.
In order to compare those packages’ unique features, each tools’ manual was analyzed and the
available literature on the subject was studied. Abu-Taieh and El Sheik (2007) developed a
study, comparing 56 simulation packages, amongst which were the five chosen for this
chapter. The criteria was based on four topics: (i) the simulation modelling approach used
from the available approaches, (ii) the reporting package used, (ii) the possibility to use 2D or
3D animation, (iv) the application of simulation packages.
3.2.4.1 The Simulation Modelling Approach Used from the Available Tools
According to Abu-Taieh and El Sheik (2007), there are four main simulation approaches.
Event-Scheduling Method – this approach consists in a system composed of state variables, or
events, that change their values during the time frame; for instance, on a queuing system, an
arrival is an event as it increases the number of items in the system (Fishman 2001).
Process-Interaction Approach – this approach assigns a process to each event, which means
the focus is on the sequence of events ordered in time (Fishman 2001).
Activity Scanning – this approach is similar to the rule-based programming, which means that
the rule is executed when a certain condition is met, and therefore produces a simulation
model composed of independent modules waiting to be executed (Abu-Taieh 2008).
Three-Phase Approach – as the name suggests, this approach is composed of three phases: (A)
the time advances upon the arrival of an event and then until its conclusion, (B) the release of
the resources when those tasks are concluded so that on (C) they can start all events which
were conditioned by the previously mentioned.
Unfortunately, many simulation packages do not provide the customer with this information,
with the exception of ProModel. This has a Process Interaction simulation approach.
3.2.4.2 The Reporting Package Used
Regarding the report packages used, one can have the software’s own tailored report
spreadsheet with or without the possibility to export the data to Microsoft Excel or it can have
this as a reporting tool. The results from this research are compiled in Table 2.
Table 2 - Report Package Comparison
Simulation Software Report Package
Arena Tailored report, with Microsoft Excel
feature
Simul8 Tailored report, with Microsoft Excel
feature
Witness Tailored report, with Microsoft Excel
feature
ProModel Microsoft Excel
ExtendSim Tailored report, with Microsoft Excel
feature

Implementation and analysis of a production simulation model
17
3.2.4.3 The Animation Feature
As of animation, it is a very useful feature as it provides a graphic vision of the system which
is being analyzed. As expected, all the selected packages include this feature.
3.2.4.4 The Application of Simulation Packages
One of the most important comparison topics is the application range. Table 3 shows the areas
for which each software is appropriate (E. M. Abu-Taieh 2008).
Table 3 - Areas of Application Comparison
Simulation Software Areas of application
Arena
Business process reengineering and
workflows
Complex system design evaluation
Service Systems
Supply Chain Management
What if… scenarios
Simul8 What if… scenarios
Witness Transportation Systems
Oil and Gas
ProModel Business process reengineering and
workflows
ExtendSim Service Systems
3.2.5 Arena Simulation Software
As a conclusion, the simulation packages explored are very much alike on most of the aspects
explored; however, they differ on the most important aspect for the objective of the tool
developed: the application areas.
The Arena Simulation Software was chosen because all of its features met the specificities of
the project, particularly the application possibilities. Since Farfetch’s production process has
very particular details that need to be taken into account all its flexibility is necessary.
Additionally, the product’s license was provided by the University, so no investment was
needed at this stage.
Simulation Supporting of Value Stream Mapping 3.3
The management of change has always been a troubling subject for managers in their pursuit
for shop floor modifications, such as layout and methodology’s, and cultural changes.
Specially in this evermore competing world, the need for mutations and adaptations represent
a great part of the daily concerns of Organizations, in order to succeed and sometimes even to
survive. Fontes (2012), on his reflection about the difficulty of the implementation of change,
highlights ten reactions which are usually responsible for inertia:
1. The lack of belief on the need to change, to offer a different product or service, as
sometimes employees don’t understand why the voice of the consumer overrides the
production.
2. The thought that is not possible to change for better, as many have already been
through unsuccessful changes, they fear for their job or simply sometimes the
methodologies are used for many years;

Implementation and analysis of a production simulation model
18
3. The lack of time, as ever so often managers use their time and resources in reacting
and not acting upon the problems;
4. The paralysis of analysis, since the search for one perfect and single way to solve the
problems can be an endless process;
5. The paralysis of the reaction, as sometimes the lack of trust on the solution found may
make the managers postpone its implementation;
6. The lack of involvement from the top management, which can be seen as the lack of
belief on the project;
7. The fear to fail and its possible consequences;
8. The difficulty to turn away from the traditional habits, so as to have an open mind to
simple but different perspectives;
9. The difficulty that may come to the definition of consistent and coherent milestones;
10. The possible dilemmas in making things happen, since alongside the change there is
also work that has to be done.
As it can be concluded by reading about traditional production versus lean manufacturing
systems, both differ in a variety of aspects, which are responsible for the reluctance of
managers when implementing the new methodology. According to Detty and Yingling
(2000), the main differences can be grouped in
employee management,
plant layout,
material and information flows and
production scheduling/control methods.
Usually, the decision whether or not to implement lean manufacturing is based on the
experience of others who have implemented this methodology and on educated guesses of the
expected return (Abdulmalek and Rajgopal 2007). For the more skeptical, a more quantifiable
proof is needed and it is where simulation assumes a great value in the Organizations as a
support for decision making, however big or small they might be. Some examples were
explored, regarding the healthcare and the industry sectors, and they clearly show the
importance given to simulation results, as well as its value on a real world situation.
3.3.1 Simulation on the Healthcare System
According to Abo-Hamad et al. (2012), the lean thinking was the correct answer to the
increasing demand on the healthcare system triggered by the population growth and its aging
as well as the market’s expectation of high quality service. Despite all the proofs given by this
methodology throughout the years, the executives were reluctant on the implementation as
there was no quantifiable evidence to support the project.
Faced with this obstacle, the solution was to develop evidence based on lean and simulation,
in order to achieve the expected proof. The present and future value stream maps were
designed and the drug round process was chosen to be analyzed. To do this, three scenarios
were simulated, such as the assumption that (i) the drug trolley was always stocked in the pre-
drug round phase, (ii) all the drugs had been successfully administrated, which means no re-
work was needed on the post drug round and (iii) the non-existence of variances in the drug

Implementation and analysis of a production simulation model
19
round, i.e. the drugs required are on the trolley. The resulting analysis showed the ward
managers and the Director that that was a right approach.
3.3.2 Simulation on the Industry Sector
Contrary to what one might expect, and since lean was developed in an industrial
environment, there is still some apprehensiveness on the application of this methodology.
Abdulmalek and Rajgopal (2007) willing to change their company’s traditional production
system resorted to simulation. The purpose was to assess the potential benefits of the
transition in an attempt to reduce or extinguish the reluctance in taking this approach.
The results were very optimistic, as they were able to simulate the basic performance
measures and analyze the configurations proposed which would further be used to, on an
initial phase, persuade the implementation of a new system, and then to motivate the teams to
obtain the predicted results.
As for Detty and Yingling’s study (2000), simulation was also useful in the pursuit for
production flow optimization. They assessed the utilization of a simulation as a tool to
quantify benefits, providing credible estimations of the achievable savings and improvements.
Confirming other studies, simulation was seen as an aid in analyzing, designing and
improving systems.
3.3.3 Simulation as Support for Decision Making
As one can conclude, in many activity sectors the combination of value stream mapping with
a simulation model is considered to be a powerful reliable decision making tool. It allows, on
one hand, to understand which are the value and the non-value added activities and, on the
other, to predict the possible gains resulting from changes by simulating a system similar to
the reality.
Abo-Hamad et al. (2012) considered this combination the key to the implementation of
changes, as it allowed to understand the impact and consequences of different strategies
before the implementation phase.
Furthermore, Sun and Xia (2013) describe the potentialities as the possibility to better
visualize dynamic features of the future state before implementation.
Simulation can, therefore, be seen as a visual and yet mathematical method, as it can provide
reports, to justify and quantify improvement suggestions or simple alterations to the system,
providing reliable data, considering the reality’s own singularities and variations.
Key Performance Indicators 3.4
In order to evaluate the impact of the alterations on a simulation model what necessarily
comes to mind is the analysis of the variables affected by that change. The metrics which
enable this study are Key Performance Indicators.
Performance Measures can be defined as the process of quantifying the efficiency and
effectiveness of an action, so a performance measure is the metric used to quantify that
efficiency/effectiveness (Neely et al. 2005).
According to Parmenter (2007), there are three types of performance indicators or measures,
which can be differentiated as:

Implementation and analysis of a production simulation model
20
(i) Key Result Indicators, which evaluate the company’s actions in a particular
perspective;
(ii) Performance Indicators, revealing the correct direction towards the defined objectives;
(iii) Key Performance Indicators, enlightening the path to highly increase performance.
The relationship between the three can be described by the following onion analogy.
Figure 9 - Onion Analogy (Paramenter, 2007)
Considering this analogy, one can easily understand the difference between the three
performance measures. Like the outside skin describes the general condition of the onion,
regarding the sun and the amount of nutrients received, so do the key result indicators exhibit
the overall performance of the company. As the layers peel off more details are presented. As
far as performance measures are concerned, the more layers one peels, the more elements one
knows, until the core is reached: the key performance indicators.
The all-time objective, and in particular this project, is to increase the company’s
performance, so the Key Performance Indicators’ theme was further analyzed. Parmenter
(2007) completes his definition of this type of performance indicators as a set of measures
focusing on the aspects of organizational performance that are the most critical for the current
and future success of the organization. Upon its definition, argues that there are seven
parameters which have to be considered:
1. They are not financial measures;
2. They have to be measured on a daily basis;
3. The company’s CEO and managers have acted on them;
4. All staff must understand the measure and its corrective action;
5. The responsibility must be tied to an individual or a team;
6. Their impact must be significant;
7. That impact must be positive.
Despite the quality of the set of indicators defined, it is of utmost importance that four
foundation stones are present, since the methodology followed to introduce and implement
the strategy will be key for its success: (i) partnership between all involved, (ii) empowerment
of the front-line, in order for the employees to take immediate actions and also for them to

Implementation and analysis of a production simulation model
21
develop a bigger sense of responsibility, (iii) development of an integrated framework so that
the performance can be evaluated and actions can be taken, (iv) link the performance
measurement to the company’s foundation strategy.
3.4.1 Key Performance Indicators as Metrics for Simulation
According to Al-Aomar’s studies in 2010 (Bataineh, Al-Aomar and Ammar 2010) and 2014
(Al-Aomar, et al. 2014), the definition of Key Performance Indicators was fundamental to
assess the variations resulting from the simulation of the initial system and to make decisions.
In 2010, the objective was to optimize the performance of public departments, and so he used
the following KPIs:
(i) Work-In-Process, in order to evaluate the number of pending subjects at the end of the
day;
(ii) Number Processed;
(iii) Waiting Time,
(iv) System Time and
(v) Total Daily Revenue, which represents the earnings brought from each processed
document.
Then, on 2014, a more complex process was evaluated: a large-scale supply chain for a steel
producer. On this case, the set chosen consists of:
1. Order Lead Time,
2. Order Fill Rate,
3. On-time Delivery,
4. Average Inventory Level,
5. Production Unit Utilization,
6. Orders Delivered Early and
7. Production Unit Yield.
In Felde’s Master’s Thesis (2010) on the decision making process regarding the utilization of
smart cards and authentication passwords upon patient treatment and other processes, in order
to evaluate security decisions in an organization, different KPIs were selected. Hence, as to
measure those effects he chose:
(i) Number of Assessment Warranty Breaches,
(ii) Average Waiting Time,
(iii) Number of Time Limit Breaches and
(iv) Length of Stay.
In conclusion, performance metrics are crucial to evaluate, control and compare systems. The
chosen parameters and their complexity will necessarily be different among the companies,
depending on the critical aspects of the business: they can be related to costs, quality,
customer service, lead time, and others.
It is vital for the company to choose its set wisely in order to control the aspects that will
increase its performance.

Implementation and analysis of a production simulation model
22
4 Project Development
Methodology 4.1
4.1.1 Arena Simulator
To approach the present study, it was conducted a literature review in order to understand
which would be the best methodology or the most appropriate combination to use. The
majority of the studies, such as Banks (1999), Brito and Teixeira (2001), Ulgen et al. (1994),
defend the same guidelines. According to J. Banks (1999) every simulation study begins with
a statement of the problem, followed by the definition of goals and the general project plan,
the conceptualization of the model, data collection, model translation to a computational
model, the verification and validation, definition of the parameters in which the simulation
will occur, development of documents and reports and, finally, implementation.
With these concepts and guidelines in mind, the first step was to define the problem. As it was
previously stated, Farfetch grows at an exponential rate, and the production layouts and
structures have to keep up with it; therefore, a tool that allows the experimentation and the
understanding of the impact before implementing assumes a great importance. Then, it was
crucial to determine the final objective of the simulator, so that it would be possible to
develop the most appropriate model that answers every requirement established.
Regarding the design of the conceptual and computational models, it was necessary to
understand and define the process, to thoroughly include all the requirements and
characteristics, in order to develop it as similar as possible to the reality. To achieve this, the
approach used was to explore each and every workstation, participating in their tasks, always
bearing in mind the search for improvements.
In order to develop the model, the basic idea was to construct the flow using different blocks,
each one giving different orders to the system.
Table 4 presents the blocks used for the development of the model, followed by a simple
explanation of its functions (Bradly 2007).

Implementation and analysis of a production simulation model
23
Table 4 - Arena Blocks
Block name Image Description Application example
Create
This module is the starting point of any
simulation, being responsible for creating the
entities that arrive in the system.
The arrival can be either based on a schedule or
on the time between arrivals.
The creation of entities
arriving in the system.
Process
This module represents the processing moments
on the simulation.
The representation of
every process.
Decide
This module represents the decision moments of
the simulation, which can be based on one or
more probabilities or on one or more condition.
The decision based on an
attribute, whether or not
the product is defective.
Assign
This module’s function is to assign different
attributes, variables, entity types, entity pictures
or other system variables.
The assignment of the
attribute representing
whether or not the
product is defective.
Hold
This module controls the queue, holding it until
a signal is given or a certain condition is
verified.
Holding the arriving
products until the arriving
time.
Separate
This module is used to duplicate entities or to
divide a batch previously formed.
The separation of the
different product rails.
Batch
This is the module responsible for the grouping
mechanism in the simulation model.
The aggregation of the
various product rails.
Route
This module is responsible for transferring an
entity from a station to another or to a defined
sequence of stations.
The indication of the
station to follow.
Station
This module defines a station in which a
process occurs.
The representation of the
station point.
ReadWrite
This module is used to import and export data
from and to and external file.
The insertion on the
system of the number of
arriving slots.
Dispose
This module is the ending point of the
simulation.
The upload of video
contents.
Submodel
This resource groups a set of processes. The set of activities that
compose a station.
Alongside the previous phase and so that all the production conditions were taken into
account, all the data were collected, regarding product specifications and processing times.
The latter were collected in two different ways (on site and trough the database), to include
both older and recent information. It was decided that every sample should be of at least 50
observations, so that a significant amount of results could be evaluated. Upon the data
analysis the sample size was rectified whenever the p-value (used to evaluate the significance
of the data collected) obtained was over the accepted value (0.05).
The Simulation Software chosen has a feature called Input Analyzer, which allows the user to
introduce the data gathered and ensures the proper distribution of values, as well as all the
parameters involved, such as the expression, representing the processing times, the arrival
quantities and so on, the square error and the corresponding p-value. Therefore, it was
possible to achieve the processing times’ expressions. An example of this feature can be
verified on Annex B.

Implementation and analysis of a production simulation model
24
In order to correct all the errors of the conception phase, the model was verified, regarding the
variables that compose the system as well as the blocs that represent the process.
Afterwards, it was validated, i.e. its results were compared to particular cases of the real
system, so that the computational model could be polished (Brito and Teixeira 2001). The
model was improved constantly, so as to the objective of the project could be achieved: the
development of the most flexible, reliable and automatic production model. The final version
of the production model is presented on Annex C.
To develop the simulation’s animation, it was necessary to draw the production’s layout. For
this purpose, Microsoft Visio was used, as it fulfilled all the requirements. It is important to
underline that each alteration made to the simulator’s layout necessarily implied an
adjustment on this element.
4.1.2 Data Analysis Algorithm
The flexibility provided by the simulation increases in the inverse proportion to its user-
friendly features. As one could conclude with the study developed regarding the
characteristics of the software available, Arena has the most flexibility; therefore, the code
development and management are quite complex.
The idea was to create an excel file that would control both the inputs and the outputs of the
simulation so that, on one hand, the information could be accessible on one single source and,
on the other hand, the reports could be personalized, as the ones provided by the simulator are
very extensive, composed by dozens of pages, and complicated, due to the dispersion of the
data. Using Arena’s ReadWrite Module, this has been possible: this component allows to
provide the model with external information on each replication (simulation run) and to
collect the resulting data considered important to make a decision.
As the simulator software doesn’t allow the model to get information from different cells on
the same file, i.e. different instructions from the same path, each command cell is connected
to another file from which the model will read. This is the reason why the information is only
received by pressing the corresponding button.
4.1.2.1 Input Section
To decide the aspects that were relevant to control on each replication and the output
considered important to make decisions, a meeting with all the managers that were involved
was arranged. It was then decided that the inputs that were to be controlled would be: (i) slot
quantity, (ii) resource capacity, (iii) category arrival probabilities, (iv) product transfer
moments from the Photography department to Logistics and (v) the arrival moments.
Additionally, a Resource Quantity Suggestion Algorithm was developed.
Resource Suggestion Algorithm
Based on the daily production targets of each workstation, on the product arrival quantity
defined and on budget limitations, the algorithm proposes a combination of resource
quantities and the need for extra work shifts.
Since a product can run different paths depending on its category, the quantity calculation has
to be personalized for each station. This happens to Live Model Women, Live Model Men,
Flat and Stills stations, in which the Slot is divided. The following mathematical formulas

Implementation and analysis of a production simulation model
25
exemplify the respective calculations: (1) represents all the stations, with the exception of the
ones mentioned above, and (2) all those mentioned above.
Equation 1 - Resource Calculation
(1)
Equation 2 - Resource Calculation
The Slot and Average Quantity are defined by the user as, upon the arrival of the items, there
is only an idea of its size that may or may not correspond to the actual number. This is also
why the budget requires that the resource suggestion is based on only 95% of the arrived
quantity. When observing Equation 2, the “Maximum Arrival Probability” parameter
concerns the categories that are processed on each station, which are represented on Table 5.
Table 5 - Arrival Probabilities for Each Station
Workstation Categories
Live Model Women Women’s Clothing + Women’s Bags
Live Model Men Men’s Clothing + Men’s Bags
Flat Women’s Clothing + Men’s Clothing
Stills Accessories + Bags + Lifestyle + Jewelry + Shoes
The algorithm also recommends the utilization of work shifts. For this purpose, three rules
were defined in line with the budget, depending on the decimal quantity:
1. if it is lower or equal to 0.1 it won’t be suggested a shift;
2. if it is between 0.1 and 0.6 (inclusive) it will be suggested a shift, and
3. if it is higher than 0.6, it will advise another resource.
Based on this information, the user has the possibility either to use the quantities suggested or
to change them. The only parameter the analyst will have to alter on the tool is the resource’s
shift, if he decides it is not the Normal Shift. The information regarding this theme will be
presented further in this report.
4.1.2.2 Output Section
As for the output, the metrics used to assess the system were also designed. Firstly, in order to
test the impacts on simple alterations, which would only change a part of the flow, the
indicators chosen were the Value-Added Time per Entity, the Waiting Time per Entity and the
Utilization on each process per replication. All these parameters are given by the simulator
reports.
To evaluate the overall behavior, the Production KPIs were selected:
(i) the Average Utilization,
(ii) the arrived and sent items,
(iii)the photo and video items completely produced, i.e. after edition and quality approval,
(iv) the Parts Per Person, which is the (resource) cost of production and
(v) the Lead Time, which is the devolution speed of the products.

Implementation and analysis of a production simulation model
26
The last two are not given; therefore, they have to be calculated. The mathematical formulas
are presented below.
Equation 3 - Parts Per Person Calculation
The Total of Resources Used corresponds to the quantity given to run the simulation.
Equation 4 - Lead Time Calculation
(
)
In this case, the Replication Length is 10 week days.
Finally, the model was ready to be implemented.

Implementation and analysis of a production simulation model
27
5 Production Simulator
Features 5.1
As previously explained, to create the most user-friendly tool, the aspects to control and to
collect from the simulation were grouped in one Excel file. However, the Arena Software
does not allow the input of all parameters. For that reason, and to provide a good experience
on the utilization of the simulator, a User Manual was developed and it is attached as Annex
D.
The Excel file developed is divided into three segments: the Inputs, in which elements for the
simulation can be altered; the Outputs - By Process, providing detailed information regarding
the different activities; and Overall Analysis, offering simulation data regarding a wider
variety of aspects, namely the Production’s KPIs. Since there were a number of changes to the
layout, including the elimination of stations, the final version of this sheet only presents the
remaining and final positions.
5.1.1 Inputs
Figure 10 shows the print of the Inputs sheet.
As illustrated in the above example, each button corresponds to one action. Thus, this
algorithm has six technical features:
1. Slot Quantity Alteration, in which one can introduce the number of slots to arrive on
each week day;
2. Resource Capacity, which provides the simulator with the number of resources on
each workstation;
3. Category Probabilities, where each week’s category arrival probability is defined;
4. Product Transfer, which corresponds to the moments of the day in which the products
that have already been photographed are transferred from the Photography sector to
Logistics;
5. Product Arrival, representing the product arrival on the Company;
6. Resource Suggestion.
Figure 10 - Input Sheet

Implementation and analysis of a production simulation model
28
It is also important to point out that if the product probability is wrongly given, an error
message will pop-up so that the user may correct the mistake and a red flag will appear at the
end of the corresponding line. The next image clarifies this feature.
5.1.2 Output – By Process
To compare scenarios and to analyze the impact of those alterations on each workstation, the
next layout was developed.
Each workstation has the latter information available. For layout reasons, as the data is
provided side by side, Figure 13 only shows one example.
By pressing the “Update Result” button, a new row of results will be introduced bellow, as it
is shown in Figure 14.
Figure 13 - Output by Process (i)
Figure 11 - Error Notification

Implementation and analysis of a production simulation model
29
As it can be seen, the Scenario number also updates when new information is added to the
file. The “Reset Result Sheet” button clears the contents of these sheets so that a new analysis
can be done.
5.1.3 Overall Analysis
Regarding the overview of the process, another tab was developed with the following
information.
By observing this report, one can analyze the impact of the alterations proposed on: Resource
Utilization, number of Media Contents (Photo and Video) uploaded, Items Arrived vs Items
Sent, the Parts per Person and the Lead Time. This will provide global information about the
system, enabling the controller to make decisions reckoning the general impact.
Using the same logic, the reset button clears all sheet contents.
Implementation 5.2
As previously stated, this simulation tool was built with two main objectives: (i) to explore
layout alterations before implementing them on the shop floor and (ii) to help defining the
best resource combination.
Figure 14 - Output by Process (ii)
Figure 25 - Overall Analysis

Implementation and analysis of a production simulation model
30
The simulation model, due to its stochastic nature, was run 6 times, each run representing two
weeks.
5.2.1 Structural Alterations
Firstly, the simulator was used to explore two layout/structural changes that were on the
manager’s mind, but never implemented, as there was no way to evaluate their potential
impacts: (i) the merge between Scan In and Duplicate Validation and (ii) the introduction of
the Step1 product characterization on Scan Out. Additionally, since this season’s priority is
Quality, both of imagery and styling, a new approach to the latter’s methodology was tested.
Finally, other idea was explored regarding the process of Jewelry items.
To analyze potential improvements and to quantify the impact resulting from the changes, an
initial state was simulated. The idea was to keep the external conditions throughout the
analysis of the layout changes so that this would be the only impact considered. For these
changes, both the simulation code and the animation layout had to be adapted to correspond to
the new particularities.
5.2.1.1 Initial State
As indicated, the basis for comparison was the initial state. It was analyzed a period of 10
working days of 16 hours each. Each day has 16 hours because the model was intended to be
the most flexible possible: as the earliest shift may start at 6h and the latest ends at 22h, i.e.
there is the possibility to choose the resource’s work shift from the ones on Table 6.
Table 6 - Shift information
Shift name Shift Period Break Time [15 minutes each]
Morning shift 6h - 9h 8h45
Normal shift 9h - 18h 11h and 15h45
Late Shift 18h - 22h 19h30
First Shift for Live Model 6h - 14h 8h45 and 11h
Second Shift for Live Model 14h - 22h 15h45 and 19h30
There are two shifts specific for Live Model. Live Model Women, on a Normal shift, has the
possibility to allocate at most 4 teams: while, in each studio, one is shooting, the other one is
on the Styling Preparation Workstation. On the Men’s case, there is only the possibility to
have one team since the styling preparation is done on site. Therefore, in order to double the
capacity, the teams will have to work on the defined shifts. There is also the possibility to
increase the number of models on each station: while one is shooting, the other one is
changing the clothes.
Regarding the arrived quantity, the simulation predicted a moment of low season, which
means they would arrive between ten and twelve slots, with their quantity given by an
expression based on the last 50 slots arrived. This detailed information is given on Annex E.
The layout is available on Annex F.
Concerning the resources allocated to this simulation run, the combination is represented on
the Table 7.

Implementation and analysis of a production simulation model
31
Table 7 - Resource Combination Initial State
Workstations Quantity
Logistics
Scan In 1(1)
or 2(2)
or 3(3)
Step 1 1
Step 1 Accessories 1
Scan Out 3
Duplicate Management
Duplicate Validation 1
Photography
Live Studio Women 2
Model Station 1 1
Model Station 2 1
Live Studio Men
Model 1
Flat 4
Stills 3
Photo Editing 8
Video Editing 1
Quality
Photo Quality Control 1
Editing Quality Control 1
The reason why the scenarios were analyzed with one, two or three resources on Scan In is
that, further along, layouts in which this item varies between 1 and 3 were explored. To
simplify the analysis, the layout will be distinguished with (1)
, (2)
or (3)
depending on the
number of Scan In resources used.
Since the main alterations would have a direct impact on the Scan In, Duplicate Validation
and Scan Out, only their results were analyzed in detail in the next two subchapters.
5.2.1.2 Workstations Merger – Scan In and Duplicate Validation
The objectives with these structural alterations were:
1. Prevent re-work on Duplicate Validation;
2. Reduce product and resource dislocation;
3. Keep every Slot together;
4. Provide all the items for product Styling, in case of Women’s Clothing and Bags.
As a first approach, the decision was to divide the tasks so that the product would be available
in a shorter amount of time.
Hypothesis 1
On the initial scenario, each workstation’s tasks can be listed as:
Scan In
1. Pick up the arrived box;

Implementation and analysis of a production simulation model
32
2. Withdraw all the products;
3. Remove the individual plastic package;
4. Scan the product;
5. Verify if the product has any defect; if yes, register the defect information,
take a picture and store it in a specific rail;
6. Remove the label;
7. Verify if the product is a duplicate; if yes, store it in a specific rail;
8. Store the product on the rail, on a coat hanger.
Duplicate Validation
1. Withdraw the product from the rail;
2. Verify if the product is in fact a duplicate; if not, store it on the rail, which will
return to the process on Step 1;
3. Insert the product information on the Duplicate Table;
4. Store the product on the rail to be sent to the Holding Stock zone.
The task distribution proposal consists of:
Scan In
1. Pick up the arrived box;
2. Withdraw all the products;
3. Remove the individual plastic package;
4. Scan the product;
5. Verify if the product is a duplicate; if yes, store it in a specific rail;
6. Store the product on the rail, on a coat hanger.
Duplicate Validation
1. Withdraw the product from the rail;
2. Verify if the product has any defect; if yes, register the defect information,
take a picture and store it in a specific rail;
3. Verify if the product is a duplicate;
a. if yes, insert its information on the Duplicate Table, store the product
on the rail to be sent to the Holding Stock zone;
b. if not, remove the label and store it on the rail that will be sent to Step
1.
It is also important to state that, meanwhile, there were technological developments that now
allow the data introduction on the Duplicate Table to be faster, so that it will also be
considered on this analysis.
By proceeding with these alterations, the advantages would be:
If the product is a duplicate, there is no need to remove the label;
The product introduction on the system is faster;
If the product is a not a duplicate, it enters the system with the rest of the Slot, which
will allow the Slot to be completed faster, since it moves together through the process.
For this experiment, three different layouts were analyzed. Note that both stations would be
inserted on the Scan In location: the Scan In functions would be developed by the person in
the red circle zone and the Duplicate Validation’s by the person in the black circle (See Table
8).

Implementation and analysis of a production simulation model
33
Table 8 - Layouts analyzed (Hypothesis 1)
Layout type Image
Layout 1x1
Layout 1x2
Layout 2x2
The results are synthesized in Tables 9 and 10.
Table 9 - Results on Scan In Workstation (Hypothesis 1)
Layout Scan In – average value-
added time [min]
Savings
[%]
Scan In – average waiting
time [min]
Savings
[%]
Initial State (1)
1,07 --- 318,91 ---
Layout 1x1 0,08 92.07% 13,13 95,88%
Layout 1x2 0,08 92.14% 12,69 96,02%
Initial State (2)
1,07 --- 38,72 ---
Layout 2x2 0,09 91.59% 5,69 85,30%

Implementation and analysis of a production simulation model
34
Table 10 - Results on Duplicate Validation Workstation (Hypothesis 1)
Layout
Duplicate Validation –
average value-added time
[min]
Savings
[%]
Duplicate Validation –
average waiting time [min]
Savings
[%]
Initial State (1)
3,73 --- 41,53 ---
Layout 1x1 1,22 67.29% 1136,40 -2536.52%
Layout 1x2 1,71 54.22% 372,21 -796,24%
Initial State (2)
2,14 --- 52,47 ---
Layout 2x2 1,62 24.24% 63,21 -20,47%
The high percentages of time decrease on the average value-added time either in Scan In or
Duplicate Validation are originated, on the first, by the reduction of the number of tasks and,
on the latter, by the simplification of the data introduction process.
The favorable impact on the average waiting time on Scan In can be explained by the time
reduction on this task: since each product would be completed faster, so would be the Slot.
For the same reason, occurs the massive increase on waiting time on the next station: since the
products are processed faster, the Duplicate Validation Station is not able to respond to the
quantity of products that it is supplied with.
Hypothesis 2
To solve this issue, the alternative idea that emerged, in addition to altering the tasks, was that
the first step would produce in a continuous flow, i.e. the Duplicate Validation would work
immediately after Scan In.
In a first phase, the test was made with the layouts previously presented to ascertain if it
would produce better results with this methodology. The results obtained are presented in
Tables 11 and 12.
Table 11 -Results on Scan In Workstation (Hypothesis 2)
Layout Scan In – average value-
added time [min]
Savings
[%]
Scan In – average waiting
time [min] Savings [%]
Initial State (1)
1,07 --- 318,91 ---
Layout 1x1 0,09 91,59% 13,16 95,87%
Layout 1x2 0,09 91,59% 12,93 95,95%
Initial State (2)
1,05 --- 139,28 ---
Layout 2x2 0,09 91,93% 5,51 96,04%
Table 12 - Results on Duplicate Validation Workstation (Hypothesis 2)
Layout
Duplicate Validation –
average value-added time
[min]
Savings
[%]
Duplicate Validation –
average waiting time [min]
Savings
[%]
Initial State (1)
3,73 --- 41,53 ---
Layout 1x1 1,21 67,56% 1085,14 -2513.09%
Layout 1x2 1,22 67,29% 180,78 -335.34%
Initial State (2)
3,76 --- 148,00 ---
Layout 2x2 1,22 67.59% 202,45 -36,79%

Implementation and analysis of a production simulation model
35
When observing the results for Scan In, one understands that they did not register any
alteration, as the impact of the test would only be felt on the next station. The same happens
to the processing time.
Regarding Duplicate Validation, the negative influence of the continuous flow results can be
explained by the fact that, since the product moves automatically from a position to the other,
the creation of batches no longer happens. This means that this station will be fed faster,
reaching its limit sooner.
The last two scenarios were excluded as the task distribution between the stations is
completely unbalanced, contributing to the delay of the entrance of the items in the system,
which was exactly contrary to the objective.
Hypothesis 3
The next hypothesis considered was used to evaluate the potential of continuous flow.
The analysis was made without changing any tasks, just by joining together the two stations at
the beginning of the process. Hence, if the piece was not identified as a possible duplicate, it
would immediately be placed on a rail instead of being sent to the duplicate phase.
It is vital to mention that, since there won’t be any alterations to the tasks developed by each
station, excluding the withdrawal of the product from the rail by the duplicate station, the
layouts will be different from the previous since there will be no time reduction in the first
station. Hence, the layouts explored were different.
Table 13 - Layouts analyzed (Hypothesis 3)
Layout type Image
Layout 2x1
Layout 2x2

Implementation and analysis of a production simulation model
36
Layout 3x1
Layout 3x2
Layout 3x3
The results for each layout are presented in Tables 14 and 15.
Table 14 - Results on Scan In Workstation (Hypothesis 3)
Layout Scan In – average value-
added time [min]
Savings
[%]
Scan In – average waiting
time [min]
Savings
[%]
Initial State (2)
1,05 --- 139,28 ---
Layout 2x1 1,02 3.18% 59,97 56,94%
Layout 2x2 0,98 7.02% 60,06 56,88%
Initial State (3)
1,06 --- 91,42 ---
Layout 3x1 1,04 1.97% 59,03 35,43%
Layout 3x2 1,05 0.93% 58,43 36,09%
Layout 3x3 1,03 2.18% 59,09 35,36%

Implementation and analysis of a production simulation model
37
Table 15 - Results on Duplicate Validation Workstation (Hypothesis 3)
Layout Duplicate Validation – average
value-added time [min]
Savings
[%]
Duplicate Validation –
average waiting time [min]
Savings
[%]
Initial State (2)
3,76 --- 148,00 ---
Layout 2x1 2,18 41.92% 37,72 74,51%
Layout 2x2 2,18 41.89% 31,38 78,80%
Initial State (3)
3,78 --- 109,88 ---
Layout 3x1 2,19 41.73% 45,88 58,25%
Layout 3x2 2,18 41.97% 41,31 62,40%
Layout 3x3 2,20 41.49% 1,12 98,98%
By analyzing Tables 14 and 15, it is obvious that this flow choice is the most advantageous
for this case, regarding waiting times.
Concerning the Scan In results, the slight increase in the processing time could be due to the
simulation itself, as they are stochastic events. When examining the waiting time results, there
is also a decrease which can be explained by the reduction in the processing time.
When analyzing the results of the alterations in Duplicate Validation, there is always an
approximate 40% decrease in the processing time. This is due to the fact that the dislocation
to pick up another rail is no longer necessary. This will inevitably reduce the waiting time on
this station. Additionally, one can verify a decrease in this station’s waiting time, which is due
to the reduction on the processing time and also to the fact that the product is closer to the
station and available on an easier way.
Hypothesis 4
As one of the main objectives of the present simulation was to eliminate the re-work, the last
hypothesis considered was to concentrate both the activities on Scan In, i.e. the Duplicate
Validation position would be erased from the system. In this way, all the objectives proposed
would be reached. The tests were made with one, two and three resources on the Scan In in
order to establish which would be the best resource combination. The results are given in
Table 16.
Table 16 - Results on Scan In Workstation (Hypothesis 4)
Layout Scan In – average value-
added time [min]
Savings
[%]
Scan In – average waiting
time [min]
Savings
[%]
Initial State (1)
1,07 --- 318,91 ---
1 resource 1,16 -8,41% 998,10 -212,97%
Initial State (2)
1,05 --- 139,28 ---
2 resources 1,18 -12,38% 185,87 -33,45%
Initial State (3)
1,06 --- 91,42 ---
3 resources 1,16 -9,43% 102,76 -12,40%
The processing time experienced an increase, since if a product is identified as a potential
duplicate the validation would necessary imply new tasks and therefore increase that time.
However, the impact is only around 10% since the proportion of duplicates identified by this

Implementation and analysis of a production simulation model
38
station is only about 20%. When observing the waiting times generated by the simulation, a
slight increase is also registered, resulting from the alterations on the processing time. In spite
of this alteration’s impact on the latter factor, it has proved to be the best choice since it is
able to fulfill all the proposed objectives with a minimum cost of time.
Additionally, many other improvements may result from joining the positions. This means
that the time-related and task efficiency winnings can be higher than the expected, as the
company has a great mindset towards seeking improvement.
The overall impact of this decision is presented in Table 17.
Table 17 - Overall Impact of First Alteration
Workstations Average Utilization
Average Value-Added
Time [min]
Average Waiting Time
[min]
Initial State Final State Initial State Final State Initial State Final State
Logistics
Scan In 35,35% 51,45% 1,05 1,18 139,28 185,87
Step 1 39,13% 49,91% 0,79 0,74 23,26 25,09
Step 1 Accessories 21,91% 25,12% 1,15 1,13 12,51 12,33
Scan Out 7,15% 10,96% 1,39 0,58 234,31 281,34
Duplicate Management
Duplicate Validation 59,92% --- 3,78 --- 109,88 ---
Photography
Styling Preparation --- --- 2,26 1,30 244,3 253,21
Live Studio Women 70,69% 79,70% 1,04 1,03 200,94 223,72
Live Studio Men 16,74% 19,02% 1,04 1,04 5,49 8,81
Flat 31,18% 36,17% 3,01 3,15 11,69 27,21
Stills 73,44% 93,10% 4,61 4,41 30,92 61,35
Photo Editing 24,48% 26,03% 2,49 2,39 23,11 48,42
Video Editing 21,44% 38,50% 6,38 6,30 26,01 55,15
Quality
Photo Quality Control 17,95% 27,05% 0,39 0,40 8,52 15,71
Editing Quality Control 23,57% 35,35% 0,55 0,56 10,54 20,63
Analyzing Table 17, the low values on the utilizations can be explained by the fact that, at the
beginning of the simulation, there is no backlog on any station. This means that the resources
were idle. It was interesting to notice that this reflects exactly what happens after the
production stoppage, which happens twice a year, at the beginning of the low season. If a
wider range of time is to be analyzed, one only has to change the parameter setup to the
desired length. For this case, this time window was the chosen by all involved, in order to
simplify the decision making process. Despite the above, it was interesting to understand that
the utilization increased on every station which is due to the faster introduction of the items
on the production system.
Evidently, and for the same reason, the waiting time has also increased.
Finally, the processing times have not registered any significant alterations (except for Scan
In) as these parameters were not changed.

Implementation and analysis of a production simulation model
39
This proved to be a better scenario, as it involves at least one less resource and, as was
previously concluded, fulfills all the proposed objectives: (i) prevention of re-work on
Duplicate Validation, (ii) reduction on product and resource dislocation; (iii) do not break up
the Slot and (iv) provide all the Women’s Clothing and Bags for Styling purposes.
Summary
In order to provide a brief description of the changes made to the system, Table 18 presents an
overview of the main impacts, both positive and negative of each hypothesis studied.
Table 18 - Impact Summary
Scenario Description Positive Impacts Negative Impacts Average Savings
Processing
Time
Waiting
Time
1
● Approximation of Scan
In and Duplicate
Validation operations;
● Decrease Scan In tasks;
● Duplicate Validation
operation.
The items are
withdrawn from the
boxes faster;
There is no re-work
regarding the search for
defects;
The slot is not broken
up;
There are no transfers
between stations.
The second position is
overwhelmed;
There is still re-work
regarding the handling of
the items;
The tasks are not
correctly balanced.
70.35% -631.13%
2
● Approximation of Scan
In and Duplicate
Validation operations;
● Decrease in Scan In
tasks;
● Duplicate Validation
operation;
● Continuous Flow
production.
The items are
withdrawn from the
boxes faster;
There is no re-work
regarding the search for
defects.
There is no transfers
between stations;
The slot is not broken
up;
The production is
continuous.
The second position is
overwhelmed;
There is still re-work
regarding the handling of
the items;
The tasks are not
correctly balanced.
79,50% -527,57%
3
● Approximation of Scan
In and Duplicate
Validation operations;
● Continuous Flow
production.
There is no transfers
between stations;
The slot is not broken
up;
The production is
continuous;
Reduction of unitary
Waiting time on both
operations.
Re-work. 22,43% 59,36%
4
●Only one resource is
responsible for Scan In
and Duplicate
Validation’s tasks.
There is no re-work;
The items are available
on a wider variety;
The slot is not broken
up;
There are no transfers
between stations.
Slight increase in
unitary Processing and
Waiting time.
-10,07% -57,27%
When observing Table 18, it may seem that the best scenario is not the fourth but the third, as
it predicts significant decreases both on processing and waiting times. However, it still
presents re-work, which was an aspect that was supposed to be eliminated with the alterations.
For that reason, the hypothesis chosen was number 4. Despite the slight increase on the above
mentioned average times, as expected (since the number of tasks increased), it proved to be a

Implementation and analysis of a production simulation model
40
small price because all the objectives established at the beginning of this implementation were
fulfilled. It is also important to note that many improvements on the process may come from
these alterations, which will definitely have a positive influence on those times.
5.2.1.3 Tasks Merger – Introduction of Step 1 Task on Scan Out
Once again, the primary objective was to eliminate re-work and to quicken the product
introduction on the system. As previously explained, the Step 1 function, like the Scan Out’s,
is to categorize the product on the platform. This means that the worker has to access the
website and insert information about the product on Step 1 and then again, on Scan Out, with
the sole difference that the information is introduced on different tabs.
In order to test this new alteration, the basis used was the previously selected. The processing
time regarding the categorization of the item was inserted on Scan Out, erasing Step 1. The
overall results are presented in Table 19.
Table 19- Overall Impact of Second Alteration
Workstations Average Utilization
Average Value-Added
Time [min]
Average Waiting Time
[min]
Initial State Final State Initial State Final State Initial State Final State
Logistics
Scan In 51,45% 50,92% 1,18 1,17 185,87 186,69
Scan Out 10,96% 11,12% 0,58 0,88 281,34 293,22
Photography
Styling Preparation --- --- 1,30 1,27 253,21 255,30
Live Studio Women 79,70% 85,78% 1,03 1,03 223,72 290,60
Live Studio Men 19,02% 19,58% 1,04 1,04 8,81 10,97
Flat 36,17% 37,34% 3,15 3,19 27,21 30,78
Stills 93,10% 91,12% 4,41 4,45 61,35 52,88
Photo Editing 26,03% 25,92% 2,39 2,38 48,42 39,98
Video Editing 38,50% 42,20% 6,30 6,30 55,15 53,90
Quality
Photo Quality Control 27,05% 27,13% 0,40 0,40 15,71 15,23
Editing Quality Control 35,35% 35,81% 0,56 0,57 20,63 17,98
As it is possible to conclude immediately, the product would now be available for styling and
photography sooner. As Scan Out registered a utilization rate rather low, this would not
damage the overall system, contributing to the faster introduction of the product. This is
proven by the slight increase on the waiting times of the majority of the workstations. It is
also responsible for the increase of the average utilization percentage, which means that the
resource’s overall idle time has reduced, on this case, in around 2%.
Again, the processing time on every workstation, excluding Scan Out, that has registered a
34% increase, has remained unchanged.
Despite the fact that the immediate quantitative results register rather low values, on the long
term, the financial impact would be significant. Just like the previous alteration, this will
eliminate at least 2 resources, as two positions have been erased (Step 1 and Step 1
Accessories), contributing to a reduction of the annual cost.

Implementation and analysis of a production simulation model
41
Due to the extinction of workstations, the layout was adapted. The final version is available
on Annex G.
5.2.1.4 Styling Process Review
As explained before, the Quality is a priority at this moment.
In order to increase the quality of the styling process, the way is to provide a wider variety of
items to be combined with each other. Currently, the items can be styled with items from the
same style within its Slot or with products from the Tool Kit.
On a long term, the objective is to be able to style all the products with each other, with no
limitations on this subject. This ability has to be negotiated with the stores and, for that
reason, it is not yet possible. However, the opportunity has come that all the Bags can be
styled with all the products. With this alteration, new processes had to be designed, so they
were firstly simulated to understand the limitations of the model upon this change.
Hypothesis 1
The idea for the first scenario was to set no boundaries: the Slots should be opened at Scan In
according to their quantity of Women’s Bags, i.e. the Slots with the higher quantity of bags
are opened first and the stylists, on Styling Preparation, can use the bags available as they
like. In this case, the categories proportions were changed, in order to potentiate the arrival of
Women live model items, such as clothing and accessories.
In this scenario, the impact has to be evaluated on the overall system, as it was crucial, first of
all, to understand if this would increase the Lead Time.
As previously referred, Farfetch is committed to send the products to the stores within a three
day period. This alteration would increase the Lead Time in one day, resulting in penalty costs
for the Company (see Table 20).
Table 20 - Styling Alterations Hypothesis 1
Current Scenario New Scenario
Parts Per Person 244 198
Lead Time 2,69 3,78
Hypothesis 2
By observing the behavior of the system with these alterations, it was possible to conclude
that, as the Photo Quality Control only evaluates the items by Slot, i.e. they only start
verifying the Slot after all its items have been photographed, a delay on one single bag can
have a great impact in its Lead Time. For this reason, the next scenario explored was mixing
the Styling alteration with a new rule for Quality check: the items would be assessed by Rail,
which is by Category and Gender (e.g. Clothing Women, Bags Men). The results are given in
Table 21.
Table 21- Styling Alterations Hypothesis 2
Current Scenario New Scenario
Parts Per Person 244 298
Lead Time 2,69 2,54

Implementation and analysis of a production simulation model
42
As one can observe, this change in Styling methodology doesn’t impact Lead Time,
contributing to a slight increase on Parts Per Person. This means that, in fact, the bottleneck of
the process was the Slot aggregation before Quality Control.
With this information, the decision was to alter this process. However, on peaks, it would be
important to be careful with the bags that were opened first so that the time to complete the
processing of the whole Slot would not increase.
It is also important to refer that the results from the alteration in Quality Control were very
favorable to the process; so, this new rule was immediately implemented.
5.2.1.5 Jewelry Process Review
So as to potentiate the sales of Jewelry items, the approach followed was to shoot the product
on a model. Evidently, this would require a change to the process, as the items would now
pass through one more studio (Live Model Women) and this one extra image would have a
significant impact on Photo Edition, increasing this Category processing time by 50%.
It is important to refer that the proportion of jewelry arriving on Farfetch is rather low (around
6%); so, for this test, three scenarios were evaluated with this change in the process: (i)
current arrival probability, (ii) 30% increase on probability arrival and (iii) 50% increase on
probability arrival (see Table 22).
Note that this alteration includes the new Quality Control rule.
Table 22 - Jewelry Process Alteration
Current Probability 30% Increase 50% Increase
Parts Per Person 230 220 215
Lead Time 2,76 3,23 3,47
Having this information, it is possible to conclude that in the worst case, this being the 50%
increase, the cost of the products would increase about 7% (Parts Per Person).
Since this is a very complex alteration in terms of the process and will definitely imply the
increase on the production costs, the next step will be to present this data to the Board.
5.2.2 Resource Combination Analysis
The second objective of this simulation tool is to assist with the definition of the resource
quantities for each workstation. For this type of analysis, the user only has to change the
parameters in the Excel File and run the model.
Then, by pressing the “Update Result” button, the user is able to evaluate the desired
parameters. This feature is especially interesting when allied to the production planning,
enabling the controller to decide, according to the products arrived, which is the best resource
combination, as the peaks on Farfetch are resolved by hiring freelancers to join the core team.
As an example, the number of arriving Slots was increased by four units and the Suggestion
Algorithm was run. The results are shown in Table 23.

Implementation and analysis of a production simulation model
43
Table 23 - Resource Suggestion
Workstations Initial Quantity Suggested Quantity Suggested Shifts
Logistics
Scan In 2 3
Scan Out 3 4
Photography
Live Studio Women 2 2
Model Station 1 1 2
Model Station 2 1 2
Live Studio Men
Model 1 2
Flat 4 4
Stills 3 3
Photo Editing 8 12
Video Editing 1 3
Quality
Photo Quality Control 1 2
Editing Quality Control 1 2
The number of resources was adjusted and the simulation was run with the given quantities.
The overall result of this alteration is presented in Table 24.
Table 24 - Overall Result from Resource Suggestion
Workstations Average Utilization
Average Value-Added
Time [min]
Average Waiting Time
[min]
12 Slots 16 Slots 12 Slots 16 Slots 12 Slots 16 Slots
Logistics
Scan In 50,92% 50,68% 1,17 1,17 186,69 184,72
Scan Out 11,12% 19,45% 0,88 0,66 443,13 188,77
Photography
Styling Preparation --- --- 1,27 1,28 255,30 263,44
Live Studio Women 85,78% 87,33% 1,03 1,03 290,60 287,05
Live Studio Men 19,58% 19,29% 1,04 1,04 10,97 10,27
Flat 37,34% 37,16% 3,19 3,20 30,78 34,62
Stills 91,12% 91,69% 4,45 4,46 52,88 50,33
Photo Editing 25,92% 17,56% 2,38 3,18 39,98 26,17
Video Editing 42,20% 41,90% 6,30 6,27 53,90 41,93
Quality
Photo Quality Control 27,13% 9,10% 0,40 0,20 15,23 6,96
Editing Quality Control 35,81% 17,59% 0,57 0,56 17,98 16,55
This feature enables the user to quickly understand the impact of the quantity of resources of
each station and take responsive and informed decisions in regard of hired personnel. For
example, perhaps it won’t be necessary to hire another resource for Photo Quality Control, as

Implementation and analysis of a production simulation model
44
the utilization may be low and the waiting times won’t justify the extra person. When
observing the overall results, one can note there is no entropy in the system, as the simulation
results are balanced.
This is exactly the purpose of this feature: to be able to be responsive and to plan in advance,
so the production flows as smoothly as possible.
5.2.3 Other developments
While understanding the workstations behavior, as it was previously explained, the approach
was to learn in detail the tasks, always having in mind possible improvements. In this
subchapter, the alterations for each workstation are presented, as well as its motivations.
5.2.3.1 Logistics Department
According to the specificities of the production model, the Slot has to be divided throughout
the process, since depending on its characteristics it can follow different paths. However, as it
was previously stated, it has to be returned complete. For this reason, by the time the products
arrive on Scan Out, or even at Expedition, they have to be grouped by their Slot Identification
Number so the Logistics’ mizusumashi, which is the person responsible for supplying the
workstations, has to look for the missing items.
Figure 12 presents the tool developed to aid in this process.
Figure 12 - Product Tracking Tool

Implementation and analysis of a production simulation model
45
As the finding process was defined, the mizusumashi had to search on every possible location,
in order to track down the absent items. Obviously, this process could and should be
improved, as this method is very slow. Since the product is scanned on each station, it is
possible to find the last station in which it has been just before; in this way, the search process
would be faster and more effective.
As it is possible to observe on Figure 12, the simple introduction of the missing Product
Identification Number is enough to find it.
Nowadays, products are caught faster, and so the slots are closed at a higher rate.
5.2.3.2 Scan In Workstation
When observing this station, what came to mind was the excessive use of paper and pencil, as
every new box and rail had to be signalized with the corresponding information, including
arrival date, slot number, quantity, store and composition. This process, being the first, is
responsible for the cadency of the product entrance on the system; therefore, it should be the
fastest possible. On the other hand, the use of pencil is not ideal, as it can damage the
products.
To solve this problem, an Excel algorithm was created. At the moment, instead of being the
Scan In resource to do this, it is the person responsible for the expedition on the day before of
the slot arrival and considering the planning sheet. The user only has to copy and paste this
sheet to the file and press the corresponding button. The user has four different alternatives:
(i) to print all the registration sheets from the slot; (ii) only one combination of rail and box;
(iii) only one sheet for a rail and (iv) only one sheet for the box.
This tool is presented on Annex H.
Additionally, important information was just registered on paper: the problems detected on
the arriving slots, such as folded forms, hidden forms and unreadable barcodes.
The solution for this issue was to create a simple application to introduce this information that
would not require a significant additional time to the process. This application (shown in
Figure 18) was developed in C# Microsoft language and the only action required from the
user is a simple product sheet scan from any product of the problematic slot.
Figure 13 - Slot Defect Application
The mentioned procedure is simple and effective and allows this information to be consulted
at any moment.

Implementation and analysis of a production simulation model
46
5.2.3.3 Scan Out Workstation
When collecting information on this station, including the processing times, it was easily
understood that the defined target was inadequate: the resources could always exceed the
predicted production value. This appears as a problem since they were not being challenged
enough and usually reduce their work cadence, as soon as the objective was reached.
The step to take on this station was to study which should be the new target to implement, in
order to motivate the workers to produce more. Using the collected processing times, there
were some specifications that needed to be added: (i) the proportion of brands that needed
labels, as its creation or introduction is one of this workstation’s tasks and does not have to be
done for each product; (ii) the arrival category, since the times for each different product can
be very different; and (iii) the use of the third quartile of the resulting time (instead of the
average) as well as the addition of 25% of time in order to give a security margin so that the
target defined could be feasible.
The result of this study was the finding that the lowest target that could be reached would be
377, and not the currently defined 140 pieces per day, without making any change to the
system. After talking to the Logistics manager, the decision was to smoothly increase this
value, so that the staff could have time to adapt to this (169%) change. So, in a short term, the
targets proposal is represented in Figure 14.
Figure 14 - New Target Implementation Proposal
5.2.3.4 Step 1 and Scan Out Workstation
One of the most troubling problems of this process is the lack of information on the database.
This means that most of the data regarding the production’s vicissitudes, namely exchanged
product identification sheets and duplicate products packed, are only registered on a piece of
paper. However, the creation of one additional task could have an impact on the productivity
of the station.
Like the application developed for Scan In, it could not consume a significant amount of time
from the worker, so the principle was the same: the interaction would be the scan of the
corresponding product sheet.
In this case, two different applications were developed: one for the Step 1 (while it was
active), in which the exchanged product forms would be identified, and one for Scan Out,
where, besides the exchanged forms, it was also developed a space to register the duplicates
packed. The Figure 15 shows the applications.

Implementation and analysis of a production simulation model
47
Once again, one can assess that it is not time consuming and it is very simple to use. The
reason why the duplicate product registration is only made at Scan Out is that, as duplicate
products are identified throughout the system, this will only happen at the end of the process
so that the information would not be inserted twice on the database.
5.2.3.5 Quality Department
By learning about the Quality Department, it was shown that there were a number of
processes that were not yet defined. Evidently, this had negative implications on the time and
efficiency of the system’s flow. Therefore, the processes regarding the request for repetitions
were defined and mapped so that they could flow as smoothly as possible.
Additionally, there was another detail on the process that was not being given attention,
despite its great importance. Every time a Repetition is requested, entropy is originated in the
process, as the item assumes priority on the system. In order to level the knowledge and
quality standards between the Photography and the Quality teams, the latter should attend the
first’s daily meetings. Actually, this was supposed to happen; however, as the team members
would be confused about which meeting they should join, they usually wouldn’t go. To
counteract this tendency, the idea was to create a monthly calendar, allocating the elements to
the meetings. Hence, it was developed an automatic tool that can be used forever (see Annex
I). In order to change the month, the user only has to select it from a dropdown list.
Finally, it was possible to conclude that there was absolutely no control on the requested
repetitions, as well as on their characteristics (category, error types and stations) or on who
was responsible. To solve this issue, it was created a Quality Control Dashboard, providing
this daily and weekly information. This report is presented in Annex J.
Figure 15 - Step 1 and Scan Out Application
Implementation and analysis of a production simulation model
48
6 Conclusions and Future Projects
The necessity to resort to Simulation arose from the ever increasing market demands and from
the company’s mindset for optimization.
Currently, the fashion market knows no boundaries or seasonality, since there is no longer a
pull system, but a push one, in which the brands are continuously producing and innovating in
order to survive in this ferocious environment. The ability to be on the edge of technology and
modernization will dictate the endurance of the companies.
The objective of this project was to create a trustworthy tool that would (i) enable the
managers to make decisions about structural changes to the system, such as the merger of
tasks and the alteration of the order of stations and (ii) assist with daily decisions, such as the
recruitment of freelancers, depending on the predicted product arrivals. To tackle the first
topic, several layout options and task distributions were analyzed, until a satisfactory solution
was reached. As for the latter, its reliability was tested and approved. This feature was also
complemented with a Suggestion Algorithm, in order to provide the user hypotheses that took
into account aspects such as workstations’ targets and budget limitations.
All the above mentioned objectives were fulfilled. The company is now able to save 3
resources whose value can be channeled to invest in other areas to improve the production.
Additionally, with the changes made to the system, the product is now introduced in the
system in a shorter amount of time and on a wider variety. Farfetch is investing more and
more on the Quality of the imagery, not only on the technical aspects, but also on styling
related issues. This new improvement will be the key as it will definitely benefit the styling
combinations.
Also, a new process for Jewelry items was explored, in order to potentiate this item’s sales.
As it was previously stated and demonstrated, the Arena Software, in exchange for its great
flexibility is not the most user friendly computer program. This could be a setback for a new
user that doesn’t have any knowledge of this programming method. For this reason, a User’s
Manual was developed. Therefore, with the help of this Handbook, it is expected that
everyone in the company, or at least in the department, will be able to benefit from all of this
tool’s potentialities.
Finally, as it was described, several other minor projects were conducted alongside the main
one. With the regular use of the developed applications and reports, a more complete view of
the overall process will be possible, which will be fundamental to learn about all the aspects
that need to be improved or taken into greater consideration.
The product has been finished and is completely integrated with the daily operations. Now,
any change to the system is firstly simulated and their impacts evaluated, before being
introduced.
As for future projects, the results were so positive that the Company decided to buy the
software, since after July the university license will be no longer valid. This tool will be
implemented in all Farfetch’s production offices around the world.
In addition to this master’s thesis, a paper entitled “Simulation Approach to a Fashion E-
commerce: a Case Study”, which describes this case study was written and submitted to the
Journal of Simulation. This paper is available in Annex K.

Implementation and analysis of a production simulation model
49
The use of simulation software to optimize layouts or to predict consequences of changes
without impacting the real process has been the subject of many studies that prove its
usefulness as a tool. Its range exceeds the simple daily planning, allowing to assist with the
decision making process in complex scenarios involving both internal and external variables.

Implementation and analysis of a production simulation model
50
7 References
Abdulmalek, Fawaz A., and Jayant Rajgopal. "Analyzing the benefits of lean manufacturing
and value stream mapping via simulation: A process sector case study." International
Journal of Production Economics, 2007: 223-236.
Abo-Hamad, Waleed, John Crowe, and Amr Arisha. "Towards Leaner Healthcare Facility:
Application of Simulation Modelling and Value Stream Mapping." (2012)."Towards
Leaner Healthcare Facility: Application of Simulation Modelling and Value Stream
Mapping." Proceedings of the International Workshop on Innovative Simulation for
Healthcare (I-WISH). Vienna, Austria: Dublin Institute of Technology, 2012.
Abu-Taieh, Evon Mo. Computer simulation using Excel without programming. Florida:
Universal-Publishers, 2008.
Abu-Taieh, Evon Mo, and Asim El Sheik. "Commercial simulation packages: a comparative
study." International Journal of Simulation 8, no. 2, 2007: 66-76.
Al-Aomar, Raid, Al-Refaei Mahmoud, Diabat Ali, Nishat F. Mohd, and Alawneh Ameen.
"Using Simulation to Assess the Performance of a Large-scale Supply Chain for a
Steel Producer." Proceedings of the 2014 International Conference on Mathematical
Methods, Mathematical Models and Simulation in Science and Engineering, 2014.
Banks, Jerry. "Discrete Event Simulation." Proceedings of the 1999 Winter Simulation
Conference, 1999: 1.
Banks, Jerry. "Discrete Event Simulation." Simulation Conference Proceedings. Piscataway,
NJ; New York, N.Y.; San Diego, CA: IEEE ; Association for Computing Machinery ;
Society for Computer Simulation International, 1999. 72-80.
Banks, Jerry, and Randal R. Gibson. "Don't Simulate When... 10 Rules for Determining when
Simulation is Not Appropriate." Automation Associates, Inc., 2007: 1.
Banks, Jerry, and Randal R. Gibson. "Don't Simulate When... 10 Rules for Determining when
Simulation is Not Appropriate." Automation Associates, Inc. 29, no. 9 (2007): 30-32.
Bataineh, Omar, Raid Al-Aomar, and Abu-Shakra Ammar. "Simulation-Based Optimization
for Performance Enhancement of Public Departments." JJMIE, 2010.
Bradly, Allen. Arena Contact Center. Rockwell Automation, 2007.
Carvalho Brito, António E.S., and J. Manuel Feliz Teixeira. Simulação por Computador.
Porto: Publindústria, 2001.
Centeno, Martha A., and Manuel Carrillo. "Challenges of introducing simulation as a decision
making tool." Simulation Conference. Arlington, VA: IEEE, 2001. 17-21.
Centre for Business Performance. "Literature Review on Performance Measurement and
Management." Measurement and Information (PMMI) Project (Measurement and
Information (PMMI) Project), 2004.
Coimbra, Euclides A. Total Flow Management: Achieving Excellence with Kaizen and Lean
Supply Chains. Bahnhofplatz: Kaizen Institute, 2009.

Implementation and analysis of a production simulation model
51
Detty, Richard B., and C. Yingling. "Quantifying benefits of conversion to lean
manufacturing with discrete event simulation: a case study." International Journal of
Production Research 38, no. 2, 2000: 429-445.
Devisch, Nadine. Key factors for e-commerce growth in the fashion industry. 02 10, 2014.
http://www.wemoveyourideas.com/en/2014/02/key-factors-for-e-commerce-growth-
in-the-fashion-industry/.
Dias, Luís, Guilherme Pereira, Pavel Vik, and José Oliveira. "Discrete Simulation Tools
Ranking - a Commercial Software Packages comparison based on popularity." 2011.
Domonkos, Tomáš. "Computer Simulation as a Tool for Analyzing and Optimizing Real-Life
Processes." Management Information Systems 5, no. 1, 2010: 13-18.
Felde, Magnus. "Analyzing Security Decisions with Discrete Event Simulation." 2010.
Fishman, George S. Discrete-event simulation: modeling, programming, and analysis. New
York: Springer, 2001.
Fontes, Nuno. Walking to the Top - Como alcançar uma performance excepcional. Barreiro:
Top Books, 2013.
Goldstine, H. H., and Adele Goldstine. "The Electronic Numerical Integrator and Computer
(ENIAC)." Mathematical Tables and Other Aids to Computation, 1946: 97-110.
Gregory, Mike, Andy Neely, and Ken Platts. "Performance Measurement and System Design:
A literature review and research agenda." International Journal of Operations &
Production Management, 1995: 80-116.
Hebbar, Sudhamshu. Retail Costumer Experience. February 6, 2014.
http://www.retailcustomerexperience.com/articles/global-e-commerce-sales-to-hit-15-
trillion-driven-by-growth-in-emerging-markets/ (accessed May 2014).
Heshmat, M., M. A. El-Sharief, and El-Sebaie M. G. "Simulation Modelling of Production
Lines: a Case Study of Cement Production Line." Journal of Engineering Sciences 41,
no. 3 (2013): 1045-1053.
Hirano, Hiroyuki. 5S for Operators: 5 Pillars of the Visual Workplace. Productivity Press,
1996.
Jacobs, F. Robert, Richard B. Chase, and Richard Chase. Operations and Supply Chain
Management. New York: McGraw-Hill, 2011.
Jenkins, Charles M., and Stephen V. Rice. "Resource modeling in discrete: event simulation
environments: a fifty-year perspective." Winter Simulation Conference, 2009: 755-
766.
Kaplan, Robert S., and David P. Norton. "Mastering the management system." Harvard
Business Review, 2008: 62.
Kaplinsky, Rapahel, and Mike Morris. A handbook for value chain research. Ottawa: IDRC,
2001.
Kleijnen, Jack PC. "Supply chain simulation tools and techniques: a survey." International
Journal of Simulation and Process Modelling, 2005: 82-89.
Macorr - Research Solutions. available:
http://www.macorr.com/sample-size-methodology.htm.

Implementation and analysis of a production simulation model
52
Madison, Daniel J. Process Mapping, Process Improvement and Process Managment.
California: Scott M. Paton, 2005.
Nance, Richard E. In History of programming languages I. New York: ACM Press, 1996.
Neely, Andy, Mike Gregory, and Ken Platts. "Performance measurement system design: A
literature review and research agenda." International Journal of Operations &
Production Management, 2005: 1228-1263.
Page, Ernest H. Simulation Modeling Methodology: Principles and Etiology of Decision
Support. Virginia Polytechnic Institute and State University, n.d.
Parmenter, David. Key Performance Indicators: Developing, Implementing and Using
Winning KPIs . New Jersey: John Wiley & Sons, Inc., 2007.
Rother, Mike, and John Shook. Leaning to See: Value Stream Mapping to add Value and
Eliminate Muda. Massachusets: The Lean Enterprise Institute, 1999.
Seppanen, Marvin S. "Developing industrial strength simulation models using visual basic for
applications (VBA)." Proceedings of the 32nd conference on Winter simulation, 2000:
77-82.
Sun, Jiwen, and Wei Xia. "Simulation guided value stream mapping and lean improvement: A
case study of a tubular machining facility." Journal of Industrial Engineering and
Management, 2013: 456-576.
Ulgen, Onur M., Jonh J. Black, Betty Johnsonbaugh, and Roger Klungle. "Simulation
Methodology - A practitioner's perspective." International Journal of Industrial
Engineering, Applications and Practice 1, no.2, 1994.
Wegner, Peter. "Concepts and paradigms of object-oriented programming." ACM SIGPLAN
OOPS Messenger 1, no. 1, 1994: 7-87.
Wei, Zhenxian, and Zhou Lijie. "E-Commerce Case Study of Fast Fashion Industry." Results
of 2012 International Conference of Intelligence Computation and Evolutionary
Computation ICEC. Wuhan, China: Springer Berlin Heidelberg, 2013. 261-270.
Wilson, Lonnie. How to implement Lean Manufacturing. McGraw Hill, 2010.
Živković, Zoran V., and Milorad J. Stanojević. "Simulation analysis of protected B2B e-
commerce processes." Computer Science and Information Systems/ComSIS 3 3, no. 1
(2006): 77-91.

Implementation and analysis of a production simulation model
A53
ANNEX A: Production Value Stream Map
Value Stream Map Men's Clothing
Value Stream Map Women's Clothing
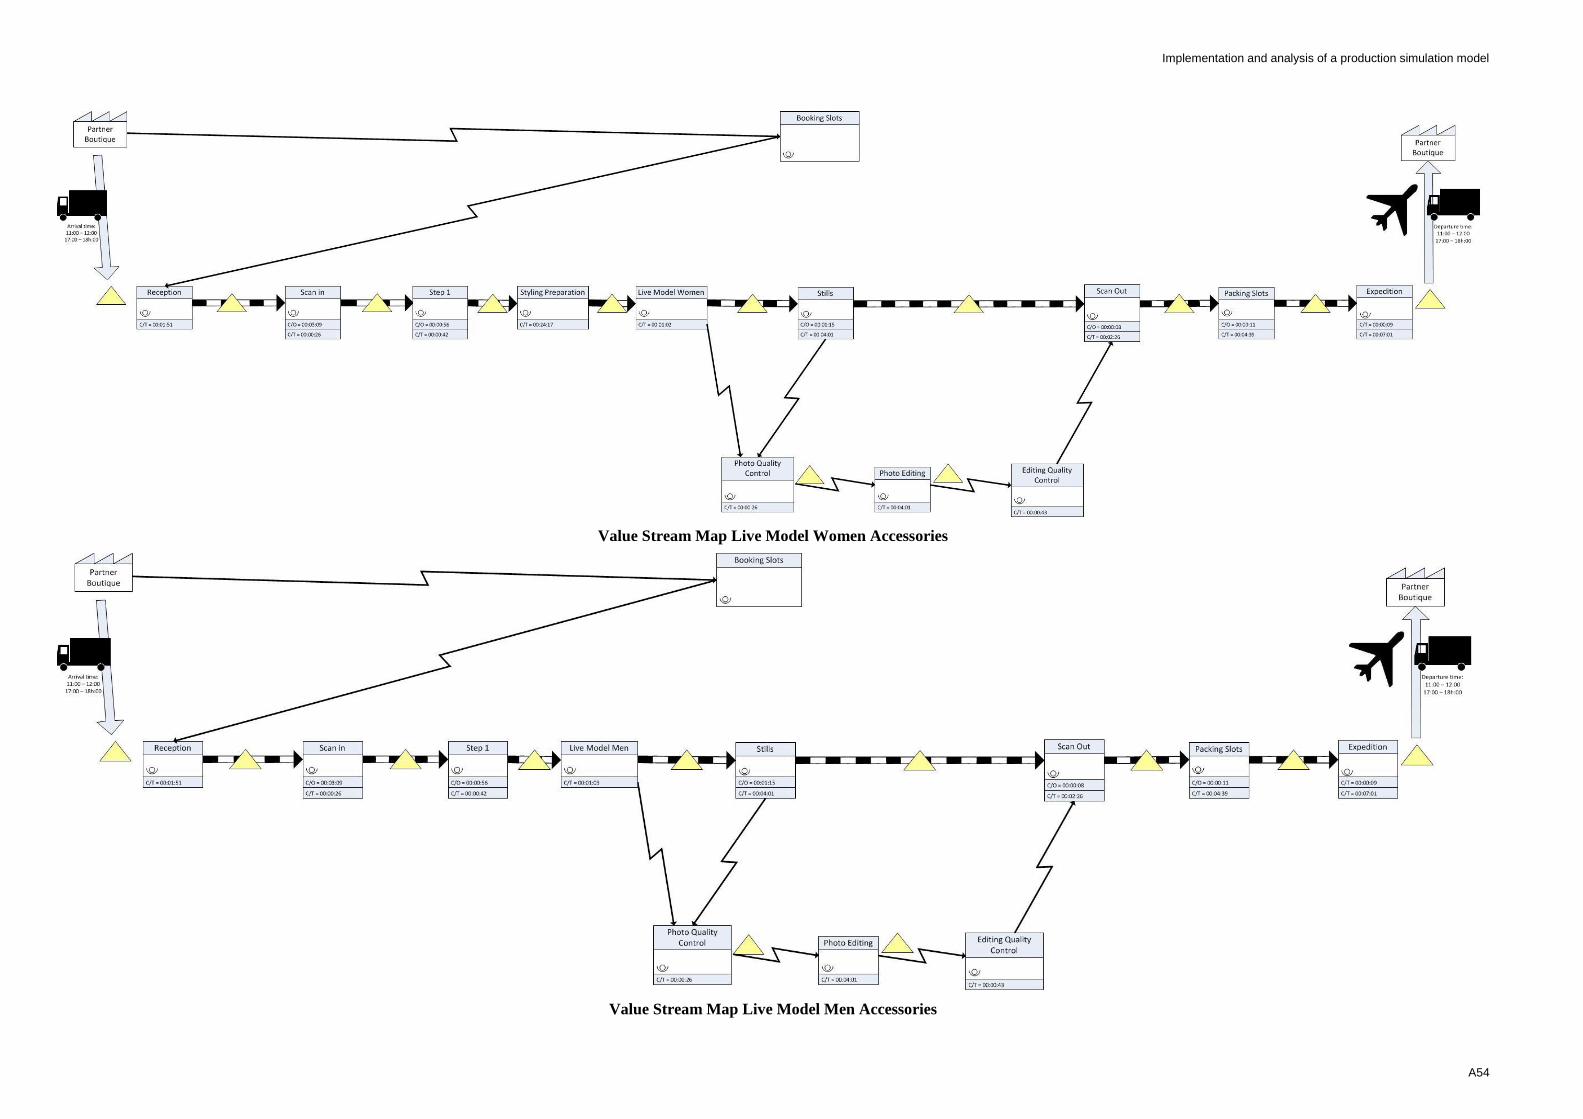
Implementation and analysis of a production simulation model
A54
Value Stream Map Live Model Women Accessories
Value Stream Map Live Model Men Accessories

Implementation and analysis of a production simulation model
A55
Value Stream Map Accessories

Implementation and analysis of a production simulation model
A56
ANNEX B: Input Analyzer Example
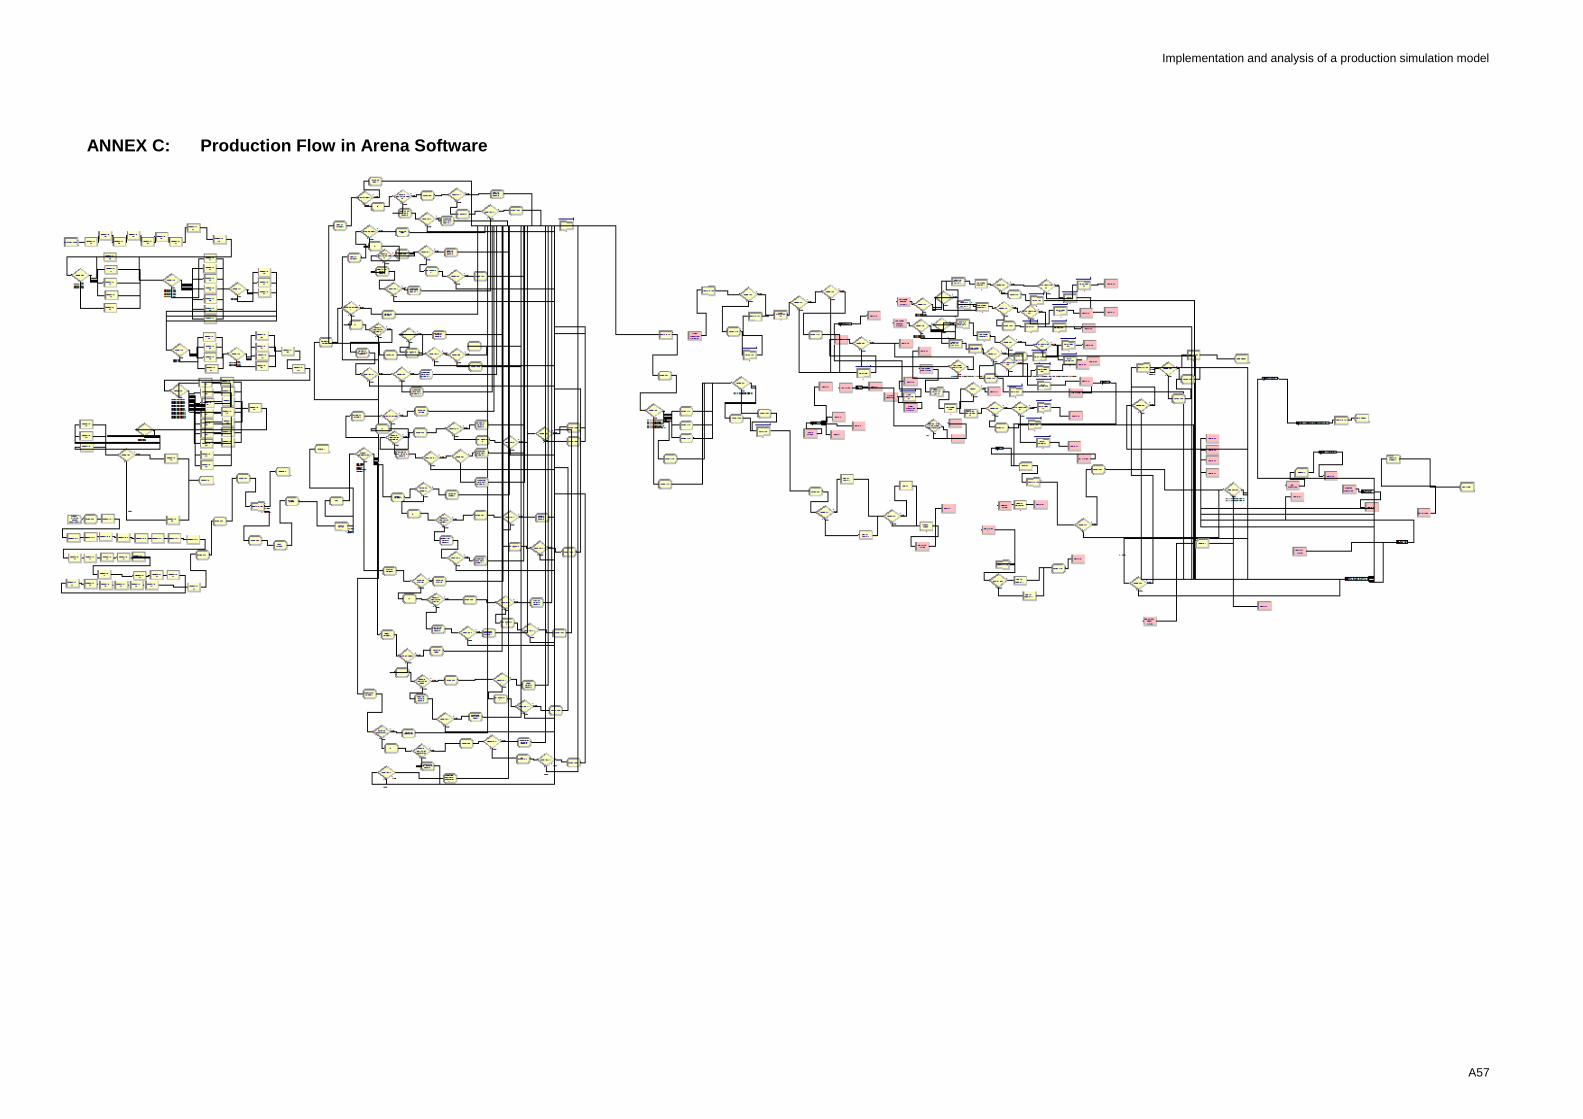
Implementation and analysis of a production simulation model
A57
ANNEX C: Production Flow in Arena Software

Implementation and analysis of a production simulation model
A58

Implementation and analysis of a production simulation model
A59
ANNEX D: User’s Manual
Production Simulator
Production Simulator User Manual
INITIAL VERSION
06/06/2014
Copyright © Farfetch
Initial Version 1.0
Date: 06/06/2014
Author: Francisca Marinho
Item/Section Production
Description Production Simulator
Table of Contents

Implementation and analysis of a production simulation model
A60
1 General Information............................................................................................................................. 4
1.1 System Overview ................................................................................................................................. 4
1.2 Manual’s Structure ............................................................................................................................... 4
2 System Summary ................................................................................................................................ 5
2.1 System Configuration ........................................................................................................................... 5
2.2 User Access Levels .............................................................................................................................. 5
3 Getting Started .................................................................................................................................... 6
4 Using the Simulator ............................................................................................................................. 7
4.1 Parameter Configuration ...................................................................................................................... 7
4.2 Shift Alterations .................................................................................................................................... 7
4.3 Replication Parameters ........................................................................................................................ 9
4.4 Run the Simulation ............................................................................................................................... 9
5 Simulation Reports ............................................................................................................................ 10
5.1 Arena Reports .................................................................................................................................... 10
5.2 Excel File ............................................................................................................................................ 10
6 STRUCTURAL MODIFICATIONS .................................................................................................... 12
6.1 Basic Blocks ....................................................................................................................................... 12
6.2 Data Treatment .................................................................................................................................. 13

Implementation and analysis of a production simulation model
A61
1 General Information
1.1 System Overview
The Production Simulator was developed for Farfetch in order to assist on the decision
making regarding both structural changes to the system and resource recruitment, by
comparing different scenarios.
The simpler alterations can be done through an Excel File; however, the most complex may
involve adjustments to the code.
All the parameters used on the model are able to be modified, in order to update the system
or to test scenarios.
1.2 Manual’s Structure
This Manual is divided in six chapters:
Chapter 1 – Contextualizes of the system, regarding its main objective and features;
Chapter 2 – Provides basic information regarding the software used and the access levels;
Chapter 3 – Explains the procedures to access the files.
Chapter 4 – Elucidates about the basic concepts regarding the use of the Simulator;
Chapter 5 – Explains the Reporting alternatives;
Chapter 6 – Provides basic concepts in order to change the current process mapping.

Implementation and analysis of a production simulation model
A62
2 System Summary
2.1 System Configuration
The Production Simulator was developed on Arena Simulation Software by Rockwell
Automation. In order to improve the user’s experience, an Excel Algorithm was developed,
through which it is possible to change the main parameters and to export the key indicators
to understand the impacts to the system.
2.2 User Access Levels
This software can be used by everyone that has an Arena Simulation Software license.

Implementation and analysis of a production simulation model
A63
3 Getting Started
In order to explore all features developed on this tool, two files should be opened:
1. Production Simulator
This file can be found at X:\Production\Simulator\ProductionSimulator.
2. Arena Parameters
This file can be found at X:\Production\Simulator\ArenaParameters.
Note: To use this program, one has to be connected to the internal network or to Farfetch’s
VPN.

Implementation and analysis of a production simulation model
A64
4 Using the Simulator
4.1 Parameter Configuration
So as to define Simulation parameters regarding:
1. Resource Capacity: the quantity of resources for each workstation.
2. Slot Quantity: in order to define the number of Slots to arrive on each day of the week.
3. Product Probabilities: for each week, is possible to outline the probability of each Category
(Women’s Clothing, Men’s Clothing, Live Model Women Accessories, Live Model Men
Accessories, Jewelry, Lifestyle and Shoes).
4. Product Transfer: one has the possibility the moment in which the products are sent from
the Photography Department to Logistics.
5. Product Arrival: it is also possible to change, for simulation purposes, the product arrival at
Farfetch.
To do this, one simple has to open “Inputs” sheet of the Excel File and insert the desired
values. An example follows.
To send the new instructions to the Simulator, one only has to press the corresponding
button.
Note: if the button is not pressed before the simulation Run, the simulator will not recognize
the changes.
4.2 Shift Alterations
The necessity to introduce shifts is not fulfilled by the previous File, so these alterations have
to be done on the Arena.
There are four kinds of shifts.
Figure 1 - Input Sheet

Implementation and analysis of a production simulation model
A65
Table 1 - Shift Information
Shift name Shift Period Break Time [15 minutes each]
Morning shift 6h - 9h 8h45
Normal shift 9h - 18h 11h and 15h45
Late Shift 18h - 22h 19h30
First Shift for Live Model 6h - 14h 8h45 and 11h
Second Shift for Live Model 14h - 22h 15h45 and 19h30
For every workstation, with the exception of Live Model Women and Men’s Teams, can be
altered from Normal Shift to a double one, called Morning with Normal Shift. As for the
mentioned stations, if two shifts per day are necessary, i.e. more than two teams are
required then the first two have to be allocated to First Shift LM and the other(s) one or two to
Second Shift LM.
To do this, the methodology is:
1. Select on the left side of the window, on Project Bar, the “Basic Process” tab.
2. Press the “Schedule” icon.
3. Choose, for each Resource the desired Shift, on column “Schedule Name” from the
dropdown list.
Figure 2 - Resource Section Selection
Figure 3 - Shift Selection

Implementation and analysis of a production simulation model
A66
4.3 Replication Parameters
To change the duration of the simulation, i.e. the time range to be evaluated, one must go to
the separator Run > Setup > Replication Parameters.
The “Replication Length” will dictate the assessment window.
4.4 Run the Simulation
Having all the parameters set, the next step is to run the model. To do this, there are two
possibilities.
1. Click on the icon ► on the tab.
Figure 5 - Simulation Run (i)
2. Go to separators Run > Go.
Figure 6 - Simulation Run
Figure 4 - Replication Length

Implementation and analysis of a production simulation model
A67
5 Simulation Reports
To evaluate the desired parameters of the simulation, there are two alternatives: (i) the Arena
Reports, for a more detailed analysis, or (ii) the Excel File, in which a personalized set of
indicators is provided.
5.1 Arena Reports
To access these reports, at the end of the simulation run, one has to choose the “Yes” Button
on the message box presented below.
All the information is available on the various separators of this report, regarding Categories,
Entities, Resources and all the data generated on the run.
5.2 Excel File
For more filtered set of information the user can access the “Output - By Process” sheet, in
which information regarding each workstation’s average Value-Added and Waiting Time and
Utilization is provided.
So as to obtain the information, one only needs to press the “Update Result” button.
In order to compare scenarios, once made the changes desired and ran the model, when
pressing the “Update Result” button the algorithm will provide the new results.
Figure 7 - Arena Report
Figure 8 - Output by Process

Implementation and analysis of a production simulation model
A68
For an overall assessment, with Production’s indicators, “Overall Analysis” sheet can be
accessed.
Figure 9 - Overall Analysis
The same logic applies to this procedure. The reset button clears all contents and the update
one provides the data produced for comparison.

Implementation and analysis of a production simulation model
A69
6 STRUCTURAL MODIFICATIONS
So as to alterations to the system can be made, this chapter will elucidate the basic concepts
of the modelling process in Arena.
6.1 Basic Blocks
On this software, the process flow is assembled through blocks, which represent different
moments of the process. The table below presents the blocks used on this model, as well as
their basic description and an application example.
Table 2 - Arena Blocks
Block name
Image Description Application
example
Create
This module is the starting point of any simulation, being responsible for creating
the entities that arrive in the system. The arrival can be either based on a
schedule or on the time between arrivals.
The creation of entities arriving in the system.
Process
This module represents the processing moments on the simulation.
The representation of every process.
Decide
This module represents the decision moments of the simulation, which can be based on one or more probabilities or on
one or more condition.
The decision based on an attribute, whether or
not the product is defective.
Assign
This module’s function is to assign different attributes, variables, entity types, entity
pictures or other system variables.
The assignment of the attribute representing
whether or not the product is defective.
Hold
This module controls the queue, holding it until a signal is given or a certain condition
is verified.
Holding the arriving products until the
arriving time.
Separate
This module is used to duplicate entities or to divide a batch previously formed.
The separation of the different product rails.
Batch
This is the module responsible for the grouping mechanism in the simulation
model.
The aggregation of the various product rails.
Route
This module is responsible for transferring an entity from a station to another or to a
defined sequence of stations.
The indication of the station to follow.
Station
This module defines a station in which a process occurs.
The representation of the station point.
ReadWrite
This module is used to import and export data from and to and external file.
The insertion on the system of the number
of arriving slots.
Dispose
This module is the ending point of the simulation.
The upload of video contents.
Submodel This resource groups a set of processes.
The set of activities that compose a station.

Implementation and analysis of a production simulation model
A70
To link the various blocks, the user must use the connector on the frame (see Figure 10).
Figure 10 - Connector
The next Figure shows an example of a simple process.
Figure 11 - Basic Process
The Create Module generates entities, the Decide Module, the elects, based on a probability
the product type, and, depending on that decision, the item is processed on Process 1 or
Process 2.
6.2 Data Treatment
When changing the system, another possibility that rises is having new processing times. To
assist on this issue, Arena provides a feature which is able to find the best representative
expression called Input Analyzer. The user only has to (1) collect the data, (2) convert it to
decimal values (in case, for example, it represents hours and minutes), (3) save the
information on a notepad file, (4) open the file on Input Analyzer and (5) press the
button to find the expression.

Implementation and analysis of a production simulation model
A71
ANNEX E: Initial Scenario Information

Implementation and analysis of a production simulation model
A72
ANNEX F: Initial Layout

Implementation and analysis of a production simulation model
A73
ANNEX G: Final Layout

Implementation and analysis of a production simulation model
A74
ANNEX H: Box and Rail Identification
Identification Sheet Generator
Box Identification
Rail Identification

Implementation and analysis of a production simulation model
A75
ANNEX I: Quality Calendar

Implementation and analysis of a production simulation model
A76
ANNEX J: Quality Report
Daily Report (i)
Daily Report (ii)

Implementation and analysis of a production simulation model
A77
Weekly Report

Implementation and analysis of a production simulation model
A78
ANNEX K: Simulation Approach to a Fashion E-commerce: a Case Study
Simulation Approach to a Fashion E-
commerce: a Case Study
Maria Francisca Marinho, Vera Miguéis, Jorge Freire de Sousa
Faculdade de Engenharia da Universidade do Porto
The use of simulation to test changes and their impacts before implementation has proven to be a very attractive and reliable methodology to optimize processes.
This paper aims to describe the development of a simulation tool to support operations planning in an e-commerce fashion company. The main objective of the simulation tool is to provide information both on the effects of structural changes in the production process and on necessary resource adjustments to face external changes.
As a result of the study, a reliable production simulator was developed. This is able to test both simple and complex changes in the production process.
Supported by the simulation tool, it was possible to eliminate three work positions and it was possible to analyze strategic changes in the processes without penalizing company’s performance indicators.
Keywords: Simulation, E-Commerce, Process Improvement, Process Modelling
1. Introduction
The ever increasing competition forces companies to find creative ways to surpass their difficulties and to get ahead. These strategies normally involve the reduction of costs or losses and, consequently, to foresee and act instead of
reacting assumes extreme importance.
Simulation is the imitation of the operation of a real-world process or system over time. Simulation involves the generation of an artificial history of the system, and the observation of that artificial history to draw inferences concerning the operating characteristics of the real system that is represented (Banks, Discrete Event Simulation 1999). Bearing this in mind, the utility of simulating an event is obvious.

Implementation and analysis of a production simulation model
A79
The exponential growth of the technological industry resulted in notorious
advances in various fields, contributing to the increase of power, accuracy, speed and easiness to use different computer software. In particular, according to Banks (Discrete Event Simulation 1999), the simulation software industry has greatly benefited from these developments. Moreover, these advances were so far that simulation is truly suitable for more than remodeling a facility, but it is nowadays incorporated into daily operations.
It is possible to enumerate a great deal of advantages coming from simulation that go far beyond simply predicting the future. Many studies, such as Banks (Discrete Event Simulation 1999), Banks & Gibson (Don't Simulate When... 10 Rules for Determining when Simulation is Not Appropriate 2007) and Centeno & Carrillo (Challenges of introducing simulation as a decision making tool 2001)
argue that simulation is a useful tool to comprehend the impact that different scenarios will have on the system without compromising human or material resources and to prepare the system for the change. Furthermore, simulation allows us to understand the reason why a phenomenon occurs, by reconstructing the scene and taking a microscopic examination of the system. This tool also enables to explore the interactions between resources, the bottlenecks, and other important variables of the process, in order to understand the performance of the overall system. Simulation is useful to explore external and internal phenomenon in order to understand them and to investigate internal changes, without disrupting the real system. Finally, simulation enables to analyze and anticipate performances, operations and hypothesis.
Concerning e-commerce, according to Wei and Lijie (2013), traditional
fashion industry has been experiencing a revolution as a result of the ever growing e-commerce strategies. The latest forecast by eMarketer (Hebbar, 2014) predicts a 20.1% increase on online worldwide sales to reach 1.5 trillion dollars in 2014, which clearly demonstrates the current relevance of the e-commerce. This fact has motivated a rapid increase in competition in this context. According to Devisch (2014), there are three key factors in order to be a successful e-commerce company: (i) free-shipping and a favorable return policy, (ii) embracing social media in order to deliver personalized customer service and (iii) partnering with a trusted e-commerce logistics company. When analyzing this new competition parameters, it is possible to conclude that the traditional indicators are no longer valid, demonstrating, once again, the fierceness of this new business.
In this context, the importance of simulation rises. The possibility of testing changes and exploring their impacts can give companies the necessary edge to be on the front line and to survive the increasingly competition.
This paper aims at describing a simulation tool, developed in e-commerce fashion context, whose objective is to provide information on the effects of structural changes in the production process as well as to provide information on the necessary arrangements to respond to external changes. Moreover, this paper aims at reporting the analysis of different simulation scenarios which

Implementation and analysis of a production simulation model
A80
involve changes in the production system, in order to meet company’s
performance targets.
The remainder of this paper is organized as follows. Section 2 presents a brief literature review on simulation. Section 3 presents the case study and the production system. Section 4 presents the methodology followed in this paper and Section 5 presents the results. The paper finishes with the conclusion.
2. Simulation in Support of Decision Making
When analyzing the typical inhibitors of changes in production systems, they are mainly related to the lack of evidence of improvements and the lack of quantitative data to assess the changes. Therefore, simulation has occupied a
prominent place in companies as a support for decision making, regardless how big or small companies are.
According to Abo-Hamad, et al. (Towards Leaner Healthcare Facility: Application of Simulation Modelling and Value Stream Mapping 2012), the lean thinking is the correct answer to the increasing demand on the healthcare system triggered by the population growth and its aging as well as the market’s expectation of high quality service. Despite all proofs given by this methodology throughout the years, the executives involved in the case study were reluctant on the implementation as there was no quantifiable evidence to support the project. Faced with this obstacle, this study proposes an approach based on lean and simulation. Three scenarios were simulated, and the results of the scenario
analysis were very effective and were well accepted by the decision makers.
Abdulmalek and Rajgopal (Analyzing the benefits of lean manufacturing and value stream mapping via simulation: A process sector case study 2007) describe a study in which the changes in a company’s traditional production system was supported by simulation. The purpose was to assess the potential benefits of the change, in an attempt to reduce or extinguish the reluctance in taking this approach. The results were very optimistic, as they were able to simulate the basic performance measures and analyze the configurations proposed which would further be used, in an initial phase, to persuade the implementation of a new system, and then to motivate the teams to obtain the predicted results.
Detty and Yingling (Quantifying benefits of conversion to lean manufacturing with discrete event simulation: a case study. 2000) also describe a simulation model used to optimize a production flow. This study assesses the utilization of simulation as a tool to quantify benefits, providing credible estimations of the achievable savings and improvements. Confirming other studies, simulation was seen as an aid in analyzing, designing and improving systems.
On the same line, Heshmat et al. (2013) also use a simulation model in order to analyze and test changes in a number of bottlenecks that were congesting a production line. The study aims to understand the ideal size of the batches so as to potentiate the production flow rate.

Implementation and analysis of a production simulation model
A81
Regarding e-commerce, the simulation has also been used to test the security
of trust models on B2B applications (Živković & Stanojević., 2006). By developing two different simulation models, this study achieves results that are used as measures to evaluate B2B structures.
This paper presents a new approach to the management of e-commerce fashion industry. In addition to providing a simulation model that reflects the company’s production process, enabling the user to have a macro view over the system, it offers the possibility of easily changing internal and external aspects of the system such that they can be analyzed based on the company’s KPIs.
3. The Production Process
On the e-commerce luxurious world, there is a company that has, over the years, registered an enormous growth and visibility: Farfetch Portugal. This company was created as a new and out-of-the-box fashion concept, which immediately positioned it at the vanguard. This concept is completely unique, when compared to the competitors, such as Net-a-Porter and Asus, as Farfetch does not buy any product and only earns commission on the products sold. Actually Farfetch only showcases and promotes the products. This business model eliminates all risks of stock accumulation.
The basic purchasing process includes 3 steps: (i) customer visits Farfetch.com; (ii) purchases a product from one of the stores included in the company’s website, which triggers an order sent to the respective store; (iii) the
store receives the order and sends the product to the customer.
The production department of Farfetch is responsible for the production of the media contents of the website: photography and videos. Figure shows an overview of its operation.
Figure 1 - Production Process
This department includes five teams:
a. Logistics - team responsible for every activity involved in the upload of information that will be displayed on the website and responsible for the unpacking and packing of the items; this team is in charge of Scan In, Duplicate Validation, Step 1 and Scan Out operations.
b. Photography - team responsible for all media content production, i.e. photography and video; this team is in charge of Live Model Women and Men, Flat and Stills operations.

Implementation and analysis of a production simulation model
A82
c. Styling - team including all people involved on styling: supermodels,
stylists and styling assistants; this team is responsible for combining items with each other, e.g. women bags and clothes.
d. Photo Edition – team responsible for the imagery treatment, i.e. the photography and video retouch.
e. Quality – team that controls photo, video and edition quality; this team also controls the existence of duplicates, i.e. identical products that come from different stores.
Products arrive at Farfetch in batches, called slots, with a maximum size of 50 units. These slots, throughout the process, are not separated and, upon the return to the stores, are grouped according to its arrival code/number.
On a low season the arrival rate is approximately 600 items per day, which represents about 13 slots; on the peak periods, it can reach 1200 items per day (around 27 slots). Farfetch is committed to return the slots in a maximum of three days.
4. Methodology
The flexibility provided by simulation increases in inverse proportion to its user-friendly features. Abu-Taieh & El Sheik (Commercial simulation packages: a comparative study 2007) compares the characteristics of the simulation software available and suggests that Arena is the most flexible. Moreover, Arena is a powerful tool for modeling complex systems. In this context, Arena was the
software used to develop this study.
Having created the model that represents the production system of the e-commerce company, another objective of the study was to create a tool that could control either the inputs or the outputs of the simulation so that, on one hand, the information could be accessible on one single source and, on the other hand, the reports could be personalized. The default reports provided by the simulation software are very extensive, composed by dozens of pages, and difficult to read due to the dispersion of the data. These factors make the reports provided by Arena not usable by decision makers. Arena’s ReadWrite Module was the basis of the developed tool.
4.1. Simulation model
Taking into account the information provided by the company’s top managers, the metrics used as inputs of each simulation replication are: (i) slot quantity, (ii) resource capacity, (iii) category arrival probabilities, (iv) moments of item transfer from photography team to logistics and (v) the arrival moments.
Furthermore, the developed simulation tool provides a Resource Quantity Suggestion Algorithm. Based on the daily production targets of each workstation, on the item arrival quantity, passed as input, and on budget limitations, the

Implementation and analysis of a production simulation model
A83
algorithm proposes a combination of resource quantities and highlights the need
for extra work shifts.
Since an item can follow different production paths, depending on its category, the estimation of the resource quantity was computed for each work operation. Live Model Women, Live Model Men, Flat and Stills operations involve a slot split and consequently the estimation of the resource quantity is different. Equation (1) and Equation (2) are used to estimate the resource quantity for the operation not involving and involving slot split respectively.
The Slot and Average Quantity parameters included in the equations are defined by the user upon the arrival of the products. Since the accurate number of items included in each slot is not known, the resource suggestion is based on 95% of the estimated quantity arrived. In Equation 2, the Maximum Arrival Probability parameter concerns the categories that are processed in each different workstation.
Regarding the extra work shifts suggestion, in line with the budget constraints, and considering the indications provided by the company’s top
managers, three rules were defined. These rules depend on the decimal resource quantity estimated using Equation (1) or Equation (2). If this decimal quantity is lower or equal to 0.1 it will not suggest any extra shift; if this is between 0.1 and 0.6 (inclusive) it suggests an extra shift; if it is higher than 0.6, it suggests another resource.
Based on this information, the user of the simulation tool has the possibility of using the suggested quantities or to change them to run the simulation model.
4.2. Performance indicators
As for the inputs, the metrics used to assess the efficiency of the production system were also designed. Firstly, in order to test the impacts on simple
alterations, which would only change a part of the flow, the indicators chosen were the average Value-Added Time per Entity, the average Wait Time per Entity and the average Utilization on each process.
To evaluate the overall behavior, the production KPIs considered were:
1. the average utilization, 2. the average number of item arrivals and sent items, 3. the average number of photo and video completely produced, i.e. after
edition and quality approval,
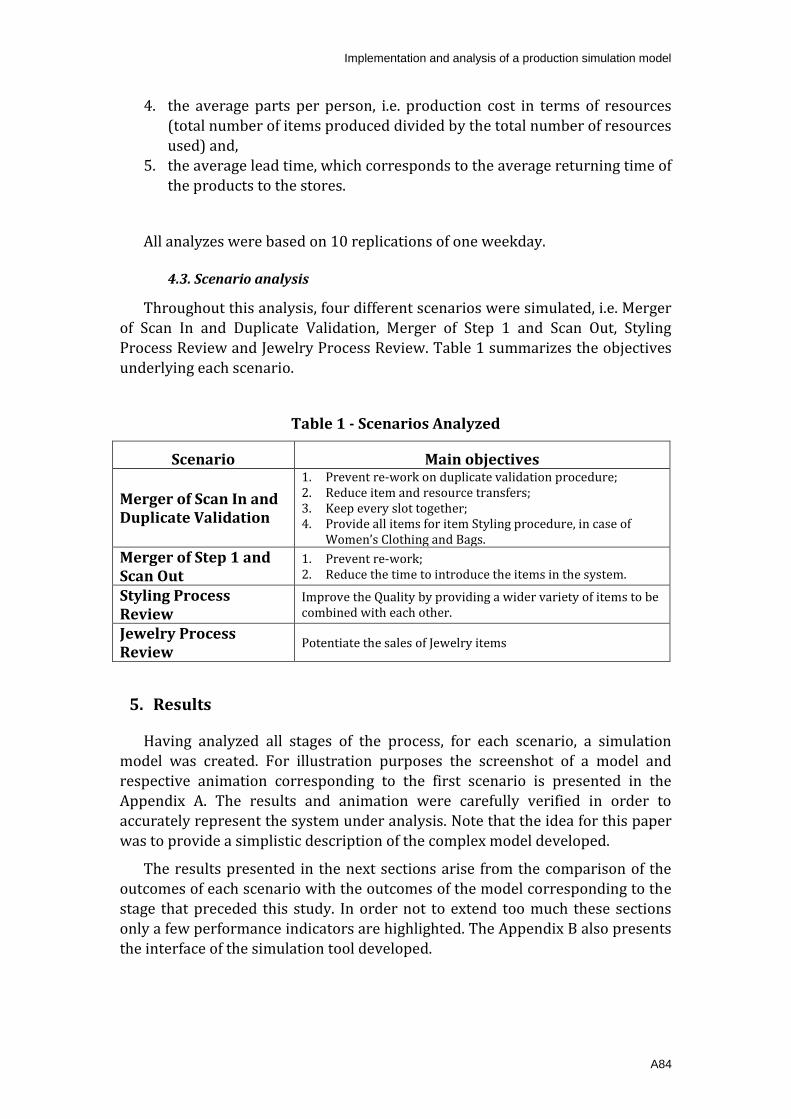
Implementation and analysis of a production simulation model
A84
4. the average parts per person, i.e. production cost in terms of resources
(total number of items produced divided by the total number of resources used) and,
5. the average lead time, which corresponds to the average returning time of the products to the stores.
All analyzes were based on 10 replications of one weekday.
4.3. Scenario analysis
Throughout this analysis, four different scenarios were simulated, i.e. Merger of Scan In and Duplicate Validation, Merger of Step 1 and Scan Out, Styling Process Review and Jewelry Process Review. Table 1 summarizes the objectives
underlying each scenario.
Table 1 - Scenarios Analyzed
Scenario Main objectives
Merger of Scan In and Duplicate Validation
1. Prevent re-work on duplicate validation procedure; 2. Reduce item and resource transfers; 3. Keep every slot together; 4. Provide all items for item Styling procedure, in case of
Women’s Clothing and Bags.
Merger of Step 1 and Scan Out
1. Prevent re-work; 2. Reduce the time to introduce the items in the system.
Styling Process Review
Improve the Quality by providing a wider variety of items to be combined with each other.
Jewelry Process Review
Potentiate the sales of Jewelry items
5. Results
Having analyzed all stages of the process, for each scenario, a simulation model was created. For illustration purposes the screenshot of a model and respective animation corresponding to the first scenario is presented in the Appendix A. The results and animation were carefully verified in order to accurately represent the system under analysis. Note that the idea for this paper
was to provide a simplistic description of the complex model developed.
The results presented in the next sections arise from the comparison of the outcomes of each scenario with the outcomes of the model corresponding to the stage that preceded this study. In order not to extend too much these sections only a few performance indicators are highlighted. The Appendix B also presents the interface of the simulation tool developed.

Implementation and analysis of a production simulation model
A85
5.1. Merger of Scan In and Duplicate Validation
In order to analyze this scenario, four hypothesis were considered. Table 2 presents a brief description of each hypothesis, their main impacts, both positive and negative.
Table 2 - Impact Summary
Hypothesis Description Positive Impacts Negative Impacts
Average Savings
Processing Time
Waiting Time
1
● Approximation of Scan In and Duplicate Validation operations; ● Decrease Scan In tasks; ● Duplicate Validation operation.
The items are withdrawn from the boxes faster; There is no re-work regarding the search for defects; The slot is not broken up; There are no transfers between stations.
The second position is overwhelmed; There is still re-work regarding the handling of the items; The tasks are not correctly balanced.
70.35% -631.13%
2
● Approximation of Scan In and Duplicate Validation operations; ● Decrease in Scan In tasks; ● Duplicate Validation operation; ● Continuous Flow production.
The items are withdrawn from the boxes faster; There is no re-work regarding the search for defects. There is no transfers between stations; The slot is not broken up; The production is continuous.
The second position is overwhelmed; There is still re-work regarding the handling of the items; The tasks are not correctly balanced.
79,50% 527,57%
3
● Approximation of Scan In and Duplicate Validation operations; ● Continuous Flow production.
There is no transfers between stations; The slot is not broken up; The production is continuous; Reduction of unitary Waiting time on both operations.
Re-work. 22,43% 59,36%
4
● Only one resource is responsible for Scan In and Duplicate Validation’s tasks.
There is no re-work; The items are available on a wider variety; The slot is not broken up; There are no transfers between stations.
Slight increase in unitary Processing and Waiting time.
-10,07% -57,27%

Implementation and analysis of a production simulation model
A86
Table 2 shows that the best hypothesis is the third, as it corresponds to
significant decreases both on processing and waiting times. However, it still presents re-work, which is an aspect that is supposed to be eliminated with the alterations.
For that reason, instead of choosing hypothesis 3, the hypothesis chosen was the hypothesis 4. Since the number of tasks increased in comparison to the hypothesis 3, there is a slight increase in the above mentioned average times. However, this increase was disregarded, as this hypothesis fulfills all the established requirements.
5.2. Merger of Step 1 and Scan Out
Step 1 operation and Scan Out operation consist of categorizing the items on
the platform. This means that a worker has to access the website and insert information about the item on Step 1 and then again, on Scan Out. The only difference between these two is that the information is introduced in different tabs.
By merging Step 1 and Scan Out operations, items were available for styling and photography processes sooner. This resulted in a slight increase in the waiting times observed in the majority of the workstations. This is also responsible for the increase of the average utilization percentage, which means that the resource’s overall idle time was reduced (about 2%).
Again, the processing time in every workstation, excluding Scan Out operation in which was registered a 34% increase, did not change.
5.3. Styling Process Review
In the long term, the objective of the company is to be able to combine all items with each other, e.g. jeans from one store with a shirt from another store, with no limitations. This possibility has to be negotiated with the stores and, for that reason, is yet not possible. However, during the development of this project, it became relevant to test the combination between all the bags with all the items. Therefore, new processes had to be analyzed. This involved the simulation of several hypotheses in order to support the decision making.
5.3.1. Hypothesis 1
This hypothesis is considered very flexible in the sense that the slots could be
opened at Scan In and the stylists, on Styling Preparation, could use those bags as they wished.
Under these circumstances, the impact of this hypothesis was evaluated on the overall system, as it was crucial to, first of all, understand if this would increase the average Lead Time.

Implementation and analysis of a production simulation model
A87
Table 3 - Styling Alterations Hypothesis 1
Initial situation Hypothesis 1
Parts Per Person 244 198
Lead Time (days) 2,69 3,78
As previously referred, Farfetch has compromised in returning the products to the stores in a 3 day period.
Table 3 shows that this hypothesis would result in an increase of the Lead Time in one day and, consequently in penalty costs for the company.
5.3.2. Hypothesis 2
As the photo quality control is conducted when the items of one slot are ready for that operation, i.e. when all items are photographed, a delay on one single bag can have a great impact on the Lead Time of the slot. For this reason, this scenario consists of combining Hypothesis 1 with a new rule for quality
control: the photo quality control would be conducted by category and gender (e.g. Clothing Women, Bags Men).
Table 4- Styling Alterations Hypothesis 2
Initial situation New Scenario
Parts Per Person 244 298
Lead Time (days) 2,69 2,54
Table 4 shows that Hypothesis 2 does not promote an increase on the Lead Time when comparing with the initial situation. However, it contributes to a slight increase on the number of parts per person. This means that, in fact, the bottleneck of the production system was the operation of grouping the items, before the quality control.
Having developed this analysis, the decision was to, when possible, alter the styling process accordingly. However, it is important to highlight that, in peak periods, it will be important to be careful with the number of bags that are
opened first so that the time to complete the processing of the whole slot will not increase.
5.4. Jewelry Review
So as to potentiate the sales of jewelry items, the company decided to start shooting the items on a supermodel. Evidently, this required a change in the process, as the items would now pass through one more studio (Live Model Women) and this extra photo would have a significant impact on the photo edition process.

Implementation and analysis of a production simulation model
A88
It is important to refer that the proportion of jewelry arriving at Farfetch is
rather low (around 6% of the total number of items received) so, for the analysis of the consequences of this change, three scenarios were evaluated: (i) current arrival probability, (ii) 30% increase on the arrival probability and (iii) 50% increase on the arrival probability.
Note that this alteration already covers the new quality control rule.
Table 5 - Jewelry Process Alteration
Initial situation
30% Increase
50% Increase
Parts Per Person 230 220 215
Lead Time (days) 2,76 3,23 3,47
From the analysis of Table 5 it is possible to conclude that, in the worst case, this being the 50% increase, the cost of the products would increase about 7% (parts per person).
6. Conclusions
The objective of this project was to develop a reliable production simulator, able to test both simple and complex changes. Additionally, it intended to create a user friendly platform, in which the user could modify the desired parameters
and import the main results, such as the department’s key performance indicators. These objectives were achieved with success.
Moreover, from the scenario analysis conducted, it was possible to save capital for further investment, since three positions were eliminated. Moreover,
the process of styling and the overall process of jewelry were analyzed in order to improve the quality of imagery considering company’s strategic decisions at lower cost. In order to potentiate the sales of jewelry, another change in the production process was addressed.
7. References
Abdulmalek, F. A. & Rajgopal, J., 2007. Analyzing the benefits of lean
manufacturing and value stream mapping via simulation: A process sector case
study. International Journal of Production Economics, 107(1), pp. 223-226.
Abo-Hamad, W., Arisha, A. & Crowe, J., 2012. Towards Leaner Healthcare Facility:
Application of Simulation Modelling and Value Stream Mapping. Vienna, Austria,
Dublin Institute of Technology.
Abu-Taieh, E. M. & El Sheik, A., 2007. Commercial simulation packages: a
comparative study. International Journal of Simulation, 8(2), pp. 66-76.

Implementation and analysis of a production simulation model
A89
Banks, J., 1999. Discrete Event Simulation. Piscataway, NJ; New York, N.Y.; San
Diego, CA, IEEE ; Association for Computing Machinery ; Society for Computer
Simulation International, pp. 72-80.
Banks, J. & Gibson, R. R., 2007. Don't Simulate When... 10 Rules for Determining
when Simulation is Not Appropriate. Automation Associates, Inc., 29(9), pp. 30-32.
Centeno, M. A. & Carrillo, M., 2001. Challenges of introducing simulation as a
decision making tool. Arlington, VA, IEEE, pp. 17-21.
Detty, R. B. & Yingling, C., 2000. Quantifying benefits of conversion to lean
manufacturing with discrete event simulation: a case study.. International Journal of
Production Research, 38(2), pp. 429-455.
Devisch, N., 2014. Key factors for e-commerce growth in the fashion industry.
[Online]
Available at: http://www.wemoveyourideas.com/en/2014/02/key-factors-for-e-
commerce-growth-in-the-fashion-industry/
Hebbar, S., 2014. Retail Costumer Experience. [Online]
Available at: http://www.retailcustomerexperience.com/articles/global-e-
commerce-sales-to-hit-15-trillion-driven-by-growth-in-emerging-markets/
[Accessed May 2014].
Heshmat, M., El-Sharief, M. A. & G., E.-S. M., 2013. Simulation Modelling of
Production Lines: a Case Study of Cement Production Line. Journal of Engineering
Sciences, 41(3), pp. 1045-1053.
Wei, Z. & Lijie, Z., 2013. E-Commerce Case Study of Fast Fashion Industry.
Wuhan, China, Springer Berlin Heidelberg, pp. 261-270.
Živković, Z. V. & Stanojević., M. J., 2006. Simulation analysis of protected B2B e-
commerce processes. Computer Science and Information Systems/ComSIS 3, 3(1),
pp. 77-91.

Implementation and analysis of a production simulation model
A90
Appendix A
Figure A1 - Arena Production Flow (i)
(For layout reasons, the flowchart was divided in two parts, the second being available in the next page.)

Implementation and analysis of a production simulation model
A91
Figure A2 - Arena Production Flow (ii)
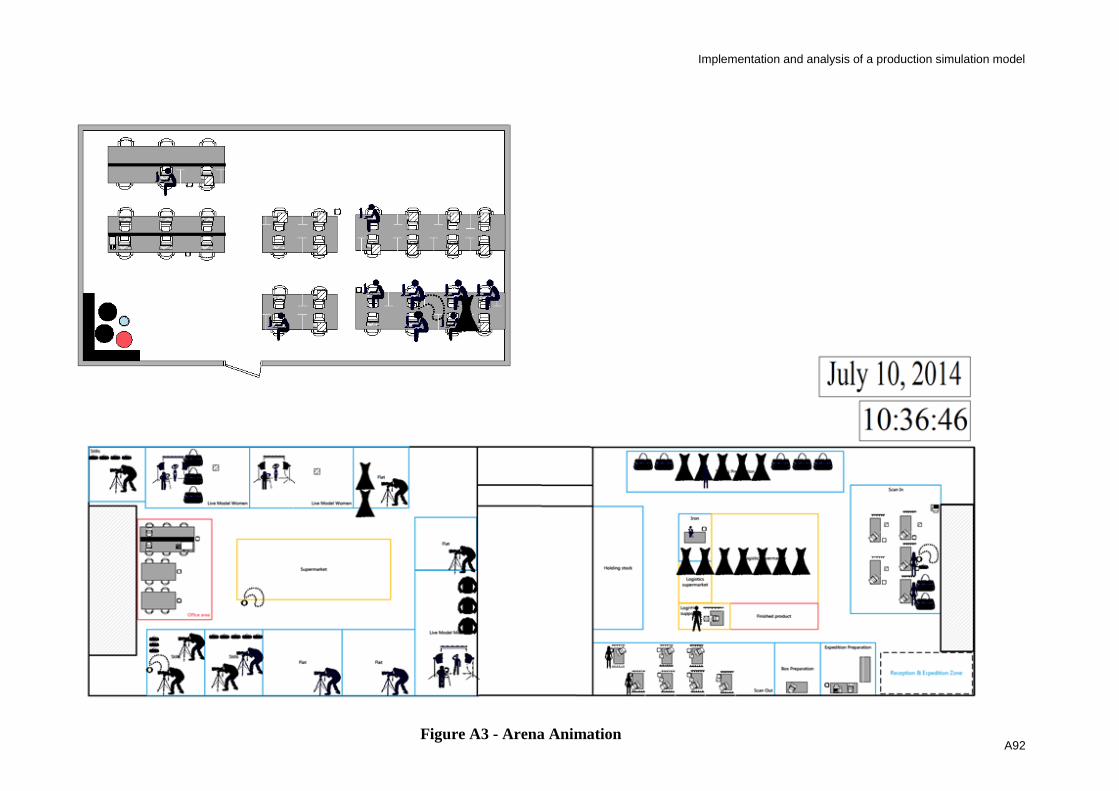
Implementation and analysis of a production simulation model
A92
Figure A3 - Arena Animation

Implementation and analysis of a production simulation model
A93
Appendix B
Figure A4 - Input Sheet
Figure A5 - Output By Process Sheet

Implementation and analysis of a production simulation model
A94
Figure A6 - Overall Analysis Sheet