Embed Size (px)
Citation preview
846
Bulgarian Journal of Agricultural Science, 27 (No 5) 2021, 846–858
Production, employment and productivity of agricultural sector in the European UnionSilvia Megyesiova
University of Economics, Bratislava, Faculty of Business Economics with Seat in Košice, Tajovského 13, 04130 Kosice, SlovakiaE-mail: [email protected]
Abstract
Megyesiova, S. (2021). Production, employment and productivity of agricultural sector in the European Union. Bulg. J. Agric. Sci., 27 (5), 846–858
Gross value added, employment and productivity are important criteria of economic development. These indicators were monitored separately for the entire economy of the EU countries and for the NACE section A: Agriculture, forestry and fishing. In 2000 Bulgaria and Romania were the most agrarian countries among EU Members, the contribution of section A in both countries was higher than 12% compared with only 0.7% in Luxembourg. The smallest contribution was typical for the most developed EU countries. The proportion of employment in agricultural sector was in Romania as high as 44.9% in 2000. The high gap between the shares of employment and contribution of section A resulted in an extremely low productivity in section A. The lowest productivity in agricultural sector in 2000 was achieved in Romania. Increase of the production and a decrease of the employment in agricultural sector led to a very high increase of labour productivity (LP) especially in the new EU coun-tries. Real LP in section A increased in Slovakia between 2000 and 2019 by 748.3%, in Romania by 271%, Latvia by 249.4%. Low productivity in section A in the new EU countries in year 2000 was combined with a very strong real growth of the LP between 2000 and 2019. This resulted into sigma convergence of the LP. Coefficient of variation, the sigma convergence co-efficient, decreased in the analysed time span from 62.3% to 53.1% in case of the overall LP and from 79.1% to 64.5% in case of the LP in agricultural sector. The LP in section A is still lower compared with the LP total, but the trend of the development is positive. In 2000 the LP in section A accounted for only 24% of the total LP but this proportion increased gradually to 38 % in 2019. Positive changes in agricultural sector can make it more attractive to investors, employees, self-employed persons and so to increase the living standard of population, especially in the rural area.
Keywords: productivity; NACE section A; agricultural sector; gross value added; employment; European Union
Introduction
Economic growth, productivity and the real change of productivity are very often used criteria for international comparison of economic development and living standard. Productivity is considered as a drive force of economic growth, competitiveness, and countries´ performance (Gor-don et al., 2015; OECD, 2019). An increase of living stan-dard in a country over time depends on ability to raise the country´s output per worker, it means to raise the productiv-
ity (Krugman, 1994). Productivity is defined as a ratio of a volume measure of output to a volume measure of input used (OECD, 2019). Productivity growth is positively corelated with growth of standard of living and with a positive change in labour compensation (Baldwin et al., 2014). The real change of productivity indicators can denote the position of a country in the business cycle and to forecast the economic growth. A deeper analysis of productivity is needed to dis-cover the differences of productivity by industries, branches or by regions (Melchor-Ferrer, 2020). Convergence of so-

847Production, employment and productivity of agricultural sector in the European Union
cio-economic indicators including productivity is one of the main aims of countries that belong to a form of intergov-ernmental union. A detailed breakdown of production and employment is possible due to the NACE classifications of productive economic activities that were in the EU devel-oped since 1970.
The structure of NACE is described in four levels, the first level consists the headings identified by an alphabetical code – section. NACE Section A refers to Agriculture, forest-ry and fishing (hereinafter referred as “agricultural sector”, “agricultural industry” or “section A”) (Eurostat, 2008). The Section A is about farming, delivering primary agricultural products and services, about providing key primary ingre-dients for the food we eat and much of what we drink, it is about production of wood, protection of the water quality, preventing soil erosion, aquaculture farming with the aim of an environmentally, economically, and socially sustain-able use of the resources (Eurostat, 2018). Agriculture plays a very import role in worldwide nutrition and food securi-ty. Europe is an important region for agricultural industry thanks to its variety for natural resources and land conditions (Statista, n.d.). Thanks productivity growth in agriculture the food has become less scarce and hence cheaper in the 20th Century (European Commission, 2016) but still 800 million people suffer from hunger across many countries and there-fore to improve nutrition quantitatively and qualitatively is a goal for agricultural sector, for agricultural and trade policies as well (EESC, 2015).
The agricultural sector in the EU is a leader in food pro-duction, is a guarantor of food security and quality and op-erates under Common Agricultural Policy (FAO, 2020). The Common Agricultural Policy helps in the EU to development a sustainable, profitable, competitive sector of the economy (Guth et al., 2020). European agriculture faces a major chal-lenge in improving standard of living through productivity growth in rural areas (Baráth & Fertő, 2016) and it is import-ant to support agricultural production, agricultural output and create fair business opportunities and suitable business environment (Belas et al., 2020). Agriculture has played an important, indispensable role in every stage of humanity.
The main purpose of the article is a detailed analysis of state and development of the gross valued added, employ-ment and productivity in the EU economies from 2000 till 2019. This time span allows to analyse the development and most important changes of the selected indicators in the EU countries. Data for 28 EU countries were collected from the Eurostat Database (Eurostat, n.d.). As the main goal of the article was to follow the changes of selected variables in the EU countries a longer time span was needed. This long-time span was chosen especially for evaluation of changes in con-
tribution of the agricultural sector and for the evaluation of productivity development in the agricultural industry. There-fore, the analysis began in 2000 when the EU consisted of 15 so called “old” Member States and the negotiations about the entry of other European countries were already started.
In 2004 altogether 10 new countries, mostly former com-munist countries, joined the EU, in 2007 two countries and in 2013 one country enlarged the EU. Although the United Kingdom leaved the EU on 31st January 2020, this country was included in the analysis since during the analysed time span the UK was a Member of the EU. The chosen very long-time span can answer a very interesting question about the dynamics of changes of the so called “new” EU economies and the older EU Members. The dynamics of changes were followed in terms of real production growth rates, employ-ment changes, and productivity development in the entire economy and especially in the NACE section A. The paper answers also an interesting view of the positions and also associations of the EU Members in terms of living standard measured by GDP per capita and contribution and impor-tance of the agricultural sector in the EU economies.
Materials and Methods
The development and status of the NACE section A in the EU was confronted with the overall condition of the economy and economic changes of the EU Member States. For analytical purposes, the gross value added (GVA), total employment, labour productivity indicators were selected on the country level, EU-28 average level, both for the entire economy and for the agricultural sector.
Gross value added gives a picture of the status of eco-nomic activity, it measures the contribution of individual producers, industry or sector and is used to calculate the well-known gross domestic product (GDP) (O´Connor, 2018). GVA represents the total value of all goods and ser-vices produced minus the intermediate consumption. The GDP is a measure of overall size of the economy and it is the sum of GVA over all industries or sectors plus taxes on products minus subsidies on products. For analysis of sec-toral contribution is therefore the gross value added more suitable. The source for calculation of the GVA is the Na-tional accounts. Annual national accounts refer to the whole economy, but breakdowns by sectors are provided by sector accounts (Eurostat, n.d.). As the GVA can be broken down by industry and institutional sector it is the best economic indicator to identify the importance of each sector of the en-tire economy.
Employment is a socio-economic indicator that deter-mines wellbeing and social inclusion. Employment covers

848 Silvia Megyesiova
persons engaged in some productive activity within the pro-duction boundary of the national accounts. Employed per-sons are either employees or self-employed. Similarly, to the indicator of GVA also in case of the total employment a breakdown by industry is possible (Eurostat, n.d.). This fact was used to follow not only the overall GVA and employ-ment status and their changes but also to follow the state and changes of the selected indicators in NACE section A.
As it was mention above to productivity is a ratio of an output volume to an input volume used. In the paper the pro-ductivity was calculated as ratio of the GVA to persons em-ployed. This productivity is known as apparent labour pro-ductivity (LP). Apparent LP takes account of only one factor, labour. The term “apparent” recalls the fact that the produc-tivity depends on all the production factors and on the way in which they are combined (Insee, n.d.). For calculation of the apparent LP productivity the following formula was used:
(1)
(2)
Fixed-base index of the variables was conducted that allowed to discover the cumulative change of the variables over a broad time span from 2000 till 2019. The fixed-base indexes of GVA and labour productivity were calculated in real terms.
The contribution of the NACE section A to the produc-tion of the entire economy was measured in current prices by following ratio:
(3)
The fraction of the employment in agricultural sector to the total employment was calculated as follows:
(4)
Both ratios (3) and (4) are important for discovering the importance of agricultural sector in the EU countries.
For analysis of a solo indicator the univariate statistical approach was chosen (Loveday, 2016). A variable was char-acterized by its average level, minimum, maximum, stan-dard deviation, median, range. Since range is not suitable for comparison of changes in variability over time or between variables also a relative measure of variability, the coeffi-cient of variation, was examined. The coefficient of variation (CV) is also a measure of the so-called sigma convergence (Das, 2016) that is often used to measure the convergence
process of selected socio-economic indicators on country or on the regional levels (Janssen et al., 2016). The coefficient of variation is defined as the ratio of standard deviation to the mean and is usually expressed in percentage:
(5)
The CV was used as a measure of sigma convergence of the overall labour productivity and in the NACE section A.
The association between a pair of selected variables was measured by Pearson´s correlation coefficient (rxy):
(6)
wheresx – standard deviation of variable X,sy – standard deviation of variable Y,sxy – covariance of variables X and Y.
The correlation coefficient quantifies the strength and direction of the linear relationship of two discrete or contin-uous variables.
Results and Discussion
The importance of NACE section A in the EU Member States was measured by contribution of agricultural sector to the total GVA and by the proportion of employment in sec-tion A to the total employment. Then the real rate of change of GVA, employment or labour productivity was conduct-ed with the aim to follow the changes of selected indicators over time.
Gross value added and employment – total and in NACE section A
The contribution of agriculture in gross value added in the EU ranged from 0.7% to 12.5% in 2000. In 2019 the min-imum proportion was as low as 0.2% and the maximum only 4.5% (Figure 1). Agriculture at the end of analysed time span belonged to proportionally smaller industries. The countries where the agriculture has only a very low impact on GVA are the most developed countries, the countries with a very high living standard.
Two new Member States, namely Romania and Bulgaria, were in 2000 the most agrarian oriented economies since the weight of section A on the total GVA was in both countries higher than 12%. The proportion in both countries signifi-cantly decreased till 2019. Similar is the result of shares to GDP (Mihailova, 2020). The weight of agricultural sector has shrunk by 8.8 percentage points (p.p.) in Bulgaria and

849Production, employment and productivity of agricultural sector in the European Union
by 7.5 p.p. in Romania (from 12.0% to 4.5%). In 2019 the agricultural sector played only a little role in Luxembourg, Belgium, United Kingdom, Germany, and Malta where the proportion of GVA of agricultural production to total GVA was lower than one percent. The agriculture´s weight in EU economies decreased between 2000 and 2019 with only one exception. In the analysed time span solely in Slovakia the contribution of section A to GVA increased from 1.9% to 2.8% (Figure 1).
Between 2000 and 2019 the total employment increased from 214.9 million to 241.5 million (12.4%) in the EU-28. But the employment in the agricultural sector changed neg-atively. The employment in section A degreased from 16.5 mill. to 9.9 mill., which resulted in a strong relative drop of employment in NACE section A by about 40%. The total employment reached its highest increases in Luxembourg (76.1%), Malta (70 %) and Cyprus (38.8%) and declined altogether in 5 EU countries: Greece, Lithuania, Portugal, Latvia and Romania. On the other hand, a drop of employ-ment in the agricultural sector was a reality in 26 EU Mem-ber States, with the highest decrease in Lithuania (66%), Romania (61%) and Croatia (55.4%). The negative change of employment in NACE section A section was significant especially in the new EU Member States.
The share of employment in agricultural sector to the total employment was also considered when assessing the importance of agricultural sector for the European coun-tries. The proportion ranged from 1.4% to nearly 45% in 2000 (Figure 2). The largest share was achieved in Romania where 44.9% of employed persons were active in section A.
Such an extremely high proportion is typical for less devel-oped countries. Very high was also the proportion in Bulgar-ia (24.1%), Poland (20.2%), Lithuania (18.6%) and Greece (16%). From these percentages it is clear that the agricultural sector in 2000 was very important for the employment es-pecially in the “new” EU Member States and also Greece. From 2000 till 2019 the employment in section A expressed as the proportion of total employment degreased in every EU country. The highest decline of the employment share in sec-tion A was reached in Romania (by 23.1 p.p.), followed by Lithuania (12.2 p.p.) and Poland (11 p.p.). Similarly, to the contribution of agricultural sector to the total GVA, also in case of proportion of employment in section A to the total employment, the lowest shares were achieved in most de-veloped countries. In 2019 only 0.8% of employed persons were active in agriculture in Luxembourg, 1.1% in United Kingdom and Belgium and 1.3% in Germany. It is in con-trast with Romania where in 2019 the share was higher than 21% and Bulgaria with proportion that attacks 17% (Figure 2).
The relationship between the contribution of section A to total GVA and between the share of employment in section A in total employment was examined with the aim to discover whether there exists any association or gap between both pro-portions (Figure 3). According to the average values of both variables especially for the less developed countries the gap is very high. This high gap will lead to a much lower pro-ductivity in agricultural sector compared with countries with only a small difference between the two selected variables. In Romania, the average rate of employment (for the time span
Fig. 1. Contribution of NACE section A to total gross value added in EU countries (in %,
current prices). Source: Own calculations based on Eurostat database. Country codes: BE – Belgium, BG – Bulgaria, CZ – Czech Republic, DK – Denmark, DE – Germany, EE – Estonia, IE – Ireland, EL – Greece, ES – Spain, FR – France, HR – Croatia, IT –
Italy, CY – Cyprus, LV – Latvia, LT – Lithuania, LU – Luxembourg, HU – Hungary, MT – Malta, NL – the
Netherlands, AT – Austria, PL – Po-land, PT – Portugal, RO – Romania,
SI – Slovenia, SK – Slovakia, FI – Finland, SE – Sweden, UK – the
United Kingdom

850 Silvia Megyesiova
from 2000 until 2019) in section A was very high (31.3%) but the contribution of these agricultural sector was only 7.9% which leads to a gap of 23.4 p.p. Very high was the difference between the shares also in Bulgaria where the employment in section A was as high as 20.2% but the contribution of the
same section to the total GVA only 6.8%, so the gap reached 13.4 p.p. In Poland, the gap was higher than 11 %. On the oth-er hand, a low gap, lower than 1 p.p., was reached in countries with a very low share of employment in agricultural sector which was associated with a very low contribution of section
Fig. 2. Employment in section A in EU countries
(% of total employment) Source: Own calculations based on
Eurostat database
Fig. 3. Association between the contribution of section A and share of employment in section A (averages for time span from 2000 to 2019)
Source: Own calculations based on Eurostat database. Note: the red point and lines represent the EU-28 averages

851Production, employment and productivity of agricultural sector in the European Union
A to total GVA, namely in Luxembourg, Germany, Belgium, UK, Sweden, Netherland, Malta. In Figure 3 the centre point represents the EU-28 average values of both variables and the countries with a minimal gap are positioned in the lower-left quadrant. The countries with a higher difference between both proportions are positioned in the upper-right quadrant. From this chart it is also clear in which countries have the section A significant impact in terms of employment and contribution to GVA. In Figure 3 two extreme values were discovered for Ro-mania and Bulgaria. The correlation between the variables is positive, very high and as expected it is statistically significant (rxy = 0.874, p < 0.0001).
The real rate of change of the GVA total and GVA in sec-tion A in 2019 compared with the base year 2000 was cor-related only very weakly and the correlation coefficient was not statistically significant (rxy = 0.372, p = 0.056). The low dependence between these two variables is visible in Fig-ure 4. The GVA changed between 2000 and 2019 in each EU country positively. The most problematic countries of the EU that were hit by the economic and financial crisis very hardly reached a very low real increase of the total GVA. In Greece, the growth was as low as 1.4%, in Italy 5.1% and Portugal 15.2%. On contrary in some countries the real GVA jumped by more than 100 %. This high growth was with only one exemption achieved in the new EU countries: Poland (101.9%), Slovakia (107.2%), Romania (110.8%), Lithuania (111.8%) and Ireland (126.3%).
The real change of the GVA in agricultural sector had a diametrically different development. I comparison with only positive real growth rates of the total GVA, unfortunately in 8 EU countries the GVA in section A degreased. The high-est drop of the real GVA in section A was achieved in Lux-embourg (67.6%), followed by Belgium (33.2%), Cyprus (25.6%), Croatia (16.3%), Bulgaria (13.6%), Italy (4.8%), Denmark (3.2%) and Greece (2.8%). Further comparison is also not in favour of the real change of GVA in agricultural sector. As it was mentioned before, in five countries the total GVA increased by more than 100% but in case of the real change of GVA in section A only one country exceeded the threshold of 100%, namely Slovakia.
In Slovakia, the real rate of change of GVA in section A was extremely high (394.2%) and therefore is not presented in the Figure 4. Most of the new Member States can be found in the upper-right quadrant compared with the centre point of EU-28 (Figure 4). It is a positive signal for these less devel-oped countries due to the fact, that they reached high growth rates of both variables. This creates the opportunity of con-vergence for less developed countries in terms of gross value added in agricultural sector and also in terms or the gross value added produced in the entire economy.
Not only the changes of the GVA but also the dynamics of employment is significant for economic growth and wellbe-ing. The total employment and the employment in agricultural sector changed differently. The most EU countries faced be-
Fig. 4. Real rate of change of GVA total and GVA in section A, in % (2019/2000)Source: Own calculations based on Eurostat database Note: Malta – missing data; Slovakia – the extreme value 394.2 % of real growth
rate for agricultural sector is not presented in the figure

852 Silvia Megyesiova
tween 2000 and 2019 a positive growth of total employment. The employment in section A unfortunately changed mostly negatively. The correlation between these both variables was stronger and significant (rxy = 0.654, p = 0.0002) than the correlation between the cumulative change of GVA total and GVA in section A. The stronger association between the se-lected employment variables is visible also in the Figure 5.
A decrease of total employment in the analysed time span was reached in 5 EU Member States but the employment in section A dropped altogether in 26 EU countries. This com-parison indicates a relocation of the workforce from agricul-tural sector to other sections of the EU economies or in some cases the workforce from agricultural labour force could be-come unemployed. While the highest increases of the total employment were 70% in Malta and 76.1% in Luxembourg, the increases of employment in section A were only 5.7% in UK and 18.4% in Malta. On the other hand, the decrease of the employment in agricultural sector was higher than 50% in Lithuania, Romania, Croatia, Latvia. So, the strongest de-crease of employment in section A was typical for the new EU Member States where the agricultural sector played a significant role in the economy at the beginning of the anal-ysed time span (Figures 1 and 2).
Association between GDP per capita and contribution of the agricultural sector
Interesting is the evaluation of the relationship between GDP per capita (in PPP), as a measure of living standard and
wellbeing, and the contribution of agricultural sector to total GVA or between GDP per capita and proportion of employ-ment in section A to the total employment.
The Figure 6 presents the relationship between the GDP per capita and the contribution of agricultural sector to the total GVA. The dependence of selected variables is negative, the correlation coefficient is high and statistically significant (rxy = -0.715, p < 0.0001). It means that in countries with a high GDP per capita the section A plays only a minimal role. These countries are located in the upper-left quadrant compared with the centre point (EU-28). For example, in Luxembourg where the GDP per capita reached the highest level, the contribution of section A to total GVA was only 0.4%. Most of the new EU Member States are located in the lower right quadrant. It is visible that the countries with the highest contribution of section A to total GVA (Romania, Bulgaria) belong to the countries with the lowest levels of GDP per capita, it means they belong to the poorest coun-tries of the EU. Also, other new EU countries are located in this fourth quadrant, namely Croatia, Hungary, Latvia, Lith-uania, Estonia, Poland Cyprus, Slovenia, Czechia, Slovakia. From the older EU Member States only Greece, Portugal and Spain were in this fourth quadrant. In these countries the agricultural sector plays an important role, and these EU Members belong to the poorer countries compared with the EU-28 average.
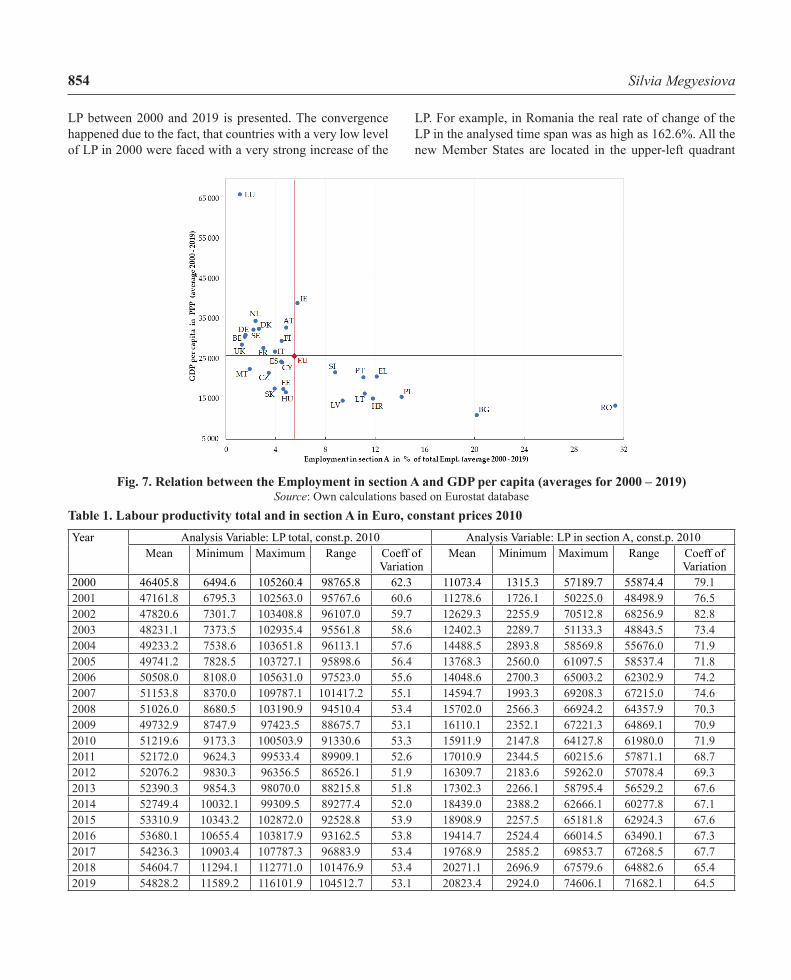
Similar is the situation when the analysis of relationship between the GDP per capita and the employment share in
Fig. 5. Rate of change of Employment total and Employment in section A, in % (2019/2000)Source: Own calculations based on Eurostat database

853Production, employment and productivity of agricultural sector in the European Union
section A is performed. The correlation coefficient is again negative and significant (rxy = -0.56, p = 0.002). The rela-tionship is only moderate, but still can be visible from the presented data in Figure 7 that the countries with a very high proportion of employment in section A belong to the countries with a lower GDP per capita. Romania and Bul-garia are the leaders with the highest employment shares in section A and also both countries belong to the countries with the lowest levels of GDP per capita. In the lower right quadrant again mostly the new EU countries are located: Romania, Bulgaria, Poland, Croatian, Latvia, Lithuania, Slovenia and from the older countries only Greece and Portugal are settled in this fourth quadrant. Unfortunately, in countries with a high share of employment in section A a lower level of GDP per capita can be expected. For the countries located in the top left quadrant is typical a high living standard measured by GDP per capita. In this quad-rant the high GDP per capita levels are combined with a very low proportion of employment in agricultural sector. Some countries are located also in the lower left quadrant where with only one exemption (Spain) these countries be-long to the new Member States. These countries reached lower levels of GDP per capita with a combination of low-er employment rates in agricultural sector of the economy. Both relations examined in Figures 6 and 7 have discovered that agricultural sector plays a significant role in the econ-omies with lower living standard.
Apparent labour productivity – total and in NACE sec-tion A
The increase or decrease of GVA and employment has a substantial impact on development of productivity. The overall LP in year 2000 ranged from 6494.6 to 105260.4 (constant prices 2010) and the average EU-28 productivity was higher than 46400 Euro (Table 1).
Till 2019 the total average EU-28 labour productivity jumped to 54828.2, with the minimum in Bulgaria (11589.2 Euro) and maximum in Ireland (116101.9 Euro). The new EU countries that joined the EU in 2004 or later, had a very low LP at the beginning of the analysed time span. The very low productivity in some countries compared with a high LP in the older EU Member States led to a substantial relative variability (measured by coefficient of variation – CV). The CV was higher than 62 % in year 2000. But during the next periods the labour productivity increased significantly in the less developed EU countries. This positive development had resulted also in convergence of the overall LP in the EU. The CV declined from 62% to 51.8% in 2013, then increased again slowly and ended with 53.1% in year 2019. The de-cline of the relative variability is a positive signal of con-vergence of the LP in the European Union. The convergence process of the LP is clearly visible also from the presentation of data in Figure 8.
On the x-axis the labour productivity in constant prices (2010) is drawn and on the y-axis the real change of total
Fig. 6. Relation between the contribution of section A to total GVA and GDP per capita (averages for 2000 – 2019)
Source: Own calculations based on Eurostat database
854 Silvia Megyesiova
LP between 2000 and 2019 is presented. The convergence happened due to the fact, that countries with a very low level of LP in 2000 were faced with a very strong increase of the
LP. For example, in Romania the real rate of change of the LP in the analysed time span was as high as 162.6%. All the new Member States are located in the upper-left quadrant
Table 1. Labour productivity total and in section A in Euro, constant prices 2010Year Analysis Variable: LP total, const.p. 2010 Analysis Variable: LP in section A, const.p. 2010
Mean Minimum Maximum Range Coeff of Variation
Mean Minimum Maximum Range Coeff of Variation
2000 46405.8 6494.6 105260.4 98765.8 62.3 11073.4 1315.3 57189.7 55874.4 79.12001 47161.8 6795.3 102563.0 95767.6 60.6 11278.6 1726.1 50225.0 48498.9 76.52002 47820.6 7301.7 103408.8 96107.0 59.7 12629.3 2255.9 70512.8 68256.9 82.82003 48231.1 7373.5 102935.4 95561.8 58.6 12402.3 2289.7 51133.3 48843.5 73.42004 49233.2 7538.6 103651.8 96113.1 57.6 14488.5 2893.8 58569.8 55676.0 71.92005 49741.2 7828.5 103727.1 95898.6 56.4 13768.3 2560.0 61097.5 58537.4 71.82006 50508.0 8108.0 105631.0 97523.0 55.6 14048.6 2700.3 65003.2 62302.9 74.22007 51153.8 8370.0 109787.1 101417.2 55.1 14594.7 1993.3 69208.3 67215.0 74.62008 51026.0 8680.5 103190.9 94510.4 53.4 15702.0 2566.3 66924.2 64357.9 70.32009 49732.9 8747.9 97423.5 88675.7 53.1 16110.1 2352.1 67221.3 64869.1 70.92010 51219.6 9173.3 100503.9 91330.6 53.3 15911.9 2147.8 64127.8 61980.0 71.92011 52172.0 9624.3 99533.4 89909.1 52.6 17010.9 2344.5 60215.6 57871.1 68.72012 52076.2 9830.3 96356.5 86526.1 51.9 16309.7 2183.6 59262.0 57078.4 69.32013 52390.3 9854.3 98070.0 88215.8 51.8 17302.3 2266.1 58795.4 56529.2 67.62014 52749.4 10032.1 99309.5 89277.4 52.0 18439.0 2388.2 62666.1 60277.8 67.12015 53310.9 10343.2 102872.0 92528.8 53.9 18908.9 2257.5 65181.8 62924.3 67.62016 53680.1 10655.4 103817.9 93162.5 53.8 19414.7 2524.4 66014.5 63490.1 67.32017 54236.3 10903.4 107787.3 96883.9 53.4 19768.9 2585.2 69853.7 67268.5 67.72018 54604.7 11294.1 112771.0 101476.9 53.4 20271.1 2696.9 67579.6 64882.6 65.42019 54828.2 11589.2 116101.9 104512.7 53.1 20823.4 2924.0 74606.1 71682.1 64.5
Fig. 7. Relation between the Employment in section A and GDP per capita (averages for 2000 – 2019)Source: Own calculations based on Eurostat database

855Production, employment and productivity of agricultural sector in the European Union
compared with the centre point (EU-28). For these countries was typical a very low LP in 2000 that was associated with a strong increase of the LP between 2000 and 2019. The old Member States are located in lower-right quadrant (except for Ireland, Sweden) compared with the EU average levels of productivity in 2000 and real growth rate of the LP be-tween 2000 and 2019. This means that the old EU countries reached high LP in 2000 that was associated with only a moderate growth or even with a moderate degrease of the real LP (Figure 8). All the mentioned facts about the status and development of real LP in the analysed time span are the reasons for convergence of the overall LP in the European Union.
For analytical purposes, the labour productivity in sec-tion A was calculated separately. This makes it possible to analyse the status, development, and proportion of the LP in agricultural sector compared to the total LP. From Table 1 it is clear, that compared with the overall productivity, the levels of the LP in agricultural sector are much lower. While the overall EU-28 average of the LP in 2000 overstepped 46405 Euro, in section A it was only 11073.4 Euro (constant prices 2010). The labour productivity in agricultural sector accounted for 24% of the total LP in the EU. The produc-tivity in section A ranges from 1315.3 to 57189.7 Euro in year 2000. Till 2019 the average LP in section A increased to 20823.4 Euro which is still much lower than the total LP of 54828.2 Euro in the same year. Positively must be rated that
the LP in agricultural sector accounted 38% of the total LP in 2019. It means that the proportion of LP in section A to the overall LP increased by 14 percentage points between 2000 and 2019. This is a positive signal of a gradual convergence of the total productivity and productivity in section A values. Till 2019 the average LP in agricultural sector increased to 20823.4 Euro, with the minimum in Bulgaria (2924.0 Euro) and maximum in Sweden (74606.1 Euro).
The new EU countries had an extremely low LP in the section A at the beginning of the analysed time span. In 2000 three countries had the annual LP in section A lower than 3000 Euro (constant prices 2010), namely Romania, Bulgaria and Poland. This extremely low labour productivities are in contrast with a high LP in Luxembourg (57189.7 Euro). The relative measure of variability was in case of the LP in agri-cultural section very high. For example, in 2000 the CV was nearly 80% which is 16.8 p.p. higher than the CV of the total LP. The highest relative variability in section A was achieved in 2002 (82.8%), while at the end of the analysed time span the CV declined to 64.5%. But also, in 2019 the difference between the coefficient of variation calculated from the labour productivity in section A was by 11.4 p.p. higher than the CV for the overall productivity. The decline of the relative vari-ability calculated from LP in section A (from 79.1% to 64.5%) was possible due to a strong growth of the productivity in the new Member States. Especially thanks to a very high real productivity growth in Slovakia, Romania, Latvia, Lithuania,
Fig. 8. Association between the overall labour productivity in year 2000 and real change of labour productivity (2019/2000)
Source: Own calculations based on Eurostat database. Note: Malta – missing data

856 Silvia Megyesiova
Estonia where the growth rate was higher than 150%. The LP in agricultural sector in Slovakia increased by 748.3% (from 3919.6 to 29329.6 Euro), in Romania by 271% (from 1315.3 to 3564.6 Euro), in Latvia by 249.4% (from 4007.6 to 9993.7 Euro). On the other hand, in some EU countries the real LP in agricultural sector declined between 2000 and 2019. Highest losses of productivity in section A were achieved by following countries: Luxembourg from 57189.7 in 2000 to 21939.1 Euro in 2019 (shrank by 61.6%), Belgium from 29369.7 to 26702.7 (shrank by 9.1%) and in Cyprus from 28833.5 to 26932.5 (shrank by 6.7%).
The convergence process of the LP in section A is vis-ible from the data presentation in Figure 9. On the x-axis the LP in section A (constant prices 2010) is drawn and on the y-axis the real change of LP in section A from 2000 till 2019 is presented. The convergence happened similarly to the convergence of the total LP due to the fact, that countries with a very low level of productivity in agricultural sector in 2000 were faced with a very strong increase of the real pro-ductivity in section A. Most of the new Member States are located in the upper-left quadrant compared with the centre point (EU-28). Slovakia with its extremely high real growth rate of 748.3 % is not presented in the Figure 9, but it would be in the second quadrant as well. The old Member States are in the lower-right quadrant (except for Austria, Finland) compared with the EU centre point. This means that the old EU countries reached high LP in section A in 2000 which
was associated with only a moderate growth or a moderate degrease of the real LP in agricultural sector. These men-tioned facts are the reasons of the convergence process of the productivity in section A.
The CV for the LP in section A decreased by 14.6 p.p. between 2000 and 2019. This decline is stronger than the degrease of the relative variability for the overall productiv-ity that dropped by 9.2 p.p. Unfortunately, the relative vari-ability of LP in the agricultural sector is still higher than the variability of overall labour productivity. The next positive view of the LP development in section A is related to the higher growth rate in comparison with a moderate growth rate of the total LP. The average EU-28 real productivity in agricultural sector increased by 88.1% in the analysed time span, while the total LP increased by moderate 18.1%. It means that a few positive signals for the agricultural sector in the EU in terms of LP were discovered by the analysis. Firstly, the real growth rate of the LP in agricultural sector was much higher than the growth rate of the overall LP. Sec-ondly, the decline of the relative variability was stronger and creates the options of further convergence of the productiv-ity in section A. Thirdly, all the mentioned facts resulted in an increase of the proportion of productivity in section A in the total LP from only 23.9% in 2000 to 38% in 2019. The trend of the development in productivity in agricultural sec-tor was positive and hopefully the productivity in section A will continue to grow and so will continue the increase of the
Fig. 9. Association between the productivity in section A in year 2000 and real change of labour productivity in section A (2019/2000)
Source: Own calculations based on Eurostat database. Note: Malta – missing data; Slovakia – the extreme value 748.28% of growth rate for agricultural sector is not presented in the figure

857Production, employment and productivity of agricultural sector in the European Union
proportion of LP in section A to the overall LP. The agricul-tural sector can stay so more attractive for new opportunities, employment, investment, and sustainable development.
Conclusions
NACE section A belongs to smaller industries as its con-tribution to total GVA ranged from 0.7% to 12.5% in 2000 and the share declined to a minimum of 0.2% and the max-imum of 4.5% in 2019. The smallest contribution was typi-cal for the most developed EU countries with a high living standard while the highest proportions were reached in less developed EU Member States. The total employment in the EU increased by 12.4% between 2000 and 2019 but the em-ployment in section A decreased by 40% in the same time span. The highest decline of employment in section A was achieved in the new EU countries were the agriculture played more important role at the beginning of the analysed period. Lower productivity was expected in countries with a high gap between the contribution of section A and the share of employment in agricultural sector in total employment. The highest differences between both indicators were reached in the most agrarian EU economies, in Romania and Bulgaria. The employment in section A declined in 26 EU countries, the highest drop was reached in the new EU countries, name-ly in Lithuania, Romania, Croatia. The association between the GDP per capita, as a measure of living standard, and the contribution of section A to total GVA discovers a negative, strong correlation. It means that in the countries with a high GDP per capita the agricultural sector plays only a little role and in countries with a low living standard the section A plays an important role. The new EU countries belong to countries with lower GDP per capita levels and higher con-tribution of section A to total GVA. Similar are the results of association between the GDP per capita and proportion of employment in section A. The association supports the former dependency between the living standard and impor-tance of agricultural sector in the economy. It means that in countries with a high share of employed persons in section A a lower GDP per capita is expected.
The labour productivity in section A is much lower than the overall LP. In 2000 the EU-28 average LP in agricultur-al sector reached 11073.4 Euro (constant price, 2010) while the overall LP was as high as 46405.8 Euro and so the LP in agricultural sector accounted for only 24% of the total LP. Till 2019 the real LP in agricultural sector increased by 88.1% and the total LP increased by only 18.1%. This made it possible to increase the share of the LP in section A to the overall LP from 24 % in 2000 to 38 % in 2019. The increased share of the LP in agricultural sector to the total LP must
be rated positively, as it makes the agricultural sector more productive, competitive. The convergence between the EU countries happened in terms of the LP in section A. While in 2000 the CV was as high as 79.1% till 2019 it declined to 64.5%. The relative measure of variability of the LP in section A is still higher than the variability of the overall LP. The convergence of the real LP in section A was possible due to a very high increase of LP in agricultural sector in new EU countries. In Slovakia, Romania, Latvia, Lithuania the increase was higher than 200%. The productivity in agricul-ture developed positively and creates the opportunity of an increase of living standard of the population and especially population living in the rural areas.
ReferencesBaldwin, J., Gu, W., Macdonald, R. & Yan, B. (2014). Produc-
tivity: What is it? How is it measured? What has Canada’s per-formance been over the period 1961 to 2012? Statistics Canada, ISSN 1710-5269.
Baráth, L. & Fertő, I. (2016). Productivity and convergence in European agriculture, discussion papers: MT-DP – 2016/26. Budapest, Hungary: Hungarian Academy of Sciences, Insti-tute of Economics, Centre for Economic and Regional Stud-ies.
Belas, J., Gavurova, B., Cepel, M. & Kubak, M. (2020). Eval-uation of economic potential of business environment devel-opment by comparing sector differences: Perspective of SMEs in the Czech Republic and Slovakia. Oeconomia Copernicana, 11(1), 135-159. doi: 10.24136/oc.2020.006.
Das, R. Ch. (2016). Handbook of research on global indicators of economic and political convergence. Business Science Refer-ence: Hershey, PA, 2016. ISBN13: 9781522502159.
EESC (2015). Opinion of the European Economic and Social Com-mittee on the Importance of Agricultural Trade for the Future Development of Farming and the Agricultural Economy in the EU in the Context of Global Food Security. 2015, Brussels, 16 September 2015, Belgium.
European Commission (2016). EU Agricultural Markets Briefs. Productivity in EU Agriculture – Slowly but Steadily Growing, https://ec.europa.eu/info/sites/info/files/food-farming-fisher-ies/trade/documents/agri-market-brief-10_en.pdf.
Eurostat (2008). NACE Rev. 2 Statistical Classification of Eco-nomic Activities in the European Community. Luxembourg: Office for Official Publications of the European Communities. ISBN 978-92-79-04741-1.
Eurostat (2018) Agriculture, Forestry and Fishery Statistics 2018 Edition. Luxembourg: Publications Office of the European Union, 2018. doi:10.2785/340432 KS-FK-18-001-EN-N
Eurostat (n.d.). Database. https://ec.europa.eu/eurostat/data/data-base (Retrieved 2020-10-20)
FAO (2020) International Telecommunication Union. Food and Agriculture Organization of the United Nations. Status of Digi-tal Agriculture in 18 Countries of Europe and Central Asia, Ge-neva, Switzerland: FAO. ISBN 978-92-5-132889-7.

858 Silvia Megyesiova
Received: December 22, 2020; Accepted: March 29, 2021; Published: October, 2021
Gordon, J., Zhao, S. & Gretton, P. (2015). On productivity: Con-cepts and measurement, Canberra: Australian Government, Productivity Commission Staff Research Note, 2015. ISBN 978-1-74037-535-1.
Guth, M., Smędzik-Ambroży, K., Czyżewski, B. & Stępień, S. (2020). The economic sustainability of farms under Common Agricultural Policy in the European Union countries. Agricul-ture, 10(2), 34. doi: 10.3390/agriculture10020034.
Insee (n.d.) The National Institute of Statistics and Economic Stud-ies. Definitions, https://www.insee.fr/en/metadonnees/defini-tions.
Janssen, F., Hende, A., Beer, J. & Wissen, L. J. G. (2016). Sigma and beta convergence in regional mortality: A case study of the Netherlands. Demographic Research, 35, 81–116.
Krugman, P. R. (1994). The age of diminished expectations: U.S. economic policy in the 1990s. 3rd ed., Cambridge Mass.: The MIT Press. ISBN 9780262610926.
Loveday, R. (2016). Statistics. Cambridge University Press: Cam-bridge, 2016. ISBN
Martini, B. & Giannini, M. (2020). Regional wage and produc-tivity in Italy: A spatio-temporal analysis. Spatial Economic Analysis, doi:10.1080/17421772.2020.1769169.
Melchor-Ferrer, E. (2020). Determinants of labour productivi-ty growth in Spanish and Portuguese regions: A spatial shift-share approach. Annals of Regional Science, 65(1), 45–65, doi:10.1007/s00168-019-00973-4.
Mihailova, M. (2020). The state of agriculture in Bulgaria – PES-TLE analysis. Bulg. J.Agric. Sci., 26(5), 935-943.
OECD (2019). OECD Compendium of Productivity Indica-tors 2019. OECD Publishing, Paris https://doi.org/10.1787/b2774f97-en.
O’Connor, A. (2018). A Guide to Gross Value Added (GVA) in Scotland. SPICe Briefing, The Information Centre. The Scot-tish Parliament, Scotland, https://sp-bpr-en-prod-cdnep.azureedge.net/published/2018/2/23/A-Guide-to-Gross-Value-Added--GVA--in-Scotland/SB%2018-15.pdf.
Statista (n.d.) https://www.statista.com/topics/4150/agriculture-in-dustry-in-europe