Embed Size (px)
Citation preview
Proc Mixed forProc Mixed forRepeated Measures DataRepeated Measures Data
������������������ ������ ���������� ����
Jaswant SinghVeterinary Biomedical Sciences

Most researchers use statistics the Most researchers use statistics the way a drunkard uses a lampway a drunkard uses a lamp--postpost
––more for support than illuminationmore for support than illumination
-- Winfred CastleWinfred Castle


Treatment 2Treatment 2
Animal #6Animal #6 Animal #8Animal #8 Animal #9Animal #9Animal #7Animal #7 Animal #10Animal #10
�� Animal ID is nested within treatmentAnimal ID is nested within treatment�� Our model statement for splitOur model statement for split--plot design will look like:plot design will look like:
Model Model Diameter = Diameter = trttrt animalanimal ((trttrt) day ) day trttrt*day*day
�� Animals are considered a Animals are considered a ‘‘random factorrandom factor’’ in the analysisin the analysis
Treatment 1Treatment 1
Animal #3Animal #3 Animal #4Animal #4Animal #2Animal #2 Animal #5Animal #5Animal #1Animal #1
Day 0
Day 1
Day 16
A random factor contains only a sample of the possible levels of the factor, and the intent is to generalize to all other levels

Traditional Method of TeachingTraditional Method of Teaching
Student #6Student #6 Student #8Student #8 Student #9Student #9Student #7Student #7 Student #10Student #10
�� Student ID is nested within MethodStudent ID is nested within Method�� Students are considered a Students are considered a ‘‘random random
factorfactor’’ in the analysisin the analysis
Experiential LearningExperiential Learning
Student #3Student #3 Student #4Student #4Student #2Student #2 Student #5Student #5Student #1Student #1
Surgery 1
Surgery 2
Surgery 5

0
4
8
12
16
0 1 2 3 4 5 6 7 8 9 10 11 12 13 14 15 16Days after Wave Emergence
Dia
met
er o
f Dom
inan
t Fol
licle
Our questions are:Our questions are:�� How does the follicle diameter How does the follicle diameter diameterdiameter
increase or decrease over time?increase or decrease over time?
�� How does one type of follicle differ from How does one type of follicle differ from another in its response over time?another in its response over time?
�� Are there any interactions among Are there any interactions among follicles due to the treatment effectfollicles due to the treatment effect

What do we want to accomplish?What do we want to accomplish?
�� To analyze time series dataTo analyze time series data
�� To find out if there is a treatment To find out if there is a treatment effecteffect

Experimental designsExperimental designs
�� Experimental Units:Experimental Units: AnimalsAnimals�� Experimental Design:Experimental Design: Completely random or oneCompletely random or one--wayway�� Treatment Design:Treatment Design: GradientGradient�� Response Design:Response Design: RepeatedRepeated
C o n tro l E strad io l 0 .1 m g i/m
E strad io l 0 .5 m g i/m
E s trad io l 1 .0 m g i/m
1 2 6 9 1 1 6 8 A n im a l
ID in 1 4 7 1 2 3 7 0
ea ch g ro u p
2 1 9 2 0 8
→
3 4 6 3 3 5
5 8 3 1 5 7 3 0

SASSAS®® PROC MIXEDPROC MIXED
�� A new analysis tool which is appropriate A new analysis tool which is appropriate for analyzing repeated measures data for analyzing repeated measures data because it models the covariance of the because it models the covariance of the data as well as the mean and the variance.data as well as the mean and the variance.–– In repeated measures data, the data collected at one In repeated measures data, the data collected at one
point in time is often not independent of the data point in time is often not independent of the data collected at another time in the study collected at another time in the study (i.e., heterogeneity of residuals, the existence of (i.e., heterogeneity of residuals, the existence of covariance in your data set).covariance in your data set).
�� Capable of analyzing data with missing Capable of analyzing data with missing values.values.
Correlation MatricesCorrelation Matrices
11000000001100000000110000000011
IndependentNo correlation
11αααααααααααααααααααααααααααααααα11αααααααααααααααααααααααααααααααα11αααααααααααααααααααααααααααααααα11
Compound SymmetryFixed and constant Correlationwithin a subject is presumed
11αααααααα4343434343434343αααααααα4242424242424242αααααααα4141414141414141
αααααααα434343434343434311αααααααα3232323232323232αααααααα3131313131313131
αααααααα4242424242424242αααααααα323232323232323211αααααααα2121212121212121
αααααααα4141414141414141αααααααα3131313131313131αααααααα212121212121212111
UnstructuredCorrelation matrix is
completely unspecified
11αααααααααααααααα22222222αααααααα33333333
αααααααα11αααααααααααααααα22222222
αααααααα22222222αααααααα11αααααααααααααααα33333333αααααααα22222222αααααααα11
AutoregressiveCorrelation decrease with distance
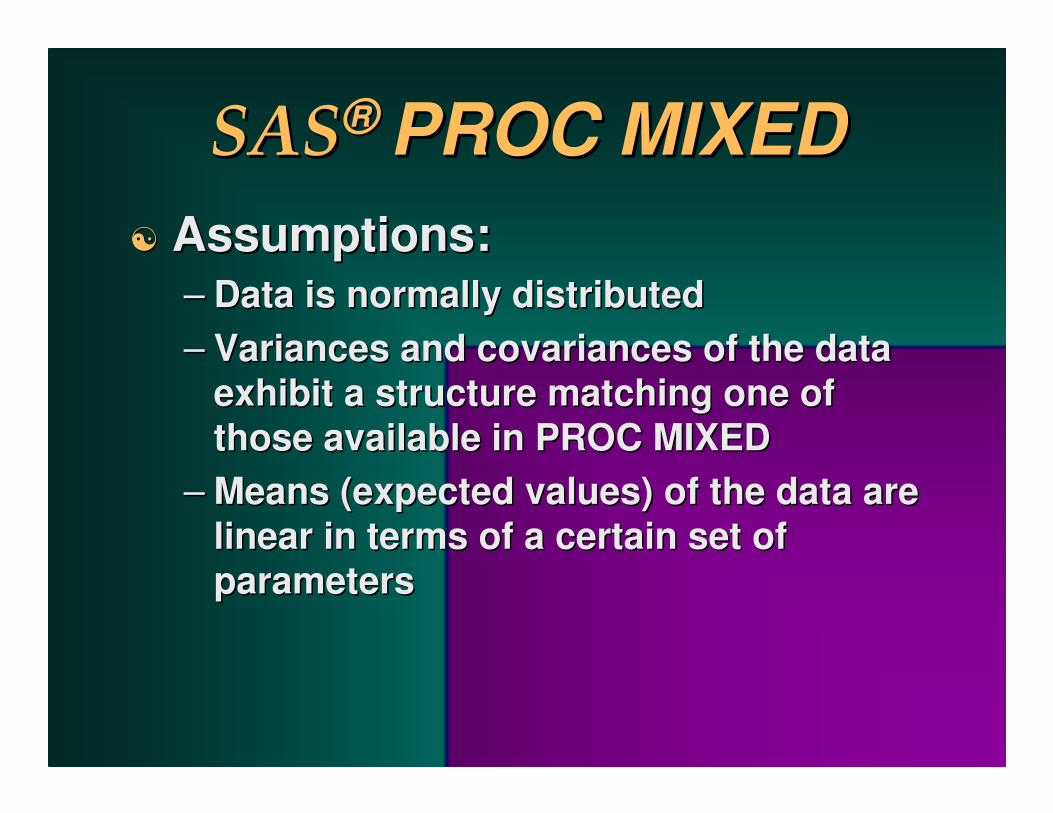
SASSAS®® PROC MIXEDPROC MIXED�� Assumptions:Assumptions:
–– Data is normally distributedData is normally distributed–– Variances and Variances and covariancescovariances of the data of the data
exhibit a structure matching one of exhibit a structure matching one of those available in PROC MIXEDthose available in PROC MIXED
–– Means (expected values) of the data are Means (expected values) of the data are linear in terms of a certain set of linear in terms of a certain set of parametersparameters
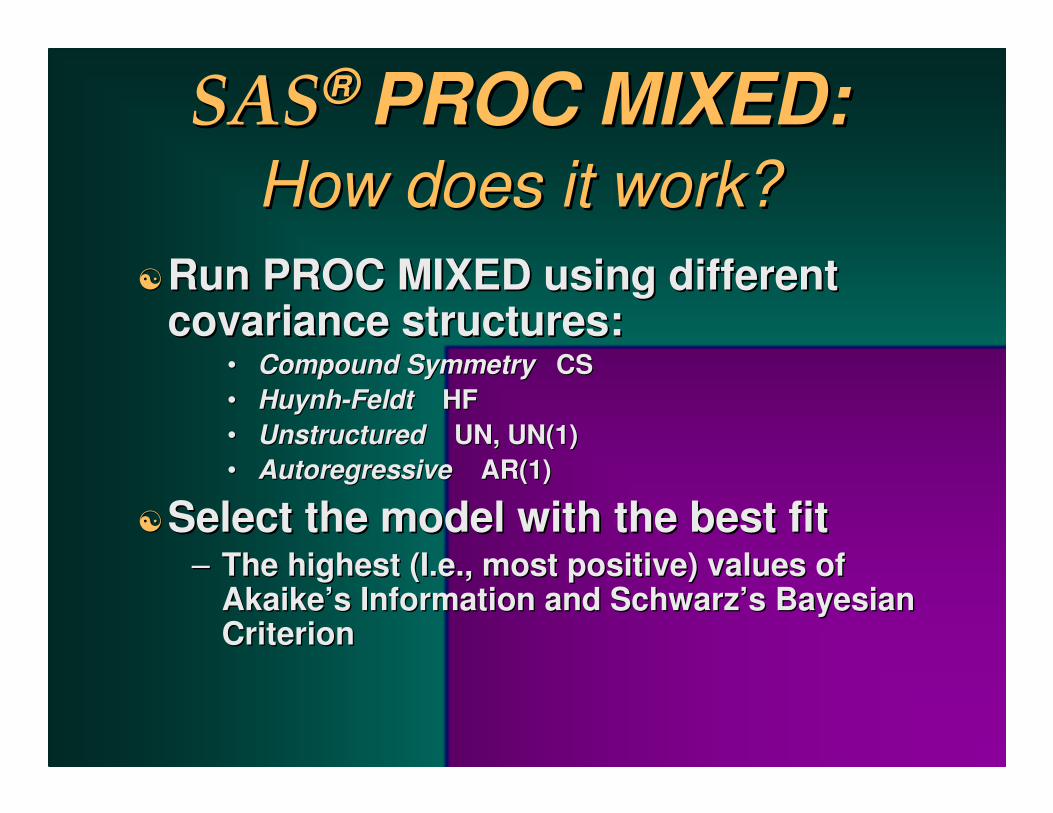
��Run PROC MIXED using different Run PROC MIXED using different covariance structures:covariance structures:
•• Compound Symmetry Compound Symmetry CSCS•• HuynhHuynh--FeldtFeldt HFHF•• Unstructured Unstructured UN, UN(1)UN, UN(1)•• Autoregressive Autoregressive AR(1)AR(1)
��Select the model with the best fitSelect the model with the best fit–– The highest (I.e., most positive) values of The highest (I.e., most positive) values of
AkaikeAkaike’’ss Information and SchwarzInformation and Schwarz’’s Bayesian s Bayesian CriterionCriterion
SASSAS®® PROC MIXED: PROC MIXED: How does it work?How does it work?

First thing firstFirst thing firstTest of Homogeneity of VarianceTest of Homogeneity of Variance
proc proc glmglm;;class class trttrt;;model model folliclediameterfolliclediameter = = trttrt;;means means trttrt / / hovtesthovtest; ; run;run;
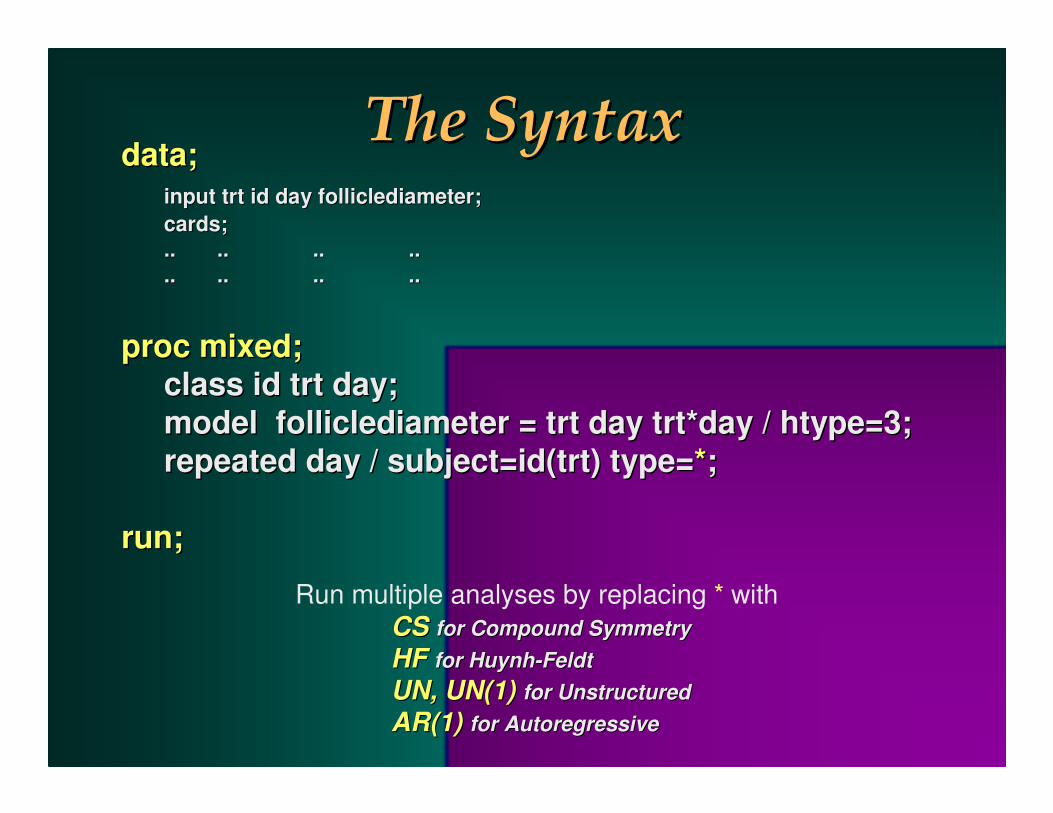
The SyntaxThe Syntaxdata;data;
input input trttrt id day id day folliclediameterfolliclediameter;;cards;cards;.... .... .... ........ .... .... ....
proc mixed;proc mixed;class id class id trttrt day;day;model model folliclediameterfolliclediameter = = trttrt day day trttrt*day / *day / htypehtype=3;=3;repeated day / subject=repeated day / subject=id(trtid(trt) type=) type=**;;
run;run;
Run multiple analyses by replacing * withCSCS for Compound Symmetryfor Compound SymmetryHFHF for Huynhfor Huynh--FeldtFeldtUN, UN(1)UN, UN(1) for Unstructuredfor UnstructuredAR(1)AR(1) for Autoregressivefor Autoregressive
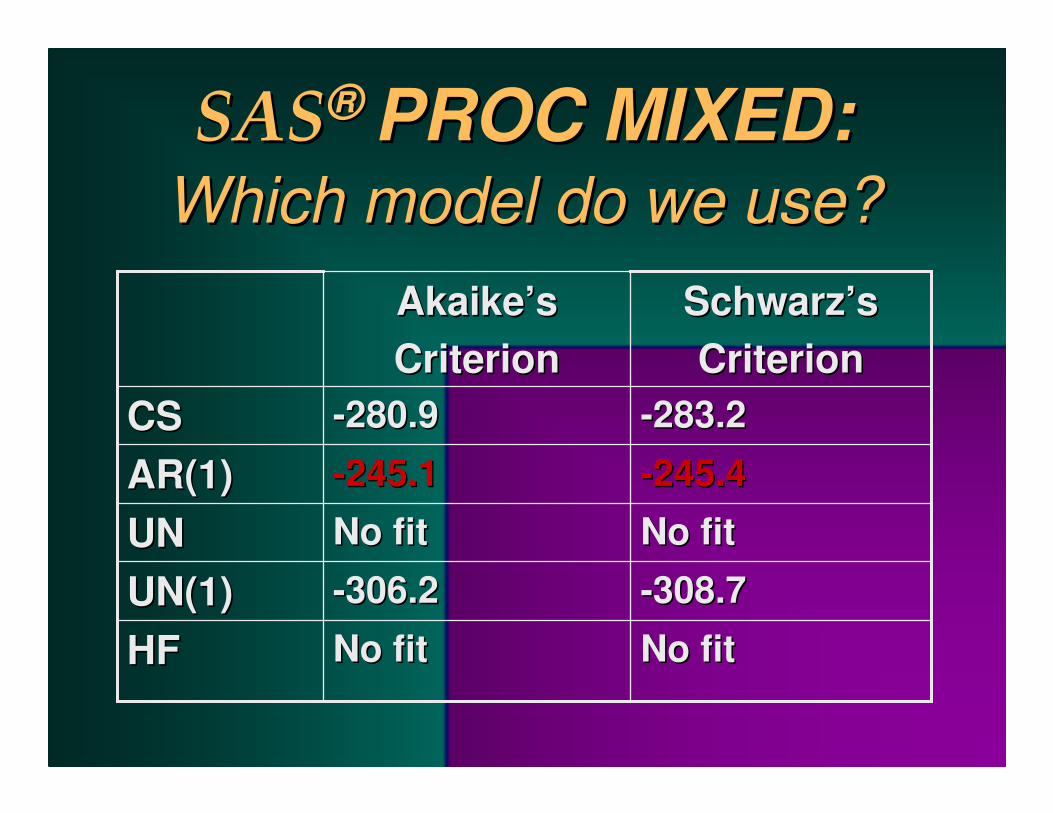
SASSAS®® PROC MIXED: PROC MIXED: Which model do we use?Which model do we use?
No fitNo fit--308.7308.7No fitNo fit--245.4245.4--283.2283.2
SchwarzSchwarz’’ssCriterionCriterion
--280.9280.9CSCS
No fitNo fitHFHF--306.2306.2UN(1)UN(1)No fitNo fitUNUN--245.1245.1AR(1)AR(1)
AkaikeAkaike’’ssCriterionCriterion

�� To determine where differences exist:To determine where differences exist:–– Least Squares MeansLeast Squares Means–– ContrastsContrasts–– EstimatesEstimates
�� In contrast to PROC GLM, PROC In contrast to PROC GLM, PROC MIXED averages across the repeated MIXED averages across the repeated measures and computes standard measures and computes standard errors accounting for the appropriate errors accounting for the appropriate covariance structure.covariance structure.
SASSAS®® PROC MIXEDPROC MIXED

SASSAS®® PROC MIXEDPROC MIXED
�� PROC GLM provides more extensive PROC GLM provides more extensive results for the traditional results for the traditional univariateunivariate and and multivariate approaches to repeated multivariate approaches to repeated measuresmeasures
�� PROC MIXED offers a richer class of both PROC MIXED offers a richer class of both mean and variancemean and variance--covariance models, and covariance models, and you can apply these to more general data you can apply these to more general data structures and obtain more general structures and obtain more general inferences on the fixed effectsinferences on the fixed effects

SASSAS®® PROC MIXEDPROC MIXEDReferences:References:
1.1. WolfingerWolfinger, R; Chang, M. Comparing the SAS GLM and , R; Chang, M. Comparing the SAS GLM and MIXED Procedures for Repeated Measures. SAS MIXED Procedures for Repeated Measures. SAS Institute Inc., Cary, NCInstitute Inc., Cary, NC
2.2. LittellLittell, R; Henry, P; , R; Henry, P; AmmermanAmmerman, C. Statistical Analysis , C. Statistical Analysis of Repeated Measures Data Using SAS Procedures. of Repeated Measures Data Using SAS Procedures. 1998. J 1998. J AnimAnim SciSci, 76:1216, 76:1216--1231.1231.
3.3. The Mixed Procedure. SAS/STAT UserThe Mixed Procedure. SAS/STAT User’’s Guide. s Guide. Version 8. Chapter 41. 1999. Volume 2: 2083Version 8. Chapter 41. 1999. Volume 2: 2083--2226.2226.