Embed Size (px)
Citation preview
WP-2007-012
Prioritization of Strategies to Overcome Barriers for Cleaner and Energy Efficient Alternatives in Urban
Transportation – Multi-criteria Approach
Sudhakar Yedla and Ram M. Shrestha
Indira Gandhi Institute of Development Research, Mumbai September 2007
Prioritization of Strategies to Overcome Barriers for Cleaner and Energy Efficient Alternatives in Urban Transportation –
Multi-criteria Approach 1
Sudhakar Yedla
Associate Professor
Indira Gandhi Institute of Development Research (IGIDR) General Arun Kumar Vaidya Marg
Goregaon (E), Mumbai- 400065, INDIA Email (corresponding author): [email protected]
Ram M. Shrestha
Professor, Energy Program, SERD
Asian Institute of Technology PO Box 4, Klong Luang, 12120, Pathumthani, Thailand
Abstract
Adoption of cleaner and energy efficient technologies (CEETs) in urban transport experiences certain barriers and deriving a set of policies to remove/reduce barrier in the case of Delhi and Mumbai transport systems was attempted in this study. A set of policy alternatives and measures (PAMs) were identified for each barrier and a pool of barriers PAMs for all barriers were identified which were finally analysed for their potential based on 4 important criteria namely administrative costs, financial burden, human resource benefits, administrative backup and political acceptability.
Based on aggregated multi-criteria assessment, the policy of distinct colouring scheme for alternate fuel vehicles (AFVs) stood first followed by awareness campaigns to the drivers, training programs to the workers, single window/priority check points, financial incentives and task force to carry out check.
To realize the completeness, potential of PAMs in handling barriers was analysed considering not only a set of criteria but also their potential in handling more than one barrier. In overall ranking, policy to develop partnerships among major stakeholders and awareness campaigns to the drivers showed highest potential in removing barriers for the adoption of CEETs.
Based on the ranking under both approaches a set of seven policy measures and alternatives were selected to remove barriers to CEETS and they are partnership between the Government, public sector undertakings and private actors in proving better infrastructure; Financial incentives like free or priority parking, separate lanes for alternative fuel vehicles and free inspection and maintenance; Task force to carry our checks; Heavy fines on defaulters; Distinct colour coding for AFVs; Demonstration of AFVs and their advantages; and Awareness campaigns to drivers. This set of PAMs would be able to control all seven pre-identified barriers to the adoption of CEETs in Delhi and Mumbai urban transportation systems. Key words: Barriers, CEETs, multi-criteria, policy analysis, urban transport 1 Authors are thankful to Swedish International Development Cooperation Agency (Sida) for providing financial support to carry out this work.
2
Prioritization of Strategies to Overcome Barriers for Cleaner and Energy Efficient Alternatives in Urban Transportation –
Multi-criteria Approach
Sudhakar Yedla and Ram M. Shrestha
1. Introduction Development of urban transportation has been an essential ingredient of economic
development of any country. Many Developing Countries (DC) in Asia have been putting
more emphasis on the development of urban transportation systems. However, due to various
circumstantial factors, differential priorities, lack of long term planning and poor financial
status for Urban Environmental Infrastructure (UEI), development in urban transportation is
not following sustainable pathways. This results in both transportation problems like
congestion, increased incidence of accidents and environmental problems like increased air
pollution, poor fuel efficiency and also contribution to climate change in terms of green
house gas emissions. Around 18-25% CO2 emissions are coming from urban transportation in
many developing countries (World Bank, 1997, Imura et al., 2005).
As the pollution levels reach their threshold limits in different cities making the life of
public miserable, various mitigation measures were considered viz. court interventions,
command and control tools, economic and innovative financial mechanisms. Though
transportation needs an integrated approach drawing good balance among various domains
like traffic management, congestion control measures, improved operating conditions and
auto fuel policies, measures like adoption of alternative technological options and improved
fuel quality are predominant. Attempts to induce improved technological alternatives and
cleaner fuels are prominent in various Asian countries (UNESCAP, 2001). These measures
clearly explain that transportation management in these growing urban centers of Asia has
been “reactive”.
Technological alternatives and cleaner fuel alternatives experience various barriers
and removal of these barriers is essential to achieve their penetration in urban transportation
(May et al., 2003; Yedla, 2005). Various policy measures addressing the implementation of
cleaner transportation alternatives and removal of barriers for the adoption of these
alternatives result in externalities on various complementing sectors. Thus it is essential to
analyze such impacts of various policies and their costs and benefits before attempting their
implementation. To add robustness to the analysis it is important to carryout this impact
3
assessment based on multiple criteria. Further, implementation of alternative options may
require more than one policy. Hence, it is important for the policy maker to know which
policies have better potential so that they can chose among the bigger lot of policy
alternatives.
Application of multi-criteria analysis for decision making in Environmental
Management is gaining importance (Yedla and Shrestha, 2003). Thus, ranking of policy
alternatives based on their impacts and potential in removing barriers to the alternative
transportation options by employing multi-criteria approach would give most convincing
answer to the policy makers. In the present paper such assessment and ranking of policy
alternatives was carried out for two mega cities of India, namely Delhi and Mumbai.
Objective of the study
To identify, assess and prioritize various policy measures to overcome barriers for the
adaptation of selected alternative transportation options in Delhi and Mumbai transportation
systems.
2. Methodology for the Analysis of Various Policy Alternatives Four necessary steps for any policy analysis are - defining the problem; identification of the
policy alternatives; establishing evaluation criteria; evaluating alternative policies.
2.1 Defining the Problem
The objective of this study is to suggest potential policy alternatives to overcome major
barriers for the adaptation of selected alternative transportation options in Delhi and Mumbai
transportation systems.
2.2 Identification of Barriers and Suitable Policy Measures
In a study carried out by the authors at the Indira Gandhi Institute of Development Research
(IGIDR), various important barriers for cleaner, energy efficient and environmental friendly
technologies (CEETs) in Delhi and Mumbai transport systems were identified and ranked by
adopting Analytic Hierarchy Process approach2 (IGIDR, 2002). Those identified barriers are
used in the present study and accordingly policy alternatives are identified for further
analysis.
2 CEETs considered were CNG cars, CNG buses, CNG 3-wheelers, batter operated 3-wheelers, 4-stroke 2-
wheelers. These CEETs were selected based on detailed techno-economic analysis. Further details on this study
can be obtained from the authors or IGIDR (2002).
4
Policy alternatives and measures (PAMs) are identified for the removal of each
identified barrier by reviewing the policies and measures tried by different countries for the
removal of barriers to CEETs and also by means of personal interviews/brainstorming session
among actors involved in transport sector. As certain policy alternatives would be common
across barriers and show potential in removing more than one barrier, a policy-barrier matrix
was developed with a set of common PAMs which have potential to remove one or more
barriers. Depending on the potential to remove number of barriers, policy alternatives are
given weights by adopting “maximum point normalization”. In this process, heavier weights
are assigned to policies that have potential to remove more than one barrier and are preferred
over the others.
2.3 Establishing Evaluation Criteria
Criteria are an important platform to compare various policies for their merits and demerits in
the process of selecting the most promising alternative policy options. In order to compare
merits and demerits of the selected policy alternatives for the removal of barriers to the
CEETs, a set of criteria was identified. Each of these criteria was given weights depending on
their importance in assessing the alternative policy options. This was done based on the
personal interviews and brainstorming session among various actors3 involved in transport
sector.
2.4 Evaluating Alternative Policies – Multi-criteria Approach
Each policy alternative was assessed based on each of the criteria identified. Performance of
each policy alternative based on each criteria was assessed on 1- 4 scale, with 1 representing
“poor” and 4 representing “excellent”. This was carried out by personal interview
(questionnaire survey)/brainstorming among actors. Average of responses from all the
respondents against each question is used as the final rating for the analysis.
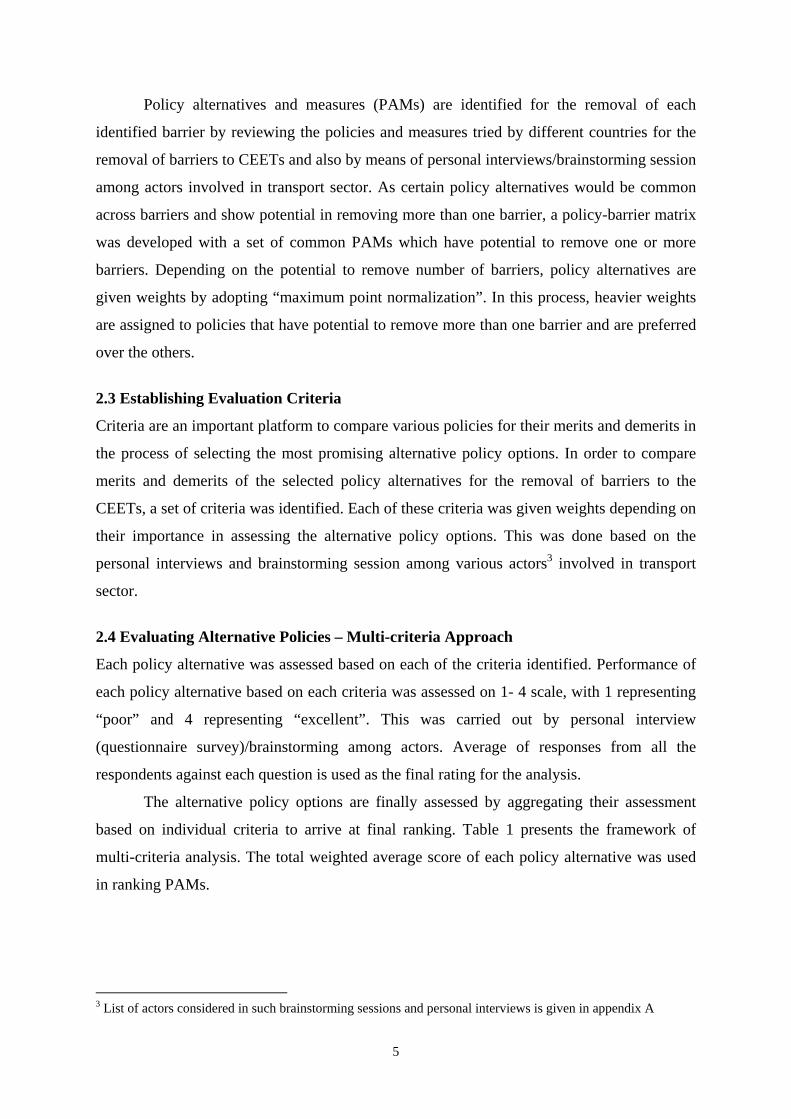
The alternative policy options are finally assessed by aggregating their assessment
based on individual criteria to arrive at final ranking. Table 1 presents the framework of
multi-criteria analysis. The total weighted average score of each policy alternative was used
in ranking PAMs.
3 List of actors considered in such brainstorming sessions and personal interviews is given in appendix A
5
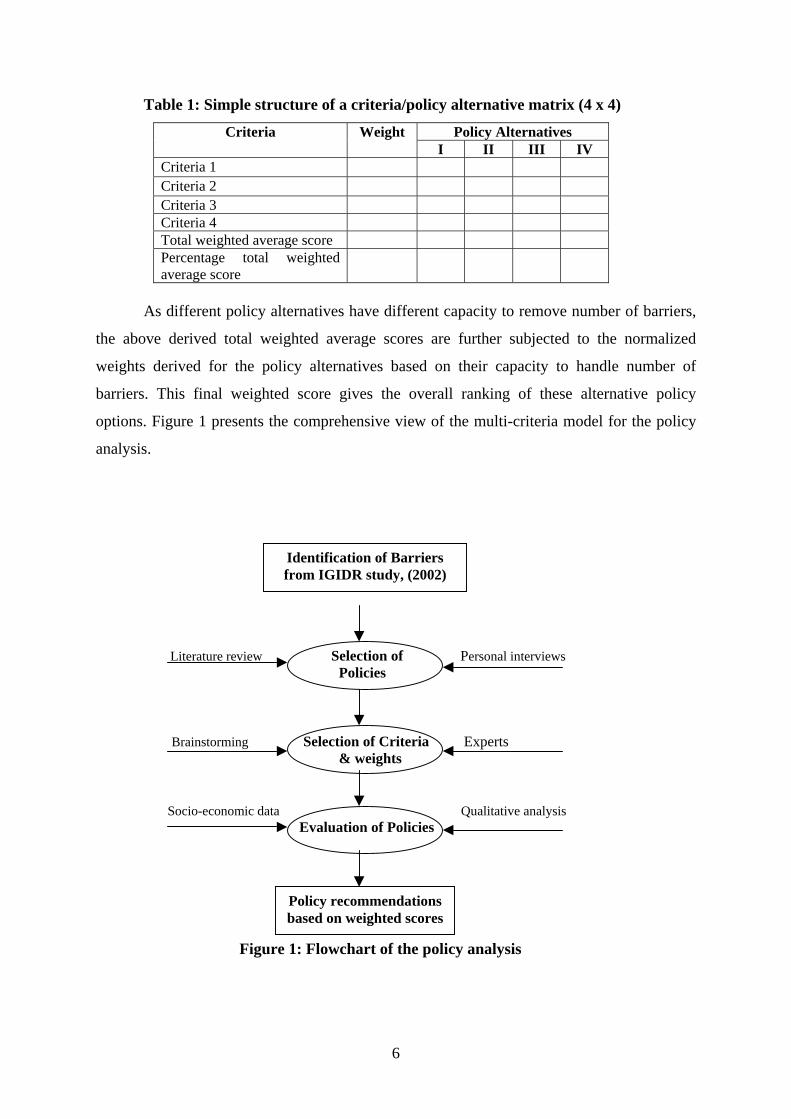
Table 1: Simple structure of a criteria/policy alternative matrix (4 x 4)
Policy Alternatives Criteria Weight I II III IV
Criteria 1 Criteria 2 Criteria 3 Criteria 4 Total weighted average score Percentage total weighted average score
As different policy alternatives have different capacity to remove number of barriers,
the above derived total weighted average scores are further subjected to the normalized
weights derived for the policy alternatives based on their capacity to handle number of
barriers. This final weighted score gives the overall ranking of these alternative policy
options. Figure 1 presents the comprehensive view of the multi-criteria model for the policy
analysis.
Identification of Barriers from IGIDR study, (2002)
Literature review Selection of Personal interviews Policies Brainstorming Selection of Criteria Experts
& weights Socio-economic data Qualitative analysis Evaluation of Policies
Policy recommendations based on weighted scores
Figure 1: Flowchart of the policy analysis
6
3. Barriers to CEETs and Identification of Suitable Policy Measures 3.1 Barriers for the Clean, Energy Efficient and Environmental friendly Technologies Indira Gandhi Institute of Development Research had analyzed several technical and
management options for greenhouse gas (GHG) mitigation in Delhi and Mumbai4. Based on
the techno-economic analysis, economically viable and energy efficient and environmentally
friendly alternatives were selected for individual cases of Delhi and Mumbai. Compressed
natural gas (CNG) options, battery operated vehicles and 4 stroke engines were the major
alternative options qualified based on techno-economic analysis. Important barriers for their
adoption in Delhi and Mumbai were identified and ranked using multiple criteria. As the
barriers are common across various alternatives both for Delhi and Mumbai, these barriers
are clustered into a group and are further consolidated by means of a brainstorming among
actors involved in transport sector. Following is the comprehensive list of barrier considered
in the present study:
• Lack of Resources and Infrastructure (B1)
• Additional Cost (B2)
• Lack of Enforcing Mechanism (B3)
• Lack of Awareness (B4)
• Lack of Availability of Efficient Technology/Conversion Kits (B5)
• Unwillingness to Participate (B6)
• Lack of Training and Implementation Programs for Smooth Transition (B7)
3.2 Review of Various Policy Initiatives in Different Cities/Countries
There are variety of policies and measures discussed in the literature for the removal of
barriers to achieve wider adoption of CEETs. These policies and measures can be
summarized into the following categories
1. Market Approach (economic instruments viz. taxes, subsidies)
2. Innovative Financial Mechanisms
3. Information, Education and Technical Assistance Programs
4. Command and Control Measures
Though each of the above categories of policies is capable of handling various
problems effectively, it is widely accepted that a combination of the above measures is
4 Details can be found at IGIDR (2002)
7
required to remove various barrier to CEETs. The following section presents various policies
tried in different cities or countries to remove/overcome different barriers to CEETs.
3.2.1 Market Approach
Economic instruments like taxes, subsidy and user fee play an important role in transport
sector (Pandey, 2004; Krupnick et al., 2003; Yedla, 2005). They have been used in many
countries to control the travel patterns and the associated emissions. Fuel taxation in
particular plays an important role in all the policy issues related to the transport sector. For
instance, higher prices at the pump provide incentives to choose more efficient cars.
Differentiated fuel taxes are also widely used to support or limit the use of specific fuels.
However, the response to fuel tax increase is very limited in short term although somewhat
greater in the longer run. In many countries fuel taxes are already at levels that are not
politically popular and the additional increase will create problem in the future (IEA, 2000).
Following table (Table 2) presents various cases of taxes, subsidies and fees exercised in
different countries.
Success of these tools depends highly on the kind of benefits they render in longer
run. In a most structured and long term policy to support natural gas vehicles, Thailand
Government, after its decision in October 1999 to promote natural gas utilization in transport
sector, has invested hugely on transport sector leading to much better long term
implementation5.
5 More details on this can be found at UNESCAP (2001)
8
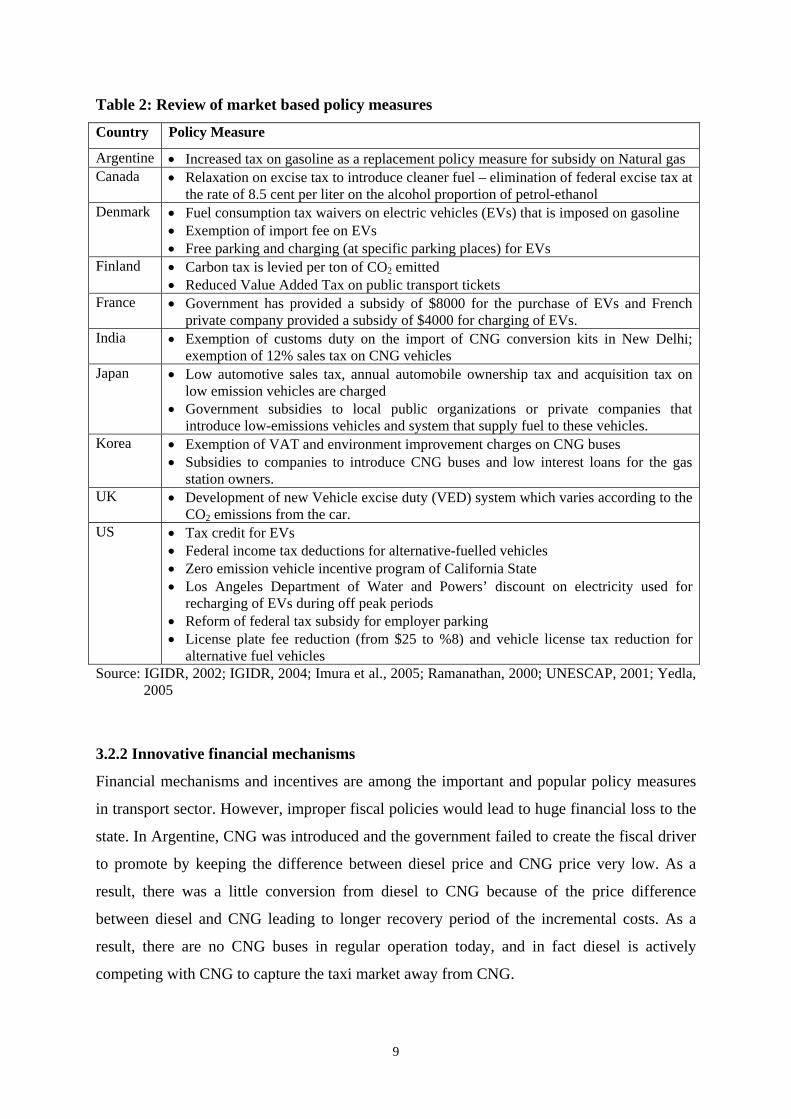
Table 2: Review of market based policy measures
Country Policy Measure
Argentine • Increased tax on gasoline as a replacement policy measure for subsidy on Natural gas Canada • Relaxation on excise tax to introduce cleaner fuel – elimination of federal excise tax at
the rate of 8.5 cent per liter on the alcohol proportion of petrol-ethanol Denmark • Fuel consumption tax waivers on electric vehicles (EVs) that is imposed on gasoline
• Exemption of import fee on EVs • Free parking and charging (at specific parking places) for EVs
Finland • Carbon tax is levied per ton of CO2 emitted • Reduced Value Added Tax on public transport tickets
France • Government has provided a subsidy of $8000 for the purchase of EVs and French private company provided a subsidy of $4000 for charging of EVs.
India • Exemption of customs duty on the import of CNG conversion kits in New Delhi; exemption of 12% sales tax on CNG vehicles
Japan • Low automotive sales tax, annual automobile ownership tax and acquisition tax on low emission vehicles are charged
• Government subsidies to local public organizations or private companies that introduce low-emissions vehicles and system that supply fuel to these vehicles.
Korea • Exemption of VAT and environment improvement charges on CNG buses • Subsidies to companies to introduce CNG buses and low interest loans for the gas
station owners. UK • Development of new Vehicle excise duty (VED) system which varies according to the
CO2 emissions from the car. US • Tax credit for EVs
• Federal income tax deductions for alternative-fuelled vehicles • Zero emission vehicle incentive program of California State • Los Angeles Department of Water and Powers’ discount on electricity used for
recharging of EVs during off peak periods • Reform of federal tax subsidy for employer parking • License plate fee reduction (from $25 to %8) and vehicle license tax reduction for
alternative fuel vehicles Source: IGIDR, 2002; IGIDR, 2004; Imura et al., 2005; Ramanathan, 2000; UNESCAP, 2001; Yedla,
2005
3.2.2 Innovative financial mechanisms
Financial mechanisms and incentives are among the important and popular policy measures
in transport sector. However, improper fiscal policies would lead to huge financial loss to the
state. In Argentine, CNG was introduced and the government failed to create the fiscal driver
to promote by keeping the difference between diesel price and CNG price very low. As a
result, there was a little conversion from diesel to CNG because of the price difference
between diesel and CNG leading to longer recovery period of the incremental costs. As a
result, there are no CNG buses in regular operation today, and in fact diesel is actively
competing with CNG to capture the taxi market away from CNG.
9
Federal Government of Canada, with an objective of encouraging the market for
natural gas vehicles, had provided financial incentives - $500 is for vehicle conversion,
$1,000 towards the purchase of a new NGV and $50,000 for each new vehicle refueling
station. This, along with relaxed excise tax on cleaner fuel has resulted in increased share of
NGVs in the market. Low-interest loans on alternative fuel vehicles are exercised as an
effective instrument to promote cleaner fuels in various countries like Thailand, Bangladesh,
India. In India, CNG is available at a price (in gasoline- equivalent terms) of Rs. 8.1- 9.2/
liter, which compares favorably with gasoline prices of Rs. 22-26/ Liter in 2001. It is
estimated that the costs of converting a vehicle to CNG in India can be recovered after
30,000km (IGIDR, 2004; Yedla, 2005).
3.2.3 Command and Control Measures Command and control has been a conventional approach in environmental management with
numerous set of examples. It is particularly effective in breaking initial resistance in
implantation of alternative policy measures. Following are few such cases –
• Argentine has adapted a command and control approach by developing standards for a
successful national private industry of compressors and dispensers, cylinders,
conversion kits to promote natural gas usage in transport sector.
• Mandatory vehicle inspections with minimum emissions requirements and zero lead
standards were implemented in Finland.
• Finland Government had adopted the privatization of railways to improve efficiency
and development of high-speed passenger train connections.
• In order to reduce pollution in the city of Milan, Italian Government permits electric
vehicles, bicycles and motorcycles fitted with catalytic converter in the streets only
between 8.00 AM to 8.00 PM.
• In a landmark decision, the Supreme Court of India ruling went into effect in New
Delhi on March 31, 2001, mandating the conversion of the entire bus fleet to
compressed natural gas (CNG). In addition, the honourable court has order the
replacement of taxis and auto rickshaws with engines running on clean fuels. Though
created friction in the system on short run, it has resulted in rich dividends on a longer
run (Yedla, 2005).
10
3.3 Review on Policy Initiative and Measures in Indian Transport Sector
Standards for controlling emission levels of new vehicles were incorporated into the Motor
Vehicles Act (1989) only as late as 1991, enforcing some quality control on the automobile
industry. The existing Bureau of Indian Standards (BIS) for fuels started incorporating
emission parameters during the same period. In 1996, government came up with stricter mass
emissions standards for vehicles. Other policy measures initiated during 1994-96 are – the
use of unleaded petrol and fitting of catalytic converters in the car. Now, EURO II and EURO
III norms also have been enforced.
The role of maintenance in combating vehicular pollution was reflected in
government policy for the first time in 1989, which made the certificate of fitness as
mandatory for registration of public vehicles, commercial vehicles and personal vehicles
older than 15 years. The 1990 vehicular emission rules required all motor vehicles to comply
with the laid down exhaust emission standards. Vehicle owners are required to check the
emission levels of their vehicles every three months and obtain a PUC (Pollution under
control) certificate. Vehicles failing to meet the standards are required to fix it and obtain the
certificate. The State Transport Authority fines those vehicles not possessing a PUC
certificate. This, apart from cutting down the emissions, actually created a lot of awareness
among citizens for the environmental pollution.
Failure of the administration to enforce environmental regulations, has led to judicial
interventions. The Supreme Court has come up with several guidelines in the last few years.
The Court has urged the government to accept the emissions standards EURO I, II, III etc. for
the vehicles as adopted by European Commissions. In last few years, The Supreme Court
issued number of directives aiming at environmental emission control, if which some are
specific to Delhi and some are nation wide (CPCB, 1999; GoNCT, 2003)6.
Two of the major initiatives towards emission control in India are enforcement of
unleaded petrol first in mega cities and then in the entire country and low sulphur diesel.
Details of these two programs are given in Box 1. The specification of lead in Indian petrol
used to be a maximum of 0.56 gm/L until 1994. As a result of the lead phase out program,
India achieved lead free-gasoline within the next 6 years (by February 1, 200). This is a
significant achievement when compared with the fact that in the developed countries, lead
phasing out was spread over a period of 10 to 20 years. Further, China and many other
6 Details can be obtained from Yedla (2005) and IGIDR (2004)
11
countries in Asia and the Pacific region, South America and Africa are yet to achieve
complete phasing out of lead.
Box 1: Lead and Sulphur phase out programs in India
Gasoline lead phase out program Phase I June 1994 Low leaded (0.15 g/l) Delhi, Mumbai, Calcutta and Chennai Phase II 1.4.1995 Unleaded (0.013g/l) Phase III 1.1.1997 Low leaded (0.15g/l) Entire country Phase IV 1.9.1998 Ban on leaded fuel NCT of Delhi Phase V 31.12.1998 Unleaded (0.013g/l) All other capitals of States/UT &
other major cities Phase VI 1.1.1999 Unleaded only NCR Phase VII 1.4.2000 Unleaded Entire country Diesel Sulphur phase out program Phase I April 1996 Low sulphur (0.5%) Four metros and “Taj Trapezium” Phase II August 1997 Low sulphur (0.25%) Delhi and “Taj Trapezium” Phase III April 1998 Low sulphur (0.25%) Metro cities Phase IV April 1999 Low Sulphur (0.25%) Entire country
Source: CPCB (1999)
3.4 Barriers and Alternative Policies Matrix
Based on the description of barriers and review of policies presented in the previous sections,
suitable policy alternatives and measures (PAMs) are identified for the removal of each
barrier, which are presented in Table 3. Identification of PAMs was done based on personal
interviews and brainstorming among various actors involved in transport sector. Policies
required for the removal each barrier are explained in detail.
12
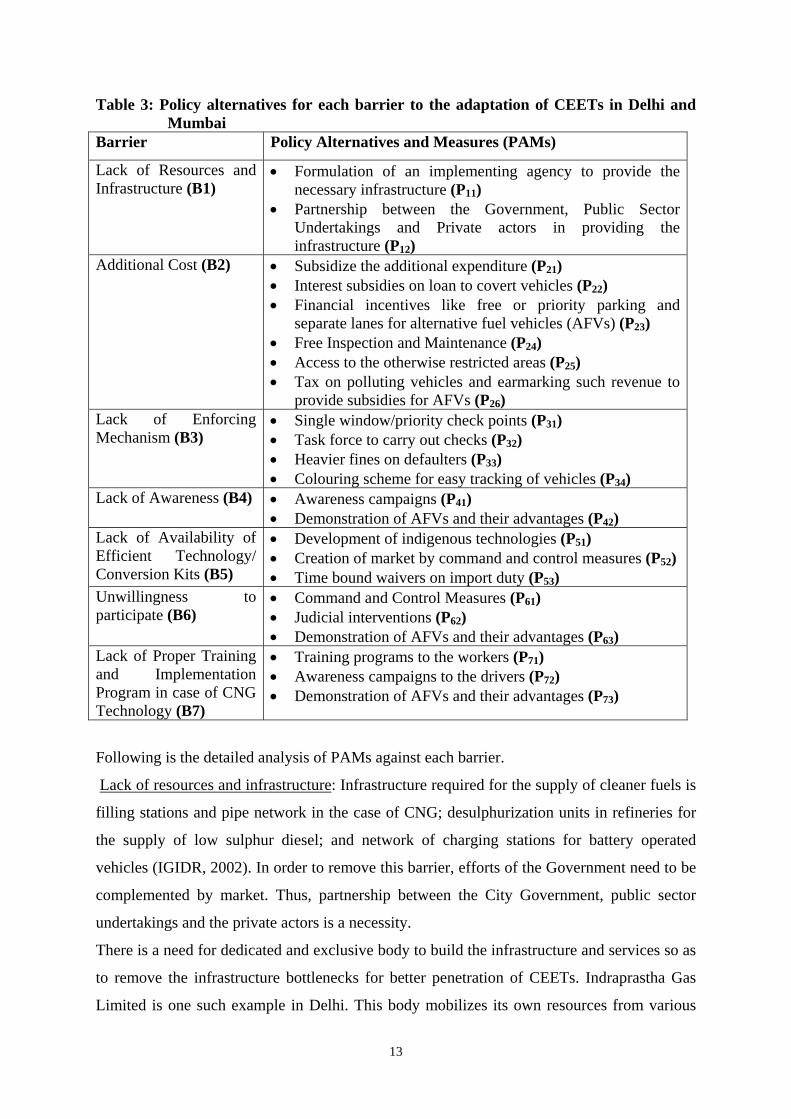
Table 3: Policy alternatives for each barrier to the adaptation of CEETs in Delhi and Mumbai
Barrier Policy Alternatives and Measures (PAMs)
Lack of Resources and Infrastructure (B1)
• Formulation of an implementing agency to provide the necessary infrastructure (P11)
• Partnership between the Government, Public Sector Undertakings and Private actors in providing the infrastructure (P12)
Additional Cost (B2) • Subsidize the additional expenditure (P21) • Interest subsidies on loan to covert vehicles (P22) • Financial incentives like free or priority parking and
separate lanes for alternative fuel vehicles (AFVs) (P23) • Free Inspection and Maintenance (P24) • Access to the otherwise restricted areas (P25) • Tax on polluting vehicles and earmarking such revenue to
provide subsidies for AFVs (P26) Lack of Enforcing Mechanism (B3)
• Single window/priority check points (P31) • Task force to carry out checks (P32) • Heavier fines on defaulters (P33) • Colouring scheme for easy tracking of vehicles (P34)
Lack of Awareness (B4) • Awareness campaigns (P41) • Demonstration of AFVs and their advantages (P42)
Lack of Availability of Efficient Technology/ Conversion Kits (B5)
• Development of indigenous technologies (P51) • Creation of market by command and control measures (P52) • Time bound waivers on import duty (P53)
Unwillingness to participate (B6)
• Command and Control Measures (P61) • Judicial interventions (P62) • Demonstration of AFVs and their advantages (P63)
Lack of Proper Training and Implementation Program in case of CNG Technology (B7)
• Training programs to the workers (P71) • Awareness campaigns to the drivers (P72) • Demonstration of AFVs and their advantages (P73)
Following is the detailed analysis of PAMs against each barrier.
Lack of resources and infrastructure: Infrastructure required for the supply of cleaner fuels is
filling stations and pipe network in the case of CNG; desulphurization units in refineries for
the supply of low sulphur diesel; and network of charging stations for battery operated
vehicles (IGIDR, 2002). In order to remove this barrier, efforts of the Government need to be
complemented by market. Thus, partnership between the City Government, public sector
undertakings and the private actors is a necessity.
There is a need for dedicated and exclusive body to build the infrastructure and services so as
to remove the infrastructure bottlenecks for better penetration of CEETs. Indraprastha Gas
Limited is one such example in Delhi. This body mobilizes its own resources from various
13
stakeholders and by going for public issue it can sustain the financial burden and also clear it
in a relatively shorter span of time (DoNCT, 2003). This barrier can be handled effectively by
the above two measures. Just by providing subsidy to the service provider it may not be
possible to create the momentum for its spread and longevity.
Additional cost: Conversion of existing vehicles to CNG needs substantial investments. The
cost of a diesel-CNG kit is about Rs. 85000 (Indian Rupees) and that of a petrol-CNG kit is
about Rs. 30000, exclusive of customs duty (DoNCT, 2003). This investment requirement
has become a major barrier for its adoption. A new CNG bus costs around 1.6 million Indian
rupees where as the diesel version costs only 0.8 million India Rupees. This additional
expenditure overshadows the fact that the CNG is cheaper. It is estimated that the costs of
converting a vehicle to CNG can be recovered after 30,000km (DoNCT, 2003). However, the
feeder services like 3-wheelers (auto rikshaw) face severe problem in meeting this huge
initial cost of conversion kits. Hence, it is essential to provide some sort of financial
incentives to overcome this barrier and allow the user to capture the low operating cost of
AFVs.
In case of major manufacturers, demand driven markets take care of the additional
investments required. In India, the CNG market was limited to a total of around 7,000
vehicles in Mumbai and Delhi, with total demand of around 0.03MMcm/ day in 2001. This
number has gone up substantially to reach as high as 70,249 motor vehicles in Delhi alone by
2004 creating good market for Natural Gas Vehicles (NGVs) (DoNCT, 2003; Yedla, 2005).
However, the small scale user needs incentives to over come this important barrier.
A subsidy in the range of 50% on the additional cost for NGVs would encourage
conversions to a great extent. However, such subsidy puts heavy burden on the Government.
An alternative measure could be interest subsidies on loans to convert the existing vehicles to
NGVs or other alternative fuels. Command and control measures are required to break the
initial stigma before the financial incentives add to the momentum. In such an attempt in
Delhi, to increase the penetration of CNG vehicles, the Government of India (GoI) had
provided an exemption of customs duty on CNG converter kits imports. Other financial
incentives attempted include exemption from the 12% state sales tax and a 3% low-cost loan
option for weaker sections of the society (DoNCT, 2003). Customs duty on imported CNG
kits was waived. These incentives helped reducing the cost of CNG conversion kit by about
15%. However, these subsidies were given only for the initial few months. Similar
14
mechanisms can be tried in Mumbai to improve the penetration of NGVs and other cleaner
options like electric and battery operated vehicles.
Apart from these direct financial incentives to provide the initial drive for conversion,
indirect incentives like free or priority parking for AFVs, special lanes would help speed up
the adoption. These mechanisms have been attempted successfully in many developed
countries and found giving good results.
Other incentives that can be offered are free inspection and maintenance, access to
areas like CBD where other gasoline and diesel vehicles are prohibited would be a major
driver, in spite of the additional costs involved in fuel switching. Another effective financial
mechanism could be a tax on polluting vehicles and earmarking such revenue to provide
subsidies for AFVs. Such measure help reduce the financial burden on the state.
Lack of enforcing mechanism: Among various barriers to the adoption of AFVs, lack of
enforcing mechanism is important because this directly influences the enforcement of the
alternative. In spite of providing infrastructure and financial incentives, the alternative
options may fail due to the absence of enforcing mechanisms.
Once the regulation for conversion of vehicles is made, a single window/priority
checking points would enhance the effectiveness of enforcement. A mobile task force to carry
out random checks on vehicles would remove this barrier of week enforcement. As an
indirect approach, levying heavier fines on defaulter could be an effective enforcement tool.
This would work well in the case of 3-wheelers and cars. For buses the enforcement will not
be a barrier as the number is limited and are easy to trace and monitor. A scheme of distinct
colouring for AFVs would help in easy tracking of vehicles. This would enhance the
enforcement and fining defaulters would be that much easier.
Lack of awareness: In the case of semi public transport encompassing taxis and 3-wheelers
(auto rikshaw) lack of awareness also poses a major barrier. Operating costs of the three
wheelers driven on natural gas is almost half that of conventional fueled three wheelers.
However, the initial capital cost requirements overshadows the other benefits because of the
poor awareness. Hence, removing this barrier could help better adaptation of AFVs. It is
required to design and execute strong awareness campaigns like bull boards, advertisements
in news papers and other media like TV and Radio. NGOs have a particularly important role
in this. Another measure to remove this barrier is the field-demonstration of these AFVs.
15
Lack of availability of efficient technology/conversion kits: In the initial phase of the AFVs,
lack of availability of efficient technology/conversion kits poses a severe constraint on their
penetration. However, this barrier disappears over a period of time as the market itself takes
care of such demand. But, it is essential to reduce its intensity to achieve a better penetration
rate in the beginning. This barrier can be controlled in a three pronged approach. During the
initial period, incentives like import duty waivers on CNG conversion kits need to be
implemented to encourage the conversion of vehicles. However, it needs to be a time bound
process, slowly reducing the waivers so that it initiates the development of indigenous kits.
However, leaving it exclusively to the market might make it unsuccessful as it takes longer to
create a market. Thus, it is necessary to make a regulation for this conversion so that market
is created with a specific time frame. Therefore, there is a need for regulation making the
conversions mandatory. Alongside, to meet the demand, indigenous technology and
conversion kits need to be developed. These three measures put together can remove this
barrier of non-availability of efficient technology/conversion kits.
Unwillingness to participate: One of the difficult barriers to remove is peoples’ unwillingness
to participate. In spite of the financial incentives and other measures people resist these
changes. Two possible ways to handle this problem both in Delhi and Mumbai are command
and control with judicial intervention and demonstration of AFVs and their advantages to
individuals and the public in general. As in the case of Delhi, a strict regulation to adopt AFs
with a strict time frame is necessary to force the conversions in spite of peoples’
unwillingness to participate. Demonstration runs of AFVs and showcasing their benefits
would reduce the initial friction resulting from the enforcement of regulation.
Lack of proper training and implementation programs: Lack of proper training and
implementation programs for smooth transition is a functional barrier affecting the efficiency
of conversion/penetration. As these alternatives like natural gas, battery operated vehicles are
technology intensive, the workers handling them need to be trained specially for the task.
Lack of such training would fail to provide a smooth transition to AFVs. No proper training
results in various operational problems and improper conversions lead to mishaps creating
havoc in the public (DoNCT, 2003). This barrier is prominent during the initial phases.
Drivers need to be made aware of the changes/adjustments in the technology in absence of
which there is every possibility of mishandling of the vehicle. Hence, awareness campaigns
for drivers (for taxis and auto rikshaws in particular) are necessary to provide a smooth
16
transition to these AFVs. Demonstration of AFVs and their advantages would reduce the gap
between introduction and implementation of these efficient alternatives in urban
transportation.
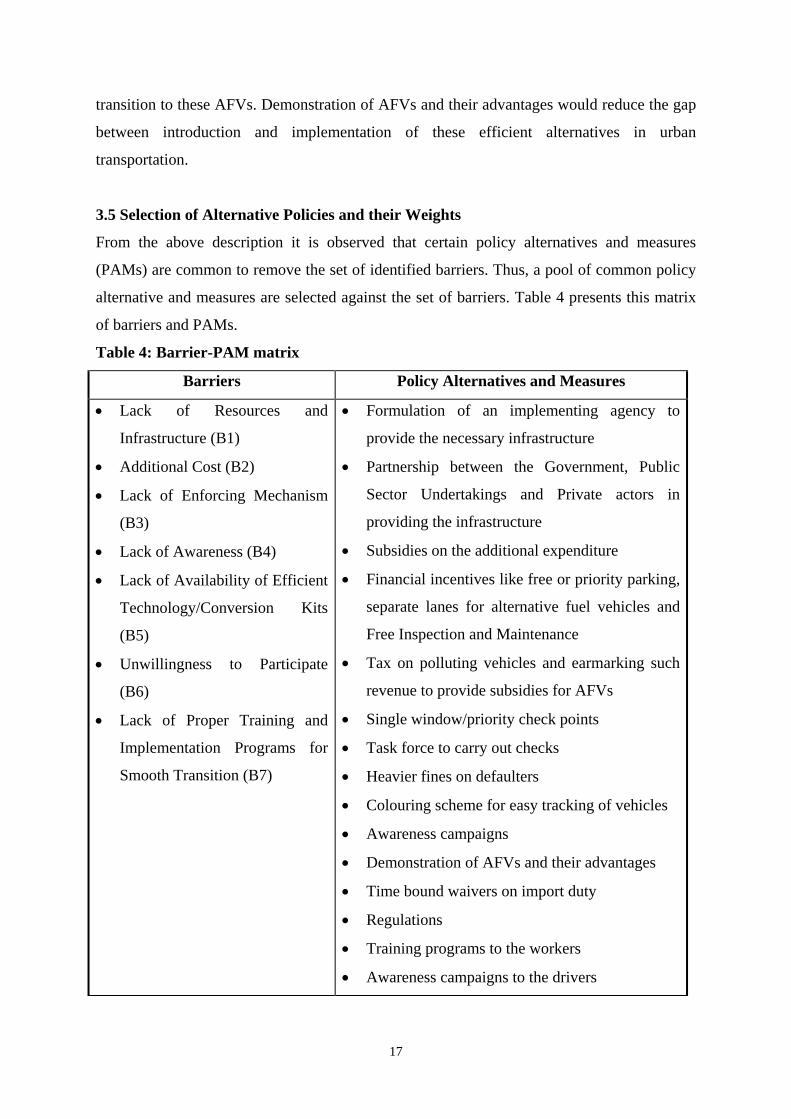
3.5 Selection of Alternative Policies and their Weights
From the above description it is observed that certain policy alternatives and measures
(PAMs) are common to remove the set of identified barriers. Thus, a pool of common policy
alternative and measures are selected against the set of barriers. Table 4 presents this matrix
of barriers and PAMs.
Table 4: Barrier-PAM matrix
Barriers Policy Alternatives and Measures
• Lack of Resources and
Infrastructure (B1)
• Additional Cost (B2)
• Lack of Enforcing Mechanism
(B3)
• Lack of Awareness (B4)
• Lack of Availability of Efficient
Technology/Conversion Kits
(B5)
• Unwillingness to Participate
(B6)
• Lack of Proper Training and
Implementation Programs for
Smooth Transition (B7)
• Formulation of an implementing agency to
provide the necessary infrastructure
• Partnership between the Government, Public
Sector Undertakings and Private actors in
providing the infrastructure
• Subsidies on the additional expenditure
• Financial incentives like free or priority parking,
separate lanes for alternative fuel vehicles and
Free Inspection and Maintenance
• Tax on polluting vehicles and earmarking such
revenue to provide subsidies for AFVs
• Single window/priority check points
• Task force to carry out checks
• Heavier fines on defaulters
• Colouring scheme for easy tracking of vehicles
• Awareness campaigns
• Demonstration of AFVs and their advantages
• Time bound waivers on import duty
• Regulations
• Training programs to the workers
• Awareness campaigns to the drivers
17
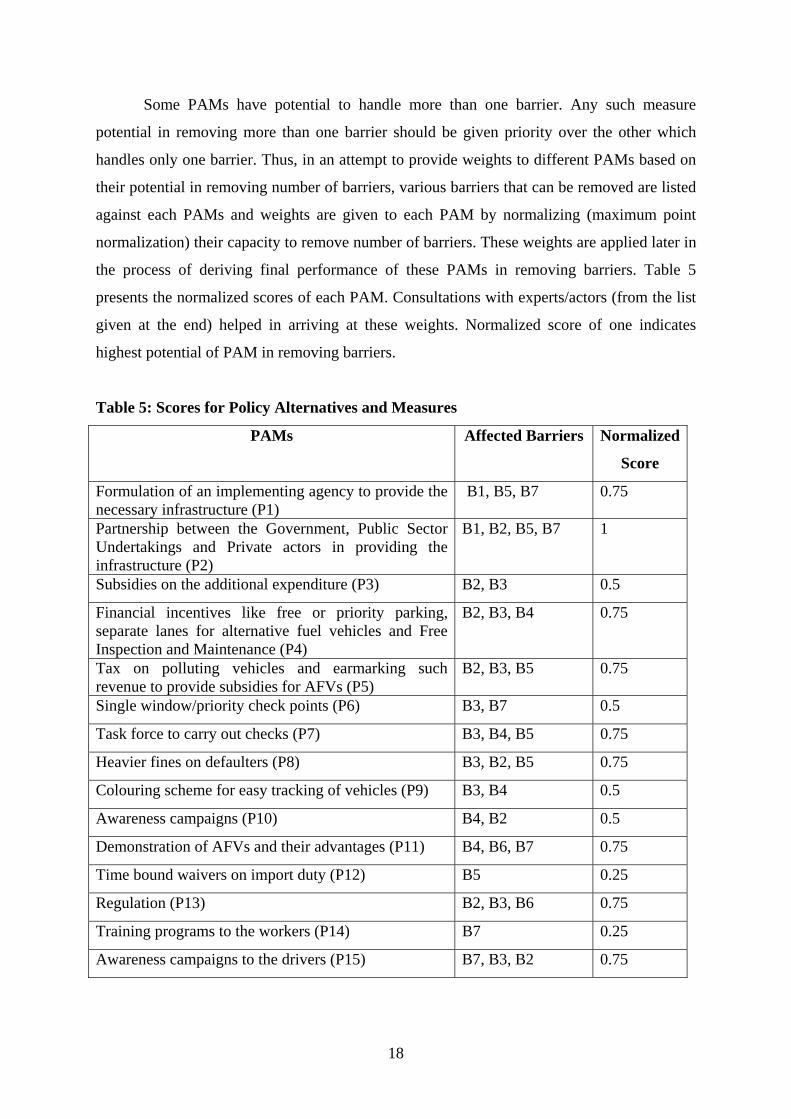
Some PAMs have potential to handle more than one barrier. Any such measure
potential in removing more than one barrier should be given priority over the other which
handles only one barrier. Thus, in an attempt to provide weights to different PAMs based on
their potential in removing number of barriers, various barriers that can be removed are listed
against each PAMs and weights are given to each PAM by normalizing (maximum point
normalization) their capacity to remove number of barriers. These weights are applied later in
the process of deriving final performance of these PAMs in removing barriers. Table 5
presents the normalized scores of each PAM. Consultations with experts/actors (from the list
given at the end) helped in arriving at these weights. Normalized score of one indicates
highest potential of PAM in removing barriers.
Table 5: Scores for Policy Alternatives and Measures
PAMs Affected Barriers Normalized
Score
Formulation of an implementing agency to provide the necessary infrastructure (P1)
B1, B5, B7 0.75
Partnership between the Government, Public Sector Undertakings and Private actors in providing the infrastructure (P2)
B1, B2, B5, B7 1
Subsidies on the additional expenditure (P3) B2, B3 0.5
Financial incentives like free or priority parking, separate lanes for alternative fuel vehicles and Free Inspection and Maintenance (P4)
B2, B3, B4 0.75
Tax on polluting vehicles and earmarking such revenue to provide subsidies for AFVs (P5)
B2, B3, B5 0.75
Single window/priority check points (P6) B3, B7 0.5
Task force to carry out checks (P7) B3, B4, B5 0.75
Heavier fines on defaulters (P8) B3, B2, B5 0.75
Colouring scheme for easy tracking of vehicles (P9) B3, B4 0.5
Awareness campaigns (P10) B4, B2 0.5
Demonstration of AFVs and their advantages (P11) B4, B6, B7 0.75
Time bound waivers on import duty (P12) B5 0.25
Regulation (P13) B2, B3, B6 0.75
Training programs to the workers (P14) B7 0.25
Awareness campaigns to the drivers (P15) B7, B3, B2 0.75
18
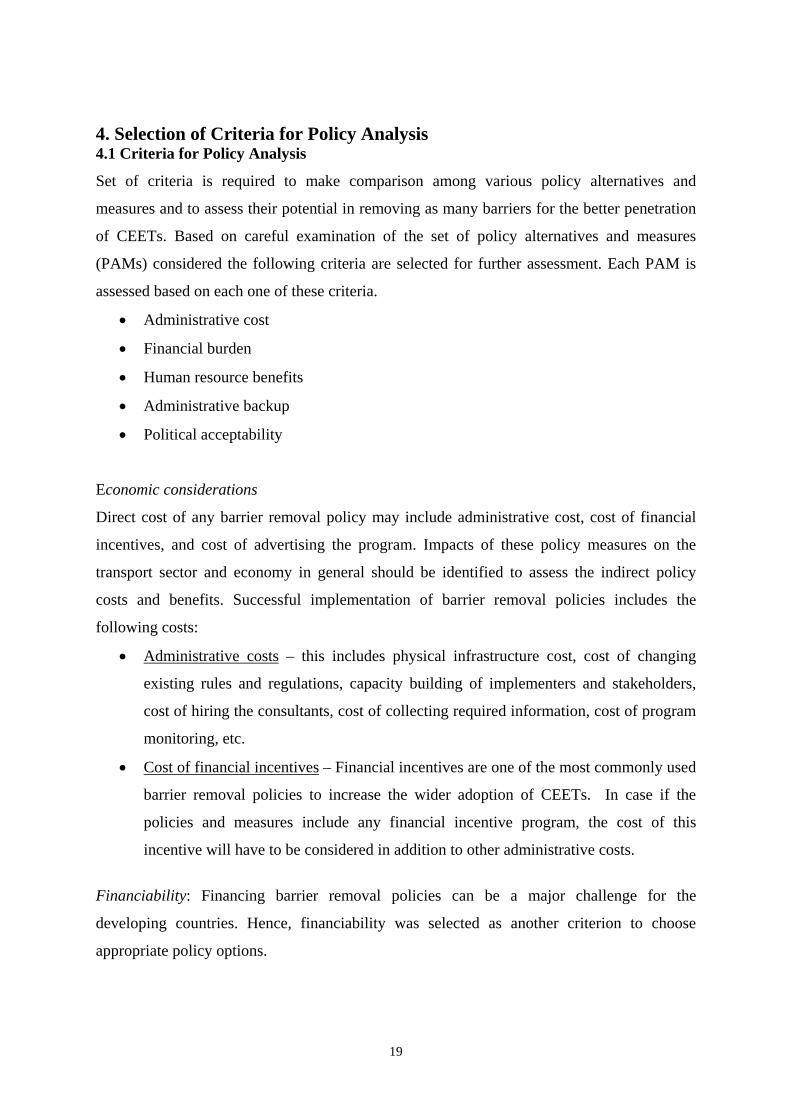
4. Selection of Criteria for Policy Analysis 4.1 Criteria for Policy Analysis
Set of criteria is required to make comparison among various policy alternatives and
measures and to assess their potential in removing as many barriers for the better penetration
of CEETs. Based on careful examination of the set of policy alternatives and measures
(PAMs) considered the following criteria are selected for further assessment. Each PAM is
assessed based on each one of these criteria.
• Administrative cost
• Financial burden
• Human resource benefits
• Administrative backup
• Political acceptability
Economic considerations
Direct cost of any barrier removal policy may include administrative cost, cost of financial
incentives, and cost of advertising the program. Impacts of these policy measures on the
transport sector and economy in general should be identified to assess the indirect policy
costs and benefits. Successful implementation of barrier removal policies includes the
following costs:
• Administrative costs – this includes physical infrastructure cost, cost of changing
existing rules and regulations, capacity building of implementers and stakeholders,
cost of hiring the consultants, cost of collecting required information, cost of program
monitoring, etc.
• Cost of financial incentives – Financial incentives are one of the most commonly used
barrier removal policies to increase the wider adoption of CEETs. In case if the
policies and measures include any financial incentive program, the cost of this
incentive will have to be considered in addition to other administrative costs.
Financiability: Financing barrier removal policies can be a major challenge for the
developing countries. Hence, financiability was selected as another criterion to choose
appropriate policy options.
19
Administrative Feasibility: Policies should be practical and feasible to actually produce
intended benefits. Implementation of barrier removal policies requires a good organizational
set-up with appropriate infrastructure, manpower and technical support.
Political Acceptability: It may be difficult to get political support for most of the GHG
reduction policies and measures because the policy makers are more likely to have their
priority on economic and social needs, as mentioned earlier, rather than giving attention to
environmental issues of global concern. The passing of GHG mitigation policies through
political and bureaucratic process can be a challenge for developing countries. Hence,
political acceptability could be one of the evaluation criteria.
Equity: Equity can be considered as an evaluation criterion because the equitable distribution
of policy cost and benefits among stakeholders could be of great importance.
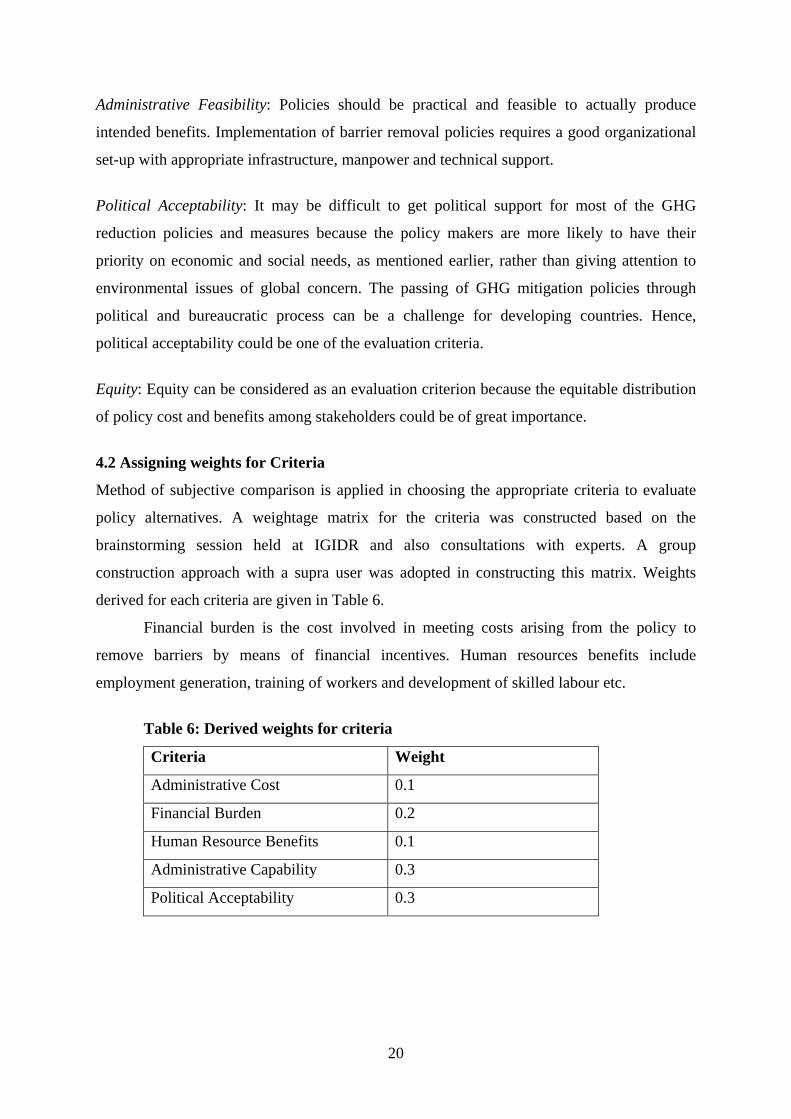
4.2 Assigning weights for Criteria
Method of subjective comparison is applied in choosing the appropriate criteria to evaluate
policy alternatives. A weightage matrix for the criteria was constructed based on the
brainstorming session held at IGIDR and also consultations with experts. A group
construction approach with a supra user was adopted in constructing this matrix. Weights
derived for each criteria are given in Table 6.
Financial burden is the cost involved in meeting costs arising from the policy to
remove barriers by means of financial incentives. Human resources benefits include
employment generation, training of workers and development of skilled labour etc.
Table 6: Derived weights for criteria
Criteria Weight
Administrative Cost 0.1
Financial Burden 0.2
Human Resource Benefits 0.1
Administrative Capability 0.3
Political Acceptability 0.3
20
5. Analysis of Alternative Policy Options to Reduce Barriers to the Adoption of CEETs
5.1 Prioritization of Policies based on Criteria
Any alternative policy option has strengths and weaknesses and it is important to make a
consolidated assessment accounting for all its strengths and weaknesses. Hence, the
effectiveness of each PAM against each criteria is assessed on a four point scale - Low – 1,
Medium – 2, High – 3, Very High - 4. On this scale low value represents the least priority of
a policy based on the criteria under consideration. For instance, a score of 1 for P1
(formulation of an implementing agency to provide the necessary infrastructure) on the
criteria of “Administrative cost” implies that P1 is less preferred as its implementation would
involve high administrative costs. Group responses for each alternative against each criteria
are developed based on brainstorming among experts. Merits and demerits of all PAMs are
explained under each criteria as presented below:
Criteria: Administrative cost
Any policy to be implemented essentially involves various efforts like changing the existing
rules and regulations, and organizational set up. If the policy cannot be implemented with the
existing organizational setup, it takes quite an effort to make it work. It involves costs like
infrastructure, hiring consultants and staff, training and education of the staff, etc.
Formulation of an implementing agency to provide necessary infrastructure
essentially involves huge administrative costs. Construction of 23.8 km CNG pipeline in
Delhi by IGL needed 250 million Indian Rupees. Establishment of 110 CNG stations and the
other necessary infrastructure needed 5220 million Rupees (DoNCT, 2003). It essentially
involves other huge costs like training personnel and providing support in execution. Policies
to promote partnership between major stakeholders also demands huge administrative costs.
At times it would be a necessity to go for amendment of rules to accommodate such new
bodies.
However, providing subsidies and financial incentives would not involve much
administrative cost as it can be implemented with the existing organizational setup. Taxing
pollution vehicles needs legislation in support and such changes demand huge administrative
costs. Similar costs would be observed in the case of fines on defaulters. Priority checks with
single window and constitution of task force doesn’t demand too much of administrative
costs as they can be handled with the existing organizational set up and man power.
21
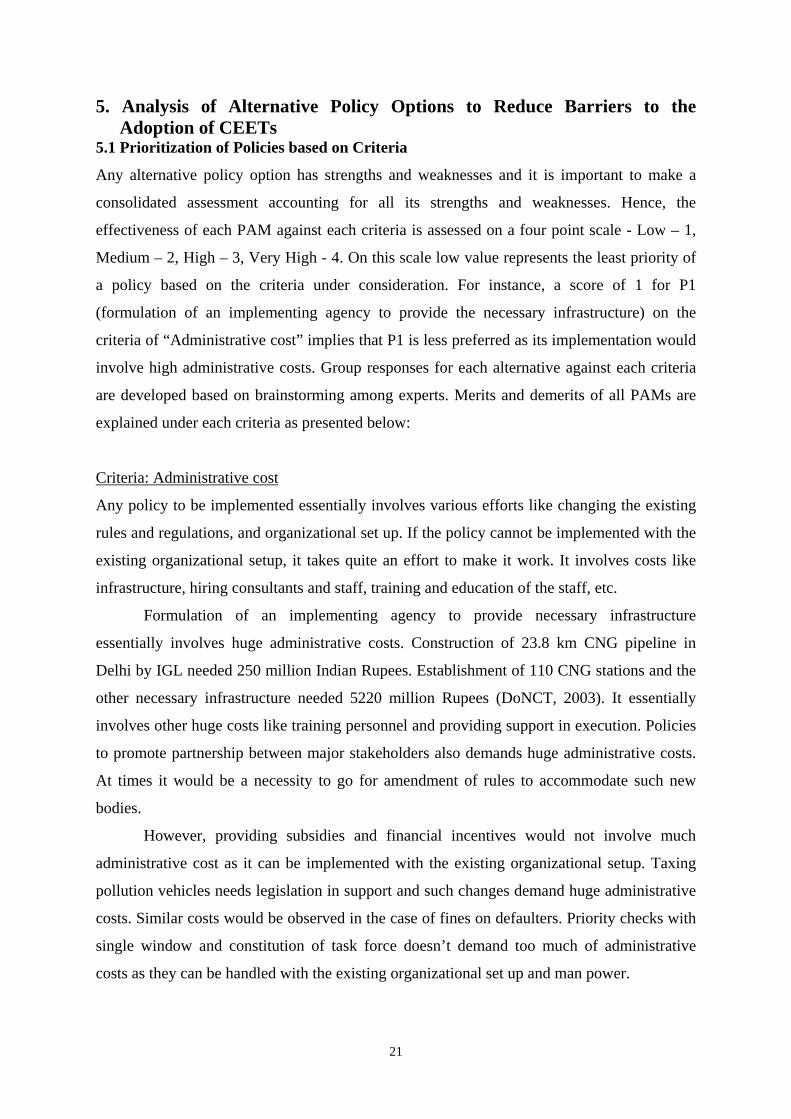
Colour coding schemes, training and awareness programs can be successfully
implemented with the existing system without having many changes. Delhi presents an
interesting illustration of achieving such without any significant additional costs. Time bound
waiver on import duty and regulation to promote AFVs doesn’t involve substantial
administrative costs. The group rating of policies under this criteria is presented below. For
instance, P4 shows better potential to remove barriers compared to P1 when compared on the
basis of “administrative costs” involve in implementing policies as P1 involves high
administrative costs while P4 involves less administrative costs.
P1
1.0
P2
2.0
P3
3.0
P4
3.0
P5
2.0
P6
3.0
P7
3.0
P8
2.0
P9
4.0
P10
2.0
P11
2.0
P12
2.0
Criteria -
Administrative
costs P13
2.0
P14
3.0
P15
3.0
Criteria: Financial burden
Financing the partnership among key stakeholders is not difficult because of the fact that
market takes care of the capital demand. Financiability would not be a problem with such
partnerships in place. Though formulation of implementation body involves substantial
administrative costs, its financiability should be taken care by the shares held by individual
actor.
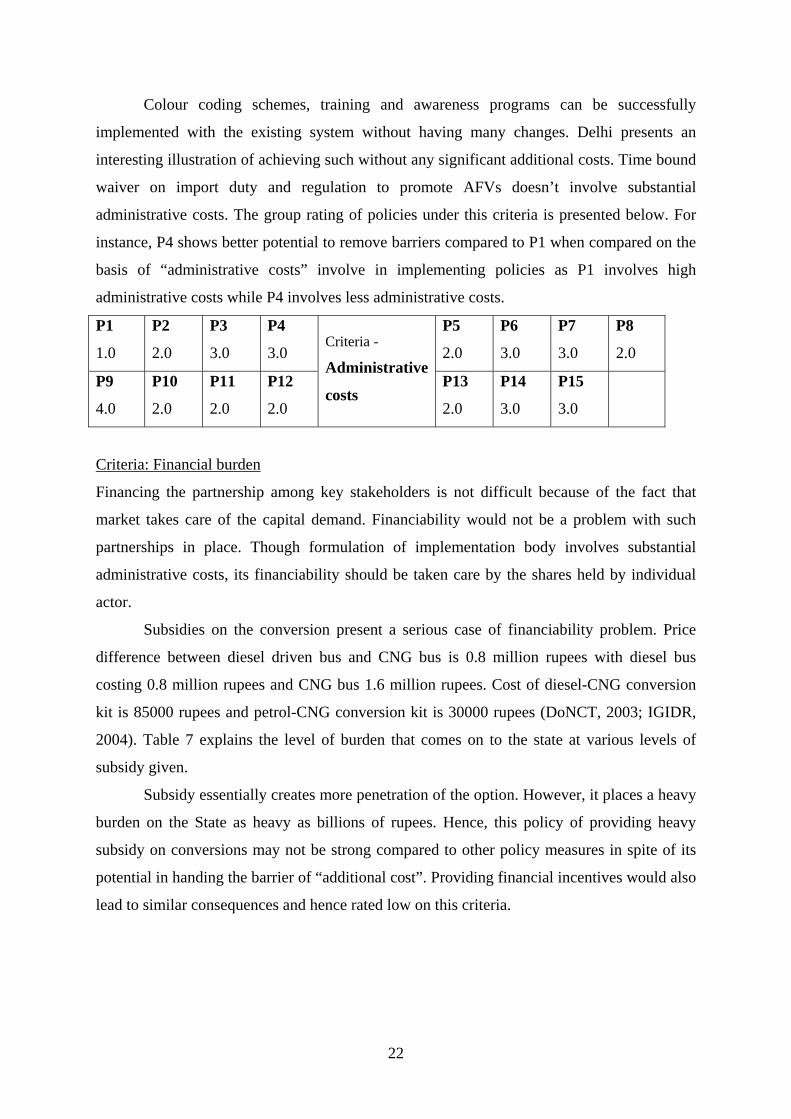
Subsidies on the conversion present a serious case of financiability problem. Price
difference between diesel driven bus and CNG bus is 0.8 million rupees with diesel bus
costing 0.8 million rupees and CNG bus 1.6 million rupees. Cost of diesel-CNG conversion
kit is 85000 rupees and petrol-CNG conversion kit is 30000 rupees (DoNCT, 2003; IGIDR,
2004). Table 7 explains the level of burden that comes on to the state at various levels of
subsidy given.
Subsidy essentially creates more penetration of the option. However, it places a heavy
burden on the State as heavy as billions of rupees. Hence, this policy of providing heavy
subsidy on conversions may not be strong compared to other policy measures in spite of its
potential in handing the barrier of “additional cost”. Providing financial incentives would also
lead to similar consequences and hence rated low on this criteria.
22
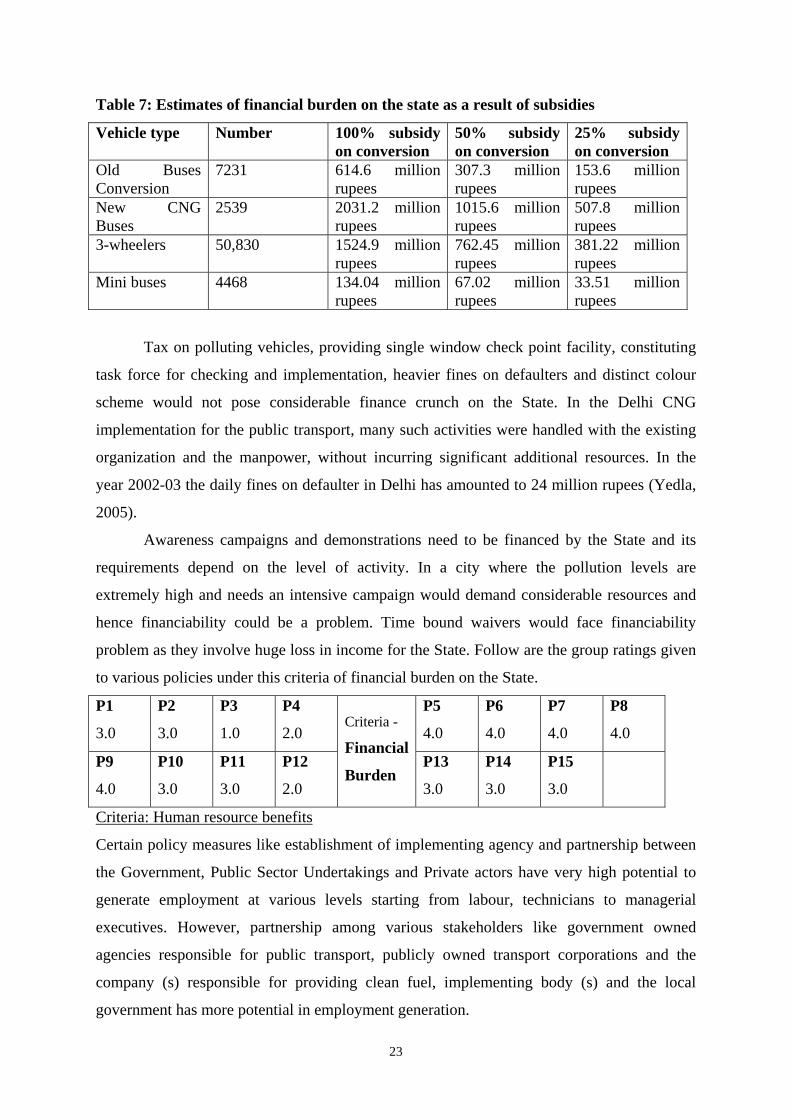
Table 7: Estimates of financial burden on the state as a result of subsidies
Vehicle type Number 100% subsidy on conversion
50% subsidy on conversion
25% subsidy on conversion
Old Buses Conversion
7231 614.6 million rupees
307.3 million rupees
153.6 million rupees
New CNG Buses
2539 2031.2 million rupees
1015.6 million rupees
507.8 million rupees
3-wheelers 50,830 1524.9 million rupees
762.45 million rupees
381.22 million rupees
Mini buses 4468 134.04 million rupees
67.02 million rupees
33.51 million rupees
Tax on polluting vehicles, providing single window check point facility, constituting
task force for checking and implementation, heavier fines on defaulters and distinct colour
scheme would not pose considerable finance crunch on the State. In the Delhi CNG
implementation for the public transport, many such activities were handled with the existing
organization and the manpower, without incurring significant additional resources. In the
year 2002-03 the daily fines on defaulter in Delhi has amounted to 24 million rupees (Yedla,
2005).
Awareness campaigns and demonstrations need to be financed by the State and its
requirements depend on the level of activity. In a city where the pollution levels are
extremely high and needs an intensive campaign would demand considerable resources and
hence financiability could be a problem. Time bound waivers would face financiability
problem as they involve huge loss in income for the State. Follow are the group ratings given
to various policies under this criteria of financial burden on the State.
P1
3.0
P2
3.0
P3
1.0
P4
2.0
P5
4.0
P6
4.0
P7
4.0
P8
4.0
P9
4.0
P10
3.0
P11
3.0
P12
2.0
Criteria -
Financial
Burden P13
3.0
P14
3.0
P15
3.0
Criteria: Human resource benefits
Certain policy measures like establishment of implementing agency and partnership between
the Government, Public Sector Undertakings and Private actors have very high potential to
generate employment at various levels starting from labour, technicians to managerial
executives. However, partnership among various stakeholders like government owned
agencies responsible for public transport, publicly owned transport corporations and the
company (s) responsible for providing clean fuel, implementing body (s) and the local
government has more potential in employment generation.
23
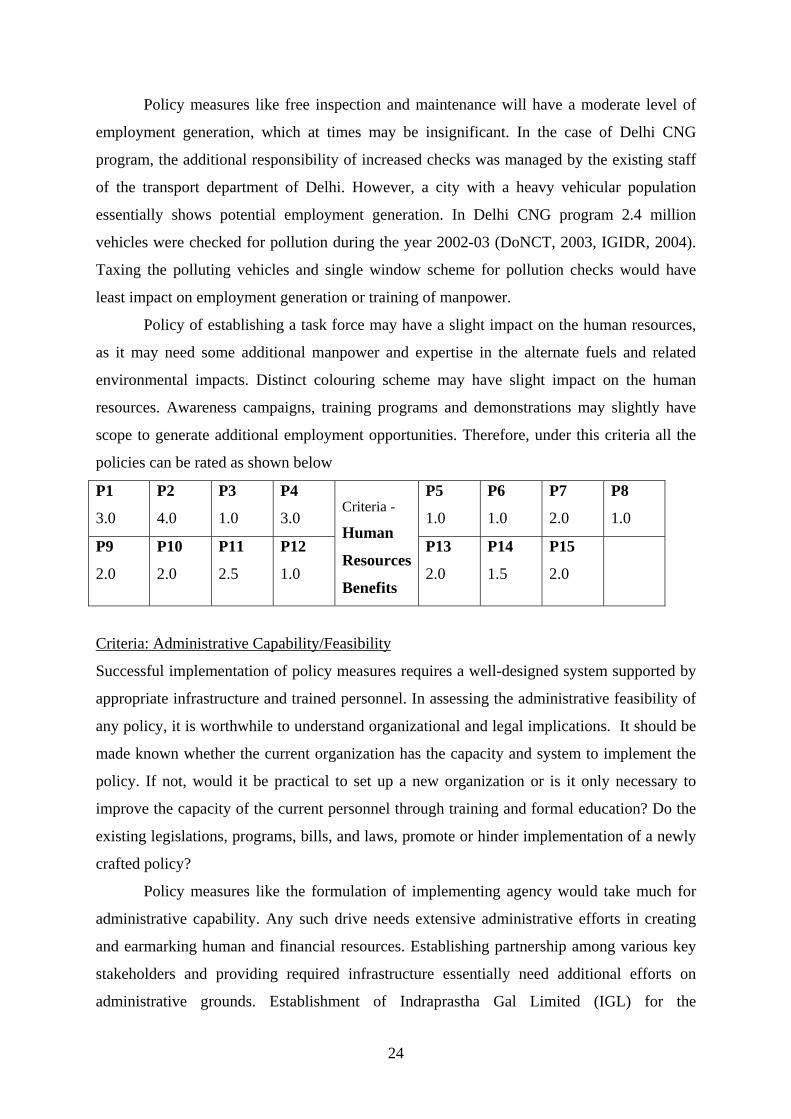
Policy measures like free inspection and maintenance will have a moderate level of
employment generation, which at times may be insignificant. In the case of Delhi CNG
program, the additional responsibility of increased checks was managed by the existing staff
of the transport department of Delhi. However, a city with a heavy vehicular population
essentially shows potential employment generation. In Delhi CNG program 2.4 million
vehicles were checked for pollution during the year 2002-03 (DoNCT, 2003, IGIDR, 2004).
Taxing the polluting vehicles and single window scheme for pollution checks would have
least impact on employment generation or training of manpower.
Policy of establishing a task force may have a slight impact on the human resources,
as it may need some additional manpower and expertise in the alternate fuels and related
environmental impacts. Distinct colouring scheme may have slight impact on the human
resources. Awareness campaigns, training programs and demonstrations may slightly have
scope to generate additional employment opportunities. Therefore, under this criteria all the
policies can be rated as shown below
P1
3.0
P2
4.0
P3
1.0
P4
3.0
P5
1.0
P6
1.0
P7
2.0
P8
1.0
P9
2.0
P10
2.0
P11
2.5
P12
1.0
Criteria -
Human
Resources
Benefits
P13
2.0
P14
1.5
P15
2.0
Criteria: Administrative Capability/Feasibility
Successful implementation of policy measures requires a well-designed system supported by
appropriate infrastructure and trained personnel. In assessing the administrative feasibility of
any policy, it is worthwhile to understand organizational and legal implications. It should be
made known whether the current organization has the capacity and system to implement the
policy. If not, would it be practical to set up a new organization or is it only necessary to
improve the capacity of the current personnel through training and formal education? Do the
existing legislations, programs, bills, and laws, promote or hinder implementation of a newly
crafted policy?
Policy measures like the formulation of implementing agency would take much for
administrative capability. Any such drive needs extensive administrative efforts in creating
and earmarking human and financial resources. Establishing partnership among various key
stakeholders and providing required infrastructure essentially need additional efforts on
administrative grounds. Establishment of Indraprastha Gal Limited (IGL) for the
24
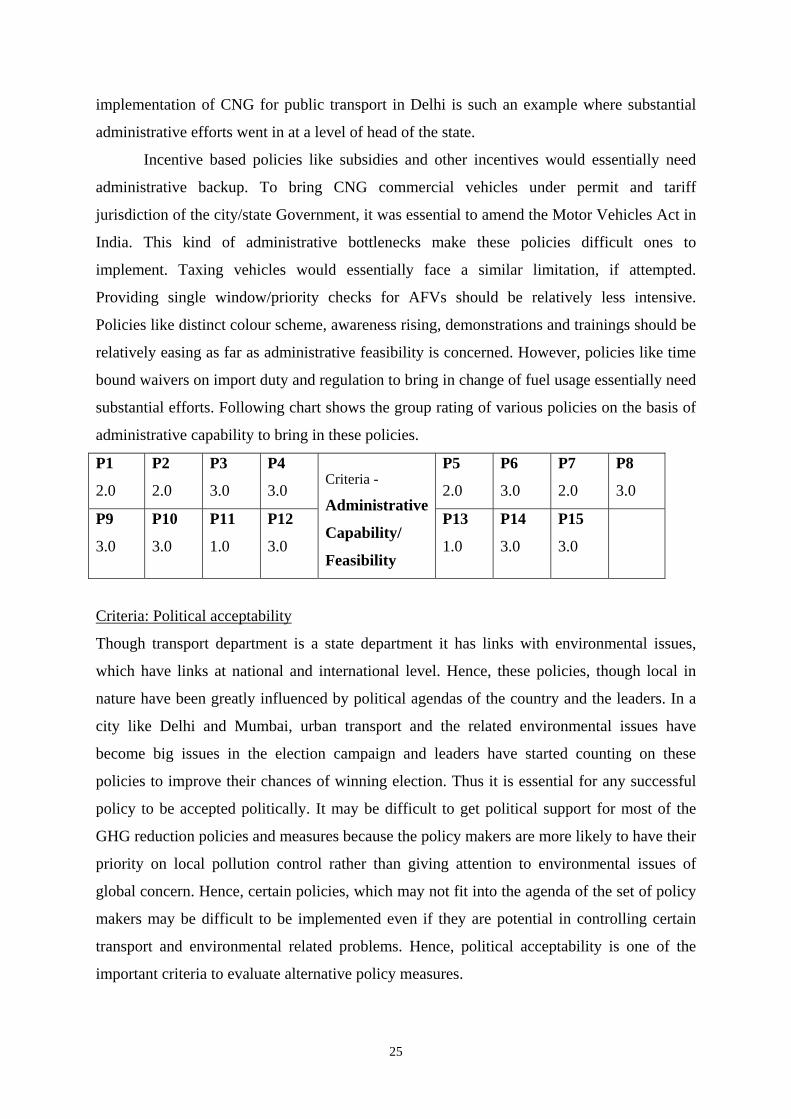
implementation of CNG for public transport in Delhi is such an example where substantial
administrative efforts went in at a level of head of the state.
Incentive based policies like subsidies and other incentives would essentially need
administrative backup. To bring CNG commercial vehicles under permit and tariff
jurisdiction of the city/state Government, it was essential to amend the Motor Vehicles Act in
India. This kind of administrative bottlenecks make these policies difficult ones to
implement. Taxing vehicles would essentially face a similar limitation, if attempted.
Providing single window/priority checks for AFVs should be relatively less intensive.
Policies like distinct colour scheme, awareness rising, demonstrations and trainings should be
relatively easing as far as administrative feasibility is concerned. However, policies like time
bound waivers on import duty and regulation to bring in change of fuel usage essentially need
substantial efforts. Following chart shows the group rating of various policies on the basis of
administrative capability to bring in these policies.
P1
2.0
P2
2.0
P3
3.0
P4
3.0
P5
2.0
P6
3.0
P7
2.0
P8
3.0
P9
3.0
P10
3.0
P11
1.0
P12
3.0
Criteria -
Administrative
Capability/
Feasibility
P13
1.0
P14
3.0
P15
3.0
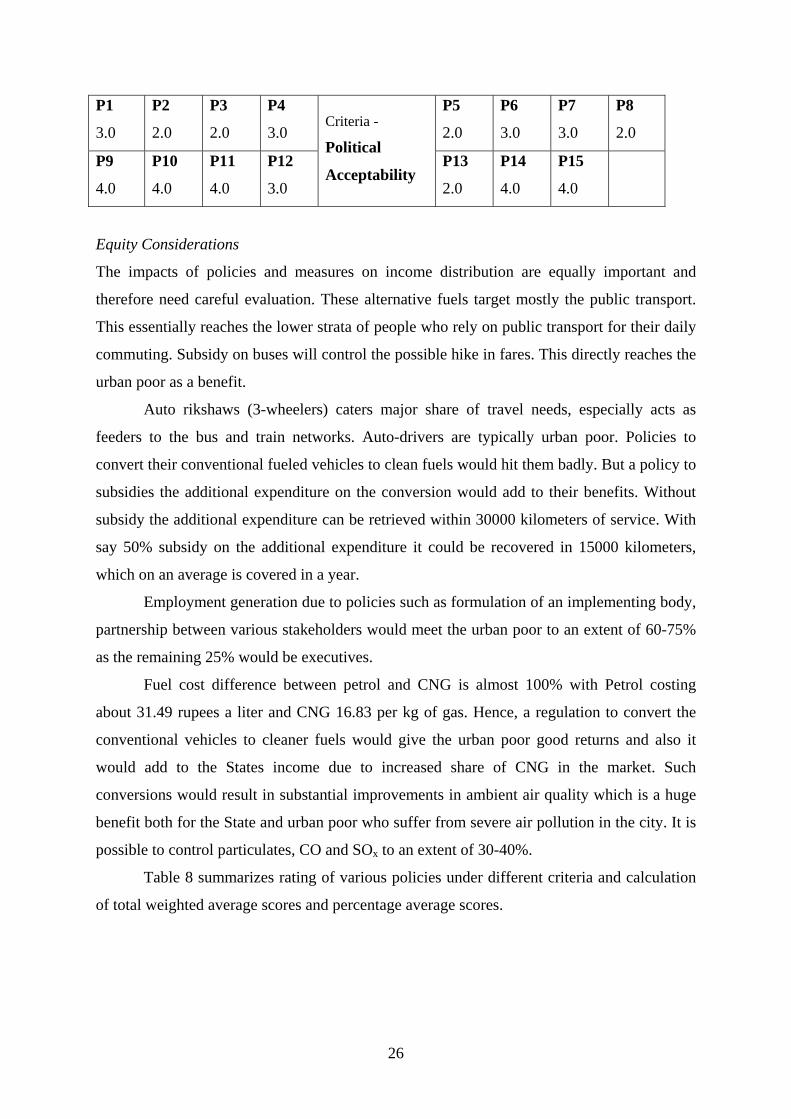
Criteria: Political acceptability
Though transport department is a state department it has links with environmental issues,
which have links at national and international level. Hence, these policies, though local in
nature have been greatly influenced by political agendas of the country and the leaders. In a
city like Delhi and Mumbai, urban transport and the related environmental issues have
become big issues in the election campaign and leaders have started counting on these
policies to improve their chances of winning election. Thus it is essential for any successful
policy to be accepted politically. It may be difficult to get political support for most of the
GHG reduction policies and measures because the policy makers are more likely to have their
priority on local pollution control rather than giving attention to environmental issues of
global concern. Hence, certain policies, which may not fit into the agenda of the set of policy
makers may be difficult to be implemented even if they are potential in controlling certain
transport and environmental related problems. Hence, political acceptability is one of the
important criteria to evaluate alternative policy measures.
25
P1
3.0
P2
2.0
P3
2.0
P4
3.0
P5
2.0
P6
3.0
P7
3.0
P8
2.0
P9
4.0
P10
4.0
P11
4.0
P12
3.0
Criteria -
Political
Acceptability P13
2.0
P14
4.0
P15
4.0
Equity Considerations
The impacts of policies and measures on income distribution are equally important and
therefore need careful evaluation. These alternative fuels target mostly the public transport.
This essentially reaches the lower strata of people who rely on public transport for their daily
commuting. Subsidy on buses will control the possible hike in fares. This directly reaches the
urban poor as a benefit.
Auto rikshaws (3-wheelers) caters major share of travel needs, especially acts as
feeders to the bus and train networks. Auto-drivers are typically urban poor. Policies to
convert their conventional fueled vehicles to clean fuels would hit them badly. But a policy to
subsidies the additional expenditure on the conversion would add to their benefits. Without
subsidy the additional expenditure can be retrieved within 30000 kilometers of service. With
say 50% subsidy on the additional expenditure it could be recovered in 15000 kilometers,
which on an average is covered in a year.
Employment generation due to policies such as formulation of an implementing body,
partnership between various stakeholders would meet the urban poor to an extent of 60-75%
as the remaining 25% would be executives.
Fuel cost difference between petrol and CNG is almost 100% with Petrol costing
about 31.49 rupees a liter and CNG 16.83 per kg of gas. Hence, a regulation to convert the
conventional vehicles to cleaner fuels would give the urban poor good returns and also it
would add to the States income due to increased share of CNG in the market. Such
conversions would result in substantial improvements in ambient air quality which is a huge
benefit both for the State and urban poor who suffer from severe air pollution in the city. It is
possible to control particulates, CO and SOx to an extent of 30-40%.
Table 8 summarizes rating of various policies under different criteria and calculation
of total weighted average scores and percentage average scores.
26

Table 8: Criteria-policy matrix Policy Alternatives Criteria Score
P1 P2 P3 P4 P5 P6 P7 P8
Administrative Cost
0.1 1.0 2.0 3.0 3.0 2.0 3.0 3.0 2.0
Financial Burden 0.2 3.0 3.0 1.0 2.0 4.0 4.0 4.0 4.0 Human Resource Benefits
0.1 3.0 4.0 1.0 3.0 1.0 1.0 2.0 1.0
Administrative Capability
0.3 2.0 2.0 3.0 3.0 2.0 3.0 2.0 3.0
Political Acceptability
0.3 3.0 2.0 2.0 3.0 2.0 3.0 3.0 2.0
Total weighted Average score
1 2.5 2.4 2.1 2.8 2.3 3 2.8 2.6
Percentage total weighted average score
62.50 60 52.50 70.00 57.50 75.00 70.00 65.00
Policy Alternatives Criteria Score P9 P10 P11 P12 P13 P14 P15
Administrative Cost 0.1 4.0 2.0 2.0 2.0 2.0 3.0 3.0 Financial Burden 0.2 4.0 3.0 3.0 2.0 3.0 3.0 3.0 Human Resource Benefits
0.1 2.0 2.0 2.5 1.0 2.0 1.5 2.0
Administrative Capability
0.3 3.0 3.0 1.0 3.0 1.0 3.0 3.0
Political Acceptability
0.3 4.0 4.0 4.0 3.0 2.0 4.0 4.0
Total weighted Average score
1 3.5 3.1 2.55 2.5 1.9 3.15 3.2
Percentage total weighted average score
87.50 77.50 63.75 62.50 47.50 78.75 80.00
Any policy will have its effects on various domains. Hence, it is possible that one
particular policy can influence/remove more than one barrier (barrier to the adoption of
AFVs). Therefore, the potential of policies in removing barrier needs to be assessed based on
not only certain criteria but also their potential to remove more than one barrier. Table 5
presents the set of barriers that each policy alternative and measure (PAM) can affect. The
scores derived based on normalization are applied to the percentage total weighted average
score to determine the final ratings of these PAMs in controlling barriers. Table 9 presents the
final (aggregated) ranking of PAMs against a set of criteria alone and also the overall ranking
with due consideration to their multiple barrier removal capabilities.
27
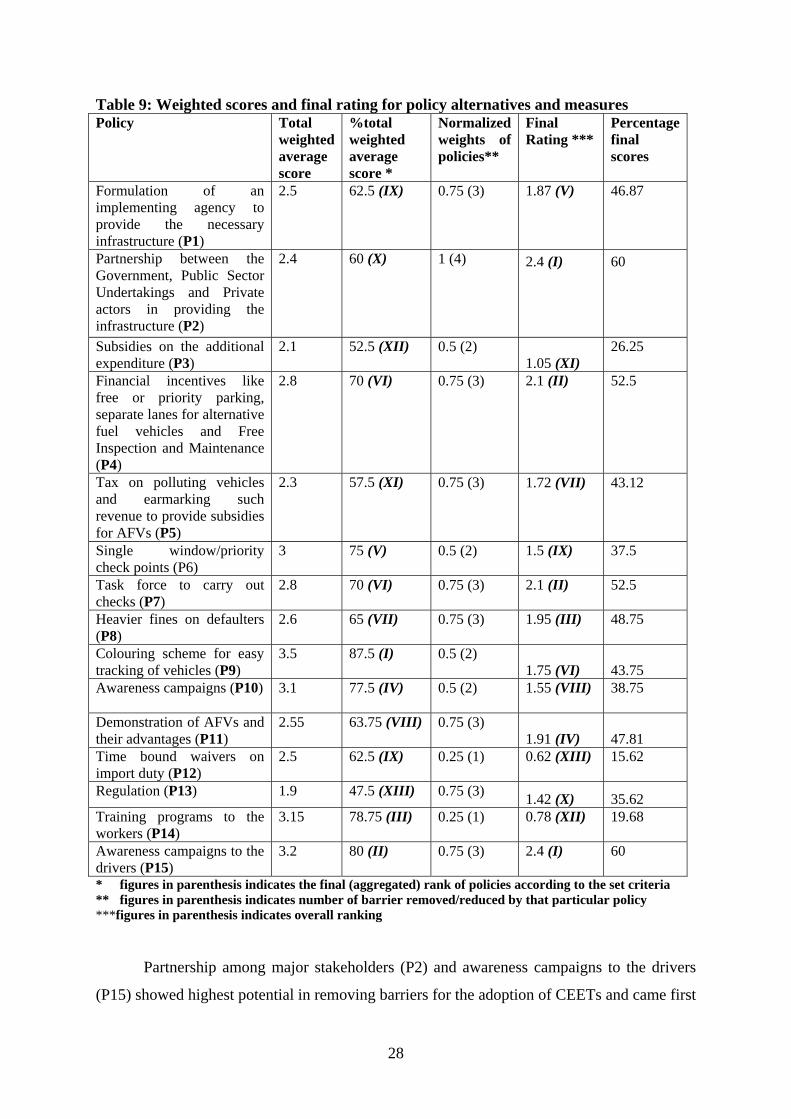
Table 9: Weighted scores and final rating for policy alternatives and measures Policy Total
weighted average score
%total weighted average score *
Normalized weights of policies**
Final Rating ***
Percentage final scores
Formulation of an implementing agency to provide the necessary infrastructure (P1)
2.5 62.5 (IX) 0.75 (3) 1.87 (V)
46.87
Partnership between the Government, Public Sector Undertakings and Private actors in providing the infrastructure (P2)
2.4 60 (X) 1 (4) 2.4 (I)
60
Subsidies on the additional expenditure (P3)
2.1 52.5 (XII) 0.5 (2) 1.05 (XI)
26.25
Financial incentives like free or priority parking, separate lanes for alternative fuel vehicles and Free Inspection and Maintenance (P4)
2.8 70 (VI) 0.75 (3) 2.1 (II)
52.5
Tax on polluting vehicles and earmarking such revenue to provide subsidies for AFVs (P5)
2.3 57.5 (XI) 0.75 (3) 1.72 (VII)
43.12
Single window/priority check points (P6)
3 75 (V) 0.5 (2) 1.5 (IX)
37.5
Task force to carry out checks (P7)
2.8 70 (VI) 0.75 (3) 2.1 (II)
52.5
Heavier fines on defaulters (P8)
2.6 65 (VII) 0.75 (3) 1.95 (III)
48.75
Colouring scheme for easy tracking of vehicles (P9)
3.5 87.5 (I) 0.5 (2) 1.75 (VI) 43.75
Awareness campaigns (P10) 3.1 77.5 (IV) 0.5 (2) 1.55 (VIII)
38.75
Demonstration of AFVs and their advantages (P11)
2.55 63.75 (VIII) 0.75 (3) 1.91 (IV) 47.81
Time bound waivers on import duty (P12)
2.5 62.5 (IX) 0.25 (1) 0.62 (XIII)
15.62
Regulation (P13) 1.9 47.5 (XIII) 0.75 (3) 1.42 (X) 35.62 Training programs to the workers (P14)
3.15 78.75 (III) 0.25 (1) 0.78 (XII)
19.68
Awareness campaigns to the drivers (P15)
3.2 80 (II) 0.75 (3) 2.4 (I)
60
* figures in parenthesis indicates the final (aggregated) rank of policies according to the set criteria ** figures in parenthesis indicates number of barrier removed/reduced by that particular policy ***figures in parenthesis indicates overall ranking
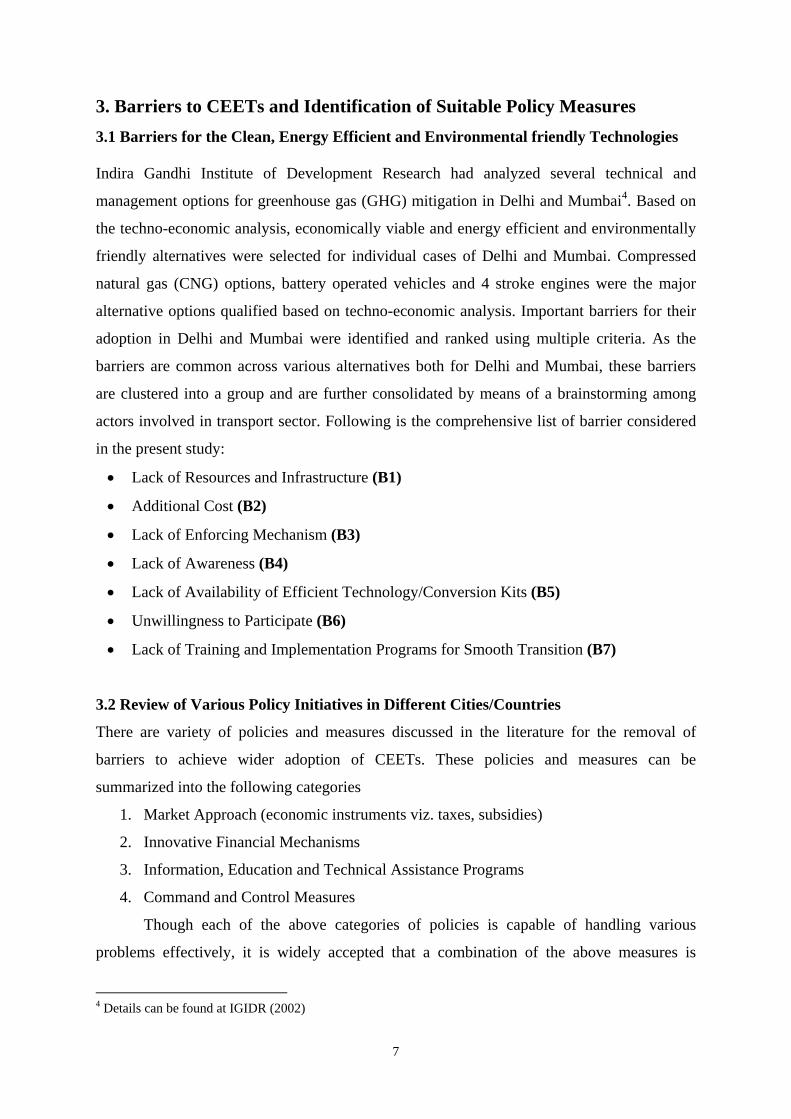
Partnership among major stakeholders (P2) and awareness campaigns to the drivers
(P15) showed highest potential in removing barriers for the adoption of CEETs and came first
28
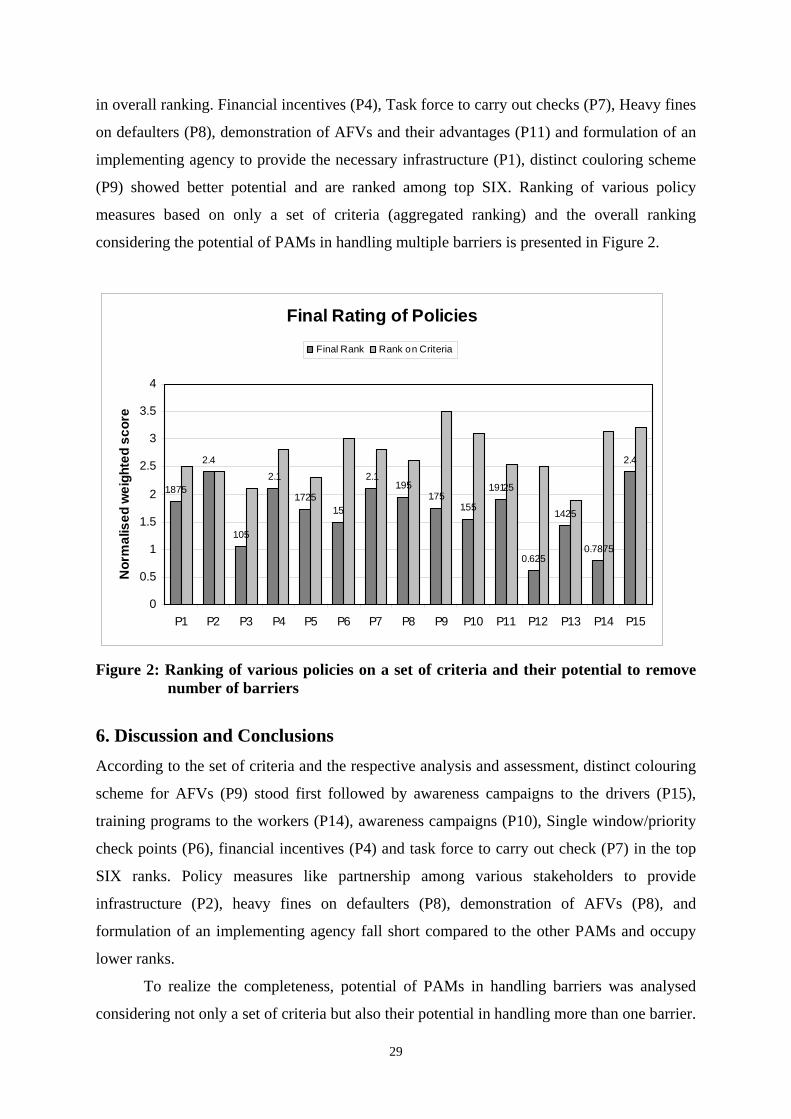
in overall ranking. Financial incentives (P4), Task force to carry out checks (P7), Heavy fines
on defaulters (P8), demonstration of AFVs and their advantages (P11) and formulation of an
implementing agency to provide the necessary infrastructure (P1), distinct couloring scheme
(P9) showed better potential and are ranked among top SIX. Ranking of various policy
measures based on only a set of criteria (aggregated ranking) and the overall ranking
considering the potential of PAMs in handling multiple barriers is presented in Figure 2.
Final Rating of Policies
1.875
2.4
1.05
2.1
1.7251.5
2.11.95
1.751.55
1.9125
0.625
1.425
0.7875
2.4
0
0.5
1
1.5
2
2.5
3
3.5
4
P1 P2 P3 P4 P5 P6 P7 P8 P9 P10 P11 P12 P13 P14 P15
Nor
mal
ised
wei
ghte
d sc
ore
Final Rank Rank on Criteria
Figure 2: Ranking of various policies on a set of criteria and their potential to remove
number of barriers
6. Discussion and Conclusions According to the set of criteria and the respective analysis and assessment, distinct colouring
scheme for AFVs (P9) stood first followed by awareness campaigns to the drivers (P15),
training programs to the workers (P14), awareness campaigns (P10), Single window/priority
check points (P6), financial incentives (P4) and task force to carry out check (P7) in the top
SIX ranks. Policy measures like partnership among various stakeholders to provide
infrastructure (P2), heavy fines on defaulters (P8), demonstration of AFVs (P8), and
formulation of an implementing agency fall short compared to the other PAMs and occupy
lower ranks.
To realize the completeness, potential of PAMs in handling barriers was analysed
considering not only a set of criteria but also their potential in handling more than one barrier.
29
Ranking on this criteria has substantial changes. Partnership among major stakeholders (P2)
and awareness campaigns to the drivers (P15) showed highest potential in removing barriers
for the adoption of CEETs and ranked first in the final ranking. Financial incentives (P4),
Task force to carry out checks (P7), Heavy fines on defaulters (P8), demonstration of AFVs
and their advantages (P11) and formulation of an implementing agency to provide the
necessary infrastructure (P1), distinct couloring scheme (P9) showed better potential and
ranking among top SIX.
It is interesting to see that the policy to have partnership among stakeholders to
provide better infrastructure could get only 10th rank based on a set of criteria but with its
potential to handle many barriers it could TOP the overall rankings. The top ranked PAM
based on a set of criteria, colour coding (P9) slipped to P6 when it’s potential to handling
more than one barrier. Policy of imposing heavy fines on defaulters also has its rank shifted
based on the criteria. However, financial incentives (P4), task force to carry out checks (P7),
colour coding (P9) and awareness campaigns to the drivers (P15) were ranked high under
both the criteria, which testimonies their potential in removing barriers. Hence the following
PAMs can be considered, based on both patterns of ranking, as potential PAMs for the
removal of barriers to CEETs (seven out of fifteen PAMs):
• Partnership between the Government, Public Sector Undertakings and Private actors
in proving better infrastructure (P2)
• Financial incentives like free or priority parking, separate lanes for alternative fuel
vehicles and free inspection and maintenance (P4)
• Task force to carry our checks (P7)
• Heavy fines on defaulters (P8)
• Distinct colour coding for AFVs (P9)
• Demonstration of AFVs and their advantages (P11)
• Awareness campaigns to drivers (P15)
Choosing one or combination of PAMs would only help in reducing certain barriers.
However, the above set of PAMs would be able to control all seven pre-identified barriers to
the adoption of CEETs in Delhi and Mumbai urban transportation systems.
30
References CPCB, 1999, Parivesh, 6(1), Central Pollution Control Board, Ministry of Environment and Forests, Government of India, New Delhi. Dass, C., 1999, Moving people of Delhi: Problems and Solutions, Habitat Concerns, No.2, India Habitat Centre, New Delhi. GoNCT (Government of National Capital Territory of Delhi), 2003, Cleaner, Greener Naturally, New Delhi, India IEA (International Energy Agency), 2000, The road from Kyoto. Current CO2 and Transport Policies in the IEA, Paris. Imura, H., Yedla, S., Memon, M.M., Shirakawa, H., 2005, Urban Environmental Issues and Trends in Asia: An Overview, Vol. 5, No.2, International Review of Environmental Strategies, IGES, Japan IGIDR (Indira Gandhi Institute of Development Research) (2002), Analysis of technological options for mitigating environmental emissions from the urban transport system in selected Asian cities, Report submitted to AIT under ARRPEEC, Thailand IGIDR (Indira Gandhi Institute of Development Research) (2004), Measures to Overcome Barriers for Wider Adoption of Cleaner and Energy Efficient Technologies in Delhi and Mumbai Transport Systems, Report submitted to AIT under ARRPEEC, Thailand Ramanathan, R., 1999, Urban transportation. In India Development Report 1999-2000, ed. K. S. Parikh., India: Oxford University Press. Sreedharan, E., 1999, Moving people: Role of MRTS, Habitat Concerns, No.2, India Habitat Centre, New Delhi. UNEP, 1999, Environmental Impacts of Trade Liberalization and Policies for Sustainable Management of Natural Resources: A case study on India's automobile sector, United Nations, New York. UNESCAP (2001), Review of Development in Transport and Communication in the ESCAP region 1996-2001, UNESCAP, Bangkok. World Bank (1997), Urban Air Quality Management Strategy in Asia, Greater Mumbai Report, World Bank Technical Paper No. 381, The World Bank, Washington. Yedla, S., Shrestha, R.M. (2003), Multi-criteria Approach for the Selection of Alternative Options for Delhi Transport System, Transport Research, Part A – Policy and Practice, Vol. 37 (8), pp: 717 – 729. Yedla, S, 2005, Urban transportation trends, alternatives and policy issues. In India Development Report 2004-2005, ed. K. S. Parikh and R. Radhakrishna, India: Oxford University Press.
31
Appendix A Actors groups from transport sector participated in personal interview and brain storming sessions
• Environmental and Economics Experts from Various Institutions/Universities • National and International Policy Research Experts • Development Research Experts • Transportation Experts and Planners • Local policy makers and implementers (Transport Commissioner) • Pollution Control Boards • Researchers from Urban Transport and Environmental Linkages • Central Road and Transport Research Institute Representatives • Automobile Research Institute Representatives • Air Pollution Experts from National Laboratories (NEERI) • Executive Bodies for Implementing CNG Initiatives in India • CNG Providers • Users of different modes of transport under consideration for the present study
32