Embed Size (px)
Citation preview
VIE
WPO
INTS
RESE
ARC
H T
HE
ME
4: H
EA
LTH
TR
AN
SITI
ON
S IN
CH
INA
www.jogh.org • doi: 10.7189/jogh.11.08006 1 2021 • Vol. 11 • 08006
Yi Tang1,2*, Aiming Chen3*, Minjie Zou1*, Zhenzhen Liu1, Charlotte Aimee Young4, Danying Zheng1, Guangming
Jin1
1 State Key Laboratory of Ophthalmology, Zhongshan Ophthalmic Center, Sun Yat-Sen University, Guangzhou, China
2 Zhongshan School of Medicine, Sun Yat-sen University, Guangzhou, China
3 Department of Pharmacy, The Fifth Affiliated Hospital of Sun Yat-Sen University, Zhuhai, China
4 Nanchang Eye Hospital, Third Affiliated Hospital of Nanchang University, Nanchang, China
*Joint first authors.
Correspondence to:Guangming Jin State Key Laboratory of Ophthalmology Zhongshan Ophthalmic Center Sun Yat-sen University #54 Xianlie South Road Guangzhou China, 510060 [email protected]
Danying Zheng State Key Laboratory of Ophthalmology Zhongshan Ophthalmic Center Sun Yat-sen University #54 Xianlie South Road Guangzhou China, 510060 [email protected]
Prevalence and time trends of refractive error in Chinese children: A systematic review and meta-analysis
Electronic supplementary material: The online version of this article contains supplementary material.
© 2021 The Author(s)JoGH © 2021 ISoGH
Background To investigate the prevalence and time trends of refractive error (RE) among Chinese children under 18 years old.
Methods PubMed, Embase, Web of Science were searched for articles that es-timated prevalence of RE in Chinese children. Data of identified eligible studies was extracted by two investigators independently. Pooled prevalence of RE and its 95% confidence interval (95% CI) and the time trends of RE were investi-gated using Meta-analysis methods.
Results Of the 41 studies covering 1 051 784 subjects, the pooled prevalence of myopia, high myopia, hyperopia and astigmatism in Chinese children was 38.0% (95% confidence interval (CI) = 35.1%-41.1%), 2.8% (95% CI = 2.3%-3.4%), 5.2% (95% CI = 3.1%-8.6%) and 16.5% (95% CI = 12.3%-21.8%), re-spectively. Subgroup analysis show that children living in urban were at higher risk of RE. Prevalence of myopia and hyperopia were higher in Northern China compared with Southern China and high myopia and astigmatism were higher in Hong Kong, Macau and Taiwan than in mainland China. Regression analysis showed an upward trend in myopia and hyperopia and a downward trend in high myopia and astigmatism with years.
Conclusions The prevalence of RE is higher in urban areas than in rural for Chinese children. The much higher prevalence of myopia and astigmatism in China compared with foreign countries indicates the important role played by environment and genetic factors. Considering the large magnitude of refractive errors, much more attention should still be paid to RE prevention and treatment strategy development in China.
Cite as: Tang Y, Chen A, Zou M, Liu Z, Xoung CA, Zheng D, Jin G. Prevalence and time trends of re-fractive error in Chinese children: A systematic review and meta-analysis. J Glob Health 2021;11:08006.
Refractive error (RE) has been one of the most common eye disorders among chil-dren and adolescents and one of the major public health concerns in the world. It has been reported that 42% of visual impairments are caused by RE globally [1]. RE have profound effects on children, for not only will it increase the possibility of pathologic ocular changes such as myopic macular degeneration and retinal detach-ment, which could lead to irreversible blindness, but it also has a great impact on psychosocial well-being for children, which can limit their educational outcomes and educational opportunities [2-4].
In East Asia, the high prevalence of RE has been a major public health concern. For urban areas of these countries, about 80% of the adolescents in high school are myopic, while 10%-20% of them suffer from high myopia [5]. Also, it is reported that the prevalence of hyperopia and astigmatism in Asian children was 4.6% and
Tang et al.V
IEW
POIN
TSRE
SEA
RCH
TH
EM
E 4
: HE
ALT
H
TRA
NSI
TIO
NS
IN C
HIN
A
2021 • Vol. 11 • 08006 2 www.jogh.org • doi: 10.7189/jogh.11.08006
14.9% respectively [6]. Moreover, striking evidence suggests a growing trend of RE prevalence especially among young East Asians [7,8]. It is expected that by 2050, 4758 million people will be myopic and 938 million peo-ple will suffer from high myopia globally [9]. China, the most populous country in the world that accounting for one fifth of world population, has had a high prevalence of RE during the past decades and possessing a large number of RE patients [6-8,10].
Considering the impact of RE and its high prevalence, it is undeniable that there is great value in further under-standing the epidemiology of RE for the purposes of policy making. Particularly, policy of myopia prevention and control has been a hotspot in the field of public health since the rapid rise of prevalence of myopia in China. Although numerous population-based or school-based studies and meta-analysis have been performed to evalu-ate the prevalence of RE in China, most of them focus on myopia and high myopia [10-13], which does not shed light on the magnitude and time trend of total RE, especially hyperopia and astigmatism, among the young Chi-nese population and there is a lack of study reporting the epidemiologic characteristics of RE as a whole.
Considering an overall estimate of the magnitude and its time trends of RE is important for RE prevent and con-trol, we performed this meta-analysis and comprehensive systematic review to evaluate the prevalence of refrac-tive errors, time trends, and its sub-classifications among children in China, which might provide useful infor-mation for appropriate preventive strategies to reduce the disease burden caused by SE in China and beyond.
METHODS
Search strategy
The protocol of the meta-analysis was registered in PROSPERO website (University of York, United Kingdom) with a registration number of CRD42020197708. In order to extract articles providing prevalence data of re-fractive errors in Chinese children, bibliographic databases including PubMed, EMBASE, and Web of Science were searched with different combinations of words including
1. Population: “China”, “Chinese”, “Taiwan”, “Macau”, “Macao”, “Hong Kong”
2. Outcome: “refractive errors”, “myopia”, “astigmatism”, “hyperopia”
3. Study design: “Prevalence”, “Epidemiology”, “epidemiology”, “prevalence”, “incidence”
The search was conducted by two investigators (TY, ZMJ) independently with the final search date of July 28, 2019.
Study selection
After the search, 4240 articles were identified. 1641 duplicate articles were removed. The selection was con-ducted by two investigators independently with the following criteria:
The inclusion criteria were as follows: 1) school-based studies or population-based studies with clearly de-fined sampling strategies; 2) studies reporting the prevalence of refractive errors in Chinese children younger than 18 years old; 3) studies with a clear definition of refractive errors; 4) sample size of at least 1000 subjects. Studies with sample size less than 1000 were excluded because it’s age-defined subgroups would be too small for a reliable assessment of the prevalence of refractive errors.
The exclusion criteria were as follows: 1) hospital-based or clinical-based surveys; 2) conducted only in a sin-gle school; 3) using visual acuity as the measurement for refractive errors; 4) missing or incomplete data; 5) obvious limitations in their statistical analysis or design; 6) different studies based on the same population without providing additional information.
Data extraction
The searches were limited to English language literature only. After the selection procedure, 41 articles that met the inclusion criteria were carefully reviewed by two investigators (TY, ZMJ). The extracted data of these articles are listed as follows:
1) Characteristics of the study: author, study year, design of study, refraction with or without mydriatics.
2) Characteristics of the studied population: sample size, age range, district and region (urban or rural) of the sample, percentage of female subjects.
3) Prevalence data: definition and prevalence of refractive errors.
Prevalence and time trends of refractive error in Chinese children
VIE
WPO
INTS
RESE
ARC
H T
HE
ME
4: H
EA
LTH
TR
AN
SITI
ON
S IN
CH
INA
www.jogh.org • doi: 10.7189/jogh.11.08006 3 2021 • Vol. 11 • 08006
Statistical analysis
Pooled prevalence of refractive error and its 95% confidence interval (95% CI) was estimated. Subgroup anal-yses were conducted for potential difference in region and study year. The I-square test was performed to es-timate the heterogeneity of the included studies (<50% indicates low heterogeneity, and >50% presents high degree of heterogeneity). When the I-square test suggested a high degree of heterogeneity, a random effect model was used, otherwise a fixed effect model was used.[10] To access the publication bias of these studies, Egger’s tests and Begg’s tests were performed and the significance level was set at P < 0.05 (2-tailed). Funnel plots were also performed for publication bias when more than 10 studies were involved in the meta-analy-sis. Sensitivity analysis of studies included in myopia, high myopia, hyperopia, astigmatism were conducted. Time trends of refractive errors were also investigated by meta regression. This meta-analysis was performed with the Comprehensive Meta-Analysis Software V.2 (Biostat, Englewood, New Jersey, USA).
RESULTS
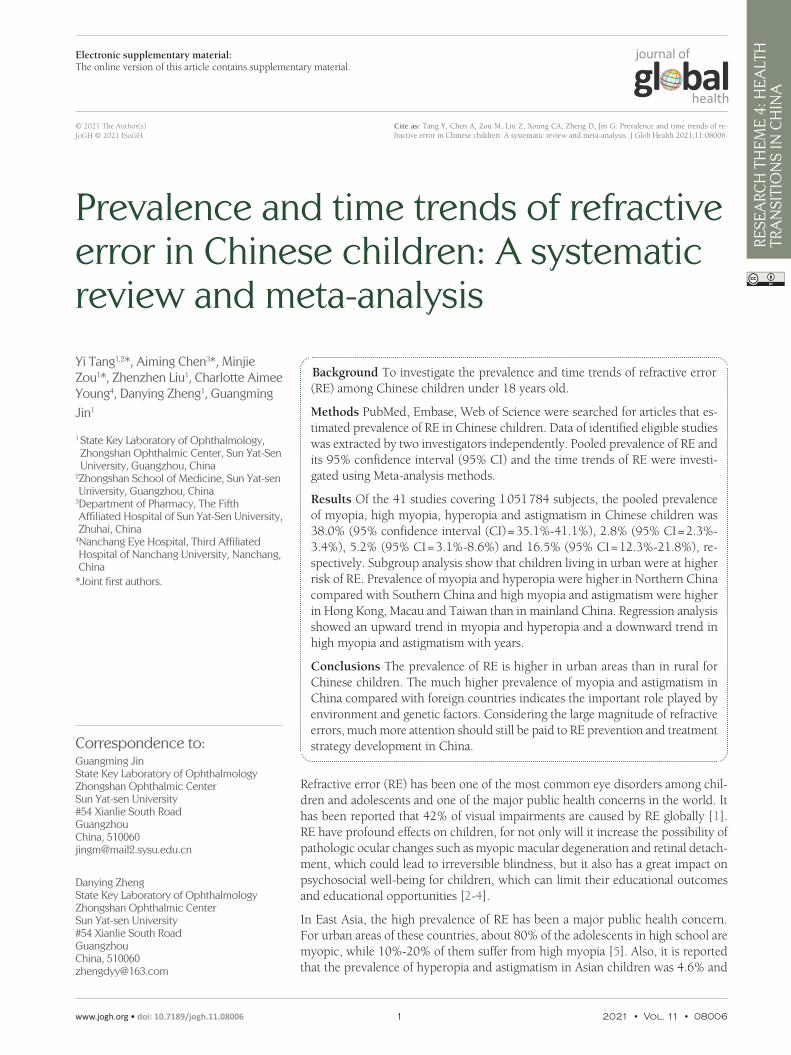
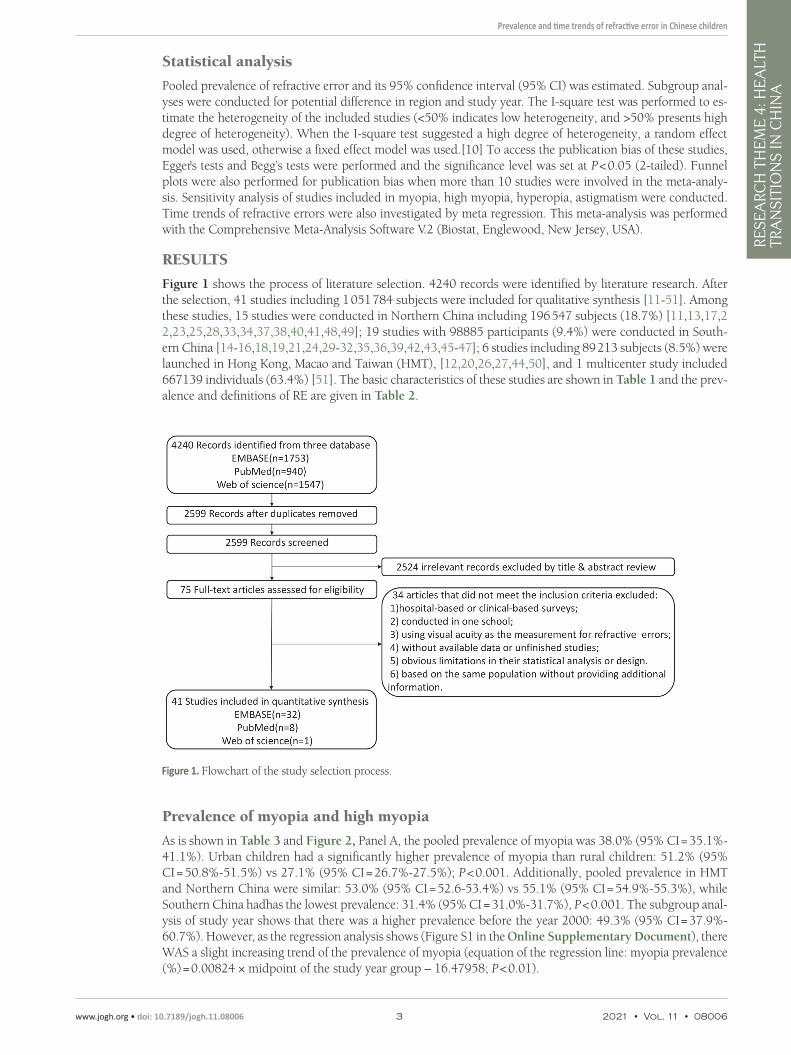
Figure 1 shows the process of literature selection. 4240 records were identified by literature research. After the selection, 41 studies including 1 051 784 subjects were included for qualitative synthesis [11-51]. Among these studies, 15 studies were conducted in Northern China including 196 547 subjects (18.7%) [11,13,17,22,23,25,28,33,34,37,38,40,41,48,49]; 19 studies with 98885 participants (9.4%) were conducted in South-ern China [14-16,18,19,21,24,29-32,35,36,39,42,43,45-47]; 6 studies including 89 213 subjects (8.5%) were launched in Hong Kong, Macao and Taiwan (HMT), [12,20,26,27,44,50], and 1 multicenter study included 667139 individuals (63.4%) [51]. The basic characteristics of these studies are shown in Table 1 and the prev-alence and definitions of RE are given in Table 2.
Figure 1. Flowchart of the study selection process.
Prevalence of myopia and high myopia
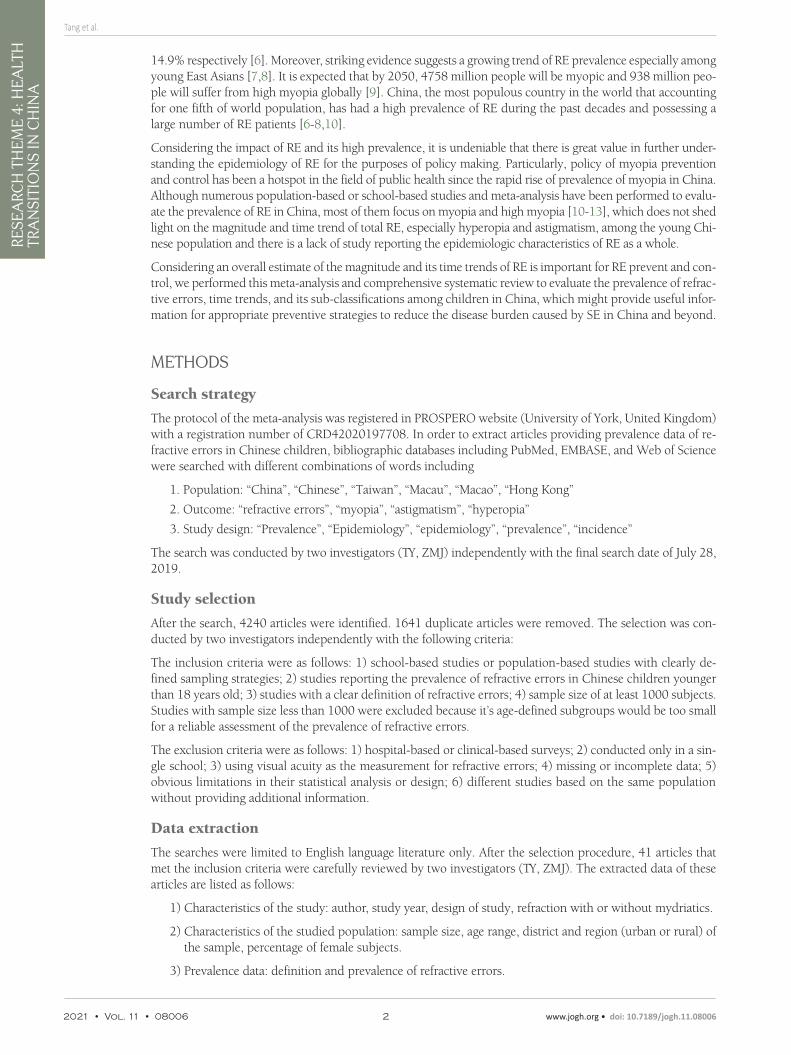
As is shown in Table 3 and Figure 2, Panel A, the pooled prevalence of myopia was 38.0% (95% CI = 35.1%-41.1%). Urban children had a significantly higher prevalence of myopia than rural children: 51.2% (95% CI = 50.8%-51.5%) vs 27.1% (95% CI = 26.7%-27.5%); P < 0.001. Additionally, pooled prevalence in HMT and Northern China were similar: 53.0% (95% CI = 52.6-53.4%) vs 55.1% (95% CI = 54.9%-55.3%), while Southern China hadhas the lowest prevalence: 31.4% (95% CI = 31.0%-31.7%), P < 0.001. The subgroup anal-ysis of study year shows that there was a higher prevalence before the year 2000: 49.3% (95% CI = 37.9%-60.7%). However, as the regression analysis shows (Figure S1 in the Online Supplementary Document), there WAS a slight increasing trend of the prevalence of myopia (equation of the regression line: myopia prevalence (%) = 0.00824 × midpoint of the study year group – 16.47958; P < 0.01).
Tang et al.V
IEW
POIN
TSRE
SEA
RCH
TH
EM
E 4
: HE
ALT
H
TRA
NSI
TIO
NS
IN C
HIN
A
2021 • Vol. 11 • 08006 4 www.jogh.org • doi: 10.7189/jogh.11.08006
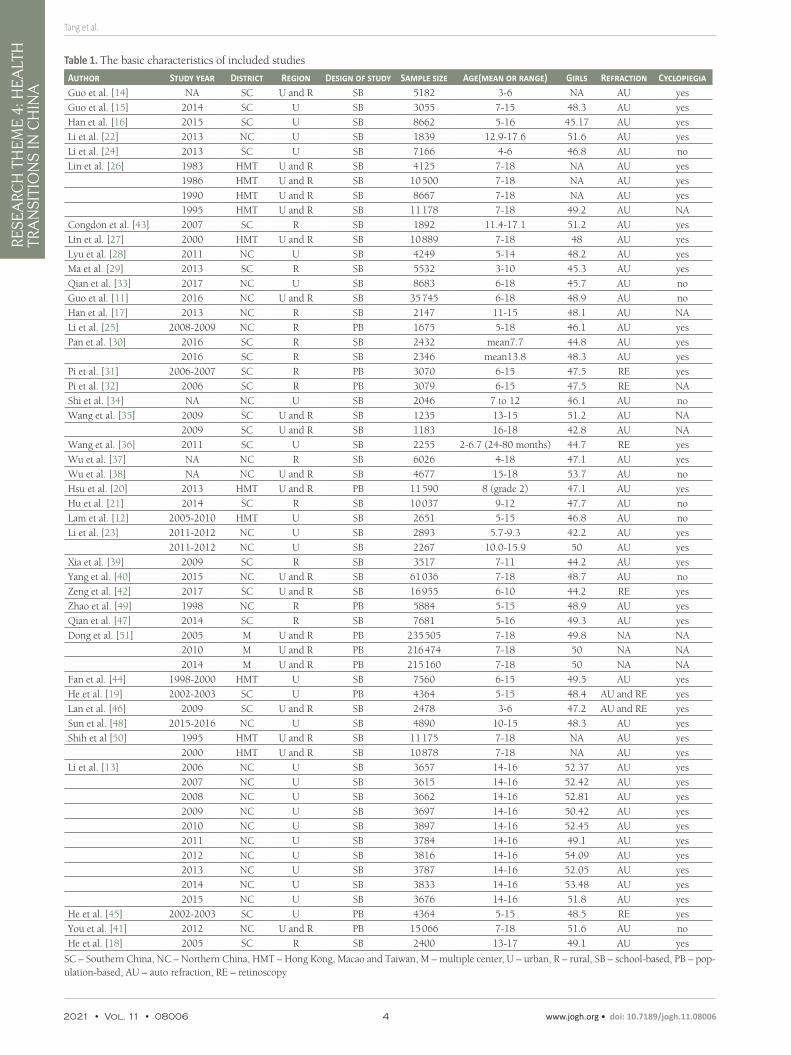
Table 1. The basic characteristics of included studies
Author Study year District Region Design of study Sample size Age(mean or range) Girls Refraction CyclopiegiaGuo et al. [14] NA SC U and R SB 5182 3-6 NA AU yesGuo et al. [15] 2014 SC U SB 3055 7-15 48.3 AU yesHan et al. [16] 2015 SC U SB 8662 5-16 45.17 AU yesLi et al. [22] 2013 NC U SB 1839 12.9-17.6 51.6 AU yesLi et al. [24] 2013 SC U SB 7166 4-6 46.8 AU noLin et al. [26] 1983 HMT U and R SB 4125 7-18 NA AU yes
1986 HMT U and R SB 10 500 7-18 NA AU yes1990 HMT U and R SB 8667 7-18 NA AU yes1995 HMT U and R SB 11 178 7-18 49.2 AU NA
Congdon et al. [43] 2007 SC R SB 1892 11.4-17.1 51.2 AU yesLin et al. [27] 2000 HMT U and R SB 10 889 7-18 48 AU yesLyu et al. [28] 2011 NC U SB 4249 5-14 48.2 AU yesMa et al. [29] 2013 SC R SB 5532 3-10 45.3 AU yesQian et al. [33] 2017 NC U SB 8683 6-18 45.7 AU noGuo et al. [11] 2016 NC U and R SB 35 745 6-18 48.9 AU noHan et al. [17] 2013 NC R SB 2147 11-15 48.1 AU NALi et al. [25] 2008-2009 NC R PB 1675 5-18 46.1 AU yesPan et al. [30] 2016 SC R SB 2432 mean7.7 44.8 AU yes
2016 SC R SB 2346 mean13.8 48.3 AU yesPi et al. [31] 2006-2007 SC R PB 3070 6-15 47.5 RE yesPi et al. [32] 2006 SC R PB 3079 6-15 47.5 RE NAShi et al. [34] NA NC U SB 2046 7 to 12 46.1 AU noWang et al. [35] 2009 SC U and R SB 1235 13-15 51.2 AU NA
2009 SC U and R SB 1183 16-18 42.8 AU NAWang et al. [36] 2011 SC U SB 2255 2-6.7 (24-80 months) 44.7 RE yesWu et al. [37] NA NC R SB 6026 4-18 47.1 AU yesWu et al. [38] NA NC U and R SB 4677 15-18 53.7 AU noHsu et al. [20] 2013 HMT U and R PB 11 590 8 (grade 2) 47.1 AU yesHu et al. [21] 2014 SC R SB 10 037 9-12 47.7 AU noLam et al. [12] 2005-2010 HMT U SB 2651 5-15 46.8 AU noLi et al. [23] 2011-2012 NC U SB 2893 5.7-9.3 42.2 AU yes
2011-2012 NC U SB 2267 10.0-15.9 50 AU yesXia et al. [39] 2009 SC R SB 3517 7-11 44.2 AU yesYang et al. [40] 2015 NC U and R SB 61 036 7-18 48.7 AU noZeng et al. [42] 2017 SC U and R SB 16 955 6-10 44.2 RE yesZhao et al. [49] 1998 NC R PB 5884 5-15 48.9 AU yesQian et al. [47] 2014 SC R SB 7681 5-16 49.3 AU yesDong et al. [51] 2005 M U and R PB 235 505 7-18 49.8 NA NA
2010 M U and R PB 216 474 7-18 50 NA NA2014 M U and R PB 215 160 7-18 50 NA NA
Fan et al. [44] 1998-2000 HMT U SB 7560 6-15 49.5 AU yesHe et al. [19] 2002-2003 SC U PB 4364 5-15 48.4 AU and RE yesLan et al. [46] 2009 SC U and R SB 2478 3-6 47.2 AU and RE yesSun et al. [48] 2015-2016 NC U SB 4890 10-15 48.3 AU yesShih et al [50] 1995 HMT U and R SB 11 175 7-18 NA AU yes
2000 HMT U and R SB 10 878 7-18 NA AU yesLi et al. [13] 2006 NC U SB 3657 14-16 52.37 AU yes
2007 NC U SB 3615 14-16 52.42 AU yes2008 NC U SB 3662 14-16 52.81 AU yes2009 NC U SB 3697 14-16 50.42 AU yes2010 NC U SB 3897 14-16 52.45 AU yes2011 NC U SB 3784 14-16 49.1 AU yes2012 NC U SB 3816 14-16 54.09 AU yes2013 NC U SB 3787 14-16 52.05 AU yes2014 NC U SB 3833 14-16 53.48 AU yes2015 NC U SB 3676 14-16 51.8 AU yes
He et al. [45] 2002-2003 SC U PB 4364 5-15 48.5 RE yesYou et al. [41] 2012 NC U and R PB 15 066 7-18 51.6 AU noHe et al. [18] 2005 SC R SB 2400 13-17 49.1 AU yes
SC – Southern China, NC – Northern China, HMT – Hong Kong, Macao and Taiwan, M – multiple center, U – urban, R – rural, SB – school-based, PB – pop-ulation-based, AU – auto refraction, RE – retinoscopy
Prevalence and time trends of refractive error in Chinese children
VIE
WPO
INTS
RESE
ARC
H T
HE
ME
4: H
EA
LTH
TR
AN
SITI
ON
S IN
CH
INA
www.jogh.org • doi: 10.7189/jogh.11.08006 5 2021 • Vol. 11 • 08006
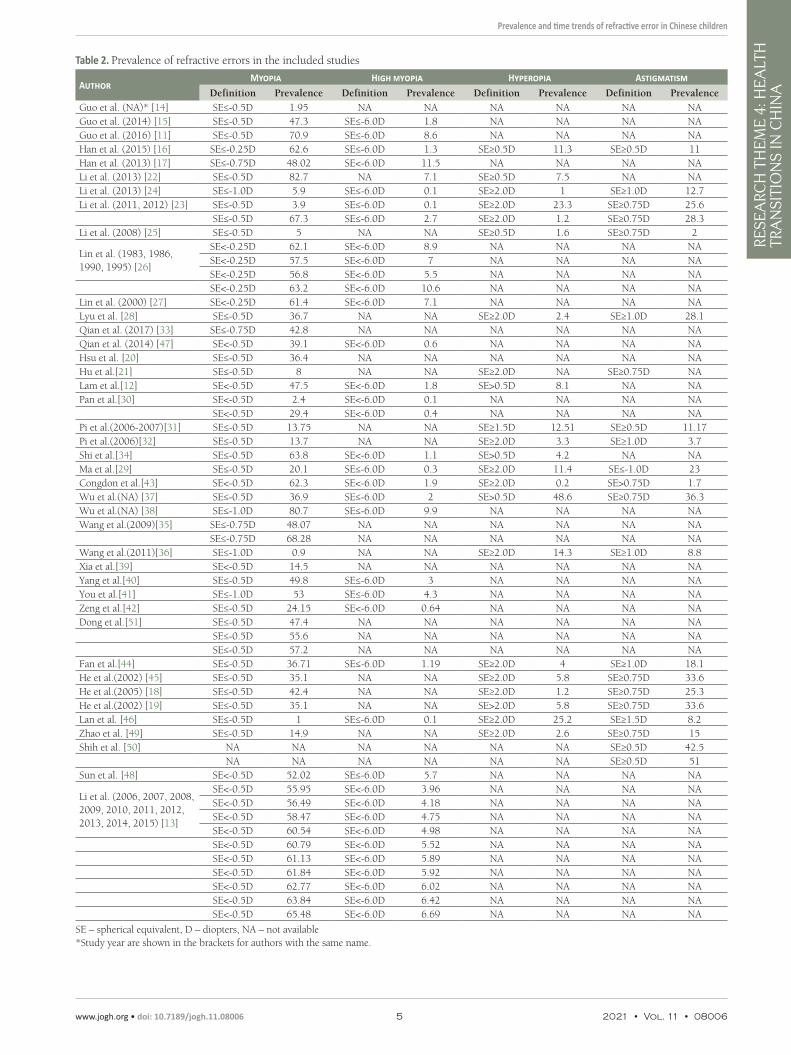
Table 2. Prevalence of refractive errors in the included studies
AuthorMyopia High Myopia Hyperopia Astigmatism
Definition Prevalence Definition Prevalence Definition Prevalence Definition PrevalenceGuo et al. (NA)* [14] SE≤-0.5D 1.95 NA NA NA NA NA NAGuo et al. (2014) [15] SE≤-0.5D 47.3 SE≤-6.0D 1.8 NA NA NA NAGuo et al. (2016) [11] SE≤-0.5D 70.9 SE≤-6.0D 8.6 NA NA NA NAHan et al. (2015) [16] SE≤-0.25D 62.6 SE≤-6.0D 1.3 SE≥0.5D 11.3 SE≥0.5D 11Han et al. (2013) [17] SE≤-0.75D 48.02 SE<-6.0D 11.5 NA NA NA NALi et al. (2013) [22] SE≤-0.5D 82.7 NA 7.1 SE≥0.5D 7.5 NA NALi et al. (2013) [24] SE≤-1.0D 5.9 SE≤-6.0D 0.1 SE≥2.0D 1 SE≥1.0D 12.7Li et al. (2011, 2012) [23] SE≤-0.5D 3.9 SE≤-6.0D 0.1 SE≥2.0D 23.3 SE≥0.75D 25.6
SE≤-0.5D 67.3 SE≤-6.0D 2.7 SE≥2.0D 1.2 SE≥0.75D 28.3Li et al. (2008) [25] SE≤-0.5D 5 NA NA SE≥0.5D 1.6 SE≥0.75D 2
Lin et al. (1983, 1986, 1990, 1995) [26]
SE<-0.25D 62.1 SE<-6.0D 8.9 NA NA NA NASE<-0.25D 57.5 SE<-6.0D 7 NA NA NA NASE<-0.25D 56.8 SE<-6.0D 5.5 NA NA NA NASE<-0.25D 63.2 SE<-6.0D 10.6 NA NA NA NA
Lin et al. (2000) [27] SE<-0.25D 61.4 SE<-6.0D 7.1 NA NA NA NALyu et al. [28] SE≤-0.5D 36.7 NA NA SE≥2.0D 2.4 SE≥1.0D 28.1Qian et al. (2017) [33] SE≤-0.75D 42.8 NA NA NA NA NA NAQian et al. (2014) [47] SE<-0.5D 39.1 SE<-6.0D 0.6 NA NA NA NAHsu et al. [20] SE≤-0.5D 36.4 NA NA NA NA NA NAHu et al.[21] SE≤-0.5D 8 NA NA SE≥2.0D NA SE≥0.75D NALam et al.[12] SE<-0.5D 47.5 SE<-6.0D 1.8 SE>0.5D 8.1 NA NAPan et al.[30] SE<-0.5D 2.4 SE<-6.0D 0.1 NA NA NA NA
SE<-0.5D 29.4 SE<-6.0D 0.4 NA NA NA NAPi et al.(2006-2007)[31] SE≤-0.5D 13.75 NA NA SE≥1.5D 12.51 SE≥0.5D 11.17Pi et al.(2006)[32] SE≤-0.5D 13.7 NA NA SE≥2.0D 3.3 SE≥1.0D 3.7Shi et al.[34] SE≤-0.5D 63.8 SE<-6.0D 1.1 SE>0.5D 4.2 NA NAMa et al.[29] SE≤-0.5D 20.1 SE≤-6.0D 0.3 SE≥2.0D 11.4 SE≤-1.0D 23Congdon et al.[43] SE<-0.5D 62.3 SE<-6.0D 1.9 SE≥2.0D 0.2 SE>0.75D 1.7Wu et al.(NA) [37] SE≤-0.5D 36.9 SE≤-6.0D 2 SE>0.5D 48.6 SE≥0.75D 36.3Wu et al.(NA) [38] SE≤-1.0D 80.7 SE≤-6.0D 9.9 NA NA NA NAWang et al.(2009)[35] SE≤-0.75D 48.07 NA NA NA NA NA NA
SE≤-0.75D 68.28 NA NA NA NA NA NAWang et al.(2011)[36] SE≤-1.0D 0.9 NA NA SE≥2.0D 14.3 SE≥1.0D 8.8Xia et al.[39] SE<-0.5D 14.5 NA NA NA NA NA NAYang et al.[40] SE≤-0.5D 49.8 SE≤-6.0D 3 NA NA NA NAYou et al.[41] SE≤-1.0D 53 SE≤-6.0D 4.3 NA NA NA NAZeng et al.[42] SE≤-0.5D 24.15 SE<-6.0D 0.64 NA NA NA NADong et al.[51] SE≤-0.5D 47.4 NA NA NA NA NA NA
SE≤-0.5D 55.6 NA NA NA NA NA NASE≤-0.5D 57.2 NA NA NA NA NA NA
Fan et al.[44] SE≤-0.5D 36.71 SE≤-6.0D 1.19 SE≥2.0D 4 SE≥1.0D 18.1He et al.(2002) [45] SE≤-0.5D 35.1 NA NA SE≥2.0D 5.8 SE≥0.75D 33.6He et al.(2005) [18] SE≤-0.5D 42.4 NA NA SE≥2.0D 1.2 SE≥0.75D 25.3He et al.(2002) [19] SE≤-0.5D 35.1 NA NA SE>2.0D 5.8 SE≥0.75D 33.6Lan et al. [46] SE≤-0.5D 1 SE≤-6.0D 0.1 SE≥2.0D 25.2 SE≥1.5D 8.2Zhao et al. [49] SE≤-0.5D 14.9 NA NA SE≥2.0D 2.6 SE≥0.75D 15Shih et al. [50] NA NA NA NA NA NA SE≥0.5D 42.5
NA NA NA NA NA NA SE≥0.5D 51Sun et al. [48] SE<-0.5D 52.02 SE≤-6.0D 5.7 NA NA NA NA
Li et al. (2006, 2007, 2008, 2009, 2010, 2011, 2012, 2013, 2014, 2015) [13]
SE<-0.5D 55.95 SE<-6.0D 3.96 NA NA NA NASE<-0.5D 56.49 SE<-6.0D 4.18 NA NA NA NASE<-0.5D 58.47 SE<-6.0D 4.75 NA NA NA NASE<-0.5D 60.54 SE<-6.0D 4.98 NA NA NA NASE<-0.5D 60.79 SE<-6.0D 5.52 NA NA NA NASE<-0.5D 61.13 SE<-6.0D 5.89 NA NA NA NASE<-0.5D 61.84 SE<-6.0D 5.92 NA NA NA NASE<-0.5D 62.77 SE<-6.0D 6.02 NA NA NA NASE<-0.5D 63.84 SE<-6.0D 6.42 NA NA NA NASE<-0.5D 65.48 SE<-6.0D 6.69 NA NA NA NA
SE – spherical equivalent, D – diopters, NA – not available*Study year are shown in the brackets for authors with the same name.
Tang et al.V
IEW
POIN
TSRE
SEA
RCH
TH
EM
E 4
: HE
ALT
H
TRA
NSI
TIO
NS
IN C
HIN
A
2021 • Vol. 11 • 08006 6 www.jogh.org • doi: 10.7189/jogh.11.08006
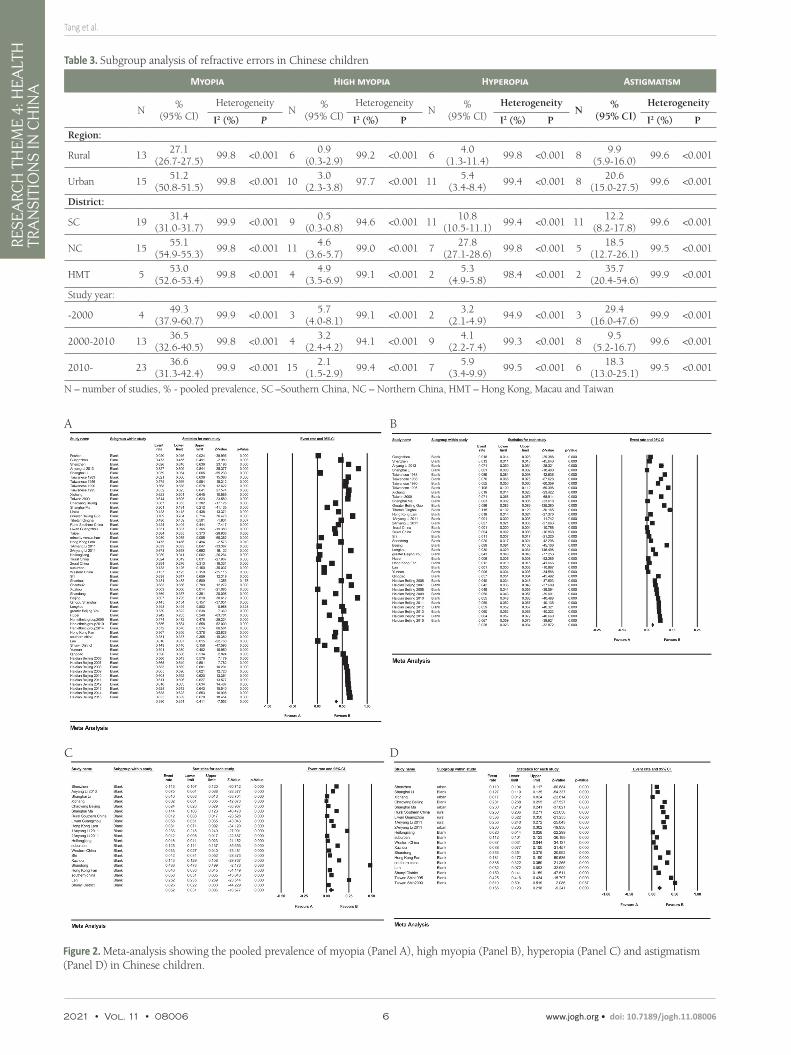
Figure 2. Meta-analysis showing the pooled prevalence of myopia (Panel A), high myopia (Panel B), hyperopia (Panel C) and astigmatism (Panel D) in Chinese children.
Table 3. Subgroup analysis of refractive errors in Chinese children
Myopia High myopia Hyperopia Astigmatism
N%
(95% CI)Heterogeneity
N%
(95% CI)Heterogeneity
N%
(95% CI)Heterogeneity
N%
(95% CI)Heterogeneity
I2 (%) P I2 (%) P I2 (%) P I2 (%) P
Region:
Rural 1327.1
(26.7-27.5)99.8 <0.001 6
0.9(0.3-2.9)
99.2 <0.001 64.0
(1.3-11.4)99.8 <0.001 8
9.9(5.9-16.0)
99.6 <0.001
Urban 1551.2
(50.8-51.5)99.8 <0.001 10
3.0(2.3-3.8)
97.7 <0.001 115.4
(3.4-8.4)99.4 <0.001 8
20.6(15.0-27.5)
99.6 <0.001
District:
SC 1931.4
(31.0-31.7)99.9 <0.001 9
0.5(0.3-0.8)
94.6 <0.001 1110.8
(10.5-11.1)99.4 <0.001 11
12.2(8.2-17.8)
99.6 <0.001
NC 1555.1
(54.9-55.3)99.8 <0.001 11
4.6(3.6-5.7)
99.0 <0.001 727.8
(27.1-28.6)99.8 <0.001 5
18.5(12.7-26.1)
99.5 <0.001
HMT 553.0
(52.6-53.4)99.8 <0.001 4
4.9(3.5-6.9)
99.1 <0.001 25.3
(4.9-5.8)98.4 <0.001 2
35.7(20.4-54.6)
99.9 <0.001
Study year:
-2000 449.3
(37.9-60.7)99.9 <0.001 3
5.7(4.0-8.1)
99.1 <0.001 23.2
(2.1-4.9)94.9 <0.001 3
29.4(16.0-47.6)
99.9 <0.001
2000-2010 1336.5
(32.6-40.5)99.8 <0.001 4
3.2(2.4-4.2)
94.1 <0.001 94.1
(2.2-7.4)99.3 <0.001 8
9.5(5.2-16.7)
99.6 <0.001
2010- 2336.6
(31.3-42.4)99.9 <0.001 15
2.1(1.5-2.9)
99.4 <0.001 75.9
(3.4-9.9)99.5 <0.001 6
18.3(13.0-25.1)
99.5 <0.001
N – number of studies, % - pooled prevalence, SC –Southern China, NC – Northern China, HMT – Hong Kong, Macau and Taiwan
A
C
B
D
Prevalence and time trends of refractive error in Chinese children
VIE
WPO
INTS
RESE
ARC
H T
HE
ME
4: H
EA
LTH
TR
AN
SITI
ON
S IN
CH
INA
www.jogh.org • doi: 10.7189/jogh.11.08006 7 2021 • Vol. 11 • 08006
Result of the meta-analysis of high myopia is presented in Figure 2, Panel B. The pooled prevalence of high myopia was 2.8% (95% CI = 2.3%-3.4%). There was a higher prevalence of high myopia in urban areas vs rural areas: 3.0% (95% CI = 2.3%-3.8%) vs 0.9% (95% CI = 0.3%-2.9%); P < 0.001. For populations in differ-ent districts, HMT and Northern China had similar pooled prevalence: 4.9% (95% CI = 3.5%-6.9%) vs 4.6% (95% CI = 3.6%-5.7%), and Southern China still had the highest pooled prevalence: 0.5% (95% CI = 0.3%-0.8%), P < 0.001. Meta regression (Figure S2 in the Online Supplementary Document) shows that the high myopia prevalence has a weak decreasing trend (equation of the regression line: high myopia prevalence [%] = -0.01469 × midpoint of the study year group + 26.70921; P < 0.01).
Prevalence of hyperopia
As shown in and Figure 2, Panel C, pooled prevalence of hyperopia was 5.2% (95% CI = 3.1%-8.6%). Preva-lence of hyperopia was higher in urban children than in rural children: 4.0% (95% CI = 1.3%-11.4%) vs 5.4% (95% CI = 3.4%-8.4%); P < 0.001. However, prevalence of hyperopia in HMT was lowest, while Northern Chi-na had the highest prevalence: 5.3% (95% CI = 4.9%-5.8%) vs 27.8% (95% CI = 27.1%-28.6%); P < 0.001. As for the subgroup analysis of study year, prevalence of hyperopia after the year 2010 was highest while prior to the year 2000 was lowest: 5.9% (95% CI = 3.4%-9.9%) vs 3.2% (95% CI = 2.1%-4.9%); P < 0.001. Result of the meta regression (Figure S3 in the Online Supplementary Document) shows an increasing trend of hyperopia prevalence (hyperopia prevalence (%) = 0.06933 × midpoint of the study year group – 141.49412; P < 0.01).
Prevalence of astigmatism
Figure 2, Panel D, shows the meta-analysis results of astigmatism. The pooled prevalence of astigmatism was 16.5% ( 95% CI = 12.3%-21.8%). According to the subgroup analysis by region type, prevalence of astigma-tism in urban areas was dramatically higher than in rural areas: 20.6% (95% CI = 15%-27.5%) vs 9.9% (95% CI = 5.9% 16.0%); P < 0.001. Prevalence of astigmatism in HMT (35.7%, 95% CI = 20.4%-54.6%) was high-est, while prevalence in Southern China was lowest (12.2%,95% CI = 8.2%-17.8%); P < 0.001. Before the year 2000 the prevalence of astigmatism was highest and prevalence was lowest in the years 2000-2010 (29.4%, 95% CI = 16.0%-47.6%) vs 47.6% (95% CI = 5.2%-16.7%); P < 0.001. A decreasing trend was detected in the meta regression analysis, which is shown in Figure S4 in the Online Supplementary Document (astigmatism prevalence (%) = -0.06604 × midpoint of the study year group + 131.37988; P < 0.01).
Publication bias and sensitivity analysis
According to the result of the Begg’s and Egger’s test, there was no publication bias detected for the prevalence of myopia, hyperopia and astigmatism (P > 0.05). We have also conducted the sensitivity analysis and the pooled prevalence RE did not change significantly compared with the initial results after removing each study sequentially, suggesting good homogeneity of the included studies.
DISCUSSIONIn this study, 41 studies conducted in China were included for this meta-analysis and the pooled prevalence of myopia, high myopia, hyperopia, astigmatism in Chinese children were 38.0%, 2.8%, 5.2%, 16.5%, respec-tively. The prevalence of RE varied across different districts, region-type and period.
Compare with previous meta-analysis that reported the overall prevalence of myopia and high myopia in Chi-nese children from 1998 to 2016 [10], the prevalence of myopia and high myopia remains in a high level (for myopia:37.7% vs 38%, for high myopia: 3.1% vs 2.8%), which suggest that much more efforts should be made in future to prevent and control myopia in China. Subgroup analysis in this study showed that the prev-alence of myopia in urban areas is dramatically higher than that of rural areas in China. Reasons that lead to the higher prevalence of myopia in urban areas are varied, such as less outdoor activities and high academic stress [7,8]. Population in HMT have higher myopia prevalence in this study, which is comprehensible since these districts are highly-urbanized. According to the regression analysis, there is an increasing trend of prev-alence of myopia. However, as shown in the subgroup analysis by study year, the prevalence of myopia and high myopia before the year 2000 are higher than the prevalence after the year 2010, which may be because there are fewer studies reporting prevalence before 2000 and many of them were conducted in Taiwan, a city with high prevalence of refractive errors [10,26,27,50].
It is worth noting that the increasing trend of myopia has a slowdown trend compared with the previous me-ta-analysis which showed a higher slope in regression analysis (1.086 vs 0.008) and predicted that the estimat-
Tang et al.V
IEW
POIN
TSRE
SEA
RCH
TH
EM
E 4
: HE
ALT
H
TRA
NSI
TIO
NS
IN C
HIN
A
2021 • Vol. 11 • 08006 8 www.jogh.org • doi: 10.7189/jogh.11.08006
ed prevalence of myopia in 2050 was 84% [10]. This might reflected that the myopia prevention and control strategies in China [52-54], including lightening student’s schoolwork burden, encouraging children to spend more time outdoors and wider use of Orthokeratology, has made some achievements in the past years.[55] Especially, the Sports for All National Strategy carried out by the government in the thirteenth Five-Year Plan of China (2016-2020), may have played an important role in myopia prevention and control in China [56,57].
Comparing the prevalence of myopia in different countries, we found that prevalence of myopia and high myo-pia in Chinese children is significantly higher than in many other countries. For example, the prevalence of myo-pia ranges from 6.1% in Morocco [58], 4.0% in Middle East [59], to 0.8% in Laos [60]. As for high myopia, the prevalence was 1.0% in Korea [61], and 1.4% in India [62]. Possible explanations for this difference may lie in several aspects. First, Pan et al. revealed that factors such as higher educational level and exposure to an inten-sive schooling system at an early age, especially in countries such as China, are positively associated with myopia [8]; second, ethnic difference that leads to a higher prevalence in China are already discussed in many articles [7,10,63]. However, whether the difference between different ethnicities is caused by inter-ethnic differences in the genetic predisposition to myopia or culture-specific environmental factors still remains unclear [64].
In terms of hyperopia, as the first meta-analysis reporting prevalence of hyperopia in Chinese Children, our results show a higher prevalence was detected in urban compared to rural areas which is inconsistent with the study performed in India which showed children in rural areas were more likely to develop hyperopia than those in urban areas [65]. In our study, the higher prevalence of hyperopia in urban areas may lie in that the mean age of participants in urban areas are younger than participants in rural areas and a previous study has revealed that there is an inverse association between prevalence of hyperopia and age [66]. As for regression analysis of hyperopia, we found an increasing trend, which could be explained by the physical education re-form of China (Sports for All National Strategy) which encourage children to spend more time on outdoor sports, and the policies for myopia prevention and control mentioned above [53,54,56,57].
When comparing the prevalence of hyperopia with other countries and regions, prevalence of hyperopia is relatively low in China which is similar to other east Asian countries. For example, the prevalence of hyper-opia is 1.5% in Singapore and 6.2% in Korea [61,67]. In contrast, prevalence is higher in western countries, from 13.1% in Poland to 14.7% in Northern Ireland [68,69]. Both environmental factors and ethnic and ge-netic factors may contribute to the low prevalence of hyperopia in China. For the environmental factors, as is mentioned above, spending more time outdoors and living in rural areas often leads to hyperopia while chil-dren in China tend to spend less time outdoors and more time in near work [65,70]. As for the ethnic factor of hyperopia, the CLEERE study reported that Caucasians had the highest prevalence of hyperopia while Asians have the lowest prevalence [63,66]. According to the meta-analysis by Hashemi et al [6], genetic and ethnic factors could play a more prominent role in hyperopia.
The prevalence of astigmatism in Chinese children is 16.5% and highest prevalence was seen in HMT (35.7%), which is higher than many countries. For example, prevalence was only 5.4% in India, 6.7% in Australia and 9% in Laos [60,62,71]. As is mentioned earlier, near work is one of the major reason that leads to astigmatism, and the high stress on academic performance may contribute to the high prevalence of astigmatism in China [72,73]. Ethnicity also plays an important part in the prevalence of astigmatism. As is reported in the CLEERE study, Asians and Hispanics had the highest prevalence of astigmatism [63], which may be explained by the anatomy of Asian eyes (tight eyelids and narrow palpebral apertures) [74]. When compared our results with the study conducted in Taiwan, which reported a prevalence of astigmatism was 42.5% in 1995 and 51% in 2000, an obvious decreasing trend was suggested. A reasonable explanation might be the perform of series policies, including the myopia prevent strategies mentioned above [72]. In the subgroup analysis by region, a higher astigmatism prevalence was detected in urban regions vs rural regions. One explanation could be ur-ban children are engaging in more near work, and as a former study reported not only can near work cause myopia but it is also likely to increase the risk of astigmatism [72]. In the subgroup analysis by district, the highest astigmatism prevalence was found in HMT, which are highly urbanization areas, which is consistent with subgroup analysis of region-type.
This study has several limitations. First, few studies were prior to the 2000 or in remote provinces which will affect the precision of the results to a certain extent. Second, not all the studies used the same definition of RE which might influence the result in some extent. Third, out of 40 studies, 9 of them did not perform cy-cloplegia for refractometry which might also influence the result. Nevertheless, to the best of our knowledge, this is the first meta-analysis to report the overall prevalence and time trend analysis of refractive errors and its sub-classifications in Chinese children. Additionally, this article includes numerous studies throughout China, covering a large population with a wide geographical distribution.
Prevalence and time trends of refractive error in Chinese children
VIE
WPO
INTS
RESE
ARC
H T
HE
ME
4: H
EA
LTH
TR
AN
SITI
ON
S IN
CH
INA
www.jogh.org • doi: 10.7189/jogh.11.08006 9 2021 • Vol. 11 • 08006
CONCLUSIONThe pooled prevalence of myopia, high myopia, hyperopia, astigmatism in Chinese children are 38.0%, 2.8%, 5.2%, 16.5%, respectively. Urban children are more vulnerable to RE (especially myopia) than rural children. Children living in HMT have a higher prevalence of myopia, high myopia and astigmatism than children in mainland China. There is an increasing trend for prevalence of myopia and hyperopia while there is a decreasing trend for prevalence of high myopia and astigmatism in Chinese children. Considering the large magnitude of refractive errors, more attention should be paid to RE prevention and treatment strategy development in China.
Funding: This work was supported by National Natural Science Foundation of China (81873673, 81900841) and the Fundamental Research Funds of the State Key Laboratory of Ophthalmology (30306020240020212). Dr Jin receives sup-port from the Young Teachers Training Program of Sun Yat-sen University (20ykpy143).
Authorship contributors: Designed the study, initiated the collaborative project, revised the paper (GM Jin and DY Zheng); Monitored data collection, wrote the statistical analysis plan and drafted the paper (Y Tang, AM Chen and MJ Zou, SB Wang and ZZ Liu); Cleaned and analyzed the data (AM Chen, CA Young and SB Wang); administrative, techni-cal or logistic support (GM Jin and DY Zheng).
Competing interests: The authors completed the ICMJE Unified Competing Interest form (available upon request from the corresponding author), and declare no conflicts of interest.
Additional materialOnline Supplementary Document
REFE
REN
CE
S
1 Pascolini D, Mariotti SP. Global estimates of visual impairment: 2010. Br J Ophthalmol. 2012;96:614-8. Medline:22133988 doi:10.1136/bjophthalmol-2011-300539
2 Ohno-Matsui K, Kawasaki R, Jonas JB, Cheung CM, Saw SM, Verhoeven VJ, et al. International photographic classification and grading system for myopic maculopathy. Am J Ophthalmol. 2015;159:877-83 e7. Medline:25634530 doi:10.1016/j.ajo.2015.01.022
3 Packwood EA. The psychosocial effects of amblyopia study. J AAPOS. 1999;3(1):15-7. Medline:10071896 doi:10.1016/S1091-8531(99)70089-3
4 Naidoo KS, Jaggernath J. Uncorrected refractive errors. Indian J Ophthalmol. 2012;60:432-7. Medline:22944755 doi:10.4103/0301-4738.100543
5 Morgan IG, Ohno-Matsui K, Saw S-M. Myopia. Lancet. 2012;379:1739-48. Medline:22559900 doi:10.1016/S0140-6736(12)60272-4
6 Hashemi H, Fotouhi A, Yekta A, Pakzad R, Ostadimoghaddam H, Khabazkhoob M. Global and regional estimates of prevalence of refractive errors: Systematic review and meta-analysis. J Curr Ophthalmol. 2017;30:3-22. Medline:29564404 doi:10.1016/j.joco.2017.08.009
7 Pan CW, Cheng C-Y. The Age-Specific Prevalence of Myopia in Asia: A Meta-analysis. Optom Vis Sci. 2015;92(3):258-66. Medline:25611765
8 Pan CW, Ramamurthy D, Saw SM. Worldwide prevalence and risk factors for myopia. Ophthalmic Physiol Opt. 2012;32:3-16. Medline:22150586 doi:10.1111/j.1475-1313.2011.00884.x
9 Holden BA, Fricke TR, Wilson DA, Jong M, Naidoo KS, Sankaridurg P, et al. Global Prevalence of Myopia and High Myopia and Temporal Trends from 2000 through 2050. Ophthalmology. 2016;123:1036-42. Medline:26875007 doi:10.1016/j.oph-tha.2016.01.006 Medline:29121045 doi:10.1371/journal.pone.0187396
10 Dong L, Kang YK, Li Y, Wei WB, Jonas JB. Prevalence and time trends of myopia in children and adolescents in China: a sys-temic review and meta-analysis. Retina. 2019;40:399-441.
11 Guo Y, Duan JL, Liu LJ, Sun Y, Tang P, Lv YY, et al. High myopia in Greater Beijing School Children in 2016. PLoS One. 2017;12:e0187396. Medline:29121045 doi:10.1371/journal.pone.0187396
12 Lam CS, Lam CH, Cheng SC, Chan LY. Prevalence of myopia among Hong Kong Chinese schoolchildren: changes over two decades. Ophthalmic Physiol Opt. 2012;32:17-24. Medline:22150587 doi:10.1111/j.1475-1313.2011.00886.x
13 Li Y, Liu J, Qi P. The increasing prevalence of myopia in junior high school students in the Haidian District of Beijing, Chi-na: a 10-year population-based survey. BMC Ophthalmol. 2017;17:88. Medline:28606071 doi:10.1186/s12886-017-0483-6
14 Guo JL, Huang XL, Yu FC, Liang SZ, Lai TT. Epidemiological survey of preschool children with myopia in foshan and the anal-ysis of related factors. Int J Ophthalmol Clin Res. 2010;10:1191-2.
15 Guo L, Yang J, Mai J, Du X, Guo Y, Li P, et al. Prevalence and associated factors of myopia among primary and middle school-aged students: A school-based study in Guangzhou. Eye (Lond). 2016;30:796-804. Medline:26965016 doi:10.1038/eye.2016.39
16 Han B, Zhou WW, Liu CM, Yang Y, Cheng HB, Xu XJ. Epidemiological study on visual acuity and refractive status of primary students and junior high school students in Shenzhen. Int J Ophthalmol Clin Res. 2016;16:2103-6.
17 Han X, Miao HL, Huang D. Investigation of junior school student myopia in high-altitude Tibetan areas in Qinghai Province. Int J Ophthalmol Clin Res. 2014;14:913-5.
Tang et al.V
IEW
POIN
TSRE
SEA
RCH
TH
EM
E 4
: HE
ALT
H
TRA
NSI
TIO
NS
IN C
HIN
A
2021 • Vol. 11 • 08006 10 www.jogh.org • doi: 10.7189/jogh.11.08006
18 He M, Huang W, Zheng Y, Huang L, Ellwein LB. Refractive Error and Visual Impairment in School Children in Rural Southern China. Ophthalmology. 2007;114:374-82. Medline:17123622 doi:10.1016/j.ophtha.2006.08.020
19 He MG, Lin Z, Huang J, Lu Y, Wu CF, Xu JJ. Population-based survey of refractive error in school-aged children in Liwan Dis-trict, Guangzhou. Zhonghua Yan Ke Za Zhi. 2008;44:491-6. Medline:19035237
20 Hsu CC, Huang N, Lin PY, Tsai DC, Tsai CY, Woung LC, et al. Prevalence and risk factors for myopia in second-grade primary school children in Taipei: A population-based study. J Chin Med Assoc. 2016;79:625-32. Medline:27349942 doi:10.1016/j.jcma.2016.02.011
21 Hu M, Zhou Y, Huang S, Congdon N, Jin L, Wang X, et al. Population prevalence of myopia, glasses wear and free glasses ac-ceptance among minority versus han schoolchildren in China. PLoS One. 2019;14:e0215660. Medline:30998750 doi:10.1371/journal.pone.0215660
22 Li H, Li S, Liu L, Li S, Kang M, Ji Y, et al. Distribution of refraction and ocular biometric parameters in a population of junior middle school children in Anyang of Henan province. Zhonghua Yi Xue Za Zhi. 2014;94:1284-8. Medline:25142845
23 Li SM, Liu LR, Li SY, Ji YZ, Fu J, Wang Y, et al. Design, methodology and baseline data of a school-based cohort study in cen-tral china: The anyang childhood eye study. Ophthalmic Epidemiol. 2013;20:348-59. Medline:24160405 doi:10.3109/09286586.2013.842596
24 Li T, Zhou X, Chen X, Qi H, Gao Q. Refractive Error in Chinese Preschool Children: The Shanghai Study. Eye Contact Lens. 2019;45:182-7. Medline:30260815 doi:10.1097/ICL.0000000000000555
25 Li Z, Xu K, Wu S, Lv J, Jin D, Song Z, et al. Population-based survey of refractive error among school-aged children in rural north-ern China: The Heilongjiang eye study. Clin Exp Ophthalmol. 2014;42:379-84. Medline:23952961 doi:10.1111/ceo.12198
26 Lin LLK, Shih YF, Hsiao CK, Chen CJ. Prevalence of Myopia in Taiwanese Schoolchildren: 1983 to 2000. Ann Acad Med Sin-gap. 2004;33:27-33. Medline:15008558
27 Lin LLK, Shih YF, Hsiao CK, Chen CJ, Lee LA, Hung PT. Epidemiologic study of the prevalence and severity of myopia among schoolchildren in Taiwan in 2000. J Formos Med Assoc. 2001;100:684-91. Medline:11760374
28 Lyu Y, Zhang H, Gong Y, Wang D, Chen T, Guo X, et al. Prevalence of and factors associated with myopia in primary school students in the Chaoyang District of Beijing, China. Jpn J Ophthalmol. 2015;59:421-9. Medline:26329826 doi:10.1007/s10384-015-0409-x
29 Ma Y, Qu X, Zhu X, Xu X, Zhu J, Sankaridurg P, et al. Age-specific prevalence of visual impairment and refractive error in children aged 3–10 years in Shanghai, China. Invest Ophthalmol Vis Sci. 2016;57:6188-96. Medline:27842160 doi:10.1167/iovs.16-20243
30 Pan CW, Wu RK, Li J, Zhong H. Low prevalence of myopia among school children in rural China. BMC Ophthalmol. 2018;18:140. Medline:29890943 doi:10.1186/s12886-018-0808-0
31 Pi LH, Chen L, Liu Q, Ke N, Fang J, Zhang S, et al. Refractive status and prevalence of refractive errors in suburban school-age children. Int J Med Sci. 2010;7:342-53. Medline:20975844 doi:10.7150/ijms.7.342
32 Pi LH, Chen L, Liu Q, Ke N, Fang J, Zhang S, et al. Prevalence of eye diseases and causes of visual impairment in school-aged children in Western China. J Epidemiol. 2012;22:37-44. Medline:22123227 doi:10.2188/jea.JE20110063
33 Qian ML, Li ZH, Bai HL, Kong BH, Xie L, Liu Q. Prevalence and related factors investigations of myopia among multi-ethnic adolescents in Linxia Prefecture. Int J Ophthalmol Clin Res. 2018;18:1105-8.
34 Shi Y, Hu J, Zhang C, Sun Y, Shi R, Li J, et al. Analysis of refractive status without cycloplegia in 2046 Pupils. Yan ke xue bao. 2010;25:16-9. Medline:21166033
35 Wang G, Tan L, Huang YQ, Lin SB, Chen B, Zhang MZ. A cross-sectional study of myopia among students from middle and high schools in Shantou, China. Int J Ophthalmol Clin Res. 2014;14:1491-3.
36 Wang X, Liu D, Feng R, Zhao H, Wang Q. Refractive error among urban preschool children in Xuzhou, China. Int J Clin Exp Pathol. 2014;7:8922-8. Medline:25674266
37 Wu JF, Bi HS, Wang SM, Hu YY, Wu H, Sun W, et al. Refractive error, visual acuity and causes of vision loss in children in Shandong, China. The Shandong children eye study. PLoS One. 2013;8:e82763. Medline:24376575 doi:10.1371/journal.pone.0082763
38 Wu LJ, You QS, Duan JL, Luo YX, Liu LJ, Li X, et al. Prevalence and associated factors of myopia in high-school students in Beijing. PLoS One. 2015;10:e0120764. Medline:25803875 doi:10.1371/journal.pone.0120764
39 Xia W, Gong LH, Zhang XY, Zhang AH, Miao L. Investigation analysis of children myopia in Qingpu district of Shanghai. Int J Ophthalmol Clin Res. 2010;10:2157-8.
40 Yang XW, Qu GZ, Liu LM, Wang N, Li H, Xing L, et al. Prevalence of myopia among primary and middle school students in Longkou City, Shandong Province. Int J Ophthalmol Clin Res. 2018;18:1287-9.
41 You QS, Wu LJ, Duan JL, Luo YX, Liu LJ, Li X, et al. Prevalence of myopia in school children in greater Beijing: The Beijing Childhood Eye Study. Acta Ophthalmol. 2014;92:e398-406. Medline:25165786 doi:10.1111/aos.12299
42 Zeng CQ, Zhou LH, Zhang P, Wang J, Ye MH, Yi BX, et al. The epidemiology of myopia in primary school students of grade 1 to 3 in Hubei province. Zhonghua Yan Ke Za Zhi. 2018;54:756-61. Medline:30347563
43 Congdon N, Wang Y, Song Y, Choi K, Zhang M, Zhou Z, et al. Visual disability, visual function, and myopia among rural chi-nese secondary school children: the Xichang Pediatric Refractive Error Study (X-PRES)–report 1. Invest Ophthalmol Vis Sci. 2008;49:2888-94. Medline:18378579 doi:10.1167/iovs.07-1160
44 Fan DS, Lam DS, Lam RF, Lau JT, Chong KS, Cheung EY, et al. Prevalence, incidence, and progression of myopia of school children in Hong Kong. Invest Ophthalmol Vis Sci. 2004;45:1071-5. Medline:15037570 doi:10.1167/iovs.03-1151
45 He M, Zeng J, Liu Y, Xu J, Pokharel GP, Ellwein LB. Refractive error and visual impairment in urban children in southern chi-na. Invest Ophthalmol Vis Sci. 2004;45:793-9. Medline:14985292 doi:10.1167/iovs.03-1051
REFE
REN
CE
S
Prevalence and time trends of refractive error in Chinese children
VIE
WPO
INTS
RESE
ARC
H T
HE
ME
4: H
EA
LTH
TR
AN
SITI
ON
S IN
CH
INA
www.jogh.org • doi: 10.7189/jogh.11.08006 11 2021 • Vol. 11 • 08006
46 Lan W, Zhao F, Lin L, Li Z, Zeng J, Yang Z, et al. Refractive errors in 3-6 year-old Chinese children: a very low prevalence of myopia? PLoS One. 2013;8:e78003. Medline:24205064 doi:10.1371/journal.pone.0078003
47 Qian DJ, Zhong H, Li J, Niu Z, Yuan Y, Pan CW. Myopia among school students in rural China (Yunnan). Ophthalmic Physiol Opt. 2016;36:381-7. Medline:26896871 doi:10.1111/opo.12287
48 Sun JT, An M, Yan XB, Li GH, Wang DB. Prevalence and Related Factors for Myopia in School-Aged Children in Qingdao. J Ophthalmol. 2018;2018:9781987. Medline:29507811 doi:10.1155/2018/9781987
49 Zhao J, Pan X, Sui R, Muoz SR, Sperduto RD, Ellwein LB. Refractive Error Study in Children: Results From Shunyi District, China. Am J Ophthalmol. 2000;129:427. Medline:10764849 doi:10.1097/00006324-200402000-00007
50 Shih YF, Hsiao CK, Tung YL, Lin LLK, Chen CJ, Hung PT. The prevalence of astifmatism in Taiwan schoolchildren. Optom Vis Sci. 2004;81:94-8. Medline:15127928 doi:10.1016/s0002-9394(99)00452-3
51 Dong YH, Liu HB, Wang ZH, Xu RB, Yang ZP, Ma J. The epidemic status and secular trends of myopia prevalence for Chi-nese children and adolescents aged 7-18 years from 2005 to 2014. Zhonghua Yu Fang Yi Xue Za Zhi. 2017;51:285-9. Med-line:28395459
52 Yu Juan YZ, Song B, Jiang S. Research Progress of juvenile myopia prevention and control. J Nurs Sci. 2014;29:86. 53 Ma J. Pay attention to implementing measures, promote prevention and control of myopia. Zhonghua Yu Fang Yi Xue Za Zhi.
2021;55:440-5. Medline:33858053 doi:10.3760/cma.j.cn112150-20210223-00178 54 Liao W. The basic principle of prevention and control of adolescent myopia. Zhongguo Xue Xiao Wei Sheng. 2008;29:385-7. 55 Bullimore MA, Johnson LA. Overnight orthokeratology. Cont Lens Anterior Eye. 2020;43:322-32. Medline:32331970
doi:10.1016/j.clae.2020.03.018 56 Hu AG, Fang XD. The development idea of sports for all national strategy. Ti Yu Ke Xue. 2016;36:3. 57 Ren H, Wang KZ, Xiao SH, Zhao SX. On format for sport resources distribution - Sport reform under the social-economic
transformation in China. Journal of Tianjin Institute of Physical Education. 2001;16:2. 58 Anera RG, Soler M, de la Cruz Cardona J, Salas C, Ortiz C. Prevalence of refractive errors in school-age children in Morocco.
Clin Exp Ophthalmol. 2009;37:191-6. Medline:19723127 doi:10.1111/j.1442-9071.2009.02001.x 59 Khoshhal F, Hashemi H, Hooshmand E, Saatchi M, Yekta A, Aghamirsalim M, et al. The prevalence of refractive errors in the
Middle East: a systematic review and meta-analysis. Int Ophthalmol. 2020;40(6):1571-86. Medline:32107693 doi:10.1007/s10792-020-01316-5
60 Casson RJ, Kahawita S, Kong A, Muecke J, Sisaleumsak S, Visonnavong V. Exceptionally low prevalence of refractive error and visual impairment in schoolchildren from Lao People’s Democratic Republic. Ophthalmology. 2012;119:2021-7. Med-line:22698982 doi:10.1016/j.ophtha.2012.03.049
61 Jang JU, Park IJ. The status of refractive errors in elementary school children in South Jeolla Province, South Korea. Clin Op-tom (Auckl). 2015;7:45-51. doi:10.2147/OPTO.S85992
62 Sheeladevi S, Seelam B, Nukella PB, Modi A, Ali R, Keay L. Prevalence of refractive errors in children in India: a systematic re-view. Clin Exp Optom. 2018;101:495-503. Medline:29682791 doi:10.1111/cxo.12689
63 Kleinstein RN, Jones LA, Hullet S, Kwon S, Lee RJ, Friedman NE, et al. Refractive Error and Ethnicity in Children. Arch Oph-thalmol. 2003;121:1141-7. Medline:12912692 doi:10.1111/j.1399-0004.2010.01592.x
64 Wojciechowski R. Nature and nurture: the complex genetics of myopia and refractive error. Clin Genet. 2011;79:301-20. Med-line:21155761 doi:10.1001/archopht.121.8.1141
65 Dandona R, Dandona L, Srinivas M, Giridhar P, McCarty CA, Rao GN. Population-based assessment of refractive error in In-dia: the Andhra Pradesh eye disease study. Clin Exp Ophthalmol. 2002;30:84-93. Medline:11886410 doi:10.1046/j.1442-6404.2002.00492.x
66 Castano VD, Fassa AG, Carret MLV, Vilela MAP, Meucci RD. Hyperopia: a meta-analysis of prevalence and a review of associat-ed factors among school-agedchildren. BMC Ophthalmol. 2014;14:163. Medline:25539893 doi:10.1186/1471-2415-14-163
67 Quek TPL, Chua CS, Chong JH, Hey HW, Lee J, Lim YF, et al. Prevalence of Refractive Errors in Teenage High School Stu-dents in Singapore. Ophthalmic Physiol Opt. 2004;24:47-55. Medline:14687201 doi:10.1046/j.1475-1313.2003.00166.x
68 Czepita D, Zejmo M, Mojsa A. Prevalence of myopia and hyperopia in a population of Polish schoolchildren. Ophthalmic Physiol Opt. 2007;27:60-5. Medline:17239191 doi:10.1111/j.1475-1313.2006.00419.x
69 O’Donoghue L, McClelland JF, Logan NS, Rudnicka AR, Owen CG, Saunders KJ. Refractive error and visual impairment in school children in Northern Ireland. Br J Ophthalmol. 2010;94:1155-9. Medline:20494909 doi:10.1136/bjo.2009.176040
70 Rose KA. Outdoor activity reduces the prevalence of myopia in children. Ophthalmology. 2008;8:1279. Medline:18294691 doi:10.1016/j.ophtha.2007.12.019
71 Huynh SC, Kifley A, Rose KA, Morgan IG, Mitchell P. Astigmatism in 12-year-old Australian children: comparisons with a 6-year-old population. Invest Ophthalmol Vis Sci. 2007;48:73-82. Medline:17197519 doi:10.1167/iovs.06-0263
72 Buehren T, Collins MJ, Loughridge J, Carney LG, Iskander DR. Corneal topography and accommodation. Cornea. 2003;22:311-6. Medline:12792473 doi:10.1097/00003226-200305000-00007
73 Gwiazda J, Grice K, Held R, McLellan J, Thorn F. Astigmatism and the development of myopia in children. Vision Res. 2000;40:1019-26. doi:10.1016/S0042-6989(99)00237-0
74 Kame RT, Jue TS, Shigekuni DM. A longitudinal study of corneal astigmatism changes in Asian eyes. J Am Optom Assoc. 1993;64:215-9. Medline:8454841
REFE
REN
CE
S