Embed Size (px)
Citation preview

TitlePressure effect on the eda-complexes formed betweenmesitylene, hexamethylbenzene and tetracyanoethylene incarbon tetrachloride
Author(s) Nakayama, Toshihiro; Sasaki, Muneo; Osugi, Jiro
Citation The Review of Physical Chemistry of Japan (1976), 46(2): 57-63
Issue Date 1976-12-25
URL http://hdl.handle.net/2433/47032
Right
Type Departmental Bulletin Paper
Textversion publisher
Kyoto University
brought to you by COREView metadata, citation and similar papers at core.ac.uk
provided by Kyoto University Research Information Repository

The Review of Physical Chemistry of Japan Vol. 46 No. 2 (1976)
THE REVIEN OP PHYSICAL CHEMISTRY DP JAPAN, VDL. 46, ND. 2, 1976 37
PRESSURE EFFECT ON THE EDA-COMPLEXES FORMED BETWEEN
MESITYLENE, HEXAMETHYLBENZENE AND TETRACYANOETHYLENE
IN CARBON TETRACHLORIDE
BV TOSHIHIRO NAFAVAMA, :41UNE0 SASAEI AND )IRO OSUGI
The intermolecular charge trnnster speclrn of tetracyanocthylene with mcsitylene and hexamethylbenzene have been measured in carbon tetrachloride under high pressures up to 1400kg/cms at 25'C. Both the equilibrium constants for the formation of EDA-complexes and their molar absorption coefficients x~ere increased with pressure. The values of the volume change for the formation of [he complexes were -i.l and -14.1 cms/mole for mesitylene-TCNE and HhfB-TCNE complexes, respetticeh•. For mesitylene-TCNE complez, the red shift of the absorption maximum w-as observed with increasing pressure, On the other hand, H\IB-TCNE complex showed the red shift at first and turned to the blue shift with higher pressure.
Introduction
In [be previous paperly the absorption spectra ofbenzene-tetratyanoethylene (TCNE) and toluene-
TCNE complexes in carbon tetrachloride were measured under high pressures up to 1500kg/cmE'.
The equilibrium constants were increased with pressure, giving dV=-3.4 and -4.9cm'/mole for
benzene-TCNE and toluene-TCNE complexes, respectively. And their absorption masuna shifted to-
ward Longer wavelength with increasing pressure. It a•as interpreted [hat the negative values of dV
might be due to smaller volumes of the EDA-complexes than the sum of molecular volumes of the
components in solution, actually as confirmed in solid state by X-ray diffraction for chloranil-hexa-
me[hylbenzene (HHB)zl. The red shift might be explained in terms of the increase of the refractive
index of the solvent with pressure, based on the relation proposed by Baylisss>.
On the contrary, HMB-TCNE complex in solution was found to show a red shift at 5rs[ and then
[urn to a blue shift with increasing pressurea•sl, which could be explained by neither the simple theory
of Bayliss nor the shortening of the intermolecular distanceal.
(Received September 21, 1976) t kg/cmr=0.9807 x IOs Pa
1) T. Nakayamn and J, Osugi, This louraol, 4S, 79 (1975) 2) S. C. Nallwork, !. Chem. Sac., 494 (I96Q 3) N. 5. Bayliss, !, Chem. Phys., 18, 192 (1950) 4) J. R. Gott and A. J. \faisch, ibid., 39, 2229 (1963) 5) A. H, Ewald, Traus, Faraday Soc., 64, i33 (1968) 6) K. E. Shuler, !. Cfrem. Pfryr., 20, 1865 (1965)

The Review of Physical Chemistry of Japan Vol. 46 No. 2 (1976)
tr:
The present paper
acceptor and mesitylene
deals
and
T. Nalayama,
with the studies
HMS as a donor.
Sf. Sasaki and J. Osugi
of the EDA-complexes formed between TCNE as an
Experimental
TCNE was purified by the same method described previouslyr7. Mesitylene was dried aver calci-
um chloride and distilled before use. HMB was recrystallized three times from methanol and dried
in vacuum at room temperature at least for a week. Spectrograde carbon tetrachloride was used with-
out further purification. The solutions containing large excess o([he donor were prepared so as to give
suitable absorbances of the charge transfer bands. The concentrations of the solutions at high pressure
were corrected by the Tait equation7l for the pure solvent.
All [be experimental procedures and apparazus used in [he present study are the same as those in
the previous paper, except that the sapphire windows were used instead of the quartz windows. All
the spectral measurements were cazried out only up to (400kg/cm° at 25`C, because the solution froze
at higher pressure.
Results
Spectra
The typical absorption spectra of mesitylene-TCNE and HbIB-TCNE systems in carbon tetra-
chloride at various pressures are shown in Figs, 1 and 2. The parent molecules. TCNE, mesitylene
and HMB have no absorptions in the visible region, and these broad absorption bands having the
maximum at 464 and 534 nm for mesitylene-TCNE and HMB-TCNE at 1 atm, respectively, can be
attributed to the EDA-complexes. Ewall and Sonnessael also reported 464 and 535 nm for the same
systems at 1 atm. The absorbances of the charge transfer bands were largely increased with increasing
pressure. Such a tendency was found also iabenzene-TCNE and toluene-TCNE complexesll. The relative increases of the absorbances at the maxima are shown in Fig. 3. The pressure scarcely caused a broa-
dening or a sharpening but caused the slight shift of the absorption maximum For mesitylene-TCNE
complex, the red shift with increasing pressure was observed; the absorption maxima were 464 nm at
1 atm and 468nm at 1400kg/cmr. Such a red shift was usually observed for neutral-neutral EDA-
complexes fn solutiont.assl and also fn solid s[atelo-1'-->. However. for HMB-TCNE complex, the
pressure led to the slight red shift first, but the higher pressure to the blue shift; the absorption maxima were 534 nm a[ I atm, 536 nm at SOO kg(cmr and 534 nm at 1400kg/cmr, respectively. The
i) R. E. Gibson and 0. H, Loe~er, J Amer. CSenr. Sa., 63, 598 (1941) 8) R. X. Ewall and A. J. Sonnessa, ibid., 92, 2845 (1970)
9} J. Ham. ibid., 76, 3581 (1951) 30) D. R. S[ephens and H. G. Drickamer, J. Clunr. Pkyr., 30, 1518 (1959)
11) H. W. Often, ibid., 42, 430 (1965) I2) H. W. OGen and A. H. Kadhim, fbiid., as, 269 ([966)
The Review of Physical Chemistry of Japan Vol. 46 No. 2 (1976)
EDA-Complexes Formed between Mesity]ene, I-Iezametbylbenzene and Tetrac}aaoethyleae 59
pressure 1400 kg/tm=, at which the absorption maximum returned to that at I atm, was much lower than those by other workers; about 7000 atm4~ and 5000 atms~ in dichlamethane, and IOkb in polymer
matrixtzl.
0.8
O.fi
0.4
G a 0 t 4
0.2
a
V
IV
III
II
I
40o aso 500 550
WavelenglL, am
Absorption spectra of mesi[ylene-TCNEcomplex in carbon tetracbleride at various pressures at 25°C. (initial conc., mesitylene: 5.051 x 10-°-mole/1, TCVE: x.886 x 10-~ mole/1) I: 1. atm. II: 400 kg/cm2, III: g00 kg/ cmZ, IV: I200kg/cm~, V: 1a00kg/cm~
0.4
0.3 rs
r
a
o.z
Fig. 1
o. ~
a
/~. IV
II `~ ~X I
I
Fig. 2
450 500 550 600
Wavelength, nm
:16sorption spectra of AIfB-TCwE complex in carbon tetrachloride a[
various pressures at 25°C (initial conc., FIffiB; 1.66Ix 10-mole/!,
TC\ E: O.S096 x 10-+mole/1) I: I atm, II; 400 kg/cmZ, III; 800
kg/cm~, IV: 1200kg/cm~, V; 1400 kg/cm'-
P. C
1.8
Lfi
La
1.2
1.0
0 500 1000
Pressure, kg/cm~
1500
Fig. 3 Increase of the absorbance at absorption maximum as a function of pressure. The dotted line is the square or the rela-tive density of solvent. ~: mesityleae-TCNE, ~: HMB-TCNE
Equilibrium measurement
The formation of these EDA-complexes is reversible.
The Review of Physical Chemistry of Japan Vol. 46 No. 2 (1976)
60 T. Nakayama, Df. Sasaki and J. Osugi
DtA~Complex (1 )
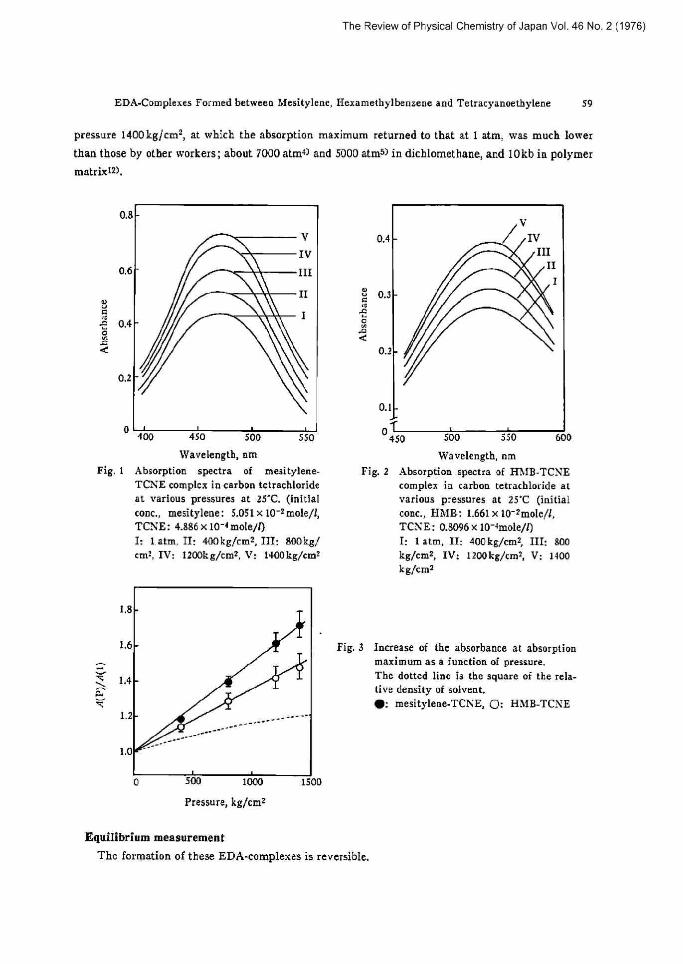
Since only 1:1 complexes are formed in carbon tetrachloridea> and the components of these complexes
have no absorption in this region, Scott's equationta} can be applied to a series of solutions in which
one of the components ([be donor in this case). exists in large excess,
[~]o[D]ol= ~ [D]ot ~ (2 ) A e Xs'
where [A]a and [D]~ are. respectively, the initial concentrations (molar unit) of the acceptor and donor. and A is the ahsorhance with [he ]igbt path length of lcm. Scott's plots for mesitylene-TCNE and
HMB-TCNE complexes are shown in Figs. 4 and 5. respectively, where each A is measured at the
i.0
e
a
0
5.0
4.0
3.0
2.0
0 1 2 3 4 5 6
[D]e x 10, mole/[
Scott's plots for mesityleoe-TCNE complex in carbon tetrachloride at various pressures
at 25°C Q: latm, n: 400kg/cm2, (]: g00kg/cm2, ~: 1200 kg/cm2. ~; 1400 kg/cm2
4.0
3.0 A
6 z 1.0
0
1.0
Fig. 4 Fig.
0 0.5 1.0 1,5 2.D
[D]ex IQ mole/( 5 Scott's plots for HMS-TCNE
complex in carbon tetrachloride at various pressures at 25°C
Q: 1 atm, ~: 400 kg/cm'-, QSDOkg/cm'--, ~; 1200 kg/cm2,
~: 1400kg/cm2
absorption maximum. The values of the egilibrium constant R and molar absorption coefficient rm.:
at various pressures were calculated from the slopes and intercepts of Scott's pints. The oscillator
strength f were also calculated from the relation,
f=4.319 x l0-' x dv~ X xm,~. (3 )
where dv~ fs the band half-width. Sfnce the change of dv~ with increasing pressure fs negligible, the
change of f is mainly due to the change of em.:, All the numerical values are listed together in Table 1.
The volume changes dV for the complex formation were determined from the slopes of approxi-
mately linear plots as shown in Fig. L. Table 2 shows [he observed values of dl', including the pre-
viousresults for benzene-TCNE and toluene-TCNE complexes.
13) R. L. Scott, Xec. Trav. Chim., 75, 7g7 (1956)

The Review of Physical Chemistry of Japan Vol. 46 No. 2 (1976)
EDA-Complexes Farmed between Mesitylene, Hexamethylbenzene and Tetracyanoethylene
Table E Equilibrium constants and spectroscopic parameters for the EDA-complexes of
mesitylene-TCNE and H1IB-TCA*E in carbon tetrachloride at 25'C
6l
Press.
kg/cmr
400
800
1200
1400
mesitylene-TCNE
x !-mole-
e,~~~, x lo-a cm-tL mole t I z..,„
nm
12.8
S.i4t0.340^
13.3
14.0
14.9
I i.7
2.40
3.05710.093^
2.61
2.Si
3,Oi
3.09
0.070
0.077
0.084
0.089
0.093
464
46B
HMS-TCI~ E
ti !. mole ~
s^~: x l0'~ cm-~ 1. mole-
a,,, nm
140
123f8.8^
lii
20i
229
242
i.16
5.1410.140"
5.20
i.42
i.63
5.73
i34
336
534
a; ref.8
2.4
2.3
2.2
1.2
a 0 J
1.]
0
O
c soo
Pressure
loon uoa
kR/cm'
Fig. fi Pressure c$ect on the equilibrium taro stants ~: mesityleae-TCVE, O: HhSB-TCNE
Consideration
As seen in Fig. 3 and Table 1, the enhancement of absorption with pressure can be ascribed not
only to the increase of concentrations of solutes caused by compression but also to the increase of li and
sm.:. Taking into account that X and dm,: aze 0.964d/mole and 385 nm for benzene-TCNE, and 1.92
!/mole and 411 nm for toluene-TCNE complexesil, it seems to be concluded [hat the higher the Iran.
sition energy hv« of the EDA-complex, [he smaller its equilibrium constant X. The similar trend
was reported in a series of aromatic 6ydrocarboa-TCNE complexes in dic6loromethanel+>. However,
the inverse trend was observed is vinyl ether-TCNE comlexeslsl. The increase of K with pressure
can be interpreted by bfulliken's original descriptionta> that both the no-bond and dative structures
have smaller intermolecular distance than the sum of the van der ~t'aals radii of the component mole.
tales. Actually, it was confirmed in solid state by X-ray diffraction studiesz>. Since the same fact is
14) R, E. Bierri6eld and W. D. Phillips, J, Amer. CGem. Soc., 80, 2778 (1958) 15) T. Arimoto and J. Osugi, Thrt Jounial, 44, 25. (1974)
l6) R. 5, Mulliken, J. Anrer. Chem. Soc., 74, 811 ([552)

The Review of Physical Chemistry of Japan Vol. 46 No. 2 (1976)
62 T. Nakayama, IDf. Sasaki and J~ Osugi
expected in solution, the volume change for the complex formation will be negative, which results in
the increase of % with pressure.
As seen in Table 2, the values of dV became more negative with the increasing number of sub-
stituents of the donor. This tendency seems to be reasonable, since the molecular size of the donor
might becomelarger with thenumber of substituents.
Table 1 Volume changes for the ED9-complex formations of TCNE and spectral shift induced by pressure in carbon tetrachloride at 25'C
Donor -eV , cm~/mole Spectral shift
Benzene
Toluene
-fesitylene
H~SB
3.4
4.9
7.1
14.t
red
red
red
red-blue
Several authors have attempted to accountfior the influence of soh•ent on the spectra of neutral-neutral EDA-completes. Since the excited state of the complex is considerably more polar than the
ground state, it has been predicted that increasing solvent polarity should cause a red shift as a con-sequence of increased stabilization of the polar excited state. This prediction, however, was not in accord with the experimental facts that the spectral shift did not correlate with the dielectic constant as a measure of solvent polarity. ivScRaerT> derived theoretically the following expression for the fre.
quency shift caused by the dipole interaction, using the soh•ent perturbation theory;
dhv.(AL+B)n1-C/D-1-neP I\ (d) 2rr-+1 ZD+i 2n +j
where (AL+B) and C are constants Characteristic of a solute, and a is the refractive index and D the dielectric constant of solvent, and dv is the amount of the red shift from vapor phase to solution. Since the second terrxi can be disregarded becaase n'-=D in nonpolar solvent, McRae's expression should be simplified [o a form similar to Bayliss' equationaf derived by using the mode! of an oscillating
point dipole in a continuum medium..9ccordingly, the following relation was obtained:
dhv ~ re1 (4 ) 2n-+i
Actually. Voigtlsl and Aihara et al.ts>found a good linear correlation between the spectral shift of EDA-complex and (n'-1)/(2n'+1) in various solvents. Furthermore, Hamal bas applied tlris relation to his pressure studies of aromatic hydrocarbon-iodine comlexes in n-heptane, but his results failed to be extrapolated to the vapor phase. On the other hand. Robertson et al.ml derived theoretically the relatton, :Jvoc p where p is the density of solvent; for non-polar solute in non-polar medium and recognized that this relation held good for some aromatic hydrocarbons in n-heptane under high pres-
I i) E. G. DScRae, !. Phys. Chem., 61, 562 (195 i) iSj bi. Voigt, iMd., 70, 598 (1966)
19) J. Aihara, M. Tsuda and H. Inokuchi, Bnll. Chem. Soc. lopan, 42, 1824 (1969) 2D) R'. R'. Robertson, 0. E. ll~eigang and F. A. iViatson, J. 3loleealar Spectro., 1, 1 (1957)

The Review of Physical Chemistry of Japan Vol. 46 No. 2 (1976)
EDA-Complexes Formed between blesitylcne, Hexamethylbenzene and Tetracyanoethylene 63
sure. According to all the suggestions mentioned above. the pressure should induce only the red shift
because both (ot'-1)/(2n'-t 1) and p are increased with pressure. And the contraction of the donor-
acceptor distance of an EDA-complex 6y pressure also should lead to the red shift, as predicted bg•
Shulersl. Thus, the spectral shift of the EDA-complexes except [he HiVIB-TCNE complex might be explained in terms of the change of solvent properties, such as the refractive index and the density of
solvent. However, as seen in the present and other studiesa•sI, the HbiB-TCI~-E complex shoe~ed a
slight red shift a[ first and then a blue shift with increasing pressure in solution. Offen and Abidi'-21 discussed the solvent effect on the EDA-complexes as follows: as the energy of the dative structure is
reduced, the enhanced mixing with the no-bond structure results in larger splittings of the ground and
excited state as seen in Fig. 7, and so the observed shift from non-polar to polar solvent results from
Excited state ~ t'" Fig. 7 Charge transfer interaction diagram Dative structure .'~ ~ Boer
di
Leo
So bond structure
-Se2/~
)1VCT
yg
Charge transfer interaction diagram
hrcr=d+a0~~t•°•••
Ba ° Ii oa- IPiSv d= IGa- SS o
iYot=~Oo Aya dr Soa= ~do 6t dr
Ground state
a balance between the red shift due to the decrease in d and the blue shift due to additional splittings
~Qo'(d+(3r''/d). Accordingly, it may he concluded that the blue shift occurs when the additional
splitting due to [he enhanced perturbation is larger than the reduced energy of the dative structure
with increasing pressure. For the HNIB-TONE complex, the amount of d is smaller than those of
other complexes as seen in the transition energy, so that even [be smaLL decrease of d by pressure
might cause the larger splittings compared with those of other complexes. The phenomenon of the
change from the red to blue shift of the HMB-TCNE complex may be explained, based on [he relative
change in d and ((ia'+t?r=)/d with pressure.
Laboratory of Playsiral Chemistry
Depwtn:ent of Ckenafsby
Facrrity of Science
Kyoto University
Kyoto 606
Japan
21) A. W. Offe¢ a¢d N. S. F. A. Abidi, 7. Chen:. Phys., 4t, 4641 (1966)


![EDA CT EDAietd.inflibnet.ac.in/bitstream/10603/752/6/06_part a.pdfsuccessfully by Foster and Fyfe [37] in the stydy of nitrobenzene complexes with several aromatic compounds. Wehrnan](https://img.dokumen.tips/doc/110x75/5b2901ce7f8b9a930c8b4907/eda-ct-apdfsuccessfully-by-foster-and-fyfe-37-in-the-stydy-of-nitrobenzene-complexes.jpg)


![Metal Complexes of Tripodal N-Heterocyclic Carbene Ligands ... · Aziridination of styrene catalyzed by [(TIMENxyl)Co]+/2 ... dtbpe 1,2-bis(di-tert-butylphosphino)ethane EDA energy](https://img.dokumen.tips/doc/110x75/5e49a27550505a29c324ce1b/metal-complexes-of-tripodal-n-heterocyclic-carbene-ligands-aziridination-of.jpg)