Embed Size (px)
Citation preview

OECD Environmental Health and Safety Publications
Series on Pollutant Release and Transfer Registers
No. 3
PRESENTATION AND DISSEMINATION OF PRTRDATA: PRACTICES AND EXPERIENCES
Getting the Word and Numbers Out

ENV/JM/MONO(2000)17
2
Environment DirectorateORGANISATION FOR ECONOMIC CO-OPERATION AND DEVELOPMENT
Paris 2000
Other Environmental Health and Safety publications onPollutant Release and Transfer Registers
Pollutant Release and Transfer Registers (PRTRs): A Tool for Environmental Policyand Sustainable Development. Guidance Manual for Governments (OECD/GD(96)32)(1996).
PRTR Series No. 1: Proceedings of the OECD International Conference on PollutantRelease and Transfer Registers (PRTRs). PRTRs: National and Global Responsibility.Tokyo, 9-11 September 1998. Part 1 (1999).
PRTR Series No. 2: Proceedings of the OECD International Conference on PollutantRelease and Transfer Registers (PRTRs). PRTRs: National and Global Responsibility.Tokyo, 9-11 September 1998. Part 2 (1999).

ENV/JM/MONO(2000)17
3
© OECD 2000
Applications for permission to reproduce or translate all or part of this material shouldbe made to:Head of Publications Service, OECD, 2 rue André-Pascal, 75775 Paris Cedex 16, France.

ENV/JM/MONO(2000)17
4
ABOUT THE OECD
The Organisation for Economic Co-operation and Development (OECD) is an intergovernmentalorganisation in which representatives of 30 industrialised countries in North America, Europe and thePacific, as well as the European Commission, meet to co-ordinate and harmonise policies, discuss issuesof mutual concern, and work together to respond to international problems. Most of the OECD's work iscarried out by more than 200 specialised Committees and subsidiary groups made up of Member countrydelegates. Observers from several countries with special status at the OECD, and from interestedinternational organisations, attend many of the OECD's Workshops and other meetings. Committees andsubsidiary groups are served by the OECD Secretariat, located in Paris, France, which is organised intoDirectorates and Divisions.
The OECD began work on Pollutant Release and Transfer Registers (PRTRs) in 1993 as a follow-up to theUnited Nations Conference on Environment and Development. In co-operation with UN organisations andrepresentatives of OECD Member governments, industry and the public, it prepared a Guidance Manualfor governments considering the establishment of PRTRs. The Guidance Manual was published in 1996; aRecommendation on Implementing Pollutant Release and Transfer Registers was adopted by the OECDCouncil in the same year.
Environmental Health and Safety Publications appear in several series, including: Testing andAssessment; Good Laboratory Practice and Compliance Monitoring; Pesticides; Risk Management;Harmonization of Regulatory Oversight in Biotechnology; PRTRs; and Chemical Accidents. Moreinformation about the Environmental Health and Safety Programme and EHS publications is available onthe OECD’s web site (see next page).
This publication was produced within the framework of the Inter-Organization Programme for theSound Management of Chemicals (IOMC).

ENV/JM/MONO(2000)17
5
This publication is available electronically, at no charge.
For the complete text of this and many other EnvironmentalHealth and Safety publications, consult the OECD’s web site
(http://www.oecd.org/ehs)
or contact:
OECD Environment Directorate,Environmental Health and Safety Division
2 rue André-Pascal75775 Paris Cedex 16
France
Facsimile: (33) 01 45 24 16 75E-mail: [email protected]
The Inter-Organization Programme for the Sound Management of Chemicals (IOMC) wasestablished in 1995 by UNEP, ILO, FAO, WHO, UNIDO, UNITAR and the OECD (the
Participating Organizations), following recommendations made by the 1992 UN Conference onEnvironment and Development to strengthen co-operation and increase international co-ordinationin the field of chemical safety. The purpose of the IOMC is to promote co-ordination of the policies
and activities pursued by the Participating Organizations, jointly or separately, to achieve the soundmanagement of chemicals in relation to human health and the environment.
ENV/JM/MONO(2000)17
6
FOREWORD
OECD work on PRTRs began in 1993 as a follow-up activity to UNCED. In co-operation with UNorganisations and representatives of OECD governments, industry and the public, a Guidance Manual wasprepared for governments considering the establishment of PRTRs. This Guidance Manual was publishedin 1996. The OECD Council adopted a Recommendation on Implementing Pollutant Release andTransfer Registers [C(96)41/Final] in the same year.
In 1998, the OECD organised a conference in Tokyo (hosted by the Environment Agency of Japan) to takestock of the status and progress of PRTR systems world-wide and to share lessons learned in developingexisting or emerging PRTRs. This conference focused particularly on the role of PRTRs as a policy toolfor sustainable developent, future directions and challenges at the national and international level, and theexchange of information on developments in system design and use. The Proceedings of this conferencewere subsequently published by the OECD [ENV/JM/MONO(99)16 PART 1 & PART 2]. One of therecommendations from this conference was that the OECD should provide guidance to its Membercountries on approaches that can be used to present and disseminate PRTR data.
Presentation and Dissemination of PRTR Data: Practices and Experiences describes a wide range ofpractices used by OECD countries to present and disseminate PRTR data to the public. This publication isaccessible via the OECD’s web page - as are the PRTR Guidance Manual, the 1996 PRTRs CouncilRecommendation, the Proceedings of the Tokyo conference, the report on PRTR Member county progressin implementing a PRTR and other material relating to PRTRs.

ENV/JM/MONO(2000)17
7
TABLE OF CONTENTS
EXECUTIVE SUMMARY ...........................................................................................................................9
CHAPTER 1 PRESENTATION AND DISSEMINATION....................................................................11
1.1 Introduction.....................................................................................................................................111.1.1 Methodology..............................................................................................................................11
1.2 The importance of data dissemination and presentation approaches .............................................121.3 Designing a system for public use ..................................................................................................141.4 Data presentation and dissemination strategy.................................................................................15
1.4.1 What are the goals of the PRTR? ..............................................................................................151.4.2 Who are the PRTR’s audiences? ...............................................................................................161.4.3 What do PRTR audiences need? ...............................................................................................171.4.4 What data are to be disseminated? ............................................................................................181.4.5 How are data to be disseminated? .............................................................................................211.4.6 How are data to be presented?...................................................................................................221.4.7 What context data or information are needed?..........................................................................22
1.5 Strategies and choices .....................................................................................................................24
CHAPTER 2 APPROACHES FOR PRESENTING AND DISSEMINATING PRTR DATA ...........25
2.1 Introduction.....................................................................................................................................252.2 Who presents and disseminates the data? .......................................................................................252.3 National government activities .......................................................................................................262.4 Joint activities of governmental and non-governmental organisations ..........................................262.5 Non-governmental organisation activities ......................................................................................272.6 Industry activities............................................................................................................................282.7 State/province activities..................................................................................................................302.8 Local/community activities.............................................................................................................312.9 Regional inter-governmental bodies...............................................................................................332.10 Academia ........................................................................................................................................352.11 Tools to enhance presentation and dissemination ..........................................................................37
2.11.1 Marketing and publicity .......................................................................................................372.11.2 Training and education..........................................................................................................38
2.12 Conclusion ......................................................................................................................................39
ANNEX 1 CORPORATE ENVIRONMENTAL REPORTING ............................................................41
ANNEX 2 HOW IS PRTR INFORMATION DISSEMINATED AND PRESENTED? ......................47
ANNEX 3 SELECTED NATIONAL PRTR REPORTS.........................................................................93

ENV/JM/MONO(2000)17
8
ANNEX 4 STATE-LEVEL PRTR DATA ..............................................................................................102
ANNEX 5 A BRIEF PUBLICITY TOOL ..............................................................................................105
ANNEX 6 WEB SITES IDENTIFIED IN THIS REPORT ..................................................................110

ENV/JM/MONO(2000)17
9
EXECUTIVE SUMMARY
The dissemination of Pollutant Release and Transfer Register data is a powerful tool for communicatinginformation about the environment. How PRTR data are presented and disseminated, and to what extent,can affect how valuable and useful they are. Furthermore, the fundamental value of a PRTR can beenhanced by the techniques used to present and disseminate the data, thereby helping a wide variety ofaudiences to access PRTR data and better comprehend what they mean.
By making this information available to the public in a form that encourages tracking, comparison andimprovement of environmental performance, PRTRs can promote pollution prevention. Government,industry, and the public all benefit from the data. While governments may use them to evaluate progresstowards achieving their environmental policy goals, industry may use PRTR data to improveenvironmental management efforts. Public access to PRTR data may also constitute a basis for dialoguewith individual facilities and can help the public better understand local conditions.
This document describes ways to present and disseminate PRTR data to the public that are currently in usein OECD countries. Chapter 1 presents specific points to consider when designing a PRTR system forpublic use. It discusses the degree and means by which the information will be disseminated, as these areimportant components of a public system. Moreover, this Chapter describes how the type of medium usedto provide PRTR data, as well as its accessibility and availability, can affect the range of audiences thatwould be able to use the data. PRTRs have generally relied on published documents that give widespreadaccess to summary data and analysis. Dissemination makes information available and the choice of adissemination approach depends on the means by which information will be distributed. The manner inwhich data are presented provides users with a tool for understanding and using the data more effectively.
Chapter 2 describes the basic elements of a presentation and dissemination strategy. Such a strategyshould be developed in light of PRTR goals, and the approaches selected for presenting and disseminatingthe data should support the goals of the PRTR system. Another important part of a strategy is determiningwho the audiences are and what they need. Ultimately, the strategy should address concerns about whatkind of data are to be disseminated, how they are to be disseminated and presented, and in which contextthey are needed.
Chapter 2 also addresses the question of who presents and disseminates the data. The predominant agentsfor disseminating data in many countries have been the government with support from non-governmentalorganisations. However, there are many other affected and interested parties who have undertaken effortsto disseminate PRTR data. For example, more and more corporate environmental reports include PRTRdata as a performance measure. State and provincial administrations often disseminate their region’s dataand have developed special tools, such as brochures, fact sheets and web sites, to provide data to thepublic. Academia frequently furnishes additional analysis of PRTR data, and complements it withcontextual data specific to a research project. And more recently, regional intergovernmental bodies havebegun to disseminate PRTR data to the public.
ENV/JM/MONO(2000)17
10
Tools that enhance the presentation and dissemination of data are described in Chapter 2. These tools playan important role in informing the public that the PRTR data for a specific year (or cycle) are availableand where to find them. Marketing and publicity techniques, as well as training and educational practices,are discussed. Specific examples of practices used in OECD countries are found in the Annexes to thedocument.
This document is not intended to serve as a comprehensive catalogue of PRTR disseminators (i.e. thepeople who release the data) or of data presentation and dissemination methods, but rather as a guide tobasic practices. It draws on an informal survey of existing and emerging PRTRs, which includes contactswith representatives of government, industry and non-governmental organisations.
PRTR dissemination and presentation tools have developed rapidly over the past decade. Undoubtedly,more change is coming. Even with the rapid expansion of access to data in recent years, PRTRs are stillin the early stages of learning how best to use new technology to disseminate and present data to achievetheir goals. Extensive web searches identified direct dissemination tools and a variety of pertinentsupplementary information.
Approaches in individual countries or regions will differ according to their priority needs and their targetaudiences. Factors influencing the choice of dissemination tools also include the characteristics andpurposes of the PRTR itself. As there are a number of approaches from which to choose, no singleapproach can be expected to serve all purposes. This document provides governments with a guide to therange of current PRTR data presentation and dissemination methods.

ENV/JM/MONO(2000)17
11
CHAPTER 1
PRESENTATION AND DISSEMINATION
1.1 Introduction
The dissemination of Pollutant Release and Transfer Register (PRTR) data is a powerful tool forcommunicating information about the environment. Government, industry, and the public all benefit fromsuch data. The value of a PRTR can be enhanced by the techniques used to present the data, helping awide variety of audiences to better comprehend what PRTR data mean.
The purpose of this document is to provide governments with information about current practices used fordisseminating and presenting PRTR data and to provide examples of approaches used in OECD countries.Practices in data presentation and dissemination can differ according to the priority needs and audiencesof individual countries and regions. This is because PRTRs are national systems: their characteristicsvary, as do their purposes. The goals and objectives of a PRTR influence the choice of disseminationtools to be applied in a given situation. For instance, a system established with the single objective ofresponding to public right-to-know may use different techniques and communication tools than systemsestablished with the objective of satisfying public right-to-know and identifying opportunities for cleanertechnologies, or for monitoring environmental policy performance.
While many PRTR data presentation and dissemination methods are described in this document, they arenot mutually exclusive. No one approach serves all purposes. PRTR disseminators, i.e. the people whorelease the data, have a variety of valid and useful tools from which to choose. This document examinesmany of the choices and methods currently used in OECD countries.
1.1.1 Methodology
This document is designed to first provide the reader with information about the presentation anddissemination of PRTR data. It answers questions such as who disseminates the data, how data arepresented and which media can be used. It also provides strategies and choices for disseminating andpresenting the data. The remainder of the document and its Annexes contain a variety of options andexamples for disseminating and presenting PRTR data.
The information in this document was drawn from informal surveys of existing and emerging PRTRs,including contacts with organisations engaged in PRTR data dissemination and presentation. Personalconversations with numerous government, industry and NGO representatives contributed valuable insightsthroughout the development of this report. Extensive searches of Internet web sites identified directdissemination tools and a variety of supplementary information pertinent to the dissemination andpresentation of PRTR data. This document is not intended to serve as a comprehensive catalogue of
ENV/JM/MONO(2000)17
12
PRTR data dissemination and presentation methods, but as a guide to the best practices that have evolvedwhile making PRTR data available and accessible to the public.
Governments revise and improve their PRTR dissemination and presentation practices over time, andInternet-based resources change very rapidly. New features to some sites have appeared as this documentwas being written, and many more such changes can be expected in the near future.
1.2 The importance of data dissemination and presentation approaches
Dissemination and presentation of data play a key role in Pollutant Release and Transfer Registers(PRTRs). PRTRs provide governments with information for evaluating progress toward environmentalpolicy goals and they help governments better manage the environment. They can encourage pollutionprevention by making the data publicly available in a form that encourages tracking, comparing, andimproving environmental performance. At the local level, public access to PRTR data establishes a basisfor initiating dialogue with individual facilities.
Box 1
What is a PRTR?
A Pollutant Release and Transfer Register (PRTR) is a catalogue or register of potentially harmful pollutantreleases or transfers to the environment from a variety of sources. A PRTR includes information about releasesor transfers to air, water and soil, as well as about wastes transported to treatment and disposal sites. PRTRscontain reports about specific pollutants such as benzene, methane or mercury as contrasted with broadcategories of pollution such as volatile organic compounds, greenhouse gases or heavy metals. Thedevelopment and implementation of a PRTR system adapted to national needs represents a means forgovernments to track the generation, release and fate of various pollutants over time.
A PRTR can play an important role in the environment policy of a government by providing otherwise difficultto obtain information about the pollution burden, encouraging reporters to reduce pollution, and engenderingbroad public support for government environmental policies. Indeed, governments may wish to set forth long-term national environmental goals to promote sustainable development and then use a PRTR as a tool toexamine objectively how well these goals are being met.1
The importance of data presentation and dissemination is reflected in many OECD documents. TheOECD PRTR Guidance Manual for Governments [OECD/GD(96)32] states that once the goals of a PRTRare selected, the next most important action is to identify how the PRTR data and results can be madeaccessible.
In their final statement, participants at the 1998 Tokyo Conference on PRTRs: National and GlobalResponsibility recommended that the OECD review the Guidance Manual for Governments to identifywhere further policy and technical guidance might be needed. Participants of the conference emphasisedthat among the areas where future guidance is needed are “methodologies for disseminating PRTR data”and “techniques used for data presentation”.2
1. Pollutant Release and Transfer Registers: Guidance Manual for Governments, A Tool for EnvironmentalPolicy and Sustainable Development, OECD, 1996 p.15.
2. PRTRs: National and Global Responsibility, Proceedings of the OECD International Conference onPollutant Release and Transfer Registers, Part I, Tokyo, 9-11 September 1998, Executive Summary, p. 17.
ENV/JM/MONO(2000)17
13
Public dissemination of PRTR data is a key aspect of a PRTR. This fundamental aspect is supported inthe 1996 OECD Council Act on Implementing Pollutant Release and Transfer Registers which calls forOECD countries to establish, implement and make publicly available a PRTR system following theGuiding Principles found in the Council Act and in the Guidance Manual. Principle 9 of the Council Actsays: “The results of a PRTR should be made accessible to all affected and interested parties on a timelyand regular basis.”
The Council Act also notes that PRTRs help fulfil the intent of Principle 10 of the Rio Declaration onEnvironment and Development of Agenda 21, which states that “each individual shall have appropriateaccess to information concerning the environment that is held by public authorities, and the opportunity toparticipate in decision-making processes and that countries shall encourage public awareness andparticipation by making information widely available”. This emphasises that the way in which data arepresented and made available to the public is extremely important.
Box 2
Role of public information in Agenda 21
Governments should: Undertake concerted activities to reduce the risks of toxic chemicals, taking into account theentire life cycle of the chemicals. These activities could encompass both regulatory and non-regulatory measures,such as . . . . emission inventories (Chapter 19.49(b)).
Industry should be encouraged to: Adopt, on a voluntary basis, community right-to-know programmes based oninternational guidelines including sharing of information on causes of accidental and potential releases and meansof preventing them, and reporting on annual routine emissions of toxic chemicals to the environment in the absenceof host country requirements (Chapter 19.50 (c)).
Governments should: Consider adoption of community right-to-know or other public information disseminationprogrammes . . . . (Chapter 19.61(c)).
Business and industry should be encouraged to report annually on their environmental records, as well as on use ofenergy and natural resources. (Chapter 30.10(a)).
In sustainable development, everyone is a user and provider of information . . . The need for information arises atall levels, from that of senior decision-makers at the national and international levels to the grass-roots andindividual level . . . . (Chapter 40.1).
Dissemination and presentation of data are an integral part of the PRTR process. Other elements in thePRTR process include data collection and management. The relationship of these elements is clearlyillustrated in the following graphic from the Netherlands’ report on its 1995 Pollutant Emission Registerdata:

ENV/JM/MONO(2000)17
14
Figure 1Schematic Overview of the Monitoring Process of Emission Data -- Netherlands
**
CEI = Collective Emission Inventory;Source categories include industry, public utilities, traffic, households, agriculture, and nature.
Source: Emission Data for the Netherlands: 1995 and Estimates for 1996
1.3 Designing a system for public use
Dissemination makes information available; choices in dissemination relate to the degree and the meansby which information will be distributed. The degree defines to which extent the public has access toPRTR data submitted by reporters, whereas the means defines the type of medium used to deliver theinformation to the public—for example on paper or electronically. PRTR programmes have generallyrelied on published documents that give widespread access to summary data and analysis. Some have alsomade use of electronic media, such as electronic bulletin boards and floppy disks, as a way to provide thepublic and interested parties access to PRTR data. The Internet has increasingly become the means ofchoice in many countries for disseminating PRTR data. Countries that do now or will soon make PRTRdata available on their web sites are Australia, Canada, Ireland, the Netherlands, Norway, the UnitedKingdom and the United States. Local and regional entities, such as the canton of Geneva in Switzerland,also make use of the Web to disseminate environmental information. It is expected that this trend willcontinue as more and more countries implement a national PRTR.
Presentation determines the manner in which information is given to audiences, in particular, whether allreported data are disseminated and to what extent does government, industry or the public provide contextto PRTR data. The contextual data constitute additional information to help users to better understandwhat the PRTR data mean.
Under many PRTRs, data are analysed and presented geographically, using static maps to illustratefindings, or using interactive maps for dissemination (as in web sites). PRTR data may also be aggregatedby industry, by facility, by chemical substance or groups of substances, or by other subsets. Thesepresentations generally rely on data tables, whether published in printed reports or generated as a result ofuser searches on interactive web sites. These choices are not mutually exclusive. Printed publications andweb sites that offer PRTR data to the public generally make use of most or all types of data presentationmethods.

ENV/JM/MONO(2000)17
15
Under many PRTR programmes, reported data are actively disseminated. The information is placed onthe Internet, distributed on CD-ROMs and summarised in annual reports to make it widely available to thepublic. A few PRTR programmes have a more passive approach to dissemination whereby data are madeavailable upon request, but are not widely distributed to the public.
1.4 Data presentation and dissemination strategy
When a government elects to initiate a PRTR system, deciding on how to provide the data to affected andinterested parties is of major importance. The presentation of PRTR data communicates to the publicinformation about their environment. Placing it in a format that can be easily understood and usedenhances the potential benefits of the data itself. Similarly, the degree to which the data will be madeavailable and accessible determines the effectiveness and scope of the PRTR system.
One of the first steps in designing a PRTR is to develop a strategy for data dissemination and presentation.This strategy will help guide the development and implementation of a PRTR. The first questions thatneed to be asked in developing a dissemination and presentation strategy are:
• What are the PRTR’s goals? How can the dissemination and presentation strategy help realisethem? What types of data tools are needed (e.g. GIS) to support the PRTR's goals?
• Who are the audiences? PRTRs seldom, if ever, have a single audience. The public, industrygroups, individual companies, environmental citizens' organisations, government agencies, andothers have needs for and interest in PRTR data.
• What do the audiences need? As information needs vary widely among the groups that have astake in PRTR data, it is important to identify each audience's needs and design a strategy that willmeet these needs.
• What data are to be disseminated, e.g. full sets of reported data, aggregated data, data sorted bydifferent themes or topics? What additional information is to be disseminated, e.g. longitude andlatitude data and trend data?
• How are data to be disseminated? Which media will be used, e.g. paper (summary reports, factsheets, special reports), or electronic (Internet, CD-ROM)? Will data be actively disseminated?
• How are data to be presented? How can they be presented so that all levels of affected andinterested parties can easily understand them?
• What context data are needed (geography, economic, production volume, etc.)?
The following sections of this Chapter will address each of these points more fully.
1.4.1 What are the goals of the PRTR?
Governments institute or expand their PRTRs based on specific goals and objectives. A government'sgoals are central to determining the methods of dissemination and presentation it will select. Generallyspeaking, the aims of national PRTRs include, inter alia:

ENV/JM/MONO(2000)17
16
• Fulfilling the public’s right-to-know;
• Identifying opportunities and encouraging pollution prevention;
• Encouraging cleaner production;
• Improving public participation in environmental policy decision-making;
• Identifying areas for action (e.g. hot spots of pollution or of a "specific" chemical) and settingpriorities;
• Measuring progress toward environment goals and policy objectives;
• Monitoring policy performance; and
• Improving the public’s understanding of environmental issues.
1.4.2 Who are the PRTR’s audiences?
There is a great variety of users of PRTR data, ranging from all levels of government to the generalpublic. This section deals with the primary audiences for PRTR data and what is needed to help thembetter understand and use the data. A good example of the range of audiences that would be interested inPRTR data is found in a report on environmental reporting by corporations. The Canadian Institute ofChartered Accountants identified the following audiences as being interested in environmentalperformance information: employees, investors, creditors, governments, communities, suppliers,consumers, environmental groups, educational institutions, professional and industry associations, and themedia (Reporting on Environmental Performance, 1994, 34-40, The Canadian Institute of CharteredAccountants).
Policy-makers benefit from integrated release and transfer data as they provide them with a sounder basisfor choosing and implementing new environmental programmes. Such data are important whenevaluating existing incentives and controls. They can help identify trends that indicate potentialenvironmental stress or improvements. For government regulators and other reporting facilities, PRTRdata represent an additional tool for tracking compliance and other activities.
Individual facilities often find that the process of estimating releases and transfers reveals previouslyunrecognised opportunities to identify leaks, reduce waste and save money. Industry groups such as tradeassociations assess PRTR data to identify potential problems, encourage effective practices specific to theindustry, and promote recognition of industry improvements. In addition, firms often use PRTR data toindicate progress in the reduction of releases or transfers of pollutants under Environmental ManagementSystems (EMS) they have implemented.
Public dissemination of PRTR data is critical for meeting access to environmental information/right-to-know goals. Communities depend on publicly available information to identify potential risks andpriorities, as well as to facilitate industry-community co-operation toward improving local conditions forhuman health and environmental well-being. A public record can encourage all parties toward positiveaction by establishing a baseline and a means for measuring progress.
Non-governmental organisations—principally environmental citizens’ organisations—both use anddisseminate PRTR data. Their needs for PRTR data reflect their individual purposes and goals, as well astheir constituencies. As a PRTR audience, NGOs priorities and interests are as diverse as the nation’scitizenry.

ENV/JM/MONO(2000)17
17
In addition to NGOs, the financial sector, researchers, academics and factory workers all use PRTR data indifferent ways. Researchers and academics might use data for modelling or other studies. The financialsector use PRTR data for evaluating investment proposals or for considering insurance issues. Factoryworkers often use data to find out what is being released or transferred from their plant.
1.4.3 What do PRTR audiences need?
The different needs of PRTR audiences influence both dissemination and presentation choices. Summarydata and presentations that emphasise overall trends principally serve as an overview, indicating to thebroadest audiences what progress is being made and where such progress is lacking. On the other hand,detailed subsets of the data or complete raw data may be essential to meet many of the specific needs ofparticular audiences. Consultation with potential audiences or users of PRTR data—the public, industryand NGOs—is an essential step in identifying information needs that a PRTR could address. Doing thishelps to focus resources and efforts on approaches that best meet the needs of the public. Carefulexamination of goals, audiences, and specific information needs may suggest particular deliverymechanisms for making data available in different ways to meet various aims.
Policy-makers can benefit from an analysis of aggregate PRTR data, looking at trends in:
• specific substances and groups of substances (such as carcinogens; persistent bio-accumulativetoxins; VOCs; contributors to smog formation; ozone depleters, etc.);
• performance by the various industrial sectors;
• geographical distribution, including ecosystem analysis; and
• performance of particular environmental policies.
Some audiences can be partners in the dissemination process. Industry associations commonlydisseminate a summary of PRTR data or this data is integrated into a company environmental report.Non-governmental organisations can serve as a bridge between local, regional and national concerns andwill often analyse, interpret and deliver PRTR data for use at the local level. Inter-governmentalorganisations, tracking international mandates, could potentially offer the same service at the internationallevel. Leveraging activities with these groups can help bridge any gaps in a national dissemination plan.
Government officials responsible for applying existing regulations can benefit from access to facility-specific PRTR data as this provides them with precise information to determine “hot spots” (specificgeographic concentrations), opportunities for pollution reduction and prevention by source, and otherdetailed analyses. Data can be also used for land-use planning and for emergency preparedness planning.Research institutes use full PRTR data sets for modelling and other planning activities.
Industry can benefit both as users and disseminators of PRTR data as they prepare and track their owndata. Facility and company personnel can identify cost-saving pollution prevention opportunities. Manycompanies use PRTR data as an input to their corporate environmental reports, which are themselves usedby financial, environmental and community audiences. Opportunities for cleaner production and pollutionprevention can be identified through the generation of site-specific data. Often facilities use PRTR data tocompare environmental performance with others engaged in the same business activities. Tradeassociations and other business groups use PRTR data to track and publicise industry-specific progress inreducing releases and transfers of pollutants. PRTR data also help industry leaders identify needs for

ENV/JM/MONO(2000)17
18
technical assistance on particular problems, whether industry-wide or evident only among a subset offacilities.
Like governmental audiences, the public and NGOs have varying needs for PRTR data that affect how thisdata might be best presented and disseminated. Often public interests centre on a particular locality.Some interests extend to both human and ecological populations, locally or in wider geographic regions.NGOs generally focus their attention on potential risk for health problems, such as exposure to cancer-causing substances or to allergens. Academia and research organisations working on risk screening usePRTR data for a range of activities, including as an input into different models. Other groups might focuson working with particular industries.
1.4.4 What data are to be disseminated?
Decisions about audiences and their needs determine what data are made available and to whom.Typically, PRTRs require facilities to quantify the amounts of listed substances released to eachenvironmental medium (air, water, land) or transferred to other locations for some form of wastemanagement. National PRTRs vary considerably in terms of the list of chemicals that must be reported,the industries or business categories that must report, and the types of releases (by medium) and transfers(by waste management activity) identified. Another basic attribute of PRTRs is their regular collection ofdata, in most cases annually. These characteristics—critical for assessing trends and tracking progress—influence dissemination plans and practices. Table 1 provides a summary of PRTR programmes in OECDcountries.
A key decision for governments is whether to disseminate all, some, or none of the full set of reportedPRTR data and to what extent it will be disseminated. This decision is influenced by the goals of thesystem itself. The most extensive dissemination programmes offer readily available public access to thecomplete PRTR database. At the other end of the spectrum are PRTRs that offer the public onlyaggregated summary data. These may be limited to national totals summed by release medium (air, water,land) and by chemical, or the data may be aggregated by political subdivision (province, state,municipality). Therefore, the goals of the PRTR play an important role in determining what todisseminate. For example, if the goal is to provide national trends for groups of chemicals to the public,then aggregated data can suffice. If the goal is to provide government or academia with data forenvironmental research or modelling, then the reported data are needed. Aggregated data can help policymakers determine trends, but reported data helps them measure policy performance.
The amount of data made publicly available determines the kind of analyses interested parties canconduct. Different kinds of summary data are useful for tracking general trends. This can be done bytheme, pollutant, annual releases or transfers, facility, or sector. In combination with other environmentalinformation, the data can also contribute to an overall picture of pollutants being released and transferred.PRTR data for specific substances are necessary for inputs into evaluating potential risks and settingpriorities for action. Industry-wide data can also serve priority-setting needs. Distribution of raw data,however, is essential for many applications, such as tracking environmental performance, assessing theeffectiveness of existing emergency plans, modelling, analysing pollutant sources in a watershed orairshed, identifying the types of business activities associated with releases of chemicals of greatestconcern, or for performing other valuable analyses.
ENV/JM/MONO(2000)17
19
Box 3
Issue: Commercial confidentiality and data dissemination
While there are terms by which reporting facilities may claim confidentiality of data, the idea of confidentiality shouldnot inhibit the dissemination of data. The OECD's PRTR Guidance Manual urges that "clear and concise guidancemust be provided to reporters" and suggests that governments "may wish to…require reporting facilities to suggestgeneric information for each item claimed as confidential". The use of more general data to substitute for specificdata claimed as confidential is important because PRTRs seek to characterise releases and transfers. If data areomitted, mistaken conclusions may be drawn.
Provisions governing confidentiality affect dissemination in two ways. First, clear guidance as to what constitutes avalid claim and the existence of procedures to deal with frivolous claims assure that confidentiality is not casually andneedlessly invoked. Second, explicit limits on the information that may be withheld, including substitutions of genericdata, assure that the privilege of confidentiality is limited to "trade secret" data, not to information needed to meet thepublic's right to know.
Existing PRTR systems have explicit and limited provisions under which businesses may claim that data areconfidential. As a result, little data have been withheld from public view. In Canada and the United States, forexample, only a dozen or so PRTR reports received in each country have claims of commercial confidentiality eachyear. In the United States, the following requirements are intended to discourage frivolous use of the confidentialityoption:
• a top corporate official must review and sign the submission;
• information to substantiate the claim must be submitted at the time the TRI report is filed (not depending uponlater agency requests or delays);
• only the chemical identity can be withheld, substituting a generic identification; and
• penalties apply for corporate officials who falsely claim trade secrecy.
While Canadian facilities can withhold from the public the reports for which they claim confidentiality, all data in atrade secret report, other than the chemical identity, is made publicly available. Annual dissemination of the US TRIdata includes all amounts of reported releases and transfers. In the first year of reporting, only 40 submissions out ofmore than 74,000 claimed commercial confidentiality. In the 1997 data, 11 TRI forms out of 71,670 submittedclaimed confidentiality, and their releases represented only a tiny fraction of the total in the database.

ENV/JM/MONO(2000)17
20
Table 1Compiled results of government responses to the 1999 OECD PRTR questionnaire on Member country progress

ENV/JM/MONO(2000)17
21
1.4.5 How are data to be disseminated?
Data from PRTRs are shared with public audiences primarily through four media: print publications,Internet web sites, electronic media (floppy disks, CD-ROMs), and direct on-line data access. Printpublications may also be preserved on microfiche.
Reporters and industry associations often disseminate summary reports of their PRTR data and annualenvironmental reports with PRTR data included. More and more companies are placing their PRTR dataon company web sites. For example, the Canadian Chemical Producers Association's (CCPA) annualreport, Reducing Emissions: Emissions Inventory and 5 Year Projections, provides a summary of reporteddata and reduction targets from their members.
In the US, public interest groups work together with local communities to create geographic databases,publish newsletters explaining local environmental conditions, and publish PRTR data in localnewspapers.
The following table illustrates possible intersections of different types of PRTR information with availabledissemination methods. A completed table that incorporates a PRTR dissemination plan could differsubstantially from one government to another. A government may choose to make its complete PRTRdatabase accessible via direct on-line access or an electronic Bulletin Board Service (BBS), whilepublishing summary reports both on the Internet and in print. Another country’s PRTR may use theInternet to give the public access to its complete database and make selected subsets of data available ondiskettes. Annual printed reports that summarise PRTR data will often be made available on the Internetas well—Acrobat® PDF files allow such print-based documents to be downloaded from web sites and readon-screen or printed locally by any interested web visitor.
Table 2Data Dissemination Methods
Electronic Other (userrequest –
newsletters,reports, factsheets, data
sheets)
PrintPublica-
tions
InternetOtheron-line
databaseCD-ROM Diskettes
DataCompleteSelectedSummarySupplementary(Context data)
AnalysesSummaryTrendsSpecial
ENV/JM/MONO(2000)17
22
Costs inevitably will affect the choice of dissemination options. For governments with limited resources,printed publications may be the primary tool for disseminating PRTR data. Simple and inexpensiveprinted materials can be easily and effectively used to promote the availability of PRTR data. Forexample, a simple flyer can be used to promote access and knowledge of how to find PRTR data, whetherthe data are Web-based, printed, or on computer diskette.
1.4.6 How are data to be presented?
PRTR data presentations should reflect the disseminators’ priorities. National summaries, presented intables and charts, inform audiences of progress toward broad environmental goals as well as trends. Thesegeneral presentations can answer such questions as: what total quantity of listed substances was reported?How were these pollutants released (to air, water, land, or underground) and transferred (to recycling,treatment, disposal, etc.)? How have the amounts changed over the years?
PRTR data can be analysed by many factors, for example by chemical group, geographic region, industrialsector or activity, type of release or transfer, type of media, and other parameters. Presenting the resultsof these analyses focuses attention on particular problems and opportunities, whether at national,state/provincial, or local levels. Incorporating available facility-specific data serves community needs andcan aid both local governments and citizens’ groups with their analyses.
Visual tools serve particular purposes in presenting the findings of PRTR data analysis. Charts (barcharts, pie charts, line graphs) help to clarify the distribution and trends of many other analyses. Thesevisual tools illustrate, but do not replace, the reported data. Charts and tables together are complementarytools for accurate and appropriate interpretation of data. Maps are the tool of choice for displaying theresults of geographic analyses. Geographic presentation of data is fast-becoming an important feature ofmany PRTR systems. Maps and the geographic presentation of pollutant concentrations provide userswith a simple and understandable presentation of conditions in a community, ecosystem or province.
Presentations of data by a specific theme or ranking could be helpful for many audiences. Rankingstates/provinces or smaller regions, industry groups, and individual facilities by total amounts released tothe environment could help audiences identify areas of the greatest potential importance. Ranking theseor other groups by specific environmental media (air, water, land) can be a first step in setting prioritiesand developing practical action plans. Facility lists, in particular, can be made more useful by presentingthe same data first in rank order and then by location.
Published reports—even those that include facility-specific information—usually offer only selected datafrom the PRTR database. Even the most detailed documents may, for example, provide the amounts ofeach chemical that a PRTR reporter ships to other facilities for waste management, but not identify thereceiving locations. Publicly accessible electronic databases may also supply only selected subsets ofdata. Even where complete data are made available, choices among forms of presentation involveselecting the data to be presented and emphasised.
1.4.7 What context data or information are needed?
Governments and other PRTR disseminators may supply external data to help users put releases andtransfers into context. These include geography, ecology, toxicity, demographics, economics, and othertypes of information. Economic data, for example, enhance PRTR analyses by business sector, whiledemographic data assist in priority-setting and decision-making processes. Local community contexts—

ENV/JM/MONO(2000)17
23
ranging from demographics and school locations to information on sewage and water treatmentcapabilities as well as details of land use—are especially important for many applications of PRTR data.Chemical/physical properties, health and environmental effects, and information on the fate and transportof a substance in the environment can provide important information for putting PRTR data in context.Information on common uses of reportable substances, their role in industrial processes, and their likelypresence in products represents another category of contextual information.
Contextual information can be especially valuable for establishing the particular significance of PRTRdata in local or regional conditions. Overlaying facility locations on watershed and airshed maps makesclear the potential influence the facilities' releases may have on the environment. Information on thepersistence of chemicals in environmental media and their tendency to bio-accumulate through the “foodweb” can aid in assessing such releases. Stream flow data are essential to understanding the movement ofpollutants discharged to rivers; equally important here is information on the environmental fate of thepollutants—does a particular substance settle quickly to the river bottom, evaporate to air, persist in wateras it travels far downstream? These examples also suggest the potential value of considering information(usually from other government agencies) on non-PRTR substances emitted to air or to surface waters inconjunction with PRTR data.
Among the most keenly sought contextual data for PRTRs is information on the toxicity and hazard oflisted chemicals. PRTR data providers and data users alike have focused increasing attention on suchinformation in recent years. Health effects data and descriptions of toxicity can boost the applicability ofchemical-specific release data reported to PRTRs, but information on health effects and toxicity can alsobe difficult to apply and interpret appropriately. Governments may refer audiences to reliable sources orcollate and supply this information themselves.
Box 4
Types of contextual informationthat are used with PRTR data
• Geographic
• Economic
• Demographic
• Land use
• Chemical or physical properties
• Production
• Ecology-ecosystems
• Toxicity
Industry observers are among those who have called for information on the toxicity and health effects ofPRTR-listed substances to be provided as context when PRTR data are disseminated. Most governmentsmake efforts to supply such information or to point data users to reliable sources of such information. Asnoted in Annex 1, some companies are now publishing their environmental report data with toxicityweightings. These weightings help them set priorities for pollution prevention and reduction activities.
Governments and other PRTR data disseminators may provide additional analyses that “normalise” datafor production levels (often reported to PRTRs as a production index or ratio, comparing the current andprevious years). It is important to note that these are supplemental analyses. Production-adjusted data donot allow tracking of progress toward policy goals. In publishing their own environmental reports,
ENV/JM/MONO(2000)17
24
corporations often choose particular contexts in which to place their environmental data. Many recasttheir release data in relation to production volumes, publishing only, or principally, production-relatedrelease data; these may be expressed in per unit of production or totals may be adjusted by a productionindex.
Table 14 in Annex 2 illustrates a variety of characteristics included in a number of PRTR web sites, aswell as some of the contextual data that can be used to provide additional explanation and clarification forthe data.
1.5 Strategies and choices
Developing an effective PRTR dissemination strategy will depend on the relationship of the PRTR’sgoals, the data collected, the data disseminated, and the available contextual data. As goals of a PRTRdiffer, strategies and choices in the type of dissemination and presentation techniques to be used will alsodiffer. In particular, governments may have specific programme goals. A principal goal of theNetherlands’ Pollutant Emission Register (PER) is to track environmental policy goals: “The databasecontains the necessary information about the emissions of all relevant species or compounds, for which anenvironmental policy or emission reduction target has been formulated…”. PER data “can be aggregatedto the level of environmental themes distinguished in the Netherlands’ National Environmental PolicyPlan”, namely: climate change, ozone depletion, acidification, eutrophication, and dispersion.3
Experience of OECD countries indicate that PRTRs change over time as environmental programmesprogress and additional, or different, data are needed.
The very broad constituency that government serves may also influence assumptions and practices ofgovernment agencies engaged in disseminating PRTR data. As noted above, some PRTR audiences alsohave a role as disseminators themselves. Organisations outside the governmental structure, on the otherhand, may represent quite specific constituencies and aims. Many NGOs, for example, advocateenvironmental improvement and protection of human health. A government’s strategy will reflect its ownpriorities, but can also take into account the benefits of dissemination activities and presentationapproaches of other potential disseminators. Company and trade associations often produce reports toshow reductions in PRTR releases and transfers and will indicate goals and targets for future reductions.Data on potential health effects and comparable risk are also included. Inter-governmental bodies may bemore likely to focus on long-range transport of pollutants, as it is well known that releases know noborders. Their constituencies, however, include member governments with different approaches to PRTRactivities. Local communities will focus on local conditions. The assumptions and goals of the variousagents of dissemination will influence their approaches to publishing and publicising PRTR data.
3 . The Pollutant Emission Register in the Netherlands, C.W.A. Evers, Ph.D., paper presented at PRTRWorkshop for Countries of the Americas, Querétaro, Mexico, July 29-31, 1997.

ENV/JM/MONO(2000)17
25
CHAPTER 2
APPROACHES FOR PRESENTING AND DISSEMINATING PRTR DATA
2.1 Introduction
Governments have adopted a range of plans and practices for sharing PRTR data with the public and withtargeted audiences. This Chapter first examines options that disseminators of PRTR data have and thenidentifies specific PRTR dissemination and presentation methods, again looking at options and examplesfrom current practice. It also addresses the different approaches used by governments, NGOs, industry,state governments, local communities, and intergovernmental and regional bodies to present anddisseminate PRTR data. To provide additional information about using the Internet as a tool for datapresentation and dissemination, Table 14 in Annex 2 lists characteristics from selected PRTR-related websites. These characteristics can also serve as a potential checklist of options for governments that aredesigning or expanding their plans for making PRTR data available and useful to targeted audiences.
2.2 Who presents and disseminates the data?
The predominant agents for disseminating PRTR data have been the governments that collect the data andnon-governmental organisations. In some countries, NGOs have played a substantial role in bringingPRTR data to the public and making them more understandable. Over time, the interaction ofgovernmental and non-governmental disseminators has helped to make PRTR information more widelydisseminated and used. Other distributors of PRTR data include intergovernmental bodies, industrygroups, individual corporations, and academia. Regional and intergovernmental bodies are also takinginformation on toxic-chemical releases and transfers to larger audiences for which the utility of such dataacross local and national boundaries is enhanced.
For PRTRs that are under development, a key question may be the extent to which the government itselfundertakes the dissemination and presentation of PRTR data, not only making the data available to thepublic, but also educating the public to their meaning and use. Some governments explicitly call on non-governmental entities, academia, and other bodies to publish the data and to help the public learn how tointerpret them. Some of these external disseminators help to make PRTR data available to the widestpossible audience. Others develop specific analyses and presentations of the data to address particularconcerns and interests. Some groups, in particular environmental citizens’ organisations (ECOs) that areorganised at the national level, may do both.
The existing national PRTRs have accumulated considerable experience with dissemination of the datathey gather—some have a decade or more of such experience. Some countries have identified widespreaddissemination of information as a priority right from the start; others have taken an incremental approach.Governments that are planning, or have begun, implementation of a PRTR exhibit a range ofcommitments to data dissemination. Some have committed considerable resources to developing tools forpublic access even before their first year of full reporting. Others plan to share only broadly aggregateddata summaries for their initial reporting years. Methods and means of sharing information collectedthrough a PRTR show equally broad scope both for well-established PRTRs and those in the planning anddevelopment stages, thus offering useful examples of approaches to making data available, accessible, and
ENV/JM/MONO(2000)17
26
comprehensible to a large number of audiences. Examples found in Annex 2 illustrate the variety ofpractices used by OECD countries.
2.3 National government activities
Governments play a prominent role in PRTR data dissemination. This is especially important “to ensurethat affected and interested parties are provided access to information on an equal and equitable basis”.4
While governments take the early lead in active dissemination, over time non-governmental organisationsoften play an increasing role in delivering PRTR data to the public and helping the public learn to usethem.
In most countries, government is the principal actor in publicising PRTR results. Examples of somenational governments that have the leading role in actively disseminating their PRTR data includeAustralia, Canada, the Netherlands, and Norway. Some of these countries have focused their activitiesdirectly on developing tools for public access to, and use of, PRTR data.
Australia’s principal dissemination tool for the National Pollutant Inventory (NPI) is the World Wide Webon the Internet. Australia tested its searchable NPI pilot database on the Web before it made the NPI datafor the first reporting year (ending June 1999) available on the Internet in January 2000. As the NPIdevelops, the structure of the Australian government suggests a potential future role by both governmentaland non-governmental agencies at the state and territory level in the dissemination and interpretation ofPRTR data.
The Netherlands began publishing summaries of its pollution emission inventory data in print in 1990 andhas developed a detailed report format that illustrates the annual results and specific trends over time withnumerous charts and graphs. The Netherlands has developed a Datawarehouse for its Pollutant EmissionRegister (PER) data that is available the on Web and on CD-ROM. The Datawarehouse allows interactivesearching of the database.
The Ministry of Environment in Norway produces an annual report, Pollution in Norway (Forurensning INorge), in which trends in the PRTR data are summarised. Full data sets are also made available tocitizens upon request. The Norwegian PRTR database (i.e. the full set of reported data) will becomeavailable on the Internet by 2000.
2.4 Joint activities of governmental and non-governmental organisations
In the United States, both the government and NGOs have actively disseminated data from the US ToxicsRelease Inventory (US TRI). The US EPA has published annual reports and analyses of TRI data and inits first years of operation placed data on the National Library of Medicine's (NLM) Toxnet system. Aftera few years, the US EPA worked together with the RTK NET—a non-governmental entity—to provide thepublic on-line electronic access to the database. Operated by two non-profit organisations, OMB Watchand The Unison Institute, RTK NET (http://www.rtk.net) was established in 1989 specifically in supportof the Emergency Planning and Community Right-to-Know Act of 1996 that established the US TRI andmandated public access to TRI data. It is worth noting that government agencies and private foundationsfund the RTK NET.
4. PRTR Guidance Manual for Governments, OECD/GD(96)32, p. 93.

ENV/JM/MONO(2000)17
27
A decade later, the Environmental Defense Fund (now called Environmental Defense) has taken aprominent role in PRTR data dissemination with its Internet-based Environmental Scorecard(http://www.scorecard.org). The scorecard provides a database by which users can quickly identifyreleases in their local areas (by zip code) and find information on the potentiality of risk. This site offersmany interactive features, covers several important environmental databases, provides useful contextualdata, connects environmental information, and breaks new ground in publishing—for widespread citizenuse—toxicity weightings of the pollutants.
Environment Canada publishes an annual summary report both on the Internet and in print and makes itsNational Pollutant Release Inventory available on a web site in several useful formats—summary reports,supplementary tables, searchable data, and downloadable databases (http://www.ec.gc.ca/pdb/npri).Environment Canada, having first taken the principal role in making data public, is now developingpartnerships with Canadian environmental organisations to expand and improve public access to, and useof, NPRI data.
While Canadian NGOs have not been directly active in dissemination processes, they have been involvedin PRTR issues, and Environment Canada has begun working with them to expand its PRTR outreach.The Canadian Institute for Environmental Law and Policy (CIELAP), for example, has participated inboth Canadian and OECD activities on PRTR topics. CIELAP is currently developing a Citizens’ Guideto the National Pollutant Release Inventory and is involved in developing local maps of NPRI releases andtransfers. Both projects, which are funded by the Canadian government, are aimed at improving thegeneral public’s knowledge of PRTR data, their importance, and their uses(http://www.cielap.org/infocent/index.html). With public and private funding, three organisations—CIELAP, the Canadian Environmental Defense, and the Canadian Environmental Law Association—arenow exploring development of an interactive Scorecard for NPRI data on the Web, similar to that recentlyinstituted for the US Toxics Release Inventory by Environmental Defense. Tools such as the Citizens’Guide, local mapping, and the potential Scorecard are viewed as important aids to generating publicawareness and expanding the use of NPRI data in coming years.
Since the initiation of the TRI, the US EPA has distributed TRI data on diskettes (for each US state) andmore recently on CD-ROM (containing a full set of reported data). In recent years, the US EPA has alsogiven TRI data users the opportunity to download complete data for each US state directly from the Web.With the advent of the Internet, the US EPA has also developed its own on-line access to the TRI data. Inaddition, EPA’s Envirofacts offers one-stop access to seven EPA databases. Envirofacts includesmapping capability and offers extensive query options (http://www.epa.gov/enviro).
2.5 Non-governmental organisation activities
Under some PRTR systems, NGO’s have played an increasingly important role as agents fordisseminating PRTR data. During the first years of operation of their PRTR systems, some governmentsactively disseminated summary reports and made full data sets available upon request. In 1994, in theUnited Kingdom, the Friends of the Earth (FOE) obtained the Chemical Release Inventory (CRI) datafrom the government. Upon receipt, FOE made the data more widely available through the Internet. FOEdeveloped maps and search tools so that users could locate data of local interest. The United Kingdom’sEnvironment Agency, seeing the value of publishing such data on the Internet, now has a web site withcurrent data from its updated and expanded Pollution Inventory, which replaces the CRI. The UKEnvironment Agency's site includes tools for searching and mapping the data. At the same time, theFriends of the Earth has introduced an advanced tool for presenting the data, Factory Watch
ENV/JM/MONO(2000)17
28
(http://www.foe.co.uk/campaigns/industry_and_pollution/factorywatch/). This tool is used to analysePollutant Inventory and CRI data and retrieves facility-specific information from the database.
Mexico has expressed interest in relying on NGOs to take the lead in disseminating PRTR data until theirPRTR programme phases in. In the Czech Republic and other central European countries, non-governmental organisations and academia have been instrumental in moving forward on plans for PRTRs.In these countries, NGOs can be expected to take active roles in dissemination, including educating thepublic on the importance and use of PRTR data (see http://mole.utsa.edu/~matserv/iheal/). EnvironmentalCitizens' Organisations (ECOs) from 33 European countries actively support establishing PRTRs to fulfilthe right-to-know provisions of the 1998 Åarhus Convention, confirming their commitment to publicdissemination and the use of such data (Chisinau Declaration, April 1999).5
Although Canada mounted its own NPRI data on the Internet and continues to do so, the complete NPRIdatabase was first made available by way of RTK NET, an active US non-governmental organisation.
2.6 Industry activities
Industry has also contributed to the publishing of PRTR data. Using the data to track progress in reducingreleases and transfers of PRTR substances, individual corporations and industry trade associations haveboth helped to foster awareness of PRTR data among various constituencies. In some cases, corporationshave publicly reported data not only for facilities in countries covered by PRTRs, but also for facilitieslocated in countries that have no such pollutant register in place. Collecting these data can be beneficialfor the company itself, providing it with: a consistent overview of environmental releases and transferredwaste; an opportunity to identify and prioritise risks; a means to identify opportunities to reduce pollutionand cut costs; and a straightforward tool to track progress.
a) Corporate environmental reporting
Corporate environmental reporting and PRTRs have grown in parallel over the past ten years.Environmental reports and PRTR data are increasingly available on company web sites. In contrast togovernments and NGOs, businesses and trade associations make use of PRTR data to track and publiciseenvironmental performance. Their publishing of these data brings company-specific environmental data,which may include PRTR information or similar data, to the attention of specific audiences who otherwisewould not necessarily focus on broader environmental information tools such as PRTRs. Some examplesof corporate environmental reporting are provided in Annex 1.
Corporate environmental reports, often containing PRTR data, are typically distributed to shareholdersand employees. Other interested recipients include not only environmentally concerned citizens, but alsofinancial analysts, as environmental issues assume a larger role in investment evaluations. To someextent, corporate environmental reports supplement—and resemble—companies’ annual reports toshareholders. A principal difference lies in the financial statements that accompany annual corporatereports. These are expected to conform to generally accepted accounting standards and to provide anaccurate view of the company’s business performance. Despite the variety of guidelines issued for
5. Negotiated through the UN Economic Commission for Europe (UNECE) and adopted in 1998, the ÅarhusConvention, provides an international legal framework that strengthens the environmental rights of citizensincluding rights to have access to information, participate in and influence decisions, and go to court. In theChisinau Declaration (http://www.participate.org/convention/Eco-report.pdf), adopted in April 1999,representatives of Environmental Citizens’ Organisations from 33 UNECE countries called on signatoriesof the Åarhus Convention to commit to a legally binding instrument requiring the establishment of PRTRs.

ENV/JM/MONO(2000)17
29
corporate environmental reporting, data standards have not become commonplace for these publications.The Global Reporting Initiative (see Annex 1) is working on standardised reporting, particularly for useby financial analysts.
Many corporations that publish environmental reports, especially those that have been doing so for severalyears, have begun setting their own targets for reducing emissions. The annual environmentalpublications thus become a public record for tracking progress toward these goals.
Over the last decade, three trends seem evident. More companies published annual environmental reportsin the late 1990s than did so in the late 1980s. Companies with experience in publishing such reports havetended to expand the range of issues that they address. While these trends are encouraging, such activitiesare more likely to be undertaken by large corporations. According to a 1997 editorial in EnvironmentalAccounting & Auditing, one out of three large multinational corporations publish an annual environmentalreport.6
The European Union’s Eco-Management and Audit Scheme (EMAS), which went into effect in 1995,provides a legal framework for companies that choose to improve their environmental performance. If acompany opts into EMAS, it collects, verifies, and reports data at the facility level, and makes the resultsof EMAS audits public. The environmental statement is to be designed for the public and written in aconcise and comprehensible manner with technical information appended. Incorporating information onwaste generation, pollutant releases, and the consumption of raw material, energy and water, EMAS’sscope is broader than that of many PRTRs.7
Box 5
EMAS Evaluation
A 1997 analysis of 465 EMAS environmental reports found that 83% included data on pollutant emissions and 99% onwaste (Swedish EMAS Survey Recommendations, Environmental Accounting and Auditing, November 1997). PRTRdata thus play a role in these reports. However, because there is no requirement to present the data in standardisedform as in PRTRs, and there is no provision for establishing a single database, EMAS reports cannot be easilycompared or analysed. Thus, dissemination is by individual facilities for local communities or other stakeholders.
The development of a European Pollutant Emissions Register (EPER) under the EU's Integrated Pollution Preventionand Control Directive may, in the future, provide a format for presenting data in a standardised manner. This couldhelp public comprehension of what is being presented in the reports.8
Countries, such as Denmark, in its Green Accounts Programme (see Box 6), and the Netherlands, nowrequire their major companies to prepare environmental reports and make them publicly available.
6. Expanding EMAS and Harmonising the Environmental Statement, Environmental Accounting and Auditing,2:15, November 1997.
7 . See Council Regulation (EEC) No. 183/93 of 29 June 1993 allowing voluntary participation by companiesin the industrial sector in a Community eco-management and audit scheme.
8 . Analysis of a European Polluting Emissions Register EPER, Swedish Environmental Protection Agency,October 1998. For further information on data elements and categories reported under PRTRs for 87corporate reports, refer to A Benchmark for Reporting on Chemicals at Industrial Facilities, prepared by theWorld Wildlife Fund and Hampshire Research Institute in 1995. This report analyse some 130 dataelements and categories reported under national PRTRs and in 87 corporate reports.
ENV/JM/MONO(2000)17
30
Box 6
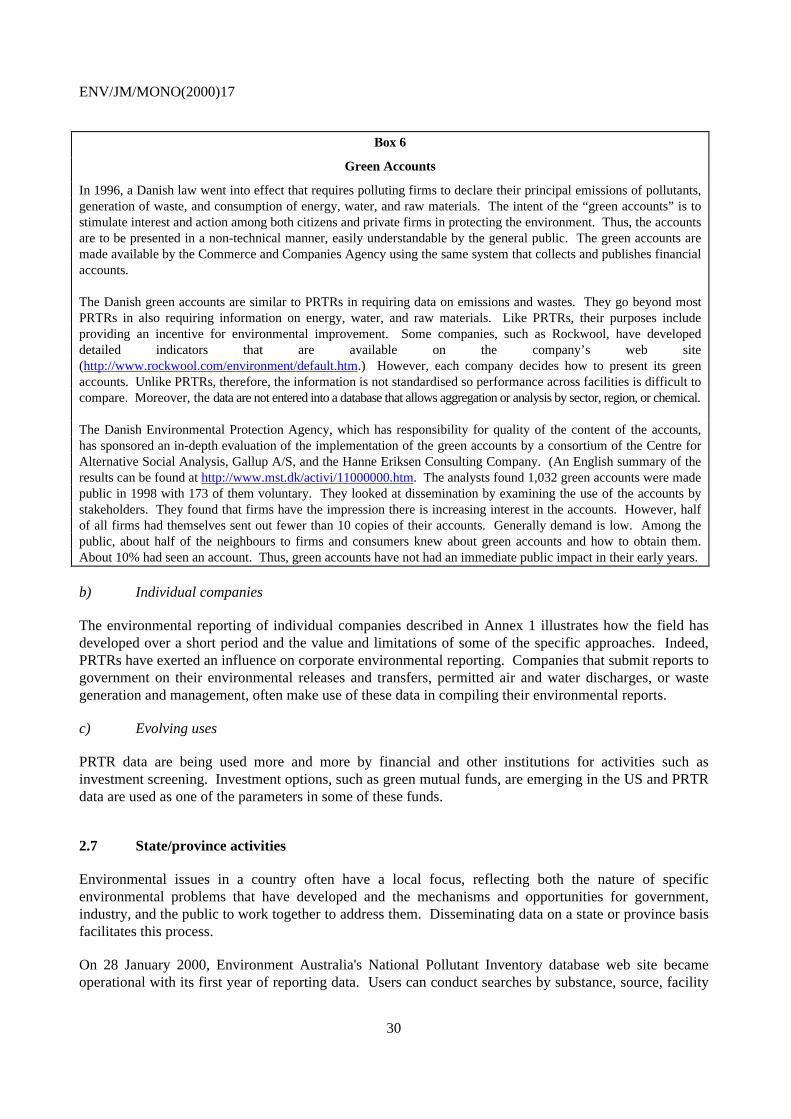
Green Accounts
In 1996, a Danish law went into effect that requires polluting firms to declare their principal emissions of pollutants,generation of waste, and consumption of energy, water, and raw materials. The intent of the “green accounts” is tostimulate interest and action among both citizens and private firms in protecting the environment. Thus, the accountsare to be presented in a non-technical manner, easily understandable by the general public. The green accounts aremade available by the Commerce and Companies Agency using the same system that collects and publishes financialaccounts.
The Danish green accounts are similar to PRTRs in requiring data on emissions and wastes. They go beyond mostPRTRs in also requiring information on energy, water, and raw materials. Like PRTRs, their purposes includeproviding an incentive for environmental improvement. Some companies, such as Rockwool, have developeddetailed indicators that are available on the company’s web site(http://www.rockwool.com/environment/default.htm.) However, each company decides how to present its greenaccounts. Unlike PRTRs, therefore, the information is not standardised so performance across facilities is difficult tocompare. Moreover, the data are not entered into a database that allows aggregation or analysis by sector, region, or chemical.
The Danish Environmental Protection Agency, which has responsibility for quality of the content of the accounts,has sponsored an in-depth evaluation of the implementation of the green accounts by a consortium of the Centre forAlternative Social Analysis, Gallup A/S, and the Hanne Eriksen Consulting Company. (An English summary of theresults can be found at http://www.mst.dk/activi/11000000.htm. The analysts found 1,032 green accounts were madepublic in 1998 with 173 of them voluntary. They looked at dissemination by examining the use of the accounts bystakeholders. They found that firms have the impression there is increasing interest in the accounts. However, halfof all firms had themselves sent out fewer than 10 copies of their accounts. Generally demand is low. Among thepublic, about half of the neighbours to firms and consumers knew about green accounts and how to obtain them.About 10% had seen an account. Thus, green accounts have not had an immediate public impact in their early years.
b) Individual companies
The environmental reporting of individual companies described in Annex 1 illustrates how the field hasdeveloped over a short period and the value and limitations of some of the specific approaches. Indeed,PRTRs have exerted an influence on corporate environmental reporting. Companies that submit reports togovernment on their environmental releases and transfers, permitted air and water discharges, or wastegeneration and management, often make use of these data in compiling their environmental reports.
c) Evolving uses
PRTR data are being used more and more by financial and other institutions for activities such asinvestment screening. Investment options, such as green mutual funds, are emerging in the US and PRTRdata are used as one of the parameters in some of these funds.
2.7 State/province activities
Environmental issues in a country often have a local focus, reflecting both the nature of specificenvironmental problems that have developed and the mechanisms and opportunities for government,industry, and the public to work together to address them. Disseminating data on a state or province basisfacilitates this process.
On 28 January 2000, Environment Australia's National Pollutant Inventory database web site becameoperational with its first year of reporting data. Users can conduct searches by substance, source, facility

ENV/JM/MONO(2000)17
31
and location. Interactive maps and information on the national pollutant inventory for each state andterritory can be obtained at http://www.environment.gov.au/epg/npi/database/index.html.
Environment Canada provides regional information and NPRI data customised to the province on thenational Internet site (http://www.ec.gc.ca/pdb/npri/index.html). The following are identified: thepollutants released in the largest quantities, pollutants transferred in the largest quantities, facilities withinthe region with the largest releases, industrial sectors with the largest releases and releases of CEPA andcarcinogenic substances. This information is also available from provincial offices in hard copy.
In the United States, the Environmental Protection Agency makes state-level data available. Twenty-sixof the 55 US states and territories also produce their own annual state TRI report, and 15 place TRI dataon their web sites, according to the National Conference of State Legislatures 1998 State TRI Assessment.For example, the state of Louisiana distributes its state TRI data. The Louisiana Department ofEnvironmental Quality maintains a state TRI database and makes these data available to the publicthrough its annual report, printed and published on the Internet. A task force was created to prepare theannual reports. This task force includes members from government, environmental groups, universities,and industry. Louisiana’s TRI reports have evolved over the years, but from the start the printed reportsused graphics creatively to make the data easily understandable for citizens. The entire series ofLouisiana reports is available at http://www.deq.state.la.us/. More recently, the reports have begun tomake use of interactive mapping on the web site, allowing users to zoom in on TRI sites to locate releasesby political jurisdiction and bodies of water. Louisiana also makes available its historical TRI data(covering 1987 to 1992) in ArcInfo format, downloadable for users with Geographical InformationSystem software.
In its Analysis of a European Polluting Emissions Register EPER (October 1998, p. 19), the SwedishEnvironmental Protection Agency notes that national authorities in Europe disseminate informationcollected by integrated (multi-media) pollutant inventories, whereas regional authorities haveresponsibility for disseminating information from non-integrated (single-medium) inventories.
2.8 Local/community activities
Local governments and NGOs play an important role in the dissemination of PRTR data. Local groupsoften take the lead in presenting data in a form useful for local communities. These groups can serve as akey point of access, helping to make the data accessible to audiences that would not otherwise be likely toobtain and use PRTR information.9 By the late 1990s, a few local groups were beginning to play a leadingrole in mediating the presentation and dissemination of PRTR and other environmental data over theInternet.
Some local groups may well become major nodes of dissemination as horizontal networks of NGOs thatare building and using PRTRs develop across the Internet. One example of such a group is the SiliconValley Toxics Coalition, an NGO located in Silicon Valley, California. The Coalition developspresentations of data at the county level and disseminates them to the local population. Established in1982 as groundwater contamination was identified from electronic plants in the area, the Coalition workedfor legislation to provide information to the public about the sources of this pollution. A local law wasadopted in 1983 and a state law in 1985—one of a handful of state-level forerunners of TRI. When
9. An early review of the uses of TRI data in the United States found this to be true in the TRI experience.For more information, see The Toxics Release Inventory: Environmental Democracy in Action, prepared byFrances M. Lynn, Jack D. Kartez, and Cheryl Connelly, January 1992.
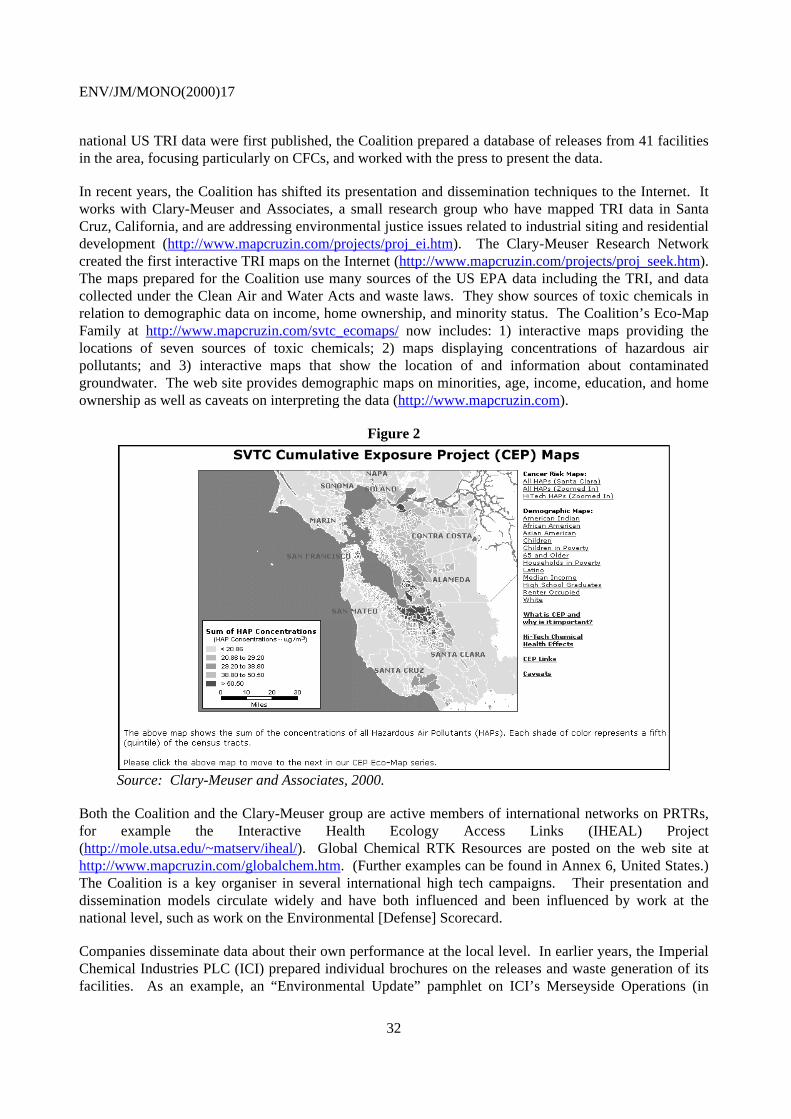
ENV/JM/MONO(2000)17
32
national US TRI data were first published, the Coalition prepared a database of releases from 41 facilitiesin the area, focusing particularly on CFCs, and worked with the press to present the data.
In recent years, the Coalition has shifted its presentation and dissemination techniques to the Internet. Itworks with Clary-Meuser and Associates, a small research group who have mapped TRI data in SantaCruz, California, and are addressing environmental justice issues related to industrial siting and residentialdevelopment (http://www.mapcruzin.com/projects/proj_ei.htm). The Clary-Meuser Research Networkcreated the first interactive TRI maps on the Internet (http://www.mapcruzin.com/projects/proj_seek.htm).The maps prepared for the Coalition use many sources of the US EPA data including the TRI, and datacollected under the Clean Air and Water Acts and waste laws. They show sources of toxic chemicals inrelation to demographic data on income, home ownership, and minority status. The Coalition’s Eco-MapFamily at http://www.mapcruzin.com/svtc_ecomaps/ now includes: 1) interactive maps providing thelocations of seven sources of toxic chemicals; 2) maps displaying concentrations of hazardous airpollutants; and 3) interactive maps that show the location of and information about contaminatedgroundwater. The web site provides demographic maps on minorities, age, income, education, and homeownership as well as caveats on interpreting the data (http://www.mapcruzin.com).
Figure 2
Source: Clary-Meuser and Associates, 2000.
Both the Coalition and the Clary-Meuser group are active members of international networks on PRTRs,for example the Interactive Health Ecology Access Links (IHEAL) Project(http://mole.utsa.edu/~matserv/iheal/). Global Chemical RTK Resources are posted on the web site athttp://www.mapcruzin.com/globalchem.htm. (Further examples can be found in Annex 6, United States.)The Coalition is a key organiser in several international high tech campaigns. Their presentation anddissemination models circulate widely and have both influenced and been influenced by work at thenational level, such as work on the Environmental [Defense] Scorecard.
Companies disseminate data about their own performance at the local level. In earlier years, the ImperialChemical Industries PLC (ICI) prepared individual brochures on the releases and waste generation of itsfacilities. As an example, an “Environmental Update” pamphlet on ICI’s Merseyside Operations (in

ENV/JM/MONO(2000)17
33
England) for 1992 focused on waste reduction goals and performance (see Annex 2, Figure 5). The one-page four-panel brochure supplied chemical-specific data for 1992 discharges to water, air, and land;summarised the year’s compliance incidents and citizen complaints (and action taken); discussed recoveryand recycling and presented plans for investing in treatment equipment. A similar publication put forththree years’ data for air, water, and land releases (1991-1993) for ICI’s Botany site in Australia. (Morerecent developments in ICI’s environmental reporting are found in Annex 1.) This example illustrates theactive role companies are beginning to take at the local level.
2.9 Regional inter-governmental bodies
The North American Commission for Environmental Co-operation (NACEC), a joint effort of Canada,Mexico, and the United States established under the North American Free Trade Agreement (NAFTA),publishes an annual report on North American PRTR data. The first three annual volumes of TakingStock: North American Pollutant Releases and Transfers have reported and analysed Canada’s NPRI andthe US TRI data; subsequent reports will incorporate Mexico’s Registro de Emisiones y Transferencia deContaminantes (RETC) as data become available. The NACEC has also worked to help the three NorthAmerican PRTRs find ways to make their individual PRTRs more comparable, to facilitate the continent-wide view of pollutant releases and transfers.
On 17 July 2000, the European Commission adopted a Decision on the implementation of a EuropeanPollutant Emission Register (EPER) in accordance with Article 15 of the Council Directive 96/61/EC onIntegrated Pollution Prevention and Control (IPPC). The primary purpose of the IPPC Directive is toreduce pollution by industry and to control emissions from larger facilities. The objectives of the EPERwill be to collect comparable emission data to air and water of individual polluting industrial sources,place them in a database and make them available to the public. The EPER will register emissions to airand water for 50 pollutants released by about 20 000 individual facilities in Europe.
National governments of all EU countries are required to inventory emission data from specified industrialsources and to report the emission data to the European Commission. Data will then be made availablevia the European Environmental Agency. The first reporting cycle shall be in June 2003 on emissions in2001; the next reporting cycle will be in June 2006 on emissions in 2004. Every three years theCommission will publish a report on the inventoried emissions and their individual sources. Bothgovernment and the public will use the EPER as a public register providing accessible environmentalinformation on major industrial activities. The present EPER can be considered as a first step towards thedevelopment of a fully integrated pollutant release and transfer register, or PRTR, for Europe.
Box 7
International Agreements
PRTR data lend themselves to tracking progress in countries’ implementation of various international agreementsand conventions for environmental protection and improvement. Many national governments developpresentations of PRTR data for groups of substances that pose particular concerns, internationally or acrossborders. Trends analysis, illustrated with charts and graphs, and data tables itemising the sources of releases andtransfers of the target substances, could serve international goals in the same way that they have served nationalPRTR goals.
In North America, there are two key cross-border projects: one on the US-Mexican border and the otheron the US-Canadian border around the Great Lakes. These projects have demonstrated international co-operation that includes dissemination of PRTR data focused on cross-border sources of pollutants. These

ENV/JM/MONO(2000)17
34
projects have not only collected and disseminated PRTR-type data, making information newly available togovernment entities and to the public, they have also laid foundations for collecting and presenting suchdata in border regions.
The 1992 US-Mexico Integrated Border Environmental Plan (IBEP), issued jointly by the two countries’environmental departments, incorporated several provisions that acknowledged the importance for theplan of environmental information that was not readily available. In the plan, the two governmentalagencies agreed to establish “requirements for public availability of data on emissions and effluents ofpollutants and other elements of a right-to-know programme in the border area” (IBEP, V-49). The planalso acknowledged the need for data on pesticide use because of concerns for both worker exposure andenvironmental contamination.
El Proyecto Fronterizo de Educación Ambiental (PFEA), a non-governmental organisation based inTijuana, Mexico, collaborated with the Environmental Health Coalition in San Diego, California (US), toidentify industrial sources of hazardous chemicals in Tijuana. In this effort, PFEA collected and analysedall publicly available information covering the period 1990 to 1996. PFEA’s report, Uso de SustanciasPeligrosas en la Industria de Tijuana, B.C.: Desde una Perspectiva del Derecho a la InformaciónAmbiental, presented the results while identifying the leading industrial sectors, the most commonhazardous substances, and the potential risks of those substances to human health. The report has beendistributed to interested parties, ranging from governmental representatives and NGOs to citizens in theborder areas.
In 1998, the Great Lakes Commission published an initial, comprehensive inventory of toxic air emissionsfrom the eight US states and Canadian province bordering the Great Lakes (Illinois, Indiana, Michigan,Minnesota, New York, Ohio, Pennsylvania, Wisconsin and Ontario). Based on 1993 data, the inventorycovered 49 toxic substances. A principal component of this effort was the development of the RegionalAir Pollutant Inventory Development System (RAPIDS), billed as “the first ever multi-jurisdictionalpollutant emissions inventory software". Information on this regional, cross-border project appears on theweb at http://www.glc.org/air/air3.html. Results of the initial inventory can be found athttp://www.glc.org/air/final1993/1993.html. The downloadable report offers a good example of thepresentation and dissemination of data from multiple jurisdictions, including explanations of the data andmethodology. Figures and tables are supplied in spreadsheet format. This facilitates a number of furtherapplications for this data, such as conducting additional analyses, developing presentations incorporatinglocal data, or reproducing the information on slides or overheads.
Box 8
European Inventories: CORINAIR
CORINAIR represents one model for reporting emissions data at the European Community level. SummaryCORINAIR data for 1990 and for 1994—for the eight targeted pollutants—have been made publicly availablethrough the Internet at http://www.aeat.co.uk/netcen/corinair/94/. Data summaries are available by country and bypollutant, and the database may be queried by country and pollutant to identify the sectors contributing the largestemissions. Little explanatory or supporting information is provided directly, but this can be obtained by searchingthe European Environment Agency web site (http://www.eea.eu.int/).

ENV/JM/MONO(2000)17
35
2.10 Academia
Publication of academic studies can bring PRTR data to the attention of new audiences. These articles,appearing in academic, professional, or topical journals, illustrate the variety of methods used to analyseand present PRTR data almost always in conjunction with contextual information.
A recent Canadian study from Simon Fraser University, prepared for Canada’s Department of Finance,estimated the “toxic intensity” of Canadian industries relative to employment and value of output.10
Academic researchers in the United States have paired TRI data with economic information11 and havecorrelated TRI reporting of source reduction activities and reductions in releases.12 Such reports usuallyreach more technical audiences, but they are also sometimes cited—or their authors invited to speak athearings—by legislative bodies weighing proposed changes in environmental laws.
Other recent studies have evaluated TRI data to assess the mutual influence, if any, of environmental andfinancial performance.13 Work in this field is of interest to policy-makers evaluating the effectiveness ofinformation tools such as TRI, as well as to financial analysts.
Useful information for developers of PRTR dissemination and presentation plans appears on a WorldBank web site called New Ideas in Pollution Regulation (NIPR) at http://www.worldbank.org/nipr/. Muchof the material on this web site, developed by World Bank and academic researchers, emphasisesdissemination strategies and the importance of making information available. The NIPR also listsenvironmental web sites, including both government and NGO sites on PRTRs. Research published onthe NIPR web site contributes to informed public use of disseminated PRTR data. A recent example is thepublication Empowering the Community: Information Strategies for Pollution Control. As described inthe abstract, “Disclosure strategies, which involve public and/or private attempts to increase theavailability of information on pollution, form the basis for what some have called the third wave inpollution control policy (after legal regulation—the first wave—and market-based instruments—thesecond wave)”.14 The NIPR site has also published the results of Indonesia’s PROPER ranking system(see description in Box 9) at http://www.worldbank.org/nipr/comrole.htm.
10. Nancy Olewiler and Kelli Dawson, Analysis of NPRI Data on Toxic Emissions by Industry, prepared for theTechnical Committee on Business Taxation, Department of Finance, Working Paper 97-16, March 1998,http://www.fin.gc.ca/taxstudy/WP97-16e.html.
11. For example, Paul H. Templet, Louisiana State University Institute for Environmental Studies, and StephenFarber, University of Pittsburgh Graduate School of Public and International Affairs, The ComplementarityBetween Environmental and Economic Risk: An Empirical Analysis, Ecological Economics, 9:2 (February1994) 153-165.
12. Pollution drops when workers get involved, Cornell Study Finds, Cornell University Science News Release,announcing study by Cornell’s Work and Environment Initiative and the Center for Advanced HumanResource Studies, May 1995, http://www.news.cornell.edu/science/May95/st.emissions.html.
13. For example, Information as Regulation: The Effect of Community Right to Know Laws on Toxic Emissions,Shameek Konar and Mark A. Cohen, Vanderbilt University, Journal of Environmental Economics andManagement 109 (1997a).
14. Empowering the Community: Information Strategies for Pollution Control, Tom Tietenberg and DavidWheeler, presented at Frontiers of Environmental Economics Conference, Airlie House, Virginia, USA, 23-25 October, 1998, http://www.worldbank.org/nipr/work_paper/ecoenv/index.htm.

ENV/JM/MONO(2000)17
36
Box 9
Publicising Facility Performance
Indonesia’s PROPER system obtains pollution data from and about facilities (focusing on regulatorycompliance), rates their performance in a simple five-colour system, and publishes the resulting ratings.Although not a PRTR, PROPER’s emphasis on public disclosure offers useful insights for PRTR dissemination.
PROPER publicly ranks Indonesian facilities on their compliance with environmental requirements by colour—gold, green, blue, red, or black—based on stated performance criteria. Gold and green facilities earn publicpraise. Blue facilities are just meeting regulatory criteria. Red and black facilities face both public pressure forcompliance and legal enforcement. Indonesia developed PROPER from the conviction that these “reputationalincentives” would work through both community pressure—via the media, non-governmental organisations, andlocal governments—and market forces, to bring about environmental improvement.
Critical to PROPER’s potential success were: first, translating complex environmental regulations into a singlerating system and, second, designing a data protocol to ensure accuracy. The rating system evolved into a list ofyes/no questions (shown below), which also simplifies data collection and analysis. PROPER uses multiple datasources (including independent inspections), relies on user-friendly software for data analysis, and requires amulti-step review before ratings are made public.
(continued)

ENV/JM/MONO(2000)17
37
Box 9 (continued)
PROPER’s Rating Methodology
By announcing positive results (blue, green, and gold facilities) first and then giving a six-month grace periodbefore publicly naming the first red and black facilities, improvements were encouraged. Publication of theresults also proceeded industry-by-industry, rather than rating all facilities at once. NGOs and media have hadaccess to PROPER’s system from its inception and can retrieve the ratings for any facility.
PROPER began as a pilot programme covering 187 facilities in 1995. Compliance increased from 35% in June1995 to 51% in December of 1996. The initial facilities also showed a 43% reduction in biochemical oxygendemand (average concentration at source) in the first year. PROPER has expanded, rating 270 facilities by July1997.
The Philippines Department of Environment and Natural Resources has adopted Indonesia’s approach in itsIndustrial EcoWatch compliance monitoring system. From its pilot implementation in the National CapitalRegion of Metro Manila, EcoWatch announced 26 blue facilities in April 1998 (no green or gold ratings wereearned in the first year). In November 1998, 19 black and red facilities were announced.
The World Bank’s New Ideas in Pollution Regulation (NIPR) web sitehttp://www.worldbank.org/nipr/comrole.htm provides information on both the Indonesian and Philippineprogrammes.
2.11 Tools to enhance presentation and dissemination
Efforts to promote widespread awareness of PRTR data and to encourage their appropriate use areimportant, no matter which methods a government adopts for disseminating the data.
2.11.1 Marketing and publicity
Making data publicly available also means letting the public know that data are available. Bothgovernmental and non-governmental agencies issue press releases to publicise the availability of PRTRdata—governments when they announce public release of the data each year and NGOs when they makeavailable major reports or new tools associated with PRTR data. Governments also hold pressconferences. For web sites, governments may wish to put out a trigger notification to specific groups,informing them when data has been placed on the Internet.
The Citizens’ Environmental Alliance of Southwestern Ontario is a non-profit, grassroots, bi-nationaleducation and research organisation. Formed in 1985 by citizens concerned about spills in the ChemicalValley, the group’s membership has grown and the focus has broadened to toxins in the Great Lakes, airand water quality, and land use planning. CEA issues a Toxic Tracker Report each year, reporting on topchemicals, top facilities, and year-to-year changes in the Windsor area(http://www.mnsi.net/~cea/news/npri1996.html). The report also makes recommendations to improve theNPRI programme. Accompanied by a press release, the report usually attracts media attention in theWindsor (Canada)–Detroit (US) area.
The Commission on Environmental Co-operation’s annual release of a North American perspective onPRTR data has also brought increased attention to Canada’s NPRI data. Because Taking Stock establishesa common ground in data that are comparably reported in both countries, the report allows something of aside-by-side view of the two countries. Some observers note that Canadian audiences (including both

ENV/JM/MONO(2000)17
38
press and industry) have less experience with PRTR results than their US counterparts and have thereforebeen more engaged with PRTR data as “news”, especially where comparisons are drawn.
The press provides prompt information to the public that PRTR data are available and often carriesarticles concerning the environment related to the PRTR data. It is worth noting that, over time, pressattention can change and the focus and impact of annual data releases may change as well. For example,in the United States, national press attention to the annual release of TRI data has declined, while localattention is sustained both by news agencies and by activities of citizens’ groups and other non-governmental organisations. While over time there has been a shift from TRI data being front-pagenational news, major city newspapers continue to use TRI data in stories about environmental policy. Inaddition, these data are often referenced in national press editorials concerning the environment and theyare used as important input to broader national topics in the press confirming national interest.
Aside from press events, efforts to publicise PRTR data availability are usually on-going activities.Outreach programmes, whether governmental or non-governmental, seek opportunities to distributeinformation and promote hotlines, publications, and web sites in arenas such as gatherings of state or localofficials or environmental groups. Tools can be as simple as a two-page brochure, such as the draft flyeron web access to US toxics-related data in Annex 5, or as elaborate as a full-fledged media campaign. Anarticle titled “Scorecard Hits Home” in Chemical Week magazine (3 June 1998, p. 25), citing numerousindicators of the Environmental Defense Scorecard’s success even in its first year, attributes much of theScorecard’s draw to coverage by major national news media and regional newspapers, as well as theEnvironmental Defense banner ads that have run on major web sites, such as ESPN SportsZone andYahoo. Ads on the Internet invite web visitors to enter their postal codes and find out which toxicchemicals “polluters” are releasing into their community’s air and water.
A convenient device for publicising PRTR information, including public release of data, is the on-lineuser group or listserv. Quick distribution of e-mail notices to interested parties on a listserv has been aneffective tool for both established PRTRs (Community Toxics Watch list in the United States, FactoryWatch list in the United Kingdom) and emerging PRTRs (in central Europe, for example, where an NGOrepresentative in the Czech Republic distributes information on PRTR developments via e-mail lists).Listservs are inexpensive, and where computer resources permit, they can easily be structured to facilitatedialogue among interested parties.
2.11.2 Training and education
One of the key elements of a government outreach plan suggested in the PRTR Guidance Manual forGovernments is training of both disseminators and user groups. A working group on outreach, trainingand education met at the 1998 Tokyo conference on PRTRs. One of its main findings urges that countries“establish PRTR outreach and education programmes to: 1) inform the public that the PRTR data exist, 2)ensure easy public access, and 3) provide information, education and training concerning the use of thedata”.
Conferences, workshops, the provision of tools at web sites, and the provision of on-site training forregional and local groups, are perhaps the most common approaches to training and education.Conferences are perhaps the most frequent venue. The US EPA has sponsored biennial data useconferences that include sessions on data presentation. NGOs in Europe held a conference in Moldova inthe spring of 1999, which provided an opportunity for peer exchange on issues including disseminationand presentation of data.

ENV/JM/MONO(2000)17
39
Besides developing RTK NET, Unison Institute has provided extensive training for both government andcitizen users of PRTR data. It has worked to establish community health and environmental managementcentres in several regions of the United States. Its role has included providing computer hardware andsoftware and environmental literature, as well as training in disseminating and using the data.
Internet web sites also perform a training and education service. Many provide background documentsthat give perspective on PRTR developments and issues. Some also offer useful publications fordownloading. Intergovernmental organisations such as OECD, national and regional information centresin many countries, and environmental citizens’ organisations also publicise the availability of printeddocuments and reports in their catalogues and resource lists. Simple materials such as the two-page flyerin Annex 5, promoting access to web sites, also serve an educational function for audiences new toenvironmental data.
The MapCruzin web site (http://www.mapcruzin.com/) features many models of maps as well as tools thatcan be downloaded to allow individuals to generate their own maps and present data as they wish. Thesite also includes links to other resources such as bookshop and news updates on environmental disclosurefor communities to use in preparing data for dissemination.
2.12 Conclusion
The dissemination of PRTR data is a powerful tool for communicating information about theenvironment. Government, industry, and the public all benefit from the data. The value of PRTR data canbe enhanced by the techniques used to present the data. Providing a range of tools to communicate PRTRdata will help a wide variety of audiences to better comprehend what the data mean.
PRTR reporters, policy-makers, data managers, and users of PRTR data have been leaders indisseminating and presenting standardised environmental data effectively for a broad range of uses.However, challenges remain in improving accuracy and timeliness, providing context and training andbuilding links with related data. At the same time the explosion of information sharing associated withthe Internet and the increasing use of information as an environmental policy tool offer significantopportunities for disseminating and presenting PRTR data in new ways.
PRTR dissemination and presentation tools have developed rapidly over the past decade. Undoubtedly,more change is coming. As the uses of PRTR evolve, so will the tools and approaches used to present anddisseminate these data. Even with the rapid expansion of access to data in recent years, PRTRs are still inthe early stages of learning how best to use changing technology to disseminate and present data toachieve their goals.

ENV/JM/MONO(2000)17
40
ANNEXES

ENV/JM/MONO(2000)17
41
ANNEX 1
CORPORATE ENVIRONMENTAL REPORTING
1. Introduction
All corporate environmental reporting models are aimed at communicating data effectively—many to thepublic, some more specifically to local communities, employees, customers and suppliers, or investors.However, relatively little explicit attention has been paid to developing and evaluating the most effectivemethods of dissemination and presentation to reach audiences. A few, mostly large, companies havetaken the lead in developing reporting models. Professional groups and consultants have also had a role inhelping corporations develop strategies for presenting and publishing information on their performance.In addition to the Europeans’ Eco-Management and Audit Scheme (EMAS), described in the text, modelsof corporate environmental reporting include:
1.1 Public Environmental Reporting Initiative.
In 1994, nine companies issued guidelines through a Public Environmental Reporting Initiative (PERI).In answer to the question, “Why is PERI needed?” the corporations stated: “Customers, employees,shareholders, environmentalists, communities, legislators and government agencies, the media and manyothers desire more information on the environmental performance of organisations. PERI seeks toimprove and encourage environmental reporting. This is considered a necessary component forconstructive dialogue and co-operation among the different sectors of society.”
1.2 Global Reporting Initiative.
Undertaken by the Coalition for Environmentally Responsible Economies (CERES) with partnercompanies and NGOs with SustainAbility and the Tellus Institute, the Global Reporting Initiative buildson both the North American and European experiences. The Initiative issued proposed guidelines forstandardised reporting on sustainability (http://www.globalreporting.org/) in 1999 that are now beingtested by about 20 companies in nine countries. The Initiative itself has not yet focused specifically ondissemination. It provides a standard format for presenting data.
Evaluations. Deloitte Touche Tohmatsu, an accounting and management consulting firm, has developeda Score Card to help corporate environment managers evaluate their own reports. The tool draws oninternational guidelines such as Company Environmental Reporting—A Measure of the Progress ofBusiness and Industry Towards Sustainable Development (Technical Report No 24, UNEP andSustainAbility Ltd., 1994). The Canadian Institute of Chartered Accountants has contributed to settingstandards by evaluating corporate environmental reports for awards programs.
1.3 Individual Companies
Changes in Dow Canada’s reporting over time illustrate the mutual influence of PRTRs and corporateenvironmental reporting. Dow Canada’s early environmental publications reflect some of the initiatives
ENV/JM/MONO(2000)17
42
that have influenced corporate environmental reporting. In June 1989, Dow Chemical Canada published“1988 Manufacturing Environmental Highlights”, one of the earliest corporate environmental reports. Fora three-year period, bar charts illustrated the number of reportable air quality and water quality incidentsplus total amounts of priority pollutants (unidentified) and of total organic carbon discharged to rivers.Text consisted of bulleted statements highlighting the company’s environmental activities (installingtreatment equipment, results of monitoring and impact assessments, plans to substitute less harmfulsubstances in products at three facilities, programs for recycling of paper and plastic waste, etc.). Onesuch bulleted item cited an air emissions inventory in one division of the company that showed “an overallreduction from 1986 to 1988 of 29%, with volatile organic compounds reduced 44%, hydrogen reduced51% and oxides of nitrogen (NOx) reduced 9%”. Many corporate environmental reports have relied onsuch general highlights.
Dow Canada’s 1989 Environmental Progress Report retained this basic format, adding topics such asresearch and development, environmental assessment, transportation, community awareness, andenvironmental expenditures. The 1989 report also included customer relations (focused largely onreducing CFCs in Dow Canada products) and product stewardship (focused on handling, use and disposalof products). Many of the new topics reflected the chemical industry’s Responsible Care themes.Bulleted text and illustrative bar charts continued as in the first report.
Dow Canada’s 1992 Environmental Progress Report was the company’s first report to include chemicalreleases to the environment. For “chemicals of interest”, the data summarised “all chemical emissions toair, water, land, and chemicals in materials and waste sent off-site for processing or treatment anddisposal”. Dow Canada’s inventory represented data to be submitted to the Canadian ChemicalProducers’ Association for use in its National Emissions Reduction Masterplan and to EnvironmentCanada's National Pollutant Release Inventory.
Although Dow Canada estimated and reported this inventory in detail to CCPA and Environment Canada,the 1992 publication presented only summary data in a graphic form. However, this included totalamounts for air, water, and land releases and for off-site waste treatment—an important addition. Withinthese categories, the report gave percentage distributions by release type (e.g., stack air emissions, fugitiveair emissions, etc.). A comparable presentation in the following year (Environmental Progress Report1993) supplied a two-year comparison and—for air emissions only—1989 baseline data. By thepublication of Dow Canada’s 8th Annual Environmental Progress Report 1995, this presentation offered afour-year view of the summary data (along with the 1989 baseline for air emissions).
Although Dow Canada presented only company-wide summary data—and did not list the “chemicals ofinterest” covered—the development of this corporate environmental report began to show the value to allaudiences both of presenting actual data (amounts) and of presenting standardised data over time.
BP Amoco (formerly British Petroleum) has conducted one of the more ambitious series of environmentalreports. In 1992, New Horizons: The Environment and BP, the company’s second such report, openedwith a quotation from Friends of the Earth staff describing as “paramount” the need for BP Amoco (BP) toimprove its public disclosure of information. For two of BP’s three business categories—chemicals andoil refining—the 1992 publication reported world-wide summary data for 1990 and 1991, with targets forreductions by 1997 in air and water emissions. For the third business group—exploration andproduction—the report gave four years’ data (1989-1992). BP’s exploration and production operationshad already exceeded a 1993 target for reductions in oil discharges to water. In addition to graphs andcharts, the 1992 New Horizons report supplied data tables. These summary data included the US PRTRsubstances as a whole, although BP Amoco’s report covered all facilities world-wide. A number of

ENV/JM/MONO(2000)17
43
corporations with operations in PRTR-covered countries have similarly chosen to develop and publishcomparable data for facilities not actually covered by those PRTRs.
BP’s New Horizons: Health, Safety and Environment Report 1993 added coverage of timely topics such asclimate change and product stewardship. More US PRTR data were also included (e.g., air, water, andland releases by U.S. refineries for 1988 through 1993 with a reduction target specified for 1995).
With BP HSE Facts 1995: Health, Safety and the Environment, the company began publishing regionaland site-specific data: 1990 baseline and 1995 data for hydrocarbon emissions to air, other air emissions,discharges to water, number of oil spills and routine waste disposal. The company also improved its datacollection, emphasising a new level of consistency as well as increasing the scope to include someoperations not previously reported. “The figures reported are our best estimate of the releases, obtainedusing a combination of direct measurement and estimation using industry standard methods. Data areintended primarily to show performance trends at each site”.
Available with the 1995 report was a computer diskette containing more detailed data, including trendsand product-related data. A CD-ROM accompanied BP’s 1996 report, and it included “detailedinventories for each of our major chemicals sites”. The 1995 diskette and the 1996 CD also includedinformation on environmental issues and programs, along with other supplementary information. BP HSEFacts 1996 also appeared on the World Wide Web. The 1997 report contained a similar CD and alsoappeared on the Web.
The 1996 and 1997 BP reports also included a printed supplement: BP Chemicals: Site Reports. Wherethe 1995 report gave one row of a table to data for each BP site, the later Site Reports devoted a page eachto examining data for the eight BP facilities (located in Great Britain, France, and the United States) in thechemicals group. The document concluded with a chemical-specific table for the chemicals group as awhole, giving on-site air, water, and land releases and off-site disposals for each of 140 chemicalsubstances for 1996.
In recent years, corporations have been invited and challenged to expand their public reporting in twodirections. One trend represents widespread recognition that environmental releases and transfersrepresent only one aspect of a unified perspective. Materials accounting, throughput data, or otherchemical use quantities can greatly extends the potential for identifying pollution preventionopportunities, prioritising and reducing risks, evaluating facility and industry performance, and otherapplications. Water and energy use, quantities of waste paper and other materials recycled, and manyother data items can also expand the view of a company’s environmental performance. Dow Canada’s1995 report, for example, covered both non-hazardous waste and recycled materials (paper, cardboard,metal, lumber, asphalt/concrete, and plastics). Notably, sustainable development looks not only atenvironmental performance but at the broader materials universe affected by corporate activity. Similarlyin the US, there is a requirement to include on-site waste management or transfers off-site for furtherwaste management. Because US companies must report this information under their PRTR, companieshave begun to include waste management information in their corporate reports.
The second trend recognises that the environment itself is only one aspect of a larger perspective oncorporate performance that includes social and economic as well as environmental performance. BPAmoco’s Environmental and Social Report 1998 covered the company’s traditional health, safety andenvironmental performance measures, additional environmental topics (climate change, air quality/cleanfuels, and solar energy), and social performance. Case studies discussed “how we do business in…”Alaska, China, Egypt, and South Africa through topics such as ethical conduct, employment, andrelationships with stakeholder groups, as well as health, safety and the environment. Supplemental reports
ENV/JM/MONO(2000)17
44
separately addressed BP Amoco in the Community (the social report) and Health, Safety andEnvironmental Data. BP Amoco also published the main report and its two annexes on CD.
As noted in the report, corporations often adjust their release data to reflect production levels. They maypublish both actual amounts released and the production-adjusted amounts (per unit of production oradjusted by a production index), or they may publish only the adjusted data. While this can show acompany’s progress in improving its efficiencies over time, production-weighted release data usefullysupplement—not substitute for—actual year-by-year amounts.
Industry representatives are among those who have called for information on the toxicity and healtheffects of PRTR-listed substances to be provided as context when PRTR data are disseminated. MostPRTRs make efforts to supply such information or to point data users to reliable sources of suchinformation. At least one company has gone beyond this step, however, publishing its data with toxicityweightings. Solvay, a chemicals, plastics, and pharmaceuticals producer, developed a reporting system(Solvay Environmental Releases File, SERF) to collect verified and unified emissions data from its 94plants located in 17 countries. Solvay developed toxicological weighting factors used to calculate theemissions indexes that the company reports to the public. These factors along with Solvay’s globalsummary data for 1996 appear in the corporation’s Web site(http://www.solvay.com/sowe/sowe/envir.htm).
ICI (Imperial Chemical Industries) has also adopted a weighted approach to reporting its environmentalperformance. ICI weights its air and water emissions for their effects on acidity, global warming, humanhealth, ozone depletion, smog creation, aquatic oxygen demand, and toxicity for aquatic life.Environmental Burden Approach spells out the factors and methodology applied in this approach. Datatables in the company’s reports show both the raw amounts and the amounts weighted by ICI’s calculationof environmental burden. Land disposal is reported without weighting. Data in the reports are chemical-specific, but not facility-specific. ICI has also set its own reduction goals, targeting 50-percent reductions,from 1995 to 2000, in four of the identified “burdens”: acidity to air and water, hazardous air emissions,aquatic oxygen demand, and aquatic ecotoxicity. ICI also tracks improvement in energy efficiency. ICI’scurrent reduction targets span the five-year period 1995 to 2000 and annual reports compare current-yeardata to the 1995 baseline.
ICI reports discuss activities in product stewardship and community awareness, and in 1998, ICI addedadditional topics: climate change, chemicals management, and endocrine disruption. ICI’s Web sitecarries the company’s annual environmental reports for the most recent three years (1998, 1997, and1996), a five-year summary for the preceding period (1990-1995), and the explanatory EnvironmentalBurden Approach (in the Safety, Health and Environment section of http://www.ici.com/iciportal/).
1.4 Trade Associations
Some industry associations publish data from PRTRs or from voluntary reporting to the association by itsmembers. Those that publish such data tend to present summary numbers or statements. Tradeassociations in the United States that have made general public use of summary of their PRTR datainclude the Semiconductor Industry Association (http://www.semichips.org/), emphasising its reductionsin releases of ozone-depleting chemicals, and the American Forest and Paper Association, citing industryparticipation in U.S. EPA’s voluntary “33/50 Program” for reduction of 17 targeted substances from 1991to 1995 (http://www.afandpa.org/).
In its Strategies for Today’s Environmental Partnership (STEP) program, the American PetroleumInstitute (API) uses chemical releases reported to US PRTR as one of eight measures of industry-wide
ENV/JM/MONO(2000)17
45
environmental, health and safety performance. API publishes its results annually (Petroleum IndustryEnvironmental Performance) in print and on the Web at http://www.api.org/step/piep.htm. Data tablessummarise petroleum refinery releases and waste management (recycling, energy recovery, and treatment)of the US PRTR chemicals. Progress is tracked from a 1988 baseline, and data are presented on thecarcinogens that refineries most commonly release. API does not publish company or facility-specificdata, but the annual report lists the participating companies that submit data to the US PRTR.
Initiated in Canada in the late 1980s, the chemical industry’s Responsible Care® program establishesvoluntary codes for improving performance in safety, health, and environmental quality; it has beenadopted in 36 countries. In the United States, the Chemical Manufacturers Association (CMA) publishesannual Responsible Care® progress reports, but these supply little data (summary numbers in the text withbar and pie charts). In part, this may reflect the public availability of facility-specific PRTR data by otherroutes. However, lack of detailed data—for programs such as Responsible Care® and for other industry-wide environmental initiatives—makes assessing progress difficult for the programs as a whole andimpossible for individual companies and facilities.
Publishing its first Reducing Emissions report for 1992, the Canadian Chemical Producers’ Association(CCPA) noted:
The decision of our member companies to provide data for public analysis flows out oftheir commitment to the principles of Responsible Care whereby companies will beresponsive and sensitive to community concerns, be aware of all effluent and emissions,and make information on risks available to the public….In adopting Responsible Care,member companies accept their responsibility to manage and reduce emissions to the bestof their ability. This report is a demonstration of their ongoing commitment to continuousimprovement in emissions reduction….We hope that the publication of the information inthis report coupled with each individual company’s disclosure of its own data will be thestart of a dialogue process which will further support and enhance our commitment toongoing emissions reductions.
[Preface], Reducing Emissions: 1992 Emissions Inventory and Five Year Projections
For each chemical on CCPA’s list, Reducing Emissions 1992 itemised 1992 emissions by chemical andidentified the companies that voluntarily reported data for that substance. Projected emissions for eachyear 1993-1997 were indexed to the 1992 data. For chemicals reported by only one company, ReducingEmissions 1992 withheld amounts. The report also associated each chemical with pertinent issues ofconcern: carcinogenicity, smog formation, ozone depletion, and global warming. In addition, thepublication listed company contact persons and telephone numbers.
Reducing Emissions 1992 pre-dated Canada’s National Pollutant Release Inventory (NPRI) by one year.In comparison to the complete NPRI data, first collected for 1993, Reducing Emissions did not supplyfacility-specific emissions data, chemical-specific data by environmental media, or data by company,facility, or chemical for transfers of listed substances to other locations for treatment or disposal. (Thereport included summary data for these and other categories.) However, Reducing Emissions expandedthe level of company-specific information available to the Canadian public before NPRI.
CCPA has maintained the Reducing Emissions series and its format, adding categories of concern:substances defined as toxic under the Canadian Environmental Protection Act, chemicals listed for furtherassessment, and those targeted for Accelerated Reduction/Elimination of Toxics (ARET). ReducingEmissions 7: 1998 Emissions Inventory and Five-Year Projections is the CCPA’s latest report.

ENV/JM/MONO(2000)17
46
In contrast, the Mining Association of Canada’s Environmental Progress Report furnishes company andfacility-specific data for air and water releases of a dozen substances, including a base year, annual datafor 1993-1997, and reduction targets for 2000 and 2008. These data are also chemical-specific, enablinginterested parties to see clearly how much of what substance (of the few covered) is released to air and towater by what facility. This represents a substantial difference with the data presentation practices ofmost trade associations. Company contacts including phone, fax, mailing address, and e-Mail are alsoprovided. Notably, the association’s Data Integrity Group—which has developed guidance to improveemissions estimation and reporting of its members’ smelting, refining, milling, and mining operations—assumed a leading role in publication of the 1997 and 1998 Environmental Progress Reports.
1.5 Others: Non-governmental Organisations and Consultants
Corporate environmental reports are disseminated more widely by the NGOs, consultants, and tradeassociations working with companies to improve the reports.
SustainAbility is a consulting firm and think tank that encourages companies to pay attention to a “triplebottom line” of socially responsible, environmentally sound, and economically viable business practices.It has worked with the United Nation’s Environment Programme to benchmark corporate reporting. ItsWeb site (http://www.sustainability.co.uk/) features discussion of the issues involved in moving towardsustainability. Related publications can be ordered from the Web site, including the recent InternetReporting Report, which reviews the development of corporate reporting on the Web and examines likelyfutures, including how the Web will “drive—or impede—the sustainability transition [and]...whether theInternet will spur new forms of accountability”. The site also links to the reports of the companies withwhom SustainAbility works. SustainAbility regularly reviews corporate environmental reports inTomorrow magazine, a further contribution to publicising environmental performance information and,indirectly, PRTR data.
The International Institute for Sustainable Development (IISD) notes: “If we are to assess our progress,the figures must be comparable, from year to year and from place to place. And the public must trust themeasurement system”. IISD’s Corporate Reporting Toolbox on the Web site offers access to somecorporate environmental reports (http://iisd.ca/business/corpreport.htm). Many IISD publications,especially those from its Measurements and Indicators Program, address sustainability reporting issues(http://iisd.ca/measure/default.htm). The International Corporate Environmental Reporting Site, offeredas a service by a consultant in the Netherlands, also includes directories that link to such reports on theWeb (http://www.enviroreporting.com/). CERES makes the reports of some of its partners available onits site (http://www.ceres.org/).
The corporations described in this section and many others have invested considerable resources inpresenting to the public information on their environmental activities and—to some extent—performance.Few environmental reports, however, have encompassed the range of data called for by initiatives such asthe Global Reporting Initiative’s proposed guidelines. Publications that tell the story of a corporation orsector’s environmental activities and progress do not support the types of analysis—especiallycomparative performance—sought by many among the diverse audiences for environmental information.

ENV/JM/MONO(2000)17
47
ANNEX 2
HOW IS PRTR INFORMATION DISSEMINATED AND PRESENTED?
2.1 Options and Member Country Examples
Governments establishing PRTRs should take into consideration the need to plan for the distribution ofPRTR data to other disseminators, where appropriate. Listed below are descriptions and examples fromMember countries. For example, in the United States, facilities reporting under the Toxics ReleaseInventory (TRI) submit their reports to both state and federal governments. RTK NET receives TRI datain advance of its publication, so that its searchable electronic database on the Web can be available theday the US EPA makes TRI data available to the public. Other disseminators in the United States, and inother countries, depend on access to the government’s PRTR databases.
2.2 Option: Print Publications
Printing of PRTR reports is often the first strategy of dissemination plans. Printed publications serve twoparticular benefits for disseminating data from PRTR systems: They provide a permanent record of thedata reported and published in a given year, and they make information available to audiences whoseaccess to electronic media is limited.
Presentation methods for printed publications often emphasise overviews and summaries of the data andtheir trends (presented in tables, charts and graphs). Tables that rank substances by total releases andtransfers and by releases to the individual environmental media are common. Geographic summaries(displayed in maps) can draw attention to areas of high concentrations of pollutants and/or to regionswhere releases and transfers are increasing or decreasing. A key issue is presentation of facility data.Some governments have issued PRTR reports that identify facilities reporting the largest amounts.National and local media especially value publication of these ranking tables, and they are of particularimportance when electronic access to the PRTR data is limited. Industry representatives often particularlyobject to rankings that compare facilities in different industrial activities. However, there are many PRTRusers who find that rankings that compare facilities and operations in the same industrial activity can helpidentify both good performers, whose experience in reducing releases may serve as examples for industry-wide improvement, and poor performers, whose operations may warrant closer examination.
Another value of printed PRTR reports is that they often include more detailed special analysis thanappears in Web-based and other access tools. Such analyses may, in fact, be difficult or impossible toperform using data obtained in Web-based searches. To date, however, few if any PRTRs have conductedand published extensive special analyses of their data outside their regular reporting cycle.
Where PRTR data are widely available via Web sites (whether hosted by governmental or non-governmental entities), governments continue to publish printed reports each year, summarising andanalysing the data. Annex 3 to this report presents the Tables of Contents of two printed publications: thenational report on the first year of US Toxics Release Inventory data (the 1987 data report) and theCommission for Environmental Co-operation’s report on North American PRTR data for 1996. The
ENV/JM/MONO(2000)17
48
contents of these pages clearly demonstrate the wide range of publicly useful analyses that PRTR datasupport.
2.3 Examples of Print Publications
The following sections provide examples of a range of print publications from Member countries.
2.3.1 The Netherlands’ Pollutant Emission Register (PER)
Printed publications resulting from the Netherlands’ PER summarise two inventories: the IndividualEmission Inventory system which collects air, water, and waste data from large point sources and theCollective Emission Inventory system which estimates releases from small facilities and diffuse sources.The Dutch system originated as a tool for monitoring environmental policy, which has led to presentationsthat emphasise trends over time in the amounts of specific chemical groupings emitted to specific media.Reports from the Netherlands’ inventory incorporate many charts and graphs to illustrate the sometimescomplex data. (Please refer to Box 1 as an example from a report.)
Some publications in the Dutch series summarise only the data for large combustion sources. Emissionsfrom Large Combustion Plants in 1997 and Estimates for 1998 highlighted both the Netherlands’ targetgroup approach to environmental policy (targeting “important groups of polluters such as refineries,energy sector, chemical industry and other industry”) and the European Community’s sectors. Use of thetwo together results in parallel presentations of the data “cut” both ways—by target group and by ECsector. This suggests one approach that may become more common in dealing with differences innational and regional systems, as countries maintain and develop their existing inventories (generallysingle medium) in light of a forthcoming European Pollutant Emissions Register.
It is worth noting that Dutch publications of inventory data result from co-operation by several ministriesand institutes. More than 45 publications have been issued since 1990 (as listed in the back of the printedreports).

ENV/JM/MONO(2000)17
49
Box 1Example of data presentation from the Netherlands' report
(Fuel consumption in 1995)
Source: Emission from Large Combustion Plants in The Netherlands in 1995,Nr. 36, February 1997, p. 16.

ENV/JM/MONO(2000)17
50
2.3.2 Canada’s National Pollutant Release Inventory (NPRI)
The NPRI Annual Summary Report provides an overview of the release and transfer data submitted forthat reporting year and trends from previous years. Data are presented by substance, by industrial sector,and by province or territory. The report also contains data from other inventories such as mobile sourcesand criteria air contaminants. Appendices rank facilities by on-site releases for each pollutant, listingreleases by environmental medium, and compare facilities that reported specified groups of chemicals(“toxic” under Canada’s environmental law or carcinogenic) within each province and territory. Figure 3presents on-site releases from the different industrial sectors.
Figure 3Industrial sectors reporting the largest on-site releases in 1996
1,065
1,175
1,599
1,993
2,157
3,108
4,342
5,444
6,540
7,981
8,019
10,496
20,251
20,372
41,965
0 10,000 20,000 30,000 40,000 50,000 60,000 70,000
10 - Food
35 - Non-metallic Mineral Products
25 - Wood
49 - Other Utility
30 - Fabricated Metal ProductsExcept Machinery and Trans. Equipment
45 - Transportation
41 - Industrial and Heavy (Engineering) Construction
16 - Plastic Products
06 - Mining
32 - Transportation Equipment
07 - Crude Petroleum and Natural Gas
36 - Refined Petroleum and Coal Products
27 - Paper and Allied Products
29 - Primary Metal
37 - Chemical and Chemical Products
SIC
Cod
ean
dIn
dust
rialS
ecto
r
On-site Releases
(22 facilities)
(37 facilities)
(26 facilities)
(22 facilities)
(93 facilities)
(55 facilities)
(16 facilities)
(33 facilities)
(71 facilities)
(100 facilities)
(54 facilities)
(79 facilities)
(102 facilities)
(304 facilities)
(101 facilities)
Source: National Pollutant Release Inventory: Summary Report 1996Environment Canada [1998]
The annual summary report is available in hardcopy, in French and English, free of charge from a numberof Environment Canada offices, by mail or in person. The annual report also describes supplementary

ENV/JM/MONO(2000)17
51
tables that are not printed in the report, but available on the Web. These supplementary tables list allfacilities reporting to NPRI and other information presented by pollutant and industrial sector. Tables 1and 2 and Figure 4 provide further examples from the Canadian NPRI Report.
Table 1Data Presentation Examples
WATER BODIES RECEIVING OVER 500 TONNES OF POLLUTANTS IN CANADA FOR 1996
Water Body Province Releases (Tonnes)
Saint John River New Brunswick 2,468
St. Lawrence River Quebec 1,540
Detroit River Ontario 849
St. Mary’s River Ontario 665
Columbia River British Columbia 660
South Saskatchewan River Alberta 537
Ottawa River Quebec 514
Onsite Releases to Surface Water 7,233
National Total of On-site Releases to Surface Water 12,999
% of National Total 55.6%
Source: NPRI Canada
Figure 4Actual and Anticipated on-site Releases (1995-1999)
Source: NPRI Canada

ENV/JM/MONO(2000)17
52
Table 2List of Reporting Facilities per Chemical
Toluene CAS # 108-88-3 Total Number of Reports: 314 Total Releases (tonnes): 6,116.701
NPRI Idno.
Company Name Facility Name CityProvince/Territory Air
Under-ground Water Land
TotalReleases
3893 General Motors of Canada Car Plant - Autoplex Oshawa ON 391.426 0.000 0.000 0.000 391,426
4399 Canadian Technical Tape St-Laurent QC 296.800 0.000 0.000 0.000 296.800
2263 Sunworthy Wallcoverings Division of Borden Co. Brampton ON 282.300 0.000 0.000 0.000 282.300
3447 Quebecor Printing Canada Quebecor Printing PE&E Etobicoke ON 255.334 0.000 5.391 0.000 260.725
4734 Consoltex Inc. Alexandria ON 234.933 0.000 0.000 0.000 234.933
3475 Canadian General-Tower Ltd. Cambridge ON 184.353 0.000 0.000 0.000 184.353
3759 International Wallcoverings Ltd. Brampton ON 166.500 0.000 0.000 0.000 166.500
0741 Morbern Incorporated Cornwall ON 166.600 0.000 0.000 0.000 166.600
3198 3M Canada Company London ON 142.819 0.000 0.000 0.000 142.819
3989 Jacobs & Thompson Inc. Weston ON 142.000 0.000 0.000 0.000 142.000
Source: National Pollutant Release Inventory: Summary Report 1996Environment Canada [1998]
2.3.3 United States’ Toxics Release Inventory (TRI)
The first TRI summary report, analysing 1987 data—TRI’s first year, ran nearly 350 pages (the Table ofContents from this report can be found at Annex 3, Table 2). It summarised the national data, introducedthe TRI, briefly analysed by reporting by industry sector and by chemical. In the first report,environmental releases and transfers were thoroughly reviewed. The report concluded by indicating otheruses for TRI data (Chapter 12 of that report).
In the decade since that publication, TRI reports have added year-to-year change as a focus, and they havealso taken various approaches to analysing and presenting the data. With release of the 1990 data, USEPA offered simpler presentations of summary data, but added a separate publication of State Fact Sheets,laying out highlights of the data for each state or territory on two pages. The purpose of including theFact Sheets was to provide state by state data and to facilitate dissemination. The State Fact Sheet volumenow appears annually with the main TRI data release, which has expanded to include more extensiveanalyses.
Over the last decade, the US EPA has adapted its annual reports to serve changing needs. For the 1996TRI data report, the US EPA devoted a chapter to each of the 20 manufacturing sectors required to report,extending the main publication to two volumes for that year. In the 1997 data report, EPA modified itsapproach to measuring progress under TRI. In the early years of TRI, EPA identified 1988 as its baselineyear, and published reports generally compare three recent years of reporting with that baseline.Beginning with the report on 1997 data, EPA has identified 1995 as a recent baseline year for trackingprogress. In part, this reflects expansion of TRI’s coverage to include more than 300 additional chemicals(added in reporting year 1995) as well as waste management categories that were added under thePollution Prevention Act of 1990. Over the last two years, US EPA has also re-categorised certaincategories of off-site transfers and designated them as “off-site releases”. These changes do not generallyaffect reporting, but they make a difference in analysis and presentation of the data. Envirofacts, theinteractive EPA Web site which gives access to TRI data, follows this revised presentation of releases.(Other tools and older reports do not reflect these changes.)

ENV/JM/MONO(2000)17
53
2.3.4 North American Commission on Environmental Co-operation
The experience of the North American Commission on Environmental Co-operation (NACEC) in itsannual PRTR data reports indicates the challenges and benefits of comparing, analysing, anddisseminating data from different PRTR systems. NACEC’s data analyses build on the preliminaryreport, aptly titled, Putting the Pieces Together: The Status of Pollutant Release and Transfer Registers inNorth America (May 1996).
For its annual data series, Taking Stock: North American Pollutant Releases and Transfers (Annex 3,Table 3 contains the Table of Contents of the 1995 report), NACEC in essence builds a North Americandatabase from the data elements that Canada’s NPRI and the US TRI have in common. The chemicallists, industry coverage, and specific data elements in NPRI and TRI differ—in some cases significantly.However, these two systems address a substantial core of industries and chemicals, and they incorporate asubstantial body of comparable data elements. From these common elements, a North American viewbegins to emerge. The largest gap in this view is that Mexico’s RETC has not yet collected national datathat can be incorporated in NACEC’s analyses. These North American reports illustrate the types ofanalyses possible with PRTR data.
NACEC’s Taking Stock reports have had their most visible impact in Canada, where PRTR informationand publicity is still a relatively new phenomenon for industry, the press, and the public. Having Mexicandata available will extend the value and impact of this continent-wide PRTR dissemination tool. As notedbelow, NACEC plans to make its North American dataset available on the Web along with the annualprint publication.
2.3.5 United Kingdom (England and Wales) – Pollutant Inventory and Chemical Release Inventory
The original UK pollutant inventory, the Chemical Release Inventory (CRI) presented a summary of datain a printed form. The original data release for 1992 and 1993 was organised under a series of topics thatincluded statistics and explanations. This report included media releases, top ten substance releases andmaps indicating releases per country of greenhouse and ozone-depleting chemicals. It includes the totalquantity of substances released per year, county-by-county releases in table format, and releases byindustry type. The second report changed somewhat and was organised by topics of environmentalconcern and environmental policies. Topics addressed included: the greenhouse effect and stratosphericozone depletion, acid deposition and nitrogen deposition, volatile organic compounds and photochemicaloxidants, particles, and toxic substances.
Tables, figures, and maps summarising pertinent national data supplemented the substantive discussionsof these topics. Some contextual information were also included. In the discussion of acid deposition, forexample, maps compared predicted deposition of sulphur (1989 to 1992) from all non-marine sources toempirical estimates of critical loads for soil acidity on a county-level basis.
CRI data for all counties in England and Wales (one county to a page) appeared in map and table form.Industry pages were similar to county presentations, but substituted a photographic illustration for theindustry in lieu of a map. The CRI report also itemised releases of each substance to all media for 1994,the year of the report, and for each year 1991-to-1993 where data were available. The followingexamples, Tables 3-4 and Figure 5, indicate how data were presented in this report.
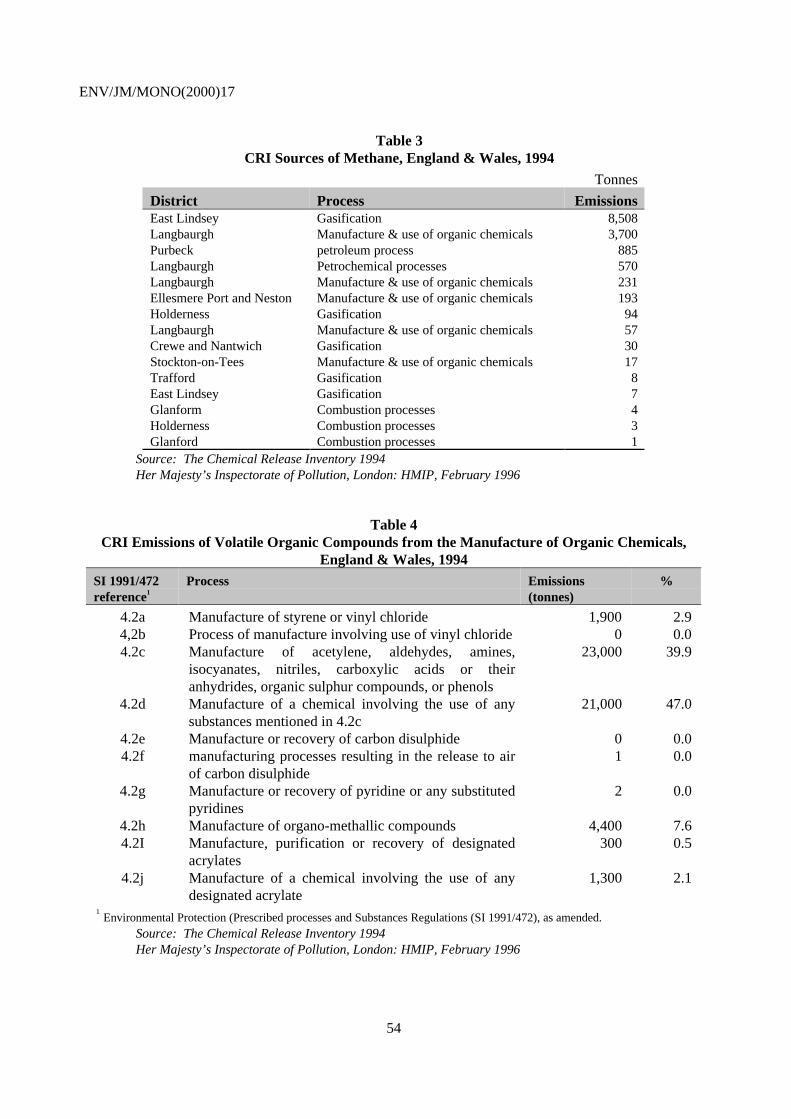
ENV/JM/MONO(2000)17
54
Table 3CRI Sources of Methane, England & Wales, 1994
Tonnes
District Process EmissionsEast Lindsey Gasification 8,508Langbaurgh Manufacture & use of organic chemicals 3,700Purbeck petroleum process 885Langbaurgh Petrochemical processes 570Langbaurgh Manufacture & use of organic chemicals 231Ellesmere Port and Neston Manufacture & use of organic chemicals 193Holderness Gasification 94Langbaurgh Manufacture & use of organic chemicals 57Crewe and Nantwich Gasification 30Stockton-on-Tees Manufacture & use of organic chemicals 17Trafford Gasification 8East Lindsey Gasification 7Glanform Combustion processes 4Holderness Combustion processes 3Glanford Combustion processes 1
Source: The Chemical Release Inventory 1994Her Majesty’s Inspectorate of Pollution, London: HMIP, February 1996
Table 4CRI Emissions of Volatile Organic Compounds from the Manufacture of Organic Chemicals,
England & Wales, 1994SI 1991/472reference1
Process Emissions(tonnes)
%
4.2a Manufacture of styrene or vinyl chloride 1,900 2.94,2b Process of manufacture involving use of vinyl chloride 0 0.04.2c Manufacture of acetylene, aldehydes, amines,
isocyanates, nitriles, carboxylic acids or theiranhydrides, organic sulphur compounds, or phenols
23,000 39.9
4.2d Manufacture of a chemical involving the use of anysubstances mentioned in 4.2c
21,000 47.0
4.2e Manufacture or recovery of carbon disulphide 0 0.04.2f manufacturing processes resulting in the release to air
of carbon disulphide1 0.0
4.2g Manufacture or recovery of pyridine or any substitutedpyridines
2 0.0
4.2h Manufacture of organo-methallic compounds 4,400 7.64.2I Manufacture, purification or recovery of designated
acrylates300 0.5
4.2j Manufacture of a chemical involving the use of anydesignated acrylate
1,300 2.1
1Environmental Protection (Prescribed processes and Substances Regulations (SI 1991/472), as amended.
Source: The Chemical Release Inventory 1994Her Majesty’s Inspectorate of Pollution, London: HMIP, February 1996
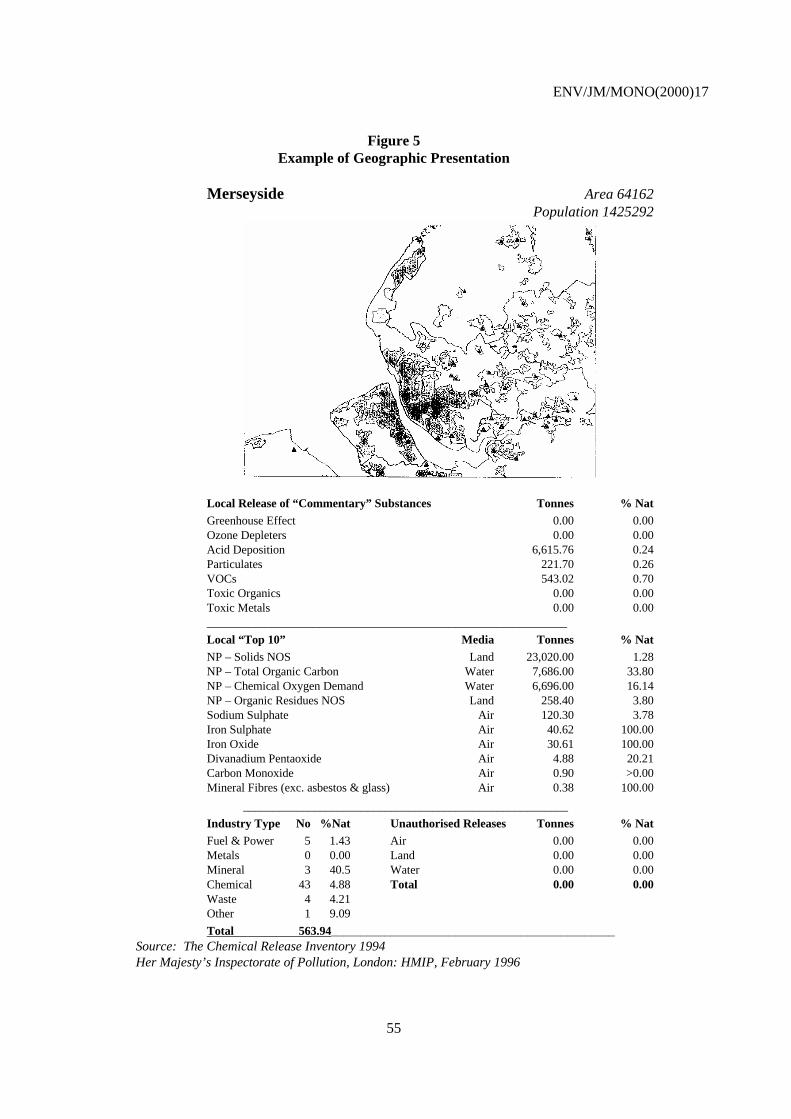
ENV/JM/MONO(2000)17
55
Figure 5Example of Geographic Presentation
Merseyside Area 64162Population 1425292
Local Release of “Commentary” Substances Tonnes % NatGreenhouse Effect 0.00 0.00Ozone Depleters 0.00 0.00Acid Deposition 6,615.76 0.24Particulates 221.70 0.26VOCs 543.02 0.70Toxic Organics 0.00 0.00Toxic Metals 0.00 0.00_____________________________________________________________
Local “Top 10” Media Tonnes % NatNP – Solids NOS Land 23,020.00 1.28NP – Total Organic Carbon Water 7,686.00 33.80NP – Chemical Oxygen Demand Water 6,696.00 16.14NP – Organic Residues NOS Land 258.40 3.80Sodium Sulphate Air 120.30 3.78Iron Sulphate Air 40.62 100.00Iron Oxide Air 30.61 100.00Divanadium Pentaoxide Air 4.88 20.21Carbon Monoxide Air 0.90 >0.00Mineral Fibres (exc. asbestos & glass) Air 0.38 100.00
_______________________________________________________
Industry Type No %Nat Unauthorised Releases Tonnes % NatFuel & Power 5 1.43 Air 0.00 0.00Metals 0 0.00 Land 0.00 0.00Mineral 3 40.5 Water 0.00 0.00Chemical 43 4.88 Total 0.00 0.00Waste 4 4.21Other 1 9.09
Total 563.94________________________________________________Source: The Chemical Release Inventory 1994Her Majesty’s Inspectorate of Pollution, London: HMIP, February 1996

ENV/JM/MONO(2000)17
56
2.4 Electronic Option: World Wide Web
In the information revolution of the 90s, the World Wide Web has exponentially expanded the reach ofdata in all dimensions. More information is available to more people—and much faster—than everbefore. The Web also greatly expands the audience for any given type of information. PRTR reportspublished in print are generally distributed to pertinent federal and state/province government officials,non-governmental organisations, and the press; placed in libraries for public access; and sent to otherinterested persons on request. In contrast, PRTR data on the Web are immediately available to anyonewith a computer, a modem, an Internet service, and a Web browser. Similarly, where corporate reportsonce went to shareholders and the financial community, companies that now choose to place theirenvironmental reports on the Web are sharing that information with any interested Web-site visitor.
PRTR data users have many needs. A dissemination approach that meets one set of priority needs will notnecessarily address another. The clearest instance of this is in data made available on the World WideWeb. Users seeking to answer narrowly defined questions (e.g. what chemical substances do the factoriesand power plants in my community release to the air? have these emissions increased or decreased overthe last five years? what ecological and human health effects may be associated with these chemicals?)will probably find Web search mechanisms and the supporting information supplied with them mosteffective. Some larger analyses, however, cannot be readily conducted by one-at-a-time searches. Userswith these interests need access to complete data, and such users most often have the database skills tomake good use of them.
Similarly, PRTR data in Web-based presentations are seldom “portable”. Even users with modestdatabase skills may wish to collect and review data for several facilities or several localities. These usersmay find themselves printing numerous Web pages and adding up numbers by hand. Despite the rapidincrease in both computer and user sophistication, most Web-based systems will leave many personsretrieving too little or too much to answer the questions that arise as users gain experience in making gooduse of PRTR data.
One principal distinction among Web sites is whether they offer mapping. Some sites rely on maps as aprincipal tool for navigating the data and displaying results. These include not only maps of facilitylocations but also maps that illustrate data via shading or other signals. Other sites offer mapping as anoptional output. Some Web systems do not use maps—interactive or illustrative—at all. Maps are clearlya valuable visual tool—words and tables cannot convey the many physical relationships between sourcesof releases and the world and its inhabitants. At the same time, however, mapping is resource-intensive.Community groups and citizens without access to high-end computer resources find map-based systemsslow and unwieldy. Mapping also calls into question the accuracy of the geographical co-ordinatesassigned to reporting facilities. The United States and Canada have both found this an area in whichfacilities themselves make many errors. US EPA supplies alternative co-ordinates based on postal codes.While these are adequate for mapping large areas, they would not serve for detailed local maps. In ruralareas, where postal codes cover large territories, assigned co-ordinates may distort the siting of facilitiesin relation to geographic and other features.
Both governmental and non-governmental entities have taken leading roles in disseminating PRTR datavia the World Wide Web, as suggested in the earlier discussion of disseminators.
Table 14 at the conclusion of this Annex, itemises characteristics of selected Web sites that supply PRTRdata and one example (CORINAIR) of non-integrated data.

ENV/JM/MONO(2000)17
57
Box 2Caught in the Web?
Web-based interfaces not only make PRTR data accessible to far more users, they also help make the data morecomprehensible to users who are not expert at analysing raw data and applying the necessary database andspreadsheet software for such analysis.
Such an interface, however, also sets limits on what can be learned from the data. For example, a user may obtainsummary data for a specific industry’s total releases to surface waters over time, but may have to conduct repeatedsearches to obtain all the detailed facility-specific data reflected in that summary.
Seemingly small technical issues can sometimes be an obstacle to successful aggregations—for example, how toconduct such an industry-wide analysis when facilities often redefine their business activities over time. Geographicanalyses may be similarly complicated when facilities that are quite near each other and have potential impacts onthe same ecological and human environments are located in different political subdivisions (counties,municipalities, etc.) Even such factors as the difference between a facility’s mailing address and its actual locationcan influence the reliability of geographic analyses. Facilities may report their names differently from year to year(an acronym in one year, for example, and a full name in another).
Search mechanisms that facilitate user access to PRTR data on the Web cannot address each of these individualfactors in fulfilling users’ requests for data. Savvy users rapidly learn both the benefits and the limitations of thetools they’re applying.
2.4.1 Searchable PRTR Data on the Web
In practical terms, World Wide Web dissemination of complete PRTR data almost inevitably involvessome electronic interface between the data user and the full set of reported data. (The next section below,“Complete Data Files on the Web”, discusses the exception—downloading data files from the Web.)These search mechanisms not only deliver data in response to specific user requests, their very structurecan help to make clear the nature of PRTR data and the kinds of questions that PRTR might appropriatelybegin to address. Facility, industry, location, chemical substance, environmental medium, and year aretypical PRTR elements on which Web interface mechanisms can search and deliver data.
Mapping has proven a useful tool in these Web sites. Several of these interactive tools allow users to findfacilities and data by zooming in geographically to the area of their interest. More significantly, searchresults are mapped, the first step in making clear the relationships of releases and transfers to humanpopulations and ecological systems.
Box 3WSYWIG
What You See Is What You Get. To minimise potentially lengthy descriptions of existing and prototype PRTRsearch vehicles on the Web, this report incorporates selected “screen captures” to demonstrate their use and theresults. These screens should be particularly useful in assessing the types of data made available by the various Webdisseminators: Does a Web site supply facility-specific data? Can a user search the database by chemical? Whatcontextual information, if any, does the Web site offer?
Although these images illustrate major features of the dissemination vehicles, they do not necessarily depict all thefunctions available in any given Web site. Web site features also change over time and those exhibited here maywell alter or be replaced. Features are being updated or added even as this report is published.

ENV/JM/MONO(2000)17
58
2.5 Examples: World Wide Web
The following examples are Internet presentation methods used by Member countries, as each countryuses a different method to present data. Examples of the query form used to access a country's data arealso included.
2.5.1 Canada’s National Pollutant Release Inventory (NPRI)
Environment Canada takes a who? what? when? where? why? approach to its National Pollutant ReleaseInventory (NPRI) Web-site user interface (http://www.ec.gc.ca/pdb/npri/).
Figure 6Example of a search page
Source: NPRI, Environment Canada, 1998
Pick lists of chemical names and Chemical Abstracts System (CAS) numbers facilitate accurateidentification of substances. The NPRI query form also specifies the effective date of the database beingsearched. For some users, this detail could be important. Because PRTR systems are typically underconstant revision, as facilities correct previous submissions, this date can be significant for comparinganalyses developed at different times. Such a date is rarely posted in Web-based PRTR disseminationtools and seldom appears in printed PRTR publications; it should be included to help users and readersunderstand and resolve discrepancies over time.
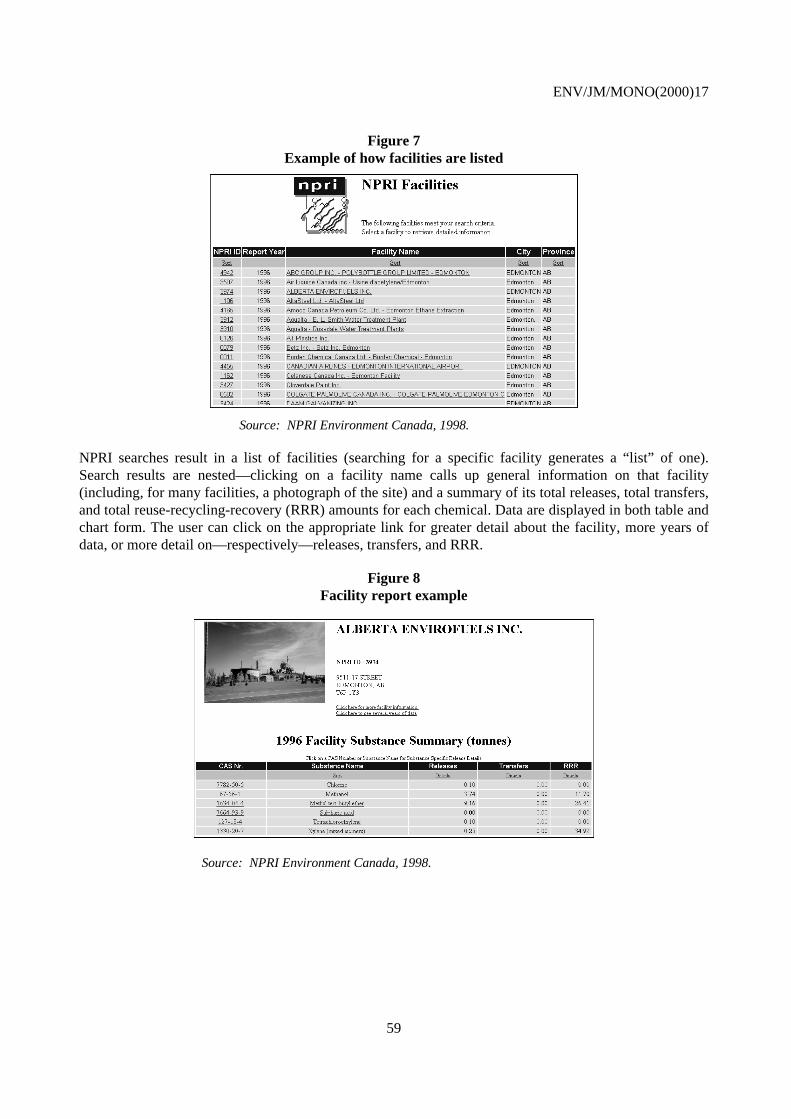
ENV/JM/MONO(2000)17
59
Figure 7Example of how facilities are listed
Source: NPRI Environment Canada, 1998.
NPRI searches result in a list of facilities (searching for a specific facility generates a “list” of one).Search results are nested—clicking on a facility name calls up general information on that facility(including, for many facilities, a photograph of the site) and a summary of its total releases, total transfers,and total reuse-recycling-recovery (RRR) amounts for each chemical. Data are displayed in both table andchart form. The user can click on the appropriate link for greater detail about the facility, more years ofdata, or more detail on—respectively—releases, transfers, and RRR.
Figure 8Facility report example
Source: NPRI Environment Canada, 1998.

ENV/JM/MONO(2000)17
60
Figure 9Map of facility location
Source: NPRI Environment Canada, 1998
Figure 10Presentation method used for displaying a summary of substances released, transferred and for
recycling, reuse or recovery (RRR)
Source: NPRI, Environment Canada, 1998
The additional facility detail includes contact information, parent company information, geographic co-ordinates for mapping the facility’s location, and a list of the other environmental programmes underwhich the facility reports—with the facility’s identification numbers in those programmes. Few Web-based dissemination tools and prototypes presently available incorporate all of these details, particularly

ENV/JM/MONO(2000)17
61
geographic co-ordinates and facility IDs under other environmental programmes. Such data areinvaluable for many purposes.
Figure 11Display page of facility-specific location and contact information
Source: NPRI Canada
The NPRI Web site makes clear one of the simultaneous benefit/limitation aspects of Web-based PRTRdissemination tools which is it lays out results clearly in a visually well-designed display. Where a greatdeal of information is available, this will entail more than one display. Users can print these results, butfor Canada’s NPRI, as an example, this will amount to printing five screens per facility for a single year’sdata. This type of limitation indicates the value of Environment Canada’s decision to make NPRI dataavailable for downloading from the Web in forms compatible with spreadsheet and relational databaseapplications, as discussed later in this report.

ENV/JM/MONO(2000)17
62
Box 4Chemical Groups of Concern
One attribute of some searchable databases sets a limit on their utility for analyses focusing on particular groups ofchemicals. Although a principal use of interactive on-line systems may be access to individual facility reports, thereare many useful analyses at all geographic levels that focus on individual chemicals or groups of chemicals. Twocharacteristics are important:
• Can a user search the database for all reports on a specific chemical?—Most Web-based dissemination ofPRTR data include this feature, but some do not.
• Does the Web site include pre-selected searches that return all chemicals in a particular group of concern,such as carcinogens or ozone depleters? If not, the user must search for each chemical, one at a time, andsomehow accumulate the results (usually by printing out reports).
A critical issue can be identifying a definitive list of the chemicals in a group of concern. For ozone depleters, theMontreal Protocol establishes an authoritative list. For other groups, a list of chemicals may not have beenauthoritatively established (persistent bio-accumulating toxins or endocrine disrupters, for example). Similarly, morethan one definitive list may exist for a particular group (for example, the International Agency for Research onCancer and the U.S. National Toxicology Programme differ in their designation of known or suspect carcinogens).
Dissemination tools can be most helpful by identifying the chemicals in a group of particular concern, naming thesource of the list, and offering pre-selected searches or supplying the results of analyses conducted by the agencyproducing the Web site.
2.5.2 US Toxics Release Inventory (TRI)
Three Web sites make US TRI data publicly available on the Internet: RTK NET, EDF Scorecard, and USEPA’s Envirofacts.
One of the earliest on-line access mechanisms for PRTR data was the RTK NET electronic bulletin boardservice, which pre-dated the World Wide Web. RTK NET’s bulletin board system, permitting bothsimple queries and downloading of complete data, helped establish a model for electronic datadissemination as the World Wide Web came into play. RTK NET expanded its data delivery to the Web,but has also maintained the bulletin board service to facilitate downloading raw TRI data whether bycomplete year or for selected subsets.
A useful feature of RTK NET’s Web site allows users to choose to receive their search results by E-mailrather than displayed in their Web browser. This can facilitate use of the data for independent analyses.
From the opening screen in RTK NET (http://www.rtk.net/), a visitor to the site can initiate a quick searchby location across numerous databases. In addition to US Toxics Release Inventory data, RTK NETfurnishes public access to nine other environmental databases as well as to three databases of informationon housing issues such as government-sponsored mortgage loans for home purchases. RTK NET userscan conduct master searches of all databases at once, searching by geographic area, by facility, or byindustry.
Many users will want to define their inquiry. RTK NET’s Web site (updated with release of the 1997 USTRI data in May 1999) supplies the means to search US TRI data by geographic area (including postalcode), by facility, by industry, by parent company, or—an important and often over-looked feature ofPRTR data—by the locations which receive chemical waste shipped (“transferred”) by reporting facilities.
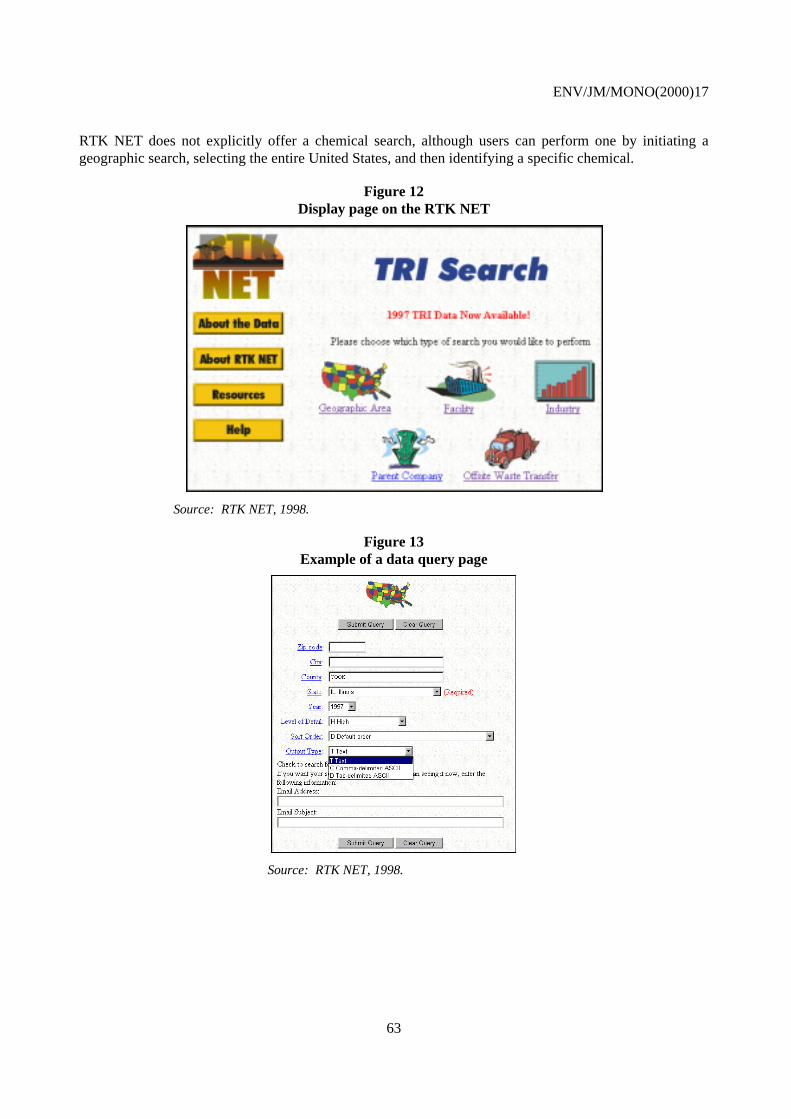
ENV/JM/MONO(2000)17
63
RTK NET does not explicitly offer a chemical search, although users can perform one by initiating ageographic search, selecting the entire United States, and then identifying a specific chemical.
Figure 12Display page on the RTK NET
Source: RTK NET, 1998.
Figure 13Example of a data query page
Source: RTK NET, 1998.

ENV/JM/MONO(2000)17
64
Figure 14Company data page
Source: RTK NET, 1998.
Figure 15Example of a display page of the breakdown of releases and waste
Source: RTK NET, 1998.

ENV/JM/MONO(2000)17
65
The Environmental Defense [Fund] Scorecard Web site combines in its opening screen a preview of atop-10 facility ranking, a news story, a choice of five environmental issues each with its own overviewmap of the data, a postal code search facility, a site navigation pick list, and a site-wide search engine(http://www.scorecard.org/).
Figure 16Search display page
Source: Environmental Defense [Fund] Scorecard, 1998.
Figure 17Example of pollution locator display
Source: Environmental Defense [Fund] Scorecard, 1998.

ENV/JM/MONO(2000)17
66
The Scorecard is quintessentially a community-focused tool. For locating data, the Scorecard isprincipally driven by “drilling” down through map layers to the local point of interest or by entering apostal code. A text-based alternative search mechanism supports searches by state, county, or by facilityname. Users cannot initiate a search by chemical.
Action opportunities appear throughout the site, integrated with search results. Access to related facilityand local/regional information is similarly integrated.
Figure 18Specific facility information and other queries on actions that can be taken
Source: Environmental Defense [Fund] Scorecard, 1998.
Results for a single facility include rankings by percentile for numerous potential health effects (forexample, in the top 20 percent of all reporting facilities for cancer hazards, non-cancer hazards, airreleases of recognised carcinogens, air releases of recognised developmental toxicants, air releases ofrecognised reproductive toxicants, water releases of suspected carcinogens, air releases of suspectedcardiovascular or blood toxicants, etc.) and for total releases (total environmental releases, air releases,surface water discharges, production-related waste, and off-site transfers to other locations for wastemanagement or disposal). Amounts of releases are also associated with the various health-effectcategories. In terms of presentation, health-effects and risk information are given precedence over thetraditional presentations of reported amounts by release and transfer type.
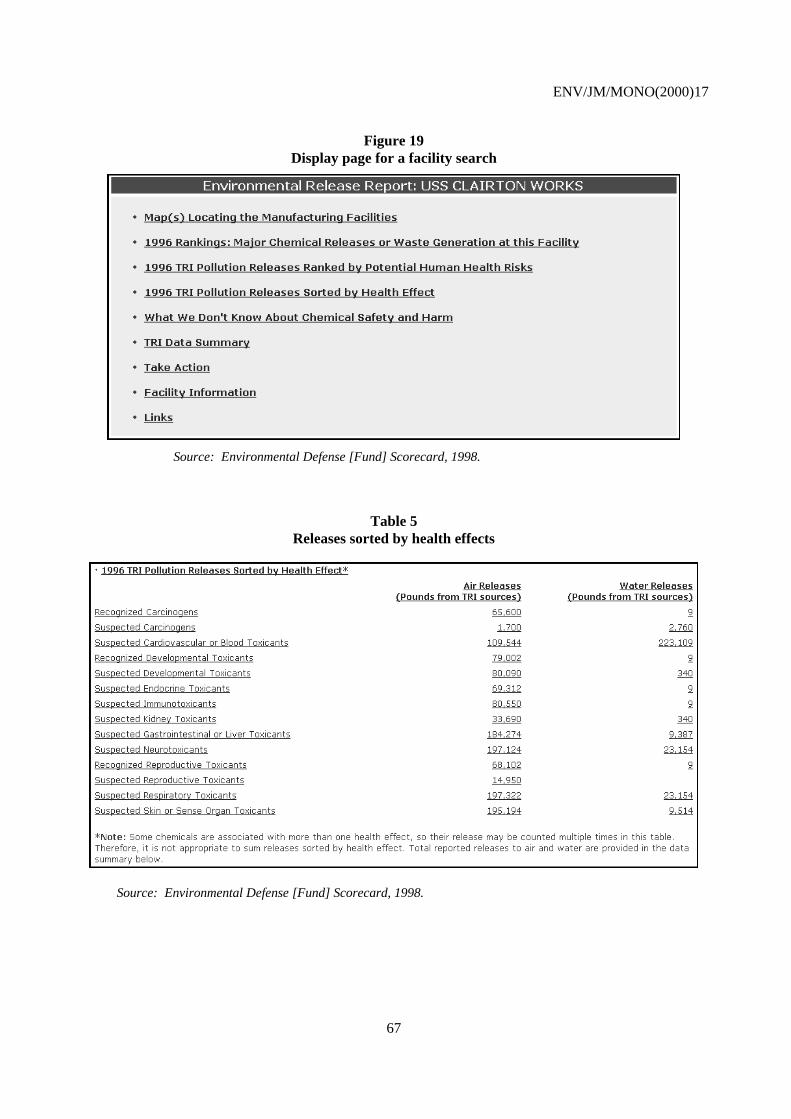
ENV/JM/MONO(2000)17
67
Figure 19Display page for a facility search
Source: Environmental Defense [Fund] Scorecard, 1998.
Table 5Releases sorted by health effects
Source: Environmental Defense [Fund] Scorecard, 1998.
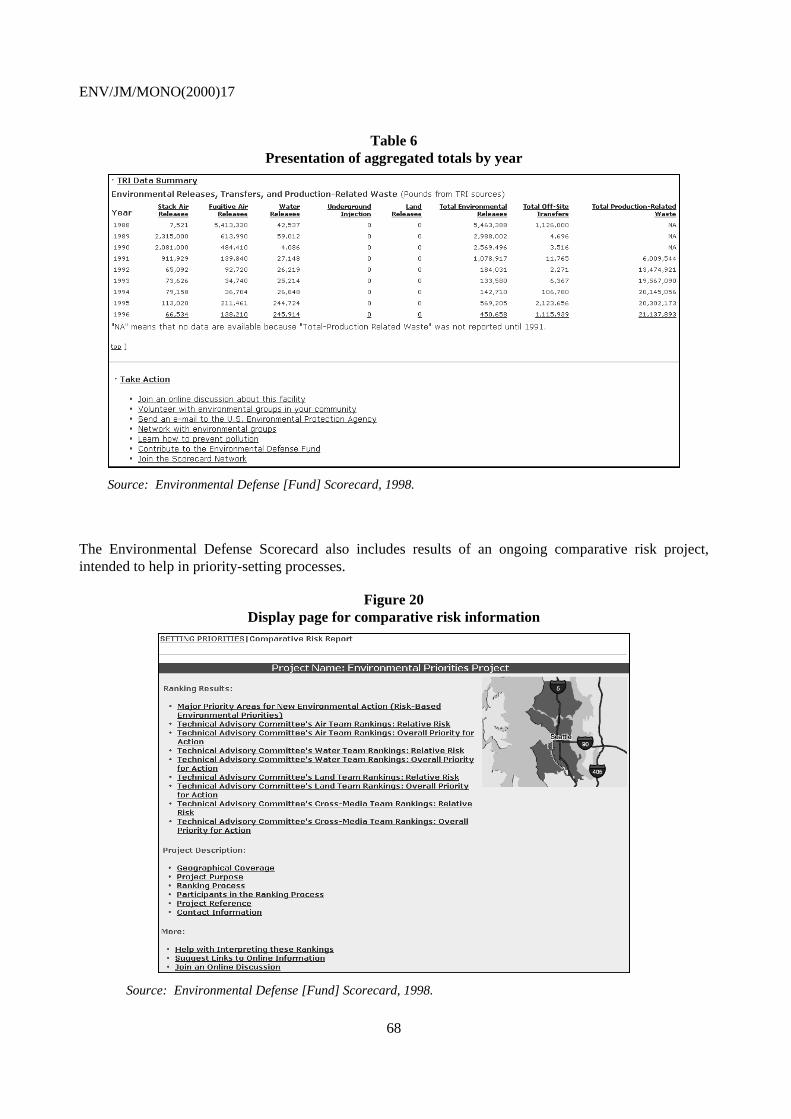
ENV/JM/MONO(2000)17
68
Table 6Presentation of aggregated totals by year
Source: Environmental Defense [Fund] Scorecard, 1998.
The Environmental Defense Scorecard also includes results of an ongoing comparative risk project,intended to help in priority-setting processes.
Figure 20Display page for comparative risk information
Source: Environmental Defense [Fund] Scorecard, 1998.

ENV/JM/MONO(2000)17
69
Although other Web-based tools for access to US TRI data (RTK NET and Envirofacts) have madeavailable the 1997 TRI data, released by US EPA in May 1999, the latest year available in EDF’sScorecard at the time of this report was 1996.
The US EPA's own Web-based tool, Envirofacts, covers seven major environmental databases includingtheir Toxics Release Inventory (http://www.epa.gov/enviro/index_java.html).
Figure 21Display page for Envirofacts web site
Source: Envirofacts, US EPA, 1998.
Standard searches of US TRI data include facility, location, industrial classification, and chemical.Envirofacts includes a mapping tool, and users have the option of generating maps directly or ofdisplaying the results of their searches and then requesting a map. Data can also be displayed in graphs.Links are offered to other Envirofacts databases that contain data for the selected facility.
Figure 22Display of results of a query
Source: Envirofacts, US EPA, 1998.

ENV/JM/MONO(2000)17
70
Figure 23Envirofacts search page example
Source: Envirofacts, US EPA, 1998.
Figure 24Display page of total aggregate releases by environmental media
Source: Envirofacts, US EPA, 1998.
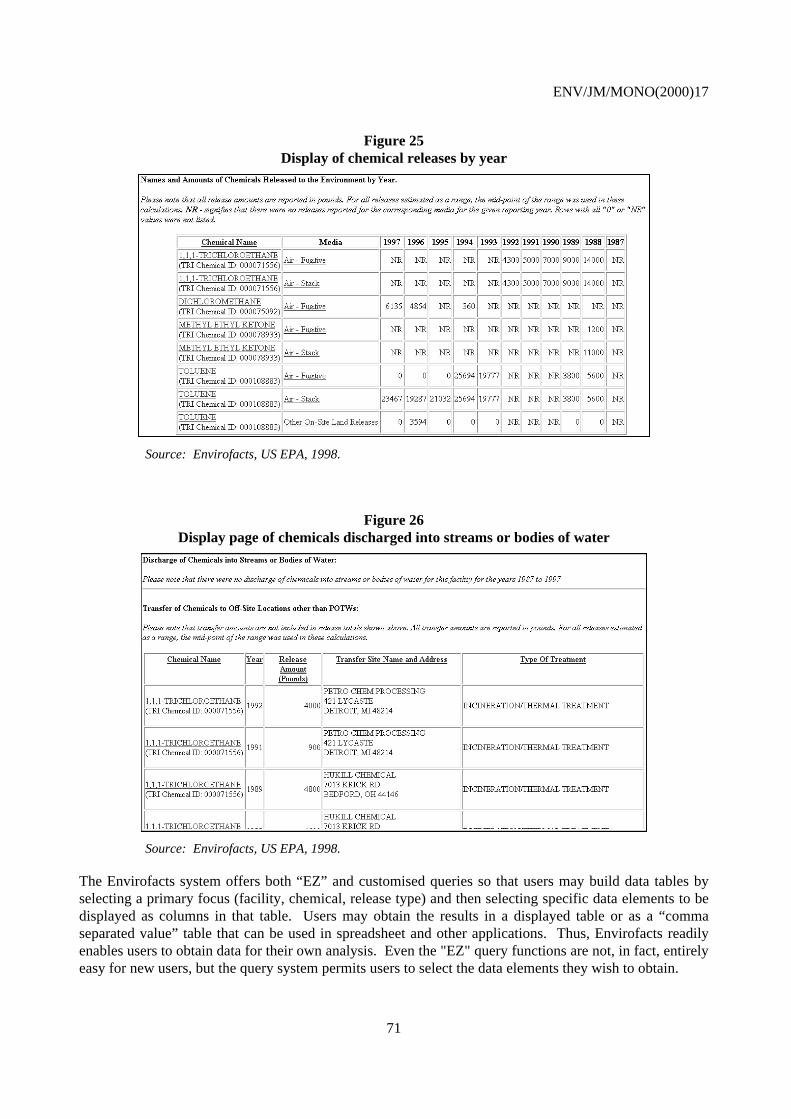
ENV/JM/MONO(2000)17
71
Figure 25Display of chemical releases by year
Source: Envirofacts, US EPA, 1998.
Figure 26Display page of chemicals discharged into streams or bodies of water
Source: Envirofacts, US EPA, 1998.
The Envirofacts system offers both “EZ” and customised queries so that users may build data tables byselecting a primary focus (facility, chemical, release type) and then selecting specific data elements to bedisplayed as columns in that table. Users may obtain the results in a displayed table or as a “commaseparated value” table that can be used in spreadsheet and other applications. Thus, Envirofacts readilyenables users to obtain data for their own analysis. Even the "EZ" query functions are not, in fact, entirelyeasy for new users, but the query system permits users to select the data elements they wish to obtain.

ENV/JM/MONO(2000)17
72
Envirofacts users can search within TRI or make use of search by a facility identifier that crosses all thedatabases. Some users conducting detailed research have found that Envirofacts may not successfullylocate data for facilities from one database to another because of inconsistencies in the way facilitiesreport and the substantial differences from one reporting system to another in how facilities are identified.Nevertheless, this system provides a good example of an integrated database.
2.5.3 The Netherlands—Datawarehouse-Pollutant Emission Register
The Netherlands has developed a “Prototype Datawarehouse Viewer” distributed on CD-ROM andaccessible on the Web at http://www.erc.geodan.nl. (Users of the Web prototype must register on-line andobtain a password.). The Datawarehouse prototype contains sampling of the PER data for 1994, selectedto cover examples of the different source categories or sectors such as industry, public utilities, traffic,households, agriculture, and nature. Users can search by year, by chemical, by location, and by sourcecategory. (The Netherlands’ Pollutant Emission Register (PER) collects air and water emissions data forlarge point sources and estimates emissions data for small and diffuse sources.) The Netherlands plans tomake available by the end of 1999 a limited dataset for 1997 and possibly 1996 (previous years must berecalculated for consistency), also with limited GIS functionality.
The Netherlands has previously published printed reports summarising PER data, but has used its centraldatabases principally for policy and research applications. Information at the level of industrial processesis restricted to regulatory authorities. National, regional, and local level governmental authorities haveaccess to the PER data, and the public can obtain information—including facility-specific emissionsdata—on request from a central information office. (Research projects, often funded by governmentagencies, also made use of the PER data.) Thus, the Datawarehouse represents a tool that will greatlyexpand public access to the Netherlands’ PER data—from making application to an information office tohands-on access via the Web. The Datawarehouse prototype on both the Web and CD-ROM also containstwo recent PER annual reports (1994 and 1995) and supporting articles on PRTRs and the PER.
Datawarehouse users begin by choosing a source such as agriculture, industry, refineries, energy, trafficand transport, consumers, building, waste disposal, drinking water companies, sewage works, HDO, ornature. Users interested in large point emissions (large combustion sources) view a map of the facilitiesand a comprehensive data table. Clicking on a facility on the map displays that facility’s ID, companyname, location, year, chemicals, and amounts. The Datawarehouse contains air emissions data for someprovinces, mapped and accessible in the same way. Water data are presented for 12 provinces and 95water quality areas.
The example in Figure 27 shows air emissions by the energy sector by province. The table supplies databy chemical (or group) for each province. Clicking on the map with the “Information” pointer (whiteballoon with the letter "i") displays the data for the selected province (Gelderland, in the example below).Figure 28 below shows large point sources of water discharges. All screens in the Datawarehouse applythis model: a map (with shading or markers indicating relative amounts), the key or legend to the map, acomplete data table, and a window which will display data for the user’s selection of province, facility, orwater quality area (as appropriate). Both the data table and the data window are scrollable to reveal allitems. This consistent visual presentation of the various “slices” of data helps make the Datawarehouse aneasy tool to learn and use.
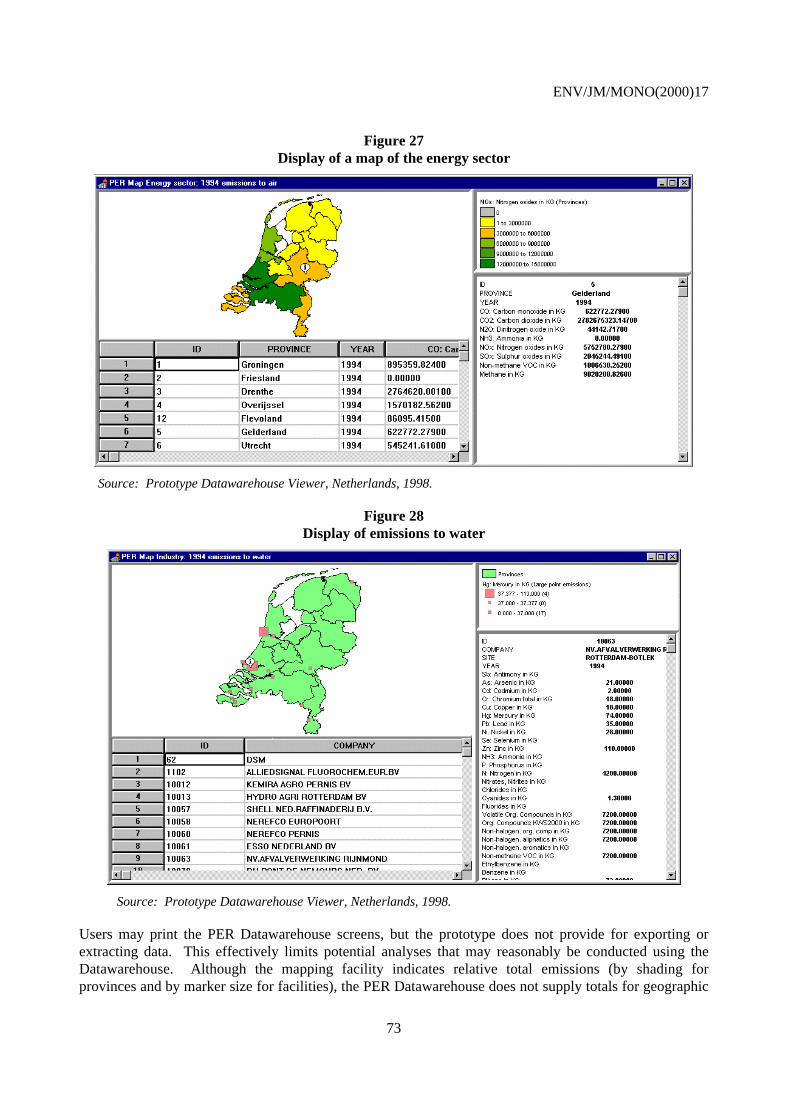
ENV/JM/MONO(2000)17
73
Figure 27Display of a map of the energy sector
Source: Prototype Datawarehouse Viewer, Netherlands, 1998.
Figure 28Display of emissions to water
Source: Prototype Datawarehouse Viewer, Netherlands, 1998.
Users may print the PER Datawarehouse screens, but the prototype does not provide for exporting orextracting data. This effectively limits potential analyses that may reasonably be conducted using theDatawarehouse. Although the mapping facility indicates relative total emissions (by shading forprovinces and by marker size for facilities), the PER Datawarehouse does not supply totals for geographic
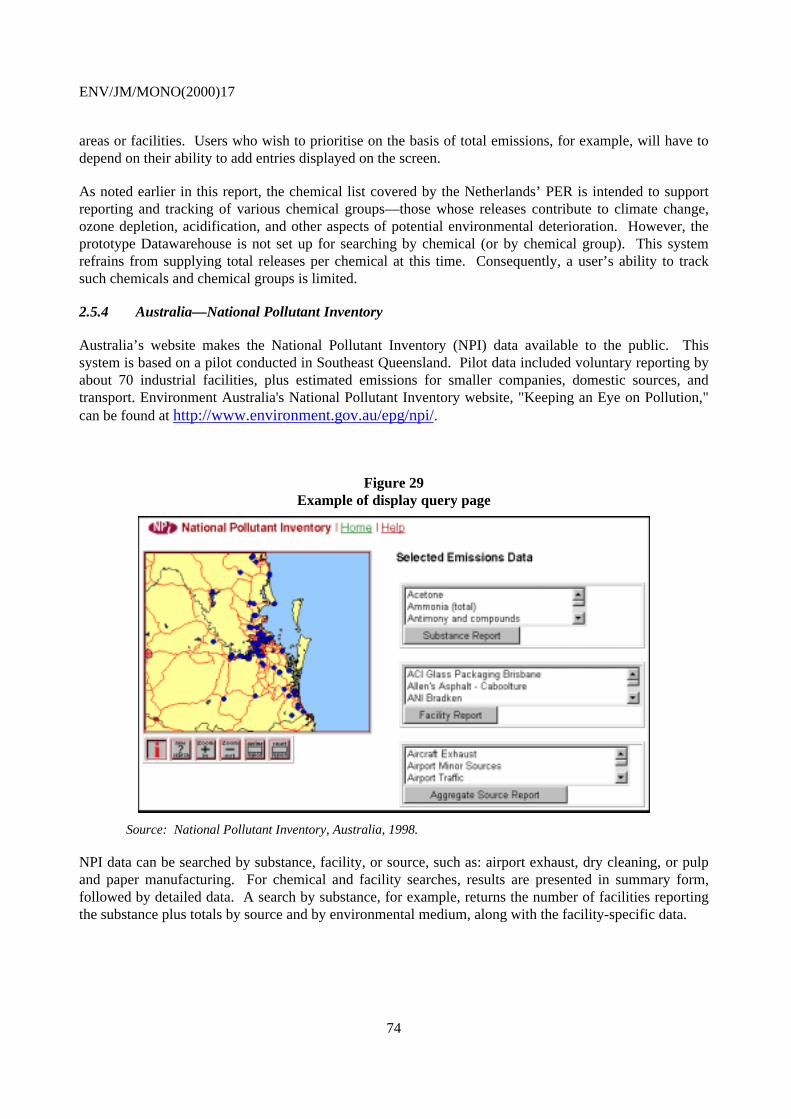
ENV/JM/MONO(2000)17
74
areas or facilities. Users who wish to prioritise on the basis of total emissions, for example, will have todepend on their ability to add entries displayed on the screen.
As noted earlier in this report, the chemical list covered by the Netherlands’ PER is intended to supportreporting and tracking of various chemical groups—those whose releases contribute to climate change,ozone depletion, acidification, and other aspects of potential environmental deterioration. However, theprototype Datawarehouse is not set up for searching by chemical (or by chemical group). This systemrefrains from supplying total releases per chemical at this time. Consequently, a user’s ability to tracksuch chemicals and chemical groups is limited.
2.5.4 Australia—National Pollutant Inventory
Australia’s website makes the National Pollutant Inventory (NPI) data available to the public. Thissystem is based on a pilot conducted in Southeast Queensland. Pilot data included voluntary reporting byabout 70 industrial facilities, plus estimated emissions for smaller companies, domestic sources, andtransport. Environment Australia's National Pollutant Inventory website, "Keeping an Eye on Pollution,"can be found at http://www.environment.gov.au/epg/npi/.
Figure 29Example of display query page
Source: National Pollutant Inventory, Australia, 1998.
NPI data can be searched by substance, facility, or source, such as: airport exhaust, dry cleaning, or pulpand paper manufacturing. For chemical and facility searches, results are presented in summary form,followed by detailed data. A search by substance, for example, returns the number of facilities reportingthe substance plus totals by source and by environmental medium, along with the facility-specific data.

ENV/JM/MONO(2000)17
75
Figure 30Example of chemical page
Source: National Pollutant Inventory, Australia, 1998.
Table 7Facility specific list
Source: National Pollutant Inventory, Australia, 1998.
Facility searches present facility identification and contact information, the number of employees, anddescriptions of the entity’s business activity and industry classification. (Some PRTRs collectemployment data as a rough indicator of economic activity or to generally compare facility size within asector.)
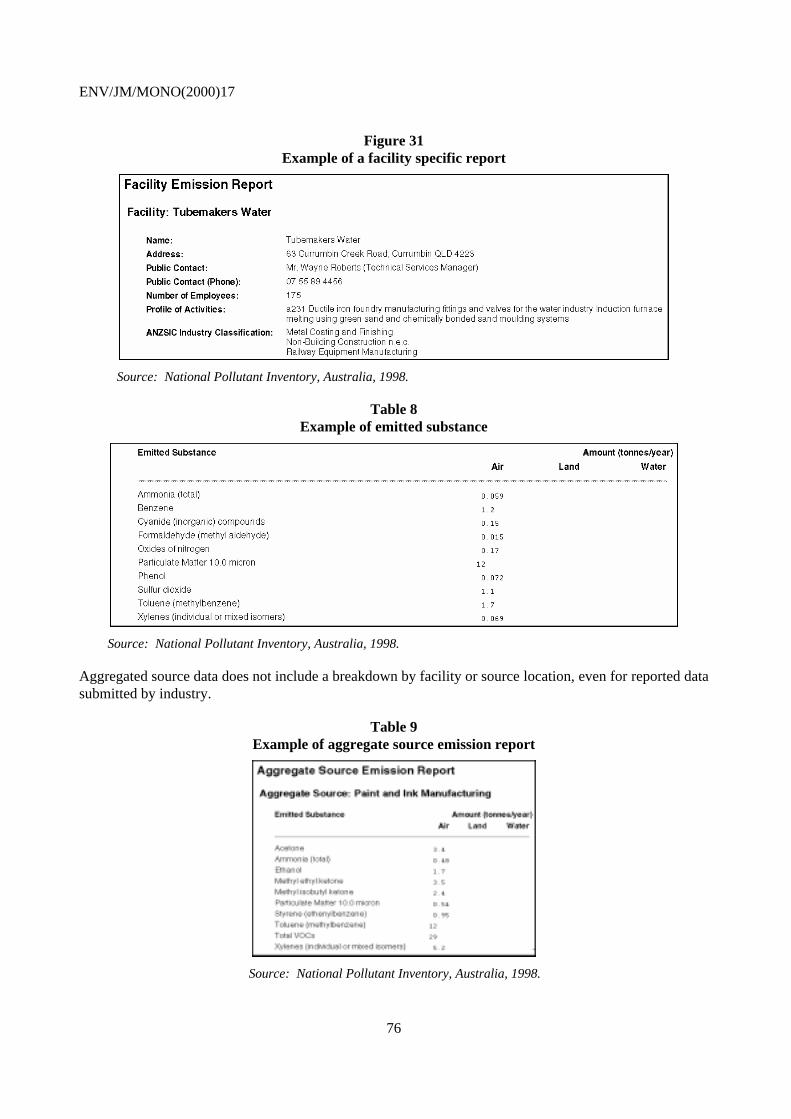
ENV/JM/MONO(2000)17
76
Figure 31Example of a facility specific report
Source: National Pollutant Inventory, Australia, 1998.
Table 8Example of emitted substance
Source: National Pollutant Inventory, Australia, 1998.
Aggregated source data does not include a breakdown by facility or source location, even for reported datasubmitted by industry.
Table 9Example of aggregate source emission report
Source: National Pollutant Inventory, Australia, 1998.

ENV/JM/MONO(2000)17
77
Table 10Example of aggregate source emission report
Source: National Pollutant Inventory, Australia, 1998.
The map feature of the NPI main window is also interactive. A user can search the entire database byplace, company, or substance and the relevant locations (facilities) on the map will be highlighted.Clicking on any facility on the NPI map identifies the facility and the substances it reported to NPI; theseappear in the appropriate report windows.
Figure 32Example of a query page
Source: National Pollutant Inventory, Australia, 1998.
Probably the most advanced example of contextual data provided with PRTR data appears in Australia’sWeb site. Australia is “road testing” a revised contextual information service to accompany the NPIdatabase. Information provided to help put NPI data in context includes: chemical/physical properties,uses, environmental and health impacts, emissions sources (natural and from human activity),environmental fate, data on concentrations found in the environment (for example, concentrations in ruraland in urban areas), exposure limits set or recommended by various regulatory bodies, health effects, andlikely exposures of the general population. This contextual database is also searchable.

ENV/JM/MONO(2000)17
78
Table 11Example of keyword searches
Keyword Searches inAustralia’s “Road Test” of Contextual Information for NPI
Affects animals/birdsAffects fish/amphibians/reptilesAffects plants/treesEnvironment - Bio-accumulationEnvironment - Contributes to smogEnvironment - Contributes to water pollutionEnvironment - Persistent Health - Allergies/asthmaHealth - Cancer/carcinogenicHealth - Circulatory disorderHealth - Growth suppressionHealth – HeadacheHealth - Immune suppression
Health - Liver/kidneyHealth – LungsHealth - Mutations/reproductive effectsHealth – SkinSource – AirSource - Domestic useSource - Industrial processesSource - Natural processesSource – TransportSource - Water/foodState – GasState - Liquid or in solutionState - Solid/dust/particles
Australia also provides background information to explain the content and concepts of the contextual data,a glossary, and references to sources of information used.

ENV/JM/MONO(2000)17
79
2.5.5 United Kingdom
Among Web site vehicles using PRTR data, Friends of the Earth UK (England, Wales, and NorthernIreland) takes the most environmentally activist approach in its Factory Watch(http://www.foe.co.uk/campaigns/industry_and_pollution/factorywatch/). FOE’s Web site was first tosupply the UK’s Chemical Release Inventory data to the public.
Figure 33Example of the Factory Watch home page
Source: Friends of the Earth, United Kingdom, 1998.
Facility data can be retrieved by facility name or location. A geographic search generates a map offacility sites—pointing at a site displays the factory name, clicking on it retrieves its CRI data.
Figure 34Example of a Factory Watch query page
Source: Friends of the Earth, United Kingdom, 1998.

ENV/JM/MONO(2000)17
80
Friends of the Earth has linked many of the chemical substances in its Factory Watch site to the contextualinformation supplied in the Environmental Defense Scorecard for US TRI chemicals.
Figure 35Example of contextual data and information available on Factory Watch
Source: Friends of the Earth, United Kingdom, 1998.
FOE’s Factory Watch also supports searches by chemical, by health effect, by industrial process, and byparent company.
Figure 36League table example from Factory Watch
Source: Friends of the Earth, United Kingdom, 1998.
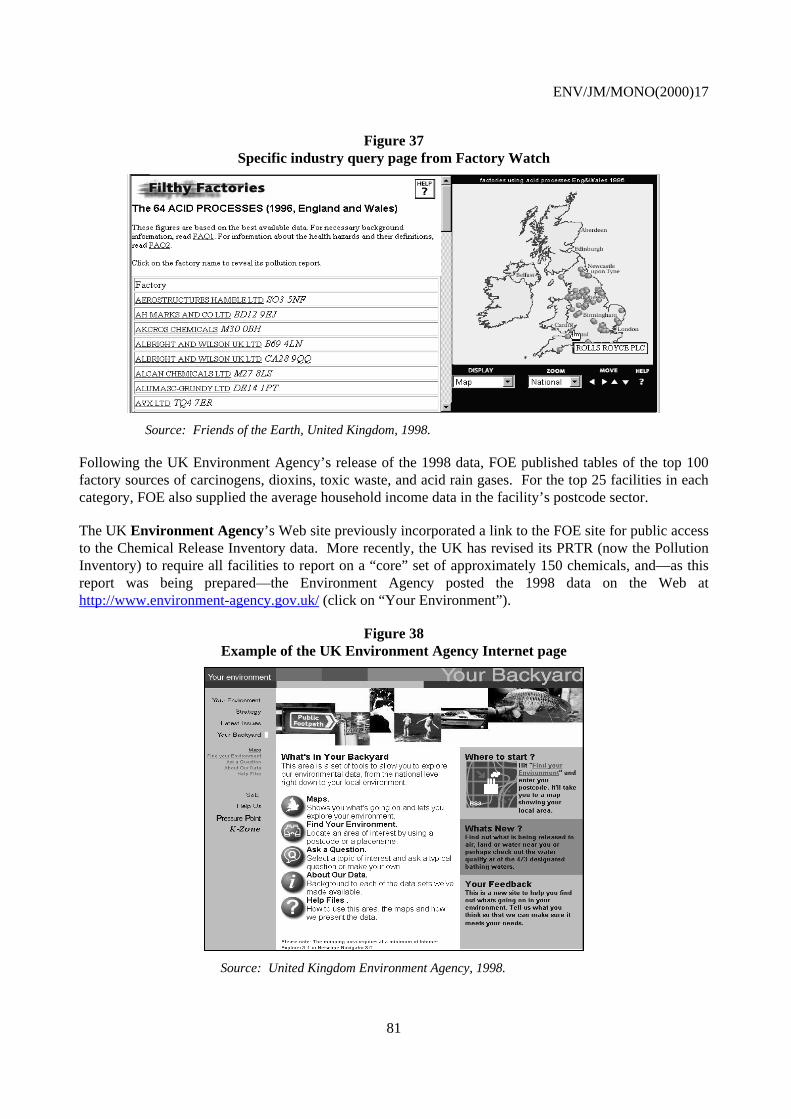
ENV/JM/MONO(2000)17
81
Figure 37Specific industry query page from Factory Watch
Source: Friends of the Earth, United Kingdom, 1998.
Following the UK Environment Agency’s release of the 1998 data, FOE published tables of the top 100factory sources of carcinogens, dioxins, toxic waste, and acid rain gases. For the top 25 facilities in eachcategory, FOE also supplied the average household income data in the facility’s postcode sector.
The UK Environment Agency’s Web site previously incorporated a link to the FOE site for public accessto the Chemical Release Inventory data. More recently, the UK has revised its PRTR (now the PollutionInventory) to require all facilities to report on a “core” set of approximately 150 chemicals, and—as thisreport was being prepared—the Environment Agency posted the 1998 data on the Web athttp://www.environment-agency.gov.uk/ (click on “Your Environment”).
Figure 38Example of the UK Environment Agency Internet page
Source: United Kingdom Environment Agency, 1998.

ENV/JM/MONO(2000)17
82
One feature of the UK Environment Agency's "What's in Your Backyard" site is likely to appealparticularly to public audiences not previously attuned to environmental data: the opportunity to check thewater quality of area bathing beaches (http://146.101.4.38/wiyby/html/introduction.htm).
Figure 39Example of bathing water quality
Source: United Kingdom Environment Agency, 1998.
Figure 40Example of a presentation of water quality samples
Source: United Kingdom Environment Agency, 1998.
The UK Pollution Inventory Web site relies in the first instance on mapping for users to “Find YourEnvironment”, beginning with a map of the whole country, a map centred on a place name, postal code orco-ordinate reference. One or more additional steps may be needed to arrive at sufficient detail to makefacilities visible on this map. The main public register may also be accessed from "What's in YourBackyard".
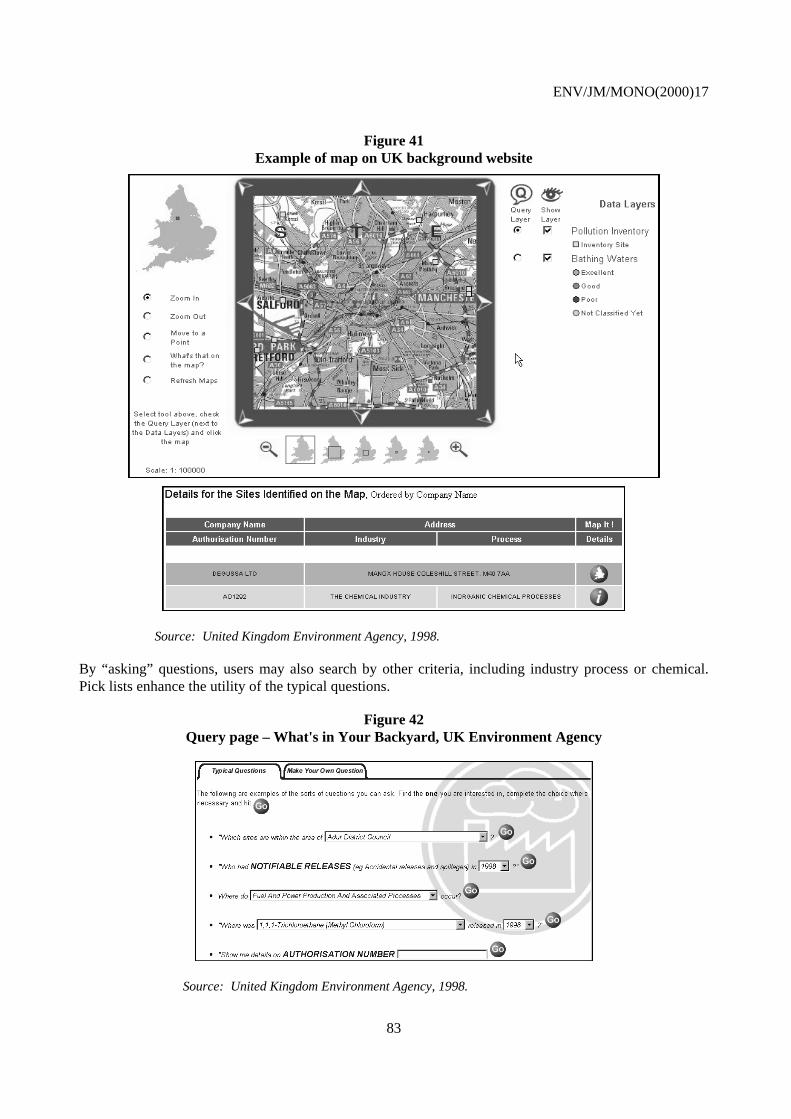
ENV/JM/MONO(2000)17
83
Figure 41Example of map on UK background website
Source: United Kingdom Environment Agency, 1998.
By “asking” questions, users may also search by other criteria, including industry process or chemical.Pick lists enhance the utility of the typical questions.
Figure 42Query page – What's in Your Backyard, UK Environment Agency
Source: United Kingdom Environment Agency, 1998.

ENV/JM/MONO(2000)17
84
Figure 43Example of reported releases – What's in Your Backyard, UK Environment Agency
Source: United Kingdom Environment Agency, 1998.
Whether from a map, from a list of sources of a chemical, or by other avenues, users may retrieve facility-specific details, including authorisation/permit number and industrial sector and process.
Figure 44Example of facility specific details – What's in Your Backyard, UK Environment Agency
Source: United Kingdom Environment Agency, 1998.
Wherever search results display a chemical, the user may click on the chemical name to obtain additionalinformation. The UK Environmental Agency’s approach puts total releases literally in the middle ofselected contextual information, with links to health effects and other supplementary data (a sampling ofthe information appears in the screen capture).

ENV/JM/MONO(2000)17
85
Figure 45Example of additional information about a specific chemical – What's in Your Backyard,
UK Environment Agency
Source: United Kingdom Environment Agency, 1998.
2.6 Complete Data Files on the Web
The one way a Web site may avoid imposing the assumptions of a user interface is to make availablecomplete data files that a Web visitor can download and use independently. Files can be made availablein a database format such as dBASE®, in spreadsheet form such as Lotus© or Microsoft® Excel, or in plaintext (ASCII).
The great value of this approach is that it allows interested persons to conduct the full range of potentialanalyses of PRTR data. Other users can similarly obtain the data to verify or build on existing analyses.For most PRTRs, a whole year of data in a database format can be conveniently compressed into a self-extracting file for any Web visitor to download, extract, and analyse. Many persons with interests inspecific PRTR information—submissions by a local facility, trends for a particular chemical—may nothave extensive experience in handling and analysing databases of full sets of reported data, and theseusers benefit from the Web-based interfaces that give them access to selected data. More sophisticatedusers, however, will need complete data to conduct many more specialised types of analyses that PRTRdata support. The principal responsibility of the disseminator in this regard is to clearly describe thecontents of the data files—the field structure and contents and any limitations in the data themselves.
Environment Canada’s Web page makes these choices clear. In addition to the summary document,supplementary tables, and the interactive query mechanism in the NPRI Web site, users can download ayear’s data as a simple flat-file (which can be read by database or spreadsheet software) or as completerelational databases.
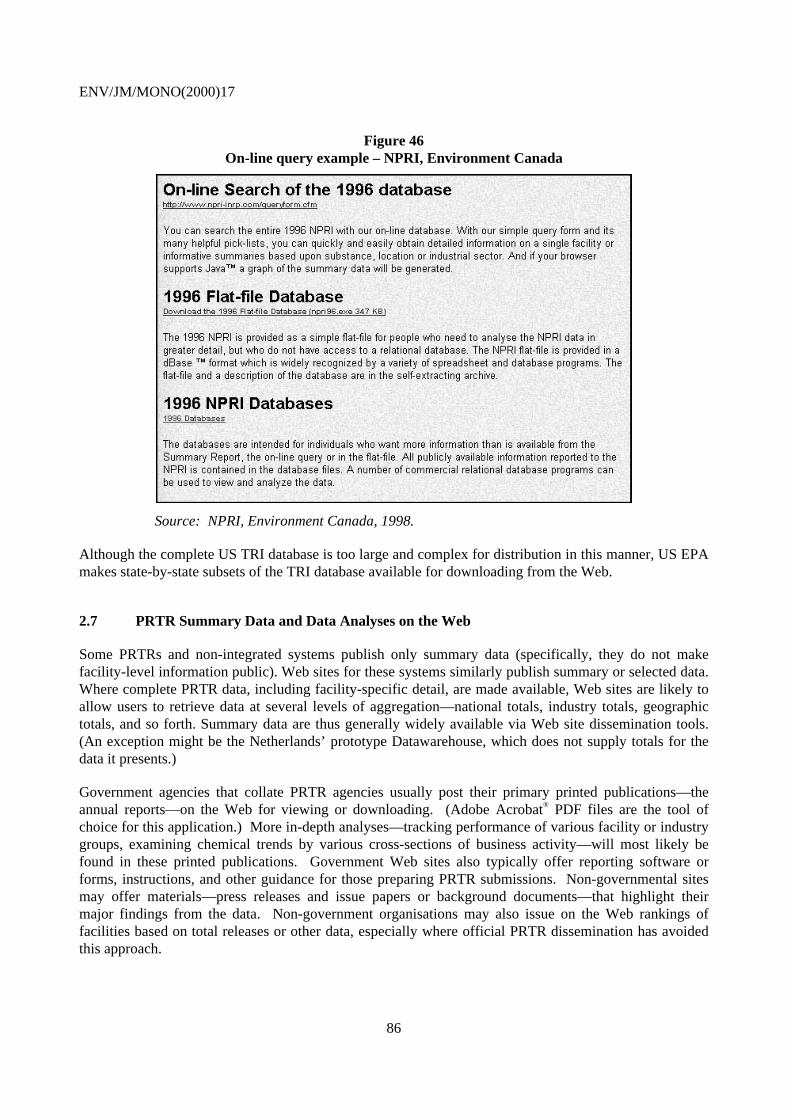
ENV/JM/MONO(2000)17
86
Figure 46On-line query example – NPRI, Environment Canada
Source: NPRI, Environment Canada, 1998.
Although the complete US TRI database is too large and complex for distribution in this manner, US EPAmakes state-by-state subsets of the TRI database available for downloading from the Web.
2.7 PRTR Summary Data and Data Analyses on the Web
Some PRTRs and non-integrated systems publish only summary data (specifically, they do not makefacility-level information public). Web sites for these systems similarly publish summary or selected data.Where complete PRTR data, including facility-specific detail, are made available, Web sites are likely toallow users to retrieve data at several levels of aggregation—national totals, industry totals, geographictotals, and so forth. Summary data are thus generally widely available via Web site dissemination tools.(An exception might be the Netherlands’ prototype Datawarehouse, which does not supply totals for thedata it presents.)
Government agencies that collate PRTR agencies usually post their primary printed publications—theannual reports—on the Web for viewing or downloading. (Adobe Acrobat® PDF files are the tool ofchoice for this application.) More in-depth analyses—tracking performance of various facility or industrygroups, examining chemical trends by various cross-sections of business activity—will most likely befound in these printed publications. Government Web sites also typically offer reporting software orforms, instructions, and other guidance for those preparing PRTR submissions. Non-governmental sitesmay offer materials—press releases and issue papers or background documents—that highlight theirmajor findings from the data. Non-government organisations may also issue on the Web rankings offacilities based on total releases or other data, especially where official PRTR dissemination has avoidedthis approach.

ENV/JM/MONO(2000)17
87
Generally, however, Web sites have not been used to offer additional analyses of PRTR data. That is, Websites most frequently offer data in visual display, and they may or may not offer data in forms that permitusers to conduct analyses. A few include pre-formulated questions that can serve as a vehicle fordelivering particular subsets of data with accompanying explanatory information. This feature could beexpanded to offer more sophisticated analyses to Web visitors. The Friends of the Earth site, FactoryWatch, in the UK takes this approach. The Environmental Defense Scorecard also offers clearlydistinguished summaries and analyses of the US TRI data.
Figure 47EDF Scorecard information page
Source: Environmental Defense, 1998.
Figure 48Query page example – Scorecard
Source: Environmental Defense, 1998.

ENV/JM/MONO(2000)17
88
Table 13Example of how data is summarised – Scorecard
Source: Environmental Defense, 1998.
Aside from reproducing published reports and press releases, however, many Web sites do not shareresults of further data analysis with their visitors. In particular, PRTR analyses tend to concentrate aroundthe periodic public release of the data. To enhance the utility of the data and to draw attention throughoutthe year to the value of PRTR data, governmental agencies could use their Web sites to publicise in-depthstudies conducted between reporting cycles.
Table 14Characteristics of Selected PRTR-Related Web Sites
Table 14
Note: As Web sites evolve,their features change andnew options are added.
Characteristics indicated herewere current in mid-1999.
1.C
anad
aN
PR
I
2.R
TK
NE
T
3.E
DF
Scor
ecar
d
4.E
nvir
ofac
ts
5.N
LD
ataw
areh
ouse
6.F
OE
Fac
tory
Wat
ch
7.U
KP
I
8.A
ustr
alia
NP
I
9.C
OR
INA
IR
Form of data
Complete data downloadable X 1 2
Complete data searchable X X X X X X
Selected but facility-specific data X X
Selected but no facility data X
Data for all years X X X X 3 4 X X
Pre-selected data(to answer specific questions)
X X
Summary data only
Opportunity for interaction 5

ENV/JM/MONO(2000)17
89
Table 14
Note: As Web sites evolve,their features change andnew options are added.
Characteristics indicated herewere current in mid-1999.
1.C
anad
aN
PR
I
2.R
TK
NE
T
3.E
DF
Scor
ecar
d
4.E
nvir
ofac
ts
5.N
LD
ataw
areh
ouse
6.F
OE
Fac
tory
Wat
ch
7.U
KP
I
8.A
ustr
alia
NP
I
9.C
OR
INA
IR
Searchable X X X X X X X X X
Mapping X X X X X X
e-Mail/off-line contactsfor sources of pollution
X X X X X X X
e-Mail/off-line contactsfor policymakers
X X X
e-Mail/off-line contactsfor sources of data
X X X X X X
Timing
Frequency(annual, biennial, less often)
A A A A A 4yrs
Timeliness (within 1 year of submission,more than 1 year)
>1 >16
>1 >16
>2 <1
Contextual Data
Geography 7 X
Ecology
Health effects, toxicity(Integrated, Links to other sites)
L I L L 8 L I
Demographics 9
Economic (Uses, Other) UO10
O11
U U
Other 12
Integration with other resource/pollution data(collected by other systems)
Non-point sources 13 X X
Permitted air emissions X X
Permitted water discharges X X
Hazardous waste transfers X14
X X14
On-site recycling (non-chemical)

ENV/JM/MONO(2000)17
90
Table 14
Note: As Web sites evolve,their features change andnew options are added.
Characteristics indicated herewere current in mid-1999.
1.C
anad
aN
PR
I
2.R
TK
NE
T
3.E
DF
Scor
ecar
d
4.E
nvir
ofac
ts
5.N
LD
ataw
areh
ouse
6.F
OE
Fac
tory
Wat
ch
7.U
KP
I
8.A
ustr
alia
NP
I
9.C
OR
INA
IR
Air, water, or soilquality data
Upstream (raw materialsextraction and processing)
Downstream (use, reuse,recycling of products, stock)
Water use
Energy use
Other 15 16 17 18
Publicity and marketing
Outreach programme X X
Press conferences, press releases X X X X X X
User group/ listserv X X
Advertising X X
Training and education in disseminationand presentation
Conferences X X
Hard copy guides 19 X
Web site links to resources X
Mapping tools(downloadable for local use)
Other 20
1 Available for sophisticated users via a “Batch Query Option”, but could be limited for large datafiles.
2 Not available for prototype, but will be available with first-year data.3 The Netherlands plans to release 1997 and possibly 1996 data by the end of 1999.4 1992-1996.5 Web visitors must register to obtain access to the prototype Web site.6 Simultaneous with U.S. EPA release of TRI data.7 Forthcoming.8 Individual chemicals linked to EDF Scorecard, where applicable.9 Forthcoming.

ENV/JM/MONO(2000)17
91
10 Industries that use the chemical; high-volume chemicals identified.11 Average income and location of major industries.12 Physical characteristics.13 In downloadable summary report.14 BRS, RCRIS, Superfund.15 Emergency notifications (ERNS), accidental releases (ARIP), chemical testing (TSCATS), civil
cases.16 Animal waste.17 Brownfields, drinking water.18 Bathing beaches water quality.19 Forthcoming.20 Newsletters.
2.8 Option: Other On-Line Access
User-friendly advances in Web data-retrieval techniques have tended to leave behind other forms of on-line access to databases. As noted, however, user-friendly Web sites are not necessarily a complete datadelivery tool. Thus, while developing and marketing its Web-based access to databases, RTK NET hasmaintained its electronic bulletin board service, which allows users to conduct searches and also todownload more extensive data files.
Although most Internet users interact with Web sites (HTML pages), File Transfer Protocol can be used toallow transfers of large files directly from Web hosting computers to the user’s computer. Little useseems to be made of this approach, which retains some of the “user-friendless” character of on-linecommunications before the advent of the Web.
2.9 Electronic Media: CD-ROM, Diskettes
Because CD-ROMs can carry such large amounts of data, they are useful for distributing larger databases.US TRI data for 1987-1996 are available on a single CD-ROM (1987-1997 data are forthcoming in thisformat).
Among other benefits, CD-ROMs can also offer the advantages of the Web without the Web. Databasessupplied on CD-ROM often resemble Web-based systems or in fact replicate them. The Netherlands’prototype PER Datawarehouse exemplifies this use—the same prototype is available on CD or on theWeb. Both distribution formats include the same supporting materials (reports and articles) as well.
More explicitly, many CDs rely on the data user’s World Wide Web browser, used off-line. Thus, theEuropean Environment Agency distributed CORINAIR’s Atmospheric Emission Inventory Guidebook asHTML files which the user views using either Netscape or Internet Explorer, the common Web browsers.A principal advantage for users of this mode is that they avoid the communications problems and delaysthat sometimes interfere with productive use of the Web. Similarly, the agency disseminating the datadoes not have to maintain the data in a Web site. Users without access to the Web can still make use of theCD so long as they have a Web browser installed.
ENV/JM/MONO(2000)17
92
2.10 Complementary Use of Dissemination Methods
To enhance use of both published reports and Web access (and other electronic media), establishedPRTRs generally included their published (printed) reports on the Web, usually as Acrobat® PDF filesavailable for downloading. In parallel to this, the published reports include information on obtainingelectronic access to the data.
One example of a more complementary use of print and electronic dissemination occurs with the US TRIdata at the state level. The annual report is issued in two volumes (publication of the 1996 data includedextensive analyses by industry sector and totalled three volumes). The main volume (Toxics ReleaseInventory: Public Data Release) consists of a national report, which includes summary data by state andterritory. Published simultaneously, the second volume (State Fact Sheets) supplies considerably moredetail with a two-page spread for each state and territory. At the same time, persons especially interestedin state-level information can visit the Web site and download complete TRI data for individual states andterritories by clicking on the appropriate state on a US map.
As an example, Environment Canada’s Executive Summary from its published annual report appears onthe Web in its entirety (http://www.ec.gc.ca/pdb/npri/1996/index.html, see Annex 3, Box 1). The rest ofthe printed report can be downloaded from the Web site, which also provides supplementary tables that donot appear in print.
Print and Web publication of PRTR data could offer more complementary features. The Commission forEnvironmental Co-operation, for example, plans to give Web users the opportunity to download tablesfrom the annual published report as spreadsheets for further analysis. This kind of complementarity couldbe further enhanced for the special analyses that appear in many PRTR publications if the relevant Website gave Web visitors access to the corresponding data aggregation—for example, data files for chemicalgroupings such as metals, carcinogens, or ozone-depleting chemicals.
Reproducing printed publications on microfiche for use in public libraries represents anothercomplementary technique for expanding public access to an existing presentation and dissemination tool.Microfiche offers substantial cost savings compared to printing and shipping larger quantities of printedpublications.

ENV/JM/MONO(2000)17
93
ANNEX 3
SELECTED NATIONAL PRTR REPORTS
3.1
The Tables of Contents found in Table 1 and 2 on the following pages illustrate the wide range of publiclyuseful analyses that are possible with PRTR data. They are taken from the national report on the first yearof US TRI data (the 1987 data report) and the North American Commission for Environmental Co-operation’s report PRTR data for 1996.
The third entry in this Annex, Box 1, presents an example of complementary distribution of a publishedreport. Environment Canada’s Executive Summary from its published annual report appears on the Webin its entirety (http://www.ec.gc.ca/pdb/npri/1996/index.html). The rest of the report is downloadablefrom the Web, and supplementary tables are available only on the Web.
Table 1Example of a summary report table of contents
(First National Summary Report on US TRI)
The Toxics Release Inventory: A National Perspective, US EPA, June 1989Table of Contents
The 1987 Toxics Release Inventory: A National SummaryTotal Releases and Transfers of TRI Chemicals ...............................................................................................1Geographical Distribution of TRI Releases and Transfers.................................................................................8Industrial Patterns of Releases and Transfers ..................................................................................................14Off-site Transfers: The Interstate Transport of TRI Wastes.............................................................................17Chemicals with the Largest Releases and Transfers ........................................................................................18Waste Treatment ..............................................................................................................................................20Waste Minimisation.........................................................................................................................................21Other Analyses.................................................................................................................................................22
Chapter 2. Introduction to the Toxics Release InventoryTRI Chemicals .................................................................................................................................................26TRI Releases and Transfers .............................................................................................................................27Facilities that Must Report to TRI ...................................................................................................................28Other Information in TRI.................................................................................................................................28TRI and Community Right-to-Know...............................................................................................................30Limits on Toxics Release Inventory Reporting................................................................................................30Failure to Comply with TRI Requirements......................................................................................................32TRI Data and Risk ...........................................................................................................................................32
ENV/JM/MONO(2000)17
94
Chapter 3. TRI FacilitiesIntroduction .....................................................................................................................................................35Geographical Distribution of TRI Facilities ....................................................................................................37Industrial Categories of Reporting Facilities ...................................................................................................42Other Facility Identification Information.........................................................................................................44TRI Chemicals: Facility Activities and Uses ...................................................................................................47
Chapter 4. TRI ChemicalsIntroduction .....................................................................................................................................................53The Number of TRI Chemical Forms and Total Releases and Transfers of TRI Chemicals............................53Chemical Categories ........................................................................................................................................59Reporting and Releases and Transfers by Chemical Class...............................................................................60Geographical Distribution of Chemical Class Releases and Transfers ............................................................70Industrial Distribution of Chemical Class Releases.........................................................................................73Maximum Amount of Chemicals Kept On-site................................................................................................80
Chapter 5. TRI Environmental Releases and Off-site TransfersIntroduction .....................................................................................................................................................83Where TRI Chemical Releases and Transfers Originated................................................................................85Environmental Distribution of Releases and Transfers....................................................................................93Industrial Releases and Off-site Transfers of TRI Chemicals ..........................................................................94Off-site Transfers ..........................................................................................................................................100Chemical Releases and Transfers...................................................................................................................103Facility Methods for Determining TRI Data..................................................................................................108
Chapter 6. Air EmissionsIntroduction ...................................................................................................................................................109Geographical Distribution of Air Emissions..................................................................................................110Industries Reporting TRI Air Emissions........................................................................................................114TRI Chemicals Emitted to Air .......................................................................................................................117Basis of Estimate for Air Emissions ..............................................................................................................126
Chapter 7. Discharges to WaterIntroduction ...................................................................................................................................................129DISCHARGES TO SURFACE WATER ......................................................................................................130Geographical Distribution of Discharges to Surface Water ...........................................................................131Industries Discharging TRI Chemicals to Surface Water ..............................................................................136Chemicals Discharged to Surface Water........................................................................................................139TRANSFERS TO PUBLIC SEWAGE SYSTEMS .......................................................................................150Geographical Distribution of Transfers to Public Sewage Systems...............................................................150Industries that Transferred TRI Chemicals to Public Sewage Systems..........................................................156Chemicals Transferred to Public Sewage Systems.........................................................................................159
Chapter 8. On-site Land Releases and Underground InjectionIntroduction ...................................................................................................................................................171ON-SITE RELEASES TO LAND .................................................................................................................173Geographical Distribution of Releases to Land .............................................................................................173Types of Land Releases .................................................................................................................................180Industries that Released TRI Chemicals to Land ...........................................................................................181TRI Chemicals Disposed of on Land.............................................................................................................187Basis of Estimate for Land Releases ..............................................................................................................196UNDERGROUND INJECTION ...................................................................................................................197Geographical Distribution of Underground Injection ....................................................................................197Industries that Disposed of TRI Chemicals by Underground Injection .........................................................203Chemicals Injected into Underground Wells .................................................................................................206
Chapter 9. Off-site Transfers of Chemical WastesIntroduction ...................................................................................................................................................215Geographical Distribution of Facilities that Transferred TRI Chemical Wastes............................................217Geographical Distribution of Facilities Receiving Off-site Transfers............................................................222

ENV/JM/MONO(2000)17
95
Types of Treatment or Disposal for Off-site Transfers ..................................................................................224Industries that Transferred TRI Chemical Wastes to Off-site Facilities.........................................................226Facilities and Companies that Transfer and Receive TRI Chemical Wastes..................................................229TRI Chemicals Transferred Off-site ..............................................................................................................231Basis of Estimate for Off-site Transfers.........................................................................................................239Issues in Interpreting Off-site Transfer Data..................................................................................................240
Chapter 10. Waste TreatmentIntroduction ...................................................................................................................................................243Geographical Distribution .............................................................................................................................244Industrial Patterns of Waste Treatment..........................................................................................................245Waste Treatment Methods .............................................................................................................................248Types of Wastestreams Treated .....................................................................................................................253Chemicals Subjected to Waste Treatment......................................................................................................254
Chapter 11. Waste MinimisationIntroduction ...................................................................................................................................................259Geographical Distribution .............................................................................................................................261Industries and Facilities that Practised Waste Minimisation .........................................................................263How and Why Facilities Attempted to Minimise their Wastes ......................................................................265Chemicals Targeted for Waste Minimisation.................................................................................................266Waste Minimisation Data on Volume Reductions.........................................................................................269
Chapter 12. Other Uses for the Toxics Release InventoryIntroduction ...................................................................................................................................................283Other National Analyses ................................................................................................................................283Chemical Analyses.........................................................................................................................................292Regional and State-Level Analyses ...............................................................................................................301Local and Facility-Level Analyses.................................................................................................................307Cross-Cutting Analyses: Combining TRI with Data from Other Sources......................................................317TRI in the Future: Comparative Data Analyses .............................................................................................317
AppendicesA. The Toxics Release Inventory Reporting Form for 1987B. The TRI List of Chemicals for 1987 ReportingC. Industries Covered by TRI Reporting RequirementsD. State TRI ContactsE. Getting Access to TRI Data on the National Library of Medicine’s Toxnet SystemF. Other EPA Publications on TRI

ENV/JM/MONO(2000)17
96
Table 2Example of the table of contents of the First U.S. TRI summary report:
The Toxics Release Inventory: A National Perspective, U.S. EPA, June 1989
The 1987 Toxics Release Inventory: A National SummaryTotal Releases and Transfers of TRI Chemicals ........................................................................................ 1Geographical Distribution of TRI Releases and Transfers .......................................................................... 8Industrial Patterns of Releases and Transfers............................................................................................ 14Off-site Transfers: The Interstate Transport of TRI Wastes ...................................................................... 17Chemicals with the Largest Releases and Transfers.................................................................................. 18Waste Treatment ....................................................................................................................................... 20Waste Minimisation .................................................................................................................................. 21Other Analyses.......................................................................................................................................... 22
Chapter 2. Introduction to the Toxics Release InventoryTRI Chemicals .......................................................................................................................................... 26TRI Releases and Transfers....................................................................................................................... 27Facilities that Must Report to TRI ............................................................................................................ 28Other Information in TRI.......................................................................................................................... 28TRI and Community Right-to-Know ........................................................................................................ 30Limits on Toxics Release Inventory Reporting......................................................................................... 30Failure to Comply with TRI Requirements ............................................................................................... 32TRI Data and Risk..................................................................................................................................... 32
Chapter 3. TRI FacilitiesIntroduction............................................................................................................................................... 35Geographical Distribution of TRI Facilities.............................................................................................. 37Industrial Categories of Reporting Facilities............................................................................................. 42Other Facility Identification Information .................................................................................................. 44TRI Chemicals: Facility Activities and Uses............................................................................................. 47
Chapter 4. TRI ChemicalsIntroduction............................................................................................................................................... 53The Number of TRI Chemical Forms and Total Releases and Transfers of TRI Chemicals ..................... 53Chemical Categories ................................................................................................................................. 59Reporting and Releases and Transfers by Chemical Class........................................................................ 60Geographical Distribution of Chemical Class Releases and Transfers...................................................... 70Industrial Distribution of Chemical Class Releases .................................................................................. 73Maximum Amount of Chemicals Kept On-site......................................................................................... 80
Chapter 5. TRI Environmental Releases and Off-site TransfersIntroduction............................................................................................................................................... 83Where TRI Chemical Releases and Transfers Originated ......................................................................... 85Environmental Distribution of Releases and Transfers ............................................................................. 93Industrial Releases and Off-site Transfers of TRI Chemicals ................................................................... 94Off-site Transfers ................................................................................................................................... 100Chemical Releases and Transfers............................................................................................................ 103Facility Methods for Determining TRI Data ........................................................................................... 108
Chapter 6. Air EmissionsIntroduction............................................................................................................................................. 109Geographical Distribution of Air Emissions ........................................................................................... 110Industries Reporting TRI Air Emissions ................................................................................................. 114TRI Chemicals Emitted to Air................................................................................................................. 117Basis of Estimate for Air Emissions........................................................................................................ 126
Chapter 7. Discharges to WaterIntroduction............................................................................................................................................. 129DISCHARGES TO SURFACE WATER................................................................................................ 130Geographical Distribution of Discharges to Surface Water .................................................................... 131Industries Discharging TRI Chemicals to Surface Water........................................................................ 136

ENV/JM/MONO(2000)17
97
Chemicals Discharged to Surface Water ................................................................................................. 139TRANSFERS TO PUBLIC SEWAGE SYSTEMS................................................................................. 150Geographical Distribution of Transfers to Public Sewage Systems ........................................................ 150Industries that Transferred TRI Chemicals to Public Sewage Systems................................................... 156Chemicals Transferred to Public Sewage Systems.................................................................................. 159
Chapter 8. On-site Land Releases and Underground InjectionIntroduction............................................................................................................................................. 171ON-SITE RELEASES TO LAND .......................................................................................................... 173Geographical Distribution of Releases to Land....................................................................................... 173Types of Land Releases........................................................................................................................... 180Industries that Released TRI Chemicals to Land .................................................................................... 181TRI Chemicals Disposed of on Land ...................................................................................................... 187Basis of Estimate for Land Releases ....................................................................................................... 196UNDERGROUND INJECTION............................................................................................................. 197Geographical Distribution of Underground Injection ............................................................................. 197Industries that Disposed of TRI Chemicals by Underground Injection................................................... 203Chemicals Injected into Underground Wells .......................................................................................... 206
Chapter 9. Off-site Transfers of Chemical WastesIntroduction............................................................................................................................................. 215Geographical Distribution of Facilities that Transferred TRI Chemical Wastes ..................................... 217Geographical Distribution of Facilities Receiving Off-site Transfers ..................................................... 222Types of Treatment or Disposal for Off-site Transfers............................................................................ 224Industries that Transferred TRI Chemical Wastes to Off-site Facilities.................................................. 226Facilities and Companies that Transfer and Receive TRI Chemical Wastes ........................................... 229TRI Chemicals Transferred Off-site ....................................................................................................... 231Basis of Estimate for Off-site Transfers .................................................................................................. 239Issues in Interpreting Off-site Transfer Data ........................................................................................... 240
Chapter 10. Waste TreatmentIntroduction............................................................................................................................................. 243Geographical Distribution....................................................................................................................... 244Industrial Patterns of Waste Treatment ................................................................................................... 245Waste Treatment Methods ...................................................................................................................... 248Types of Wastestreams Treated............................................................................................................... 253Chemicals Subjected to Waste Treatment ............................................................................................... 254
Chapter 11. Waste MinimisationIntroduction............................................................................................................................................. 259Geographical Distribution....................................................................................................................... 261Industries and Facilities that Practised Waste Minimisation................................................................... 263How and Why Facilities Attempted to Minimise their Wastes ............................................................... 265Chemicals Targeted for Waste Minimisation .......................................................................................... 266Waste Minimisation Data on Volume Reductions .................................................................................. 269
Chapter 12. Other Uses for the Toxics Release InventoryIntroduction ................................................................................................................................................................ 283Other National Analyses ............................................................................................................................................. 283Chemical Analyses ..................................................................................................................................................... 292Regional and State-Level Analyses............................................................................................................................. 301Local and Facility-Level Analyses .............................................................................................................................. 307Cross-Cutting Analyses: Combining TRI with Data from Other Sources................................................................... 317TRI in the Future: Comparative Data Analyses .......................................................................................................... 317
AppendicesA. The Toxics Release Inventory Reporting Form for 1987B. The TRI List of Chemicals for 1987 ReportingC. Industries Covered by TRI Reporting RequirementsD. State TRI ContactsE. Getting Access to TRI Data on the National Library of Medicine’s Toxnet SystemF. Other EPA Publications on TRI

ENV/JM/MONO(2000)17
98
Table 3Selected Contents of Taking Stock: North American Pollutant Releases and Transfers, 1995
Commission for Environmental Co-operation, 1998
Preface v
List of Acronyms vii
List of Definitions ix
CHAPTER 1 Introduction 2
2 Overview of Existing Programs in North America 6
3 Pollutant Releases and Transfers in North America 21
4 1995 Canada and US Data Compared (Based on MatchedChemical/;Industry Data Set)
55
5 1994 and 1995 Canada and US Data Compared (Based on MatchedChemical/;Industry Data Set)
99
6 Special Analyses 148
7 Border and Transborder Analyses 160
8 The Pulp and Paper Industry in Canada and the United States 180
APPENDIX A A Comparison of Chemicals Listed under 1995 TRI, NPRI andRETC
197
B TRI Form R 215
C NPRI Reporting Form 221
D Certificate for the Operation of Industrial Facilities under FederalJurisdiction (Cédula de Operación Anual)
235
Chapter 3 Pollutant Releases and Transfers in North America
3.1 Introduction 23
3.2 North American Releases and Transfers: The Data 24
Table 3-1 North American Releases and Transfers, NPRI and TRI (MatchedData, 1995)
Table 3-2 North American Releases and Transfers, NPRI and TRI (All Data,1995)
Table 3-3 North American Releases and Transfers, NPRI and TRI (MatchedData, 1994-1995)
Table 3-4 Update of North American Total Release and Transfer Data NPRI andTRI (All Data, 1994)
[All other figures and tables in Chapter 3, listed below, based on Matched Data, 1995]
3.3 North American Releases and Transfers 28
Figure 3-1 North American Releases and Transfers (Matched Data,1995)

ENV/JM/MONO(2000)17
99
Selected Contents of Taking Stock: 1995 (cont.)(Remainder of Chapter 3 based on Matched Data 1995)
3.4 Geography of North American Releases and Transfers .................................... 30
Table 3-5 North American Releases by State and Province
Table 3-6 North American Releases and Transfers by State and Province
Map 3-1 Largest Sources of North American Releases and Transfers:States and Provinces
Map 3-2 Largest Sources of North American Releases and Transfers:Facilities
Table 3-7 The 50 North American Facilities with Largest Total Releases
Figure 3-2 North American Releases, Top 50 Facilities and All Other Facilities
Table 3-8 The 50 North American Facilities with Largest Total Releases andTransfers
Figure 3-3 North American Releases and Transfers, Top 50 Facilities andAll Other Facilities
3.5 Principal Chemicals Reported ............................................................................. 38
Figure 3-4 North American Top Five Chemicals for Total Releases and Transfers
Table 3-9 The 25 Chemicals with the Largest Total Releases and Transfers in NorthAmerica
Table 3-10 The 25 Chemicals with the Largest total Releases in North America
Table 3-11 The 25 Chemicals with the Largest Transfers in North America
Table 3-12 North American Releases and Transfers of Known or SuspectedCarcinogens
Table 3-13 Top 50 North American Facilities with Total Releases of Known orSuspected Carcinogens
Table 3-14 Top 50 North American Facilities with Total Releases and Transfers ofKnown or Suspected Carcinogens
3.6 Reporting Industries ............................................................................................. 43
Table 3-15 Total Releases and Transfers in North America by Industry
Table 3-16 Releases in North America by Industry
Table 3-17 Transfers in North America by Industry
Figure 3-5 North American Top Three Industries for Total Releases and Transfers
3.7 Projections for Future Releases and Transfers .................................................. 43
Table 3-18 North American Projections of Total Releases and Transfers, NPRI andTRI, 1995-1997
Figure 3-6 Industries Projecting Large Reductions in Total Releases and Transfers,1995-1997
Table 3-19 North American Projections of Total Releases and Transfers, NPRI andTRI by Industry, 1995-1997

ENV/JM/MONO(2000)17
100
Box 1Excerpts from the NPRI, Canada, Summary Report
1996 NPRI Summary Report: Executive Summary
The 1996 Summary Report is the fourth annual report published under the National Pollutant Release Inventory(NPRI) program. The report provides information on 176 listed substances, specifically on their on-site releases toair, water, land and underground injection; off-site transfers in waste; and off-site transfers for recovery, re-useand recycling (3Rs), and energy recovery.
The NPRI is the only legislated, nation-wide, publicly accessible inventory of its type in Canada. One of thefundamental aspects of the NPRI is to provide Canadians with access to pollutant release information for facilitieslocated in their communities. In addition, the NPRI continues to support a number of environmental initiatives byproviding information that assists governments and others to identify priorities for action, encourages industry totake voluntary measures to reduce releases, allows tracking of progress in reducing releases, and supports anumber of regulatory initiatives across Canada.
The 1996 Summary Report includes data from the National Pollutant Release Inventory for the calendar years1995 and 1996 as it appeared in the NPRI database on January 10, 1998. Non-confidential NPRI information anddata are also accessible on the Internet at the Environment Canada National NPRI website athttp://www.ec.gc.ca/pdb/npri/. Readers should note that the NPRI data on the Internet site are updated regularly asa result of new or revised reports submitted by facilities. As a result of revisions submitted after January 10, thequantities identified in this report may at times differ from those listed on the national database.
The report highlights 1996 release and transfer information, and this year, for the first time, includes a section onnational, provincial and territorial analysis for NPRI-listed CEPA-toxic and carcinogenic pollutants listed on theinventory from 1995 to 1996.
Environment Canada and the NPRI program encourage industrial associations, community groups, and the publicto participate actively in all aspects of the NPRI program.
Highlights of the 1996 NPRI Summary Report
• A total of 1,818 Canadian facilities filed reports with the NPRI in 1996. The number of reporting facilitiesincreased by 39 (+2.2%) over 1995.
• There were 6,635 pollutant reports filed in 1996 (one report is filed for each substance released ortransferred); 271 (+4.3%) more reports than in 1995.
• In 1996, facilities across Canada reported:– on-site releases totalling 142,613 tonnes; a decrease of 25,001 tonnes or -14.9% compared with
1995.– off-site transfers in waste totalling 64,626 tonnes; an increase of 12,500 tonnes or +24.0%.
• on-site releases of NPRI-listed CEPA-toxic and carcinogenic pollutants totalling 13,252 tonnes; a decreaseof 865 tonnes or -6.1%.
• off-site transfers of NPRI-listed CEPA-toxic and carcinogenic pollutants in waste totalling 9,427 tonnes; adecrease of 621 tonnes or -6.2% since 1995.
• 97,884 tonnes as off-site transfers for 3Rs and 4,262 tonnes as off-site transfers for energy recovery.
• In 1996, the following five industrial sectors, based on two-digit Canadian Standard Industrial Classification(SIC) codes, reported the largest on-site releases of NPRI-listed pollutants:
1. Chemical and Chemical Products Industries: 41,965 tonnes
2. Primary Metal Industries: 20,372 tonnes
3. Paper and Allied Products Industries: 20,251 tonnes
4. Refined Petroleum and Coal Products Industries: 10,496 tonnes
5. Crude Petroleum and Natural Gas Industries: 8,019 tonnes

ENV/JM/MONO(2000)17
101
Furthermore, the following two industrial sectors reported the largest decrease in on-site releases of NPRI-listedpollutants from 1995 to 1996:
• The Mining Industries Sector showed the largest decrease in on-site releases between 1995 and 1996. In1995, this industrial sector reported total on-site releases of 20,400 tonnes, compared to 6,540 tonnes in 1996(a decrease of 13,860 tonnes or -67.9%). The primary factor for this decrease was the 1995 closure of theBHP Minerals Canada Ltd. - Island Copper Mine (NPRI #1127), in Port Hardy, BC. This facilityreported 12,000 tonnes of copper (and its compounds) released to surface water in 1995.
• The Paper and Allied Products Industries Sector showed the second largest decrease in on-site releasesin Canada from 1995 to 1996. This decrease of 9,649 tonnes (-32.3%) was primarily due to the effluenttreatment requirements of the federal pulp and paper regulations.
• In 1996, the following five industrial sectors, based on two-digit Canadian SIC codes, reported the largest on-site releases of NPRI-listed CEPA-toxic and carcinogenic pollutants:
1. Primary Metal Industries: 3,436 tonnes
2. Mining Industries: 3,272 tonnes
3. Plastic Products Industries: 1,482 tonnes
4. Chemical and Chemical Products Industries: 1,369 tonnes
5. Wood Industries: 853 tonnes
• In 1996, the following five industrial sectors, based on two-digit Canadian SIC codes, reported the largestoff-site transfers of NPRI-listed pollutants in waste:
1. Primary Metal Industries: 22,504 tonnes
2. Chemical and Chemical Products Industries: 20,813 tonnes
3. Fabricated Metal Products Industries (Except Machinery and Transportation EquipmentIndustries): 3,260 tonnes
4. Transportation Equipment Industries: 2,604 tonnes
5. Non-metallic Mineral Industries: 2,412 tonnes
• In 1996, the following five industrial sectors, based on two-digit Canadian SIC codes, reported the largestoff-site transfers of NPRI-listed CEPA-toxic and carcinogenic pollutants in waste:
1. Primary Metal Industries: 3,627 tonnes
2. Non-metallic Mineral Products Industries: 2,328 tonnes
3. Chemical and Chemical Products Industries: 1,069 tonnes
4. Fabricated Metal Products Industries (Except Machinery and Transportation Equipment): 451tonnes
5. Transportation Equipment Industries: 319 tonnes
The report contains two main appendices:
Appendix 1 ranks facilities based on the largest total on-site releases per pollutant and lists releases byenvironmental medium.
Appendix 2 compares facilities that reported NPRI-listed CEPA-toxic or carcinogenic pollutant releases byprovince and territory in 1996. Both on-site releases and off-site transfers in waste were provided for everyfacility. This analysis compares facilities in a given industrial sector and their management of CEPA-toxic andcarcinogenic NPRI pollutants during 1995 and 1996.
The NPRI program continues to evolve in response to the needs and concerns of both governments and the publicin Canada. Environment Canada has engaged stakeholders on proposed changes to the program since 1997 andconsultations are still under way. As one of its highest priorities, Environment Canada is undertaking a review ofthe NPRI list of substances and the list of facilities currently exempt from reporting to the NPRI
ENV/JM/MONO(2000)17
102
ANNEX 4
STATE-LEVEL PRTR DATA
US Toxics Release Inventory annual publications include a volume of State Fact Sheets that cover all USstates and territories. These are laid out on two-page spreads to facilitate photocopying of just the state(s)of particular interest to a user. (The following example is from 1996 Toxics Release Inventory: PublicData Release — 10 Years of Right-to-Know. State Fact Sheets.) It provides an example of how state dataare presented in the US.

ENV/JM/MONO(2000)17
For More Information . . State Contact: EPA Regional Contact: To obtain TRI data use assistanceJohn David Burns Ezequiel Velez call TRI User Support Service (TRI-US):(601) 960-9000 (404) 562-9191Fax (601) 103352-8314 Fax (404) 562-9163(202) 260-1531 Fax (202) 401-2347
103
1996 TOXICS RELEASE INVENTORY
State/TRI Data
Population 2,710,750
Total Facilities 322
Total Forms 1,047
Form As 128
National Rank for
On- and Off-site Releases 17
On-site Releases 16
Transfers into State
National Rank 38
Pounds 3,292,752
Transfers out of State
National Rank 25
Pounds 22,871,434
MISSISSIPPIReported Releases and Waste Management Activities
(pounds)
On- and Off-site Releases 54,846,362Air Emissions 52,820,669Surface Water Discharges 7,566,642Underground Injection
Class I Wells 83,315Class II-V Wells 0
Releases to landRCRA Subtitle C Landfills 1,924Other On-site Land Releases 5,665,772
Transfers Off-site to Disposal 2,025,693
On-site Waste Management 338,644,569Recycling 215,890,406Energy Recovery 28,567,578Treatment 104,186,585
Off-site Transfers for Further Waste Management 27,012,462Recycling 21,598,058Energy Recovery 2,654,505Treatment 2,122,333Publicly Owned Treatment Works (POTWs) 628,934Other Off-site Transfers 8,632

ENV/JM/MONO(2000)17
104
1996 TOXICS RELEASE INVENTORY MISSISSIPPITop Ten Chemicals for On- and Off-site Releases
UndergroundInjection On-site Releases to Land Total
CASNumber Chemical
AirEmissions
SurfaceWater
DischargesClass IWells
Class II-VWells
RCRASubtitle CLandfills
OtherOn-site Land
Releases
TotalOn-site
Releases
TransfersOff-site to
Disposal
On-andOff-site
ReleasesPounds Pounds Pounds Pounds Pounds Pounds Pounds Pounds Pounds
67-56-1 Methanol 8,773,102 142,890 61,845 0 0 5,400 8,983,237 31,000 9,014,237— Nitrate compounds 0 6,948,605 0 0 0 5 6,948,610 0 6,948,610— Manganese compounds 9,393 24,044 0 0 0 5,105,200 5,138,637 34,172 5,172,809
108-88-3 Toluene 4,624,141 8,487 7,998 0 212 19 4,640,857 251 4,641,10878-93-3 Methyl ethyl ketone 4,462,837 1,104 4,615 0 0 10 4,468,566 2,200 4,470,76675-09-2 Dichloromethane 4,103,921 0 0 0 0 0 4,103,921 0 4,103,921
7664-41-7 Ammonia 2,892,734 276,788 0 0 0 126,035 3,295,547 10,680 3,306,2271330-20-7 Xylene (mixed isomers) 2,193,660 72 0 0 0 0 2,193,732 820 2,194,552110-54-3 n-Hexane 2,081,427 42,022 0 0 0 2 2,123,451 1,150 2,124,601
7647-01-0 Hydrochloric acid 1,507,038 0 0 0 0 0 1,507,038 0 1,507,038
Top Ten Facilities for On- and Off-site ReleasesUnderground
Injection On-site Releases to Land Total
Facility / City, CountyAir
Emissions
SurfaceWater
DischargesClass IWells
Class II-VWells
RCRASubtitle CLandfills
OtherOn-site Land
Releases
TotalOn-site
Releases
TransfersOff-site to
Disposal
On-andOff-site
ReleasesPounds Pounds Pounds Pounds Pounds Pounds Pounds Pounds Pounds
Vicksburg Chemical Co., Vicksburg, Warren 93,282 6,046,178 0 0 0 0 6,139,460 0 6,139,460Kerr-McGee Chemical Corp., Hamilton, Monroe 203,003 28,520 0 0 0 5,245,400 5,476,923 0 5,476,923Gencorp, Columbus, Lowndes 3,930,015 5 0 0 0 0 3,930,020 51,450 3,981,470Chevron Products Co., Pascagoula, Jackson 3,529,786 249,634 0 0 0 1,771 3,781,191 2,647 3,783,838Georgia-Pacific Corp., Monticello, Lawrence 2,986,090 110,666 0 0 0 96,139 3,192,895 0 3,192,895International paper, Natchez, Adams 2,055,664 57,101 0 0 0 5,475 2,118,240 0 2,118,240Du Pont, Pass Christian, Harrison 2,000,360 0 0 0 0 4 2,000,364 0 2,000,364Carpenter Co., Verona, Lee 1,520,124 0 0 0 0 0 1,520,124 0 1,520,124International Paper, Redwood, Warren 1,511,685 7,110 0 0 0 0 1,518,795 0 1,518,795World Color, Corinth, Alcorn 1,384,320 0 0 0 0 0 1,384,320 0 1,384,320

ENV/JM/MONO(2000)17
105
ANNEX 5
A BRIEF PUBLICITY TOOL
Print resources to promote PRTR data access, such as the two-page draft brochure in this Annex, can besimple, short, and effective. Such a tool could be used to promote other means of access, as well, such asthe availability of PRTR data on computer diskettes. This Annex also contains examples of a Fact Sheetdistributed by Environment Canada.

ENV/JM/MONO(2000)17
106
How to Get U.S. Environmental Toxics Data from theWorld Wide Web15
This booklet is designed for those who want informationabout toxic substances in the U.S. environment, and who mayhave some familiarity with the basic terms used, but whoaren’t sure where to start. It’s more like a guide to part of alibrary than anything else. It focuses on ways of getting freeinformation through the World Wide Web, so you’ll need aWeb connection for it to be of much use. If you want verydetailed information about a particular issue or facility, usingthe Freedom of Information Act (FOIA) at the Federal levelor with your state environmental agency can produce muchmore information. But that is better done if you’ve alreadylooked through the Web and haven’t found the informationyou need.
Keep in mind that the first thing you should know whenlooking for information is which question you’re trying toanswer. A broad investigation of a particular area, chemical,or company can turn up additional information for as long asyou care to look for it, making this research an essentiallyopen-ended process. You can find things you wouldn’t havethought of beforehand, but it requires a large timecommitment. If you don’t have a lot of time, you’re better offdeciding on a focussed question before you start. Examplesmight be: what chemicals does this facility release, and whatare their well-known health effects? How smoggy is the air inmy county? Who has permits to release chromium into thewater nation-wide? Being clear about what you need at thebeginning can save you a lot of time later.
Almost all of the data that’s easily available can be foundthrough eight major sources (four, if you consider everythingon the U.S. EPA Web site to be one source). The exact URLsfor these sources are listed in a table at the end of thisbooklet; the rest of the booklet refers only to the names of thesources. Having the URLs in one place will allow you toupdate the booklet easily if the URLs change. The Webchanges quickly, so if you are reading this booklet more thana year after its publication date, much of the information
15. Draft Data Access flyer, by Rich Puchalsky,Grassroots Connections, project for U.S. PIRG
about the data provided by different sources may havechanged as well. You should know that different sources ofdata on the Web will often use the same databases of EPAinformation. This booklet will refer to the commonly usednames of databases, so that you’ll know whether twodifferent sources are really presenting the same data or not.
The rest of the booklet is divided into major areas of inquiry.Once you’ve decided what you’re looking for, find the areaof inquiry that seems closest and try the sources listed there.Good luck!
Accidents
Accidents involving toxic chemicals can occur at fixed sitesor during transport by road, rail, or sea. EPA’s majordatabase for tracking these accidents is a database calledERNS, which holds records of phone calls to a nation-wideresponse centre. ERNS can be downloaded as a full datasetfrom the EPA Web site, but to search it the best source iscurrently RTK NET. Be sure to look for the accidentdescriptions.
Air quality (smog)
This information, which is mostly from EPA’s AQS/AIRSdatabase, is best found through EPA’s AIRSData site. EPA’sCEIS also has simple air quality profiles for each county inthe U.S. If you want to analyse data yourself, the EPA Website provides a downloadable program called “AIRSExecutive.”
Compliance and enforcement
Sometimes you want to find out if a particular entity has beencomplying with environmental laws. Compliance with airpollution, water pollution, and hazardous waste laws istracked in the three main permit databases (see Permitsbelow), with some additional information available aboutSuperfund sites and drinking water sources (seeContaminated Sites and Water quality). In addition, there isa database called DOCKET that tracks enforcement actionsby EPA. It is available through RTK NET.
Contaminated sites (including “Superfund”)
Some sites have been contaminated by past releases of toxicsto the land, and remain dangerous (usually as threats togroundwater, or to people in nearby buildings). “Superfund”sites are major sites that are known to the government. BasicSuperfund information is held in a database called CERCLIS,though there are many other related factsheets and smallerdatabases. The best source for this is EPA’s Envirofacts. Themost common other hazard of this type is old undergroundstorage tanks. There is generally no national database of thesetanks; the only way to find them is to FOIA for information atthe state level or to pay a company to do a real estate searcharound a particular point.
Factories
Factories make pollution in addition to products. Majorcategories of information about factories are Toxic Releases,Hazardous Waste, and Permits (see sections below). If youare interested specifically in factories in the petroleumrefining, iron and steel production, primary non-ferrousmetals, pulp manufacturing, or automobile assemblyindustries, then you may be best off with EPA’s SFIP.

ENV/JM/MONO(2000)17
107
Geographic areas (states, counties, and Zip codes)
Sometimes you want a summary of the status of a geographicarea or a list of sites within it. Quick summaries can be foundthrough EPA’s CEIS. The EDF Scorecard has a good rankingsystem that ranks facilities by health hazards within an area,and a comparative risk feature that will sometimes haveexpert opinion on the worst risks in an area. EPA’s Surf YourWatershed is very good for an overall look at water issueswithin an area; EPA’s AIRSdata site is best for air quality.Both EPA’s Envirofacts and RTK NET will provide detaileddata about facilities within areas.
Health and regulatory information (on chemicals)
Often you will want to know what health effects a chemicalcan cause, which chemicals can produce a certain healtheffect, or which chemicals are regulated under a particularlaw. The EDF Scorecard is the best site for that type ofinformation, and it will provide links to other sites.
Hazardous waste (generation, shipment, treatment anddisposal)
EPA’s data on quantities and types of hazardous waste -- itsgeneration, and its destinations, such as incinerators andlandfills -- is mainly in the BRS database, available throughRTK NET and EPA’s Envirofacts. The TRI database also hasinformation on generation of waste and transfers of wastefrom factories. The best source for this is RTK NET, since itlets you search for the destinations as well as the sources ofthe waste.
Mapping
EPA’s Envirofacts has extensive real-time mappingcapabilities. The EDF Scorecard also has real-time maps thathave less information but are easier to use. EPA’s Surf YourWatershed provides watershed maps,
and most of the other sites have some kind of static mapsavailable. If you want to produce detailed maps on your owncomputer, you can download the free EPA Landviewprogram from RTK NET.
Permits (for air releases, water releases, or hazardouswaste)
Most pollution in the U.S. is permitted by law. Generally,each facility must have a one or more permits (to release tothe air, to the water, or to handle hazardous waste).Information about these permits, and compliance with them,is kept in the AFS/AIRS, PCS, and RCRIS databases (for air,water, and hazwaste respectively). The best source for airpermit data is EPA’s AIRSData site. For water permits, thebest source is EPA’s Envirofacts. Both Envirofacts and RTKNET are good sources for hazwaste permit information fromRCRIS.
Pesticides
EPA has many fragmented pesticide databases available fordownload through the EPA Web page. The most usefulsearchable site is EWG’s Foodnews site, which will showwhich pesticides are in which foods.
Toxic releases (to air, water, and land)
The TRI database is the best and mostly widely used sourcefor this information. It provides estimates of actual releaseamounts, rather than permit levels. For complete TRI data,the best source is RTK NET. If you want TRI data linkedwith other EPA data, the best source is EPA’s Envirofacts.For TRI data linked with information on health effects ofchemicals, the best source is the EDF Scorecard.
Water quality (drinking water and surface water)
Data on sources of drinking waters is kept in EPA’s SDWISdatabase, available through EPA’s Envirofacts and EWG’s“Where You Live.” Data on quality of surface water (rivers,lakes, etc.) is best accessed through EPA’s Surf YourWatershed site.
SourcesEDF Scorecard http://www.scorecard.org/Has subset of latest toxic release information, with veryextensive health effect and regulatory info.EPA’s AIRSData http://www.epa.gov/airsweb/Run by EPA’s air pollution office; has info on general airquality and air pollution from individual sites.EPA’s CEIS http://www.epa.gov/ceis/Environmental statistics; look under “EnvironmentalProfiler” for county data summaries.EPA’s Database pagehttp://www.epa.gov/epahome/Data.htmlSource for a large number of downloadable data files.EPA’s Envirofacts http://www.epa.gov/enviro/Info from seven major EPA databases, with very goodlinkage between databases.EPA’s SFIP http://es.epa.gov/oeca/sfi/access.htmConjoined pollution, compliance, and production data forfacilities in 5 major industries.EPA’s Surf Your Watershed http://www.epa.gov/surf/Has wide variety of water quality and ecological informationon surface waters.EWG http://www.ewg.org/Has “Where You Live” source for environmental and otherdata; “Foodnews” for pesticides in foods.RTK NET http://www.rtk.net/Has detailed information from EPA toxic release and manyother databases.

ENV/JM/MONO(2000)17
108
Figure 1
Example of a Fact Sheet
Source: Environment Canada, 1998

ENV/JM/MONO(2000)17
109
Figure 2
Example of a Fact Sheet
Source: Environment Canada, 1998

ENV/JM/MONO(2000)17
110
ANNEX 6
WEB SITES IDENTIFIED IN THIS REPORT
Australia
• National Pollutant Inventory (NPI): http://www.environment.gov.au/epg/npi/
• http://www.environment.gov.au/epg/npi/database/index.html?Ok=OK
• http://www.environment.gov.au/cgi-bin/epg/npi/database/npi3/npiquery.pl
Canada
• National Pollutant Release Inventory (NPRI):
• http://www.npri-inrp.com/queryform.cfm
• http://www.ec.gc.ca/pdb/npri/
• 1996 Executive Summary: http://www.ec.gc.ca/pdb/npri/1996/index.html
• Citizens’ Environmental Alliance of Southwestern Ontario, Toxic Tracker Report:http://www.mnsi.net/~cea/news/npri1996.html
Corporate Environmental Reporting
• Canadian Chemical Producers Association's "Reducing Emissions Report" 1998 EmissionsInventory and Five-Year Projections: http://www.ccpa.ca/english/sitemap/index.html
• Coalition for Environmentally Responsible Economies (CERES): http://www.ceres.org/
• Global Reporting Initiative (also by CERES): http://www.globalreporting.org/
• ICI (Imperial Chemical Industries): http://www.ici.com/iciportal/ (Safety, Health andEnvironment section)
• International Corporate Environmental Reporting Site: http://www.enviroreporting.com/
• International Institute for Sustainable Development: http://iisd.ca/business/corpreport.htm,http://iisd.ca/measure/default.htm
• Rockwool (Green Account): http://www.rockwool.com/environment/default.htm.
• Solvay: http://www.solvay.com/sowe/sowe/envir.htm
• Semiconductor Industry Association: http://www.semichips.org/
ENV/JM/MONO(2000)17
111
• SustainAbility: http://www.sustainability.co.uk/
Denmark
• Green Accounts (Evaluation): http://www.mst.dk/activi/11000000.htm(see also: Corporations—Rockwool and useful information on Danish Green Accounts in theCzech Right-to-Know Web site)
European Community
• CORINAIR: http://www.aeat.co.uk/netcen/corinair/94/
• European Environment Agency: http://www.eea.eu.int/
Geneva, Switzerland
• l’Etat de Genève (République et canton de Genève), Environnement, énergie et territoire:http://www.geneve.ch/environnement/welcome.html
Government and Environmental Non-Governmental Organisations:
• CIELAP: "A Citizen's Guide to the National Pollutant Release Inventory":http://www.cielap.org/infocent/index.html
Great Lakes (Canada and United States):
• Great Lakes Commission’s Regional Air Pollutant Inventory Development System (RAPIDS):• http://www.glc.org/air/air3.html
http://www.glc.org/air/final1993/1993.html
Indonesia
• PROPER (in World Bank’s Web site): http://www.worldbank.org/nipr/comrole.htm
The Netherlands
• Pollutant Emissions Register Datawarehouse: http://erc.geodan.nl/
Trade Associations
• American Petroleum Institute: http://www.api.org/step/piep.htm.
• Semiconductor Industry Association: http://www.semichips.org/index2.htm
• American Forest and Paper Association: http://www.afandpa.org/
United Kingdom (England and Wales)
• Environment Agency, Pollutant Inventory:http://www.environment-agency.gov.uk/your_env/;http://www.environment-agency.gov.uk/aboutus/how_to_get_info/public_registers.htm;http://146.101.4.38/wiyby/html/introduction.htm.
• Friends of the Earth UK, Factory Watch:http://www.foe.co.uk/campaigns/industry_and_pollution/factorywatch/
ENV/JM/MONO(2000)17
112
United States
• U.S. Environmental Protection Agency, Envirofacts, Toxics Release Inventory (TRI):http://www.epa.gov/enviro/index_java.html
• Environmental Defense Fund’s Scorecard: http://www.scorecard.org/
• RTK NET: http://www.rtk.net/
• Louisiana: http://www.deq.state.la.us/
• New Jersey Release and Pollution Prevention Report data (supplied by the Hampshire ResearchInstitute): http://www.hampshire.org/njdeq/home.htm
• Silicon Valley Toxics Coalition (mapped by Clary-Meuser and Associates):http://www.mapcruzin.com/svtc_ecomaps/http://www.mapcruzin.com/projects/proj_ei.htmRight-to-know resources: http://www.mapcruzin.com/globalchem.htmEnvironmental risk map network: http://www.mapcruzin.com/global_toxmaps.htmEnvironmental justice resources: http://www.mapcruzin.com/environmental_justice.htmCommunity-based research: http://www.mapcruzin.com/part_research.htmData sources: http://www.mapcruzin.com/data.htmOther WebMap Projects: http://www.mapcruzin.com/other_projects.htmGIS data and map layers: http://www.mapcruzin.com/download_mapcruz.htmPersonal GIS: http://www.mapcruzin.com/free_gis.htm
World Bank
• New Ideas in Pollution Regulation: http://www.worldbank.org/nipr/
• Tom Tietenberg and David Wheeler, “Empowering the Community: Information Strategies forPollution Control”, presented at Frontiers of Environmental Economics Conference, AirlieHouse, Virginia, USA, 23-25 October 1998,http://www.worldbank.org/nipr/work_paper/ecoenv/index.htm.
• (see also Indonesia)
Mapping Tool (downloadable)
• MapCruzin: http://www.mapcruzin.com/
Other Reports
• Nancy Olewiler and Kelli Dawson, “Analysis of NPRI Data on Toxic Emissions by Industry”,prepared for the Technical Committee on Business Taxation, Department of Finance, WorkingPaper 97-16, March 1998: http://www.fin.gc.ca/taxstudy/WP97-16e.html
• Cornell University, “Pollution drops when workers get involved, Cornell study finds”, CornellUniversity Science News Release, announcing study by Cornell’s Work and EnvironmentInitiative and the Center for Advanced Human Resource Studies, May 1995:http://www.news.cornell.edu/science/May95/st.emissions.html

ENV/JM/MONO(2000)17
113
Other Useful Websites
• http://www.enfo.ie/
• Korean Ministry of Environment:http://www.me.go.kr; http://www.me.go.kr/english/eindex.html