Embed Size (px)
Citation preview
PRELIMINARY REPORT ON FISCAL DESIGNS FOR THE DEVELOPMENT OF ALASKA NATURAL GAS
BY
DAVID WOOD NOVEMBER 2008
For
State of Alaska Legislative Budget & Audit Committee
David Wood & Associates www.dwasolutions.com
Section 4.6
Alaska gas progressivity tax (GPT) ‐ alternative potential mechanisms considered & evaluated
Part 4: Analysis of Alternative Upstream Fiscal Models for Alaska
4.6 Alaska gas progressivity tax (GPT) – alternative potential mechanisms considered & evaluated This section considers in some detail ten potential alternative mechanisms for a progressivity fiscal instrument focused on natural gas (GPT). Figure 4.6.1 illustrates that the section of the overall fiscal design receiving attention is focused upon PTV of gas and oil. In the figures presented in this section and Appendix 7 the identification abbreviations used for the ten alternative GPT mechanisms modelled are:
• Mechanism No. 1 Status quo CPT rules (CPT 2008 Rules). • Mechanism No. 2 Separate CPT streams for oil and gas (Gas CPT Rules). • Mechanism No. 3 Separate CPT streams for oil and gas, with 33% gas stream subject to
GPT (33% Gas Rules). • Mechanism No. 4 Separate CPT streams for oil and gas, with gas valued on its own and
not boe equivalent (Gas PTV). • Mechanism No. 5 GPT calculated on return‐factor (R‐Factor). • Mechanism No. 6 GPT calculated on internal rate of return (IRR). • Mechanism No. 7 GPT calculated on cumulative gas reserves production volume (Cum
Res). • Mechanism No. 8 GPT calculated on annual gas production volume (Gas Prod). • Mechanism No. 9 GPT calculated on cumulative gas PTV (Cum Gas PTV). • Mechanism No. 10 Cumulative gas PTV plus fiscal allowances (Cum Gas PTV +
Allowances). Note: Mechanism No.1 represents the status quo progressivity tax mechanism in the Alaska fiscal design. The rationale and details of each mechanism are explained, and then their impact on the fiscal performance is compared with more details in the sensitivity models for the ten field sizes considered. This information is provided in Appendix 6.
Preliminary Report on Fiscal Designs for the Development of Alaska Natural Gas David Wood November 2008
291

Figure 4.6.1 Flow diagram illustrating how various mechanisms for gas progressivity tax (GPT) fit into the overall Alaska fiscal design.
Preliminary Report on Fiscal Designs for the Development of Alaska Natural Gas David Wood November 2008
292

The ten alternative mechanisms for GPT are driven by: 1. PTV $/boe unit value (status quo, combined progressivity tax or CPT) – This mechanism converts gas production tax value to oil unit‐equivalent value by converting gas volumes produced at 6,000 cubic feet = 1 boe (approximate energy equivalence) in order to compute combined production tax value as per boe unit. It then applies the rates and thresholds of CPT as defined in the prevailing fiscal design (signed into law in 2007) to the combined PTV (with oil and gas revenue and cost streams together). This mechanism has been applied as the base case in the analysis presented in early sections of this study. 2. PTV $/boe unit value (oil and gas progressivity calculated separately as OPT and GPT) –This mechanism converts gas production tax value to oil unit‐equivalent value by converting gas volumes produced at 6,000 cubic feet = 1 boe (approximate energy equivalence) in order to compute separate oil and gas production tax values as per boe unit. It then applies the rates and thresholds to compute separate oil and gas progressivity taxes (OPT and GPT, using the same rates, etc. as those used for CPT). Calculating two separate gas and oil PTV streams is not envisioned in the current law and would require costs to be separated into those two streams. Under the oil and gas prices seen to date and the full range of gas tariffs that have been suggested for future interstate gas sales, this would typically yield much lower progressivity rates for the GPT than for the OPT. 3. PTV $/boe unit value (OPT and GPT calculated separately, same as Mechanism No. 2, but with only a fraction ‐‐ 33% used as an example – of the gas PTV subject to GPT) – This mechanism converts gas production tax value to oil unit‐equivalent value by converting gas volumes produced at 6,000 cubic feet = 1 boe in order to compute separate oil and gas production tax values per boe unit. It then applies the rates and thresholds to compute separate oil and gas progressivity taxes (OPT and GPT, using the same rates, etc. as those used for CPT). Calculating two separate gas and oil PTV streams provides taxing authorities the flexibility to treat one stream quite differently from the other. Applying progressivity tax to just a fraction (e.g. 33%) is an example of such flexibility. 4. Gas PTV as $/mmbtu unit value – This mechanism constructs a GPT using the same mechanism as the OPT, but replaces oil production tax $ per boe unit value thresholds with gas production tax $ per mmbtu unit value thresholds, and adjusts rates and thresholds accordingly. OPT and GPT are calculated on separate PTV streams (as for all mechanisms except Mechanism No. 1). This mechanism requires a new set of thresholds and rates to be established for the gas PTV stream. OPT is calculated using the same thresholds and rates as Mechanism No. 1. Note: In the prior four mechanisms the basis for calculating the tax rate and the base to which that rate is applied are the same, and that tax base is the same that the 25% BPT is applied to. In the remaining six mechanisms that is not the case. In all but Mechanism No. 10, the basis for calculating the gas progressivity tax rate is different for each, though the tax base against which
Preliminary Report on Fiscal Designs for the Development of Alaska Natural Gas David Wood November 2008
293

that rate is applied remains the same and is of course the same base to which the 25% BPT is applied. 5. R‐factor – This mechanism drives gas progressivity tax (GPT) rates to progressively increase as the ratio of cumulative project point‐of‐production gas values (PPV) less royalty divided by cumulative project gas costs increases. OPT is calculated using the same thresholds and rates as Mechanism No. 1. Note: As used in this study PPV includes royalty that is ultimately deducted from PPV along with upstream costs to calculate PTV. 6. IRR – This mechanism drives the GPT rate to progressively increase as gas PTV IRR increases. OPT is calculated using the same thresholds and rates as Mechanism No. 1. 7. Cumulative gas volume produced – This mechanism targets larger and more mature fields, but is not linked to prices, values or cash flows. It drives GPT rate to progressively increase as natural gas cumulative volumes produced increases. OPT is calculated using the same thresholds and rates as Mechanism No. 1. 8. Annual gas production quantity – This mechanism targets the high volume (or high Btu) producing fields, but is not linked to prices, values or cash flows. OPT is calculated using the same thresholds and rates as Mechanism No. 1. This mechanism has some parallels to the former Economic Limit Factor (ELF) mechanism of severance tax applied in Alaska up to 2006. 9. Cumulative gas PTV – This mechanism drives the GPT rate to progressively increase as cumulative gas PTV increases. The oil PTV stream is taxed as in Mechanism No. 1 for this analysis. 10. Cumulative gas PTV plus fiscal allowances – This mechanism drives the GPT rate to progressively increase as cumulative gas PTV increases, with GPT calculated as a percentage rate of PPV (i.e. the same base used of royalty calculations). It is also coupled with fiscal allowances designed to moderate the regressive impacts of royalty, property tax and BPT floor provisions for more marginal projects, particularly in the early and late years of the field life when fields tend to be most impacted and vulnerable to regressive elements. It combines incentives with fiscal take‐backs tailored to make it a more genuinely progressive fiscal instrument in its own right. OPT is calculated using the same thresholds and rates as Mechanism No. 1. In this mechanism the GPT and BPT are applied against different tax bases.
Preliminary Report on Fiscal Designs for the Development of Alaska Natural Gas David Wood November 2008
294

Figure 4.6.2 Fiscal mechanisms based upon production quantity, unit price, destination value (sales revenue), cash flow (net revenue) value and return on investment arranged in terms of their regressive or progressive tendencies. The alternative fiscal designs devised for this study test a range of gas progressivity trigger mechanisms varying from regressive to progressive in character as illustrated schematically in Figures 4.6.2 and 4.6.3. There are examples in fiscal designs around the world where each of the trigger mechanisms identified in Figure 4.6.2 are applied to drive specific fiscal elements. In order not to overwhelm this analysis with cases, not all of the trigger mechanisms identified in Figure 4.6.2 are modelled separately as potential drivers for GPT in this study. Those selected are considered representative from the two extremes (i.e. the two most regressive economic drivers to the far left and the two most progressive drivers to the far right of the scale in Figure 4.6.2). The other mechanisms selected are focused on PTV per‐unit production quantity (status quo mechanism of Alaska’s CPT) and cumulative PTV. Destination value per unit, destination value, and point of production value are not modelled here as they are considered unlikely candidates to drive GPT because they do not include adjustments for costs. The more progressive fiscal mechanisms based upon cash‐flow values (or their cumulative values) and returns on investment (referred to here as “net mechanisms”) provide better government takes when product prices are high and projects are highly profitable. On the other hand, the more regressive fiscal mechanisms based upon production quantities,
Preliminary Report on Fiscal Designs for the Development of Alaska Natural Gas David Wood November 2008
295

cumulative reserves produced and destination or point of production values (referred to here as “gross mechanisms”), such as those usually used to levy royalty, provide better government takes (if applied to a GPT mechanism) when product prices are low and projects are much less profitable. From a producer’s perspective, regressive gross mechanisms can lead to projects becoming prematurely non‐commercial, while net mechanisms may be harsh at high prices but they help the projects remain commercial under adverse conditions. Mechanism No. 10 introduces the concept of combining fiscal allowances and take‐backs in a single instrument to improve its progressive tendencies. The relationships between fiscal allowances and take‐backs are explained in more detail below. Figure 4.6.3 The impacts of gas progressivity tax (GPT) may be moderated by the influence of existing fiscal elements and by other fiscal mechanisms specifically introduced to mitigate certain fiscal consequences. Figure 4.6.3 illustrates how some regressive fiscal instruments, such as property tax, royalty and production tax floor, are able to provide the state with minimum revenue levels even when projects are subject to marginal returns. In contrast, the progressive investment credits and fiscal allowances or exemptions are designed to partially mitigate the impacts of property tax, royalty and tax floor (to an extent) and attract investors by rewarding them for capital expenditures made. Figures 4.6.4 and 4.6.5 illustrate the prevailing BPT + CPT production tax methodology (Mechanism No. 1) and the alternative modifications involving BPT+OPT+GPT production tax methodologies (Mechanisms No. 2 to No. 10) involving separate oil and gas PTV production, sales and cost streams. Preliminary Report on Fiscal Designs for the Development of Alaska Natural Gas David Wood November 2008
296

Figure 4.6.4 (below) Figure 4.6.5 (above)
Preliminary Report on Fiscal Designs for the Development of Alaska Natural Gas David Wood November 2008
297

Factors, Methodologies and Potential Limitations of Alternative Gas Progressivity Tax (GPT) Mechanisms Considered Mechanism No. 1, PVT $/boe unit value (status quo of the combined progressivity tax, or CPT) – This method has already been described in some detail in earlier sections of the report and is illustrated in Figure 4.6.4. It is used as the base case model and calculates CPT on a combined oil and gas PTV $/boe unit value basis. It depends on a PTV per production quantity unit driver (Figure 4.6.2). Potential disadvantages:
• When oil prices are high and gas prices are low, the gas PTV $/boe dilutes the combined PTV per unit boe value and reduces Alaska revenues from projects producing substantial quantities of gas.
• Thresholds and factors may need adjusting as market conditions and prevailing prices change, but it lacks the flexibility to change rates and factors to target gas PTV rather than oil PTV.
Mechanism No. 2, PVT $/boe unit value (separate gas and oil streams) – The same rates and threshold $/boe unit values apply as in the prevailing CPT mechanism, but are applied to separate gas and oil PTV $/boe unit values. All oil and C5+ is subject to OPT. Assuming high‐calorific value gas is sent through the gas pipeline, the lighter NGLs are treated as gas Btus. If a light‐NGL extraction plant were to be sited in Alaska, those light NGLs might, or might not, in the future be considered part of the gas PTV. Prior to the 2006 Alaska fiscal reforms a significant amount of hydrocarbons taxed as gas were monetized by sending them through TAPS, but the future fiscal design should consider whether this is the most effective way to tax NGL revenue streams. Mechanism No.2 simply separates the calculations of oil and gas progressivity taxes; it does not consider whether NGLs sold as oil should be included in the oil progressivity calculation or the gas progressivity calculation. It seems logical that NGLs sold as oil should be taxed as oil, but that change would require a change to the definitions of natural gas and natural gas liquids as applied for fiscal purposes. Potential disadvantages:
• Thresholds and factors may need adjusting as market conditions and prevailing prices change, but this can at least be done separately for gas and oil (C5+)
• GPT (and OPT) calculated separately requires apportionment of joint costs to each stream. If these rules are flexible, producers could try to manipulate these to minimize liabilities under one or the other stream; if the rules are mechanical, they may produce bizarre or unintended results.
Mechanism No. 3, PVT $/boe unit value (separate gas and oil streams, with only a fraction of the gas stream subject to GPT) – The same rates and threshold $/boe unit values apply as in the prevailing CPT mechanism, but are applied to separate gas and oil PTV
Preliminary Report on Fiscal Designs for the Development of Alaska Natural Gas David Wood November 2008
298

$/boe unit values. All oil and C5+ is subject to OPT. However, only part of the gas PTV stream is subject to GPT. The fraction could itself be varied from time to time (or tailored to project size, i.e. high fractions for major fields, low fractions for marginal fields). Potential disadvantages:
• Thresholds and factors may need adjusting as market conditions and prevailing prices change, but this can at least be done separately for gas and oil (C5+) and the fraction of gas PTV eligible for GPT could be varied from time to time.
• GPT (and OPT) calculated separately requires apportionment of joint costs to each stream. If these rules are flexible, producers could try to manipulate these to minimize liabilities under one or the other stream; if the rules are mechanical, they may produce bizarre or unintended results.
Mechanism No. 4, gas PVT $/mmbtu unit value ‐ The same methodology as Mechanisms 1 to 3 is applied, but now the gas values are referenced to gas Btus produced and the rates and thresholds are tailored to those units. In the mechanism devised for this study the following thresholds and rates are applied:
First gas PTV $/mmbtu threshold – US$2.5/mmbtu (no GPT paid below that value). First tranche GPT rate ‐ 1.50% for each US$1/mmbtu increase in gas PTV between US$ 2.5/mmbtu and US$ 19.17/mmbtu. At US$19.17/mmbtu the GPT rate is 25%. Second gas PTV $/mmbtu threshold – US$19.17/mmbtu (lower incremental GPT rate applied above that gas PTV). Second tranche GPT rate ‐ 0.60% for each US$ 1/mmbtu increase in gas PTV above US$ 19.17/mmbtu. This is added to the full first tranche rate of 25%. Second tranche GPT rate cap – In order to prevent GPT rate increasing to unrealistic severe rates, a cap or maximum rate of 25% for the total second tranche GPT is applied. The cap means that GPT under this mechanism cannot increase above a rate of 50%.
Note that the rates and thresholds applied here could be varied to make GPT calculated in this way more or less severe. The rates are applied to gas PTV so GPT acts as a percentage add‐on to BPT tax rate in the same way as CPT. Potential disadvantages:
• Thresholds and factors may need adjusting as market conditions change. • GPT (and OPT) calculated separately requires apportionment of joint costs to each
stream. If these rules are flexible, producers could try to manipulate these to minimize liabilities under one or the other stream; if the rules are mechanical, they may produce bizarre or unintended results.
Mechanism No. 5, R‐factor – This also adopts a threshold and rate approach, but the thresholds are based on R‐factors (numerator = cumulative PPV less royalty; denominator = cumulative gas project capex plus cumulative gas project opex) [see note below regarding PPV
Preliminary Report on Fiscal Designs for the Development of Alaska Natural Gas David Wood November 2008
299

and royalty]. Neither income nor production taxes play a role in the calculation of the R‐factor as defined for this mechanism.
First R‐factor threshold – 2.00 (no GPT paid below that threshold of nominal payback). Initial GPT rate ‐ 2.0% multiplied by the R‐factor/first threshold for R‐factor of >2.00 and <4.00 up to a maximum of 4% (providing an add‐on to BPT by that amount). Second R‐factor threshold – 4.00 (that value is used as the denominator in a ratio with actual R‐factor as the numerator to escalate the second rate). Second GPT rate ‐ 4.0% multiplied by actual R‐factor divided by second threshold to calculate the entire GPT liability once the project exceeds second threshold R‐factor. Second GPT rate cap – In order to prevent GPT rate increasing to unrealistic severe rates, a cap or maximum rate of 50% for GPT is applied. The cap means that GPT under this mechanism cannot increase above a rate of 50% no matter how high the project R‐factor increases.
Note: As used in this study PPV includes royalty that is ultimately deducted from PPV along with field costs to calculate PTV.
The rates and thresholds applied in this mechanism simply translate the R‐factor ratio into a progressivity scale in percentage terms from 2% to 50%. However, by varying the rates and thresholds, GPT calculated by this method could be made more or less severe. The rates are applied to gas PTV so GPT calculated acts as a percentage add‐on to BPT tax rate. The initial threshold should be set above 1 if it is deemed necessary to take into account the undiscounted nature of R‐factor calculation and provide an early return on investment to producers. Potential disadvantages:
• Because this is profitability driven, projects yet to reach payback do not pay any GPT, so it is a delayed fiscal element coming into effect later in the field cycle.
• Such mechanisms can encourage cost/facility gold‐plating by IOCs to keep the R‐factor at lower rates as long as possible. To counter gold‐plating risks a GPT mechanism such as this could be combined with cost‐reduction fiscal incentives, such as enhanced investment credits (or costs uplifts) for project profits re‐invested in exploration or new capital projects, or accelerated depreciation linked to other fiscal elements (e.g. income taxes) for the higher R‐factor values.
• GPT (and OPT) calculated separately requires apportionment of joint costs to each stream. If these rules are flexible, producers could try to manipulate these to minimize liabilities under one or the other stream; if the rules are mechanical, they may produce bizarre or unintended results.
Mechanism No. 6, IRR – This also adopts a threshold and rate approach, but the thresholds are based on internal rates of return (IRR) calculated on gas PTV:
First IRR (%) threshold – 15.0% (no GPT paid below that threshold of discounted payback). Initial GPT rate ‐ 2.5% multiplied by the actual project IRR (%) divided by 15.0%.
Preliminary Report on Fiscal Designs for the Development of Alaska Natural Gas David Wood November 2008
300

Second IRR threshold – 25.0% (a higher and more progressive GPT rate applies above that level of profitability). Second GPT rate ‐ 11.0% multiplied by actual project IRR (%) divided by 25.0% to calculate the entire GPT liability once the project exceeds second threshold IRR. Second GPT rate cap – In the mechanism used none is deemed necessary.
This mechanism involves a step change in GPT rate once the second IRR threshold is reached (i.e. at an IRR of 24% the GPT rate is 4%, but at an IRR of 25% this increases the GPT to 11%).Note that the rates and thresholds applied here could be varied to make GPT calculated in this way more or less severe. The rates are applied to gas PTV so GPT acts as a percentage add‐on to BPT tax rate. Potential disadvantages:
• Because this is driven by return on investment, projects yet to provide a nominal 15% return on investment do not pay any GPT; so, it is a delayed fiscal element coming into effect later in the field cycle. Its impact on state take occurs later in the field cycle than for the R‐factor (i.e. Mechanism No.5).
• Such mechanisms (like those based on R‐factor) can encourage cost/facilities gold‐plating by IOCs to keep the project IRR at lower rates as long as possible. To counter gold‐plating risks a GPT mechanism such as this could be combined with cost‐reduction fiscal incentives, such as enhanced investment credits (or costs uplifts) for project profits re‐invested in exploration or new capital projects for the higher IRR values.
• GPT (and OPT) calculated separately requires apportionment of joint costs to each stream. If these rules are flexible, producers could try to manipulate these to minimize liabilities under one or the other stream; if the rules are mechanical, they may produce bizarre or unintended results.
Mechanism No. 7, Cumulative gas reserves production volume – This also adopts a threshold and rate approach, but the thresholds are based on cumulative gas reserves produced:
First natural gas reserves (bcf) threshold – 250 bcf (no GPT paid until at least 250 bcf gas volumes have been produced). Initial GPT rate ‐ 2.0% multiplied by ratio of actual project cumulative gas production divided by 250. Second natural gas reserves (bcf) threshold – 1,000 bcf (a higher and more progressive GPT rate applies above 1 tcf of cumulative production). Second GPT rate ‐ 8.0% multiplied by ratio of actual project cumulative gas production divided by 1,000, once the project exceeds second threshold of 1 tcf of cumulative production. Second GPT rate cap – In the mechanism used none is deemed necessary.
Note that the rates and thresholds applied here could be varied to make GPT calculated in this way more or less severe. The rates are applied to gas PTV, so GPT acts as a percentage increase to BPT tax rate.
Preliminary Report on Fiscal Designs for the Development of Alaska Natural Gas David Wood November 2008
301

Potential disadvantages:
• Because this progresses only as production volumes increases, it does not respond to project profitability or natural gas prices. This mechanism would become regressive in low‐price environments and could impact some low‐profitability fields adversely. It could, however, target large fields or mature long‐term producers and spare smaller, newer fields from a progressivity fiscal burden.
• Not responsive enough to market conditions. Method is used in some production‐sharing contracts (e.g. Nigeria), but not usually in isolation of other fiscal elements targeting gross and net values.
• GPT (and OPT) calculated separately requires apportionment of joint costs to each stream. If these rules are flexible, producers could try to manipulate these to minimize liabilities under one or the other stream; if the rules are mechanical, they may produce bizarre or unintended results.
• The mechanism could act as a disincentive to producers to invest in increasing recoverable reserves of a specific field as any incremental barrels would be subject to high progressivity tax rates irrespective of the prevailing economic circumstances.
Mechanism No. 8, annual gas production volume – This also adopts a threshold and rate approach, but the thresholds are based on annual gas production volumes:
First natural gas annual production (bcf) threshold – 100 bcf (no GPT paid until annual gas production reaches 100 bcf). Initial GPT rate‐ 5.0% multiplied by ratio of actual project annual gas production divided by 100. Second natural gas annual production (bcf) threshold – 200 bcf (a higher and more progressive GPT rate applies above 200 bcf of annual production). Second GPT rate ‐ 10.0% multiplied by ratio of actual project annual gas production divided by 200, if the project exceeds 200 bcf of production in that particular year. Second GPT rate cap – In the mechanism used none is deemed necessary.
Note that the rates and thresholds applied here could be varied to make GPT calculated in this way more or less severe. The rates are applied to gas PTV; so, GPT acts as a percentage add‐on to BPT tax rate. Potential disadvantages:
• Because this progresses only as annual natural gas production volumes increase above certain thresholds it does not respond to project profitability or natural gas prices. This mechanism would become regressive in low‐price environments and could impact some low profitability fields adversely. It could, however, target large fields or highly productive short‐term producing fields and spare smaller, lower‐rate producing fields from a progressivity fiscal burden.
• Not responsive enough to market conditions.
Preliminary Report on Fiscal Designs for the Development of Alaska Natural Gas David Wood November 2008
302
• GPT (and OPT) calculated separately requires apportionment of joint costs to each stream. If these rules are flexible, producers could try to manipulate these to minimize liabilities under one or the other stream; if the rules are mechanical, they may produce bizarre or unintended results.
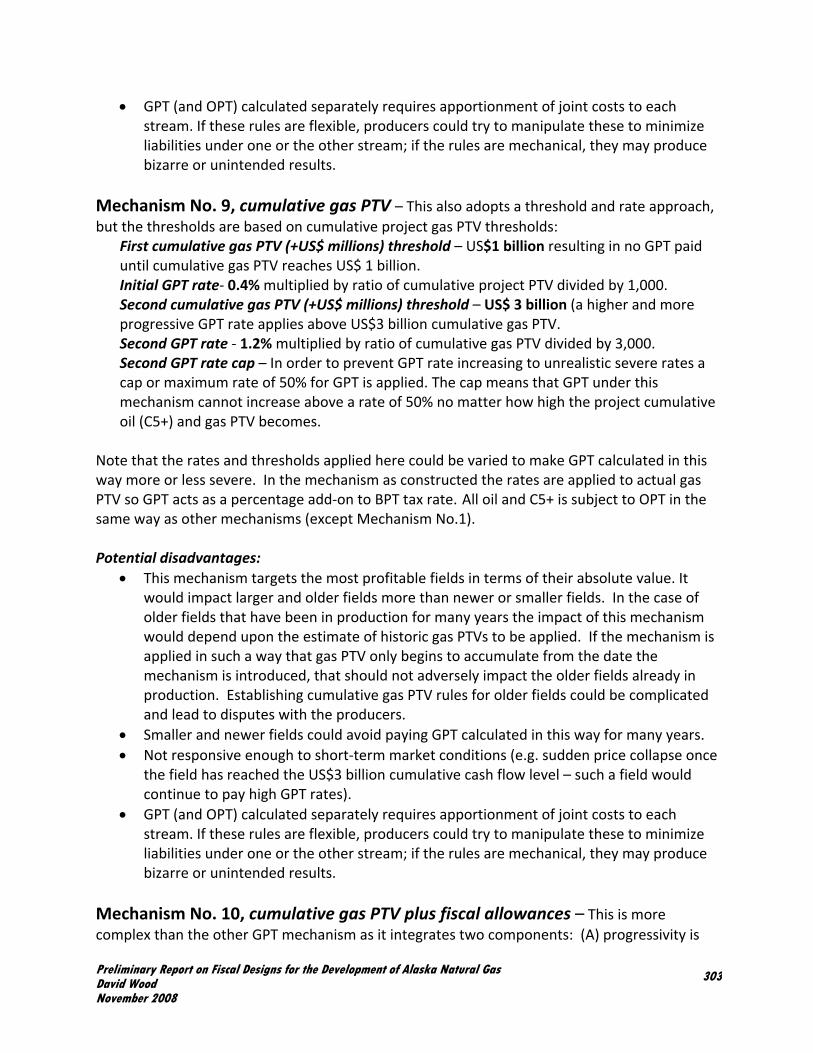
Mechanism No. 9, cumulative gas PTV – This also adopts a threshold and rate approach, but the thresholds are based on cumulative project gas PTV thresholds:
First cumulative gas PTV (+US$ millions) threshold – US$1 billion resulting in no GPT paid until cumulative gas PTV reaches US$ 1 billion. Initial GPT rate‐ 0.4% multiplied by ratio of cumulative project PTV divided by 1,000. Second cumulative gas PTV (+US$ millions) threshold – US$ 3 billion (a higher and more progressive GPT rate applies above US$3 billion cumulative gas PTV. Second GPT rate ‐ 1.2% multiplied by ratio of cumulative gas PTV divided by 3,000. Second GPT rate cap – In order to prevent GPT rate increasing to unrealistic severe rates a cap or maximum rate of 50% for GPT is applied. The cap means that GPT under this mechanism cannot increase above a rate of 50% no matter how high the project cumulative oil (C5+) and gas PTV becomes.
Note that the rates and thresholds applied here could be varied to make GPT calculated in this way more or less severe. In the mechanism as constructed the rates are applied to actual gas PTV so GPT acts as a percentage add‐on to BPT tax rate. All oil and C5+ is subject to OPT in the same way as other mechanisms (except Mechanism No.1). Potential disadvantages:
• This mechanism targets the most profitable fields in terms of their absolute value. It would impact larger and older fields more than newer or smaller fields. In the case of older fields that have been in production for many years the impact of this mechanism would depend upon the estimate of historic gas PTVs to be applied. If the mechanism is applied in such a way that gas PTV only begins to accumulate from the date the mechanism is introduced, that should not adversely impact the older fields already in production. Establishing cumulative gas PTV rules for older fields could be complicated and lead to disputes with the producers.
• Smaller and newer fields could avoid paying GPT calculated in this way for many years. • Not responsive enough to short‐term market conditions (e.g. sudden price collapse once
the field has reached the US$3 billion cumulative cash flow level – such a field would continue to pay high GPT rates).
• GPT (and OPT) calculated separately requires apportionment of joint costs to each stream. If these rules are flexible, producers could try to manipulate these to minimize liabilities under one or the other stream; if the rules are mechanical, they may produce bizarre or unintended results.
Mechanism No. 10, cumulative gas PTV plus fiscal allowances – This is more complex than the other GPT mechanism as it integrates two components: (A) progressivity is
Preliminary Report on Fiscal Designs for the Development of Alaska Natural Gas David Wood November 2008
303

applied to PPV (the base value used for calculating royalty), not PTV (the base value for calculating BPT), as the project becomes cumulatively more profitable in absolute terms; and (B) early and late‐life reliefs are applied based on PPV and royalties paid during low‐profitability phases of the project. Component (A) adopts a threshold and rate approach, and like Mechanism No. 7 the thresholds are based on cumulative PTV thresholds, but in this case just cumulative gas PTV:
First cumulative gas PTV (+US$ millions) threshold – US$ 1 billion (no GPT paid until cumulative gas PTV reaches US$ 1 billion). Initial GPT rate ‐ 1.0% multiplied by ratio of cumulative gas PTV divided by 1,000 and is applied as a rate to PPV (the base value used for calculating royalty). Second cumulative gas PTV (+US$ millions) threshold – US$ 2.5 billion (a higher and more progressive GPT rate applies above US$2.5 billion cumulative gas PTV). Second GPT rate ‐ 2.0% multiplied by ratio of cumulative gas PTV divided by 2,500 and is applied as a rate to PPV (the base value used for calculating royalty). Second GPT rate cap – In order to prevent the calculated GPT rate increasing to unrealistic severe rates a cap or maximum rate of 40% for GPT is applied. The cap means that GPT under this mechanism cannot increase above a rate of 40% no matter how high the project cash flow becomes. The GPT rate calculated in this mechanism is moderated by a fiscal allowance, calculated as follows: 1. If annual gas PTV is less than zero, any royalty liability calculated under royalty
provisions due for that period is offset by an equivalent tax credit that could be applied against any tax or cashed in by the producer (i.e. making the effective royalty rate 0% for that period). This is designed to make the GPT instrument offset some of the regressive tendencies of other fiscal elements (i.e. royalty, property tax and production tax floor) in adverse economic conditions and for marginal fields.
2. If annual gas PTV is greater than zero, but cumulative gas PTV is less than zero, 75% of any royalty paid under royalty provisions due for that period is offset by an equivalent tax credit that could be applied against any tax or cashed in by the producer (i.e. effective royalty rate = 3.125% for that period).
3. Reserve‐tail fiscal allowance to help reduce GPT impact as field declines. If gas revenues decline by 25% or more year‐on‐year, then a 25% reduction in the royalty liability calculated under royalty provisions due for that period is offset by an equivalent tax credit that could be applied against any tax or cashed in by the producer (i.e. effective royalty rate = 9.375% for that period).
These allowances could act as incentives targeting marginal situations rather than capital investment incentives already targeted by investment credits. Note that the rates and thresholds applied here could be varied to make GPT calculated in this way more or less severe. In the mechanism as constructed the rates are applied to PPV; so, GPT calculated by this mechanism acts as an adjustment to royalty rate even though it is added to BPT and OPT to become part of the overall production tax liability.
Preliminary Report on Fiscal Designs for the Development of Alaska Natural Gas David Wood November 2008
304

Potential disadvantages:
• This mechanism targets the most profitable fields in terms of absolute values (because it is using cumulative gas PTV to drive it, it will impact larger and older fields more than newer or smaller fields).
• Smaller and newer fields could avoid paying GPT calculated in this way for many years. • As it uses royalty rate as the adjusted fiscal component, it could be a regressive fiscal
element in volatile price environments. To moderate the regressive nature the fiscal allowances are applied to the less profitable phases of the project cycles. This approach could be applied to other mechanisms to make them (or the overall fiscal design) more progressive.
• As is the case for other GPT mechanisms linked to cumulative triggers, this mechanism may not be responsive enough to short‐term market conditions (e.g. sudden price spikes or troughs once the field has reached the US$2.5 billion cumulative cash flow level – such a field would continue to pay high GPT rates).
• GPT (and OPT) calculated separately requires apportionment of joint costs to each stream. If these rules are flexible, producers could try to manipulate these to minimize liabilities under one or the other stream; if the rules are mechanical, they may produce bizarre or unintended results.
These ten alternative GPT mechanisms are selected to highlight the wide range of options available for introducing progressive fiscal elements into a fiscal design and how their impacts may vary significantly, depending on how they are driven. Note these mechanisms could all be constructed to be either ring‐fenced to each project, or ring‐fenced to each lease, or not ring‐fenced and applied to each producer’s cumulative gas production within the whole of Alaska. The larger producers would likely be obliged to pay higher rates of progressivity tax using the later option applied to Mechanisms No. 5 through No.10. The mechanisms might also be applied only to gas sold outside the state (leaving in‐state gas consumption to be unaffected by gas progressivity or dealt with at reduced rates). In summary, the ten alternative GPT mechanisms can be grouped as follows:
• Mechanism No. 1 (status quo CPT) driven by combined oil and gas PTV $/boe unit value. • Mechanisms No. 2 and No. 3 are driven by separate oil and gas PTV $/boe unit value,
with Mechanism 3 applying GPT to only 33% of the gas PTV. • Mechanism No. 4 is driven by separate oil and gas PTV streams, with GPT driven by gas
PTV $/mmbtu value thresholds. • Mechanisms No. 5 and No. 6 are driven by gas project return on investment at PTV
base. • Mechanisms No. 7 and No. 8 are driven by gas project production volumes. • Mechanism No. 9 is driven by cumulative gas (PTV) cash flows and levied on gas PTV.
Preliminary Report on Fiscal Designs for the Development of Alaska Natural Gas David Wood November 2008
305

• Mechanism No. 10 is driven by cumulative gas (PTV) cash flows and levied on PPV, with some fiscal allowances applied to compensate for regressive fiscal elements (royalty, property tax and production tax floor).
Preliminary Report on Fiscal Designs for the Development of Alaska Natural Gas David Wood November 2008
306

Sensitivity Analysis: Ten Potential Alternative GPT Mechanisms Tested The consequences of the different factors driving the alternative GPT mechanisms, in terms of fiscal revenues for Alaska, are evaluated here by a series of sensitivity cases. Figure 4.6.6 Variables used to test the alternative GPT mechanism in systematic sensitivity analysis.
Preliminary Report on Fiscal Designs for the Development of Alaska Natural Gas David Wood November 2008
307

Each potential GPT mechanism has been analysed using a series of sensitivity cases applied to each of the ten hypothetical fields used previously in this study. The results of the sensitivity analysis for each field are presented in Appendix 6. The sensitivity case information makes it possible to evaluate the impact of each of the ten GPT mechanisms on the full range of hypothetical oil and gas field sizes and types developed for this study. In this section the GPT mechanism sensitivity analysis of gas field #4 is presented and discussed and the analysis of the other fields is referred to for comparison. Gas field #4 is used because it holds large gas reserves (some 5 tcf) plus some 100 million barrels of associated NGLs. Total gas and liquid reserves produced from field #4, over a 17‐year production period in the model constructed, amount to some 941 million boe. The sensitivity analysis approach is similar to that used to evaluate the impact of prices, yields, costs and fiscal terms in Section 4.5 of this report. The variables focused upon to test the GPT mechanisms in the analysis presented here are: natural gas price; gas TT&T cost; capital costs; and, operating costs (see Figures 4.5.1 and 4.5.2 for ranges and specific case values used for these variables). These variables were shown in Section 4.5 to have the greatest impact on project values and fiscal takes for a wide range of gas fields. For the purposes of this study each GPT mechanism has been structured, in terms of thresholds values and rates applied, to yield similar GPT values (i.e. values of GPT paid to Alaska on an undiscounted basis for field #4) at base‐case gas prices (i.e. US$ 7.5/mmbtu in year 0 escalated at 1%/year) . This is a starting‐point gas price profile that could be changed and is adjusted significantly as part of the sensitivity analysis conducted. It is, however, a useful common baseline for the purpose of comparing various GPT mechanisms. In the figures presented in this section and Appendix 6 the identification abbreviations used for the ten alternative GPT mechanisms are:
• Mechanism No. 1 CPT: 2008 Rules • Mechanism No. 2 GPT: Gas CPT Rules • Mechanism No. 3 GPT: 33% Gas ‐ CPT Rules • Mechanism No. 4 GPT: Gas PTV • Mechanism No. 5 GPT: R‐Factor • Mechanism No. 6 GPT: IRR • Mechanism No. 7 GPT: Cum Res • Mechanism No. 8 GPT: Gas Prod • Mechanism No. 9 GPT: Cum Gas PTV • Mechanism No. 10 GPT: Cum Gas PTV + Allowance
Preliminary Report on Fiscal Designs for the Development of Alaska Natural Gas David Wood November 2008
308

Gas Price Sensitivities Figure 4.6.7 illustrates the impact on Alaska’s take of profits (%) and discounted unit revenue value (NPV US$/boe) of natural gas price on the ten GPT mechanisms for gas field #4. Clearly the discounted value (NPV) of Alaska’s take goes up and down progressively as natural gas prices increase and decrease, respectively, but less so for the mechanisms driven only by reserves and production volumes. On the other hand, in terms of percentage take of profits, at very low prices (e.g. US$ 1/mmbtu and US$ 2/mmbtu) in all cases the Alaska take of profits in percentage terms increases relative to the percentage takes at higher prices. As discussed in Section 4.5 this regressive effect is due to the impact of the royalty fiscal component in the overall fiscal design. Figure 4.6.1 shows that this regressive effect is less pronounced for the royalty adjustment GPT mechanism as the royalty relief component compensates for it. Figure 4.6.7 Impact on Alaska’s take of MOD undiscounted cash flow of variable gas price on the ten GPT mechanisms for gas field #4. The upper table lists the impact on Alaska fiscal take (%) of reducing gas prices (ranging from 6.75 to 3.00 US$/mmbtu) from the base case value of 7.5 US$/mmbtu (shown in the third column colored gray). Each column represents a different year 0 gas price. The lower table lists the impact on Alaska’s fiscal take of increasing natural gas prices (ranging from 9.00 to 22.50 US$/mmbtu) from the base case value. Each row represents a different GPT mechanism.
Preliminary Report on Fiscal Designs for the Development of Alaska Natural Gas David Wood November 2008
309

A graphical display of the sensitivity case values (Figure 4.6.8) reveals that each GPT mechanism has subtly different impacts on Alaska’s percentage take of MOD undiscounted cash flows at different natural gas prices. The Mechanisms No. 7 Cum Res and No. 8 Gas Prod do not increase Alaska’s percentage take of cash flow at high natural gas prices because they are not driven by dollar values but rather by quantity mechanism. On the other hand, all the other mechanisms achieve this as they are driven by value and return on investment criteria influenced by gas price and project costs. The Mechanism No. 10 Cum Gas PTV + Allowance provides Alaska with the highest percentage take of cash flow at high gas prices and the lowest percentage take of cash flow at low gas prices (except for Mechanism No. 1 Gas CPT Rules, which does not work effectively at low gas prices). Mechanism No. 10 demonstrates its progressive qualities in this figure. Mechanisms No. 2 Gas CPT Rules and No. 4 Gas PTV have quite similar impacts, as was intended by the thresholds gas PTV values and rates selected for Mechanism No. 4. This confirms that an independent GPT mechanism driven by gas PTV $ per mmbtu (and capped at specific rates for very high gas values) can operate in a similar way to GPT driven by gas PTV with thresholds expressed in $ per boe for gas fields. Mechanism No. 4 shows one of the steepest gradients toward the right of Figure 4.6.8, confirming that it responds well to high prices. Mechanism No. 3 33% Gas‐CPT Rules does not have much impact at high prices because only one‐third of the gas PTV is subject to GPT. Mechanism No. 5 R‐Factor also only increases state take slowly as gas price increases. Both Mechanisms No. 3 and No. 5 could be adjusted by changing the thresholds and rates to increase their takes at higher prices if desired. Figure 4.6.8 Impact on Alaska’s take of MOD undiscounted cash flow of variable gas price on the ten GPT mechanisms for gas field #4.
Preliminary Report on Fiscal Designs for the Development of Alaska Natural Gas David Wood November 2008
310

The GPT rate increase applied when natural gas prices exceed the second GPT threshold in Mechanism No. 2 Gas CPT Rules could be increased to yield a steeper curve in Figure 4.6.8 and provide Alaska with a higher ultimate take of cash flow at very high prices, i.e. make them more progressive at higher prices. A maximum rate cap, however, is required to avoid unrealistically severe rates being applied at very high prices by such mechanisms. Mechanisms No. 7 Cum Res and No. 8 Gas Prod show a declining Alaska percentage take of cash flow because they do not respond to gas prices. The most striking behaviour of the trend for Mechanism No. 1 CPT 2008 Rules is its lower take at low gas prices than all the other mechanisms which calculate GPT separately rather than from a combined PTV $ per boe value. At low gas prices the gas not only fails to trigger the CPT threshold of US$30/boe PTV value but its low value Btus inflate the boe denominator and effectively dilute any CPT that oil (C5+) might have paid at high crude oil prices. This flaw in the prevailing CPT mechanism is clearly illustrated in Figure 4.6.8. Figure 4.6.9 Impact on Alaska’s discounted real fiscal revenue value (NPV US$/boe) of variable gas price on the ten GPT mechanisms for gas field #4. At higher discount rates the spread of results for the GPT mechanism is greater at high gas prices.
Preliminary Report on Fiscal Designs for the Development of Alaska Natural Gas David Wood November 2008
311

Figure 4.6.10 Impact on Producer’s real discounted cash flow value (NPV US$/boe) of variable gas price on the ten GPT mechanisms for gas field #4. Figures 4.6.9 and 4.6.10 illustrate the impact of the various GPT mechanisms on discounted values of total fiscal cash flows to Alaska and discounted value of post‐tax cash flow for the producer (IOC). These two graphs show quite systematic trends in discounted value terms, with each mechanism having quite similar effects at gas prices less than about US$ 12/mmbtu. At higher natural gas prices the GPT mechanisms driven by cumulative reserves and annual gas production volumes yield greater values to the producer and lower values to Alaska, as do the R‐Factor mechanism and 33% Gas‐CPT mechanism. It is clear from Figure 4.6.11 that GPT mechanisms driven by gas and oil prices and royalty adjustments linked to cumulative profitability (Mechanism No. 8) provide the producer with a significantly lower value at high natural gas prices. The mechanisms driven by IRR and R‐Factor provide returns at high gas prices that follow similar trends to Mechanisms No. 1, No. 2 and No. 8, but with the rates and thresholds applied provide the producer with slightly higher values at high gas prices.
Preliminary Report on Fiscal Designs for the Development of Alaska Natural Gas David Wood November 2008
312
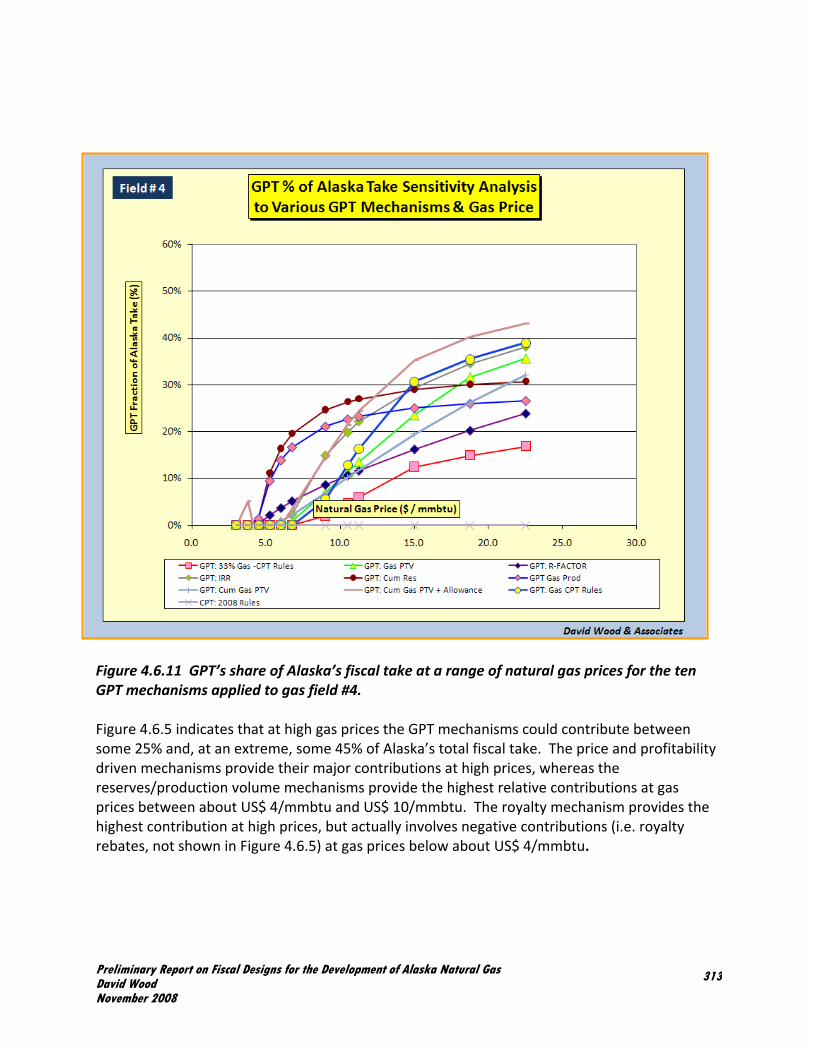
Figure 4.6.11 GPT’s share of Alaska’s fiscal take at a range of natural gas prices for the ten GPT mechanisms applied to gas field #4. Figure 4.6.5 indicates that at high gas prices the GPT mechanisms could contribute between some 25% and, at an extreme, some 45% of Alaska’s total fiscal take. The price and profitability driven mechanisms provide their major contributions at high prices, whereas the reserves/production volume mechanisms provide the highest relative contributions at gas prices between about US$ 4/mmbtu and US$ 10/mmbtu. The royalty mechanism provides the highest contribution at high prices, but actually involves negative contributions (i.e. royalty rebates, not shown in Figure 4.6.5) at gas prices below about US$ 4/mmbtu.
Preliminary Report on Fiscal Designs for the Development of Alaska Natural Gas David Wood November 2008
313

Figure 4.6.12 Impact on Producer’s IRR (%) of variable gas price on the ten GPT mechanisms for gas field #4. For the smaller gas fields (Fields #1, #2 and #3) Mechanism No. 10, cumulative gas PTV plus fiscal allowances GPT method, provides Alaska with a lower fiscal take and discounted value than the straight PTV per production quantity unit methods and the other mechanisms driven by return on investment. This is because at lower profitability the moderating impact of the fiscal allowances is greater. This effect is illustrated in Figure 4.6.13 for producer NPV US$/boe for Field #2, which should be contrasted with Figure 4.6.10. This underlines the more progressive character of Mechanism No. 10. As GPT contributes less than 10% of Alaska’s fiscal take in the case of the 5 oil fields studied (i.e. fields #6 to #10), the sensitivity analysis of different GPT mechanisms for those fields (Appendix 6) does not reveal much about the relative impacts of the mechanisms. However, should a producer have the opportunity to develop a more extensive, as yet undeveloped gas pool associated with such fields, the prevailing CPT Mechanism No. 1 could lead to such a development at moderate gas prices and high oil prices to reduce the CPT liabilities of the
Preliminary Report on Fiscal Designs for the Development of Alaska Natural Gas David Wood November 2008
314

combined projects. Some would argue that this is an incentive for operators to develop gas reservoirs, but it has the potential to limit Alaska state revenues significantly. Figure 4.6.13 Impact on producer’s discounted cash flow value (NPV US$/boe) of variable gas price on the ten GPT mechanisms for gas field #2. Compare with Figure 4.6.10 and note that there is a greater spread of results at high gas prices among the mechanisms for the smaller gas fields. Capital Expenditure Sensitivities
Preliminary Report on Fiscal Designs for the Development of Alaska Natural Gas David Wood November 2008
315

Figure 4.6.14 Impact on Alaska’s take of undiscounted MOD cash flow of variable capital expenditure on the ten GPT mechanisms for gas field #4. Figure 4.6.14 illustrates the impact on Alaska’s take of profits (%) and discounted unit revenue value (NPV US$/boe) of capital costs on the ten GPT mechanisms for gas field #4. Figure 4.6.15 Impact on Alaska’s take of variable capital expenditure on the ten GPT mechanisms for gas field #4. Figure 4.6.15 shows clear differences in the ways the alternative GPT mechanisms respond to a wide range of capital expenditures for gas field #4. The PTV‐driven mechanisms and the reserves/production volume mechanisms provide Alaska with essentially flat percentage takes over the full range of unit capital costs considered. On the other hand, those mechanisms driven by return on investment show, as should be expected, lower returns to Alaska as capital costs increase. In order of sensitivity to capital costs are: Mechanism No. 6 GPT: IRR (most sensitive) Mechanism No. 5 GPT: R‐Factor Mechanism No. 10 GPT: Cum Gas PTV + Allowance
Preliminary Report on Fiscal Designs for the Development of Alaska Natural Gas David Wood November 2008
316
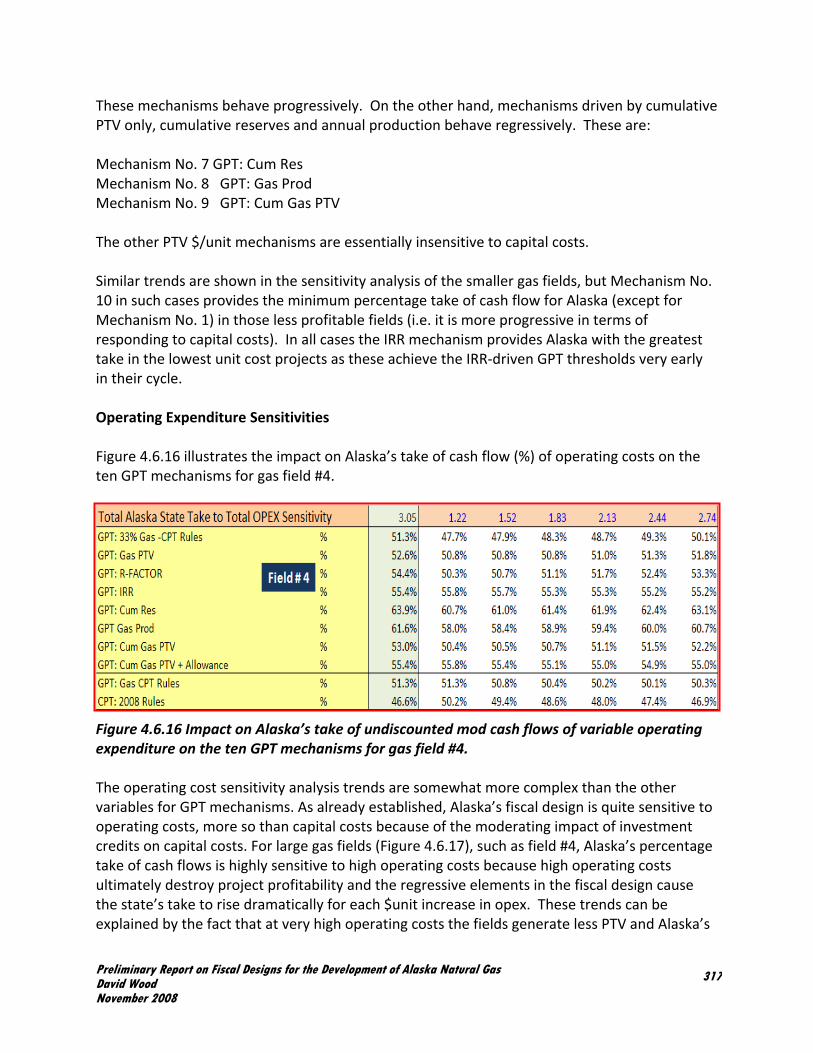
These mechanisms behave progressively. On the other hand, mechanisms driven by cumulative PTV only, cumulative reserves and annual production behave regressively. These are: Mechanism No. 7 GPT: Cum Res Mechanism No. 8 GPT: Gas Prod Mechanism No. 9 GPT: Cum Gas PTV The other PTV $/unit mechanisms are essentially insensitive to capital costs. Similar trends are shown in the sensitivity analysis of the smaller gas fields, but Mechanism No. 10 in such cases provides the minimum percentage take of cash flow for Alaska (except for Mechanism No. 1) in those less profitable fields (i.e. it is more progressive in terms of responding to capital costs). In all cases the IRR mechanism provides Alaska with the greatest take in the lowest unit cost projects as these achieve the IRR‐driven GPT thresholds very early in their cycle. Operating Expenditure Sensitivities Figure 4.6.16 illustrates the impact on Alaska’s take of cash flow (%) of operating costs on the ten GPT mechanisms for gas field #4. Figure 4.6.16 Impact on Alaska’s take of undiscounted mod cash flows of variable operating expenditure on the ten GPT mechanisms for gas field #4. The operating cost sensitivity analysis trends are somewhat more complex than the other variables for GPT mechanisms. As already established, Alaska’s fiscal design is quite sensitive to operating costs, more so than capital costs because of the moderating impact of investment credits on capital costs. For large gas fields (Figure 4.6.17), such as field #4, Alaska’s percentage take of cash flows is highly sensitive to high operating costs because high operating costs ultimately destroy project profitability and the regressive elements in the fiscal design cause the state’s take to rise dramatically for each $unit increase in opex. These trends can be explained by the fact that at very high operating costs the fields generate less PTV and Alaska’s
Preliminary Report on Fiscal Designs for the Development of Alaska Natural Gas David Wood November 2008
317

take depends more upon royalty than BPT, which leads to a greater percentage take for Alaska of the small cash flow generated. As opex unit costs fall the PTV $/unit mechanisms and return on investment mechanisms show an increasing state take trend (progressive response to higher profitability), as does Mechanism No. 10. Figure 4.6.17 Impact on Alaska’s take of variable operating expenditure on the ten GPT mechanisms for gas field #4. The trends are different for the smaller less profitable gas fields as revealed by Figure 4.6.18. The GPT mechanisms respond as two groups. Those GPT mechanisms driven by PTV $/unit and return on investment yield slightly higher percentage takes to Alaska at low unit operating costs, similar to trends displayed for larger gas fields (Figure 4.6.17). However, all mechanisms show trends of progressively increasing Alaska’s percentage take as unit operating costs increase. This is explained by the greater impact of royalties on Alaska percentage take for small low profitability fields, which generate low PTV (cash flow) in high operating cost cases. This regressive effect is moderated to a degree by Mechanism No. 10, which shows a slightly flatter trend than the other mechanisms (Figure 4.6.18) except Mechanism No. 1, which plots
Preliminary Report on Fiscal Designs for the Development of Alaska Natural Gas David Wood November 2008
318

off‐trend because progressivity payments fall away more quickly for that mechanism and reduce Alaska’s take at moderate and high operating costs. Figure 4.6.18 Impact on Alaska’s take of variable operating expenditure on the ten GPT mechanisms for small gas field #1.
Preliminary Report on Fiscal Designs for the Development of Alaska Natural Gas David Wood November 2008
319

What does the overall sensitivity analysis suggest for future options for upstream gas fiscal design in Alaska? Of the ten GPT mechanisms considered the following conclusions can be drawn: Mechanism No. 1 (CPT, status quo) will not work well for gas because: 1) the boe thresholds are designed for oil and much moderately priced gas pays no CPT; and 2) because gas and oil PTV are treated in a combined way such that low‐price gas has the effect of diluting CPT liabilities of high‐price oil and vice versa. This study clearly suggests that changes need to be made to tailor the progressivity to work for both oil and natural gas. An obvious first step is to separate out oil and gas and calculate their PTV streams independently to enable appropriate progressivity thresholds to be applied, and that is what the nine alternative mechanisms do. They calculate separate GPT and OPT progressivity taxes. Mechanism No. 2 (GPT, gas and oil handled separately but using the same CPT $/boe thresholds and rates). This is an easy answer to solve CPT problem 2) above, but fails to address CPT problem 1) above because the oil‐focused thresholds and rates of CPT are inappropriate for natural gas. Mechanism No. 3 ( GPT, 33% of gas PTV stream is deemed liable for GPT which is calculated in the same way as Mechanism No. 2 using CPT thresholds and rates in $/boe). If Alaska wishes to give incentives to gas explorers and producers, exempting a fraction of the gas PTV stream could work. Moreover, the fraction of the gas PTV stream liable for GPT could be varied in the future (i.e. increased or decreased to meet prevailing market conditions), adding some flexibility. The mechanism as structured also fails to address CPT problem 1) above. Mechanism No. 4 (GPT, gas PTV $/mmbtu thresholds are used to drive GPT rates, and GPT and OPT are calculated on separate PTV streams). This approach addresses both CPT problems 1) and 2). It would be easy to implement in the sense that it uses the same structure and methodology as the status quo CPT methods, but without the gas problems. If Alaska is only focused on capturing more revenue in high price environments (spikes or sustained market highs) then this mechanism calculated monthly would fit the requirement. If it also wanted to provide some incentives to companies to develop existing gas fields and explore for new ones and compensate for the regressive elements already in the fiscal design (i.e. royalty, property tax, and production tax floor), it would need to be combined with more complex instruments (e.g. such as those built into Mechanism No. 10). Mechanisms No. 5 and No. 6 (GPT, driven by R‐factor of cumulative PPV/(cumulative capex plus cumulative opex), or IRR calculated separately from OPT). These mechanisms address both CPT problems 1) and 2). They are highly progressive and are good for limiting fiscal take in marginal projects during development and in leading to high state take as projects mature and become more profitable. They do not respond well to market troughs for mature fields (i.e.
Preliminary Report on Fiscal Designs for the Development of Alaska Natural Gas David Wood November 2008
320

once the thresholds are passed low prices or high costs will take a long time before they moderate R‐factor or IRR). They also require a whole new approach to accounting, leading to additional administrative burdens and concern that costs can be used in certain periods to manipulate the R‐factor or IRR measures. They do nothing to moderate the regressive elements already in the Alaska fiscal design (i.e. royalty, property tax, and production tax floor). Both mechanisms would need to be combined with more complex instruments (e.g. such as those built into Mechanism No. 10 for GPT to partially mitigate the regressive nature of other fiscal instruments. Mechanisms No. 7 and No. 8 (GPT, driven by cumulative reserves or annual production and calculated separately from OPT). These mechanisms address both CPT problems 1) and 2). However, they are highly regressive in low‐price environments and not very progressive in high‐price environments. Therefore they are considered unsuitable for driving GPT. If Alaska was keen to preferentially tax large fields (high reserves and/or high production rates) or major producers, the fiscal elements driven by these mechanisms could be used to exclude small companies from progressivity taxes as an incentive. Mechanism No. 9 (GPT, driven by cumulative gas PTV and calculated separately from OPT). This mechanism is simple and addresses both CPT problems 1) and 2). It does not respond well to market troughs for mature fields (i.e. once the cumulative thresholds are passed, low prices or high costs will take a long time before they moderate the rates). It would exclude marginal fields and those in early stages of development and could be tailored to place high GPT rates on the large profitable fields and producers. This mechanism would need to be combined with more complex instruments (e.g. such as those built into Mechanism No. 10) for GPT to partially mitigate the regressive nature of other fiscal instruments in the Alaska fiscal design. Mechanism No. 10 (GPT, driven by cumulative gas PTV but applied as a rate to PPV and moderated by allowances that mitigate its impacts in early developments and marginal fields). GPT is calculated separately from OPT. This mechanism addresses both CPT problems 1) and 2). Its objective is to be a truly progressive instrument, meaning that it increases state take in highly profitable situations and moderates state take in marginally profitable situations. The fiscal allowances incorporated specifically target the regressive tendencies of royalty, but also target other regressive elements indirectly. It is for this reason that it is calculated using the PPV base. In highly profitable environments it increases the state take (the GPT would effectively add incremental percentages to the royalty rate, but incorporate those increments in the production tax). In marginal environments it offsets the basic royalty payments with a tax credit (i.e. royalty paid is offset by an equivalent tax credit that could be applied against any tax or cashed in by the producer). Designing a new GPT mechanism using methodologies similar to Mechanism No. 10 would enable it to be rolled out to the industry as part incentive and part additional fiscal burden. Small‐ and medium‐sized gas producers should like it because it will encourage marginal field developments or developments in poor market conditions. Large producers and reserves holders will pay much more progressivity tax in high‐priced gas market conditions.
Preliminary Report on Fiscal Designs for the Development of Alaska Natural Gas David Wood November 2008
321
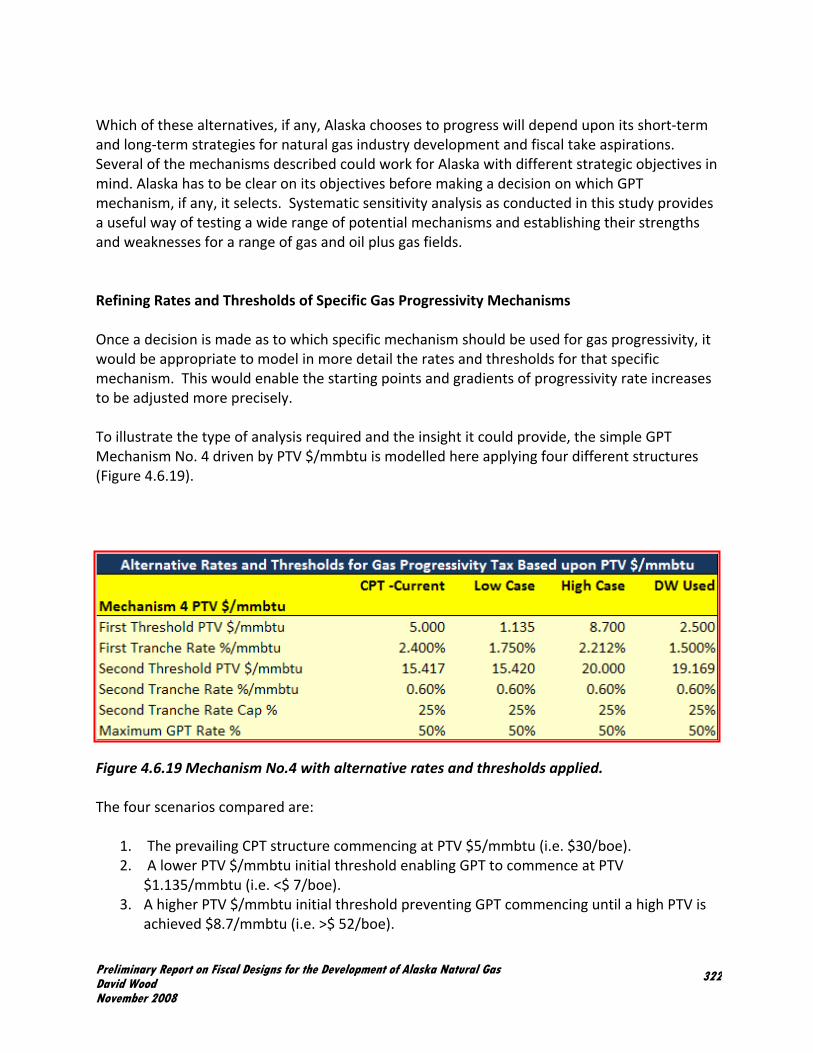
Which of these alternatives, if any, Alaska chooses to progress will depend upon its short‐term and long‐term strategies for natural gas industry development and fiscal take aspirations. Several of the mechanisms described could work for Alaska with different strategic objectives in mind. Alaska has to be clear on its objectives before making a decision on which GPT mechanism, if any, it selects. Systematic sensitivity analysis as conducted in this study provides a useful way of testing a wide range of potential mechanisms and establishing their strengths and weaknesses for a range of gas and oil plus gas fields. Refining Rates and Thresholds of Specific Gas Progressivity Mechanisms Once a decision is made as to which specific mechanism should be used for gas progressivity, it would be appropriate to model in more detail the rates and thresholds for that specific mechanism. This would enable the starting points and gradients of progressivity rate increases to be adjusted more precisely. To illustrate the type of analysis required and the insight it could provide, the simple GPT Mechanism No. 4 driven by PTV $/mmbtu is modelled here applying four different structures (Figure 4.6.19). Figure 4.6.19 Mechanism No.4 with alternative rates and thresholds applied. The four scenarios compared are:
1. The prevailing CPT structure commencing at PTV $5/mmbtu (i.e. $30/boe). 2. A lower PTV $/mmbtu initial threshold enabling GPT to commence at PTV
$1.135/mmbtu (i.e. <$ 7/boe). 3. A higher PTV $/mmbtu initial threshold preventing GPT commencing until a high PTV is
achieved $8.7/mmbtu (i.e. >$ 52/boe).
Preliminary Report on Fiscal Designs for the Development of Alaska Natural Gas David Wood November 2008
322

4. The structure used for the mechanism modelled in this study enabling GPT to commence at PTV $ 2.5/mmbtu (i.e. $15/boe).
Figures 4.6.20 and 4.6.21 compare these four alternatives over a range of PTV $/mmbtu values. Figure 4.6.20 Alternative configurations for Mechanism No. 4, with four distinct rates and thresholds applied. Figure 4.6.21 Alternative configurations for Mechanism No. 4, with four distinct rates and thresholds applied. Figure enlarged at the lower PTV $/mmbtu range.
Preliminary Report on Fiscal Designs for the Development of Alaska Natural Gas David Wood November 2008
323

The configuration for Mechanism No.4 selected for this study has an initial impact at lower PTV $/mmbtu values than the CPT mechanism, but then increases at a lower gradient than that mechanism. If it is decided to fix the problems with CPT by applying a simple change to the existing Alaska progressivity mechanism, then adapting Mechanism No. 4 could offer such a solution. Separate OPT (using the thresholds and rates of CPT) for an oil (C5+) and GPT mechanisms could be adapted. The GPT could apply one of the configurations displayed in Figures 4.6.19 to 4.6.21 to significantly improve performance of a gas progressivity tax. Rather than adopt such a simple approach, this author suggests that some fiscal allowances/incentives also be considered to mitigate the regressive elements in the current fiscal design which significantly limit commerciality for gas field developments with less than about 1 tcf of reserves. Making small fields commercial and extracting more value through progressivity from high value gas production should be the objective.
Preliminary Report on Fiscal Designs for the Development of Alaska Natural Gas David Wood November 2008
324