Embed Size (px)
Citation preview
Journal of Soft Computing in Civil Engineering 2-4 (2018) 47-61
SCCE is an open access journal under the CC BY license (http://creativecommons.org/licenses/BY/4.0/)
Contents lists available at SCCE
Journal of Soft Computing in Civil Engineering
Journal homepage: http://www.jsoftcivil.com/
Prediction of Concrete and Steel Materials Contained by
Cantilever Retaining Wall by Modeling the Artificial Neural
Networks
U. Gokkus1*
, M. S. Yildirim2 and Arif Yilmazoglu
3
1. Professor, Civil Engineering Department, Manisa Celal Bayar University, Turkey
2. Research Assistant (M.Sc.), Civil Engineering Department, Manisa Celal Bayar University, Turkey
3. M.Sc. Student, Institute of Natural and Applied Sciences, Manisa Celal Bayar University, Turkey
Corresponding author: [email protected]
http://dx.doi.org/10.22115/SCCE.2018.137218.1078
ARTICLE INFO
ABSTRACT
Article history:
Received: 26 June 2018
Revised: 09 July 2018
Accepted: 11 July 2018
In this study, the Artificial Neural Network (ANN) application
is implemented for predicting the required concrete volume and
amount of the steel reinforcement within the inversed-T-shaped
and stem-stepped reinforced concrete (RC) walls. For this aim,
seven-different RC wall designs were approached differentiated
within the wall heights and various internal friction angles of
backfill materials. Each RC wall is proportionally designed and
subjected to active lateral earth pressure defined with the
Mononobe-Okabe approach foreseen by Turkish Specification
for Building to be Built in Seismic Zones (TSC-2007).
Following the stability analysis of the RC retaining walls, the
structural and reinforced concrete analyses are performed
according to the Turkish Standard on Requirements for Design
and Construction in Reinforced Concrete Structures (TS500-
2000). Input parameters such as concrete volumes, weights of
the steel bars, soil and wall material properties are subjected to
the ANN modeling. The prediction of the concrete volume and
amount of the steel bars are achieved with the implementation
of the ANN model trained with the Artificial Bee Colony
(ABC) algorithm. As a result of this study, it is revealed that
ANN models are useful for verifying the existing RC retaining
wall designs or performing preliminary designs for the L-
shaped and stem-stepped cantilever retaining walls.
Keywords:
Inverse T-Shaped Retaining
Walls,
Stem-Stepped Walls,
Concrete Volume and Steel
Area in Wall Design,
Prediction with Neural
Network,
Artificial Bee Colony-Based
Preliminary Wall Design.

48 U. Gokkus et al./ Journal of Soft Computing in Civil Engineering 2-4 (2018) 47-61
1. Introduction
Implementation of the retaining walls are frequently ascertained for numerous engineering
applications such as in hydraulic engineering especially including coastal and river protection
structures, transportation engineering in land slide protection structures of deep excavations and
embankments and in marine transportation covering infrastructures of sea ports, and structural
engineering in concrete and steel-based structural analysis. Especially implementing a proper
retaining wall design is not solely based on the soil-base characteristics but the intensity of the
earthquake risk, the preliminary design of the retaining wall and dimensioning. This study is
extensively based on the structural analysis of the retaining walls and the stability analysis of the
wall body under the influence of the passive and active soil pressure behind the wall statue.
Structural systems of the earth-retaining walls are generally categorized into; T-shaped cantilever
walls, stem-stepped cantilever walls, counter-fort walls, caisson-type wall and retaining wall
with pile system. While designing a typical retaining wall, the loading types such as soil
pressures, hydrostatic pressure, surcharge and earthquake must be assigned. In general, retaining
walls are designed by lateral earth pressures based on Rankine or Coulomb’s theories. Mononobe
and Matsuo, and Okabe (M-O) proposed a method to determine the lateral earth pressure of the
granular cohesion-less soils during earthquake. The method was a modified version of Coulomb
theory in which earthquake forces are applied to the failure mass by pseudo-static method. In
stabilization of a wall, the general procedures are; check for overturning about its toe, check for
sliding along the base, check for bearing capacity failure, settlement, and overall stability.
2. Literature Survey
It is known that the ANN analysis is progressively used in optimization processes of counter-fort
and cantilever walls, geo-synthetic reinforced retaining wall design and extensively other fields
of geotechnical engineering. In 2003, Lee developed the I-PreConS (Intelligent PREdiction
system of CONcrete Strength) that provide in-place strength information of the concrete to
facilitate concrete form removal and scheduling for construction. For this aim, two major
techniques were applied to increase the accuracy and to more precisely predict concrete strength
development. One was to use parameter condensation technique in the determination of input
neurons. The other was to apply the weighting technique of input neurons for more prediction
accuracy. Consequently, this study indicated that I-PreConS using ANNs was very efficient for
predicting the compressive strength development of concrete [1]. Mansour et al.(2004)
investigated the application of the ANNs to predict the ultimate shear strengths of reinforced
concrete (RC) beams with transverse reinforcements. They developed the ANN model trained the
available test data of 176 RC beams collected from the technical literature. As a result of this
study, model based on the ANNs had strong potential as a feasible tool for predicting the ultimate
shear strength of the RC beams with the transverse reinforcement within the range of considered
input parameters [2].
On the other side, to optimize the area of steel bar in tension (Ast) and area of concrete (Ac.) of
the specified-sized cantilever retaining wall, Manjunath et al. (2012) studied changing just only
the total number of 15 input parameters and applied the ANNs for the different outputs (Ast and

U. Gokkus et al./ Journal of Soft Computing in Civil Engineering 2-4 (2018) 47-61 49
Ac)[10]. Similarly, Chethan et al. (2012) studied for the ANNs training of parameters composed
of the steel weights and concrete volumes required for specific-sized counter-fort retaining wall
and certain soil parameters [3].
Shehata (2016) also worked for the structural assessments of two shelves of inversed T-shaped
retaining wall with certain wall size and soil parameters [4]. Chougule et al.(2017) analyzed
three different cantilever wall model with/without shelves at stem and they revealed that RC
walls with two shelves were economical as compared to RC wall with single shelf without
applying the ANNs [5].
Alias et al.(2015) examined the performances of the ANNs for predicting the external stability of
cantilever RC retaining walls. Two types of this model were used as follows: Model I (for 1
output) and Model II (for 3 outputs). The results of their study indicated that, when compared in
terms of R2 value, first model had better performance than second considering the prediction
performance the of external stability [6]. Patil et. al. (2015) performed a study on Analysis and
Design of Stepped Cantilever Retaining Wall with using the aid of soft computing methods [7].
Buhuniyan et al. (2017), studied the retaining walls with relief shelves. The finite element
analysis of 2-D models of retaining walls by using STAAD-Pro was performed in this study and
his findings indicated the advantage of using the relief shelves over the cantilever and counter-
fort retaining walls. Gokkus et al.(2018) presented a study on the comparison of the relevant
footing widths of the proportionally-sized reinforced concrete retaining walls under extreme
loading conditions according to the Turkish Standard-2000 (TS500) Specification as in Fig. 1.
[8].
Fig. 1. RC retaining walls versus footing widths (EQ=Earthquake Motion HP=Hydraulic Pressure).
As indicated in Fig.1, it can be said that stem-stepped cantilever walls provided the most suitable
wall dimensions satisfying conditions regarding the stability analysis and reinforcement
9 8 10
27
20
25
14 12
14
31
22
28
0
5
10
15
20
25
30
35
Foo
tin
g W
idth
B(m
)
T-shaped cantilever Stem-stepped Counter-fort
RC Retaining Walls versus Footing Widths
Without EQ+ Without HP Without EQ+With HP With EQ+Without HP With EQ+With HP

50 U. Gokkus et al./ Journal of Soft Computing in Civil Engineering 2-4 (2018) 47-61
amounts. This process was followed by the counter-type cantilever wall as second one and
finally by T-shaped cantilever wall. It is obvious that this study aimed to carry out the ANNs
application of inversed T-shaped and double stem-stepped RC retaining wall.
3. Aim of the Study
In recent years, it is known that structural assessments and the ANN applications related to the
different-shaped RC retaining walls with specific design parameters has been carried out. Apart
from the above-mentioned studies, as warm based ANN application (Artificial Bee Colony) for
the inversed-T-shaped and double stem-stepped RC walls dimensioned for7 different input
parameters with 7 different wall heights were implemented for this study for prediction of
concrete volume and steel rebar weight required for the variable heights of the RC retaining
walls. Additionally, both of the structural stabilities and resistances of the RC retaining walls
with proportionally-varied sizes were verified against extreme loading conditions. Even if there
have been changes in heights and loading conditions, the backfill material height corresponding
to each RC retaining wall height was taken equal to each other in all cases. By this approach, this
study demonstrates the implementation of the ANN models for a quick preliminary design of
special types of RC retaining walls under the design considerations such as variable H (wall
height) and internal soil-friction coefficient.
4. Methodology
For this study, a typical inversed T-shaped retaining wall with two relief shelves was designed
and differentiated models were generated with varying wall heights and soil-friction coefficient
values. The structural analysis of the model was performed and the output of the structural
analysis phase was the required concrete volume in cubic meters and the steel reinforcement
amount in kilogram. With the implementation of the ANNs model trained with the swarm based
ABC training algorithm, it was concluded that, such models can be implemented for verifying or
performing preliminary design of the inversed T-shaped and double stem-stepped cantilever
beam-like retaining walls for many projects. In the following subsections, the loading conditions,
stability analysis and reinforcement detailing of the RC retaining walls are briefly mentioned.
4.1. Total Earth Pressures due to Extreme Loads
Total active, atK , and passive, ptK , pressure coefficients based on the Mononobe-Okabe (M-O)
model including earthquake motion foreseen by Turkish Specification for Building to be Built in
Seismic Zones [9] is considered as in Eq.1a and Eq.1b.
22
2
1 sin( )sin1
cos cos
V
at
C cos iK
cos cos cos i
(1-a)
22
2
1 sin( )sin1
cos cos
V
pt
C cos iK
cos cos cos i
(1-b)

U. Gokkus et al./ Journal of Soft Computing in Civil Engineering 2-4 (2018) 47-61 51
where𝜑 is the soil friction angle, 𝛿 is the wall friction angle, 𝛼 is the wall inclination with
respect to the vertical axis, 𝑖 is the ground inclination with respect to horizontal on both sides of
the wall and the angle 𝜆 for dry and submerged soil.The resultant 𝑃𝑎𝑑and 𝑃𝑝𝑑(dynamic active
and passive soil pressures) are obtained respectively as seen in Eq.2a and Eq.2b:
20.5 / 2ad ad cdP K H z H (2-a)
20.5pd pdP K H (2-b)
where 𝛾 is the unit weight of soil (𝛾𝑠𝑢𝑏 for submerged soil, 𝛾𝑠𝑎𝑡 for) and 𝐻 is the vertical height
of thewall. The resultant of the active and passive soil pressures are also included into to the
analysis in addition to the static soil pressures by contribution of the earthquakes seen in Eq.3a
and Eq.3b:
0 { / 3} cos
ad at as cd
cosQ q K K H z H
i
(3-a)
0cos
pd pt ps
cosQ q K K H
i
(3-b)
where 𝑄𝑎𝑑 and 𝑄𝑝𝑑 are respectively the resultant of active and passive soil pressures, 𝐾𝑎𝑠 and
𝐾𝑝𝑠 are respectively static active and passive pressure coefficient, and surcharge load 𝑞0.
4.2. Stability Analysis
The stability analysis of the wall is performed by consecutive analyses regarding the overturning
about its toe, sliding along its base, bearing capacity failure of the base, settlement, and overall
stability as in Eq.4.
R R u
O S BC
O S max
M F qFS FS FS
M F q
(4)
where 𝐹𝑆𝑂 is safety against overturning (total resisting and overturning moments, respectively,
RM and OM ), 𝐹𝑆𝑆 is safety factor against sliding (total resisting forces and sliding forces,
respectively, RF and SF ), BCFS is safety factor against bearing capacity failure ( uq is the
ultimate soil-bearing capacity, maxq is maximum pressure at toe, minq is minimum pressure at the
heel).
4.3. Reinforcement
Before designing a reinforced concrete retaining wall, earth and water pressures were calculated
according to Eurocode-8 (1994) [10]. Also with including the earthquake force, the loading
conditions required for the M-O earth pressure equations are provided as foreseen in the TSC
(2007) [9]. Each of the proportionally-sized element RC retaining wall with varying height was
analyzed from aspect of overturning and sliding stability conditions, and bearing capacity of the
subjected soil. As the following phase of the study, the appropriately dimensioned RC retaining
wall was subjected to the reinforced concrete design. Afterwards, the structural system of the RC
retaining wall exposed to the design loads was analyzed by Structural Analysis Program

52 U. Gokkus et al./ Journal of Soft Computing in Civil Engineering 2-4 (2018) 47-61
(SAP2000). The results such as bending moments, shear forces and axial compression forces of
the structural sections at the upper and lower steps, stem and footing were obtained. This analysis
is performed along whole wall members and all structural nodes of the models. Later on, the
reinforced concrete design was achieved for the mentioned sections according to TS500 Turkish
Standard on Requirements for Design and Construction in Reinforced Concrete Structures
(TS500) (2000) [11].
Total areas of the steel bars required for footing section (at toe and heel), stem and two shelves
exposed to the combined axial and shear forces, and bending moments are determined at the
reinforcement concrete design stage of the study which are composed of longitudinal steel bars
and shear reinforcement elements (stirrups). For reinforced concrete design of the steps and
footings, the combined flexural and shear design methods were used similar to the designing of a
beam section. On the contrary, the reinforcement design of the stem is analyzed with the
combination of the axial compression load, shear force and bending moment similar to the sole
design phase of a reinforced concrete column. Outputs of the reinforced design phase of the
study are the concrete volume (m3) and total area of steel members (kg
f) for each wall with unit
length and different height. The outputs of the structural analysis and design phases are subjected
to the ANN modeling for the prediction phase of the study.
4.4. Artificial Neural Networks
In this study, the ANN regression approach is implemented considering the outputs of the
structural analysis and reinforced concrete design phases and various inputs representing the
dimensioning of the RC retaining walls and soil conditions. A typical ANN model acts as a
human brain with the inter-connected neurons to each other and it has the capability of pattern
detection and fitting a suitable model to a nonlinear data for applying a regression model. The
basic structure of a ANN model is well known in literature and shown in the Fig. 2..
Fig. 2. A typical diagram of the ANN model.
After the training of the ANN model, the best performing model is selected by evaluating the
performance statistics such as the R-Square of the model output and the Mean Square Error
(MSE) defined with Eq.5.

U. Gokkus et al./ Journal of Soft Computing in Civil Engineering 2-4 (2018) 47-61 53
2
e mO OMSE
n 1
(5)
where n is the number of sample, Oe is the vector denoting values of n number of estimations and
Oma vector representing n number of measured values.
4.5. Implementing the ANNs model
In the prediction model, the concrete volume and the reinforcement amount in kilograms are the
outputs of the ANN model to be predicted. The independent variables for the ANN model were
the height of the L-shaped wall (H), the soil-friction coefficient (angle). In Table 1, the input
variables are shown with the output variables of the generated ANN model.
Table. 1. Input and output variables for the ANN model.
Variables Symbol Variable Type
Height of Wall Meters Independent
Soil friction coef. - Independent
Concrete Volume m3 Dependent
Reinforcement Amount kgf Dependent
A single hidden layer, feed forward neural network model was used for this study with a swarm
based Artificial Bee Colony (ABC) training algorithm as it is was considered sufficient for
approximating complex nonlinear functions.All variables were normalized between 0.1 and 0.9
for a better ANN generalization performance by using Eq.6.
r rminn
rmax rmin
Y YY 0.9 0.1
Y Y
(6)
In the Eq, nY is the normalized data-point, nY is the raw data-point rmaxY and rminY are maximum
and minimum data-points observed in the data.
5. Case Study: Specified-Sized and Stem-Stepped RC Retaining Walls
5.1. Retaining Wall and Soil Characteristics
Eurocode-8 (1994) and TSC (2007) are used to apply loading conditions [12, 13]. In this case,
the wall height to determine proportionally the dimensions of wall elements is taken as variable
parameters to model the ANNs. RC retaining wall and soil characteristic parameters are
presented in Table 2.
Table. 2. RC retaining wall and soil characteristic parameters.
Wall Height H SafetyFactors(Sliding/Overturning/BearCap) 1.5/2.0/1.5
Footing Width 0.4H-0.7H Allow. Bearing Capacity of Ground 350 kN/m2
Footing Thickness H/12-H/10 Unit Weight of Concrete 23 kN/m3
Top Thick. of Stem Min20-30cm Bulk Unit Weight of Soil 18 kN/m3
Bottom Thick.of Stem H/12-H/10 Submerged Unit Weight of Soil 20 kN/m3
Wall Inclination Angle 900 Backside Slope of Stem 0
Wall Friction Angle 00 Depth/Thickness of Upper Step (H/3)/0.50m
54 U. Gokkus et al./ Journal of Soft Computing in Civil Engineering 2-4 (2018) 47-61
Passive Earth Height Hp=tBASE Depth/Thickness of Lower Step (2H/3)/0.50m
Passive Water Height Hw=tBASE Building Importance Factor I=1.0
Active Earth Height Ha=H Seismic Zone in TURKEY 20(High Risk)
Active Water Height Hw=2/3H Concrete Comp.Strength 30Mpa
Eff.Eq.Acc.Coff. kh 0.35g Yield Strength of Longitudinal Bar 220 Mpa
Surcharge Load Qt=20 kN/m2 Yield Strength of Transversal Bar 220 Mpa
Eff.LenghtofSurcharge 6m Concrete/Steel Class C30/ST37
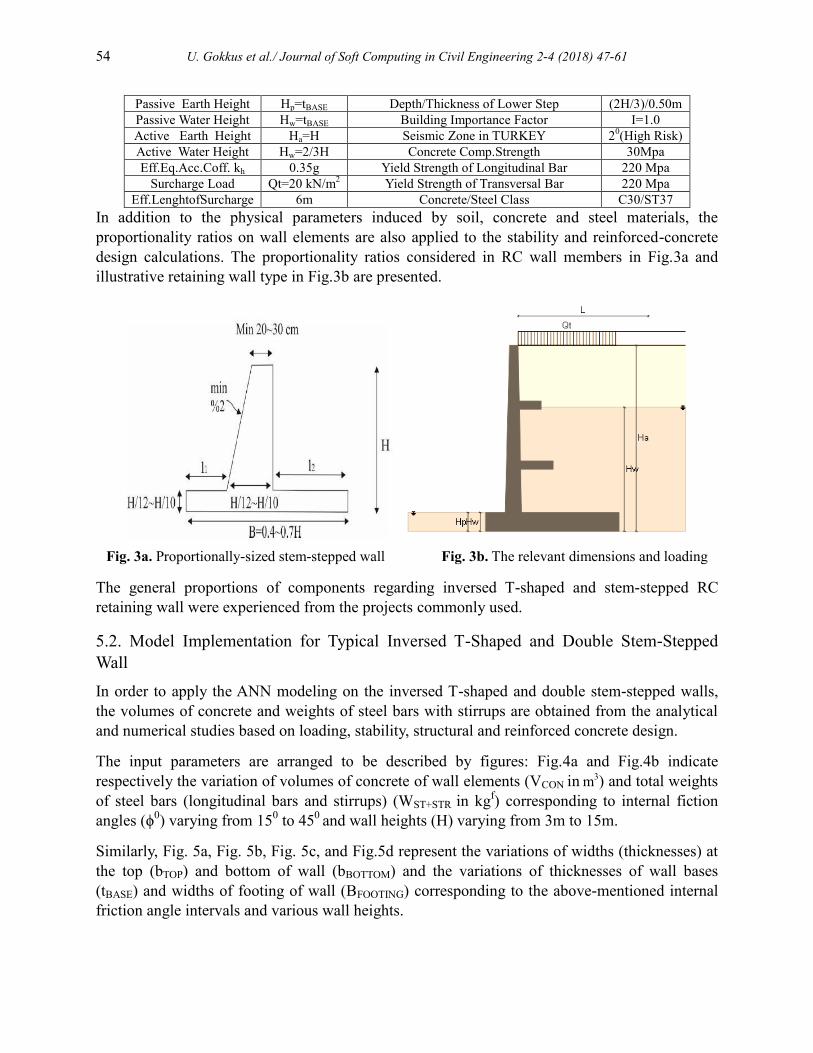
In addition to the physical parameters induced by soil, concrete and steel materials, the
proportionality ratios on wall elements are also applied to the stability and reinforced-concrete
design calculations. The proportionality ratios considered in RC wall members in Fig.3a and
illustrative retaining wall type in Fig.3b are presented.
Fig. 3a. Proportionally-sized stem-stepped wall Fig. 3b. The relevant dimensions and loading
The general proportions of components regarding inversed T-shaped and stem-stepped RC
retaining wall were experienced from the projects commonly used.
5.2. Model Implementation for Typical Inversed T-Shaped and Double Stem-Stepped
Wall
In order to apply the ANN modeling on the inversed T-shaped and double stem-stepped walls,
the volumes of concrete and weights of steel bars with stirrups are obtained from the analytical
and numerical studies based on loading, stability, structural and reinforced concrete design.
The input parameters are arranged to be described by figures: Fig.4a and Fig.4b indicate
respectively the variation of volumes of concrete of wall elements (VCON in m3) and total weights
of steel bars (longitudinal bars and stirrups) (WST+STR in kgf) corresponding to internal fiction
angles (ϕ0) varying from 15
0 to 45
0 and wall heights (H) varying from 3m to 15m.
Similarly, Fig. 5a, Fig. 5b, Fig. 5c, and Fig.5d represent the variations of widths (thicknesses) at
the top (bTOP) and bottom of wall (bBOTTOM) and the variations of thicknesses of wall bases
(tBASE) and widths of footing of wall (BFOOTING) corresponding to the above-mentioned internal
friction angle intervals and various wall heights.

U. Gokkus et al./ Journal of Soft Computing in Civil Engineering 2-4 (2018) 47-61 55
Fig. 4a. Variation of the concrete volume with respect to internal friction angle and height.
Fig. 4b. Variation of the total weight of steel bars with respect to internal friction angle and height.
3 5
7 9
11 13
15 0
10
20
30
40
50
60
15 20
25 30
35 40
45
Co
ncr
ete
Vo
lum
e V
CO
N (m
3 )
Internal Friction Angle ϕ(0)
0-10 10-20 20-30 30-40 40-50 50-60
3 5
7 9
11 13
15 0
1000
2000
3000
4000
5000
6000
7000
8000
15 20 25 30
35 40
45
Tota
l Wei
ght
of
Stee
l Bar
s (K
gf )
Internal friction angle ϕ(0)
0-1000 1000-2000 2000-3000
3000-4000 4000-5000 5000-6000

56 U. Gokkus et al./ Journal of Soft Computing in Civil Engineering 2-4 (2018) 47-61
Fig. 5a. Variation of the btop with respect to internal friction angle and height.
Fig. 5b. Variation of the bbottom with respect to internal friction angle and wall height.
3 5
7 9
11 13
15 0.2
0.22
0.24
0.26
0.28
0.3
15 20 25 30
35 40
45
bto
p (
m)
Internal Friction Angle ϕ(0)
0.2-0.22 0.22-0.24 0.24-0.26
0.26-0.28 0.28-0.3
3 5
7 9
11 13
15 0.25
0.35
0.45
0.55
0.65
0.75
0.85
15 20
25 30
35 40
45
bb
ott
om
(m)
Internal Friction Angle ϕ(0)
0.25-0.35 0.35-0.45 0.45-0.55 0.55-0.65
0.65-0.75 0.75-0.85 0.85-0.9

U. Gokkus et al./ Journal of Soft Computing in Civil Engineering 2-4 (2018) 47-61 57
Fig. 5c.Variation of the thicknesses of wall bases with respect to internal friction angle and height.
Fig. 5d. Variation of the widths of wall footings with respect to internal friction angle and height.
3 5
7 9
11 13
15 0
0.2
0.4
0.6
0.8
1
1.2
1.4
15 20 25 30
35 40
45
t bas
e (
m)
Internal friction angle ϕ0
0-0.2 0.2-0.4 0.4-0.6 0.6-0.8
0.8-1 1-1.2 1.2-1.4 1.4-1.5
3 5
7 9
11 13
15 0
2
4
6
8
10
15 20 25 30
35 40
45
Bfo
oti
ng
(m)
Internal friction angle ϕ0
0-2 2-4 4-6 6-8 8-10

58 U. Gokkus et al./ Journal of Soft Computing in Civil Engineering 2-4 (2018) 47-61
5. Conclusion
Up to now, it is determined that structural analyses of cantilever (with/without shelf) and
counter-fort walls based on the specific wall sizes and specific design parameters were
performed. They do not consider the ANNs application to evaluate the outputs of such wall
analyses. After this, it is seen that there is the ANNs application thereafter, but specific
parameters are applied only to a certain size of the wall
Table. 4.
The dependent and independent variables for building the ANNs model.
This study aimed to evaluate the ANNs application of analytical and numerical findings of
inversed T-shaped and double stem-stepped walls with seven different dimensions and seven
different physical parameters. Therefore, concrete volume and amount of concrete were
calculated according to each design based on two separate models. The first ANNs model
depicted as ANN1 is constructed for the concrete volume prediction. Its results are presented in
Fig.6a and Fig.6b.
Sample Wall
Height
Int.Fric.
Angle
Concrete
Volume
Steel
Reinforcement Sample
Wall
Height
Concrete
Volume
Steel
Reinforcement
N H(m) ∅0 m
3 kg
f 25 9 30 10.84 1731
1 3 15 2.25 191.8 26 9 35 10.16 1561
2 3 20 2.19 173.5 27 9 40 9.93 1421
3 3 25 2.19 172.8 28 9 45 9.80 1312
4 3 30 2.18 158.6 29 11 15 20.34 4154
5 3 35 2.15 155.2 30 11 20 18.14 3221
6 3 40 2.12 149.2 31 11 25 17.04 2884
7 3 45 2.01 147.6 32 11 30 15.94 2469
8 5 15 4.42 602.6 33 11 35 14.84 2224
9 5 20 4.17 531.7 34 11 40 14.21 2014
10 5 25 4.02 487.5 35 11 45 14.10 1886
11 5 30 3.89 437.5 36 13 15 33.56 5030
12 5 35 3.79 427.8 37 13 20 30.95 4291
13 5 40 3.61 392.3 38 13 25 29.66 3735
14 5 45 3.52 380.1 39 13 30 28.36 3385
15 7 15 7.37 1168.0 40 13 35 27.71 3286
16 7 20 6.95 1067.0 41 13 40 27.01 3004
17 7 25 6.81 912.0 42 13 45 25.76 2772
18 7 30 6.67 902.0 43 15 15 54.18 7002
19 7 35 6.53 821.0 44 15 20 50.18 5532
20 7 40 6.21 751.0 45 15 25 46.10 4686
21 7 45 6.01 740.0 46 15 30 42.18 3844
22 9 15 12.19 2562.0 47 15 35 41.80 3598
23 9 20 11.74 2071.0 48 15 40 39.96 3249
24 9 25 11.29 1883.0 49 15 45 39.00 3088

U. Gokkus et al./ Journal of Soft Computing in Civil Engineering 2-4 (2018) 47-61 59
Fig. 6a. The ANN1 model for predicting the concrete volume) R
2=0.850.
Fig. 6b. The ANN1 model for predicting the concrete volume R
2=0.878.
The result for the ANN1 model demonstrated that, the real and predicted concrete volumes for
the training and testing periods are close to each other. Especially high deviations were observed
for the values larger than V>20 M3. The mean square error values for the traiaing and testing
periods of the ANN1 models were 17.853 M3 and 32.517 M3 for the training and testing period.
The second ANN model depicted as ANN2 model was also configured for predicting the
reinforcement amount for the retaining walls as in Fig.7a and 7b.
0
10
20
30
40
50
60
70
0 10 20 30 40 50 60
Re
al C
on
cre
te V
olu
me
(m
3)
Predicted Concrete Volume (m3) R2=0.850
0
10
20
30
40
50
60
70
80
0 10 20 30 40 50 60
Re
al C
on
cre
te V
olu
me
(m
3)
Predicted Concrete Volume (m3) R2=0.878

60 U. Gokkus et al./ Journal of Soft Computing in Civil Engineering 2-4 (2018) 47-61
Fig. 7a. The ANN model for predicting the reinforcement amount R
2=0.856.
Fig. 7b. The ANN model for predicting the reinforcement amount R
2=0.901.
For the ANN2 model the input variables were same as the ANN1 model but the output variable
was configured as the reinforcement amount in kilograms.
Two different ANN models depicted as ANN1 for predicting the concrete volume and ANN2 for
predicting the reinforcement amount were implemented for a inversed T-shaped retaining wall.
The structural and stability designs for the L shaped retaining walls were performed with regard
to the recent design methodology referenced from the block stability design and TS500 structural
design codes.
Both the ANNs models were trained with the design output data and by using the back
propagation training algorithm as generally used for ANNs training. The result demonstrated that
both models were successful in predicting the reinforcement amounts and concrete volumes for
different design configuration such as variable soil friction factors and wall heights.
0
1000
2000
3000
4000
5000
6000
7000
8000
0 1000 2000 3000 4000 5000 6000 7000 8000
Re
al R
ein
forc
em
en
t A
mo
un
t (k
g)
Predicted reinforcement amount (kg) R2=0.856
0
1000
2000
3000
4000
5000
6000
7000
0 1000 2000 3000 4000 5000 6000 7000 8000
Re
al R
ein
forc
em
en
t A
mo
un
t (k
g)
Predicted reinforcement amount (kg) R2=0.901
U. Gokkus et al./ Journal of Soft Computing in Civil Engineering 2-4 (2018) 47-61 61
This study concludes that conventional ANN implementation can be beneficial for preliminary
design of the L shaped retaining walls and propose important clues for the designer during the
final design of these structures.
References
[1] Lee, SC.,(2003), Prediction of Concrete Strength Using Artificial Neural Networks, Engineering
Structures, Vol: 25(7), pp.849-857,DOI:10.1016/S0141-0296(03)0004-X.
[2] Mansour, M.Y., Dicleli, M., Lee,J.Y., Zhang,J., (2004), Predicting the Shear Strength of
Reinforced Concrete Beams Using Artificial Neural Networks, Engineering Structures, Vol: 26(6),
pp:781-799.
[3] Chethan,V.R.,Sri RamaRao,T.A., Keerthi, G.B.S., (2012), Optimization of Counterfort Retaining
Wall Using Artificial Neural Network, National Conference on Contemporary Civil Engineering
Research and Practices – CCERP, April 20-21 2012, pp.1-8.
[4] Shehata, H.F., (2016), Retaining walls with relief shelves, Innovative Infrastructure. Solutions,
Vol:1/4, Springer.
[5] Chougule, A.C., Patankar, J.P., Chougule, P.A.,(2017), Effective Use of Shelves in Cantilever
Retaining Walls, International Research Journal of Engineering and Technology (IRJET) e-ISSN:
2395 -0056 Volume: 04 Issue: 07 (July 2017), p.2635.
[6] Alias, R., Kasa,A.,Taha,M.R, (2015), Artificial neural networks approach for predicting the
stability of cantilever RC retaining walls, International Journal of Applied Engineering Research,
Vol: 10(10), pp:26005-26014.
[7] Patil, S.S. and Bagban, A.A.R., (2015), Analysis and Design of Stepped Cantilever Retaining Wall,
International Journal of Engineering Research & Technology (IJERT), Vol. 4, Issue 02
[8] Gokkus,U., Yildirim, M.S., Yılmazoglu, A., (2018), Comparison of Footing Widths of
Proportionally-Sized Reinforced Concrete Retaining Walls under Extreme Loading, SSRG
International Journal of Civil Engineering (SSRG-IJCE) – Volume 5 Issue 1– January 2018 , ISSN:
2348 – 8352.
[9] Turkish Specification for Buildings to be Built in Seismic Zones (2007), Ministry of Public Works
and Settlement, Government of Republic of Turkey, Ankara.
[10] EUROCODE-8 (EUROPEAN PRE-STANDARD), (1994). "Design Provisions for Earthquake
Resistance of Structures- Part 5: Foundations, Retaining Structures and Geotechnical Aspects”, The
Commisssion of the European Communities.
[11] TS500, TURKISH STANDARD, (2000), Requirements for Design and Construction of Reinforced
Concrete Structures, Institute of Turkish Standard, Ankara.
[12] Manjunath, K., Gowda. B.S.K., Prasad, E.,(2012), Optimization of Cantilever Earth Wall Using
Artificial Neural Network, Proceedings of National Conference on Innovations in Civil
Engineering, April 19-20, 2012, Paper No T118.
[13] EUROCODE-8 EN (2011), Seismic Design of Buildings Worked examples, Ed. B. Acun, A.
Athanasopoulou, A. Pinto E. Carvalho, M. Fardis, European Commission Joint Research Centre,
Lisbon.