Embed Size (px)
Citation preview
University of Denver University of Denver
Digital Commons @ DU Digital Commons @ DU
Electronic Theses and Dissertations Graduate Studies
1-1-2018
Predictive Modeling of Hip Dislocation: Assessment of Surgical Predictive Modeling of Hip Dislocation: Assessment of Surgical
and Patient Factors to Reduce the Occurrence of Hip Instability and Patient Factors to Reduce the Occurrence of Hip Instability
and Adverse Clinical Outcomes and Adverse Clinical Outcomes
Daniel N. Huff University of Denver
Follow this and additional works at: https://digitalcommons.du.edu/etd
Part of the Biomechanics Commons, and the Biomechanics and Biotransport Commons
Recommended Citation Recommended Citation Huff, Daniel N., "Predictive Modeling of Hip Dislocation: Assessment of Surgical and Patient Factors to Reduce the Occurrence of Hip Instability and Adverse Clinical Outcomes" (2018). Electronic Theses and Dissertations. 1411. https://digitalcommons.du.edu/etd/1411
This Dissertation is brought to you for free and open access by the Graduate Studies at Digital Commons @ DU. It has been accepted for inclusion in Electronic Theses and Dissertations by an authorized administrator of Digital Commons @ DU. For more information, please contact [email protected],[email protected].

Predictive Modeling of Hip Dislocation: Assessment of Surgical and Patient Factors to
Reduce the Occurrence of Hip Instability and Adverse Clinical Outcomes
__________
A Dissertation
Presented to
the Faculty of the Daniel Felix Ritchie School of Engineering and Computer Science
University of Denver
__________
In Partial Fulfillment
of the Requirements for the Degree
Doctor of Philosophy
__________
by
Daniel N. Huff
March 2018
Advisor: Paul J. Rullkoetter

©Copyright by Daniel N. Huff 2018
All Rights Reserved

Author: Daniel N. Huff Title: Predictive Modeling of Hip Dislocation: Assessment of Surgical and Patient Factors to Reduce the Occurrence of Hip Instability and Adverse Clinical Outcomes Advisor: Paul J. Rullkoetter Degree Date: March 2018
Abstract
Instability and dislocation remain leading indications for revision of primary Total
Hip Arthroplasty (THA). Many studies have addressed the links between implant design
and propensity for dislocation, however a comprehensive review of the ability of modern
THA constructs to protect against joint instability is needed.
Accordingly, the objective of this study is to provide objective data about THA
risks to be considered in the treatment algorithm to protect against adverse joint loading
conditions and joint instability. Adverse loading conditions were assessed in a
population of activities of daily living using data from telemetric hip implant
representation in an FE simulation which included probabilistic representation of clinical
implant position variation. Separately, dislocation was assessed using a series of
strength-calibrated joint contact and muscle forces for a variety of THA implant designs
in subject-specific musculoskeletal models of patients performing activities consistent
with posterior and anterior THA dislocation. The resistive moment at the point of
dislocation, as well as the overall dislocation rate per construct, provide relevant
measures of resistance of the THA construct to dislocation.
Based on a range of acetabular implant alignments reported clinically, variation in
cup anteversion/retroversion had the largest impact on liner peak loading location of any
degree of freedom throughout the prescribed activities. Cup inclination also showed a
ii
relationship to response liner loading; stem variation in either longitudinal plane was not
strongly correlated to edge loading propensity across activities.
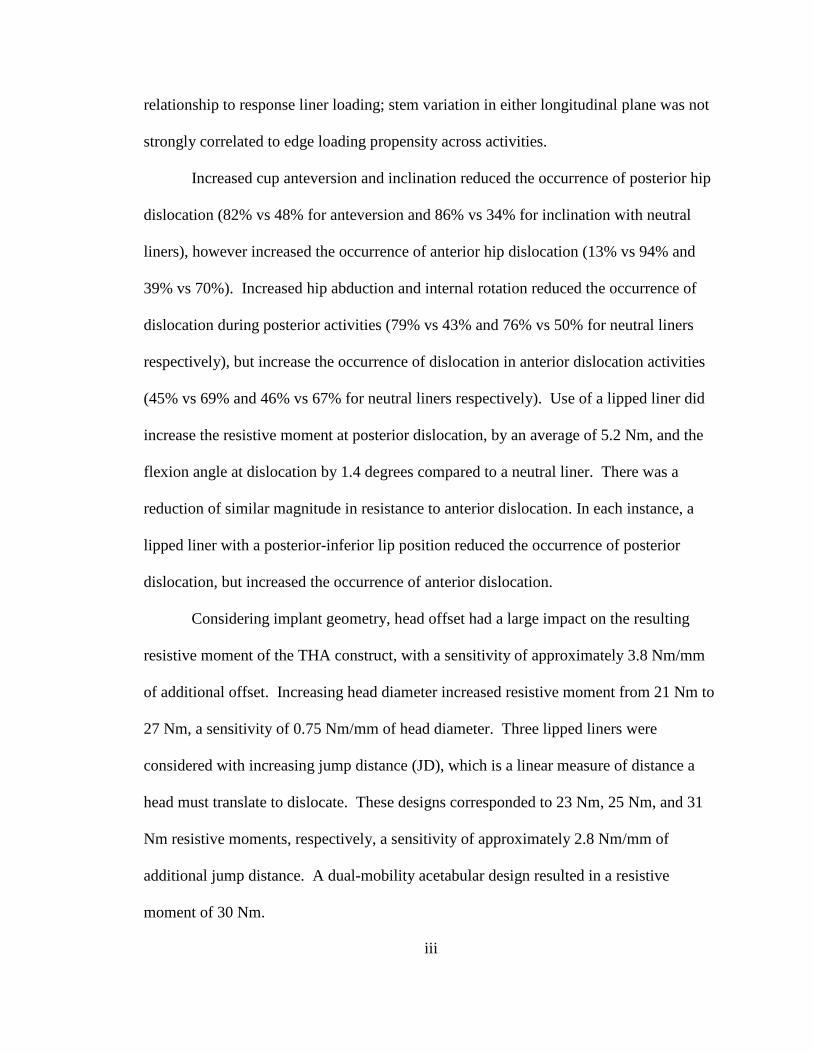
Increased cup anteversion and inclination reduced the occurrence of posterior hip
dislocation (82% vs 48% for anteversion and 86% vs 34% for inclination with neutral
liners), however increased the occurrence of anterior hip dislocation (13% vs 94% and
39% vs 70%). Increased hip abduction and internal rotation reduced the occurrence of
dislocation during posterior activities (79% vs 43% and 76% vs 50% for neutral liners
respectively), but increase the occurrence of dislocation in anterior dislocation activities
(45% vs 69% and 46% vs 67% for neutral liners respectively). Use of a lipped liner did
increase the resistive moment at posterior dislocation, by an average of 5.2 Nm, and the
flexion angle at dislocation by 1.4 degrees compared to a neutral liner. There was a
reduction of similar magnitude in resistance to anterior dislocation. In each instance, a
lipped liner with a posterior-inferior lip position reduced the occurrence of posterior
dislocation, but increased the occurrence of anterior dislocation.
Considering implant geometry, head offset had a large impact on the resulting
resistive moment of the THA construct, with a sensitivity of approximately 3.8 Nm/mm
of additional offset. Increasing head diameter increased resistive moment from 21 Nm to
27 Nm, a sensitivity of 0.75 Nm/mm of head diameter. Three lipped liners were
considered with increasing jump distance (JD), which is a linear measure of distance a
head must translate to dislocate. These designs corresponded to 23 Nm, 25 Nm, and 31
Nm resistive moments, respectively, a sensitivity of approximately 2.8 Nm/mm of
additional jump distance. A dual-mobility acetabular design resulted in a resistive
moment of 30 Nm.
iii
Tradeoffs between acetabular component position, design, and patient activity and
the relative clinical risk of adverse implant loading as well as anterior and posterior
dislocation must be considered and weighted accordingly. A quantitative understanding
of tradeoffs in the dislocation risk inherent to THA construct options is valuable in
supporting surgical decision making. Computer modeling provides a framework for
meaningful design assessments which can be transferred and have meaningful input to
clinical practice.
iv
Table of Contents
Chapter One: Introduction .................................................................................................. 1 1.1 Adverse Edge Loading in Total Hip Arthroplasty ............................................ 1 1.2 Hip Joint Dislocation Following THA .............................................................. 5
Chapter Two: Method ......................................................................................................... 9 2.1 Adverse Edge Loading of the THA Construct .................................................. 9
2.1.1 Patient Activity and Kinematics ........................................................ 9 2.1.2 Finite Element Modeling ................................................................. 10 2.1.3 Polyethylene Material ...................................................................... 12 2.1.4 Probabilistic Finite Element Analyses ............................................. 13 2.1.5 Data Analysis ................................................................................... 16
2.2 Hip Instability and Dislocation Following THA: Understanding Variation in Surgical Component Alignment and Patient Kinematics ..................................... 17
2.2.1 In vivo patient measurement ............................................................ 17 2.2.2 Musculoskeletal modeling ............................................................... 19 2.2.3 Finite element modeling of impingement-based dislocations ......... 20 2.2.4 Capsular representation .................................................................... 20 2.2.4 Simulation of THA dislocation ........................................................ 22
2.3 Hip Instability and Dislocation Following THA: Dislocation Propensity Considering THA Component Geometry ............................................................. 26
Chapter Three: Results ...................................................................................................... 28 3.1 Adverse Edge Loading Conditions ................................................................. 28 3.2 Dislocation Associated with Surgical and Kinematic Variability .................. 36 3.3 Dislocation Propensity Considering THA Construct Geometry ..................... 40
Chapter Four: Discussion .................................................................................................. 45 4.1 Edge Loading in Total Hip Arthroplasty ........................................................ 45 4.2 Dislocation vs Surgical Alignment and Kinematics ....................................... 49 4.3 Dislocation per THA Construct ...................................................................... 52
Chapter Five: Summary .................................................................................................... 54
References ......................................................................................................................... 57
v
List of Figures Figure 1.1: Alignment variables of the acetabular THA component (Left) and femoral THA component (Right) ..................................................................................................... 3 Figure 2.1: FE representation of THA construct in pelvis and femur ............................. 11 Figure 2.2: Comparison of deformable and rigid with pressure-overclosure polyethylene liner representations, including force-displacement (left) and force-area (right) relationships. ..................................................................................................................... 13 Figure 2.3: (Left) The range of cup alignments that were analyzed from clinical positions reported by Rathod et al. (Right) The range of stem alignments that were analyzed from clinical positions reported by Tsai et al. ........................................................................... 15 Figure 2.4: Representative view of degree of edge loading as results are presented. 0% edge loading represents peak contact loading directly at the dome of the liner, while 100% edge loading represents peak contact loading at the equator of the liner ............... 16 Figure 2.5. Patient data collection during posterior (top left) and anterior (top right) dislocation-related activities, with musculoskeletal model representation, estimated joint reaction loads, and measured hip kinematics during the activities. Black line indicates ‘worst-case’ positioning and load used as a starting point in dislocation models. ........... 18 Figure 2.6: Illustration of the soft tissue structures making up the hip capsule representation. Each structure is composed of a fiber-reinforced membrane, represented by 2D quadrilateral elements embedded with tension-only non-linear springs ................ 21 Figure 2.7: Neutral and Lipped hip acetabular implant constructs .................................. 22 Figure 2.8: The range of cup alignments that were analyzed from clinical positions reported by Rathod et al. ................................................................................................... 24 Figure 2.9. Anterior (Top) and Posterior (Bottom) dislocation activities from worst-case positions observed during in vivo patient measurement (Left) to dislocation positions (Right). .............................................................................................................................. 25 Figure 3.1: Collation of activity kinematics by category show bounds associated with each activity type .............................................................................................................. 28 Figure 3.2: Magnitude and direction of joint reaction force loading for each activity classification. X is medial/lateral loading, Y is Anterior/Posterior loading, Z is Superior/Inferior loading .................................................................................................. 30 Figure 3.3: Overall probability of the peak edge loading per activity category corresponding to the categorical kinematic flexion magnitude and variation .................. 31 Figure 3.4: Peak edge load values for each activity classification corresponding to neutral implant positioning ........................................................................................................... 32 Figure 3.5: Edge loading response to alignment and kinematic categories ...................... 33 Figure 3.6: Representative data for the gait activity illustrates the impact of both Stem Varus/Valgus and Cup Version on the location of peak liner loading ............................. 35 Figure 3.7. Resistive moment at dislocation as a function of dislocation angle. Posterior Dislocation (Top), Anterior Dislocation (Bottom). Neutral Liners (Left, in Blue), Lipped Liners (Right, in Red). ...................................................................................................... 36
vi
Figure 3.8. Effect of cup version and inclination on posterior (top) and anterior (bottom) dislocation rates for cohort quartiles with both neutral and lipped liners. ........................ 38 Figure 3.9. Effect of kinematics on posterior (left) and anterior (right) dislocation rate. 40 Figure 3.10: Resistive moment versus flexion angle for each component considered. Blue dots indicate point of dislocation. Bar plot comparing resistive moment at point of dislocation with black line indicating resistive moment for neutral components ............. 42 Figure 3.11: Plot of energy of dislocation for each liner style .......................................... 44 Figure 4.1: Representative contact location in flexion for a non-anteverted cup compared with an anteverted cup in a flexed hip .............................................................................. 46 Figure 4.2: Change in response edge loading from -1 standard deviation to +1 standard deviation of clinical occurrence rate of both loading and alignment. ............................... 47
vii
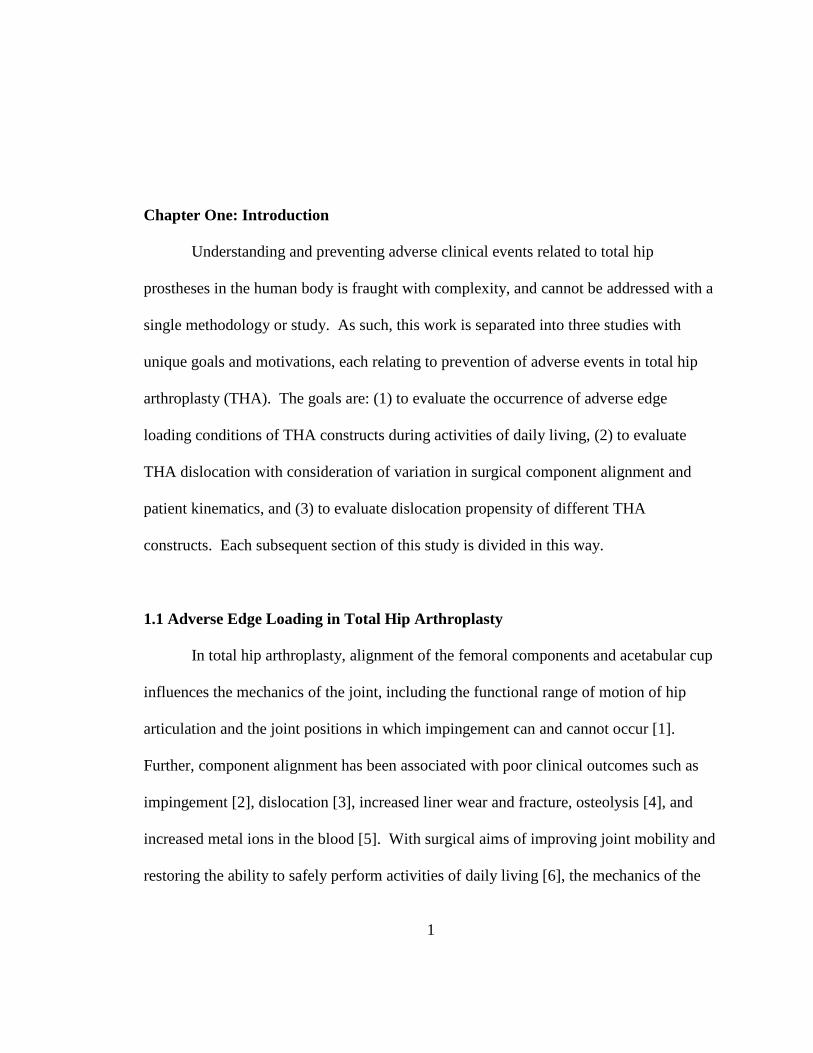
Chapter One: Introduction
Understanding and preventing adverse clinical events related to total hip
prostheses in the human body is fraught with complexity, and cannot be addressed with a
single methodology or study. As such, this work is separated into three studies with
unique goals and motivations, each relating to prevention of adverse events in total hip
arthroplasty (THA). The goals are: (1) to evaluate the occurrence of adverse edge
loading conditions of THA constructs during activities of daily living, (2) to evaluate
THA dislocation with consideration of variation in surgical component alignment and
patient kinematics, and (3) to evaluate dislocation propensity of different THA
constructs. Each subsequent section of this study is divided in this way.
1.1 Adverse Edge Loading in Total Hip Arthroplasty
In total hip arthroplasty, alignment of the femoral components and acetabular cup
influences the mechanics of the joint, including the functional range of motion of hip
articulation and the joint positions in which impingement can and cannot occur [1].
Further, component alignment has been associated with poor clinical outcomes such as
impingement [2], dislocation [3], increased liner wear and fracture, osteolysis [4], and
increased metal ions in the blood [5]. With surgical aims of improving joint mobility and
restoring the ability to safely perform activities of daily living [6], the mechanics of the
1
joint are a critical consideration, with many studies assessing the effects of component
alignment on range of motion and the likelihood of impingement [7]. Component
alignment also directly affects the degree to which edge loading of the acetabular liner
occurs [8], or loading in which peak contact pressure occurs towards the equator of the
acetabular liner, but the degree of sensitivity including significant variation in patient
activity has not been previously quantified in a cohort of patient activities.
Native hip anatomy following THA is typically not fully restored compared to the
contralateral hip [9]. THA component alignment angles of interest in this study are shown
in figure 1.1.
2
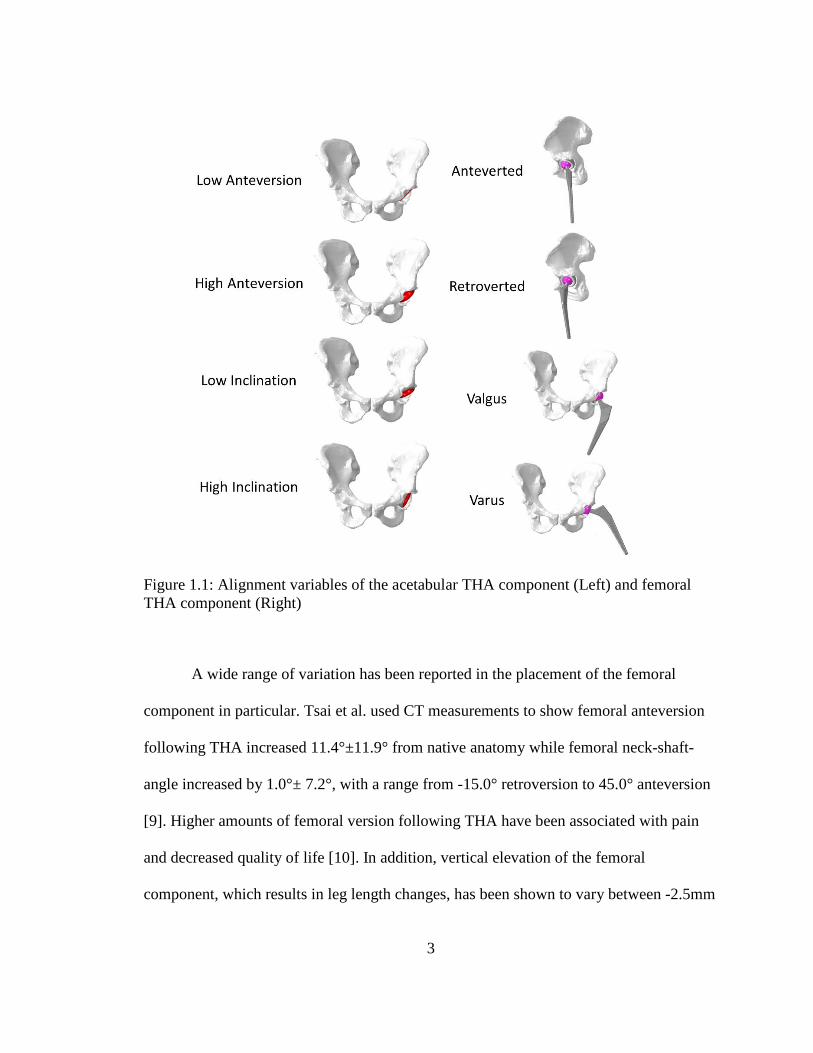
Figure 1.1: Alignment variables of the acetabular THA component (Left) and femoral THA component (Right)
A wide range of variation has been reported in the placement of the femoral
component in particular. Tsai et al. used CT measurements to show femoral anteversion
following THA increased 11.4°±11.9° from native anatomy while femoral neck-shaft-
angle increased by 1.0°± 7.2°, with a range from -15.0° retroversion to 45.0° anteversion
[9]. Higher amounts of femoral version following THA have been associated with pain
and decreased quality of life [10]. In addition, vertical elevation of the femoral
component, which results in leg length changes, has been shown to vary between -2.5mm
3
to 12.6 mm relative to the contralateral side [9]. Placement of the acetabular component
has shown smaller amounts of variability in comparison to the femoral component, but
cup placement has a direct influence on the location of the center of rotation of the hip
and can also result in leg length changes. Cup position variability has been shown to be
similar in each degree of freedom and can vary by up to approximately ±10 mm [9].
Recently, computer-aided surgery systems that improve the placement of the cup relative
to native hip geometry have become available for use during THA [11]. However, these
systems have not been widely adopted because they can add considerably to both cost
and time of the surgery.
The influence of variation in component position on peak acetabular contact
stresses can be assessed non-invasively with the use of probabilistic finite element (FE)
simulations. A large amount of openly disseminated telemetric hip joint reaction force
loading data makes it possible to address variation of component position across multiple
patients and activities [12]. By perturbing component positions within the ranges
published from clinical assessments, variation in joint loading position can be evaluated
in a large range of telemetric implant-informed loading conditions. Implant loading
trends and sensitivities with respect to component placement angles and activity types
can then serve as a risk assessment which offers valuable insight to clinicians and
researchers studying mechanical loading of total hip components for the purposes of
tribological assessment, fatigue considerations, or loading associated with taper
corrosion.
4
Finite element modeling has been previously used to assess how variation in knee
prosthesis component design, surgical technique, and component alignment affect
loading patterns of the tibiofemoral and patellofemoral joint mechanics [13]. However,
the extent of the impact of positioning THA components on hip joint loading patterns
during daily activities is less understood. Quantifying the tradeoffs that exist in joint
mechanics and routine daily loading when altering component placement for a patient
population can support surgical practice in considerations of bone quality, fixation, pelvic
morphology, or joint stability. Accordingly, the objectives of this portion of the study
were to 1) assess the impact of component alignment on hip joint contact loading patterns
during tasks of daily living and 2) to identify which alignment and loading parameters
have the greatest associated risks of adverse edge loading.
1.2 Hip Joint Dislocation Following THA
Dislocation following THA can be a frequent and serious problem that requires
thorough evaluation and preoperative planning before surgical intervention. In the
United States, instability/dislocation is the most common indication for revision THA,
accounting for 22.5% of revisions [14]. Hip dislocation often happens early, with 60%
occurring within the first 5 week postoperatively [15]. As a result, hip dislocation has
been shown to account for 32.4% of all hospital readmissions within 90 days in a cohort
of primary and revision THA patients [16]. Further, in-hospital post-operative
dislocation is considered a non-reimbursable “Never Event” by the Center for Medicare
and Medicaid services [17].
5
Several risk factors for dislocation have been identified, such as implant
orientation, surgical technique (both approach and surgical experience), sex, femoral
neck fracture as indication, American Society of Anesthesiologists classification,
rheumatoid arthritis, and neuromuscular disease [18,19].
Further, improvements in posterior soft-tissue repair after primary THA along
with variation in implant design have received more attention as possible mechanisms to
reduce dislocations [20]. One study with 1,515 patients showed a dislocation rate for
patients receiving a posterior capsulectomy was 4.8% and those with posterior capsular
repair was 0.7% [21]. Another study with 500 patients showed a dislocation rate of 2.8%
for the capsulectomy cohort and 0.6% dislocation rate for the capsular repair cohort [22].
Corroborating clinical results, in vitro experimental studies have shown significantly
higher torque required to dislocate a THA construct in cadaveric specimen when the
capsule is not compromised and fully repaired [23,24]. It is noted that proper capsular
repair increased construct stability substantially, but that suture sites were often at risk of
failure [24].
Other surgical factors aside from capsular repair may also influence joint stability.
Cup anteversion and leg shortening have shown to be factors, presumably because of
posterior femoral head coverage and soft tissue tensioning, respectively [25]. Geier et al.
showed that increasing femoral offset, and hence tensioning of structures surrounding the
hip, resulted in increased resisting torque and associated greater joint stability [26]. The
surgical approach used by the clinician, with reported rates of dislocation at 10 years of
6
3.1% for anterolateral approach, 3.4% for transtrochanteric approach, and 6.9% for
posterolateral approach [27].
Variations in implant design and configuration have a clear influence on
dislocation propensity. As an example, femoral head size has impacted dislocation rates
using the posterolateral approach at 12.1%, 6.9%, and 3.8% for 22mm, 28mm, and 32mm
diameter femoral heads, respectively [27]. Howie et al. demonstrated a reduction in
dislocation rate from 4.4% with a 28mm head to 0.8% with a 36mm head in primary
THA, and a reduction from 5.4% to 1.3% in both primary and revision THA procedures
[28]. Increasing femoral head diameter as well as using an acetabular component with a
well-positioned elevated rim increase the jump distance (distance the femoral head must
travel to dislocate), resulting in an inherently more stable construct. During the act of
dislocation, the dislocating joint must oppose the remaining hip capsule and active
muscular hip constraints acting to keep the hip intact, resulting in a torque associated
with the activity that can be measured experimentally as a measure of dislocation
resistance. Geier et al. showed that larger head offset (and jump distance) resulted in
increasing resisting torques by these structures [26].
Computational models can be used to understand the importance of variation in
implant design, surgical placement, and patient factors on relative risk of dislocation.
Elkins et al. used such models to underscore the importance of retention or repair of
capsular structures during THA; creating a parametric model used to study the effect of
progressive capsular excision on joint stability following THA [24]. Bunn et al. used
subject-specific models to study the effect of femoral head diameter on the risk for
7

dislocation [29]. The objective of the dislocation assessment in the current study was to
use a computational model to quantitatively describe and compare how variation in THA
geometry and implantation alignment contribute to joint stability and the capsular
resistance to anterior and posterior dislocation.
8
Chapter Two: Method
Understanding and preventing adverse clinical events related to prostheses in the
human body is complex. As such, the goals of this study are threefold: (1) to evaluate the
occurrence of adverse edge loading conditions of THA constructs during activities of
daily living, (2) to evaluate THA dislocation with consideration of variation in surgical
component alignment and patient kinematics, and (3) to evaluate dislocation propensity
of different THA constructs. The methods associated with such goals are also threefold.
They are common in their FE representation of physiological and clinical hip replacement
situations, but are unique in their structure and application of FE methods to best query
the cause of clinical adversity of interest.
2.1 Adverse Edge Loading of the THA Construct
2.1.1 Patient Activity and Kinematics
THA patient activities from the publically-available Orthoload database were
screened for those with kinematics of the hip substantially defined in the sagittal plane
[12]. Activities were chosen in which the view of the camera is sufficient to take
measurements associated with hip flexion and extension, as synchronized kinematic data
was not recorded experimentally. 203 activities were identified which were generally
classified as gait activities, erect standing with active range of motion activities, seated
9

activities, stairclimb activities, and stumbling activities. For each of the 203 activities,
hip joint reaction force data and a video associated with the activity was downloaded
from the Orthoload site.
A custom Matlab (Mathworks, Natick, MA) script was created to manually
extract hip kinematics from each activity video. Hip flexion was measured at several
intervals of each activity by identifying the two dimensional coordinates describing the
position of the trunk, hip, and knee to calculate the hip angle. The starting time and
ending time of the activity were marked along with each increment of time, so that each
measured angle can be correlated with an increment of time within the total length of the
video. Kinematic data and corresponding joint reaction force (JRF) data of each activity
were then resampled to a common time increment and duration. This data was then
formatted to be written as input boundary conditions for finite element modeling in
Abaqus (Simulia, Providence, RI).
Five trials for each activity (gait, erect standing, seated, and stairclimb) for a total
of 20 activities represented variation in patient activity for this study.
2.1.2 Finite Element Modeling
Finite element representation of the implanted THA construct developed in
Abaqus consisted of representation of the resected femur and pelvis involved in the hip
joint shown in Figure 2.1. The femur, pelvis, femoral stem and head, and acetabular shell
were represented by rigid tetrahedral elements. General contact was defined between the
acetabular and femoral components with a coefficient of friction of 0.04. Components of
10
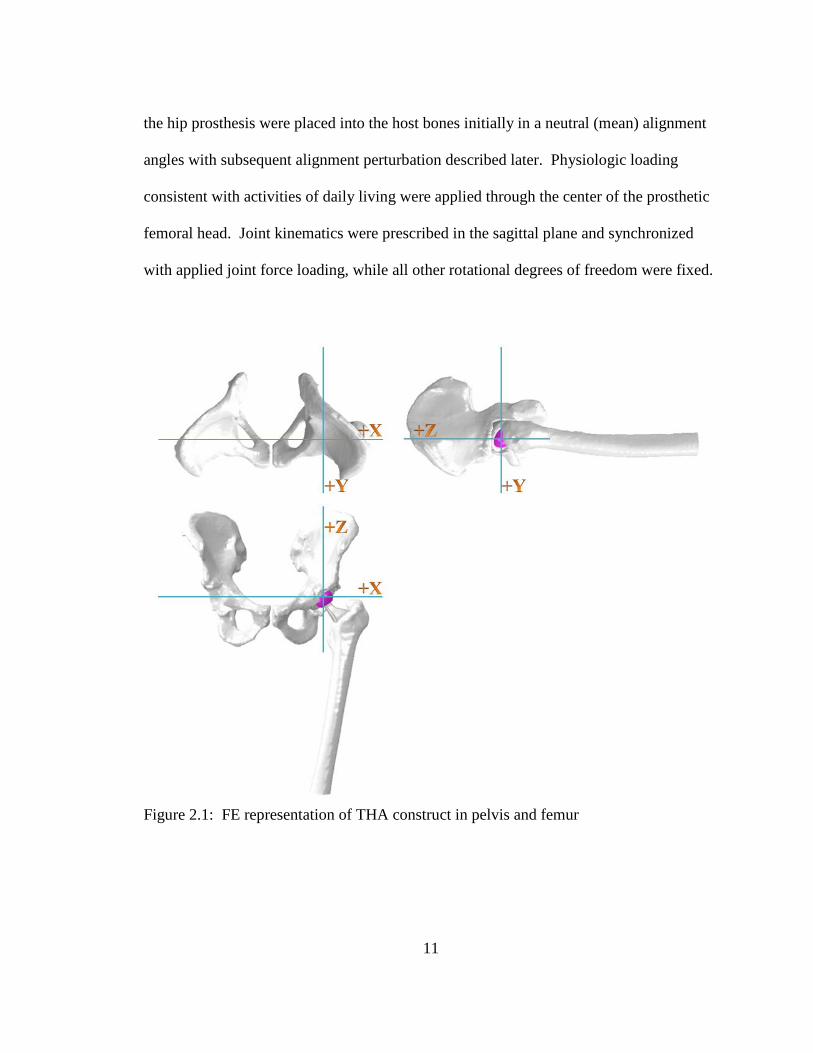
the hip prosthesis were placed into the host bones initially in a neutral (mean) alignment
angles with subsequent alignment perturbation described later. Physiologic loading
consistent with activities of daily living were applied through the center of the prosthetic
femoral head. Joint kinematics were prescribed in the sagittal plane and synchronized
with applied joint force loading, while all other rotational degrees of freedom were fixed.
Figure 2.1: FE representation of THA construct in pelvis and femur
11

2.1.3 Polyethylene Material
To improve efficiency of predictions of liner contact mechanics for all current
models, head-liner contact was modeled as rigid-rigid with a calibrated pressure-
overclosure relationship based on material testing data of the polyethylene of interest. A
ramp test was simulated using a deformable liner composed of hexahedral elements with
material properties for initial modulus and true stress-strain derived from experimental
data. The liner was fixed and a spherical head (represented as an analytical surface) was
brought into contact with a ramped loading to 6000N. The resulting peak contact
pressure, force-displacement, and contact area from the deformable model were used to
calibrate the pressure-overclosure relationship of the same simulation run with rigid-rigid
contact (Figure 2.2). Results compared well for each variable considered. At the point of
peak contact pressure, the rigid model was within 0.5 MPa (Deformable: 15.7 MPa;
Rigid: 15.3 MPa). The Root Mean Square (RMS) error in force displacement was
0.035mm and 44.2 mm2 in contact area. This was below 5% error for all three variables,
with a time savings of approximately 90%.
12
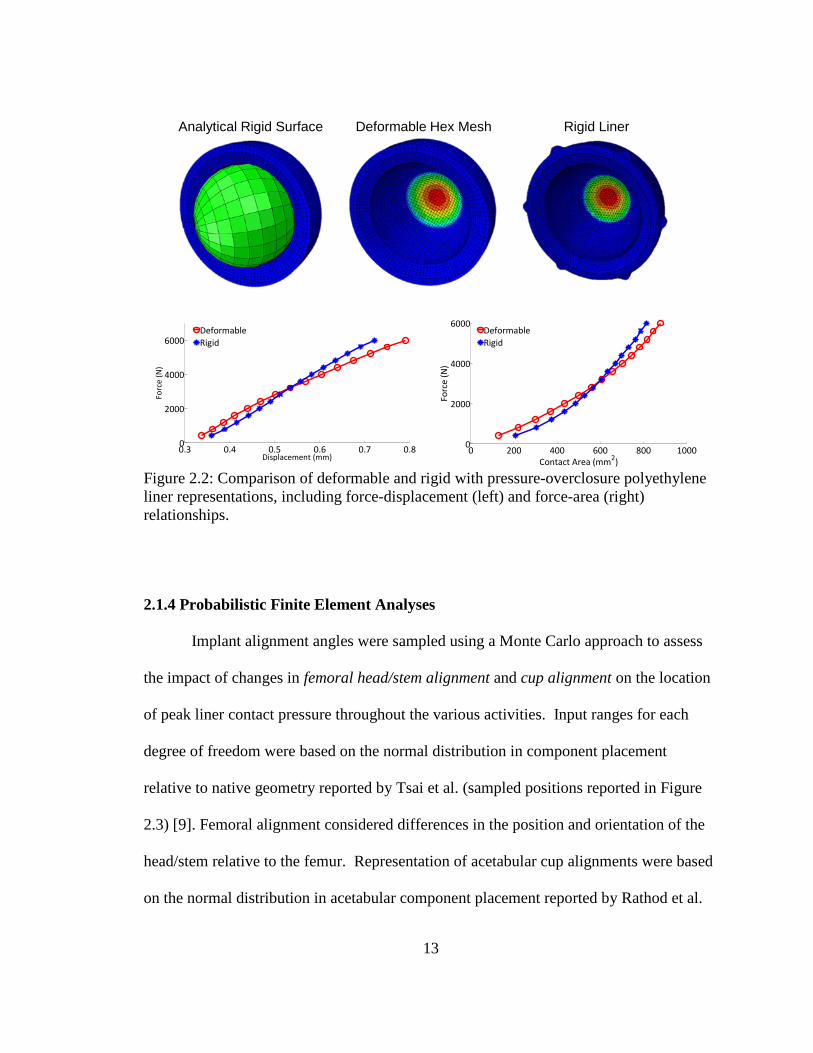
Figure 2.2: Comparison of deformable and rigid with pressure-overclosure polyethylene liner representations, including force-displacement (left) and force-area (right) relationships.
2.1.4 Probabilistic Finite Element Analyses
Implant alignment angles were sampled using a Monte Carlo approach to assess
the impact of changes in femoral head/stem alignment and cup alignment on the location
of peak liner contact pressure throughout the various activities. Input ranges for each
degree of freedom were based on the normal distribution in component placement
relative to native geometry reported by Tsai et al. (sampled positions reported in Figure
2.3) [9]. Femoral alignment considered differences in the position and orientation of the
head/stem relative to the femur. Representation of acetabular cup alignments were based
on the normal distribution in acetabular component placement reported by Rathod et al.
0.3 0.4 0.5 0.6 0.7 0.80
2000
4000
6000
Displacement (mm)
Forc
e (N
)
DeformableRigid
0 200 400 600 800 10000
2000
4000
6000
Contact Area (mm2)
Forc
e (N
)
DeformableRigid
Analytical Rigid Surface Deformable Hex Mesh Rigid Liner
13

(sampled positions shown in Figure 2.3) [30]. Consistent with Monte Carlo sampling, the
highest density of sampled positions is near the mean angles, with variation in each DOF
consistent with reported standard deviations. 150 simulations were complete to capture
variation associated with 20 Orthoload ADLs and variation in sampled implant positions.
14
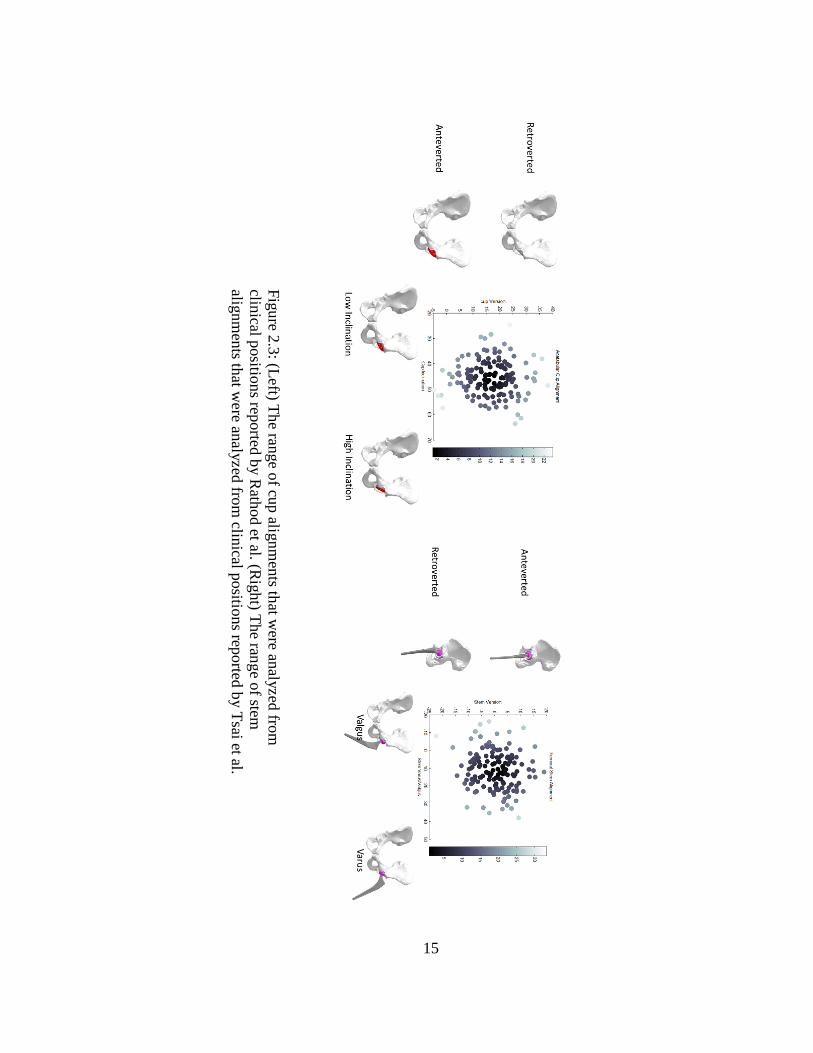
Figure 2.3: (Left) The range of cup alignments that w
ere analyzed from
clinical positions reported by Rathod et al. (R
ight) The range of stem
alignments that w
ere analyzed from clinical positions reported by Tsai et al.
15
2.1.5 Data Analysis
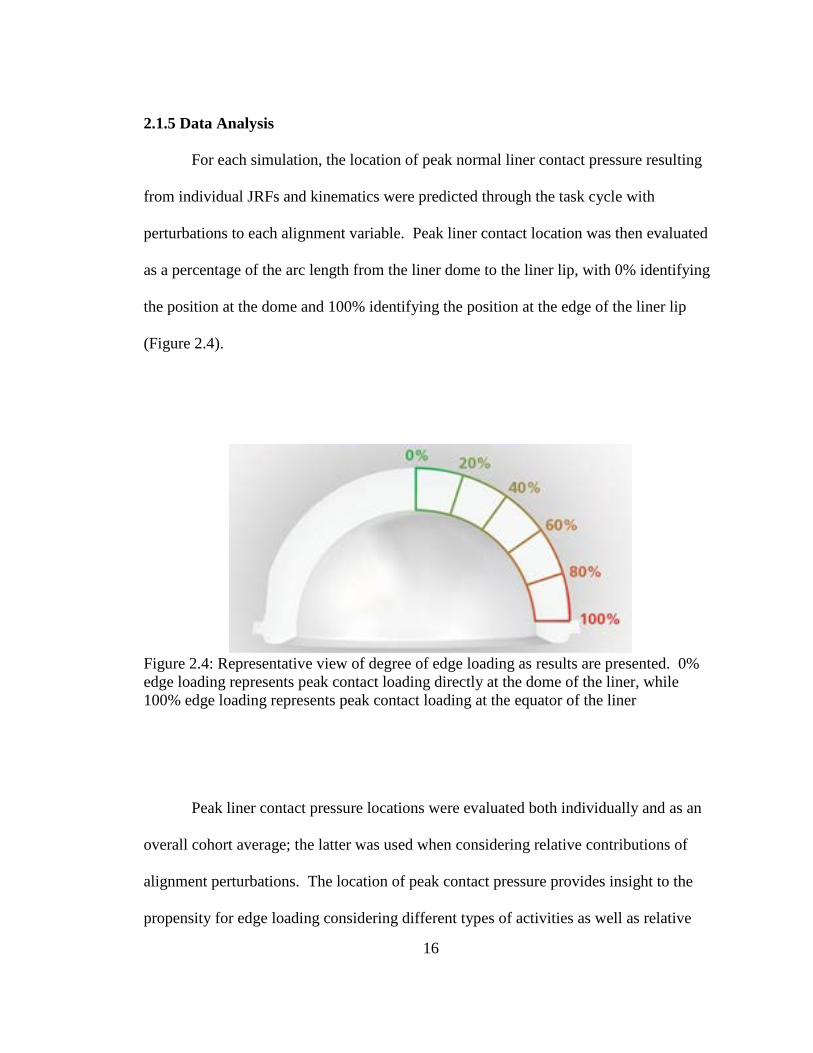
For each simulation, the location of peak normal liner contact pressure resulting
from individual JRFs and kinematics were predicted through the task cycle with
perturbations to each alignment variable. Peak liner contact location was then evaluated
as a percentage of the arc length from the liner dome to the liner lip, with 0% identifying
the position at the dome and 100% identifying the position at the edge of the liner lip
(Figure 2.4).
Figure 2.4: Representative view of degree of edge loading as results are presented. 0% edge loading represents peak contact loading directly at the dome of the liner, while 100% edge loading represents peak contact loading at the equator of the liner
Peak liner contact pressure locations were evaluated both individually and as an
overall cohort average; the latter was used when considering relative contributions of
alignment perturbations. The location of peak contact pressure provides insight to the
propensity for edge loading considering different types of activities as well as relative
16
risk and sensitivity to prosthesis alignment in several planes. Sensitivity relationships
between edge loading and component alignment were quantified through regression
analysis of the data, with slope and correlation coefficient reported for each alignment
and loading parameter.
2.2 Hip Instability and Dislocation Following THA: Understanding Variation in
Surgical Component Alignment and Patient Kinematics
2.2.1 In vivo patient measurement
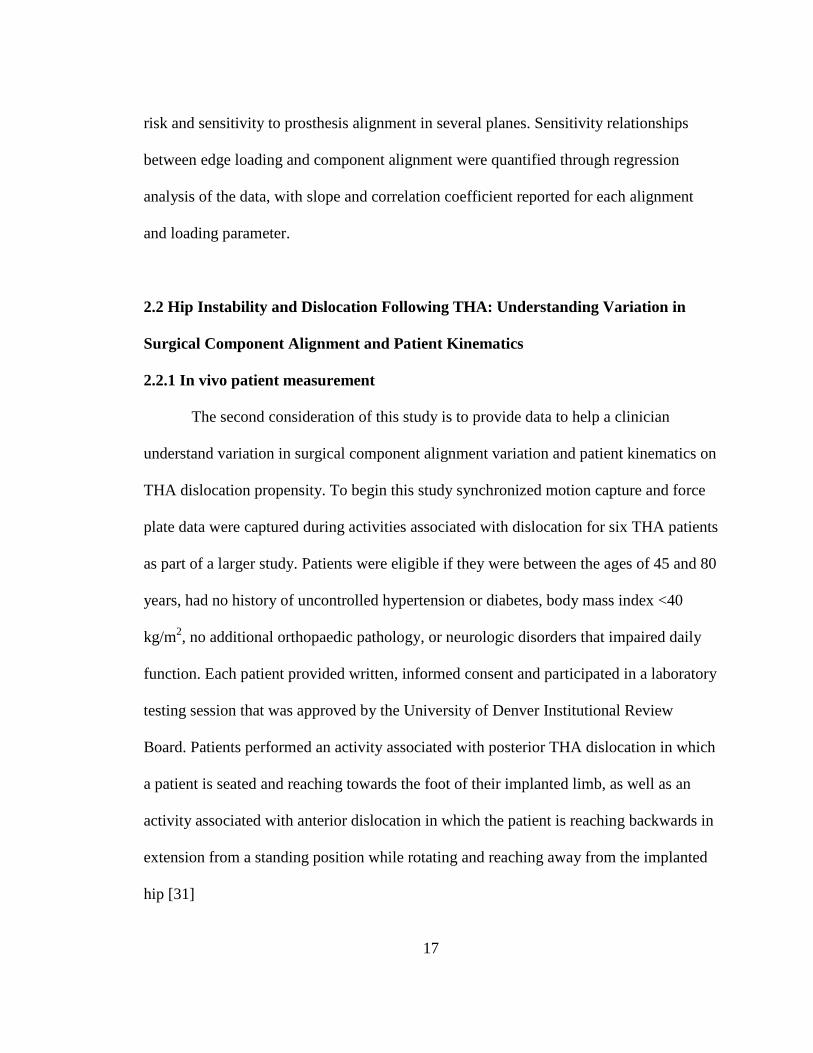
The second consideration of this study is to provide data to help a clinician
understand variation in surgical component alignment variation and patient kinematics on
THA dislocation propensity. To begin this study synchronized motion capture and force
plate data were captured during activities associated with dislocation for six THA patients
as part of a larger study. Patients were eligible if they were between the ages of 45 and 80
years, had no history of uncontrolled hypertension or diabetes, body mass index <40
kg/m2, no additional orthopaedic pathology, or neurologic disorders that impaired daily
function. Each patient provided written, informed consent and participated in a laboratory
testing session that was approved by the University of Denver Institutional Review
Board. Patients performed an activity associated with posterior THA dislocation in which
a patient is seated and reaching towards the foot of their implanted limb, as well as an
activity associated with anterior dislocation in which the patient is reaching backwards in
extension from a standing position while rotating and reaching away from the implanted
hip [31]
17
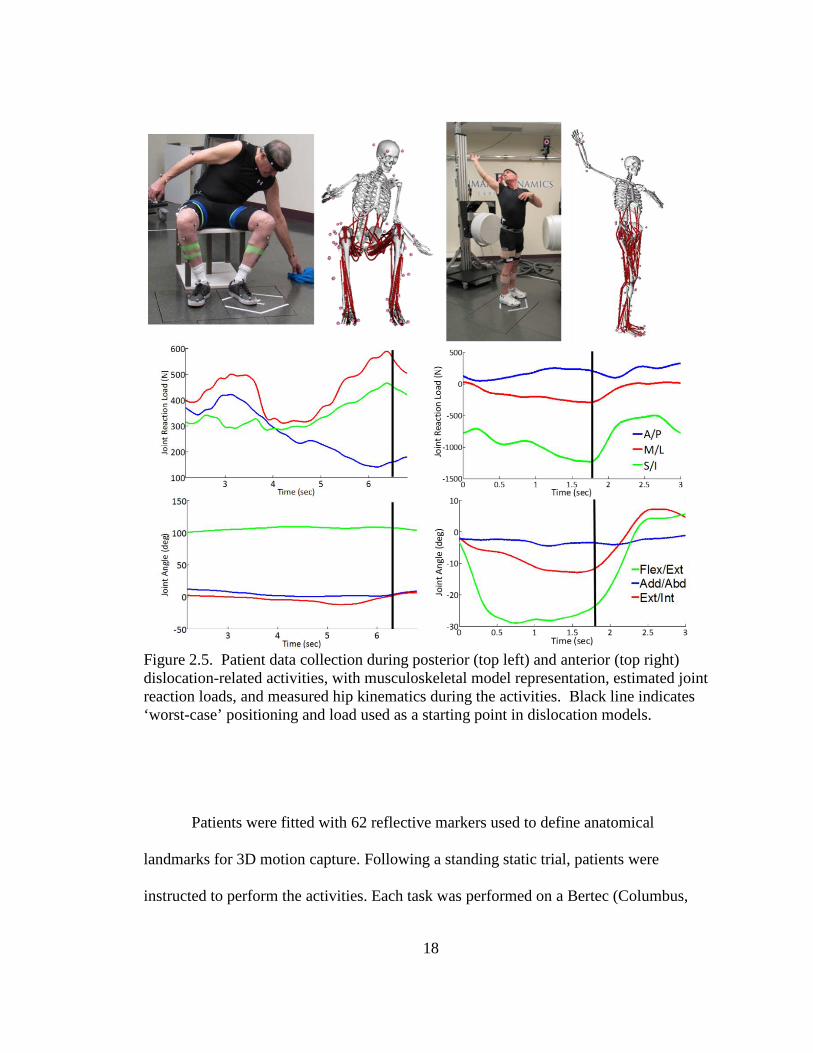
Figure 2.5. Patient data collection during posterior (top left) and anterior (top right) dislocation-related activities, with musculoskeletal model representation, estimated joint reaction loads, and measured hip kinematics during the activities. Black line indicates ‘worst-case’ positioning and load used as a starting point in dislocation models.
Patients were fitted with 62 reflective markers used to define anatomical
landmarks for 3D motion capture. Following a standing static trial, patients were
instructed to perform the activities. Each task was performed on a Bertec (Columbus,
18
OH, USA) force platform embedded in the floor with their surgical limb while force data
was collected at 1000 Hz and an 8 camera Vicon motion capture system (Centennial, CO,
USA) collected at 100 Hz. Finally, isometric strength of the hip flexors, extensors, and
abductors was measured in the affected limb.
2.2.2 Musculoskeletal modeling
Musculoskeletal simulations for each patient performing the activities were
constructed using a patient-specific whole body scaled models in OpenSim [32] (Figure
2.5 above). The dimensions of each segment in the model were scaled so that the
distances between the virtual markers on the model matched the distances between the
experimental markers. The dimensions of the body segments, mass properties (mass and
inertia tensor) of the segments, and the elements attached to the body segments, such as
muscle actuators and wrapping objects were all scaled. In addition, for each patient-
specific model, moment arms and maximum isometric torques were scaled for
flexion/extension, internal/external rotation, and adduction/abduction of the hip using the
measured isometric strength of each patient [33]. Simulations of each activities was
performed using the corresponding measured kinematics and ground reaction forces to
predict hip joint contact forces and muscle forces using static optimization, in which the
sum of muscle activation squared was minimized [34]. Joint reaction force outputs from
these models have been previously verified with strong agreement [33] to patients with
telemetric implants for activities of daily living [35] that include, gait, step down and sit
19
to stand, however this telemetric data does not include activities associated with
dislocation.
2.2.3 Finite element modeling of impingement-based dislocations
The finite element model used for dislocation simulations were the same as those
used in assessment of edge loading with regards to bone and THA construct
representation, including tuned parameters of polyethylene representation.
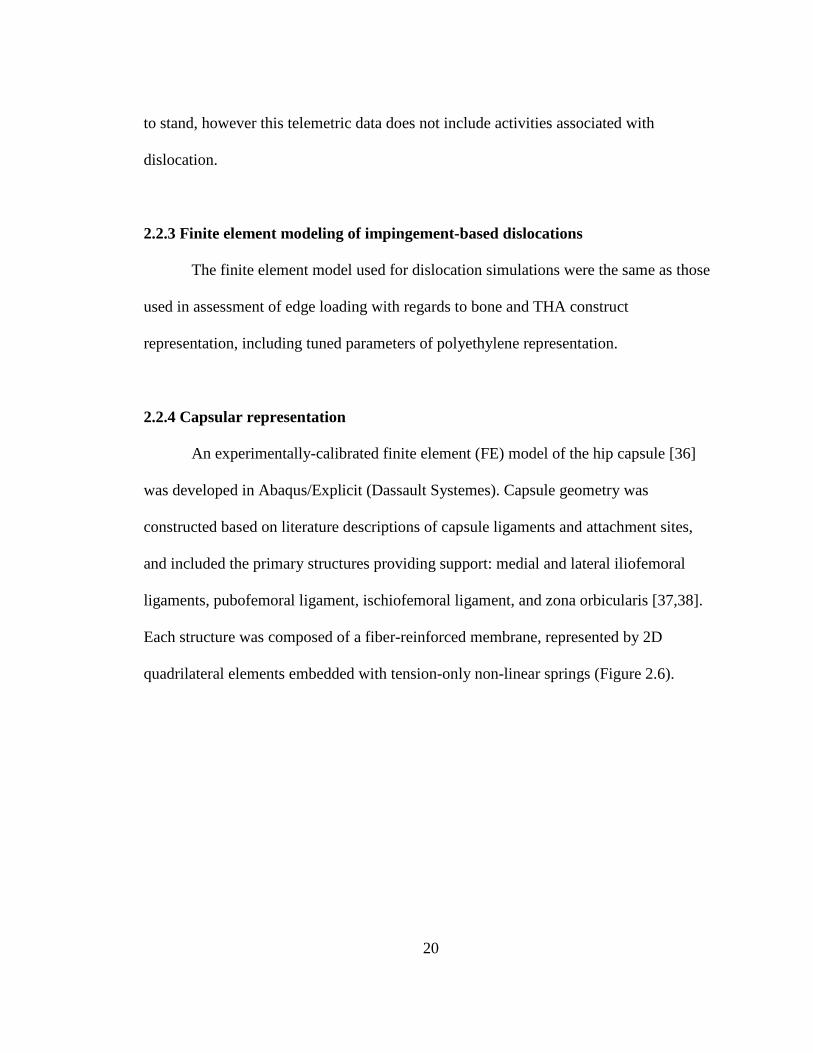
2.2.4 Capsular representation
An experimentally-calibrated finite element (FE) model of the hip capsule [36]
was developed in Abaqus/Explicit (Dassault Systemes). Capsule geometry was
constructed based on literature descriptions of capsule ligaments and attachment sites,
and included the primary structures providing support: medial and lateral iliofemoral
ligaments, pubofemoral ligament, ischiofemoral ligament, and zona orbicularis [37,38].
Each structure was composed of a fiber-reinforced membrane, represented by 2D
quadrilateral elements embedded with tension-only non-linear springs (Figure 2.6).
20
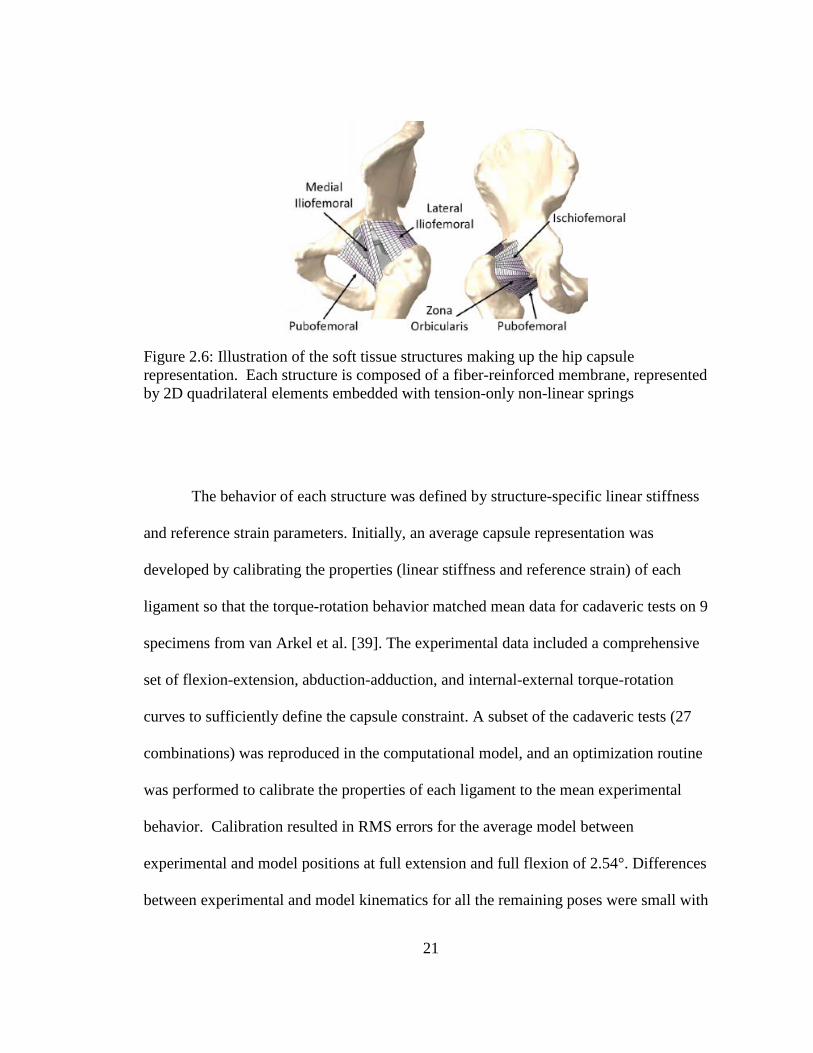
Figure 2.6: Illustration of the soft tissue structures making up the hip capsule representation. Each structure is composed of a fiber-reinforced membrane, represented by 2D quadrilateral elements embedded with tension-only non-linear springs
The behavior of each structure was defined by structure-specific linear stiffness
and reference strain parameters. Initially, an average capsule representation was
developed by calibrating the properties (linear stiffness and reference strain) of each
ligament so that the torque-rotation behavior matched mean data for cadaveric tests on 9
specimens from van Arkel et al. [39]. The experimental data included a comprehensive
set of flexion-extension, abduction-adduction, and internal-external torque-rotation
curves to sufficiently define the capsule constraint. A subset of the cadaveric tests (27
combinations) was reproduced in the computational model, and an optimization routine
was performed to calibrate the properties of each ligament to the mean experimental
behavior. Calibration resulted in RMS errors for the average model between
experimental and model positions at full extension and full flexion of 2.54°. Differences
between experimental and model kinematics for all the remaining poses were small with
21
an overall RMS error of 4.94°. Differences were identified in the calibration response for
different degrees of freedom. For example, RMS errors for internal rotation (3.99°) were
lower than for external rotation (5.26°). For simulations not involving internal/external
rotation, the RMS errors for abduction (1.39°) were lower than for adduction (8.66°).
Output bounds from the optimized probabilistic capsule representation were consistent
with ±2 SD of experimental data; the overall RMS error was 5.10°.
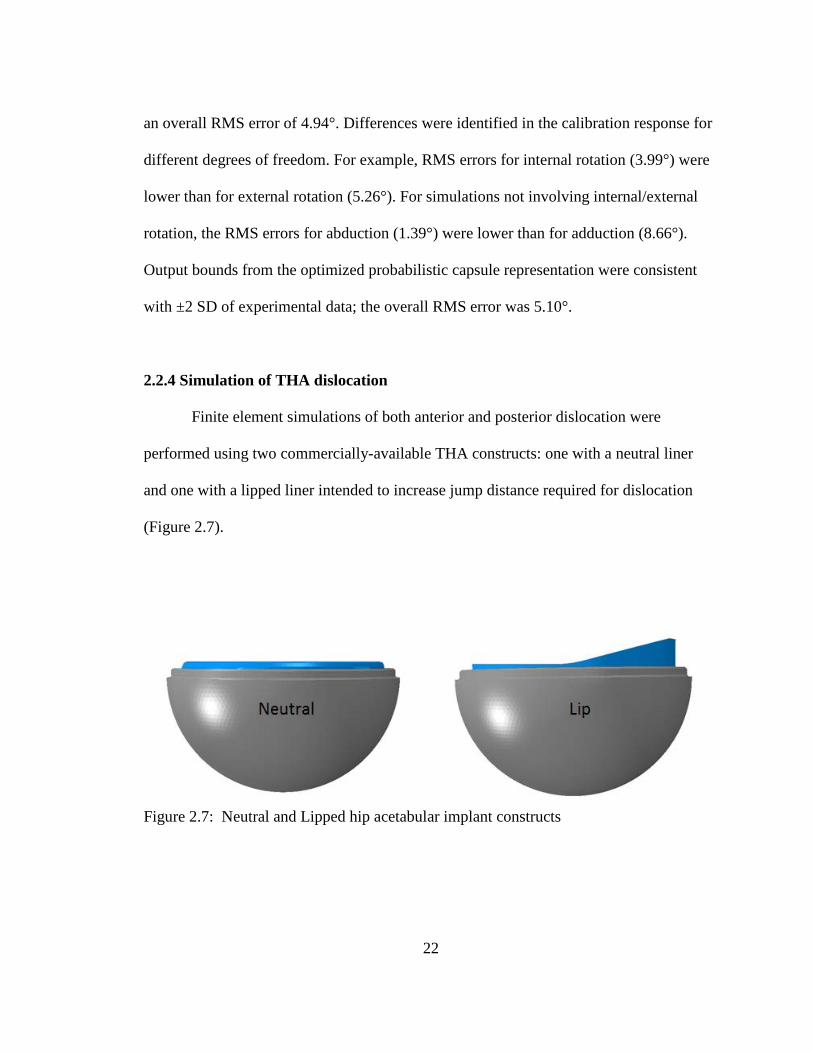
2.2.4 Simulation of THA dislocation
Finite element simulations of both anterior and posterior dislocation were
performed using two commercially-available THA constructs: one with a neutral liner
and one with a lipped liner intended to increase jump distance required for dislocation
(Figure 2.7).
Figure 2.7: Neutral and Lipped hip acetabular implant constructs
22
The femur, pelvis, femoral stem and head, and acetabular shell were represented
by rigid tetrahedral elements. The acetabular liner and hip capsule were represented as
described earlier. General contact was defined between the acetabular and femoral
components with a coefficient of friction of 0.04, as well as between the capsule and each
of the THA components. Models of the specific THA implants were aligned to patient-
specific placement per a CT scan. The lipped liner was indexed so that the lip was in a
posterior-inferior position as described by Goldstein et al [22].
Each design was evaluated in 30 unique positions of inclination and version
sampled by latin hypercube in a design space ±2σ from mean placement angles reported
by Rathod et al. [30] (Figure 2.8).
23
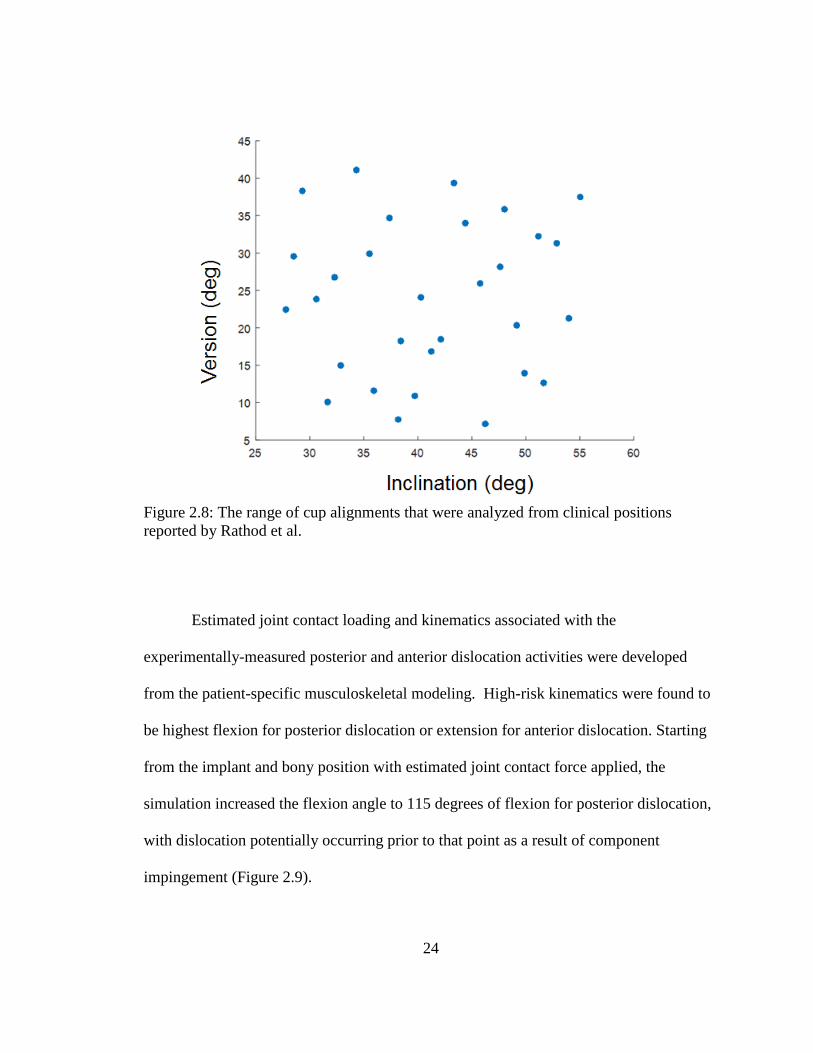
Figure 2.8: The range of cup alignments that were analyzed from clinical positions reported by Rathod et al.
Estimated joint contact loading and kinematics associated with the
experimentally-measured posterior and anterior dislocation activities were developed
from the patient-specific musculoskeletal modeling. High-risk kinematics were found to
be highest flexion for posterior dislocation or extension for anterior dislocation. Starting
from the implant and bony position with estimated joint contact force applied, the
simulation increased the flexion angle to 115 degrees of flexion for posterior dislocation,
with dislocation potentially occurring prior to that point as a result of component
impingement (Figure 2.9).
24
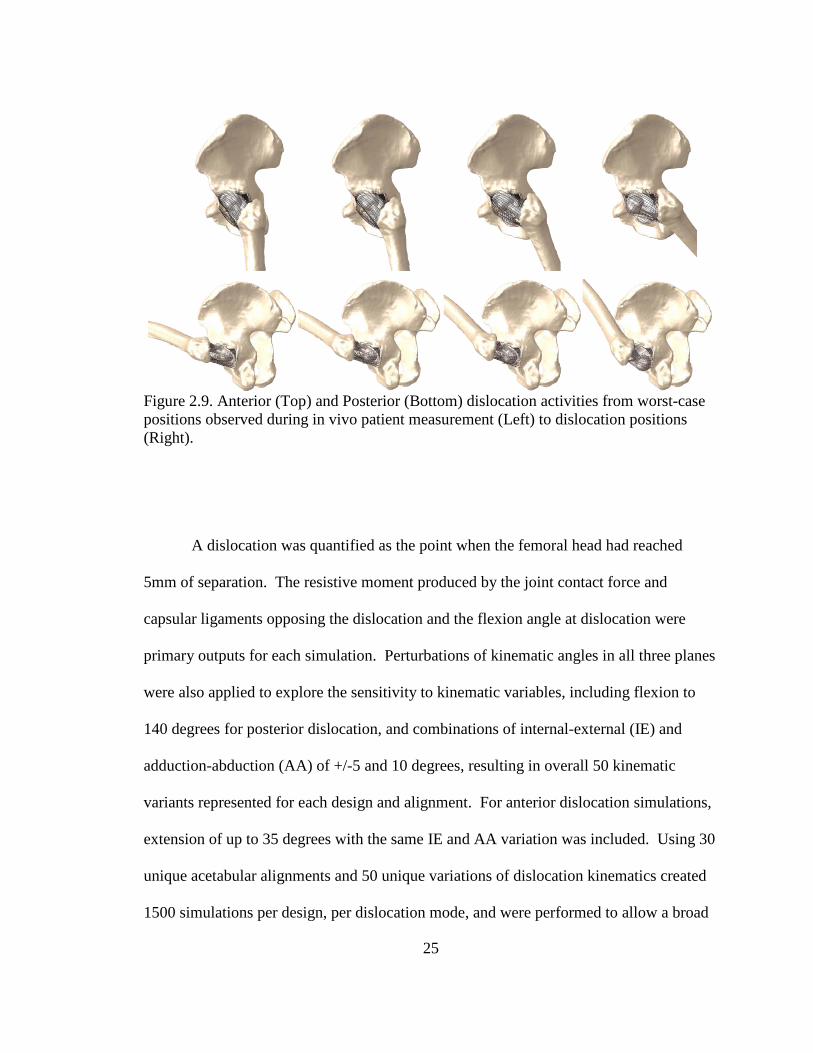
Figure 2.9. Anterior (Top) and Posterior (Bottom) dislocation activities from worst-case positions observed during in vivo patient measurement (Left) to dislocation positions (Right).
A dislocation was quantified as the point when the femoral head had reached
5mm of separation. The resistive moment produced by the joint contact force and
capsular ligaments opposing the dislocation and the flexion angle at dislocation were
primary outputs for each simulation. Perturbations of kinematic angles in all three planes
were also applied to explore the sensitivity to kinematic variables, including flexion to
140 degrees for posterior dislocation, and combinations of internal-external (IE) and
adduction-abduction (AA) of +/-5 and 10 degrees, resulting in overall 50 kinematic
variants represented for each design and alignment. For anterior dislocation simulations,
extension of up to 35 degrees with the same IE and AA variation was included. Using 30
unique acetabular alignments and 50 unique variations of dislocation kinematics created
1500 simulations per design, per dislocation mode, and were performed to allow a broad
25
understanding of design sensitivity to position and kinematic variation. An automated
framework was created in Matlab (Mathworks, Natick, MA) to create abaqus input files
for each individual analysis and post-process the resulting data.
Resistive moment provided by the joint contact force and hip capsule and the
angle at dislocation were determined for each analysis. Subsequently, dislocation rates
were calculated for each design by dividing the number of analyses which dislocated by
the total number of analysis in a given cohort. To consider the effect of implant
alignment angles on dislocation propensity, dislocation rates were found for cohorts
above and below mean alignment angles, as well as for quartiles of implant alignment
angles.
2.3 Hip Instability and Dislocation Following THA: Dislocation Propensity
Considering THA Component Geometry
The third consideration of this study is to provide data to help a clinician decide
how and to what extent commercially available THA constructs deter dislocation. To
make an assessment of dislocation propensity, this study used the same capsular and
polyethylene representation as the surgical variability dislocation study. A posterior
dislocation activity was simulated with application of the predicted joint contact vector,
with the hip initially positioned in 95° flexion, 10° internal rotation and 10° adduction.
The simulation increased the flexion angle to 125° of flexion. Dislocation occurred prior
to 125° in all instances as a result of component impingement. A dislocation was defined
as the point when the femoral head reached 5mm of separation. The moment produced
26
by the joint loading and capsular ligaments resisting the dislocation and the flexion angle
at dislocation were primary outputs for each simulation. The posterior dislocation was
initially performed using a neutral component configuration with a 32mm head with +1
offset. Dislocations where then performed with consideration of offset using +5mm offset
and +9mm, iteratively with three variations in jump distance (10°, 15° and 20° lips
corresponding to jump distances of 18.18mm, 19.60mm and 21.03mm respectively), a
size 40 head with +1mm offset and a neutral liner, and a dual mobility construct. The
resistive moment and flexion angle at the point of dislocation were compared across each
design. Another measure was also calculated which takes into account both the moment
required to dislocate as well as the flexion angle required to dislocation, representing a
more holistic measure of dislocation resistance. This has been previously described in
literature as the energy of dislocation [40]. Energy of dislocation is calculated by
evaluating the integral of the resistive moment vs flexion angle curve up to the point of
dislocation.
27
Chapter Three: Results
3.1 Adverse Edge Loading Conditions
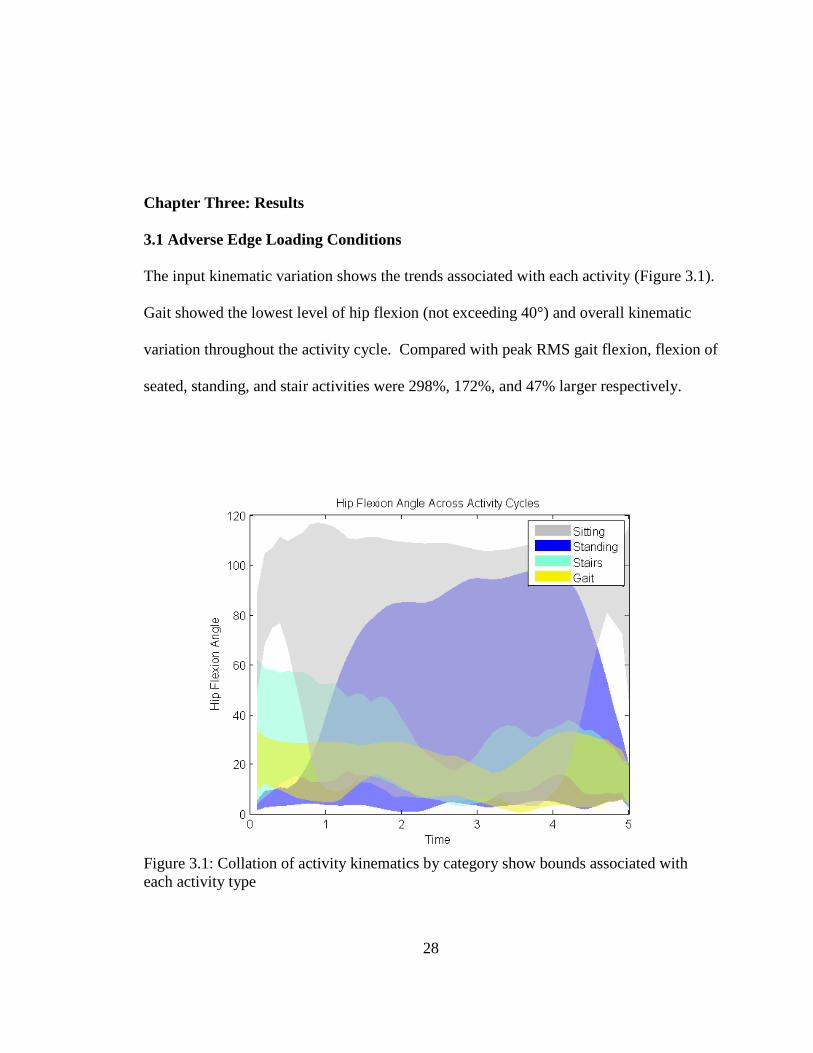
The input kinematic variation shows the trends associated with each activity (Figure 3.1).
Gait showed the lowest level of hip flexion (not exceeding 40°) and overall kinematic
variation throughout the activity cycle. Compared with peak RMS gait flexion, flexion of
seated, standing, and stair activities were 298%, 172%, and 47% larger respectively.
Figure 3.1: Collation of activity kinematics by category show bounds associated with each activity type
28
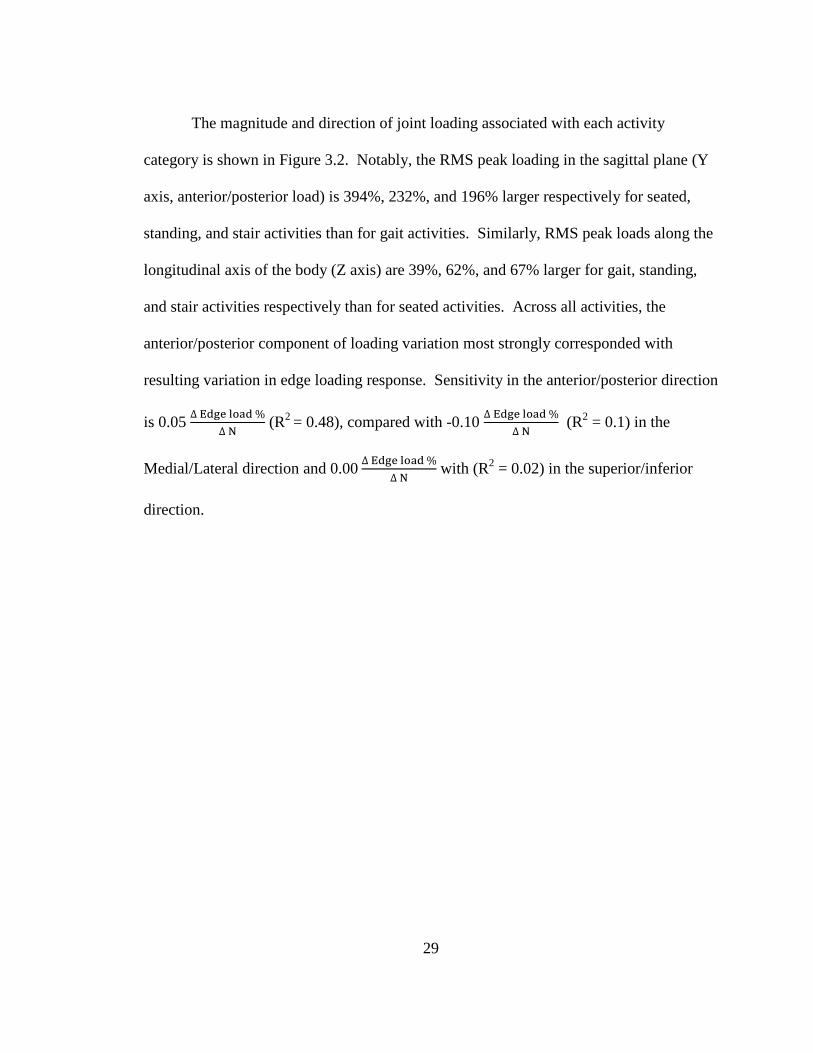
The magnitude and direction of joint loading associated with each activity
category is shown in Figure 3.2. Notably, the RMS peak loading in the sagittal plane (Y
axis, anterior/posterior load) is 394%, 232%, and 196% larger respectively for seated,
standing, and stair activities than for gait activities. Similarly, RMS peak loads along the
longitudinal axis of the body (Z axis) are 39%, 62%, and 67% larger for gait, standing,
and stair activities respectively than for seated activities. Across all activities, the
anterior/posterior component of loading variation most strongly corresponded with
resulting variation in edge loading response. Sensitivity in the anterior/posterior direction
is 0.05 ∆ Edge load %∆ N
(R2 = 0.48), compared with -0.10 ∆ Edge load %∆ N
(R2 = 0.1) in the
Medial/Lateral direction and 0.00 ∆ Edge load %∆ N
with (R2 = 0.02) in the superior/inferior
direction.
29
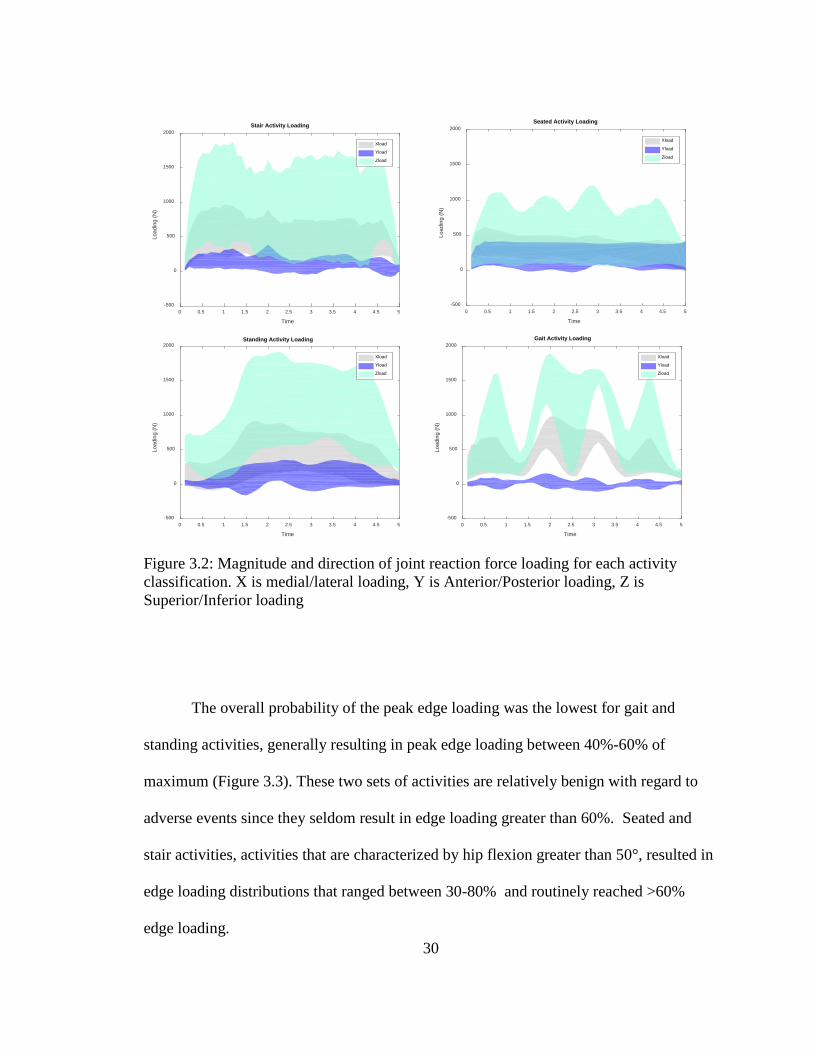
Figure 3.2: Magnitude and direction of joint reaction force loading for each activity classification. X is medial/lateral loading, Y is Anterior/Posterior loading, Z is Superior/Inferior loading
The overall probability of the peak edge loading was the lowest for gait and
standing activities, generally resulting in peak edge loading between 40%-60% of
maximum (Figure 3.3). These two sets of activities are relatively benign with regard to
adverse events since they seldom result in edge loading greater than 60%. Seated and
stair activities, activities that are characterized by hip flexion greater than 50°, resulted in
edge loading distributions that ranged between 30-80% and routinely reached >60%
edge loading.
0 0.5 1 1.5 2 2.5 3 3.5 4 4.5 5
Time
-500
0
500
1000
1500
2000
Load
ing
(N)
Stair Activity Loading
Xload
Yload
Zload
0 0.5 1 1.5 2 2.5 3 3.5 4 4.5 5
Time
-500
0
500
1000
1500
2000
Load
ing
(N)
Seated Activity Loading
Xload
Yload
Zload
0 0.5 1 1.5 2 2.5 3 3.5 4 4.5 5
Time
-500
0
500
1000
1500
2000
Load
ing
(N)
Standing Activity Loading
Xload
Yload
Zload
0 0.5 1 1.5 2 2.5 3 3.5 4 4.5 5
Time
-500
0
500
1000
1500
2000
Load
ing
(N)
Gait Activity Loading
Xload
Yload
Zload
30

Figure 3.3: Overall probability of the peak edge loading per activity category corresponding to the categorical kinematic flexion magnitude and variation
Viewed slightly differently, Figure 3.4 shows that activities associated with erect
standing showed the least edge loading with THA implants in neutral position. In fact,
edge loading associated with standing activities was significantly lower than edge loading
associated with gait activities (P=0.02). Stair activities (P=0.02) and seated activities
(P<0.01) showed significantly higher levels of edge loading compared with gait
activities.
31
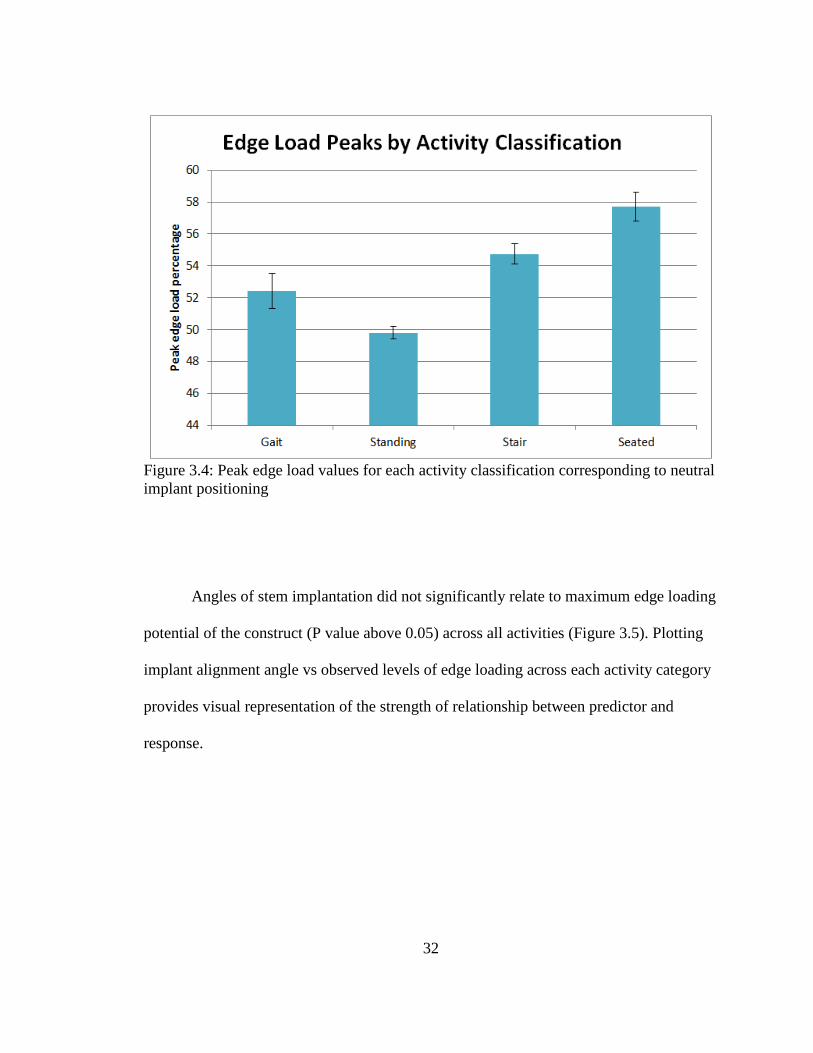
Figure 3.4: Peak edge load values for each activity classification corresponding to neutral implant positioning
Angles of stem implantation did not significantly relate to maximum edge loading
potential of the construct (P value above 0.05) across all activities (Figure 3.5). Plotting
implant alignment angle vs observed levels of edge loading across each activity category
provides visual representation of the strength of relationship between predictor and
response.
32
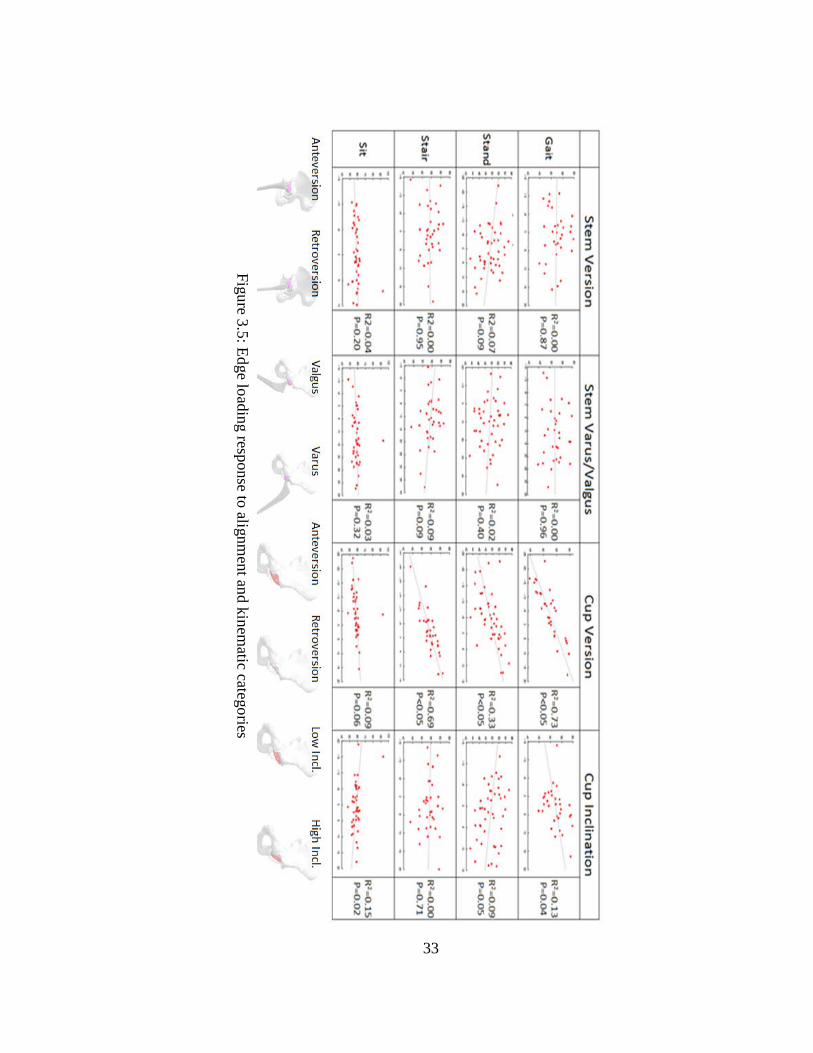
Figure 3.5: Edge loading response to alignment and kinem
atic categories
33
Cup alignment angles showed more influence on liner contact position based on
R2 values than did femoral stem alignment angles, as shown in Figure 3.5. Throughout
most activities, the relationship between cup angles and liner loading position had a P
value below 0.05, indicative of a significant relationship. Cup version in gait and stair
activities was a good predictor of edge loading (R2 = 0.73 & R2=0.69, respectively), with
a significant relationship for both (P<0.05). Cup version trended towards higher degrees
of edge loading with increasing retroversion due to the tendency of all ADLs sampled to
move in flexion in the sagittal plane, rather than extension. Cup inclination did not
clearly trend towards increased or decreased edge loading with varying inclination.
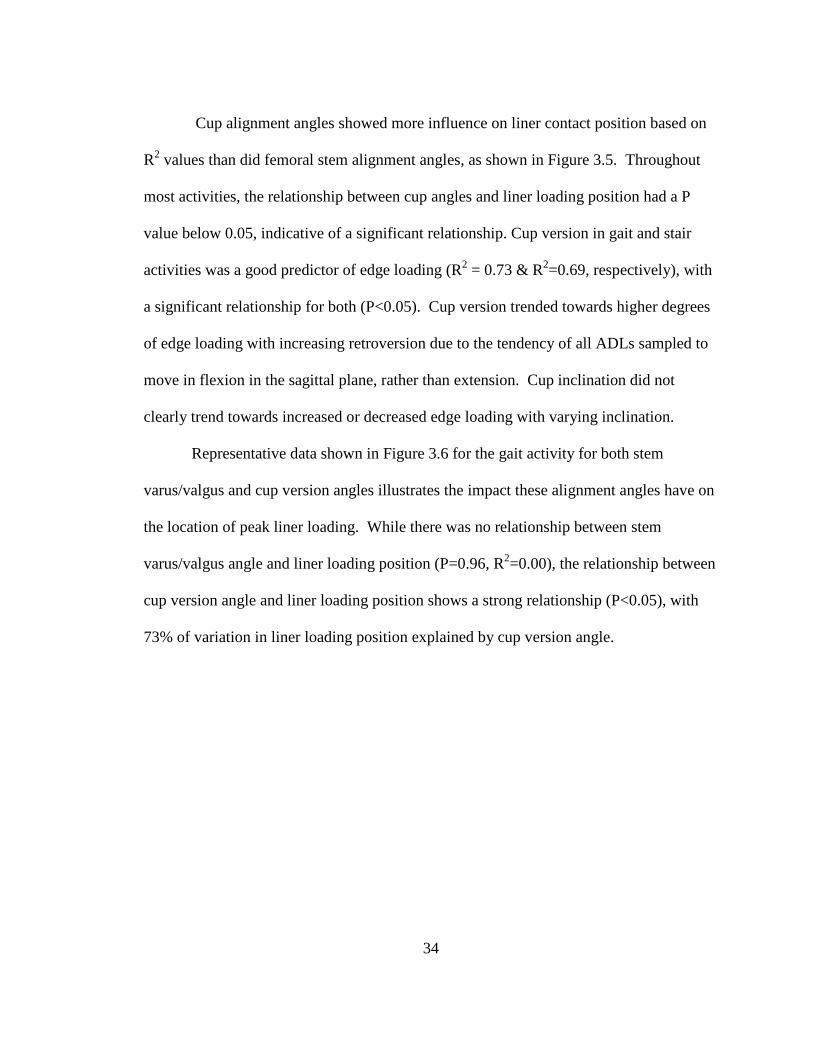
Representative data shown in Figure 3.6 for the gait activity for both stem
varus/valgus and cup version angles illustrates the impact these alignment angles have on
the location of peak liner loading. While there was no relationship between stem
varus/valgus angle and liner loading position (P=0.96, R2=0.00), the relationship between
cup version angle and liner loading position shows a strong relationship (P<0.05), with
73% of variation in liner loading position explained by cup version angle.
34
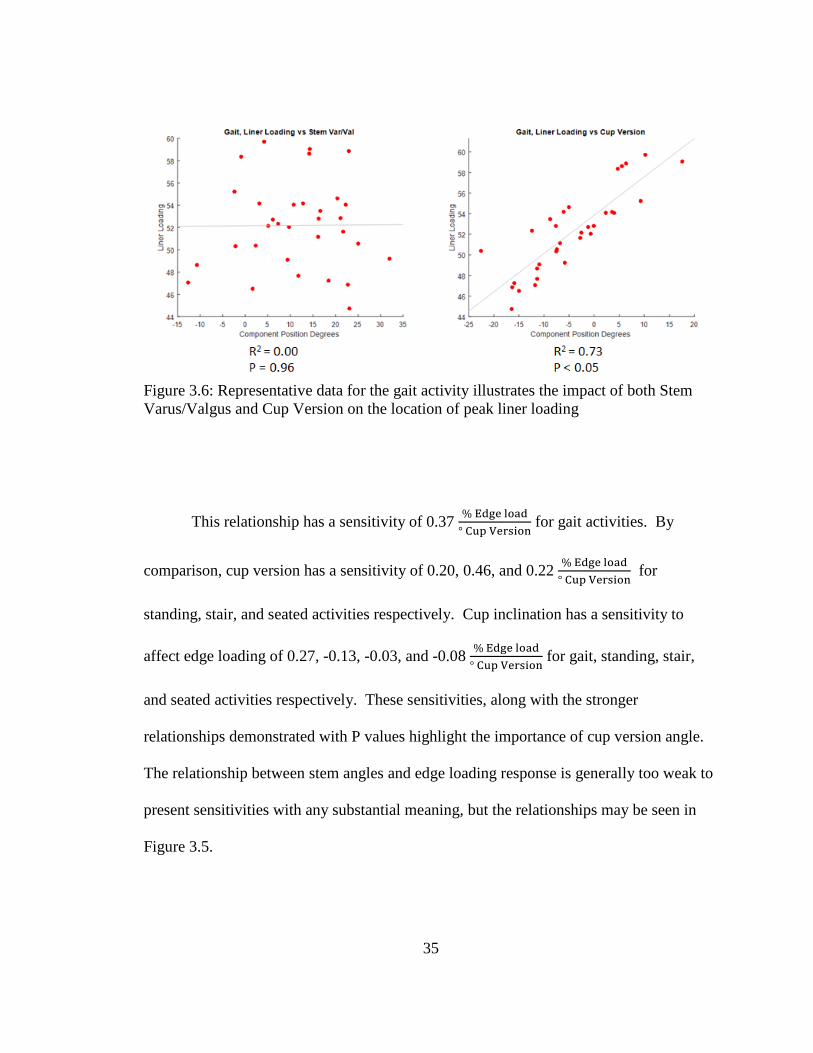
Figure 3.6: Representative data for the gait activity illustrates the impact of both Stem Varus/Valgus and Cup Version on the location of peak liner loading
This relationship has a sensitivity of 0.37 % Edge load° Cup Version
for gait activities. By
comparison, cup version has a sensitivity of 0.20, 0.46, and 0.22 % Edge load° Cup Version
for
standing, stair, and seated activities respectively. Cup inclination has a sensitivity to
affect edge loading of 0.27, -0.13, -0.03, and -0.08 % Edge load° Cup Version
for gait, standing, stair,
and seated activities respectively. These sensitivities, along with the stronger
relationships demonstrated with P values highlight the importance of cup version angle.
The relationship between stem angles and edge loading response is generally too weak to
present sensitivities with any substantial meaning, but the relationships may be seen in
Figure 3.5.
35
3.2 Dislocation Associated with Surgical and Kinematic Variability
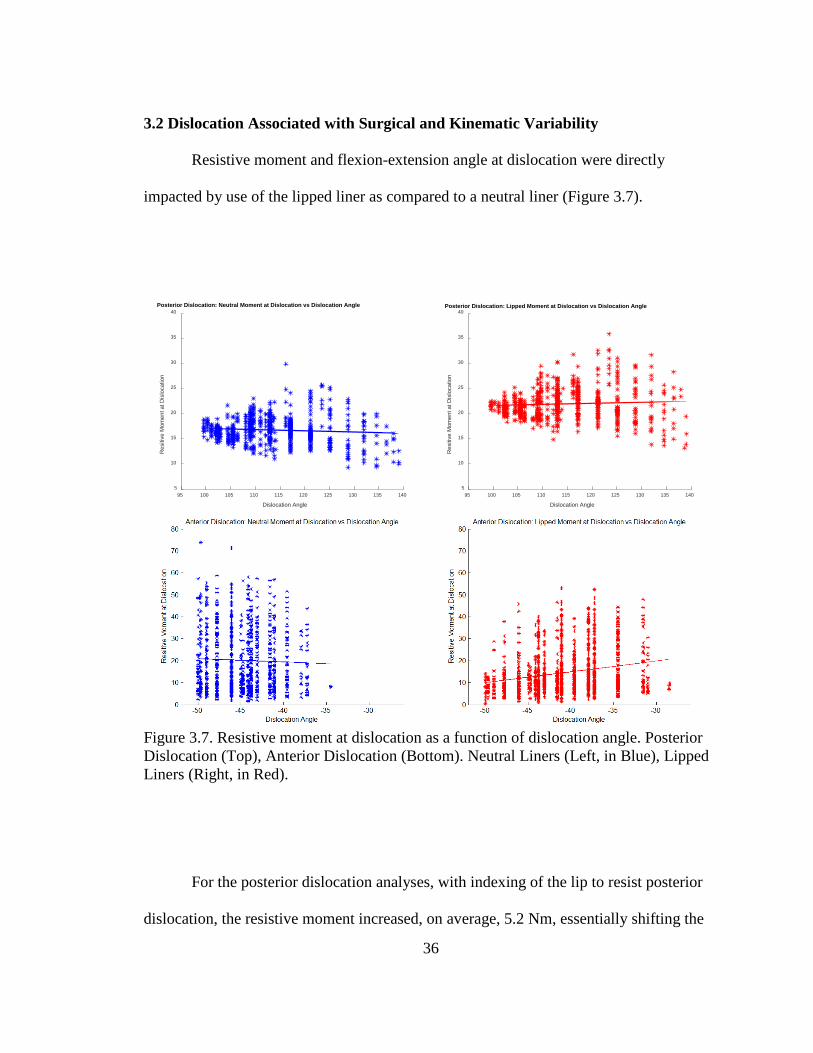
Resistive moment and flexion-extension angle at dislocation were directly
impacted by use of the lipped liner as compared to a neutral liner (Figure 3.7).
Figure 3.7. Resistive moment at dislocation as a function of dislocation angle. Posterior Dislocation (Top), Anterior Dislocation (Bottom). Neutral Liners (Left, in Blue), Lipped Liners (Right, in Red).
For the posterior dislocation analyses, with indexing of the lip to resist posterior
dislocation, the resistive moment increased, on average, 5.2 Nm, essentially shifting the
95 100 105 110 115 120 125 130 135 140
Dislocation Angle
5
10
15
20
25
30
35
40
Res
itive
Mom
ent a
t Dis
loca
tion
Posterior Dislocation: Neutral Moment at Dislocation vs Dislocation Angle
95 100 105 110 115 120 125 130 135 140
Dislocation Angle
5
10
15
20
25
30
35
40
Res
itive
Mom
ent a
t Dis
loca
tion
Posterior Dislocation: Lipped Moment at Dislocation vs Dislocation Angle
36
response compared with the neutral liner. The average flexion angle at dislocation also
increased, from 112.8 degrees to 114.2 degrees for neutral and lipped liners,
respectively. As anticipated, the anterior dislocation simulations demonstrated the
opposite trend, with potential for earlier impingement in extension, the average lipped
liner resistive moment decreased by 5.6 Nm, with corresponding decrease in extension
angle at dislocation of 4.0 degrees compared with neutral liners. With anterior
dislocation, the resistive moment response was also relatively consistent as a function of
angle of dislocation for neutral liners, while the lipped liner showed a trend of decreasing
resistive moment with higher extension angles. Overall, resistive moment and flexion-
extension angle were most sensitive to acetabular version, followed by acetabular
inclination.
Subsequently, dislocation percentages were determined based on the number of
analyses that dislocated compared with the overall number of analyses, and used to
evaluate the impact of alignment and kinematic variables. For posterior dislocation, with
both neutral and lipped liners the rate of posterior dislocation is lower for high
anteversion (48% and 44%) compared to low anteversion (82% and 75%), and that of
those results the rate of dislocation for lipped liners is lower than that of neutral liners
(Figure 3.8).
37
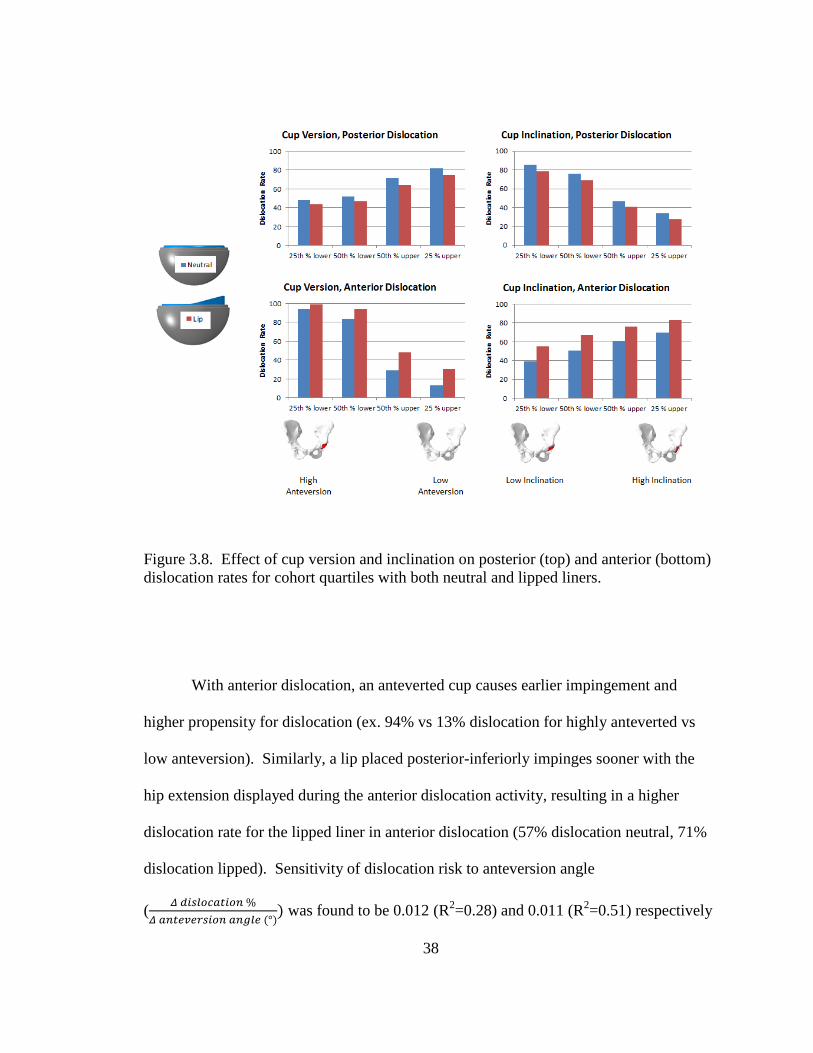
Figure 3.8. Effect of cup version and inclination on posterior (top) and anterior (bottom) dislocation rates for cohort quartiles with both neutral and lipped liners.
With anterior dislocation, an anteverted cup causes earlier impingement and
higher propensity for dislocation (ex. 94% vs 13% dislocation for highly anteverted vs
low anteversion). Similarly, a lip placed posterior-inferiorly impinges sooner with the
hip extension displayed during the anterior dislocation activity, resulting in a higher
dislocation rate for the lipped liner in anterior dislocation (57% dislocation neutral, 71%
dislocation lipped). Sensitivity of dislocation risk to anteversion angle
( 𝛥𝛥 𝑑𝑑𝑑𝑑𝑑𝑑𝑑𝑑𝑑𝑑𝑑𝑑𝑑𝑑𝑑𝑑𝑑𝑑𝑑𝑑𝑑𝑑 %𝛥𝛥 𝑑𝑑𝑑𝑑𝑑𝑑𝑎𝑎𝑎𝑎𝑎𝑎𝑎𝑎𝑑𝑑𝑑𝑑𝑑𝑑𝑑𝑑 𝑑𝑑𝑑𝑑𝑎𝑎𝑑𝑑𝑎𝑎 (°)
) was found to be 0.012 (R2=0.28) and 0.011 (R2=0.51) respectively
38
for neutral and lipped liners in the posterior dislocation, and -0.031 (R2=0.89) and -0.026
(R2 = 0.83) respectively for neutral and lipped liners in the anterior dislocation.
With regard to cup inclination, for both neutral and lipped liners the rate of
posterior dislocation is lower for high inclination (34% and 28%) compared to low
inclination (86% and 79%), and the rate of posterior dislocation for lipped liners is lower
than that of neutral liners (Figure 3.7). Anterior and posterior dislocation activities again
have competing alignment trends to lower dislocation propensities. High cup inclination
lowers the rate of posterior dislocations due to increased range of motion prior to
impingement while simultaneously increasing the propensity for anterior dislocation. A
posterior-inferiorly placed lip again lowers the rate of dislocation for posterior dislocation
(62% dislocation neutral, 56% dislocation lip), while increasing the rate of dislocation for
anterior dislocation (57% dislocation neutral, 71% dislocation lip). Sensitivity of
dislocation risk to inclination angle was found to be -0.022 (R2=0.61) and -0.022
(R2=0.61) respectively for neutral and lipped liners in the posterior dislocations, and
0.010 (R2=0.06) and 0.009 (R2 = 0.07) respectively for neutral and lipped liners in the
anterior dislocation.
Anterior and posterior dislocation propensities are generally oppositely affected
by kinematic variation as well (Figure 3.9).
39
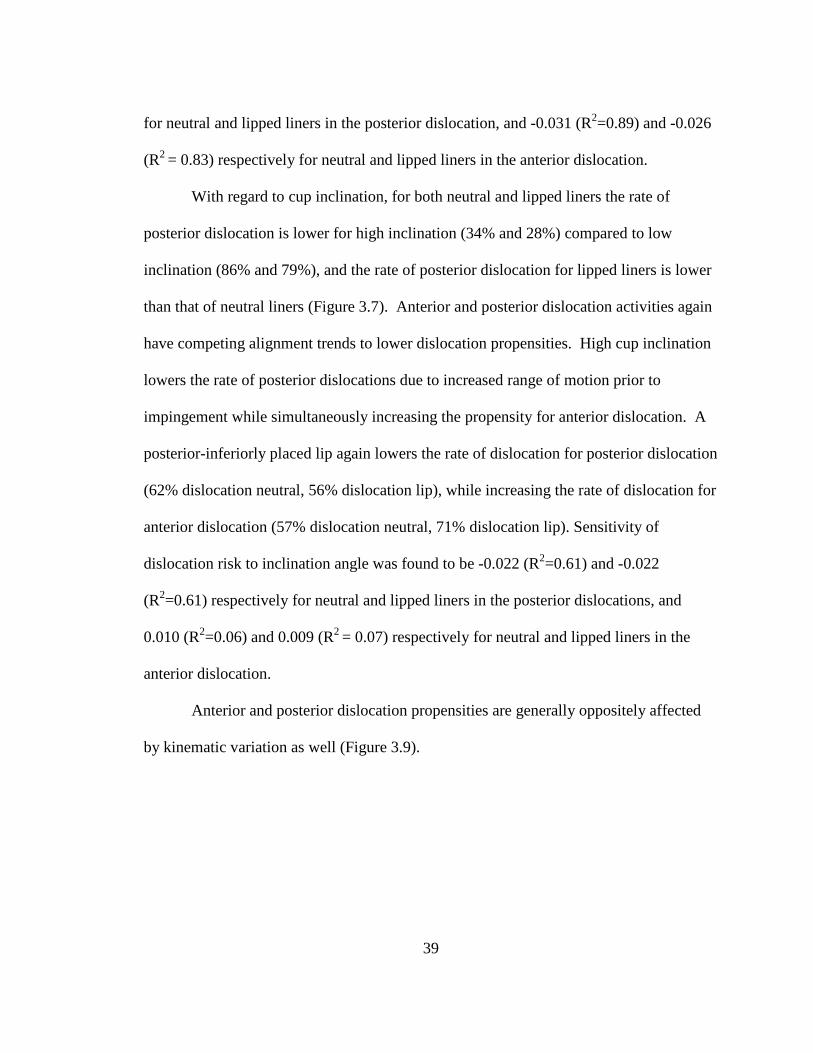
Figure 3.9. Effect of kinematics on posterior (left) and anterior (right) dislocation rate.
Increasing abduction and external rotation lower the propensity for posterior
dislocation while simultaneously increasing the propensity for anterior dislocation. As
before, a posterior-inferiorly placed lip reduces the propensity for dislocation across
nearly all conditions of posterior kinematics while simultaneously increasing the risk for
all kinematic conditions of anterior dislocation.
3.3 Dislocation Propensity Considering THA Construct Geometry
Each design considered resulted in greater resistance to dislocation compared with
the neutral configuration. The +5 and +9 offset, with associated increase in capsular
tensions and joint compressive loading, resulted in the greatest resistive moment during
dislocation that was 78.1% and 121% greater than neutral, respectively, and both resulted
in an increase in flexion angle at dislocation of 105.6°. This was in contrast to the larger
40
head size that provided only a 9.9% percent increase in resistive moment. Dual mobility
provided 29.4% greater resistive moment and an increase in the flexion angle at which
dislocation occurred (109.5° vs 101.3°). Increasing jump distance by 10° relative to
neutral resulted in a 13.5% increase, 15° jump distance was 20.9% greater than neutral,
and a 20° jump distance had a much larger effect with 46.5% increase. The 20° jump
distance performed similarly to dual mobility with regard to resistive moment (Figure
3.10).
41
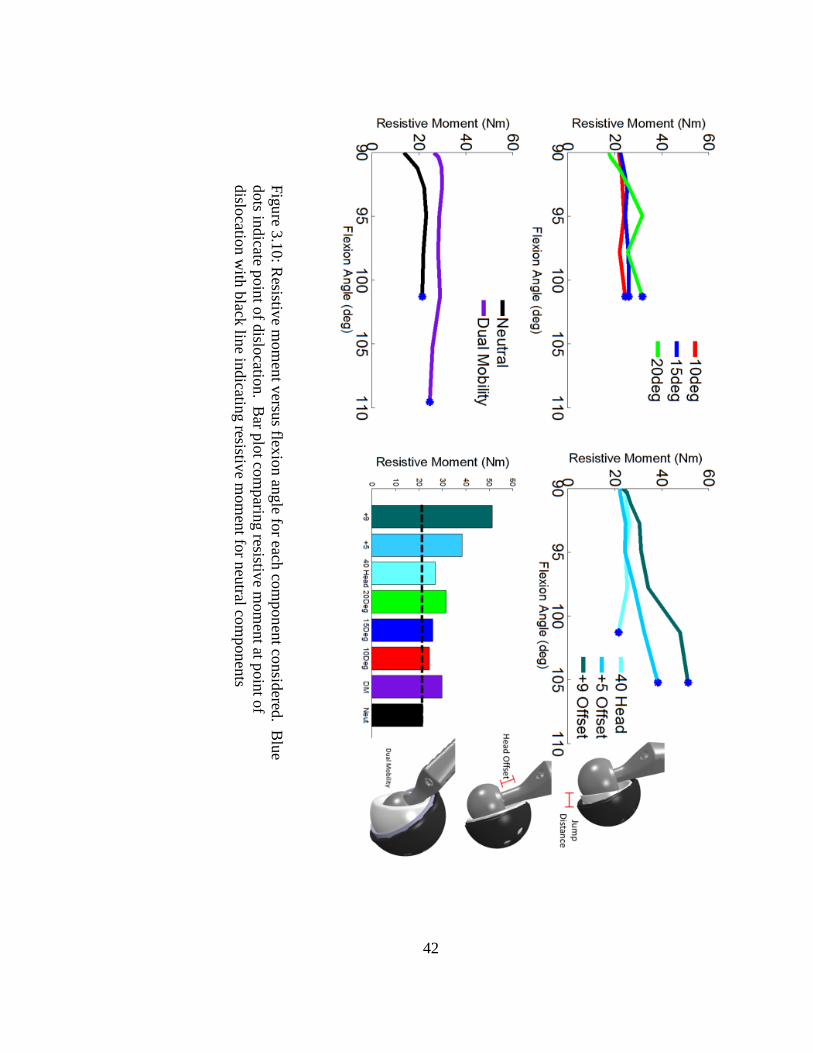
Figure 3.10: Resistive m
oment versus flexion angle for each com
ponent considered. Blue
dots indicate point of dislocation. Bar plot com
paring resistive mom
ent at point of dislocation w
ith black line indicating resistive mom
ent for neutral components
42
To consider both resistive moment and flexion angle at dislocation together in a
single measure, Figure 3.11 shows the area under the curve from the resistive moment vs
flexion angle plots of each construct. This measure takes into account both the moment
required to dislocate as well as the flexion angle required to dislocation, representing a
more holistic measure of dislocation resistance.
The +5 and +9 offset constructs, with associated increase in capsular tensions and
joint compressive loading, resulted in energy of dislocation 82% and 138% greater than
neutral, respectively. This was in contrast to the larger head size that provided only a
15% percent increase in energy of dislocation. Figure 3.10 showed that the dual mobility
design showed only 29.4% greater resistive moment than neutral; however dual mobility
had the largest flexion angle at dislocation of any construct tested, resulting in a 124%
increase in energy to dislocation compared to the neutral design. Increasing jump
distance by 10° relative to neutral resulted in an 8% increase, 15° jump distance was 17%
greater than neutral, and a 20° jump distance was 27% increase in energy to dislocation.
The 20° jump distance performed similarly to dual mobility with regard to resistive
moment shown in Figure 3.11, however the increased range of motion with the dual
mobility design resulted in a 78% larger energy to dislocation of the dual mobility design
compared with the 20° jump distance acetabular liner.
43
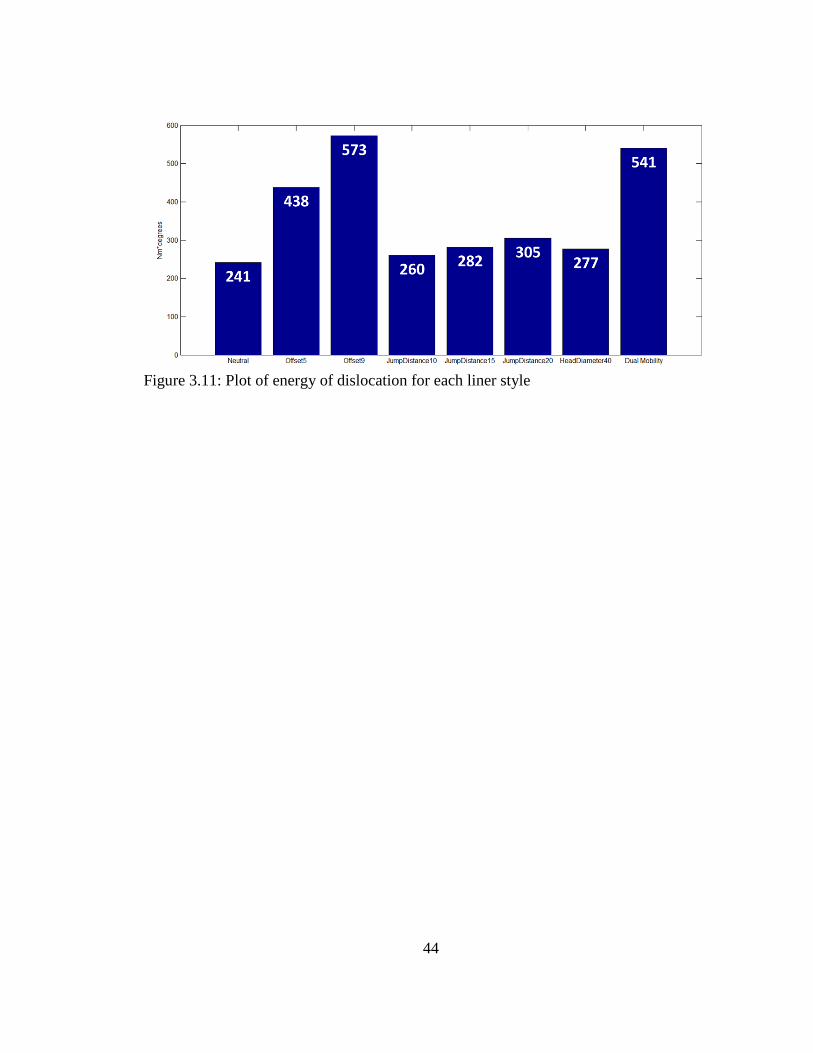
Figure 3.11: Plot of energy of dislocation for each liner style
44
Chapter Four: Discussion
4.1 Edge Loading in Total Hip Arthroplasty
A clinically informed finite element analysis that included perturbations in THA
component alignment identified acetabular cup/liner anteversion as having the greatest
impact on the location of peak liner stresses during 20 activities of daily living across
four activity classifications. Quantifying propensity for edge loading during dynamic
activities is important for surgical decision making to assess placement considerations for
prevention of adverse events associated with undesirable loading conditions of the
acetabular liner.
Our results complement those within literature while providing a different
perspective considering variation in loading and kinematics between activities. Hua et al.
consider cup inclination to be the preeminent factor in consideration of edge loading [41].
The present study found cup inclination to be important, but found cup anteversion to be
the best predictor of edge loading propensity. This could be due to a number of factors
including different activities, implant geometries, method in which edge loading is
calculated (peak vs duration of activity cycle), or the inclusion of flexion kinematics in
the current study. Our findings align with literature reports of differences in anteversion
between clinically dislocating and non-dislocating cohorts [25]. Hip dislocation is an
adverse event characterized by distraction of the THA femoral head away from the apex
of the liner, not unlike the process of edge loading.
45
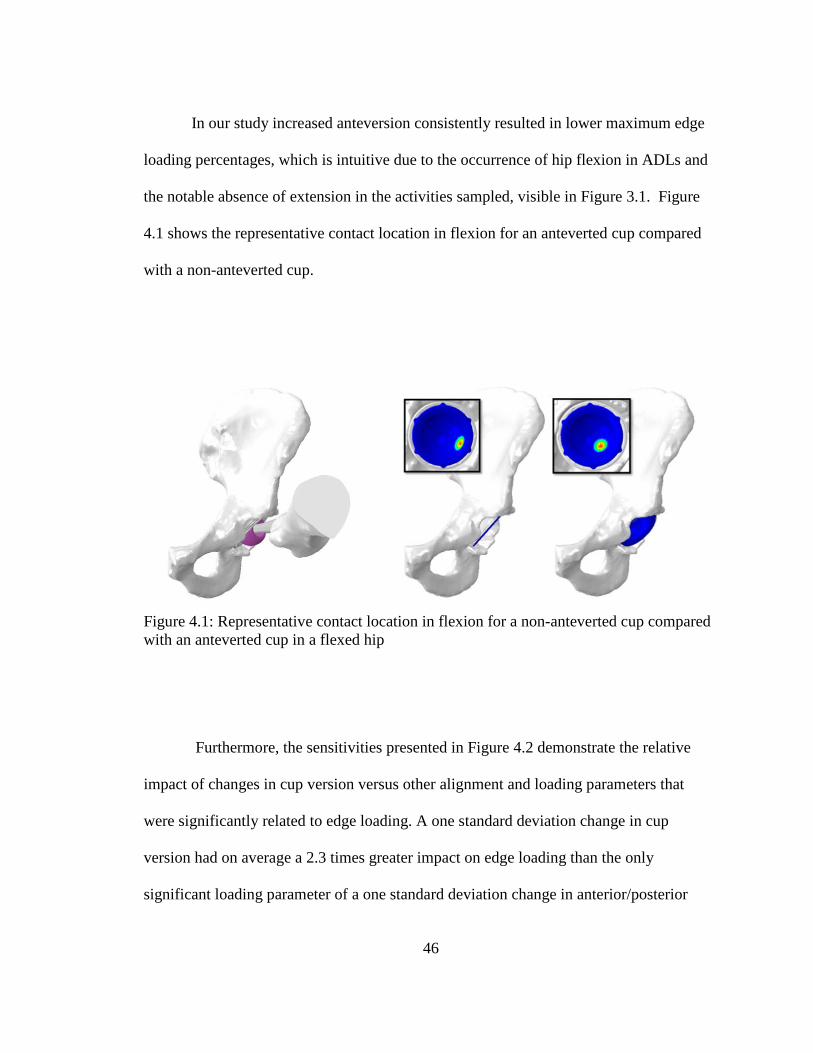
In our study increased anteversion consistently resulted in lower maximum edge
loading percentages, which is intuitive due to the occurrence of hip flexion in ADLs and
the notable absence of extension in the activities sampled, visible in Figure 3.1. Figure
4.1 shows the representative contact location in flexion for an anteverted cup compared
with a non-anteverted cup.
Figure 4.1: Representative contact location in flexion for a non-anteverted cup compared with an anteverted cup in a flexed hip
Furthermore, the sensitivities presented in Figure 4.2 demonstrate the relative
impact of changes in cup version versus other alignment and loading parameters that
were significantly related to edge loading. A one standard deviation change in cup
version had on average a 2.3 times greater impact on edge loading than the only
significant loading parameter of a one standard deviation change in anterior/posterior
46
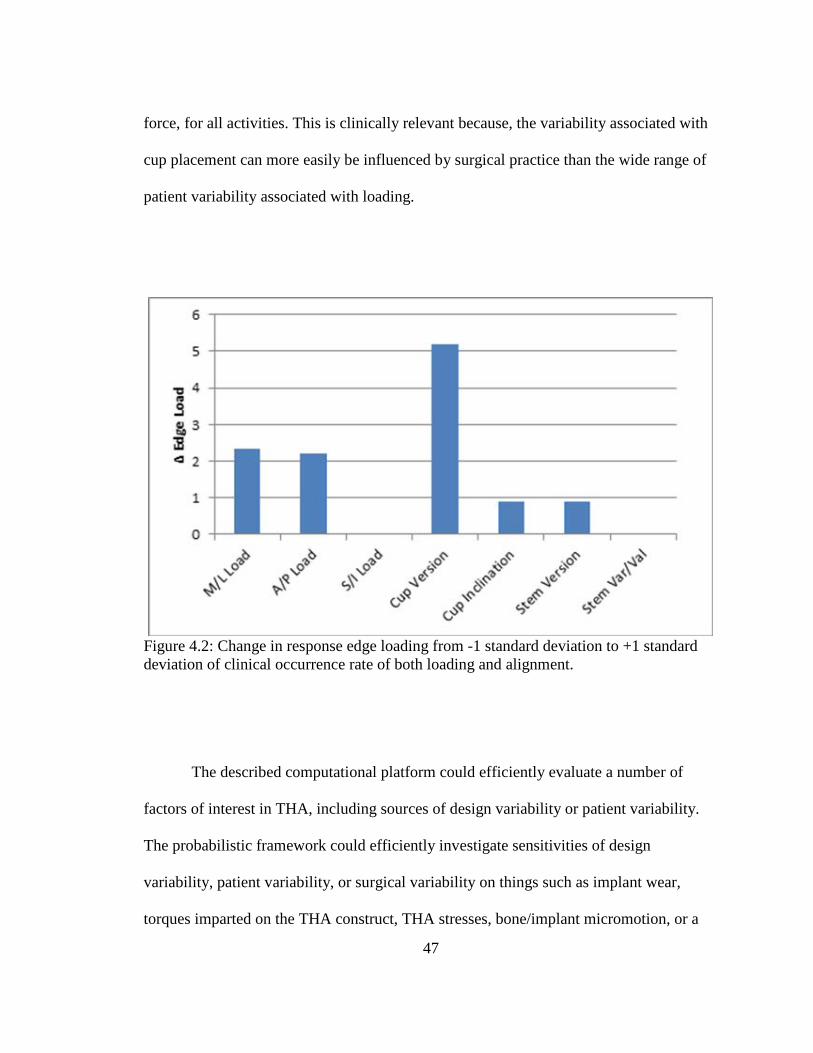
force, for all activities. This is clinically relevant because, the variability associated with
cup placement can more easily be influenced by surgical practice than the wide range of
patient variability associated with loading.
Figure 4.2: Change in response edge loading from -1 standard deviation to +1 standard deviation of clinical occurrence rate of both loading and alignment.
The described computational platform could efficiently evaluate a number of
factors of interest in THA, including sources of design variability or patient variability.
The probabilistic framework could efficiently investigate sensitivities of design
variability, patient variability, or surgical variability on things such as implant wear,
torques imparted on the THA construct, THA stresses, bone/implant micromotion, or a
47
number of other variables of interest to the long term success of the THA construct. This
has been done effectively by Fitzpatrick et al. with total knee replacements [13].
The present study demonstrated the basis of a virtual risk assessment used to
predict idealized conditions for a THA construct given identification of contributing
factors. If desired acetabular cup angles are able to be predicted then surgical procedures,
device designs, navigation systems and instrumentation that facilitate optimal cup
placement can be used to limit excessive edge loading on the acetabular liner implant.
There are limitations to this study that should be considered. First, the simulation
of each task used kinematics and loading for each patient based on Orthoload data.
Kinematics were not altered following perturbations to component alignment. While it is
possible that the perturbations could result in musculoskeletal adaption, those can be
complex neuoromuscular responses that were outside of the scope of this study. Second,
hip kinematics were represented only in the sagittal plane. While the largest kinematic
component of available hip ADLs with simultaneously sampled in-vivo joint reaction
forces are generally in the sagittal plane, rotation in the coronal and transverse planes are
omitted due to limitations of estimating out of plane hip angles from 2D video. Third,
sampling ADLs is a good representation of daily use of prostheses, but does not represent
‘worst case’ conditions which are prone to create dislocation secondary to impingement.
While it is intuitive that conditions causing loading near the equator of the liner are the
same as those which cause impingement, there is risk in using edge loading as a surrogate
measure for joint stability and dislocation. Finally, the study perturbed component
alignment variables individually and thereby did not evaluate the interaction effects of
48
combined degrees of freedom. While our approach was able to meet the goals of
identifying the alignment degrees of freedom that had the greatest impact edge loading,
we recognize that interactions effects are important moving forward.
In conclusion, the identification of the important hip implant alignment variables
and quantification of their impact on edge loading during ADLs can support surgical
decision-making and instrumentation development. Considering the surgical
implications of how alignment affects edge loading, and improved understanding of the
sensitivities of edge loading to acetabular alignment variation can help avoid clinical
adverse events caused by edge loading and lead to improved THA patient outcomes.
4.2 Dislocation vs Surgical Alignment and Kinematics
An experimentally-based musculoskeletal modeling analysis that included
variation in THA component alignment was performed to identify the contributions of
alignment and geometry to stability and dislocation propensity during dynamic activities.
This study highlights the conflicting idealized implant positions and patient kinematics in
considering risk of anterior and posterior dislocation. Results of this study provide
further evidence for the surgical options to enhance dislocation resistance in treatment of
unstable THAs. The framework of the study is designed not to predict a clinical
dislocation rate which may be substantiated by clinical series, but to represent clinically
challenging scenarios which purposefully cause dislocation in a substantial percentage of
simulations. The bounds of these parameters are clinically based, but the occurrence of
these scenarios is not. The study then finds the resistive moment and flexion angle at
49
dislocation, and relative propensity for dislocation of each geometry based on component
position and prescribed kinematics.
Acetabular component design and alignment angles provide varying resistance to
instability and dislocation as this study highlighted the tradeoffs associated with THA.
For example, increasing anteversion is an effective way to reduce the risk of dislocation
across a broad range of posterior dislocation kinematics. Without further consideration,
this could be considered to be an ideal solution for a large cohort of patients. Of course it
should be considered as well that by increasing cup anteversion the risk of anterior
dislocation increases. Lipped liners are thought to provide increased jump distance
required for dislocation, thereby lowering propensity for dislocation. This was found to
be true when the lip is placed such that the lip is positioned consistent with the egress site
opposite the femoral neck/acetabular component impingement location. However when
the kinematics are reversed the lip becomes a point of impingement earlier in the desired
range of motion, causing higher propensity for dislocation. This highlights the
thoughtfulness of lip position relative to the anticipated kinematics and anterior/posterior
dislocation risk for a given patient. This also highlights the potential benefit of dual
mobility hip liners, in which the point of largest jump distance is always opposite the
stem/liner impingement site, and is self-adaptable to variation in kinematics.
Interestingly, cup inclination in this study is a more closely correlated to response
posterior dislocation risk, with R2 values of 0.61 and 0.61 respectively for neutral and
lipped liners compared with cup anteversion R2 values of 0.28 and 0.25 respectively for
neutral and lipped liners. Conversely, cup anteversion is more closely correlated to
50
response anterior dislocation risk, with R2 values of 0.89 and 0.83 respectively for neutral
and lipped liners compared with cup inclination R2 values of 0.06 and 0.07 respectively
for neutral and lipped liners.
In addition, it was shown that a lipped liner in this case doesn’t notably increase
the angle in which posterior dislocation occurs due to two things, (1) the geometry of the
rim of neutral and lipped liners is the same in the position in which neck/liner
impingement occurs resulting in the same impingement-free range of motion and (2) the
5mm threshold used to signal dislocation in this study. Lipped liners do, however,
increase the resistive moment of the construct for dislocation to occur, particularly at
higher flexion dislocation angles. For anterior dislocation we see that dislocation angle is
affected with a lipped liner, as the head/neck impingement occurs sooner.
The overall clinical rate of posterior dislocation exceeds that of anterior
dislocation [42], so the risks associated with each dislocation mode as well as their
associated idealized implant positions must be weighted accordingly in the assessment of
overall dislocation risk. The rate of posterior vs anterior dislocation is likely
multifactorial, but could be based on surgical trauma during the procedure, presence or
completeness of capsular repair, or simply the high occurrence of hip flexion activities
compared with hip extension activities during activities of daily living [43].
There are limitations to this study that should be considered. First, the simulation
of each task used baseline kinematics for each patient to calculate muscle forces and joint
contact forces. Kinematics were not altered following perturbations to component
alignment. While it is possible that the perturbations could result in musculoskeletal
51
adaption, those can be complex neuoromuscular responses that were outside of the scope
of this study. Further, true dislocation kinematics are not defined in vivo so simulation
dislocation kinematics were extrapolated beyond those collected in the gait lab to cause
dislocation. Second, this study considers only dislocation secondary to impingement. It
does not consider subluxation or general instability which may be prevalent during
ADLs. Finally, this initial study did not evaluate the interaction effects of combined
degrees of freedom. While our approach was able to meet the goals of identifying the
alignment degrees of freedom that had the greatest impact on dislocation propensity, we
recognize that interactions effects are important moving forward.
In conclusion, the identification of the important hip implant alignment variables
and the associated dislocation propensities throughout dislocation can support surgical
decision-making and assessment of dislocation risk. Considering the surgical
implications of how alignment affects dislocation propensity of different modes can help
assess tradeoffs and lead to improved THA patient outcomes by reducing the occurrence
of adverse clinical events.
4.3 Dislocation per THA Construct
Results of this study provide further evidence for the use of surgical options to
enhance dislocation resistance in treatment of unstable THAs. These options include
increased head size, femoral stem offset, lipped liner jump distance and the use of dual
mobility. Results indicate that increasing offset between the femur and the pelvis is an
effective way to increase joint stability and reduce the propensity for dislocation.
52
Increasing offset within reason effectively tensions the soft tissue allowing for passive
constraint of the hip joint. A dual mobility-style liner was also very effective at
increasing joint stability shown in Figure 3.10 and 3.11.
As shown in figure 3.10, the dual mobility design was effective largely because
the dual mobility design had the largest flexion angle to dislocation of any construct
tested. This highlights the benefits of dual mobility designs in patients with hip
instability, allowing for a relatively large resistive moment but also a high flexion angle
at the point of dislocation compared with other designs.
Use of a lipped liner of varying designs (jump distances) increased joint stability
compared to a neutral design, as did increasing head diameter, however head offset and
dual mobility designs provided the greatest resistance to dislocation with over 2x the
energy to dislocation of a neutral acetabular liner in some instances.
In conclusion, quantifiable assessment of dislocation propensities of clinically
available THA constructs can support surgical decision-making and assessment of
dislocation risk. Simulation techniques such as have been presented in this study can
distinguish between designs which work in uniquely different ways (inherent geometric
constraint for large diameter heads or lipped liners vs soft tissue constraint for higher
offset constructs) Considering the surgical implications of how each construct affects
dislocation propensity and each of the associated constituent risks (ROM at dislocation,
resistive moment) can lead to improved THA patient outcomes by reducing the
occurrence of adverse clinical events.
53
Chapter Five: Summary
This study was performed to provide objective data to be considered in the
treatment choices for THA patients to protect against adverse joint loading conditions and
joint instability. Effects of such conditions are detrimental not only in terms of cost to
healthcare systems, but more importantly to patients who are affected by these
conditions. Hip dislocation is a traumatic and painful event. Instability and dislocation
remains a leading indication for revision of primary THA constructs; this work provided
objective data to be used for the betterment of THA outcomes in a patient population.
Adverse loading conditions were assessed in a population of activities of daily
living using data from telemetric hip implant measurements in an FE simulation which
included probabilistic representation of clinical implant position variation. Dislocation
was assessed using a series of strength-calibrated joint contact and muscle forces.
Dislocation propensity was evaluated using a variety of THA implant designs in subject-
specific musculoskeletal models of patients with THA performing activities consistent
with posterior and anterior THA dislocation. The resistive moment at the point of
dislocation, as well as the overall dislocation rate per construct provide relevant measures
of resistance of the THA construct to dislocation. This data, in combination with the
appropriate identification and collection of individual patient, can provide the basis of a
predictive tool used to aid in the treatment of THA patients at the time in which they
present for hip replacement as well as intra-operative, data-driven guidance.
54
Based on a range of acetabular implant alignments reported clinically, variation in
cup anteversion/retroversion had the largest impact on liner peak loading location of any
degree of freedom throughout the prescribed activities. Cup inclination also showed a
relationship between angle and response liner loading; stem variation in either
longitudinal plane was not strongly correlated to edge loading propensity across
activities.
Increased cup anteversion and inclination reduced the occurrence of posterior hip
dislocation (82% vs 48% for anteversion and 86% vs 34% for inclination with neutral
liners), however increased the occurrence of anterior hip dislocation (13% vs 94% and
39% vs 70%). Increased hip abduction and internal rotation reduced the occurrence of
dislocation during posterior activities (79% vs 43% and 76% vs 50% for neutral liners
respectively), but increase the occurrence of dislocation in anterior dislocation activities
(45% vs 69% and 46% vs 67% for neutral liners respectively). In each instance, a lipped
liner with a posterior-inferior lip position reduced the occurrence of posterior dislocation,
however increased the occurrence of anterior dislocation.
Considering implant geometry, head offset had a large impact of the resulting
resistive moment of the THA construct, with a sensitivity of approximately 3.8 Nm/mm
of additional offset. Increasing head diameter from 32mm to 40mm increased resistive
moment from 21 Nm to 27 Nm, a sensitivity of 0.75 Nm/mm of head diameter. Three
lipped liners were considered with increasing jump distance. These designs corresponded
to 23 Nm, 25 Nm, and 31 Nm resistive moments, respectively, a sensitivity of
55

approximately 2.8 Nm/mm of additional jump distance. A dual-mobility acetabular
design resulted in a resistive moment of 30 Nm.
This work, and future work based on these methods, may provide objective data
to be considered in the treatment algorithm of THA patients to protect against adverse
joint loading conditions and joint instability.
56

References
1. Patel AB, Wagle RR, Usrey MM, et al. 2010. Guidelines for Implant Placement to Minimize Impingement During Activities of Daily Living After Total Hip Arthroplasty.J. Arthroplasty 25(8):1275–1281
2. Renkawitz T, Haimerl M, Dohmen L, et al. 2012. The association between Femoral
Tilt and impingement-free range-of-motion in total hip arthroplasty.BMC Musculoskelet. Disord. 13(1):65
3. Higa M, Tanino H, Abo M, et al. 2011. Effect of acetabular component anteversion on
dislocation mechanisms in total hip arthroplasty.J. Biomech. 44(9):1810–1813 4. Kennedy JG, Rogers WB, Soffe KE, et al. 1998. Effect of acetabular component
orientation on recurrent dislocation, pelvic osteolysis, polyethylene wear, and component migration. J. Arthroplasty 13(5):530–534
5. Harris WH. 2012. Edge loading has A paradoxical effect on wear in metal-on-
polyethylene total hip arthroplasties.Clin. Orthop. Relat. Res. 470(11):3077–3082 6. Vissers MM, Bussmann JB, Verhaar J a N, et al. 2011. Recovery of Physical
Functioning After Total Hip Arthroplasty : Meta-Analysis of the Literature.Phys. Ther. 91(5):615–629
7. Petrella AJ, Stowe JQ, D’Lima DD, et al. 2009. Computer-assisted versus manual
alignment in THA: A probabilistic approach to range of motion.Clin. Orthop. Relat. Res. 467(1):50–55
8. Kwon Y-M, Mellon SJ, Monk P, et al. 2012. In vivo evaluation of edge-loading in
metal-on-metal hip resurfacing patients with pseudotumours.Bone Joint Res. 1(4):42–49
9. Tsai TY, Dimitriou D, Li G, Kwon YM. 2014. Does total hip arthroplasty restore
native hip anatomy? Three-dimensional reconstruction analysis.Int. Orthop. 38(8):1577–1583
10. Liebs TR, Nasser L, Herzberg W, et al. 2014. The influence of femoral offset on
healthrelated quality of life after total hip replacement.Bone Jt. J. 96 B(1):36–42 57
11. Renkawitz T, Tingart M, Grifka J, et al. 2009. Computer-assisted total hip
arthroplasty: coding the next generation of navigation systems for orthopedic surgery. Expert Rev Med Devices 6(5):507–514
12. Bergmann G. (Ed) 2008. Charite – Universitaetsmedizin Berlin (2008) “Orthoload”.
Retrieved August 9, 2016 from http://Orthoload.com 13. Fitzpatrick CK, Clary CW, Rullkoetter PJ. 2012. The role of patient, surgical, and
implant design variation in total knee replacement performance. J Biomech. 45: 2092-2102
14. Bozic KJ, Kurtz SM, Lau E, et al. 2009. The epidemiology of revision total hip
arthroplasty in the United States. J Bone Joint Surg. Am. 91(1): 128-133 15. Bourne RB, Mehin R. 2004. The dislocating hip: what to do, what to do. J.
Arthroplasty 19(4): 111-114 16. Schairer WW, Sing DC, Vail TP, et al. 2014. Causes and Frequency of Unplanned
Hospital Readmission After Total Hip Arthroplasty. Clin. Orthop. Relat. Res. 472(2): 464-470
17. Milstein A. 2009. Ending Extra Payments for “Never Events” – Stronger Incentives
for Patient’s Safety. New England J. of Medicine 360:2388-2390 18. Masonis JL, Bourne RB. 2002. Surgical Approach, Abductor Function, and Total Hip
Arthroplasty Dislocation. Clin. Orthop. Relat. Res. 405: 46-53 19. Khatod M, Barber T, Paxton E, et al. 2006. An analysis of the risk of hip dislocation
with a contemporary total joint registry. Clin. Orthop. Relat. Res. 447: 19-23 20. Soong M, Rubash HE, Macaulay W. 2004. Dislocation After Total Hip Arthroplasty.
J. American Academy Orthop. Surgeons 12(5): 314-321 21. White RE, Forness TJ, Allman JK, et al. 2001. Effect of Posterior Capsular Repair on
Early Dislocation in Primary Total Hip Replacement. Clin. Orthop. Relat. Res. 393: 163-167
22. Goldstein WM, Gleason TF, Kopplin M, et al. 2001. Prevalence of Dislocation after
Total Hip Arthroplasty Through a Posterolateral Approach with Partial Capsulotomy and Capsulorrhaphy. J. Bone and Joint Surgery – Am 83(2) 2-7
58
23. Mihalko WM, Whiteside LA. 2004. Hip Mechanics After Posterior Structure Repair
in Total Hip Arthroplasty. Clin. Orthop. Relat. Res. 420:194-198 24. Elkins JM, Stroud NJ, Rudert MJ, et al. 2011. The capsule’s contribution to total hip
construct stability -- a finite element analysis. J Orthop. Res. 29(11): 1642-1648 25. Seagrave KG, Troelsen A, Madsen BG, et al. 2017. Can Surgeons Reduce the Risk
for Dislocation After Primary Total Hip Arthroplasty Performed Using the Posterolateral Approach? J. Arthroplasty 32(10): 3141-3146
26. Geier A, Kluess D, Grawe R, et al. 2017. Dynamical analysis of dislocation-
associated factors in total hip replacements by hardware-in-the-loop simulation. J Orthop. Res. 35(11): 2557-2566
27. Berry DJ, Van Knoch M, Schleck CD, et al. 2005. Effect of femoral head diameter
and operative approach on risk of dislocation after primary total hip arthroplasty. J Bone Joint Surg. Am 87(11): 2456-2463
28. Howie DW, Holubowycz OT, Middleton R, et al. 2012. Large femoral heads decrease
the incidence of dislocation after total hip arthroplasty: a randomized controlled trial. J Bone Joint Surg. Am 94(12): 1095-1102
29. Bunn A, Colwell CW, D’Lima D. 2014. Effect of Head Diameter on Passive and
Active Dynamic Hip Dislocation. J. Orthop. Res. 32: 1525-1531 30. Rathod PA, Bhalla S, Deshmukh AJ, et al. 2014. Does Fluoroscopy With Anterior
Hip Arthroplasty Decrease Acetabular Cup Variability Compared With a Nonguided Posterior Approach? Clin. Orthop. Relat. Res. 472(6): 1877-1885
31. Myers C, Shelburne K, Laz P, et al. 2017. In Vivo Total Hip Arthroplasty Kinematics
during a Range of Dynamic Activities using Stereo Radiography. Proceedings of 63rd annual Orthopaedic Research Society Meeting. Paper No.0114
32. Delp, S.L., Anderson, F.C., Arnold, A.S., Loan, P., Habib, A., John, C.T.,
Guendelman, E., Thelen, D.G., 2007. OpenSim: Open-source software to create and analyze dynamic simulations of movement. IEEE Trans. Biomed. Eng. 54, 1940–1950. doi:10.1109/TBME.2007.901024
33. Myers, C.M., Laz, P.J., Shelburne, K.B., Judd, D.L., Huff, D.N., Winters, J.D.,
59
Stevens-Lapsley, J.E., Rullkoetter, P.J. 2018. The impact of hip implant alignment on Muscle and joint loading during dynamic activities. Clinical Biomechanics. doi:10.1016/j.clinbiomech.2018.02.010
34. Anderson, F.C., Pandy, M.G., 2001. Static and dynamic optimization solutions for
gait are practically equivalent. J. Biomech. 34, 153–61. 35. Bergmann, G., Graichen, F., Rohlmann, a., Bender, a., Heinlein, B., Duda, G.N.,
Heller, M.O., Morlock, M.M., 2010. Realistic loads for testing hip implants. Biomed. Mater. Eng. 20, 65–75. doi:10.3233/BME-2010-0616
36. Nadzadi ME, Pedersen DR, Yack HJ, et al. 2003. Kinematics, kinetics, and finite
element analysis of commonplace maneuvers at risk for total hip dislocation. J Biomech. 36(4): 577-591
37. Telleria JJ, Lindsey DP, Giori NJ, et al. 2001. An anatomic arthroscopic description
of the hip capsular ligaments for the hip arthroscopist. Arthroscopy 27(5): 628-636
38. Hewitt J, Guilak F, Glisson R, et al. 2001. Regional material properties of the human
hip joint capsule ligaments. J. Arthroplasty 19(3): 359-364 39. van Arkel RJ, Amis AA, Jeffers JRT. 2015. The envelope of passive motion allowed
by the capsular ligaments of the hip. J Biomech. 48(14): 3803-3809 40. Nadzadi M, Pedersen D, Callaghan J, et al. 2002. Effects of acetabular component
orientation on dislocation propensity for small-head-size total hip arthroplasty. Clin. Biomech 17(1): 32-34
41. Hua X, Li J, Jin Z, et al. 2016. The contact mechanics and occurrence of edge
loading in modular metal-on-polyethylene total hip replacement during daily activities. Med. Eng. and Physics 38(6): 518-525
42. Wolson ST, Rahimtoola ZO. 1999. Risk factors for dislocation during the first 3
months after primary total hip replacement. J. Arthroplasty 14(6): 662-668 43. Hyodo K, Masuda T, Aizawa J, et al. 2017. Hip, knee, and ankle kinematics during
60

activities of daily living: a cross-sectional study. Brazilian J. Phy. Therapy 21(3): 159-166
61