Embed Size (px)
Citation preview

Prediction of the Performance of Mineral Fillers in SMA
N. Shashidhar', S. P. Needham', 8. H. Chollart and P. Romero'
Abstract
Previous studies(I, 2) on finding parameters that distinguished between "bad" and "good" performing fillers for stone matrix asphalts concluded that only the Rigden voids could singly distinguish between most of tile "good" and "bad" fillers. The "good" and "bad" were based on field experience during stone matrix asphalt (SMA) pavement construction in three European countries (2). There were inconsistencies and exceptions to this conclusion that suggested that there could be other factors that influence the stiffening potential of mineral fillers. A recent study(3) explored the factors affecting tnc stiffening ~tential of asphalts. They showed two parameters. the maximum packing fraction, t. and the generalized Einstein coefficient. KE• to characterize the asphalt· fi ller system. The volume·fiJling contribution to stiffening was captured by the parameter +. and the physiC(H:hemical contribution was captured by~. These parameters had a physical basis and were a function of many factors that affected the stiffening potential of fi llers. These parameters were determined ror the fillers used in previous study{t , 2). It was found that the volume·filling contribution to stiffening <+..} was able to better distinguish between fillers with "good" and "bad" performance in SMA in the cases studied. It was able to predict the perfonnance accurately even in cases in which prediction by Rigden voids had failed.
Key Wordf
Mineral fillers, Stone matrix asphalt, Rigden voids
Introductwn
The influence of mineral fillers on asphalt and asphalt concrete has been repol1ed quite extensively in the literature(4, 5). Mineral fillers are known 10 affect the workability of the mix and therefore play an important role in the compaction and performance of bituminous mixtures. In fact, if a core of asphalt concrete is observed in crosrsection three components can be visually observed-aggregates, air voids and mastic. The asphalt cement occurs not as asphalt alone, but is intimately mixed with mineral fi llers forming the mastic. Such a distribution points to the important role played by the mastic in the workability and performance of asphalt concrete.
A typical dense graded mix may contain as much as 5 percent (by weight of the mix) of ·75 ~ (·200 mesh) material, referred to as filler, and 5 percent (by weight of the mix) of
• Soillll'ld Land Usc Technology, Inc. I Federal Highway Administr.llion

2
asphalt cemcnl.lfal1lhe filler is assumed to mix with all the asphalt. a ratio orlO:70 ratio of fil ler \0 asphalt by volume c:lll be expected. As some asphalt coats the coaJ1«
aggregates, this ratio is likely to be higher, more on the order of 40:60 by volume. As pointed by Anderson and GoetZ(5), at these ratios, the filler will be floating in asphalt and the reinforcement of the asphalt by the filler is the result of volume filling and physicochemical interaction between the asphalt and the filler. The behavior of particles floating in asphalt is much like a suspension of particles in a liquid/semi-solid medium. This is in contrast to the behavior oCtbe coarser aggregates where the particle-particle contact plays the dominant role in determining the mechanical properties o(the mix.
In a previous study, Harris and SIu.art{I) investigated the means of distinguishing berween good and bad mineral fi llers for slone mastic asphalt (SMA) mixtw"es. They obtained several fil1m from Europe for which the field performance in SMA mixes was known. They concluded thai the fractional voids in a dry compact (Rigden voids) measured with the Anderson modified Rigden procedure correlated the most with the stiffening potential of asphalt. They further noted that none of the other measured characteristics of the fillers (fineness modulu.s. coefficient of uniformity. coefficient of curvature, median particle size. specific surface area. cumulative -30 JlRl, cumulative - IO~) showed any correlation with the stiffening P.Otentiai orthc fillers.
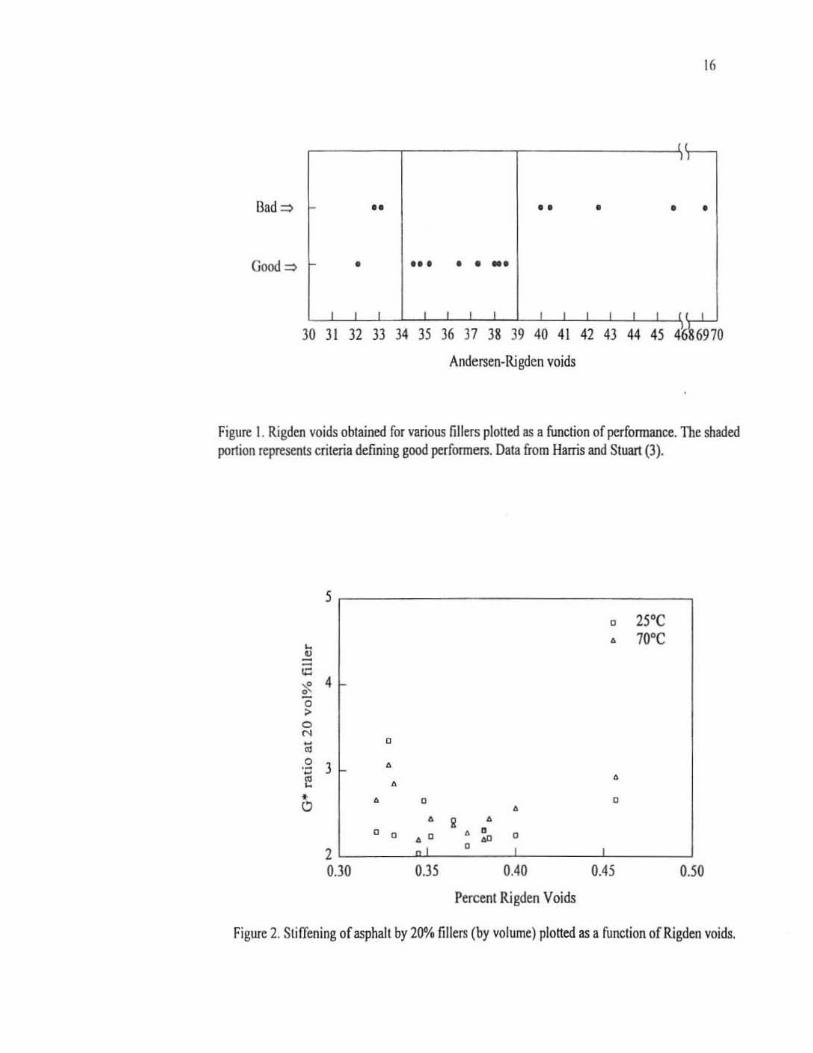
Their data, summarized in Figure I, showed that fillers with Rigden voids greater than ]9'10 or with Rigden voids less than 34'/, tend 10 be bad perfonncrs. A filler was labeled a bad performer when it resulted in a very stiff mix that was difficult to lay-down or cracked soon after lay-down in the field. A filler was also labeled a bad perfonner when it did not stiffen the milt enough so that the asphalt drained after lay-down. Intuitively, a filler with high Rigden voids wil1 stiffen to cause cracking and a filler with low Rigden voids will no! stiffen the mix enough and cause drain-down.
The conclusions of Harris and Stuan's \.\'Ork suggested thai the perfonnance of the fillers was directly related to the stiffening power of the fillers and that the Rigden voids was a measure of this stiffening power. This suggests that the Rigden voids should correlate with the stiffening of asphalts. However, when asphalt stiffening was planed as a function of Rig den voids at 25°C and nrc, as in Figure 2, it becomes evident that there is no correlation. Therefore.. Rigden voids cannot completely explain the performance of the filler. This paper reports the resul ts of an investigation of the behavior of asphaJt-filler systems using the same fillers that were used in the Harris and Stuart study and proposes another factor thaI predicts the performance of fillers in SMA mixes.
Prt'llious work
In 1976 Puzinauskas(6) measured the effect of filler on (steady state viscosity?) properties of the mastic and concluded that mineral fillers drastically changed these properties. He showed that different fillers affected the properties of the mastic differently and recommended particle size analysis, plasticity index of the mastic. and immersioncompression tests be U5ed to better control the quality of the mineral fillers.

J
Later, in 1980, Anderson and GoelZ(5) used dynamic tests and creep tests to develop master curves fot mastics. When the master curves for the mastic were compared with the binder, they noted a simple horizontal and vertical shift orlhe master curve of asphalt atone does not necessarily result in the master curve of the mastic. They focused on providing a method to characterize the stress strain behavior of mastic. Their work does not explain why fillers are different from each other in terms of stiffening potential.
On the basis of extensive work, Rigden(1) showed that the percentage of voids in compacted fillers (Rigden voids) gives some indication oflhe stiffening potential of the fillers. When a fillcr was compacted using a specific procedW'e, those with a larger percentage of voids usually showed higher stiffening potentiaL This was also confirmed by Anderson and Chrismer(I). Also, the accuracy of predicting the stiffening potential was as good as the ability to measure the fractional voids. They recommended modifications in Rigden's procedure to measure fractional voids. They also noted that gradation plays a limited role and should not be used to predict stiffening potential.
Fritschy and Papirer(9) published a series of papers on measuring the complex shear modulus of asphalt with silica. They attributed the changes in stiffening potential among binders to changes in the specific surface area of fillers. However, the particle siu of tile fillers used in their study was much finer than what would typically be used in asphalt concrete.
Craus, Ishai and Sides(IO) proposed a classification scheme for mineral fillers based on a durabiiity parameter measured by immersion of an asphal t-aggregate mixtlU'e in water for 14 days at 60°C. This parameter was based on resilient modulus and Mwall stability. However, due to its empirical nature, it does nol relate to any material property of the mastic.
In a recent pUblication, Shashidhar and Romero(3) analyzed the factors that affect the stiffening potential of a mastic in detail. They identified two parameters, the maximum packing fraction, •• , and the generalized Einstein coefficiel!l, KE> as characterizing stiffening polenlial of the asphalt-filler system. They discussed in delail how each factor such as the gradation, particle size, degree of dispersion, and particle shape affect •• and K" and hence the stiffening potential. They noted that it is best to measure these two parameters directly for a given filler-asphalt system.
Although many researchers have recognized the part played by factors such as aggregate size, gradation, shape etc., it was only recenlly that a direct relationship between these parameters and mastic property was clearly identified(J). Until recently, the only methods we had of evaluating the performance of a mineral filler was either to measure Rigden voids and/or to make the mix and conduct mixllJre tests. As pointed out earlier, there are inconsistencies in the relationship between Rigden voids and stiffening factor.
Objective
This paper will report on extending the approach by Shashidhar and Romero to present a coherent theory for the behavior of asphalt filler systems. We will identify the properties of the mastic that control the perfonnance of fillers in SMA mixes. A parameter for predicting the performance of fillers in SMA mixes will be identified, and its predictability discussed.
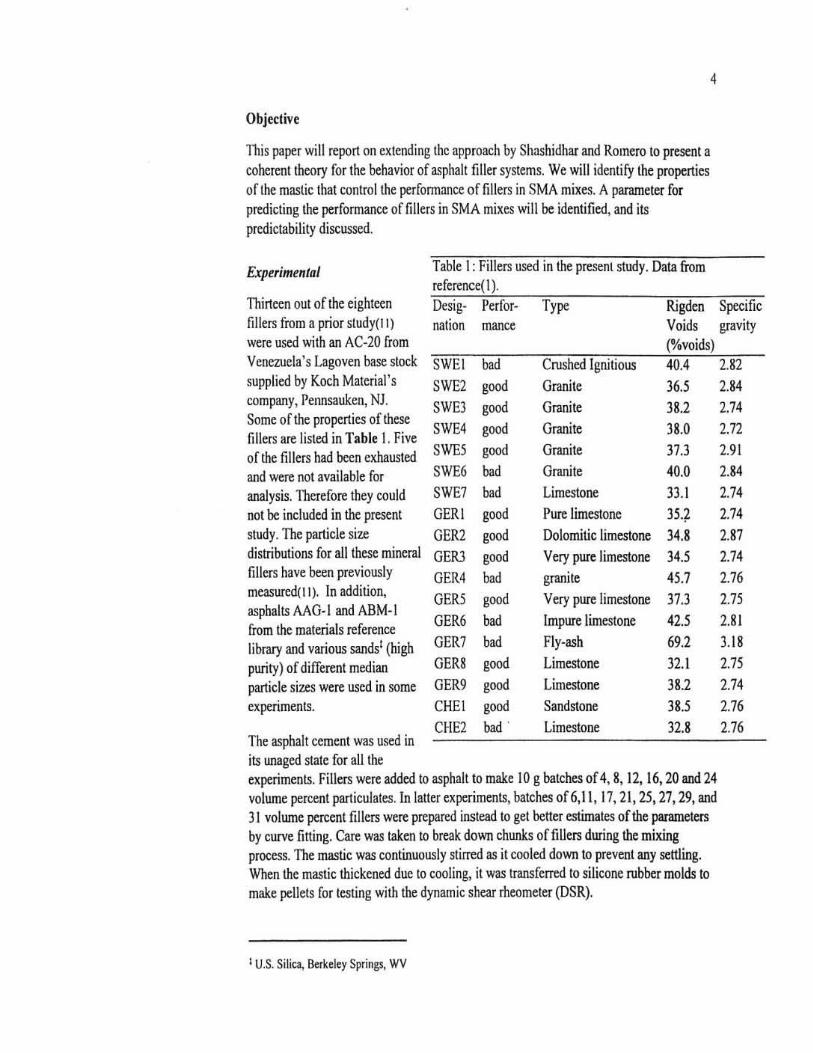
Expl!fimellia/ Table I: Fillers used in the present study. Data from reference(I).
Thirteen out of the eighteen Desig· Perfor- Type Rigden fillers from a prior sludy{l l) nation manet Voids
4
were used with an AC·20 from (%voids) Venezuela's Lagoven base stock SWEI bad Crushed Ignitious 40.4 supplied by Koch Material's SWE2 good Granite 36.5 company, Pennsauken, NJ. SWE3 good Granite 38.2 Some of the properties of these
SWE4 good Granite 38.0 fillers are listed in Table I. Five of the fillers had been exhausted SWE5 good Granite 37.J
and were not available for SWE6 b,d Granite 40.0
analysis. Therefore they could SWE1 bad Limestone 33.1 not be included in the present GERI good Pure limestone 35., study. The particle size GER2 good Dolomitic limestone 34,8 distributions for all these mineral GOO good Very pure limestone 34.5 fillers have been previously GER4 bad granite 45.7 measured(l J). In addition, GER5 good Very pure limestone 37.J asphalts MG-J and ABM-J from the materials reference GER6 bad Impute limestone 42.5
library and various sands! (high GER7 b,d Fly-ash 69.2
purity) of different median GER8 good Limestone 32.\
particle sizes were used in some GER9 good Limestone 38.2 experiments. CHEI good Sandstone 38.5
CHE2 bad Limestone 32.8 The asphalt ccment was used in its unaged state for all the experiments. Fillers were added to asphal t to make 10 g batches of 4,8, 12, 16,20 and 24 volume percent particulates. In latter experiments, batches of 6, II, 17, 21, 25, 27. 29. and 31 volume percent fillers were prepared instead to get better estimates of the parameters by curve fining. Care was taken to break down chunks of fill ers during the mixing process. The mastic was continuously stirred as it cooled down to prevent any settling. When the mastic thickened due 10 cooling, it was transferred to silicone rubber molds to make pellets for testing with the dynamic shear rheometer (DSR).
I U.S. Silica, Berkeley Springs, WV
Specific gravity
2.82 2.84 2.74 2.72
2.91 2.84 2.74
2.74
2.87 2.74 2.76 2.75 2.81 l l8 2.75 2.74
2.76 2.76
I
Testing of the mastics was done with a Rheometries RDA II dynamic shear rheometer (DSR) with a FRT torque transducer. The transducer was used in its most sensitive range (200 g-em full scale and torque sensitivity of 0.2 g-cm). Strain sweeps were measured at 2SoC and 10 radls frequency with 8 mrn parallel plate geometry and 2 nun gap and at 70°C with a 25 nun parallel plate and I mm gap. There has been discussion as to the maximum size particulates that can be used between parallel plates with lmm gap.
The issue of the maximum size filler particle that could be used in a DSR was not addressed in this study. [t was assumed that if the maximum size of the filler particles was less thai 1110" the gap, the rheometer would see the mastic as a homogenous system. Therefore, in this study only fine particulates with over 90% weight below 75 f.lm were tested.
Scllling tests were conducted on some fillers. The fillers with approximately similar median particle size (DwJ and fraction liner than I~ were chosen. For these tests 30';' fillers (by volume) were added to the asphalt, mixed thoroughly by a mecltanical stirrer and subjected to ultrasonic vibration to break: down agglomerates. The mastic was then pnured into a test tube and left in the oven fo r 145 hours at 165°C. The test tubes were then cooled and imaged by x-ray radiography using a medical-grade machine.
Ra ultr Dnd Discussion
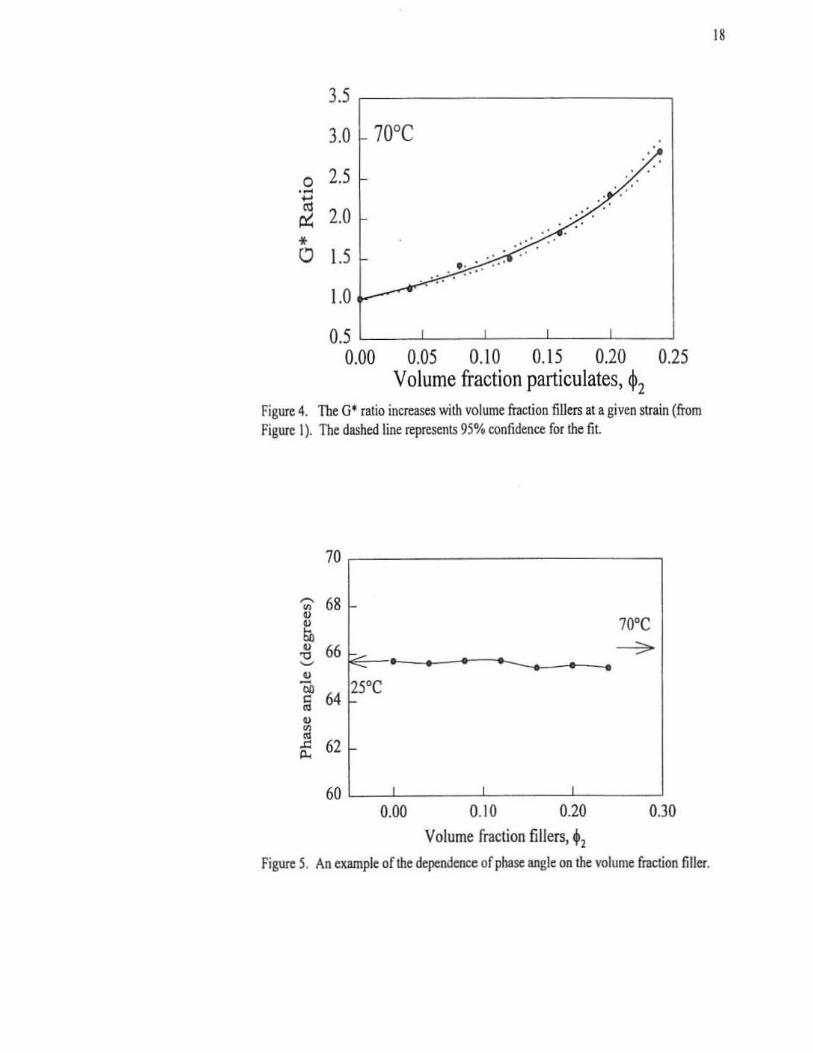
The cltange in complex. shear modulus (0' ) with strain (referred to as a strain sweep) of the Venezuelan asphalt with different amount of filler is shown in Figure 3 at 25DC and 7oDe. These curves are representative for all the fillers studied. These curves show that 0' increases with the addition offiller. These curves further show the range of strain for which the material shows a linear viscoelastic behavior. This range decreases with increasing volume fraction of fill er. For further analysis, a strain was selected so that the asphalts when combined with various amounts of fillers were within the linear range. The ratio ofOt of the mastic divided by 0- of the neat asphalt (subsequently referred to as the 0 ' ratio) as a function of volume fraction particulates, +1' is shown in Figure 4. These curves characterize the dcpendence of the mastic rheology as a function of volume fraction of the filler. These results are consistent to those obtained by previous researchers(6,1, (2). This indicates that the Ot ratios and viscosity ratios follow similar behavior.
The dependence of the phase angle on volume fraction of me filler was also studied. Figure S shows a representative ex.ample whieh shows that at both temperatures, the phase angle does not vary as a function of +).

Rcreatabilily
In order to verify the repeatability in measuring G' for fi lled systems. three samples made v.ith a mixture of a single liller, 40j.lm sand. ilIKI AAM-I asphalt were prepared. The complex shear modulus, G' . and the phase angle. 6. was measured at two temperatures (25 and 58°C). The results are plotted in Figure 6 and summarized as coefficient of variation (CV) in T.ble 3. TIle Table shows that each measurement has a repeatability consistent with the round robin resulls(IJ) (shown in Table 2), except for G' at 25°C of the mastic with 0.\\ volume fraction filler. 111is variability was attributed to one bad measurement.
Obviously, several factors contribute to obtaining repeatability in measurement. If a coarse filler is used (e.g., 125 j.lm) more variability in measurement would be expected. Keeping the hoI (liquid) binder constantly stirred to prevent seltling is key to good repeatability. Care must be taken 10 ensure that filler particles do not settle at any step during the sample preparation process.
Table 3: Repeatability ofG' and 6 Measurements of Mastics. ZsoC
Volwne fraction G' cv 0 cv G' fillers (MP,) (G' ) (1 (0) (P,)
0 1.03 5.7 60.8 1.1 JI59 0.06 1.41 5.7 59.6 0.4 40J9 0.11 1.52 17.8 60.0 I.l 4880 0.17 2.27 2.3 59.3 0.7 6J08 0.21 2.79 4.2 59.4 0.8 7657 0.25 3.02 2.3 59.6 0.5 86 11 0.27 3.27 2.8 59.6 0.4 9852 0.29 3.71 4.0 59.6 0.4 1091l 0.31 4.09 5.4 59.2 0.7 12674
QuantifiCition of Mutics Rheology
Tlble 2: Within-Laboratory Repeatability for DSR Measurements. From Reference (13j)
Property DlS
G' (8 mm) 7.2 0(8 mm) J.l G' (25 mm) 4.9 0(25 mm) 0.8
we CV 0 CV (G' ) r) (0) 5.3 85.7 0.1 2.3 85.4 0.1 2.7 85.4 0.1 4.8 85.4 0.5 3.5 85.2 0.1 3. 1 85.2 0.1 2.8 85.0 0.1 2.4 85.0 0.1 4. 1 84.9 0.4
6
Quantification of mastic rheology is useful in several ways.-i t helps in predicting what the stiffness of lhe mastic wi ll be. It can help as a check of mastic consistency. It can also provide insight about the state of the system so that comparisons can be made between different binder-filler systems 10 select the optimum system.

Quantification of curves such as in Figure 4 is 1\01 new. Investigators since Einstein(14),(lS),(16) have come up with a plethora of equations. These equations range from empirical. semi-empiricaJ and to rigorous. TIJeSe equations were derived for different specific material systems-mose thaI have an adsorbed layer on its surface; those dealing with emulsions; those specifically designed for colloidal particles, where particle-particle interaction will be high; those having origins from Einstein'S equatiOn(IS); those derived from an elastic analysis of solids;{17) etc. Since our purpose was to understand the nalure of asphalt·fillu systems, the Nielsen modified Kerner's equation was chosen. This equation relates the increase in any modulus with the addition of fillers as given below:
M I+AB+l - = M, 1- B'V+1
Equation I
M-any modulus. (shear, elastic,clc) '1=yo1ume fraction filler A, B, C, IV = constants, as defined +. =maximum volume fraction
The subscript I refers to asphalt and the 2 refers KE"'generalizcd Einstein coefficient to fi llers. The constant A takes into account such factor.; as geometry of the filler phase aoo Poisson 's ratio of the matrix. The constant B takes into acCOWlt the relative modulii of the matrix and filler phases as given by
Equation 2
Its value is 1.0 for very large MIM, ratios. i.e., when particulates are much stiffer than binder. The factor 'V depends on the maximum packing fraction, +., of the filler. An empirical equation that satisfactorily describes the relationship between IjI and +. is
I-I-"';;\+--1, • 1-' Equation 3
The oonslant A is related to the generalized Einstein coefficient ~ by
Equation 4
In the case of mineral filler in asphalt, since the modulus of the filler is much higher than the asphalt, the value of B is unity. Substituting B=i and equation 3 in equation I, one C3!I obtain
M J +A+2 - = MI \-(1+C+1)+1
Equation S
where
7

I - P. Co -
p.' Equation 6
By curve-fitting equation 5 to the data, the constants A and C can be estimated. From these parameters, the generalized Einstein coefficient KE and the maximum packing fraction, +., can be calculated.
8
Equation I was initially derived from Kerner's equation which is a derivation from elastic analysis of two-phase systems. Nielsen's generalization of this equation enabled this equation 10 be used successfully in viscoelastic systems. An important factor that enabled successful adaptation oflhis equation is the fact thai the viscosity ratio and the shear modulus ratio are related by the following equation( IS).
(" 1 (4-5,,)(0 1 ~- I - 3(1-vd' ~-l Equation 7
When Poisson's ralio is 0.5, the viscosity ratio and the shear mod!llus ratio are equal. From Figure 5 we can see
G-shear modulus of mastic G1=shear modulus of asphalt lJ=viscosity of mastic lJ1=viscosity of asphalt v,"'POisson's ratio of asphalt
that the addition of mineral filler does not affect the phase angle significantly. Therefore, for mineral filler in asphalt matrix, the following relationship stands.
G G' G' Equation 8
Thus. for any given system. the constants K( and +. can be estimated from !he Gt data. These two parameters define the rheology of the asphalt-filler system. A knowledge of Ihe variat ion of ~ and~", for different asphalt-filler systems as a function of properties of interest may lead 10 the selection of appropria te powders to improve such properties.
Significance or +. and Kt on stiffening potential
.'igure 7 shows the effect of changing +. while keeping ~ constant (=6). The +. acts as a vertical asymptote to the curves. This is intuitive, since at+ .. , the particles touch one another forming a rigid structure that is infinitely stiffer than the stiffness oftne asphalt A mastic with +l greater than + .. is not possihle as under these conditions there will be three distinct materials-mineral filler, asphalt and air·voids. The Nielsen modified Kerner's equation cannot be applied in such a case.
The variation of stiffness curves with K£ at constant +. (=0.50) is shown in Figure 8. As K( increases, the slope of the curves increase. Thus, this parameter is an indicator of the rale of increase of stiffness with addition of filler particles. When KE is 1.0, there is no bond between filler and asphalt, the G· does nol increase unlillne loading gets fairly high. The stiffening effect, shown by the lowest curve (KE""' I) in Figure 8, is due solely to the volume filling by the filler. M K£ increases, there is morc of a stiffening effect

9
with the addition of filler. As the filler particles start to in teract more wi th the asphalt and between themselves, the stiffening effeCI increases and the rale of increase of stiffening with increase in +1 also increases.
Physical meaning or the p:ar.tmeten
Figure 9 illustrlltes the volumetrics orlhe mastics as used in the asphalt induslry{7, I). The volume of the asphall-filler mixture is composed of three fractions- the solid volume of the filler particles, VI\.> the free (V..nJ and fixed (V.uJ volume of asphalt The fixed asphalt volume is defined as the volume of asphalt required to fi ll the voids between the solid filler particles, assuming the filler is compacted or consolidated to some reference density. The free asphah provides fluidity to the mixture. When a volume V1 of filler is added to a volume of asphalt V I. the volume fraction of fillers, +1 is defined by
Equation 9
The maximum amount of fi ller that can be added to the asphalt without forming air voids is defined as + .. the maximum volume fraction of the fillers. When a mastic has +1=+.' the particles are all touching one another with asphalt occupying all the void spaces. In Figure 9, if there were no free asphalt, the volwne fraction of filler is + •. Or
+ .. = Vn. = _VR_" VfL+ VAIX VFB
Equation lO
where all variables are as defined in Figure 9. If the particles are compacted according to Anderson modified Rigden procedure, the voids in the compact are defined as Rigden voids. In such a case +.'1R'
Even though +. and +. seem to measure the same property it is important to realize the difference between the cwo. This difference is that Rigden voids are measured for a dry filler compact, while the +. is measured for filler that is in asphalt. This implies that'. lakes into consideration any interaction effects between asphalt and filler. This difference can be very significant since a given filler can stiffen different asphalts to different degrees, or be affected by any treatments applied to the filler surface(J).
The generalized Einstein coefficient, KE, is more convoluted than +. and includes effects due to particle shape, asphalt-filler interaction, stale of agglomeration of the fill er, (if the filler exists in asphalt as individual parlicles or a groups of particles sticking to each other, called agglomerates), average panicle size. and olher factors. Fortunately for us, lhis parameter has been cKtensiveiy investigated in the past in other fields. For perfectly spherical fillers, in dilute suspension having perfect interface with the asphalt, K£ is 2.5 as derived by Einstein(t5). The implications of +. and KE are discussed in detail in a prior pubJication(J).

10
"arking of Filler Partidn
Packing of powders has been studied extensively in ceramics, paints. and other fields where high solids loading is desired. All research and innovation go into maximizing the amount of fillers added to a given system.
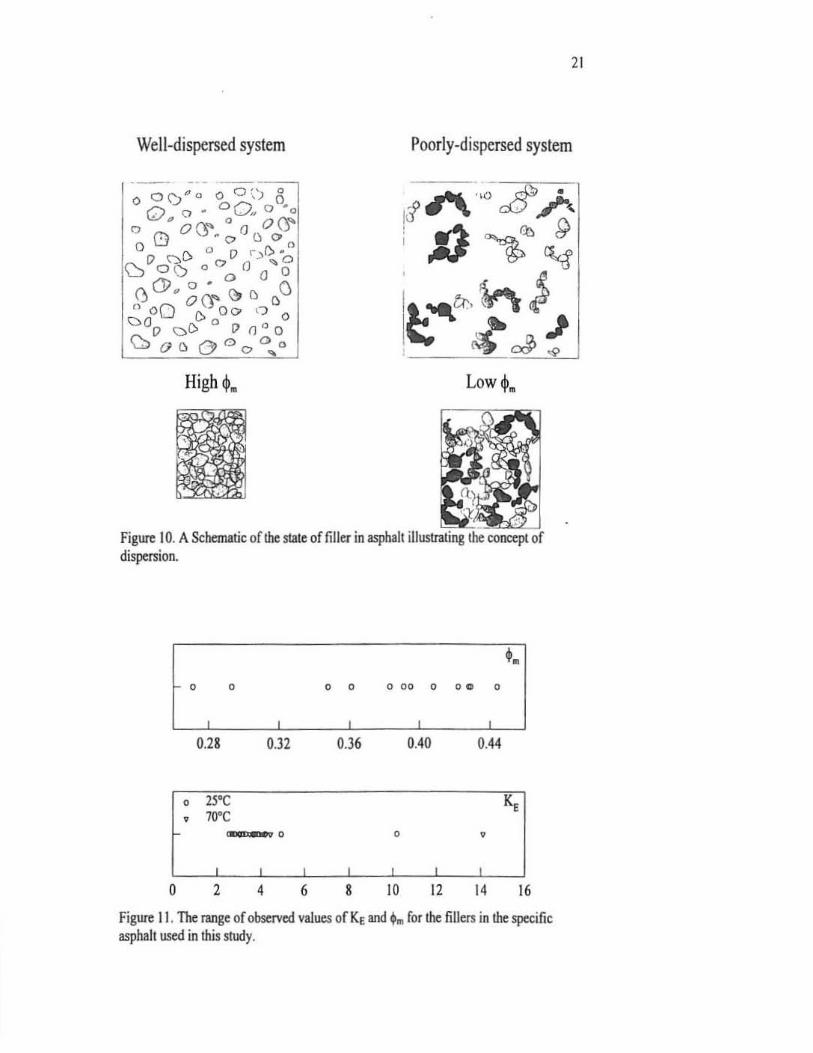
When the filler particles are mixed in asphalt they have a natural anraclion (van der Waal) for each other. This attraction causes the particles in suspension to join with other particles and form bridging slructurcs and inefficient packing as shown in Figure 10. Under these conditions not much loading is possible causing the +. to be low <t. is synonymous with bulk density; the higher the +., the higher the bulk densi ty).
This phenomenon is analogous to that observed during bulk density measurement of tillers. If the powder surface is not dry enough, a low bulk density will be obtained because the powders will nol pack efficiently. In the Rigden procedure, the filler particles are dried and an impact load applied forcing the particles to pack efficiently and give the highest level of densification. On the other hand. fillers in asphalt have mutually attraclive forces similar to moisture on powders that causes the particles to pack inefficiently.
It is lrue that filler particles in asphalt do nol Table 4: Panuneters +. and K£
physically come logether 10 (onn a compact, but Estimated from Fitting Equation 5 to
the rhrology depends on +. which is a reflection G· ratio Data
of the same tendencies in the system that lead the Filler t. K, powders to compact. In fact, the "golden 25"C 70·C standard" for estimating +. is the settling test, in which particles in a suspension are allowed to CHEI 0,395 2.810 4.003
settle under gravity. The volume fraction of CHE2 0.271 3.885 3.706 particles in the sediment is the +. which predicts GERI 0.429 3.297 4.204 the rh«llogy of the suspension( (9).
GER2 0.422 4.925 4.429 Since we do not know apriori what degree of GER3 0,391 2.552 3.040 dispersion is required for constructing asphalt
GER4 0,361 3.629 4.102 pavemcnts, one couJd question the need for engineering the asphalt-flller system to get GER7 0.293 10.19 14.10 maximum packing and thereby high + •. The GER9 0.428 3.750 3.651 suspension with high dispersion is also called a
SWE2 0.48 1 4.195 3.682 stabil ized syslem. The properties of a stablized suspension are very reapealable and consislant. SWEJ 0.408 3.169 3.480 This is the reason all industries deal ing with
SWEl 0.444 3.018 J.601 suspensions tend to stabilize them. A system that is nOI stabilized could have high scalter in SWE6 0,383 2.675 3.998 pmeasured properties due 10 IWO reasons: (I) the SWE7 0,348 2.775 3.024 mastics can get agglomerated to different degrees

depending on the mixing histories, and (2) shear orlhe mastic during mixing could selectively break down agglomerates that e<luse non-unifonn properties.
Behavior of asphalt-fillers systems
II
The data shown in Figure 3 was fined 10 equation 5 to estimate the parametm +. and Kt .
By defini tion, the dispersion of mastic defines +._ Two pellets cast from the same mixture (for measurements at 25·C and 70"C) should have the same + •. Therefore, the data al 250C and 7O"C were pooled 10 estimate +. and then separated to estimate ",. Using such a procedure is consistent with our definition of parameters and also gives lower variability (due 10 doubling of data points) in the non-linear curve-fitting.
All our data fit me equation with Rl greater than 0.99 indicating thaI this model can be applied to asphalt-filler systems. Table 4 gives a summary or ille conslanlS +. and KE for our chosen systems. These values are also graphically illustrated in Figure II. The +. was observed to be between 0.27 and 0.45 for all the fillers.
The ~ was distributed between 2 and 6 with the exception ofGER7. which is a fly ash. which had KEof 10.2 at25C and 14.1 at 70C. This indicated that the interaction of flyash with asphalt was much different than the interaction of other mineral filters with asphalt. The reason for this difference will be investigated in the fUMe.
By definition, if the filler particles pack as well in asphalt as they do in air (while detennining the Rigden voids), then the +. estimated from the rheology should be equal to the +. estimated from bulk density of fillet compact Figure 12 shows a comparison of +. and +. from lilerature(t2) and from the present study. The rheology data of Huschek and Angst were fit with Equation 5 to detennine Ihe + •. In both these studies, the +. estimated from rheology were between 0.30 and 0.45, while +. was between 0.6 and 0.7. There was little correlation between the two values. It was interesting \0 note that both +. and +. measured by two independent laboratories were in the same ballpark..
The fact that +. and +. do not agree could be explained in two ways--either our estimation of +. fro m rheology is incorrect or fillers behave in asphalt much diffcrently than they do in air. In order to verify this, settling experiments were conducted.
Sllle or Dispersion
Let us explore the concept of dispersion in greater detail . Figure 10 shows two different slales of a suspension. In one case when the filler is in suspension, eoch fi ller particle is separated from other panicles. This is a well-dispersed system. The particles in such a system settle very slowly, and when they do settle, they settle to a low volwne. This implies that when they settle they will have a high ••. On the other hand, fillers have a natural tendency to be attracted to one another by Van der WaaJ's forces, which make particles lump together, as shown in Figure 10. Such I system is called a flocculated
suspension. Such systems form a high sediment volume on settling allli consequently bave a low + •.
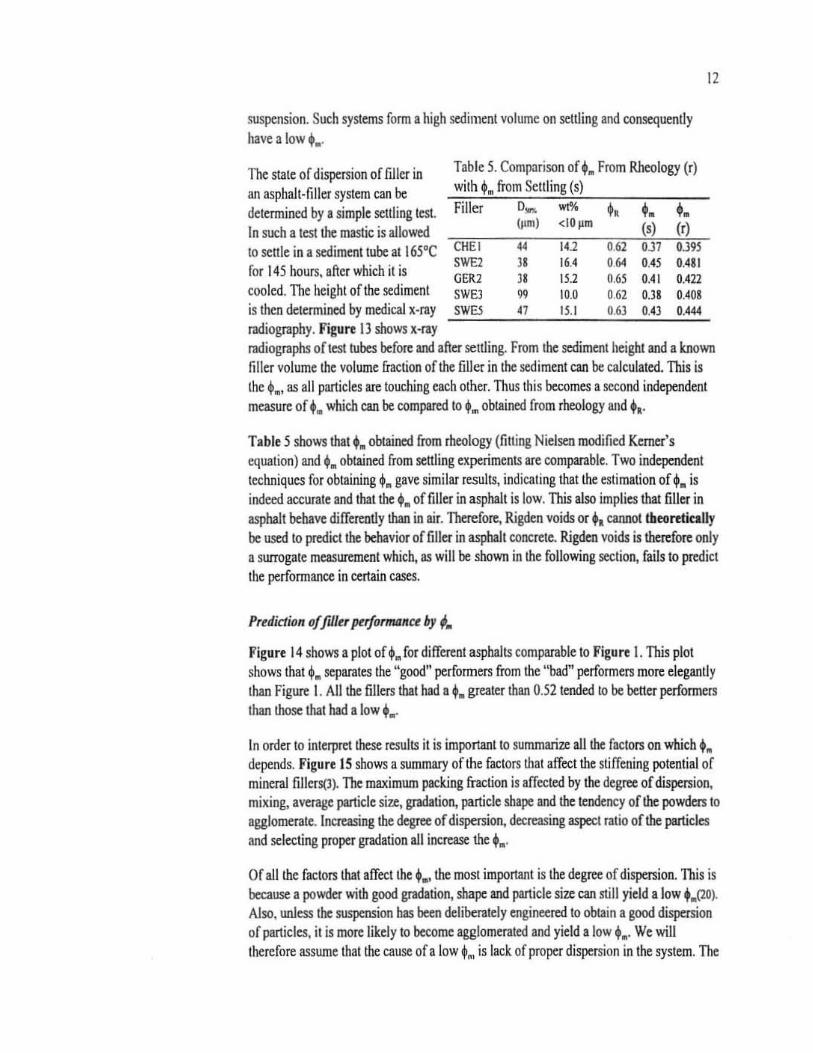
The state of dispersion of filler in an asphalt-filler system can be determined by a simple settling test. J n such a test the mastic is allowed
Table 5. Comparison of +. From Rheology (r) with +. from SeUling (5)
Filler 0,.,. wt%
to settle in a sediment tube: at 165°C CHE l for t45 hours. after which it is ~:; cooled. The height of the sediment SWEl
111m) <1O 11m .. 1I
" "
141 16.4 13.2 10.0
i.
0.62 064 0.65 0.62
i. (,) OJ7 0."5 0.41 OJ8
I. (r) OJ9S 0.481 0.422 OAOS
12
is then detennined by medical x-ray ..!SW~E5~_....:47~_'~S~. I_....:O.~6l~~O.'~l~O~"'=radiography. Figure 13 shows x·ray radiographs ar test tubes before and after settling. From the sediment height and a known filler volume the volume fraclion of the filler in the sediment can be calculated. This is the +., as all particles are touching each other. Thus Ihis becomes a second independent measure of +. which can be compared to .... obtained from rheology and 'l' Table 5 shows that ... obtained from rheology (fitt ing Nielsen modified Kerner's equation) and + .. obtained from settling experiments are comparable. Two independent techniques for oblaining +. gave similar results, indicaling that the eslimation of +. is indeed accurate and that the •• of filler in asphalt is low. This also implies that filler in asphalt behave differently than in air. Therefore, Rigden voids or •• cannot theontkally be used to predict the behavior of filler in asphalt concrele. Rigden voids is therefore only a surrogale measurement which, as will be shown in the following section, fails to predict the performance in certain cases.
Pudidion offdle, ~rfo'mII"ce by;.
Figure 14 shows a plot of,. for different asphalts comparable to Figure I. This plot shows that + .. separates the "good" performers from the "bad" performers more elegantly Ihan Figure I. All the fillers thai had a +. grealer than 0.52 tended 10 be better performers than those that had a low too'
In order 10 interpret these results il is important to sllmmarize all the factors on which,. depends. Figure 15 shows a sllmmary of the factors that affect the stiffening potential of mineral fillers(3). The maximwn packing fraction is affected by the degree of dispersion, mixing, average particle size, gradation, particle shape and the tendency of the powders to agglomerate. Increasing the degree of dispersion, decreasing aspect ratio of the particles and selecting proper gradation all increase the ••.
Of all the factors that affect the ••• the most important is the degree of dispersion. This is because a powder with good gradation, shape and particle size can still yield I low'.(20). Also. wtIe5S the suspension has been deliberately engineered to obtain a good dispmion of particles. it is more likely to become agglomerated and yield I low + •. We will therefore assume that the cause of a low 'n. is lick of proper dispersion in Ihe system. The

beller the powders are dispersed in asphalt. tne higher the •• and the more likely it is 10
perform better in SMA.
Il
As mentioned in tOe introduction, some fillers were labelled "bad" when they did nol stiffen the mix enough, causing drain down. The two fillers that were "bad" performers and had low Rigden voids are SWE7 and CHE2. Rigden's fractional voids ooncept would predict these fillers to have lower stiffnesses than "good" performers. [t can be Sten from Figure 2 that the stiffening caused by these two fillers (data points with circles is OO[
unusual ly low. The propenies of mixtures and mastics with these two fillers did 00111.150 distinguish them to be any less stiffer than other fillersp). Therefore, these two fillers fail the predictions by the Rigdeo's fractional voids concept.
A poor dispersion can decrease,. and cause very sliff SMA, thaI will crack after lay down. On the other hand, a poorly dispersed suspension is not a slable system. When such a system is subjected to the mixing operation with aggregates, the shearing action during mixing could break down these agglomerates causing the viscosity of the mastic to go down. This would cause drain down problems after the mix is placed. Thus, a low +. could cause both very stiff mastic and lean mastic.
Summary and conclflj;ons
The stiffening of asphalt by a filler can be fu lly characterized by measuring the maximum packing fraction, +., and the generalized Einstein coefficient, Kv of the system. The data oblained show that +. is a better predictor of the performance offilJer in SMA than Rigden voids. The specific conclusions reached in this study are as follows:
1. The complex modulus measurements with a dynamic shear rheometer have the same variability for the mastics used in this study as they did for neat asphalts.
2. The stiffening of asphalt as fillers are added can be quantified by the generalized Nielsen's equation. The two parameters that characterize the stiffening are the maximum packing fraction, +., and the generalized Einstein coefficient, Kt .
3. The +. denotes the maximum filler one can put into the system. It denotes the volume-filling conlribution [0 stiffening. Mathematically, it is an asymptote at which the stiffening is infinite. +. is analogous to bulk density in many ways. KE is the physico-chemical contribution to stiffening. It is a measure of the rate of increase in stiffness ratio with the addition of fillers- the higher the K£, the higher the slope of the CWVtS.
4. The fillets studied had +. ranging from 0.28 10 0.45 and K€ between 2.5 and 4.5 with one exception.
5. Settling tests could be used to measure +. of fillers in asphalts di rectly. X-ray radiography should be used to delennine the sediment height. The +. ob(ained from
14
rheology (fitling Nielsen '5 equation) compared well with the +. ohtained by settling tests.
6. TIle~. of filler in asphalt does not compare with ,_ detennined by Rigden '5 procedure, indicating thai filler does not behave in asphalt like il does in air when it is in ils dry state. t. is an indicator of the properties of asphalt-filler systems as a whole as opposed to Rigden voids which renee! the properties of the filler alone.
7. t. could differentiate between good and bad perfoOlling mineral lillers in SMA. A filler-asphal t system thai has t. greater than OJ8 will perfonn better in SMA. AlIlhe fillers tested confonned to this find ing.
8. Rigden voids measure the properties of filler alone while +. measured the properties of the asphalt-filler system. As a result, the,. could predict performances even in cases where Rigden voids failed in its predictions.
References
I. Harris, S.M. and K.O. Stuart, Analysis a/Mineral Fillers and Mastics Used in Stone Matrix Asplwlt. 1. Assoc. Paving Tedmol., 1995. 64: p. 54-95.
2. Mogawer, W.S. and K.D. Stuart, Effects a/Mineral FifIers on Propertia a/Stone Matrix Asphalt Mix/ures. Transportation Research Record, 1996. 1530: p. 86-94.
J. Shashidhar, N. and P. Romero, Factors Aflecling the Stiffening POlenlial of Fillers. Transportation Research Record (to be published), 1998.
4. TunniclifT, D.O., A Review a/Mineral Filler. Proceedings of the Association of Asphalt Paving Technologists, 1962. 31 : p. 118-150.
5. Anderson, D.A. and W.H. GoelZ, Mechanical Behavior and Rein/orcemtnt 0/ Mineral Filler-Asphalt Mixtures. Proceedings oftbe Association of Asphalt PDving Technologists, 1973. 42: p. 37-66.
6. Puzinauskas, V.P., Filler in Asphall Mixtures,. [969, The Asphalt Institute.
7. Rigden, P J ., . 1954, Road Research Laboratory, Hammondswonh, Middlesex, H. M. S.D.: London.
8. Andeoon, D.A. and S.M. Chrismer. EvalUlJlion a/Tuts/or Characterizing /he Stiffening Po/ential a/Bughouse Dust in Asphalt Mixes. Transporlation R~h Record, 1984. 968: p. 31-37.
9. Fritschy, G. and E. Papirer. Dyrwmic Mechanical Properties of a Bilumen-Silico Composite I. Relalion with Filler Conlen/ and Bilumen-Silica Inler/acial Area. Rheo!. Acta, 1979. 18: p. 749-755.
IS
10. Craus, 1..1. Ishai, and S. A, Durahiliry oj Biluminou$ Poving Mix/um as Rrlafed fQ Fillu Typt and Propertits. Pmc. Assoc. Asphalt Paving T !!CMologislS, 1981 . 50: p. 291-318.
II . Harris, B.M. and K.D. Stuart, Ana/y.ris of Minus 150 pm ARKregafes for SIOIII! Malrix Asphalt, . 1994, Federal Highway Administration: Mclean.
12. Huschek. S. and C. Angst. Mechanical Properties a/Filler-Bilumin Mix/um a/ High und Low Service Ttmperotum', Proc. Assoc. Asphalt Paving Technologists, 1980.49: p. 440-75.
13. Anderson. D.A., tl 01., Inttrfaboratory Tesl Program /0 Dt/ermine the Precisian of the SHRP Performance-based Asphalt Binder Tests,. 1997, Federal Highway Administration (to be published),
14. Einstein, A., Ann. Phys." 1905. 17: p. 549.
15. Einstein, A., Eine Neve Beslimmung der MoldilldimensiOntn. Ann. Phys., 1906. 19: p. 289.
16. Einstein, A., Ann. Phys., 1911. 34 : p. 591.
17. Kerner, E.H .• Pmc. Phys. Soc .• 1956. 869: p. 808.
18. Guth. E., J. Appl. Phys., 1945. 16: p. 20.
19. Landel, R.F., B.G. Moser, and A.1. Bauman, in Proc. 4/h In/ern. Congr. Rhtol., Pari 2, E.H. Lee, Editor. 1965, 100erscience: New York. p. 663.
20. Conley, R.F., Prac/ical Dirptrrion. 1996, New York: VCH Publishers.
16
"
IJod => .. .. 0 0 0
Good=> 0 .. 0 0 o NO
30 31 32 33 34 35 36 31 38 39 40 41 42 43 44 45 46&6970
Andersen·Rigden voids
Figure 1. Rigden voids obtained for various fillers plotted as a function of performance. The shaded portion represents criteria defining good perfonners. Data from Harris and Stuart (3).
5 , 25°C 0
" 70°C
.!! ;a ,;. 4 "0 >
0 N
" ,
.2 3 • f • • 0 • , , 0 • • , • , , • , , . ' ..
2 ,
0.30 0.35 0.40 0.45 0.50
Percent Rigden Voids
Figure 2. Stiffening of asphalt by 20"~ fillers (by volume) plotted as a function of Rigden voids.

17
2.0
- 1.8 25'C • " = . ~ 1.6 ~
1.4 0.20 • , "3 1.2 0.16 " 0
1.0 :;: 0.1 x 0.8 • 0. E 0.6 ',=0.0 0 u 0.4
0.2
(a) 0.001 0.01 0.1 I 10 100
Strain (percent)
2.2
- 2.0 ',= 0.24 70'C
• 'Q 1.8 ~
• , 1.6 "3 " 1.4 0 :;: x 1.2 v
0.20 ~
--... 0.16 ...
0. 1.0 E 0 u 0.8
0.12 0.08
0.04
0.6 .,,0.0
10 100 (b) Strain (percent)
Figure J. Strain sweeps for asphalt with different volume fraction fillers at (a) 25°C and (b) 70"C. <+2 is the volwne fraction fillers added to the asphalt)
3.5 ,-------- -----,
3.0 70°C
o 2.5
~ 2.0 .,' . .. .
• o 1.5
1.0 L-.-.-'~
0.5 '--_.L.-_.L.-_.L.-_.L.-_
0.00 0.05 0.10 0.15 0.20 0.25 Volume fraction particulates, $2
Figure 4. The G' ratio increases with volume fraction fillers at a given strain (from Figure I). The dashed line represents 95°;' confidence for the fit
70
~ 68 • " 11 70' C
" 66 ---7 " ~ • • • --- . • • " .,
64 25' C
c • " ~ .c 62 ..
60 , , , 0.00 0.10 0.20 030
Volume fraction fillers, t2 Figure 5. An example of the dependence of phase angle on the volume fraction filler.
18

. 19
5
, Repeal I 4 r Repeal 2
, , • Repeal 3
, • , i
.2 J , , ;; , , " • • • <) 2 i ,
! i
OL-__ L-__ ~ __ ~ __ ~ __ -L __ ~~
0.00 0.05 0.10 0. 15 0.20 0.25 0.30
Volume fraction fil lers Figure 6 The repeatabil ity orG' measurements for asphalt-fil ler systems.
10
K =5 E
8
,.=0.25 0.65
0 6
'E • 0 4
2
O L-~ __ ~ __ L-~~~~ 0.00 0.10 0.20 0.30 0.40 0.50 0.60
Volume fract ion fillers Figure 7. The effect of changing the ' III (in increments 0(0.05) in Equation 5 when K£ is kepi a constant ("'5).

10 ,_=0.5
8
K,=IO 0 6
'ia • • " 4
OL-__ L-~L-~~~~~ 0.00 0. 10 0.20 0.30 0.40 0.50
Volume fraction fi llen Figure 8. The effect of increasing KE (in increments of 1.0) when + .. is kept at constant (=0.5).
t FREE ASPHALT
V,. FREE ASPHALT
FlXED ASPHALT
(a) (b) Figure 9. A schematic of Rig de D'S fractional volume concept for an asphalt-filler system.
20
21
Well-dispersed system Poorly-di spersed syslem
High $. Low $.
+. o o o 0 0000000
, , 0.28 0.32 0.36 0.40 0.44
o 2SOC • 7O'C
~ __ ~o o •
o 2 4 6 8 10 12 14 16
Figure 11 . The range of observed values of KE and +m for the fillers in the specific asphalt used in this study.

0.1
• Present study HusclIek and Angst (Re 2)
'ii 0.'
0 <; • L 0.5 , E I • , •
'" • , • \
~ 0.4 • • • • •
OJ OJ 0.' 0.' 0.' 0.1
+. (from Rigden Voids)
Figure 12. Comparison of +111 obtained from rheology and +R measured for dry fillers using the Rigden procedure ..
Befort After
22
Figure 13. A schemat ic representation of x-ray radiographs of mastics before and .lIfier settling.

23
. . .. . .. .
' .ll OJ< OJ. •. ~ O.4S OJ.
Figure 14. Scalier plot of +.'s against reported performance showing a clear differentiation between good- and bad-performing fillers.
iBpersioD
MiD.g
Agglomeration
Av. article size
Maximum packing fraction, !fI_
,- --- - ---, GradatioD _~ Generalized Elutein
Particle sha e / "1 Coefficient, K,
'-_ ID=I''''n:::'',,''-----'t .
',r------, StiffeDin Potential
Figure 15. Summary of the factors that affect the stiffening potential of fillers in asphalt (R,f. 9)