Embed Size (px)
Citation preview
PREDICTION AND CONTROL OF AIR OVERPRESSURE
FROM BLASTING IN HONG KONG
GEO REPORT No. 232
Alan B Richards
GEOTECHNICAL ENGINEERING OFFICE
CIVIL ENGINEERING AND DEVELOPMENT DEPARTMENT
THE GOVERNMENT OF THE HONG KONG
SPECIAL ADMINISTRATIVE REGION

PREDICTION AND CONTROL OF AIR OVERPRESSURE
FROM BLASTING IN HONG KONG
GEO REPORT No. 232
Alan B Richards

- 2 -
© The Government of the Hong Kong Special Administrative Region
First published, August 2008
Prepared by:
Geotechnical Engineering Office, Civil Engineering and Development Department, Civil Engineering and Development Building, 101 Princess Margaret Road, Homantin, Kowloon, Hong Kong.

- 3 -
PREFACE
In keeping with our policy of releasing information which may be of general interest to the geotechnical profession and the public, we make available selected internal reports in a series of publications termed the GEO Report series. The GEO Reports can be downloaded from the website of the Civil Engineering and Development Department (http://www.cedd.gov.hk) on the Internet. Printed copies are also available for some GEO Reports. For printed copies, a charge is made to cover the cost of printing.
The Geotechnical Engineering Office also produces documents specifically for publication. These include guidance documents and results of comprehensive reviews. These publications and the printed GEO Reports may be obtained from the Government’s Information Services Department. Information on how to purchase these documents is given on the second last page of this report.
R.K.S. Chan Head, Geotechnical Engineering Office
August 2008

- 4 -
FOREWORD
The adverse effect of blasting noise in close proximity to populated areas in Hong Kong leading to complaints from the general public has been a concern to the Government. Blasting contractors have expressed views that too stringent control on blasting noise would reduce efficiency and increase cost. Blasting noise is part of the air pressure waves generated from blasting, and these pressure waves are referred to as air overpressure by blasting practitioners.
In December 2007, the Geotechnical Engineering Office engaged Mr. Alan Richards of Terrock Consulting Engineers in Australia to undertake a study on air overpressure generated from blasting works for civil engineering projects in Hong Kong. This Report presents the findings and recommendations from the study.
Vincent S.H. Tse Chief Geotechnical Engineer/Mines

- 5 -
CONTENTS
Page No.
Title Page 1
PREFACE 3
FOREWORD 4
CONTENTS 5
1. SCOPE OF INVESTIGATION & REPORT 7
2. REVIEW OF CURRENT INTERNATIONAL LEGISLATION, 7 STANDARDS, GUIDELINES AND CRITERIA ON THE CONTROL
OF AIR OVERPRESSURE FROM BLASTING FOR SETTINGS SIMILAR TO THE HONG KONG BUILT ENVIRONMENT
2.1 Australian Standards and Guidelines 7
2.2 Chinese National Standard GB 6722-2003 8
2.3 Limits and Guidelines Specified in the USA 9
2.4 Limits and Guidelines Specified in Canada 9
2.5 Limits and Guidelines Specified in the United Kingdom 10
3. TECHNICAL INFORMATION ON THE NATURE OF AND FACTORS 10 AFFECTING OVERPRESSURE
3.1 Technical Information on the Nature of Air Overpressure 10
3.2 Technical Information on the Various Factors that Affect the 11 Level of Air Over-Pressure
3.3 Charge Mass and Distance 11
3.4 Face Height and Orientation 12
3.5 Stemming Height and Type 12
3.6 Blasthole Diameter to Burden Ratio 13
3.7 Topographic Shielding 13
3.8 Wavefront Reinforcement - the Combined Effect of Burden, 14 Spacing and Sequential Initiation Timing
3.9 Meteorological Conditions 14
4. REVIEW OF MODELS AVAILABLE FOR THE PREDICTION OF 14 AIR OVER-PERSSURE FOR INITIAL DESIGN AND DURING
CONSTRUCTION

- 6 -
Page No.
4.1 Effect of Charge Mass and Distance 14
4.2 Face Height and Orientation 15
4.3 Topographic Shielding 15
4.4 Stemming Height and Type 16
4.5 Blasthole Diameter to Burden Ratio 16
4.6 Burden, Spacing, and Sequential Initiation Timing 17
4.7 Meteorological Conditions 17
5. RECOMMENDED CRITERIA ON THE CONTROL OF AIR 17 OVERPRESSURE FOR USE IN HONG KONG, WITH DETAILS
ON TYPES OF EQUIPMENT AND SET UP APPROPRIATE FOR MONITORING
6. RECOMMENDED MITIGATION MEASURES TO ADEQUATELY 18 CONTROL AIR OVERPRESSURE
7. EXAMPLES TO ILLUSTRATE THE EFFECT OF SIGNIFICANT 19 FACTORS AND THE USE OF PREDICTIVE MODELS, AND
MITIGATION MEASURES
7.1 Example 1 - Effect of Stemming 19
7.2 Example 2 - Effect of Charge Mass Reduction 20
7.3 Example 3 - Effect of Barriers 21
7.4 Example 4 - Nature of Emission Outside the Portal 21
7.5 Example 5 - Effect of Stemming in a Tunnel Blast 21
8. CONCLUSIONS 21
9. REFERENCES 22
LIST OF FIGURES 24
APPENDIX A: ANALYSIS OF dBA VS dBL MEASUREMENTS - 33 CHOI WAN ROAD AND JORDAN VALLEY
- 7 -
1. SCOPE OF INVESTIGATION & REPORT
This investigation & report covers:
(a) A review of current international legislation, standards, guidelines and criteria on the control of air overpressure from blasting for settings similar to the Hong Kong built environment.
(b) Technical information on the nature of air overpressure and the various factors that affect the level of air over-pressure.
(c) A review of models available for the prediction of air over-pressure for initial design and during construction.
(d) Recommended criteria on the control of air overpressure for use in Hong Kong, with details on types of equipment and set up appropriate for monitoring.
(e) Recommended mitigation measures to adequately control air overpressure.
2. REVIEW OF CURRENT INTERNATIONAL LEGISLATION, STANDARDS, GUIDELINES AND CRITERIA ON THE CONTROL OF AIR OVERPRESSURE FROM BLASTING FOR SETTINGS SIMILAR TO THE HONG KONG BUILT ENVIRONMENT
This review has been based on:
(a) A detailed knowledge of legislation, standards, and guidelines applying in Australia.
(b) Chinese National Standard - GB 6722-2003 Safety Regulations for Blasting.
(c) The range of controls applying in the USA, Canada, and the United Kingdom.
2.1 Australian Standards and Guidelines
Responsibility for the regulatory control of air overpressure in Australia is shared between Environmental Departments in each State or Territory, and Departments responsible for safety in mines, quarries, and construction sites.
In cases where regulatory control is achieved by conditions specified in Environmental Licences the criteria normally recommended for blasting in Australia, based on human discomfort, are contained in the Australian and New Zealand Environment Council

- 8 -
Guidelines (ANZEC, 1990) and (Environmental Australia, 1998).
The ANZEC criteria for the control of blasting impact at residences are:
(a) The recommended maximum level for airblast overpressure is 115 dB Linear (dBL).
(b) The level of 115 dBL may be exceeded on up to 5% of the total number of blasts over a period of 12 months, however the level should not exceed 120 dBL at any time.
Australian Standard AS2187.2-2006 - Use of Explosives, provides information on airblast limits for human comfort chosen by some regulatory authorities in an informative “Appendix J - Ground Vibration and Airblast Overpressure”.
For sensitive sites such as residential structures, the limits chosen by some regulatory authorities are:
(a) For operations lasting longer than 12 months or more than 20 blasts, 115 dBL for 95% of blasts per year, and 120 dBL maximum unless agreement is reached with the occupier that a higher limit may apply.
(b) For operations lasting for less than 12 months or less than 20 blasts, 120 dBL for 95% of blasts per year, and 125 dBL maximum unless agreement is reached with the occupier that a higher limit may apply.
2.2 Chinese National Standard GB 6722-2003
Reference has been made to Chinese National Standard - GB 6722-2003 - Safety Regulations for Blasting.
Professor Wang Xuguang, Chairman of the CSEB Committee, has provided the following clarifications on the parts of the regulations that are relevant to noise control and air overpressures.
An English language translation of Professor Wang’s comments is given below:
1. GB 6722-2003, Clause 6.8.3 on “Noise Control”. This is about the noise that is audible, that it does not include noise that is of low frequencies (<20 Hz) and ultra high frequencies. In the measuring equipment, there is a filter that would filter out the low frequencies parts, and we normally denote such measurements by dB. Clause 6.8.3.1 of the Regulations states that the “Blasting noise is a kind of intermittent impulsive noise. For urban blasting, every impulsive noise should be controlled to less than 120 dB”. The unit of measurement here should be dBA.
2. On air overpressures, Clause 6.3 of GB 6722-2003 provides more detailed criteria.

- 9 -
The air overpressure here means the peak value for the full frequency band and the unit of measurement is dBL (linear scale). This can also be represented as pressure value in Pa. Clause 6.3.2 states that safe allowable standard of air overpressures: for human is 2000 Pa, and for structures the values are given in Table 6. The allowable safe distance for air overpressures should be determined with due considerations given to the type of structures to be protected, type of explosives, topography and meteorological conditions.
An airblast overpressure level of 120 dBA would correspond to an airblast overpressure level of approximately 145 dBL.
This is a level at which highly stressed window panes start to break, and this fact, together with my subjective experience over 30 years, makes me confident that an airblast overpressure limit of 145 dBL would not be acceptable in Hong Kong.
Clause 6.3 relates to air overpressure levels that will injure people and cause structural damage. These levels are well in excess of 145 dBL, and do not relate to air overpressure levels that cause complaint in well controlled blasting operations.
2.3 Limits and Guidelines Specified in the USA
Responsibility for the regulatory control of air overpressure in the USA is shared between a wide range of federal, state, county, and local government authorities.
In USBM Report of Investigations 8485 - Structure Response and Damage Produced by Airblast from Surface Mining (Siskind et al, 1984) a safe level of airblast was found to be 133 dBL (2Hz).
A literature search to date has revealed that levels in the range 128 to 133 dBL are specified by the state and federal authorities that specify airblast limits.
Although 133 dBL has been found to be a safe structural level, this level of airblast overpressure results in substantial complaint from affected residents.
Information was received from blast vibration specialists during informal discussion at the 2008 Annual Conference of the International Society of Explosives Engineers that pro-active mines and quarries have adopted a self-imposed guideline level of 120 dBL as a means of reducing complaints about airblast overpressure to an acceptable level.
Advice was also received during informal discussion that limits below 133 dBL have also been applied by local government authorities.
2.4 Limits and Guidelines Specified in Canada
A regulatory limit of 128 dBL is specified by Provincial regulatory authorities in Canada.
However, this level results in substantial complaint from affected residents, and

- 10 -
information was received during informal discussion at the 2008 I.S.E.E conference that that pro-active mines and quarries have adopted a self-imposed guideline limit of 120 dBL. As was the case in the USA, this has been a means of reducing complaints about airblast overpressure to an acceptable level.
During question time following a paper entitled “Improving the Amount of Material Cast at Highvale Mine using Electronic Detonators” the Blasting Engineer at this Canadian mine stated that the reduction in the airblast overpressure level to 115 dBL at an environmental monitoring station sited to assess airblast levels at neighbouring houses eliminated complaints about airblast overpressure.
During informal discussion, he advised that the mine has adopted a guideline level of 120 dBL as a means of reducing complaints about airblast overpressure to acceptable levels.
2.5 Limits and Guidelines Specified in the United Kingdom
There are no nation-wide limits specified in England and Scotland.
However it is common for mineral planning authorities in each county to specify a guideline level in the range 120 to 125 dBL in the documentation for development approvals.
3. TECHNICAL INFORMATION ON THE NATURE OF AND FACTORS AFFECTING OVERPRESSURE
3.1 Technical Information on the Nature of Air Overpressure
Air overpressure consists of air transmitted sound pressure waves that move outwards from an exploding charge.
A well confined explosives charge creates pressure waves with frequencies that are predominantly less than 20 Hz, with a relatively small amount of energy having frequencies above 20 Hz.
The human ear responds to frequencies above 20 Hz, but filters out frequencies below 20 Hz.
Buildings respond predominantly to frequencies in the range 2 to 20 Hz.
Community noise measurement for health or environmental purposes uses sound level meters that filter out frequencies below 20 Hz, and record the filtered sound level on a decibel A (or dBA) scale.
Because air overpressure from blasting consists of frequencies that are substantially below 20 Hz, air over-pressure levels are measured with a meter that measures frequencies in the range 2 to 250 Hz on a decibel (Linear) (or dBL) scale.
As a comparison between the two scales, if a sound level meter set to measure air over-pressure from a well confined blast measured 120 dBL, a sound level meter set to

- 11 -
measure community noise on the dBA scale would measure approximately 95 dBA.
Analysis of 137 comparative air overpressure measurements taken by CEDD officers at Choi Wan Road and Jordan Valley measurement stations between 7th December 2002 and 17th June 2006 confirm this comparison. Details of the analysis are given in Appendix A.
3.2 Technical Information on the Various Factors that Affect the Level of Air Over-Pressure
Important factors influencing airblast levels are:
(a) Charge mass and distance from blast.
(b) Face height and orientation.
(c) Topographic shielding.
(d) Stemming height and type.
(e) Blasthole diameter to burden ratio.
(f) Burden, spacing, and sequential initiation timing.
(g) Meteorological conditions.
3.3 Charge Mass and Distance
As a general rule, if other factors are equal, airblast levels increase with increased charge mass, and decrease as the distance from the blast site increases.
Established scaling methods have been used for many years to determine the relationship between charge mass, distance, and blast vibration levels.
Air vibration levels have been commonly assessed using the following cube root scaling formula:
a
D
P=K ............................................................ (1)3 W
where: P = pressure (kPa) W = explosives charge mass per delay (kg) D = distance from charge (m) K = site constant
a = site exponent
This formula is applicable for both surface blasting and tunnel blasting close to the portal.

- 12 -
For unconfined surface charges, in situations which are not effected by meteorology, a good estimate may be obtained by using a site exponent (a) of -1.45, (which corresponds to an attenuation rate of 9 dBL with doubling of distance), and a site constant (K) of 516.
For confined blasthole charges used in quarrying or construction blasting, the site constant is commonly in the range 10 to 100 (for a site exponent (a) of -1.45). This is equivalent to a site constant in the range 3.15 to 31.5 for a site exponent of -1.2.
It should be noted that air vibration is proportional to the cube root of the charge mass. This limits the effectiveness of charge mass reduction as a method of reducing vibration levels; other factors are often more important, especially for confined blasthole charges.
I have been asked to comment on the following formula described by Dr John Heilig (Heilig, 2006) as a commonly used reference equation in his report dated November 2006:
D dBL = 164 − 24 × log ................................................ (2)3 W
This equation is equivalent to equation (1) with a site exponent of -1.2, and a site constant of 3.17. From our experience this site constant would be applied to a fully confined charge.
3.4 Face Height and Orientation
When an explosive charge in a vertical hole is fired towards a free vertical face, the resulting airblast levels are greater in front of the face than behind it due to the shielding effect of the face (Moore et al, 1993).
An empirical computer-based model has been developed to aid in airblast assessment based on elliptical air overpressure (AOP) contours that are “stretched” in front of the face and generally flattened behind the face.
For design purposes, the size of the elliptical AOP contours can be determined from the inputs: burden, hole diameter and charge mass. The model may also be used for the analysis of air vibration measurements and the assessment of air vibration levels at unmonitored locations.
For blasts without a vertical free face, or where the airblast emission is predominantly controlled by the stemming height, the AOP contours are circular, the size of which can be determined from the inputs: stemming height, blasthole diameter, and charge mass.
The model produces decibel contour plans to a scale that can be overlain on aerial photographs, maps, or plans of the area surrounding the blast site, as shown in Figure 1.
3.5 Stemming Height and Type
From our experience, good quality crushed rock stemming with a size in the range

- 13 -
1/5th to 1/10th blasthole diameter will consistently result in less air blast than if the same stemming height of drill cuttings is used. If stemming height is equal to burden the aggregate stemming is very effective. A stemming height less than burden may be satisfactory, but stemming heights of less than 0.8 x burden are unlikely to be consistently effective in urban situations.
Airblast levels will increase as stemming height is reduced beyond the level necessary to effectively contain the explosive gases during detonation.
An example of the effect of reducing stemming from 3.0 m to 1.6 m is given in Figure 2a.
3.6 Blasthole Diameter to Burden Ratio
The burden of blastholes can have a significant influence on vibration levels. Too much burden may increase ground vibration levels; too little burden in front row holes may result in flyrock and will increase air vibration levels. The effect of burden reduction is illustrated in Figure 2b, which shows the size and shape of 120 dBL contours when front row burden is changed from 3.6 m to 2.8 m. Blasthole diameter remained constant at 89 mm.
The assessment contours for blasts without wavefront reinforcement can be used to determine the effect of changing burden to alter rock pile profile, and to illustrate the effect of reductions in burden due to face irregularities or poor burden control.
As blasthole diameter increases, the burden must be increased to prevent excessive airblast and flyrock.
3.7 Topographic Shielding
In hilly terrain, or deep excavations, airblast levels resulting in the surrounding area are reduced by secondary shielding (Moore et al, 1993). The relationship between shielding, the effective barrier height and the incident angle, has been investigated. These terms are illustrated in Figure 3a.
Analysis of measurements taken for various shielding situations when blasting in different rock types has permitted a relationship to be developed. The relationship between secondary shielding measured in decibels-linear (dBL), barrier height, and incident angle is shown in Figure 3b.
This relationship permits adjustments to be made to the sound pressure (dBL) levels determined using the basic airblast contour model to increase its accuracy.
In practice, it has been found that the elliptical airblast model works satisfactorily without the need for shielding adjustments when the incident angle between the blast face and the measurement station does not exceed 15 degrees or the effective barrier height is less than 20 m. Topographic shielding can be important in deep excavations or in hilly country.

- 14 -
3.8 Wavefront Reinforcement - the Combined Effect of Burden, Spacing and Sequential Initiation Timing
When a single blasthole is fired, a vibration wavefront is created which spreads uniformly in all directions at the propagation speed (eg. 340 m/sec for sound waves). At any period of time after firing, the wavefront will have travelled a distance from the blasthole which is proportional to time.
If the distance between blastholes coincides with the distance the wavefront has travelled, then a reinforcement will occur. For example, if a row of blastholes 3 m apart are fired with a 9 ms delay between them, the resulting wavefront diagram is shown in Figure 4. This pattern will result in a dramatic increase in air vibration in the direction of initiation (Richards & Moore, 1995).
3.9 Meteorological Conditions
The effect of meteorology on air overpressure levels at close (100 metres) distances is limited to the effect of surface winds, which will cause an increase of up to 2 dBL downwind from the blast.
The effect of meteorology at distances greater than 500 metres can result in greater increases due to inversions and changes in wind velocity at heights well above the surface.
This effect is explained below:
When a blast is fired, the air vibration travels as a wavefront outwards from the blast at the speed of sound in all directions. The speed of the wavefront is then affected by wind (speed and direction) and by atmospheric temperature. The effect of wind velocity and air temperature can be demonstrated if the wavefront is considered as a series of sound “rays” radiating out from the blast and perpendicular to the wavefront.
Reinforcement occurs when the sound rays are deflected by wind or air temperature variation and are concentrated at the surface as shown in Figure 5.
This results in a higher air vibration level than that resulting from the normal decay rate. Increases of 10-20 dBL may result from this reinforcement at distances greater than 1 km from the blast site. The significance of this reinforcement for quarry blasts is that blasts which would normally not be noticed due to the reduction in air over-pressure with distance may on occasions result in complaints at distances greater than 1 km from the blast site.
4. REVIEW OF MODELS AVAILABLE FOR THE PREDICTION OF AIR OVER-PERSSURE FOR INITIAL DESIGN AND DURING CONSTRUCTION
4.1 Effect of Charge Mass and Distance
Models commonly in use world-wide are cube root scaling models that calculate the effect of charge mass and distance on air overpressure levels.

- 15 -
An example of this model is show below:
a
D
P=K ..........................................................(1)3 W
where: P = pressure (kPa) W = explosives charge mass per delay (kg) D = distance from charge (m) K = site constant
a = site exponent
It is emphasised that air vibration is proportional to the cube root of the charge mass.
This limits the effectiveness of charge mass reduction as a method of reducing vibration levels; other factors are often more important, especially for confined blasthole charges.
The site constant in the above formula incorporates the effect of all variables other than charge mass and distance.
An improved level of prediction and control is obtained by the use of empirical models developed by Terrock that in addition to charge mass and distance, make use of additional factors including:
(a) Face height and orientation.
(b) Topographic shielding.
(c) Stemming height and type.
(d) Blasthole diameter to burden ratio.
(e) Burden, spacing, and sequential initiation timing.
(f) Meteorological conditions.
4.2 Face Height and Orientation
The effect of face height and orientation has been recognised in Hong Kong, and may be quantified by the use of models such as the one described in the preceding section of this report.
4.3 Topographic Shielding
The effect of topographic and man-made noise barriers in reducing air over-pressure is far less than the effect on higher frequency audible noise.

- 16 -
The effect of noise barriers on air over-pressure may be determined from the graphical model shown in the preceding section.
The effect of barriers in situations where the incident angle is less than 15 degrees (which covers many Hong Kong blasting situations) is less than 2 dBL.
4.4 Stemming Height and Type
In blasts where there is no vertical/sub-vertical free face or there is a free face but the stemming practice is inadequate to contain the gas pressure until the face moves, most of the energy of the gases of the explosion is projected through the collar region of the blasthole; we define this situation as stemming controlled blasts. Stemming controlled blasts may result in cratering or stemming ejection but, in a well managed blast, may only result in general ground swell.
The contours of airblast levels from stemming controlled blasts are circular in form because the energy is directed equally in all directions. The airblast levels are a function of charge mass, distance, hole diameter and stemming height, according to the empirical formula:
2.5
k d
× 3sD120 = m ...................................................(3) SH
where: D120 = distance in front of bast to the 120 dBL contour d = hole diameter (mm)
SH = stemming height (mm) m = charge mass/delay (kg)
ks = a calibration factor typically varying from 80-180
Circular contours are then drawn based on the D120 calculated and the airblast attenuation rate. Use of the formula requires local calibration by site measurement and serves as an indicator of the effectiveness of the stemming practice and the ability of the shotfiring crew to achieve consistent loading. The limitation of the formula is that as the stemming height is reduced approximately 8 hole diameters for good quality crushed aggregate stemming, the explosion performs as an unconfined charge and the airblast levels are as predicted by Formula 1.
4.5 Blasthole Diameter to Burden Ratio
Burden controlled blasting occurs when there is a vertical/sub-vertical free face available and the stemming practice (stemming height, stemming material, specification and placement) is adequate to contain the gases of the explosion until the free face begins to move forward. In these circumstances, most of the energy is emitted through the face and higher airblast levels result in front of the face than in other directions.
Contours of airblast levels from burden controlled blasts are elliptical with airblast commonly measured 6 dBL to 10 dBL higher in front of the face than behind the face.

- 17 -
From analysis of field measurements over many years, we have found that the airblast levels in front of the face are a function of charge mass, distance, hole diameter and burden, according to the empirical formula:
2.5
k b d
× 3D120 = m ...................................................(4) B
where: D120 = distance in front of blast to the 120 dBL contour d = hole diameter (mm) B = burden (mm) actual burden for analysis or design burden for prediction m = charge mass/delay (kg) kb = a calibration factor typically varying between 150-250
The formula requires local calibration by site measurement and serves as an indicator of the ability of the shotfiring/survey crew to measure burden and compensate for under-burdening during loading. The highest k value of 250 gives a more conservative prediction for ‘average’ face control. Elliptical contours are then drawn based on the D120 calculated and the airblast attenuation rate.
This formula has been proven useful for back calculating effective burdens from blasts where face burst was observed and high airblast levels measured. The limitation of the formula is that, as the actual burden is reduced to approximately 17 hole diameters, the explosion acts as an unconfined charge and the airblast levels can be predicted from Formula 1.
4.6 Burden, Spacing, and Sequential Initiation Timing
The combined effect of burden, spacing, and sequential initiation timing may be determined by wavefront models that produce outputs of the type shown in the preceding section.
4.7 Meteorological Conditions
In most Hong Kong blasting situations, the effect of meteorological conditions is limited to an increase in air overpressure levels of 1-2 dBL downwind, and the use of meteorological atmospheric refraction models is not warranted.
5. RECOMMENDED CRITERIA ON THE CONTROL OF AIR OVERPRESSURE FOR USE IN HONG KONG, WITH DETAILS ON TYPES OF EQUIPMENT AND SET UP APPROPRIATE FOR MONITORING
A review of current of current international legislation, standards, guidelines, and criteria on the control of air overpressure from blasting for settings similar to the Hong Kong built environment has been carried out.

- 18 -
This review reveals a wide range of formal limits, ranging from 115 dBL (with 5% exceedence permitted to 120 dBL) in many operations in Australia, to 133 dBL in the USA. In practice a guideline limit of 120 dBL has been widely applied in many blasting operations in Australia, the USA, Canada, and the United Kingdom, and conformance with this guideline limit has been successful in reducing complaints to an acceptable level.
The Chinese National Standards GB 6722-2003 states that for urban blasting, impulsive blast noise should controlled to less than 120 dBA. It has been my experience that for confined blasthole charges, an air overpressure level of X dBA will correspond to an air overpressure level of approximately (X + 25) dBL. Analysis of 137 comparative air overpressure measurements taken by CEDD officers at Choi Wan Road and Jordan Valley measurement stations between 7th December 2002 and 17th June 2006 confirms this comparison. Details of the analysis are given in Appendix A.
It has been my experience that an air overpressure level of 145 dBL will result in substantial complaint, and measurements of up to 138 dBL taken in residential areas in Hong Kong support this opinion.
It is my opinion that an appropriate guideline level for blasting in the Hong Kong built environment is 120 dB (Linear), measured with equipment that conforms with specifications based on the recommendations of the International Society of Explosives Engineers, and Australian Standard AS 2187.2-2006.
Most air over-pressure meters used world-wide conform to these specifications.
It is possible that some flexibility in the manner in which the guideline level is enforced may be warranted, with higher levels being permitted for short term periods in some circumstances.
Measurements procedures, including the position of the measurement, should be based on procedures specified by the ISEE and AS2187.2-2006.
6. RECOMMENDED MITIGATION MEASURES TO ADEQUATELY CONTROL AIR OVERPRSSURE
(a) Blast design using empirical models that take account of significant factors
(b) Strictly controlled implementation of the blast design
(c) Effective measurement of resulting air over-pressure levels
(d) Detailed recording of blast and air overpressure data.
Blasting at distances of approximately 100 metres presents a great challenge in the control of air over-pressure.
The most significant factors that contribute to air over-pressure levels resulting from

- 19 -
blasting at these close distances are:
(a) Charge mass and distance
(b) Stemming height and type
(c) Burden to blasthole ratio
(d) The combined effect of burden, spacing, and delay timing
Blast design using models that evaluate the effect of these factors will permit the prediction of air overpressure levels.
It is probable that at distances of approximately 100 metres predicted levels will exceed 120 dBL without the use of additional measures such as backfill cover.
The effect of backfill cover has the potential to reduce air overpressure levels by 10 dBL. The use of backfill cover will also assist in the control of flyrock.
Air overpressure levels may also be reduced by deck loading. In a blast with a significant vertical free face, this reduction may in some circumstances be obtained by deck loading the front row holes fired on the initial delays only, without needing to deck load all the front row holes.
When using surface lines of detonating cord for pre-splitting, the detonating cord must be covered with sufficient material such as soil or sand to reduce the level of airblast overpressure. The amount of cover required must be determined by field measurement for the specific situation. The use of backfill cover is particularly effective in reducing the level of airblast overpressure during pre-splitting.
7. EXAMPLES TO ILLUSTRATE THE EFFECT OF SIGNIFICANT FACTORS AND THE USE OF PREDICTIVE MODELS, AND MITIGATION MEASURES
These examples, although based on actual field experience, do not refer to any specific site. They are intended to illustrate design concepts that can be used to control airblast overpressure.
7.1 Example 1 - Effect of Stemming
Base data for this case study is as follows:
Charge mass/delay = 4 kg Stemming height = 2.2 m Blasthole diameter = 76 mm
Distance from blast = 116.5 m Airblast Overpressure level = 118.5 dBL

- 20 -
Using the relationship:
2.5
k d
× 3sD120 = m ...................................................(3)SH
where: D120 = distance in front of bast to the 120 dBL contour d = hole diameter (mm)
SH = stemming height (mm) m = charge mass/delay (kg)
ks = a calibration factor
The calibration factor ks was previously determined as 154.
Using this calibration factor, for an identical blast with a charge mass/delay of 4 kg and a stemming height of 2.2 metres an airblast overpressure level of 120 dBL will result at 104 metres.
To maintain a 120 dBL airblast overpressure level at closer distances, one option is to reduce charge mass and/or increase stemming height.
If it is desired to maintain a constant charge mass per delay of 4 kg, an increased stemming height will be required.
If the distance from the blast is reduced to 60 metres, the equivalent stemming height will need to be increased to 2.74 metres.
One method of achieving this would be to use a stemming height of 2 metres in the competent rock being blasted, and covering the blasting area with 1 metre of back fill. The use of the backfill cover would also assist in the control of flyrock.
7.2 Example 2 - Effect of Charge Mass Reduction
Changes to the charge mass have a limited effect on the air overpressure level, due to the fact that air overpressure varies according to the cube root of the charge mass as shown in the following equation:
a
D
P=K ..........................................................(1)3 W
where: P = pressure (kPa) W = explosives charge mass per delay (kg) D = distance from charge (m) K = site constant
a = site exponent
For example, if the charge mass per delay in Example 1 was halved (from 4 kg to 2 kg), the airblast overpressure level at 104 metres would be reduced from 120 dBL to 117 dBL.

- 21 -
7.3 Example 3 - Effect of Barriers
In the example illustrated in the cross-section shown in Figure 6a. The line of sight between a portal and a sensitive site has been interrupted by 8 metre barrier.
The effect of the barrier, which has been determined from Figure 6b, is approximately 1 dBL.
7.4 Example 4 - Nature of Emission Outside the Portal
An example of airblast emission resulting from a tunnel blast is given in the Figure 7. The face was 60 m from the portal, and the charge mass per hole was 1.5 kg.
This form of assessment modelling permits the airblast overpressure levels in the area outside a tunnel portal to be more accurately evaluated.
7.5 Example 5 - Effect of Stemming in a Tunnel Blast
In this example, the blast specifications were:
Blasthole depth: 1.5 metres Charge mass per hole (and per delay): 240 g
In the initial Blast 1, the stemming was 100 mm of moist paper and the airblast overpressure level measured 114 metres from the blast in front of the portal was 142 dBL (see Figure 8a).
In a subsequent Blast 2, 800 mm of aggregate stemming was used, and the airblast overpressure level measured 114 metres from the blast in front of the portal was reduced to 128 dBL (see Figure 8b).
This example demonstrates clearly the substantial reduction that can be made to airblast overpressure by the use of stemming.
8. CONCLUSIONS
Following a review of current of current international legislation, standards, guidelines, and criteria on the control of air overpressure from blasting for settings similar to the Hong Kong built environment, it has been concluded that an appropriate guideline level for blasting in the Hong Kong built environment is 120 dB (Linear), measured with equipment that conforms with specifications based on the recommendations of the International Society of Explosives Engineers, and Australian Standard AS 2187.2-2006.
Models are available that will permit air overpressure to be effectively predicted for initial design and during construction, and mitigation measures are available to adequately control overpressure.

- 22 -
It is possible that some flexibility in the manner in which the guideline level is enforced may be warranted, with higher levels being permitted for short term periods in some circumstances.
9. REFERENCES
Standards Australia (2006). Explosives - Storage and use, Part 2: Use of Explosives (AS 2187.2-2006 : Part 2 : 2006). Australian Standard.
ANZEC (1990). Technical Basic for Guidelines to Minimise Annoyance due to Blasting Overpressure and Ground Vibration. Australian and New Zealand Environment Council, Canberra, Australia.
General Administration of Quality, Supervision, Inspection and Quarantine (2003). Safety Regulations for Blasting (GB 6722-2003). Chinese National Standard, Standards Press of China.
Environment Australia (1988). Noise, Vibration and Airblast Control. Best Practice Environmental Management in Mining (ISBN 0 642 54510 3).
Moore, A. J., Evans, R. and Richards, A. B. (1993). An Elliptical Airblast Attenuation Model, Proceedings of The Fourth International Symposium on Rock Fragmentation by Blasting - Fragblast - 4, Vienna, Austria, pp 247-252.
Richards, A. B., Moore, A. J. and Evans, R. (1994). Blast Vibration Wavefront Reinforcement Model, in The International Society of Explosives Engineers 20th
Annual Conference, Austin, Texas, USA, pp 11.
Richards, A. B. and Moore, A. J. (1995). The Effect of Blast Design on Vibration Frequencies, in Proceedings of The 2nd International Conference on Engineering Blasting Technique, Chinese Society of Theoretical and Applied Mechanics and co-sponsored by China Association for Science and Technology, National Natural Science Foundation of China, Chinese Society of Engineering Blasting, CSTAM: Kunming, China, pp 502-509.
Richards, A. B. and Moore, A. J. (1995). Blast Vibration Control by Wavefront Reinforcement Techniques, presented at EXPLO 1995, Australian Institute of Mining and Metallurgy in association with International Society of Explosives Engineers, Brisbane, Australia, pp 323-327.
Moore, A. J. and Richards, A. B. (1996). Blast Vibration Assessment for Planning & Operational Control, in The Institute of Quarrying 40th Annual Conference, Institute of Quarrying: Canberra, Australia, pp 43-48.
Richards, A. B. and Moore, A. J. (1997). Blasting in an Urban Environment, in Resourcing the 21st Century, The AusIMM 1997 Annual Conference. Australian Institute of Mining and Metallurgy: Ballarat, Victoria, pp 77-82.
- 23 -
Richards, A. B. and Moore, A. J. (1999). Predictive Assessment of Surface Blast Vibration, presented at EXPLO '99, A Conference on Rock Breaking. Australian Institute of Mining and Metallurgy in association with the Western Australian School of Mines: Kalgoorlie, Australia, pp 91-97.
Richards, A. B. and Moore, A. J. (2002). Airblast Design Concepts in Open Pit Mines, presented at The 7th International Symposium on Rock Fragmentation by Blasting (FRAGBLAST 7), China Society of Engineering Blasting and Chinese Society of Mechanics: Beijing, China.
Richards, A. B. and Moore, A. J. (2003). Structural Response of Brick Veneer Houses to Blast Vibration, presented at The 29th Annual Conference on Explosives and Blasting Technique, International Society of Explosives Engineers: Nashville, Tennessee, USA.
Richards, A. B. and Moore, A. J. (2004). Flyrock Control - By Chance or Design in the proceedings of The 30th Annual Conference on Explosives and Blasting Technique, International Society of Explosives Engineers: New Orleans, Louisiana, USA.
Gad, E. F., Wilson, J. L., Moore, A. J. and Richards, A. B. (2005). Effects of Mine Blasting on Residential Structures published in the Journal of Performance of Constructed Facilities - American Society of Civil Engineers, pp 222-228.
Siskind, D. E., Stachura, V.J., Stagg, M. S. and Kopp, J. W. (1984). Report of Investigations 8485, Bureau of Mines, United States Department of Interior, Structure Response and Damage Produced by Airblast from Surface Mining.
Heilig, J. H. (2006). Overpressure Restrictions: Review and Implication on Blast Design, a report to the Hong Kong Construction Association, Heilig and Partners Pty. Ltd., November 2006.
- 24 -
LIST OF FIGURES
Figure No.
1 Decibel Contours Placed Over an Area Plan
2 120 dBL Contours for Different Stemming Heights and Burdens
3 Shielding Terminology and Secondary Shielding Relationships
4 Wavefront Reinforcement
5 Meteorological Reinforcement Caused by Warm Air Inversion Layer
6 Effect of Barriers and Secondary Shielding Relationships
7 Emission Outside Tunnel Portal
8 Effect of Stemming or Tunnel Emission
Page No.
25
26
27
28
29
30
31
32

- 25 -
Figure 1 - Decibel Contours Placed Over an Area Plan

- 26 -
Dis
tanc
e fr
om B
last
(m)
Distance from Blast (m)
(a) 120 dBL Contours for Different Stemming Heights
Dis
tanc
e fr
om B
last
(m)
Distance from Blast (m)
(b) 120 dBL Contours for Different Burdens
Figure 2 - 120 dBL Contours for Different Stemming Heights and Burdens

- 27 -
Figure 3 - Shielding Terminology and Secondary Shielding Relationships
(a) Shielding Terminology
(b) Secondary Shielding Relationships

- 28 -
Spacing 3 metres
Spacing Delay 9 ms
Velocity 340 m/s
Figure 4 - Wavefront Reinforcement

- 29 -
Figure 5 - Meteorological Reinforcement Caused by Warm Air Inversion Layer

- 30 -
Figure 6 - Effect of Barriers and Secondary Shielding Relationships
(a) Effect of Barriers
(b) Secondary Shielding Relationships

- 31 -
Figure 7 - Emission Outside Tunnel Portal

- 32 -
Figure 8 - Effect of Stemming or Tunnel Emission
(a) 100 mm Moist Paper as Stemming
(b) 800 mm of Aggregate as Stemming

- 33 -
APPENDIX A
ANALYSIS OF dBA VS dBL MEASUREMENTS - CHOI WAN ROAD AND JORDAN VALLEY

- 34 -
CONTENTS
Page No.
Title Page
CONTENTS
33
34
A.1 ANALYSIS OF dBA VS dBL MEASUREMENTS - CHOI WAN ROAD AND JORDAN VALLEY
35
LIST OF TABLES 36
LIST OF FIGURES 44

- 35 -
A.1 ANALYSIS OF dBA VS dBL MEASUREMENTS - CHOI WAN ROAD AND JORDAN VALLEY
Details of an analysis of 137 comparative air overpressure measurements (see Table A1) taken by CEDD/Mines officers at Choi Wan Road and Jordan Valley measurement stations between 7th December 2002 and 17th June 2006 are given below.
Measurement details were obtained from CEDD/Mines File No. Red 426 and Red 427_Overall (Sheets 1 to 24).
Details of the linear regression analysis and comparison between dBA and dBL measurements are given in Figures A1 and A2 respectively.

- 36 -
LIST OF TABLES
Table Page No. No.
A1 Records of Monitoring by Mines Division, Choi Wan Road 37 and Jordan Valley

- 37 -
Table A1 - Records of Monitoring by Mines Division, Choi Wan Road and Jordan Valley (Sheet 1 of 7)
Sound Pressure Level
No. Date of Blast Time (hrs) Distance (m) dBA dBL
1 7-Dec-02 17:07 167 99.8 111.5
2 24-Jan-03 17:04 256 87.3 113.1
3 18-Mar-03 15:54 241 90.6 117.1
4 10-Sep-03 16:56 536 79.4 91.5
5 24-Nov-04 17:24 124 83 116.8
6 29-Nov-04 17:04 108 84.6 112.5
7 15-Dec-04 16:09 126 82.1 109.7
8 17-Dec-04 16:10 49 91.9 117.8
9 5-Feb-05 16:15 173 93.8 107.5
10 22-Feb-05 16:40 309 86 105.1
11 25-Feb-05 17:20 150 86.6 114.1
12 26-Feb-05 16:42 145 91 125.9
13 8-Jun-05 16:08 115 92 121.5
14 9-Jun-05 16:42 179 84.3 112.4
15 18-Jun-05 16:38 130 87.7 114
16 27-Jun-05 16:40 145 93.8 118.1
17 28-Jun-05 16:09 169 84.8 112.9
18 29-Jun-05 17:02 130 108 128.1
19 2-Jul-05 16:06 128 95.4 127.6

- 38 -
Table A1 - Records of Monitoring by Mines Division, Choi Wan Road and Jordan Valley (Sheet 2 of 7)
Sound Pressure Level
No. Date of Blast Time (hrs) Distance (m) dBA dBL
20 12-Jul-05 17:18 123 79 112.3
21 14-Jul-05 16:15 114 86.8 118.8
22 15-Jul-05 16:43 169 94.8 111.5
23 19-Jul-05 17:36 123 90.8 118.9
24 26-Jul-05 16:13 152 97.3 122.6
25 27-Jul-05 16:06 110 105.9 128.8
26 28-Jul-05 16:41 95 103.1 128.1
27 1-Aug-05 16:39 120 93.8 123.7
28 5-Aug-05 16:24 103 97.3 131.8
29 6-Aug-05 16:07 107 100.5 129.6
30 10-Aug-05 16:38 105 96.2 123.8
31 13-Aug-05 16:35 112 99 125.4
32 16-Aug-05 16:35 149 95 120.9
33 18-Aug-05 16:43 185 87.2 115.4
34 19-Aug-05 16:06 128 81.8 120
35 23-Aug-05 16:09 133 102.8 127.5
36 29-Aug-05 16:08 185 89.6 117.7
37 5-Sep-05 16:29 96 90.7 115.4
38 6-Sep-05 16:29 113 95.7 119.3
39 10-Sep-05 16:12 128 98.2 129.5

- 39 -
Table A1 - Records of Monitoring by Mines Division, Choi Wan Road and Jordan Valley (Sheet 3 of 7)
Sound Pressure Level
No. Date of Blast Time (hrs) Distance (m) dBA dBL
40 14-Sep-05 16:11 120 91.9 119.1
41 21-Sep-05 17:48 210 100.9 127.1
42 23-Sep-05 16:12 128 89.2 119.4
43 27-Sep-05 16:08 249 92 112.6
44 28-Sep-05 16:07 108 99.2 119.8
45 29-Sep-05 16:44 103 88.9 121.4
46 4-Oct-05 16:45 69 90.3 125.6
47 5-Oct-05 16:43 119 105.8 129.9
48 10-Oct-05 16:11 221 89 118
49 15-Oct-05 16:10 85 94.4 127
50 18-Oct-05 16:14 198 90.3 114.5
51 20-Oct-05 16:10 80 109.4 133.2
52 22-Oct-05 16:11 149 99.7 116.5
53 25-Oct-05 16:45 77 93.8 125.3
54 1-Nov-05 16:43 82 102.2 122.4
55 3-Nov-05 16:44 221 96.2 120.3
56 3-Nov-05 16:44 165 91.3 113.9
57 7-Nov-05 16:08 95 99.9 131.8
58 8-Nov-05 16:10 85 99.5 121.6
59 9-Nov-05 16:06 65 95.7 120.7

- 40 -
Table A1 - Records of Monitoring by Mines Division, Choi Wan Road and Jordan Valley (Sheet 4 of 7)
Sound Pressure Level
No. Date of Blast Time (hrs) Distance (m) dBA dBL
60 10-Nov-05 16:35 110 106.4 126.1
61 11-Nov-05 16:13 130 80.6 117.5
62 12-Nov-05 16:39 127 92.6 122.1
63 15-Nov-05 17:05 70 94.6 121.9
64 16-Nov-05 16:41 145 83.4 114.3
65 17-Nov-05 16:38 115 92.8 113.3
66 22-Nov-05 16:36 80 94.5 121.4
67 23-Nov-05 16:09 120 98.3 123.2
68 24-Nov-05 16:37 120 102.8 127.3
69 25-Nov-05 16:16 100 96.1 118.8
70 29-Nov-05 16:44 70 92.9 117.5
71 30-Nov-05 16:11 130 98.2 113.7
72 5-Dec-05 16:10 85 96.4 120.5
73 6-Dec-05 17:08 75 94.2 122.9
74 7-Dec-05 16:51 75 106.7 128.2
75 9-Dec-05 16:12 70 94.4 120
76 10-Dec-05 16:09 85 87.5 116.3
77 12-Dec-05 16:12 85 92.2 121.3
78 13-Dec-05 16:45 87 95.3 121.6
79 15-Dec-05 16:13 80 94.5 125.9

- 41 -
Table A1 - Records of Monitoring by Mines Division, Choi Wan Road and Jordan Valley (Sheet 5 of 7)
Sound Pressure Level
No. Date of Blast Time (hrs) Distance (m) dBA dBL
80 19-Dec-05 16:11 100 102.1 125.3
81 20-Dec-05 16:36 65 95.8 123.3
82 22-Dec-05 17:07 90 96.7 122.1
83 24-Dec-05 16:12 60 100.6 128.6
84 29-Dec-05 16:38 70 86.5 114.9
85 30-Dec-05 16:09 100 95.1 119
86 4-Jan-06 17:10 95 94.3 121.7
87 6-Jan-06 16:06 85 86.2 120.7
88 10-Jan-06 16:09 95 90.6 119.2
89 11-Jan-06 16:09 41 101.1 127.2
90 12-Jan-06 16:15 100 102.9 127.9
91 13-Jan-06 17:05 65 97.6 126.4
92 14-Jan-06 17:15 110 98.9 129.2
93 16-Jan-06 16:41 67 91.5 117.1
94 17-Jan-06 16:11 87 108.4 132.1
95 18-Jan-06 16:07 56 97 126.6
96 20-Jan-06 17:09 215 96.1 121.1
97 21-Jan-06 16:38 77 95.5 126.2
98 23-Jan-06 16:38 62 94.8 124.1
99 24-Jan-06 16:13 50 96.1 131.7
- 42 -
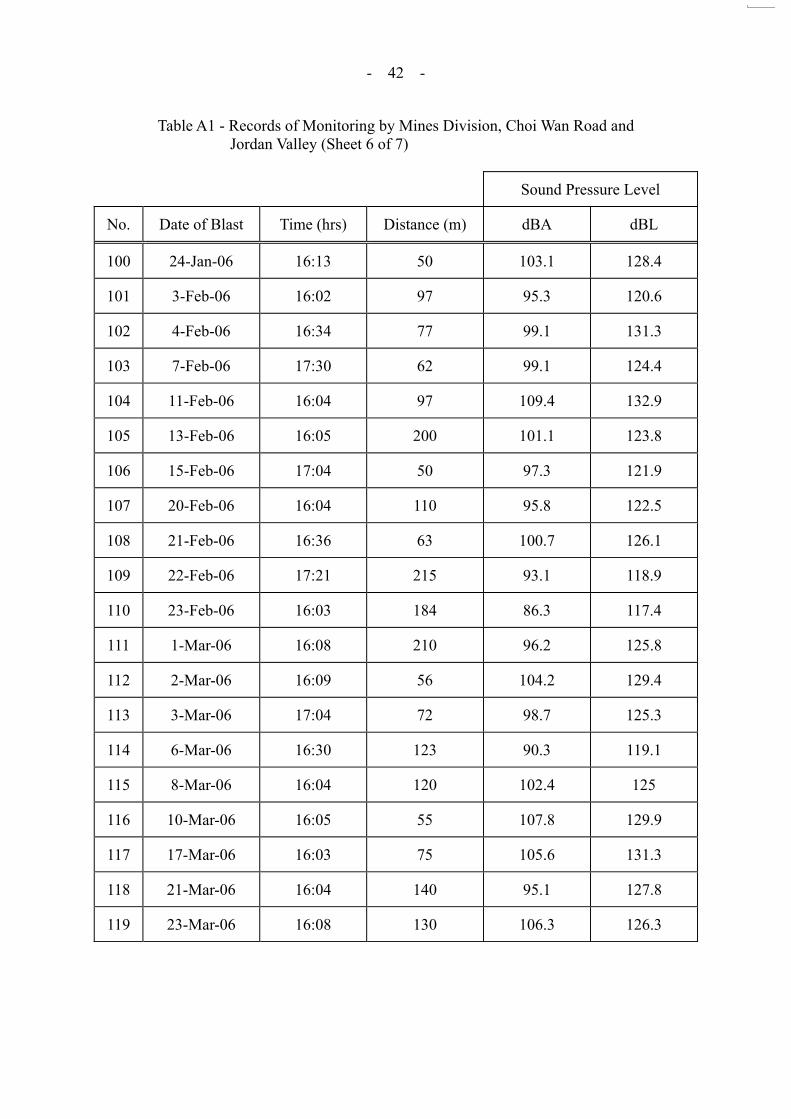
Table A1 - Records of Monitoring by Mines Division, Choi Wan Road and Jordan Valley (Sheet 6 of 7)
Sound Pressure Level
No. Date of Blast Time (hrs) Distance (m) dBA dBL
100 24-Jan-06 16:13 50 103.1 128.4
101 3-Feb-06 16:02 97 95.3 120.6
102 4-Feb-06 16:34 77 99.1 131.3
103 7-Feb-06 17:30 62 99.1 124.4
104 11-Feb-06 16:04 97 109.4 132.9
105 13-Feb-06 16:05 200 101.1 123.8
106 15-Feb-06 17:04 50 97.3 121.9
107 20-Feb-06 16:04 110 95.8 122.5
108 21-Feb-06 16:36 63 100.7 126.1
109 22-Feb-06 17:21 215 93.1 118.9
110 23-Feb-06 16:03 184 86.3 117.4
111 1-Mar-06 16:08 210 96.2 125.8
112 2-Mar-06 16:09 56 104.2 129.4
113 3-Mar-06 17:04 72 98.7 125.3
114 6-Mar-06 16:30 123 90.3 119.1
115 8-Mar-06 16:04 120 102.4 125
116 10-Mar-06 16:05 55 107.8 129.9
117 17-Mar-06 16:03 75 105.6 131.3
118 21-Mar-06 16:04 140 95.1 127.8
119 23-Mar-06 16:08 130 106.3 126.3

- 43 -
Table A1 - Records of Monitoring by Mines Division, Choi Wan Road and Jordan Valley (Sheet 7 of 7)
Sound Pressure Level
No. Date of Blast Time (hrs) Distance (m) dBA dBL
120 24-Mar-06 16:04 90 101 128.8
121 25-Mar-06 16:37 130 85.5 116.6
122 28-Mar-06 16:02 95 92.5 121.3
123 29-Mar-06 16:08 100 105.5 122.3
124 31-Mar-06 16:09 130 97.7 117.3
125 1-Apr-06 16:00 100 93.9 124.2
126 6-Apr-06 16:07 55 100.4 125.2
127 22-Apr-06 15:59 65 103.4 128.7
128 26-Apr-06 16:37 205 92.7 118.3
129 29-Apr-06 16:03 84 111.3 133.3
130 3-May-06 16:15 179 88.1 119.5
131 15-May-06 16:00 74 101.8 126.8
132 27-May-06 16:07 130 98.2 122.9
133 30-May-06 15:58 69 92.9 117
134 7-Jun-06 15:59 205 103 125.3
135 10-Jun-06 16:03 118 96.1 121.8
136 14-Jun-06 16:11 168 95.9 121
137 17-Jun-06 16:18 195 98.6 122.6

- 44 -
LIST OF FIGURES
Figure No.
Page No.
A1
Linear Regression Analysis (dBA vs dBL)
45
A2
Comparison between dBA and dBL Measurements
46

- 45 -
y = 0.7059x + 54.367R2 = 0.5578
80
90
100
110
120
130
140
70 75 80 85 90 95 100 105 110 115
dBA
dBL
140
130
120
110
100
90
8070 75 80 85 90 95 100 105 110 115
dBA
dBL
y = 0.7059x + 54.367 R2 = 0.5578
Figure A1 - Linear Regression Analysis (dBA vs dBL)

- 46 -
0
20
40
60
80
100
120
140
160
1
dbadba+25dbl
160
140
120
100
80
60
40
20
0
dBA dBA+25 dBL
Figure A2 - Comparison between dBA and dBL Measurements

GEO PUBLICATIONS AND ORDERING INFORMATION 土力工程處刊物及訂購資料土力工程處刊物及訂購資料土力工程處刊物及訂購資料土力工程處刊物及訂購資料
A selected list of major GEO publications is given in the next page. An up-to-date full list of GEO publications can be found at the CEDD Website http://www.cedd.gov.hk on the Internet under “Publications”. Abstracts for the documents can also be found at the same website. Technical Guidance Notes are published on the CEDD Website from time to time to provide updates to GEO publications prior to their next revision.
部份土力工程處的主要刊物目錄刊載於下頁。而詳盡及最新的
土力工程處刊物目錄,則登載於土木工程拓展署的互聯網網頁
http://www.cedd.gov.hk 的“刊物”版面之內。刊物的摘要及更新
刊物內容的工程技術指引,亦可在這個網址找到。
Copies of GEO publications (except maps and other publications which are free of charge) can be purchased either by:
讀者可採用以下方法購買土力工程處刊物讀者可採用以下方法購買土力工程處刊物讀者可採用以下方法購買土力工程處刊物讀者可採用以下方法購買土力工程處刊物((((地質圖及免費刊物地質圖及免費刊物地質圖及免費刊物地質圖及免費刊物
除外除外除外除外):):):):
writing to Publications Sales Section, Information Services Department, Room 402, 4th Floor, Murray Building, Garden Road, Central, Hong Kong. Fax: (852) 2598 7482
書面訂購
香港中環花園道
美利大廈4樓402室
政府新聞處
刊物銷售組
傳真: (852) 2598 7482
or 或 − Calling the Publications Sales Section of Information Services
Department (ISD) at (852) 2537 1910 − Visiting the online Government Bookstore at
http:// www.bookstore.gov.hk − Downloading the order form from the ISD website at
http://www.isd.gov.hk and submit the order online or by fax to (852) 2523 7195
− Placing order with ISD by e-mail at [email protected]
− 致電政府新聞處刊物銷售小組訂購 (電話:(852) 2537 1910)
− 進入網上「政府書店」選購,網址為
http://www.bookstore.gov.hk − 透過政府新聞處的網站 (http://www.isd.gov.hk) 於網上遞
交訂購表格,或將表格傳真至刊物銷售小組 (傳真:(852)
2523 7195)
− 以電郵方式訂購 (電郵地址:[email protected])
1:100 000, 1:20 000 and 1:5 000 maps can be purchased from:
讀者可於下列地點購買1:100 000,1:20 000及1:5 000地質圖:
Map Publications Centre/HK, Survey & Mapping Office, Lands Department, 23th Floor, North Point Government Offices, 333 Java Road, North Point, Hong Kong. Tel: 2231 3187 Fax: (852) 2116 0774
香港北角渣華道333號
北角政府合署23樓
地政總署測繪處
電話: 2231 3187
傳真: (852) 2116 0774
Requests for copies of Geological Survey Sheet Reports, publications and maps which are free of charge should be sent to:
如欲如欲如欲如欲索取地質調查報告索取地質調查報告索取地質調查報告索取地質調查報告、、、、其他免費刊物及地質圖其他免費刊物及地質圖其他免費刊物及地質圖其他免費刊物及地質圖,,,,請致函請致函請致函請致函::::
For Geological Survey Sheet Reports and maps which are free of charge: Chief Geotechnical Engineer/Planning, (Attn: Hong Kong Geological Survey Section) Geotechnical Engineering Office, Civil Engineering and Development Department, Civil Engineering and Development Building, 101 Princess Margaret Road, Homantin, Kowloon, Hong Kong. Tel: (852) 2762 5380 Fax: (852) 2714 0247 E-mail: [email protected]
地質調查報告及地質圖:
香港九龍何文田公主道101號
土木工程拓展署大樓
土木工程拓展署
土力工程處
規劃部總土力工程師
(請交:香港地質調查組)
電話: (852) 2762 5380
傳真: (852) 2714 0247
電子郵件: [email protected]
For other publications which are free of charge: Chief Geotechnical Engineer/Standards and Testing, Geotechnical Engineering Office, Civil Engineering and Development Department, Civil Engineering and Development Building, 101 Princess Margaret Road, Homantin, Kowloon, Hong Kong. Tel: (852) 2762 5346 Fax: (852) 2714 0275 E-mail: [email protected]
其他免費刊物:
香港九龍何文田公主道101號
土木工程拓展署大樓
土木工程拓展署
土力工程處
標準及測試部總土力工程師
電話: (852) 2762 5346
傳真: (852) 2714 0275
電子郵件: [email protected]

MAJOR GEOTECHNICAL ENGINEERING OFFICE PUBLICATIONS 土力工程處之主要刊物土力工程處之主要刊物土力工程處之主要刊物土力工程處之主要刊物
GEOTECHNICAL MANUALS
Geotechnical Manual for Slopes, 2nd Edition (1984), 300 p. (English Version), (Reprinted, 2000).
斜坡岩土工程手冊(1998),308頁(1984年英文版的中文譯本)。
Highway Slope Manual (2000), 114 p. GEOGUIDES
Geoguide 1 Guide to Retaining Wall Design, 2nd Edition (1993), 258 p. (Reprinted, 2007).
Geoguide 2 Guide to Site Investigation (1987), 359 p. (Reprinted, 2000).
Geoguide 3 Guide to Rock and Soil Descriptions (1988), 186 p. (Reprinted, 2000).
Geoguide 4 Guide to Cavern Engineering (1992), 148 p. (Reprinted, 1998).
Geoguide 5 Guide to Slope Maintenance, 3rd Edition (2003), 132 p. (English Version).
岩土指南第五冊 斜坡維修指南,第三版(2003),120頁(中文版)。
Geoguide 6 Guide to Reinforced Fill Structure and Slope Design (2002), 236 p.
Geoguide 7 Guide to Soil Nail Design and Construction (2008), 97 p. GEOSPECS
Geospec 1 Model Specification for Prestressed Ground Anchors, 2nd Edition (1989), 164 p. (Reprinted, 1997).
Geospec 3 Model Specification for Soil Testing (2001), 340 p. GEO PUBLICATIONS
GCO Publication No. 1/90
Review of Design Methods for Excavations (1990), 187 p. (Reprinted, 2002).
GEO Publication No. 1/93
Review of Granular and Geotextile Filters (1993), 141 p.
GEO Publication No. 1/2000
Technical Guidelines on Landscape Treatment and Bio-engineering for Man-made Slopes and Retaining Walls (2000), 146 p.
GEO Publication No. 1/2006
Foundation Design and Construction (2006), 376 p.
GEO Publication No. 1/2007
Engineering Geological Practice in Hong Kong (2007), 278 p.
GEOLOGICAL PUBLICATIONS
The Quaternary Geology of Hong Kong, by J.A. Fyfe, R. Shaw, S.D.G. Campbell, K.W. Lai & P.A. Kirk (2000), 210 p. plus 6 maps.
The Pre-Quaternary Geology of Hong Kong, by R.J. Sewell, S.D.G. Campbell, C.J.N. Fletcher, K.W. Lai & P.A. Kirk (2000), 181 p. plus 4 maps. TECHNICAL GUIDANCE NOTES
TGN 1 Technical Guidance Documents