Embed Size (px)
Citation preview

Precarious employment in Europe
Conference on qulaity of employment, 28. and 29. February 2008
Janine Leschke
European Trade Union Institute for Research, Education and Health and Safety (ETUI-REHS)

Forms of (potentially) precarious employment
Part-time employment Marginal employment (<15 hours) Fixed-term employment Temporary agency work (TWA) (Own-account) self-employment
These employment forms are often termed atypical employment or non-standard employment
Standard employment = indefinite (at one employer), full-time, dependent
Other sources of precariousness (going beyond the contract form): low wage employment asocial working time (shift work; Saturday work; Sunday work; night
work; evening work) excessive working hours flexible working hours (without control)

Dimensions of potential precariousness(focus on non-standard employment)
Danger of...
…lower wages (working-poor) especially relevant for part-time and marginal employment
…lacking job security especially relevant for fixed-term and TWA work (by definition lower
employment protection legislation) but also for marginal workers
…lower access to social security potentially all groups (depending on the country and the social security
system)
… lower access to employability measures (firm-based training, life-long learning)
potentially all groups
…possible effects on health and safety at work potentially all groups
…lack of collective interest representation potentially all groups, directly (self-employed) or indirectly (part-time
workers as women)

Non-standard forms of employment:
extent, developments and country differences

5
Employment rate, share of part-time and temporary workers and unemployment rate, EU-27 yearly averages
60.764.4
15.9
18.1
14.3
11.4
8.9
10.1
8.1
9.8
0
10
20
30
40
50
60
70
1997 1998 1999 2000 2001 2002 2003 2004 2005 20060
5
10
15
20
Lisbon empl. ratetarget
employment rate(EU27)
share of part-timeworkers (EU27)
share of temporarycontracts (EU27)
share of self-employed
unemployment rate*
*Unemployment rates refer to EU15 for 1997, to EU25 for 1998-1999 and to EU27 for 2000-2006.Self-employment refers to EU15 for 1997-1999 and to EU27 for 2000-2006.
right-hand scale
left-hand scale

Part-time employment in 2000 and 2007(% of total employment 15-64)
0
5
10
15
20
25
30
35
40
45
BG SK HU CZ GR CY LV EE LT PL RO SI PT MT ES FI IT FR IE EU27 LU EU15 AT BE DK SE UK DE NL
2000 2007
Data source: Eurostat (2007, 2nd quarter).
Part-time employment by gender, 2007
(% of total employment of a given sex 15-64)
0
10
20
30
40
50
60
70
80
BG SK HU LV CZ RO LT EE CY GR SI PL PT FI ES MT IT FR EU27 IE EU25 DK EU15 LU SE AT BE UK DE NL
Men Women
Data source: Eurostat (2007, 2nd quarter).

Part-time employment of women by reason, 2005
(% of total, 15-64)
0%
10%
20%
30%
40%
50%
60%
70%
80%
90%
100%
NL UK SI LU AT BE DE DK EE CZ SK HU SE FR FI LV CY ES PL PT IT RO LT GR BG MT
Could not find a full-time job Did not want a full-time jobFamiliar or personal responsabilities In education or trainingOwn illness or disability no or other reason/missing
Data source: Eurostat (2007). Not data for Ireland.

Temporary employment in 2000 and 2007(% of employment 15-64)
0
5
10
15
20
25
30
35
RO EE LT LV SK UK BG MT LU HU CZ BE AT DK IE GR CY IT FR DE EU27
EU15
FI SE NL SI PT PL ES
2000 2007
Data source: Eurostat (2007, 2nd quarter).
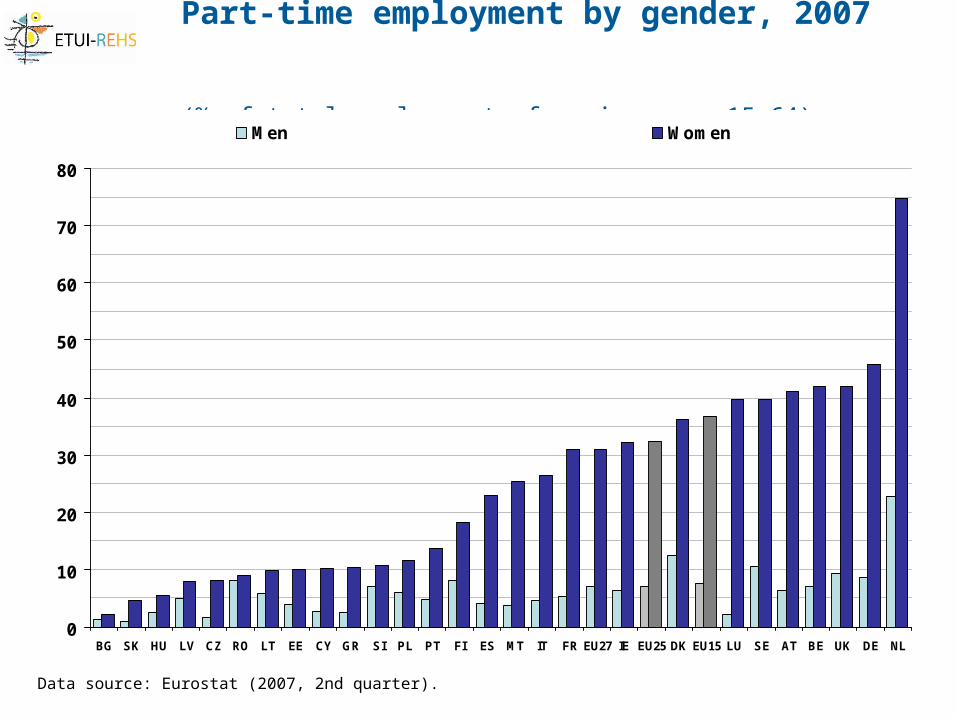
Temporary employment by age group, 2007 (% total number employees in age group)
0
10
20
30
40
50
60
70
RO EE BG LT MT UK LV SK CZ HU IE DK CY GR BE AT LU EU27
EU15
IT NL FI PT FR DE SE ES PL SI
15-24 25-49 50-64
Data source: Eurostat (2007, 2nd quarter).

Temporary employment by reason, 2006
(% of total, 15-64)
0%
10%
20%
30%
40%
50%
60%
70%
80%
90%
100%
AT DE IE UK NL LU DK SI FR SE HU IT FI BG CZ LV SK LT PL RO PT BE GR ES CY
Could not find permanent job Did not want a permanent job
In education or training Probationary period
Data source: Eurostat (2007), no data for EE and MT.

Self-employment 2000 and 2007
(% of all employees 15-64)
0
5
10
15
20
25
LU DK DE EE FR LV SE HU AT SI BG FI NL BE MT EU15
SK IE UK EU27
LT ES CY CZ PT PL IT RO GR
2000 2007
Data source: Eurostat (2006, 2nd quarter).

In how far are these employment forms precarious?

Working poor – full-time and part-time workers
0
2
4
6
8
10
12
14
16
18
20
22
24
26
28
30
BE NL DK MT CZ DE SE FR EU15
CY AT SI EU25
IE FI ES LU UK IT HU SK EE PL GR LV LT PT
Working full-time Working part-time
Data source: Eurostat (2007). 18 years and over.
In-work at risk of poverty 2005 by full-time/part-time work (cut-off point: 60% of median equivalised income after social transfers)
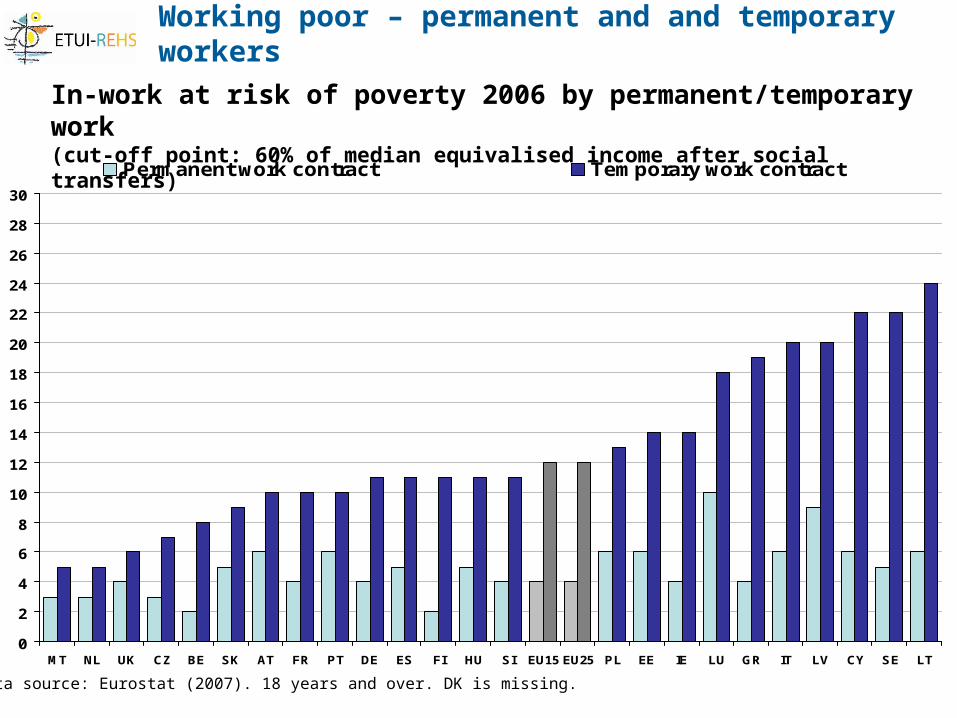
Working poor – permanent and and temporary workers
0
2
4
6
8
10
12
14
16
18
20
22
24
26
28
30
MT NL UK CZ BE SK AT FR PT DE ES FI HU SI EU15 EU25 PL EE IE LU GR IT LV CY SE LT
Permanent work contract Temporary work contract
Data source: Eurostat (2007). 18 years and over. DK is missing.
In-work at risk of poverty 2006 by permanent/temporary work (cut-off point: 60% of median equivalised income after social transfers)

Job Security: Increasing differences between permanent and temporary workers
Source: OECD Employment Outlook 2004.
Country
Overall strictness of protection against
dismissals on permanent contracts
Overall strictness of regulation on
temporary contracts
1990 2003 1990 2003
Austria 2.9 2.4 1.5 1.5 Belgium 1.7 1.7 4.6 2.6 Czech Republic .. 3.3 .. 0.5 Denmark 1.5 1.5 3.1 1.4 Finland 2.8 2.2 1.9 1.9 France 2.3 2.5 3.1 3.6 Germany 2.6 2.7 3.8 1.8 Greece 2.5 2.4 4.8 3.3 Hungary .. 1.9 .. 1.1 Ireland 1.6 1.6 0.3 0.6 Italy 1.8 1.8 5.4 2.1 Netherlands 3.1 3.1 2.4 1.2 Poland .. 2.2 .. 1.3 Portugal 4.8 4.2 3.4 2.8 Slovak Republic .. 3.5 .. 0.4
Spain 3.9 2.6 3.8 3.5 Sweden 2.9 2.9 4.1 1.6 United Kingdom 0.9 1.1 0.3 0.4

Disadvantages in social security systems (illustrated by unemployment benefits): part-time workers
98
91
72
63
33
24
58
28
19
32
47
34
78
1614
36
0
10
20
30
40
50
60
70
80
90
100
full-time part-time full-time part-time full-time part-time full-time part-time
Denmark Germany Spain United Kingdom
Un
em
plo
ym
en
t b
en
efi
t re
ceip
t as s
hare
of
reg
iste
red
un
em
plo
yed
/ a
ll w
ith
no
jo
b lo
okin
g f
or
a
job
registered no job, looking for a job
Source: Own calculation based on pooled and weighted ECHP data. The retrospective survey information on part-time employment is used.
Unemployment benefit receipt of former full-time and part-time workers (comparison of registered unemployed and all unemployed looking for a job)

Disadvantages in social security systems (illustrated by unemployment benefits): temporary workers
Source: Own calculation based on pooled and weighted ECHP data. The retrospective survey information on part-time employment is used.
Unemployment benefit receipt of former permanent and temporary workers (comparison of registered unemployed and all unemployed looking for a job)
8184
47
62
72
89
80
52
42
33
43
35
9696
46
66
0
10
20
30
40
50
60
70
80
90
100
permanent temporary permanent temporary permanent temporary permanent temporary
Denmark Germany Spain United KingdomUn
empl
oym
ent
ben
eift
rec
eip
t as
shar
e o
f reg
iste
red
u
nem
plo
yed
/ all
wit
h no
job
loo
king
for
a jo
b
registered no job, looking for a job
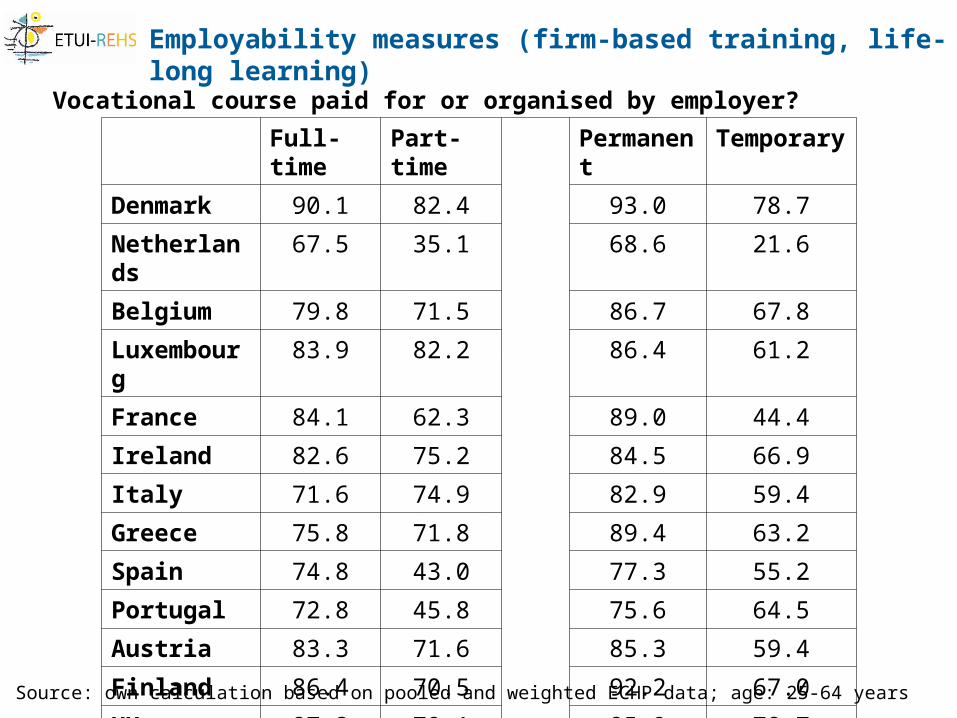
Full-time Part-time Permanent Temporary
Denmark 90.1 82.4 93.0 78.7
Netherlands 67.5 35.1 68.6 21.6
Belgium 79.8 71.5 86.7 67.8
Luxembourg 83.9 82.2 86.4 61.2
France 84.1 62.3 89.0 44.4
Ireland 82.6 75.2 84.5 66.9
Italy 71.6 74.9 82.9 59.4
Greece 75.8 71.8 89.4 63.2
Spain 74.8 43.0 77.3 55.2
Portugal 72.8 45.8 75.6 64.5
Austria 83.3 71.6 85.3 59.4
Finland 86.4 70.5 92.2 67.0
UK 87.3 79.1 85.9 78.7
Employability measures (firm-based training, life-long learning)
Vocational course paid for or organised by employer?
Source: own calculation based on pooled and weighted ECHP data; age: 25-64 years

Health and safety
Source: Benavides et al. (2000). Data: Second European Survey of Working Conditions, coverage EU15.
Distribution of self reported health indicators by employment, 2000 (EU-15 average as percentage)
Types of employment
absenteeism stress fatigue backache muscular pains
Permanent 25.2 29.5 17.7 28.7 16.9
Temporary 22.8 22.4 21.3 30.5 20.1
Full-time 25.6 29.5 18.0 29.1 17.2
Part-time 23.3 27.2 16.3 27.0 15.6

Trade union density (2004) Collective agreement coverage
Austria 32% 91-100%
Belgium 49% 91-100%
France 8% 91-100%
Slovenia 44% 91-100%
Sweden 77% 91-100%
Denmark 80% 81-90%
Finland 74% 81-90%
Italy 34% 81-90%
Netherlands 25% 81-90%
Spain 16% 81-90%
Luxembourg 46% 71-80%
Portugal 17% 71-80%
Cyprus 53% 61-70%
Germany 20% 61-70%
Greece 20% 61-70%
Ireland 36% 51-60%
Malta 55% 51-60%
Collective interest representation
Sources: Industrial Relations in Europe (2006); Keune 2006.

Trade union density (2004) Collective agreement coverage
Poland 17% 41-50%
Slovakia 31% 41-50%
Hungary 17% 31-40%
United Kingdom 29% 31-40%
Czech Republic 22% 21-30%
Estonia 12% 21-30%
Latvia 16% 11-20%
Lithuania 13% 11-20%
Collective interest representation - suite
Sources: Industrial Relations in Europe (2006); Keune 2006.

Non-standard employment and precarity
Regular part-time
Marginal employment (<15 hours)
Fixed-term Temporary work agency employment
(Bogus) self-employment
Wages Formally proportional (in reality often lower)
Low (sometimes by definition)
Usually lower than standard employment
lower Often lower than for standard employment*
Job security Same as for standard
Often lower Low by definition
Lower than for standard employment
Low
Social security Formally proportional but in fact often lower access
Minimal (or via a working partner/ another job)
Dependent on continuity
Same as for standard (with exceptions)
Depending on country often lower and/or very expensive; exclusion from some systems (unemployment)
Employability Lower Very low lower Lower Not clear Health and safety
Not clear (lacking comparative research)
Collective interest representation
Not clear but probably lower (lacking research)
Source: adapted from Keller/Seifert (2006).

Conclusions
Forms of non-standard employment have been growing over the last decade
Specific labour market groups are over-represented, namely women, young workers, low qualified and migrant workers
Non-standard jobs do not necessarily have to be precarious but often are in at least some dimensions
Importance of regulations
Stepping stones or dead-end jobs?
There is a lack of comparative data and studies on precariousness especially on issues of health and safety and collective interest representation but also on social security