Embed Size (px)
Citation preview

HPA-RPD-016
© Health Protection Agency Centre for Radiation, Chemical and Environmental Hazards Radiation Protection Division Chilton, Didcot, Oxfordshire OX11 0RQ
Approval: August 2006 Publication: November 2006 £35.00 ISBN 0 85951 580 X
This report from HPA Radiation Protection Division reflects understanding and evaluation of the current scientific evidence as presented and referenced in this document.
Practical Implications of Neutron Survey Instrument Performance
R J Tanner1, C Molinos2, N J Roberts3, D T Bartlett1, L G Hager1, L N Jones3, G C Taylor3 and D J Thomas3
1 RADIATION PROTECTION DIVISION, HEALTH PROTECTION AGENCY, CHILTON, DIDCOT, OXON OX11 0RQ 2 FORMERLY NRPB. 3 NEUTRON METROLOGY GROUP, DQL, NATIONAL PHYSICAL LABORATORY, TEDDINGTON, MIDDLESEX, TW11 0LW
ABSTRACT Neutron area survey instruments are used to detect neutrons with a wide range of energies and directions. They are designed to have a response that is as independent of neutron energy and angle of incidence as possible, but given the difficulty of the problem it is unsurprising that they are all deficient in terms of both energy and angle dependence of response to some extent. Simple inspection of the maximum systematic errors that could occur would lead to a very pessimistic view of their performance in the workplace because the energy and direction distributions of the neutrons will tend to reduce the maximum bias that can occur. To estimate the magnitudes of these biases improved energy and angle dependence of response characteristics for the three most commonly used designs in the UK have been calculated using MCNP. These calculations have been augmented by measurements. The new response data have then been used to calculate the response in workplaces and assess the implications of the deficiencies of the response characteristics. Data have also been obtained to enable a less thorough assessment to be made for other instruments. The performances of the instruments are also assessed in terms of effective dose and for situations where the user perturbs the response.
This study was funded by the National Measurement System Policy Unit of the Department of Trade and Industry as Project 3.5.5 in the Ionising Radiation Metrology Programme IR(01-04)


iii
EXECUTIVE SUMMARY
Detailed Monte Carlo modelling has been performed for three models of neutron area survey instrument, namely the Leake 0949, the NM2B and the Studsvik 2202D. The geometric specifications of the instruments have been improved compared to earlier modelling of the same devices, and the energy and angle dependence of response has been modelled in smaller increments. The resultant response characteristics have been applied to understanding the behaviour of the instruments in workplaces, given assumptions about the direction distributions of the fields. Such assumptions are required to take account of the angle dependence of response of the instruments. They are also needed to assess whether the H*(10) assessment provides a conservative or reasonable estimate of effective dose. Published response data for the Berthold LB6411 and the Thermo Electron SWENDI-II have also been included in the study. Unfortunately, the variation of the response characteristics with angle of incidence are not available for either of these instruments, so analysis of their response in terms of effective dose has had to assume perfect isotropic response.
All of these single detector designs are found to make generally conservative estimates of H*(10). However, the Leake 0949 tends to underestimate H*(10) in hard neutron fields to avoid excessive overestimates in soft fields. The significantly heavier NM2B and Studsvik 2202D have better H*(10) response in workplace fields, although their direction dependence is less satisfactory. The spherical symmetry of the Leake is clearly preferable in this respect.
The newer designs of instrument, the LB6411 and SWENDI-II do not have significantly better H*(10) response, although this assessment depends on the workplace application. The LB6411 has a reduced overestimate in the 1-10 keV energy region, but this leads to a significant under-response to thermal neutrons. In workplaces, this is seen to give very good integral H*(10) response, unless the field is very soft. This effect is most significant for a sub-set of the reactor fields. The SWENDI-II, requires a slightly more complex analysis because its calibration is appropriate for high-energy neutron fields. It hence has a large overestimate in terms of H*(10) for energies between thermal and 1 MeV, and would overestimate in all of the fields in this study. To avoid subjective judgements about the correct calibration response, the data have also been presented for a bare 252Cf calibration.
Generally, the instruments avoid underestimates of effective dose when calibrated in terms of H*(10) using bare radionuclide sources. There are exceptions, such as the LB6411 for unidirectional, very soft fields. However, fields that are so soft are unlikely to be unidirectional. In terms of the isotropic geometries considered, these estimates of effective dose are still conservative.
One field that causes problems for the instruments in this respect is the bare 241Am-Be calibration field. EAP/Φ is higher than H*(10)/Φ for this field. Hence, if the instrument is calibrated using this field it will underestimate effective dose by 5%. This makes the field particularly problematic for the lightest instrument, the Leake, for which there is a 28% underestimate of effective dose. The unscattered field from a point source will be

PRACTICAL IMPLICATIONS OF NEUTRON SURVEY INSTRUMENT PERFORMANCE
iv
approximately unidirectional so the assumption of some degree of isotropy is not realistic for that field.
Because EAP/Φ represents the maximum for effective dose in the energy range studied, when rotational or spherical isotropy is assumed large overestimates of effective dose occur. All of the instruments suffer from this to differing degrees, but when the H*(10) from thermal neutrons is overestimated, the problem is worse. It is particularly true for soft fields for the Leake, for which the instrument overestimates H*(10). Consequently, for spherically isotropic fields the instrument can overestimate effective dose by up to a factor of six.
Unfortunately, there are few simultaneous direction and energy distribution determinations that have been made in workplaces. The only ones available to this study are from calculations that were performed during the design process of a facility that is now being commissioned. The direction distributions are interesting, since there are many relatively unshielded sources in the room, and operator positions that have sources located on all sides. Because the direction distributions are known, the reading of the instrument can be more accurately determined, but more importantly, the effective dose can be calculated more correctly. Hence, it is possible to show that whilst the assessments of ambient dose equivalent are relatively good, the instruments overestimate effective dose by factors of up to 2.5. This conclusion can only be justified for these specific calculations, which may not represent the plant as it is to be operated when it is fully operational.
Two other, more sophisticated instruments have been studied. Both designs have smaller deviations in their H*(10) response to monoenergetic neutrons. In workplace fields, the improvement in their response characteristics is not so significant. For the HPA/BNFL Novel Survey Instrument, this is caused by its underestimate of H*(10) at 100 keV. However, despite underestimating H*(10) in some of these fields by up to 30%, it does not underestimate effective dose in any field by more than 4%. The avoidance of any significant overestimates of H*(10) assists the effective dose performance: the overestimates of isotropic fields reach a factor of 3.5, which is slightly more than the maximum for the LB6411, equivalent to the NM2B and better than the other single detector instruments.
The Hybrid Survey Instrument developed by the University of Lancaster, despite being lighter than the original HPA/BNFL design, performs better. Its estimates of H*(10) are within the range from –26% to +31% of the true value, for the fields included in this study when incident from the reference direction. The corresponding values for the HPA/BNFL version are –30% to +35% and those for the best single detector design in this respect, the NM2B, –25% to +31%. Clearly, although these designs have improved energy dependence of response in monoenergetic fields they do not offer a major advance over the single detector systems in workplace fields. However, they do have the potential for providing warnings or even corrections to the reading based on the direction distribution of the field.
Published response data show that the behaviour of a particular instrument type varies from instrument to instrument. Perturbation calculations have been used to understand

v
whether the intrinsic variability of the response between instruments is caused by manufacturing uncertainties. Several parameters have been tested:
a Polyethylene density b Accuracy of construction of the attenuating layer construction, specifically the
holes diameters c Composition of the attenuating layer d Central detector gas pressure e Accuracy of the cross-section data for hydrogen
The polyethylene density is found most likely to cause variation between instruments. Commercial products have a range of densities and the density has an energy-dependent influence on the response. This is found to have a potentially significant impact on the response in workplace fields: the H*(10) response for some fields falls by up to 10% relative to the calibration response for plausible changes to the polyethylene density.
The response is even more sensitive to the sizes of the holes in the thermal neutron attenuation layer. The likely variation in this parameter is, however, not so easy to assess but there are good grounds for believing that it may be systematically rather than randomly perturbed. The effect on the response is energy dependent and greatest for low energies. Uncertainties of this type will affect the response in workplace fields relative to that of the calibration field.
Modelling of the effect of a user holding the instruments to make measurements has shown that the impact on the reading is not very significant, unless the user shields a significant component of the field. The shielding provided by the torso is more significant in terms of effect and solid angle than that provided by the legs, but in both cases the response of the instrument is suppressed by 90-95% for specific angles of incidence. This does not have a very large effect on the reading in isotropic fields, although it can reach 25% if the sensitive volume of the instrument is held close to the torso.
For the calculated fields for which the direction distribution is known, the NM2B response in terms of ambient dose equivalent is not very adversely affected by the user: it is changed by ±10%. There is also a reduction in the overestimate of effective dose, which is otherwise substantially overestimated because the fields are quite isotropic. Hence, for those fields, it is not clear that making the measurements whilst holding the instrument would make the reading less satisfactory. That conclusion, however, depends on the user not shielding a prominent component of the field.
The models that have been developed have been exhaustively tested for energy and angle dependence of response. The new areas of study that have been developed, the sensitivity of the calculated results to the input parameters and natural variations in manufacture and mode-of-use, both show interesting preliminary results. These are worthy of further development so that more conclusive analysis of their impact becomes possible.
Developments in neutron area survey instruments have been relatively few in the last 40 years. However, a paper on the most significant change to the Leake design since it was introduced in the 1960’s has recently been published. Changes made include

PRACTICAL IMPLICATIONS OF NEUTRON SURVEY INSTRUMENT PERFORMANCE
vi
replacing the cadmium layer with a boron loaded rubber layer, with consequent improvements to the response in the intermediate energy range. Additionally, a higher pressure detector increases the response per unit dose of the instrument. At the time of going to press, the published data are for an intermediate stage in the development. The boron loaded layer is now imperforated, so no folding has been performed in this work to assess the impact of these changes. However, the new response data will, when available, warrant being treated in the same manner as those for the LB6411 and the SWENDI-II to assess whether the new design offers significant dosimetric improvement.
Workplace direction distributions are vital to understanding effective dose. The only fields in this study that have direction information are the calculated fields, for which the direction resolution is crude. Consequently, the analysis of the response and dose quantities in the workplaces requires assumptions to be made. In reality, most of the fields in the study will have stronger direction dependence for the fast component of the field than they have for the soft component. Knowledge of this aspect of workplace fields will also have significant impact on the mode-of-use analysis.
Recent developments as part of an EC funded project on measuring the energy and direction distribution of workplace fields are beginning to show real promise. Preliminary results are in press, but were not ready for inclusion in the analysis for this report. Early results are for a boiling water reactor and near an NTL11 fuel flask at Krümmel in Germany plus the VENUS research reactor and Belgonucleaire fuel fabrication plant at Mol in Belgium. Future sites for the measurements will include the Ringhals PWR in Sweden and probably BNFL, Sellafield. When the data are available, they will become the most useful fields available for the interpretation of the response of neutron survey instruments.
The new ICRP recommendations are scheduled to be published in early 2007. These will not impact on ambient dose equivalent, the quantity with which this work is primarily concerned, but they are expected to cause changes to effective dose. The proposed changes to the radiation weighting factor function for neutrons with energies lower than 1 MeV will reduce effective dose in soft fields, but leave that for hard fields relatively unchanged. Additional proposed changes to the tissue weighting factors and the phantoms that are used for effective dose calculations will have effects that are less easy to predict. The result will be new values for the fluence to effective dose conversion coefficients that will need to be used to recalculate the readings of the instruments in terms of effective dose in workplace fields.

vii
CONTENTS
1 INTRODUCTION 1 1.1 Background 2 1.2 Dose quantities 5 1.3 Issues 6 1.4 Aims 8
2 Modelling results and measurements 9 2.1 Definitions 9
2.1.1 Angles of incidence 9 2.1.2 Effective centre 10
2.2 Leake 10 2.2.1 Enhancements to the modelling 10 2.2.2 Angle and model dependence of response 11 2.2.3 Comparison between calculations and measurements 13 2.2.4 Full energy and angle dependence of response 20 2.2.5 Response from 0° and for isotropic fields 22
2.3 NM2 23 2.3.1 Model variations 23 2.3.2 Changes to the model 24 2.3.3 Measurements using radionuclide sources 25 2.3.4 Comparison with other measurements 27 2.3.5 Energy and angle dependence of response 32 2.3.6 Response to isotropic fields 35
2.4 Studsvik 2202D 39 2.4.1 Modelling enhancements 39 2.4.2 Radionuclide source measurements 43 2.4.3 Response from the reference direction 49 2.4.4 Angle dependence of response 51 2.4.5 Comparison with prior experimental data 52
3 Sensitivity of modelling results 56 3.1 Leake, 0949 59
3.1.1 Holes in the cadmium layer 59 3.1.2 Polyethylene density 61
3.2 NM2 61 3.2.1 Polyethylene density 61 3.2.2 Holes in the boron-loaded layer 61 3.2.3 BF3 pressure 62
3.3 Studsvik 2202D 64 3.3.1 Polyethylene density 65 3.3.2 Boron loading of the neoprene layer 66 3.3.3 Perturbation of cross sections 68
4 Influence of the field and mode of use 70 4.1 Influence of a concrete floor 72 4.2 Influence of a person on the instrument reading 74
4.2.1 Leake 75 4.2.2 NM2 78
5 Neutron energy distributions 88 5.1 Fluence-energy distributions 88

PRACTICAL IMPLICATIONS OF NEUTRON SURVEY INSTRUMENT PERFORMANCE
viii
5.2 Calibration fields 90 5.3 Simulated workplace fields 92 5.4 Reactor fields 93
5.4.1 UK gas cooled reactor energy distributions 93 5.4.2 PWR energy distributions: Gosgen and Ringhals 96
5.5 Fuel cycle and source production fields 97 5.5.1 Fuel processing, reprocessing and storage 98 5.5.2 Source fabrication and source usage areas 99
5.6 Transport flasks 101 5.7 Calculated energy distributions 104 5.8 Summary 108
6 Response data for Other designs 109 6.1 Single detectors designs 110
6.1.1 LB6411 110 6.1.2 SWENDI-II 111
6.2 Multi-detector designs 113 6.2.1 HPA/BNFL novel survey instrument 113 6.2.2 Hybrid 114
6.3 Other designs 116 6.3.1 The Canberra Dineutron 116 6.3.2 HPI Model REM 500 116 6.3.3 REMbrandt™ 116 6.3.4 E-600/NRD 116 6.3.5 FHT 750/751/752 BIOREM Neutron Detector 117 6.3.6 Ludlum Model 12-4 117 6.3.7 Model 5080 Meridian 117 6.3.8 Model 2080 Albatross Pulse Neutron Detector 117 6.3.9 Prescila 118 6.3.10 Victoreen® Model 190N 118 6.3.11 Fuji Electric NSN10014 119 6.3.12 Aloka Neutron Survey Meter TPS-451S 119 6.3.13 Thermal neutron detectors 119
7 Response in workplaces 119 7.1 Folding 119 7.2 Response in workplaces 120
7.2.1 Ambient dose equivalent 121 7.2.2 Effective dose 121
7.3 Leake 0949 122 7.4 NM2B 124
7.4.1 Unperturbed response 124 7.4.2 Folding and perturbation 127 7.4.3 Mode-of-use perturbation 127
7.5 Studsvik 2202D 132 7.6 LB 6411 134 7.7 SWENDI-II 137 7.8 HPA/BNFL Novel Area Survey Meter 138 7.9 Hybrid 141 7.10 Sellafield MOX Plant fields 143
8 Conclusions 146 8.1 Modelling and experimental data 146 8.2 Response in workplaces 149 8.3 Perturbation studies 152

ix
8.4 Mode-of-use 153 8.5 Summary 156 8.6 Future work 159
8.6.1 Direction distribution data 159 8.6.2 New ICRP Recommendations 159
9 Acknowledgements 161
10 References 161
APPENDIX A 166 Isotropic Source in MCNP
APPENDIX B 168 Calculated response data
B1 Leake 169 B2 NM2B 170 B3 Studsvik 2202D 171
APPENDIX C 174 Effective centre measurements
C1 Studsvik 2202D 174
APPENDIX D 177 Additional measured data
D1 Studsvik 2202D 177
APPENDIX E 179 Central Index of Dose Information Data (CIDI) 2003
APPENDIX F 180 Influence of polyethylene density on NM2 response


INTRODUCTION
1
1 INTRODUCTION
This work was performed for the National Measurement System (NMS) Policy Unit of the Department of Trade and Industry as Project 3.5.5 in the Ionising Radiation Metrology Programme, IR(01-04). It builds on the results and conclusions of the earlier NMS Project 3.6.1, ‘Provision of Reliable Energy Response Function Data for Routinely Used Survey Meters in Neutron Metrology’ (Bartlett et al, 2002). In that project the main work areas and outcomes were:
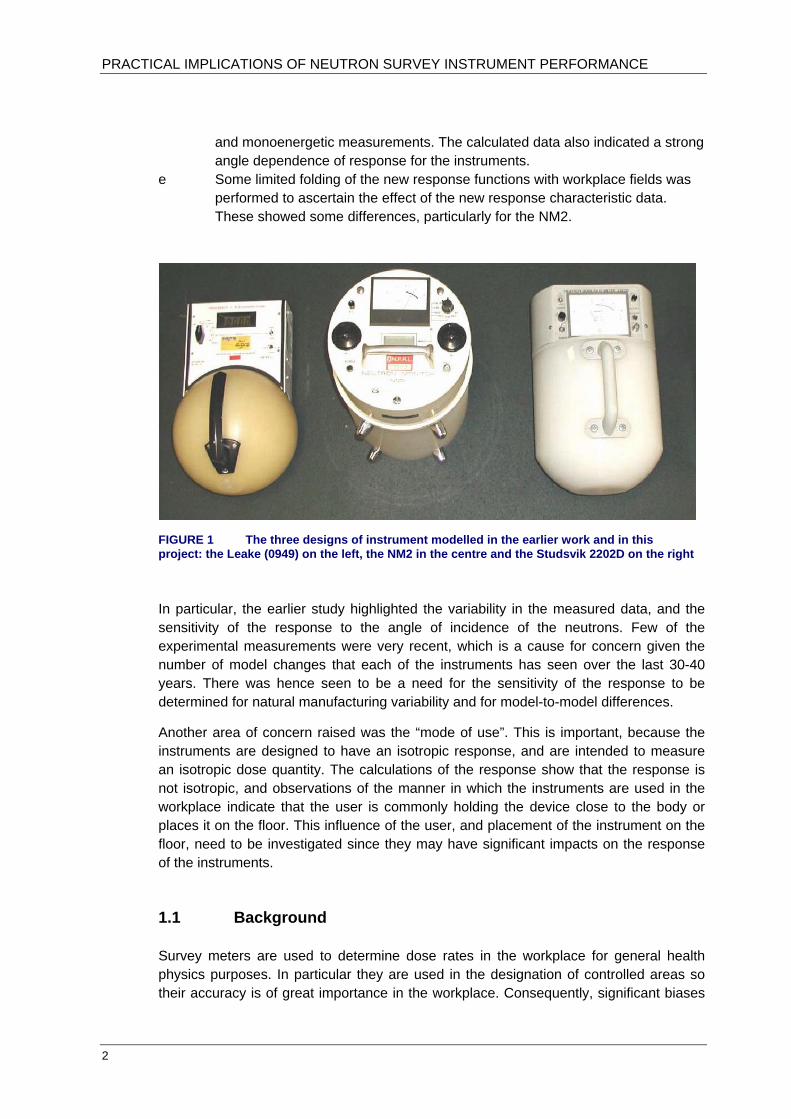
a A survey was performed to determine the numbers of each type of neutron area survey meter in use in the UK. This identified the most commonly used devices and formed the basis for selecting instruments for inclusion in the later stages of the project: these were two instruments based on the Andersson-Braun design, the NM2 and the Studsvik 2202D, plus the Leake design (Figure 1).
b Published and unpublished response data for the most commonly used instruments were gathered together. These data spanned a 30-40 year period and included radionuclide source and monoenergetic neutron measurements, and interpolations of the experimental data. These data were evaluated to check what instrument settings and normalizations had been applied, and corrected where appropriate. Sets of recent radionuclide source measurements made at National Standards laboratories were selected, so that they could be used to normalize the calculated response characteristics. This was not possible for the NM2, for which no recent, reliable, radionuclide source calibrations were available for the study.
c Computer models of the main types of neutron area survey meter in use in the UK were constructed to facilitate Monte Carlo simulation of the response of those dosemeters. Recent drawings and additional information were obtained from the manufacturers of the most commonly used neutron area survey meters, so that MCNP-4C (Briesmeister, 2000) input files could be developed. These models included very detailed descriptions of the central detector and moderator, and modelling of the electronics that is as realistic as is reasonably achievable. Whilst the moderator has changed little since these designs were originally produced, significant variations in the central detectors and the electronics were found, both of which had changed considerably as new models have been introduced. There was also found to be significant uncertainty about the composition and density of some of the materials used in the construction.
d The three selected designs of instrument (Figure 1) were modelled using neutron energies ranging from thermal (0.0253 eV) to 20 MeV and angles of 0°, 90° and 180° to the reference direction of the instrument. These results were compared with all experimental measurements after normalization to recent radionuclide source measurements made at National Standards Laboratories. It was found that the calculated response characteristics fitted well with the general trend of the experimental data, but that the experimental data exhibited a large scatter. This was true for both the radionuclide source
PRACTICAL IMPLICATIONS OF NEUTRON SURVEY INSTRUMENT PERFORMANCE
2
and monoenergetic measurements. The calculated data also indicated a strong angle dependence of response for the instruments.
e Some limited folding of the new response functions with workplace fields was performed to ascertain the effect of the new response characteristic data. These showed some differences, particularly for the NM2.
FIGURE 1 The three designs of instrument modelled in the earlier work and in this project: the Leake (0949) on the left, the NM2 in the centre and the Studsvik 2202D on the right
In particular, the earlier study highlighted the variability in the measured data, and the sensitivity of the response to the angle of incidence of the neutrons. Few of the experimental measurements were very recent, which is a cause for concern given the number of model changes that each of the instruments has seen over the last 30-40 years. There was hence seen to be a need for the sensitivity of the response to be determined for natural manufacturing variability and for model-to-model differences.
Another area of concern raised was the “mode of use”. This is important, because the instruments are designed to have an isotropic response, and are intended to measure an isotropic dose quantity. The calculations of the response show that the response is not isotropic, and observations of the manner in which the instruments are used in the workplace indicate that the user is commonly holding the device close to the body or places it on the floor. This influence of the user, and placement of the instrument on the floor, need to be investigated since they may have significant impacts on the response of the instruments.
1.1 Background
Survey meters are used to determine dose rates in the workplace for general health physics purposes. In particular they are used in the designation of controlled areas so their accuracy is of great importance in the workplace. Consequently, significant biases

INTRODUCTION
3
on the instrument reading can have implications for working practice, which makes it important for the potential for systematic biases to be understood.
Most designs of neutron survey instruments rely on 3He or BF3 detectors because of the high thermal neutron cross-sections of 3He(n, p) and 10B(n, α) reactions. Those cross-sections, however, fall rapidly with increasing neutron energy (Figure 2), which means that a practical instrument based on thermal neutron detectors requires very careful design.
10-2 10-1 100 101 102 103 104 105 106 107
En (eV)
0.1
1
10
100
1000
10000
Cro
ss S
ectio
n (b
arns
)
0
0.05
0.10
0.15
0.20
0.25
Norm
alized Φi /ln(E
i+1 /Ei )
3He(n, p)3H
Fuel Storage
Fuel Assembly
Calder Hall
FIGURE 2 Three neutron fluence-energy distributions of differing hardness plotted with the 3He(n, p) cross-section
The problem of detecting the wide range of neutron energies encountered in the workplace using strongly energy dependent capture reactions (Figure 2), in general, involves the use of a large moderating mass to improve the efficiency with which fast neutrons are detected. Such a simple design would, however, over-respond to intermediate-energy neutrons, so a thermal neutron absorbing layer is located at an intermediate depth in the moderating layer. In practice, this layer is generally perforated so that the response to thermal neutrons is not over-suppressed (Andersson and Braun, 1963; Andersson and Braun, 1964; Leake, 1966; Leake, 1968). The result is an instrument that detects thermal and fast neutrons with approximately equal dose equivalent response, but which can lead to significant errors for intermediate energy neutrons. However, even for fields that have significant fluence in the intermediate

PRACTICAL IMPLICATIONS OF NEUTRON SURVEY INSTRUMENT PERFORMANCE
4
energy range (eg the fuel storage field in Figure 2) the largest component of dose equivalent is generally from fast neutrons (Figure 3).
This basic design accounts for almost all of the neutron area survey instruments that are currently in use in the UK. Other designs exist, such as those based on tissue equivalent proportional counters, but their use is not widespread. New designs may form an increasing fraction of the instruments used in the UK, but individual area survey meters remain in use for many years, so any change will be very slow.
10-2 10-1 100 101 102 103 104 105 106 107
En (eV)
0
1
2
3
4
5
6
Nor
mal
ized
H*(
10) r
espo
nse
0
0.05
0.10
0.15
0.20
0.25
Norm
alized Φi /ln(E
i+1 /Ei )Fuel Storage
Fuel Assembly
Calder Hall
NE 0075
FIGURE 3 The fluence-energy distributions from Figure 2 plotted as H*(10) distributions and the H*(10) response of one of the commonest variations on the Leake design of neutron survey instrument
In general, neutron survey instruments have been designed to have an approximately isotropic response. Since 1985, when the International Commission on Radiation Measurements and Units introduced ambient dose equivalent as the quantity appropriate for area monitoring (ICRU, 1985), this requirement has become more formalized. Indeed, since the dose quantity that is to be assessed is by definition isotropic, it is important that the instrument that is used to assess it has an isotropic response.
Each of the instruments in use has a specified reference direction, which is carefully selected. This avoids the electronics and handle, which are generally located on the outside of the moderating sphere. It also avoids the direction where the signal is

INTRODUCTION
5
extracted from the central detector, since that inevitably provides a loss of symmetry in the design. In practice, problems caused by the anisotropy of response are overcome if:
a The user is aware of the reference direction. In designs based on cylindrical moderators, this is perpendicular to the axis of the cylinder, which may not be recognized by the user.
b The field is relatively unidirectional. This may commonly be true, but in highly moderated neutron fields there will be a strong isotropic component, and it is for the soft component of the field that the instrument response shows the poorest isotropy.
c The user correctly recognizes the primary direction of the field.
In addition to the problems associated with the angle dependence of response of the instruments, the field itself can be incorrectly assessed because of perturbation by the user or the floor. Ideally, the measurement should be made with the instrument supported at the height of the torso, without a substantial supporting structure. When the instrument is hand held, or placed on the floor, the field will be perturbed by both attenuation and scatter. If the instrument is to be held by the user, then the situation can be improved by its being held away from the body, but the weight of the instruments generally prevents this. Some designs even provide a shoulder strap so that they can be used whilst adjacent to the body. In a field with a large isotropic component, the user could shield a significant fraction, or the floor could provide a strong component of scatter. In a strongly directional field, the user could either shield the dominant component, or enhance it by providing backscatter.
1.2 Dose quantities
Survey instruments are generally calibrated in terms of ambient dose equivalent, H*(10), which is defined in the 30 cm diameter ICRU sphere at a depth of 10 mm for an expanded and aligned field (ICRU, 1985). Evaluation of H*(10) in the workplace is possible for any measured or calculated energy distribution because it is an isotropic quantity: the direction distribution of the field is not relevant. Since measurement of the energy distribution is a well established (Thomas and Klein, 2003), plenty of data are available that allow H*(10) to be determined in specific workplaces.
Measurements made using a survey instrument calibrated in terms of H*(10) are intended to provide estimates of the protection quantity, effective dose (ICRP, 1991), so the implications of H*(10) measurements can only be assessed if the effective dose can be determined. In the workplace this is rarely possible because the direction distribution of the field needs to be known since effective dose, unlike ambient dose equivalent, is not an isotropic quantity. Unfortunately, there are very few reliable determinations of the neutron direction distribution in workplaces, so effective dose must generally be calculated from the measured energy distribution and an assumed direction distribution.
The conversion coefficients for effective dose published by the International Commission on Radiological Measurements and units (ICRU) and the International Commission on Radiological Protection (ICRP) (ICRU, 1998; ICRP, 1996) are limited to four unidirectional plane parallel fields and two isotropic fields. For unidirectional exposure

PRACTICAL IMPLICATIONS OF NEUTRON SURVEY INSTRUMENT PERFORMANCE
6
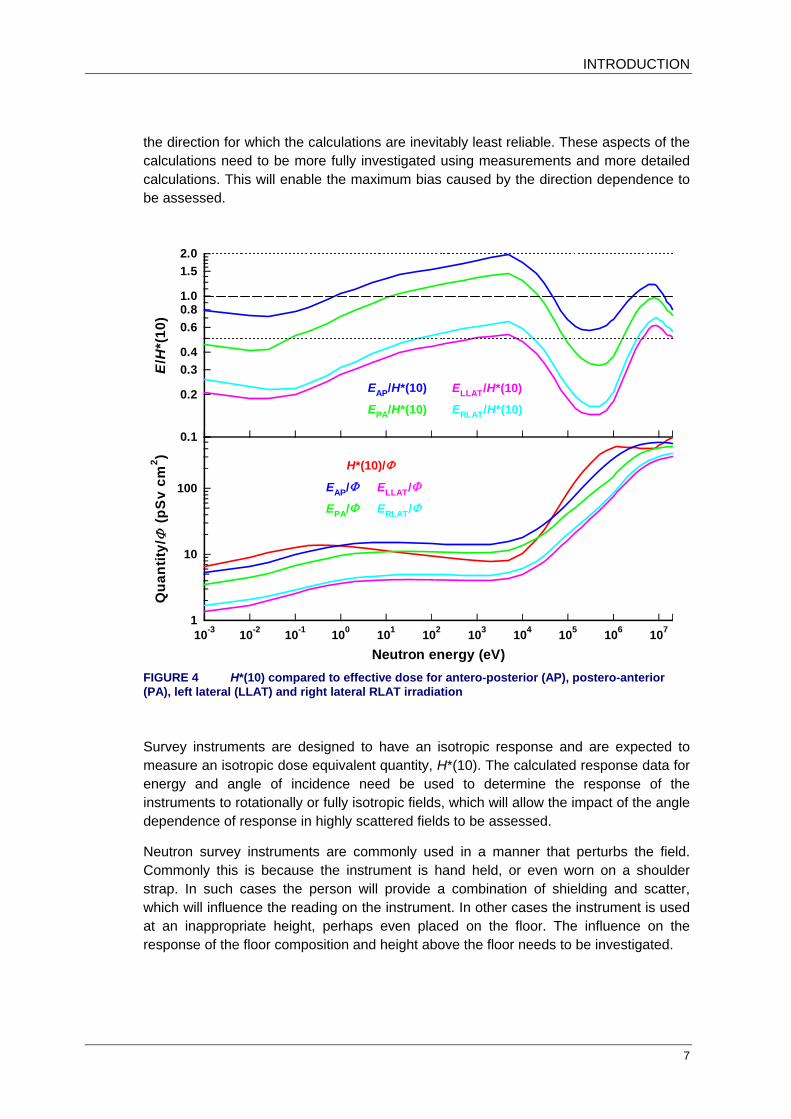
conversion coefficients for antero-posterior, left lateral, right lateral and postero-anterior are tabulated, whilst data for rotational* (ROT) and spherical† (ISO) isotropy have also been calculated. The four directions are antero-posterior (AP), postero-anterior (PA), right lateral (RLAT) and left lateral (LLAT). For all energies up to 20 MeV AP has the maximum value of these six geometries. It is lower than H*(10) for much of the energy range up to 20 MeV, although it is higher in the ranges 1 eV to 30 keV and 3 MeV to 12 MeV (Figure 4). The maximum underestimate of effective dose that would result from an accurate assessment of H*(10) would be almost a factor of 2 for a 5 keV field incident AP. Whilst the PA geometry can also produce higher effective dose values than H*(10), the difference is smaller, and effective dose is always smaller for fast neutrons. In practice, only the fast neutron component is likely to be unidirectional, and effective dose for other geometries can be much lower than for AP (Figures 4 and 5), so effective dose is likely to be smaller than H*(10) for almost all workplace fields.
1.3 Issues
Systematic biases in the spectrum averaged H*(10) response of neutron area survey meters in the workplace have impacts on working practice, since surveys performed using these instruments are the basis for health physicists’ decisions on the designation of controlled areas. It is hence important for UK industry to have available reliable information on the accuracy of neutron area survey instruments, and their potential for misuse.
The response as a function of energy of these instruments has recently been characterized in another NMS project, which generated the most comprehensive response datasets yet available for the main instruments used in the UK (Bartlett et al, 2002). These datasets need to be validated by measurement and tested for sensitivity to a range of parameters, to evaluate their accuracy and the intrinsic variability from instrument to instrument, and model to model. The NM2 needs to have its calibration for radionuclide sources determined, because no data were available to the earlier project for measurements made at a National Standards Laboratory using the current or recent models.
In the earlier NMS project, the results showed a significant variation with angle of incidence. This variation was particularly strong for irradiation thorough the electronics,
* Rotational isotropy is defined with respect to an axis, which in radiation protection situations most commonly means a vertical axis. All particles are then travelling perpendicular to this axis: i.e. horizontally. The field is also independent of position but has equal components coming from all directions within the horizontal plane. This rather artificial field is sometimes a good approximation of the situation in the workplace since commonly the sources are numerous and/or extended and in the same horizontal plane as the worker. Then, if the worker moves the field may assume approximate rotational isotropy. † Spherical isotropy refers to a field for which the fluence is entirely independent of direction and position. In highly scattered radiation fields this may be a good approximation of the thermalized component in particular. When there is a strong residual fast neutron peak, this geometry is less likely to be applicable.
INTRODUCTION
7
the direction for which the calculations are inevitably least reliable. These aspects of the calculations need to be more fully investigated using measurements and more detailed calculations. This will enable the maximum bias caused by the direction dependence to be assessed.
10-3 10-2 10-1 100 101 102 103 104 105 106 107
Neutron energy (eV)
1
10
100
Qua
ntity
/ Φ (p
Sv
cm2 )
0.1
0.2
0.30.4
0.60.81.0
1.52.0
E/H
*(10
)
EAP/H*(10)
EPA/H*(10)
ELLAT/H*(10)
ERLAT/H*(10)
EAP/Φ
EPA/ΦELLAT/Φ
ERLAT/Φ
H*(10)/Φ
FIGURE 4 H*(10) compared to effective dose for antero-posterior (AP), postero-anterior (PA), left lateral (LLAT) and right lateral RLAT irradiation
Survey instruments are designed to have an isotropic response and are expected to measure an isotropic dose equivalent quantity, H*(10). The calculated response data for energy and angle of incidence need be used to determine the response of the instruments to rotationally or fully isotropic fields, which will allow the impact of the angle dependence of response in highly scattered fields to be assessed.
Neutron survey instruments are commonly used in a manner that perturbs the field. Commonly this is because the instrument is hand held, or even worn on a shoulder strap. In such cases the person will provide a combination of shielding and scatter, which will influence the reading on the instrument. In other cases the instrument is used at an inappropriate height, perhaps even placed on the floor. The influence on the response of the floor composition and height above the floor needs to be investigated.

PRACTICAL IMPLICATIONS OF NEUTRON SURVEY INSTRUMENT PERFORMANCE
8
10-3 10-2 10-1 100 101 102 103 104 105 106 107
En (eV)
1
10
100
Qua
ntity
/ Φ (p
Sv
cm2 )
0.1
0.2
0.30.4
0.60.81.0
1.52.0
E/H
*(10
)
EAP/H*(10)
EROT/H*(10)
EISO/H*(10)
EAP/ΦEROT/Φ
EISO/ΦH*(10)/Φ
FIGURE 5 H*(10) compared to effective dose for antero-posterior (AP), spherical isotropic (ISO) and rotational isotropy (ROT)
1.4 Aims
The project aimed to enhance understanding of the behaviour of neutron area survey instruments in the following ways:
a Investigation of the instrument-to-instrument variability in response measurements that was observed previously using Monte Carlo computer simulations. These calculations focus on the influence of the electronics on the response and the sensitivity of the response to the natural variations in the manufacture of the instruments.
b Determination of the response of the current models of the instruments to radionuclide source fields and some monoenergetic neutrons at the National Physical Laboratory.
c Investigation of the influence of the mode of use via Monte Carlo calculations. This includes modelling of the influence of the user and the floor on the instrument reading.
d Assessment of the impact of the new response functions and the mode of use data by using a large selection of workplace field fluence-energy distributions.

MODELLING RESULTS AND MEASUREMENTS
9
2 MODELLING RESULTS AND MEASUREMENTS
2.1 Definitions
2.1.1 Angles of incidence Throughout this report, the angle of incidence is defined by two angles, θ and φ. Where the two angles are specified together, they will be referred to as (θ, φ). For irradiation with point sources, the distance becomes relevant, so (r, θ, φ) will be used, where r is the distance from the source to the effective centre of the instrument. Because of convention and convenience, conventional spherical polar co-ordinates have not been used. Here 0° for both θ and φ coincide with irradiation from the end of the instrument opposite the electronics:
a θ = angle of incidence in the horizontal plane (Figure 6). The reference direction, θ = 0° along the axis of symmetry of the cylindrical moderator, from the end opposite the electronics. For such instruments θ R = 90° is the reference or calibration direction. θ R = 0° for devices with spherical symmetry is also from the end opposite the electronics. For such instruments, 0° is the reference or calibration direction.
b φ = angle of incidence in the vertical plane through the axis of symmetry (Figure 6). Irradiation from above corresponds to θ = 90° and from below to 270°.
FIGURE 6 Definition of the angles. θ is illustrated on the left and φ on the right. The reference direction for the NM2 and Studsvik 2202D is θ R = 90° whereas that for the Leake is θ R = 0°.
PRACTICAL IMPLICATIONS OF NEUTRON SURVEY INSTRUMENT PERFORMANCE
10
Reflectional symmetry about the 0°-180° axis in the horizontal plane may be assumed for any of the calculations and measurements apart from those where a user is to be modelled in the mode of use. In some situations 90° is not equivalent to 270°, but otherwise the models and instruments have almost complete left-right symmetry in this respect.
This convention may not be entirely consistent for cylindrical instruments, which may be used with their axis of symmetry positioned vertically. This is more applicable to the NM2 than the Studsvik, since it is designed so that it can be conveniently used in either orientation. Similarly, the default orientation for the WENDI (Olsher et al, 2000) is such that its axis of symmetry is vertical.
2.1.2 Effective centre Most calculations performed in this work use monoenergetic plane-parallel beams in a vacuum. These are the appropriate fields for determining the response to neutrons of a given energy and direction so that the folding with workplace fields can be performed. Radionuclide source or accelerator generated fields, however, generally approximate to point sources. True calibrations are also performed in air with its associated in and out scatter, in calibration rooms with additional various sources of scatter.
The point source nature of calibration fields means that the beam will be divergent at the calibration position. It therefore becomes important to know the exact position at which the instrument is measuring the field. This can be thought of as the position at which the instrument behaves as a point detector and is known as the effective centre. For spherical devices the effective centre is the same as the geometric centre (Axton, 1972), and for a cylindrical device at 90° incidence the effective centre can be taken as being on the cylindrical axis (ISO, 2000). However, for other angles of incidence with cylindrical instruments the position of the effective centre is not obvious. Consequently, it is necessary for the effective centre of the instrument to be determined so that the appropriate fluence can be used in determining the response from a point source calibration. In practice this involves making measurements or calculations at a range of distances so that the position of the effective centre can be calculated and hence corrected for.
2.2 Leake
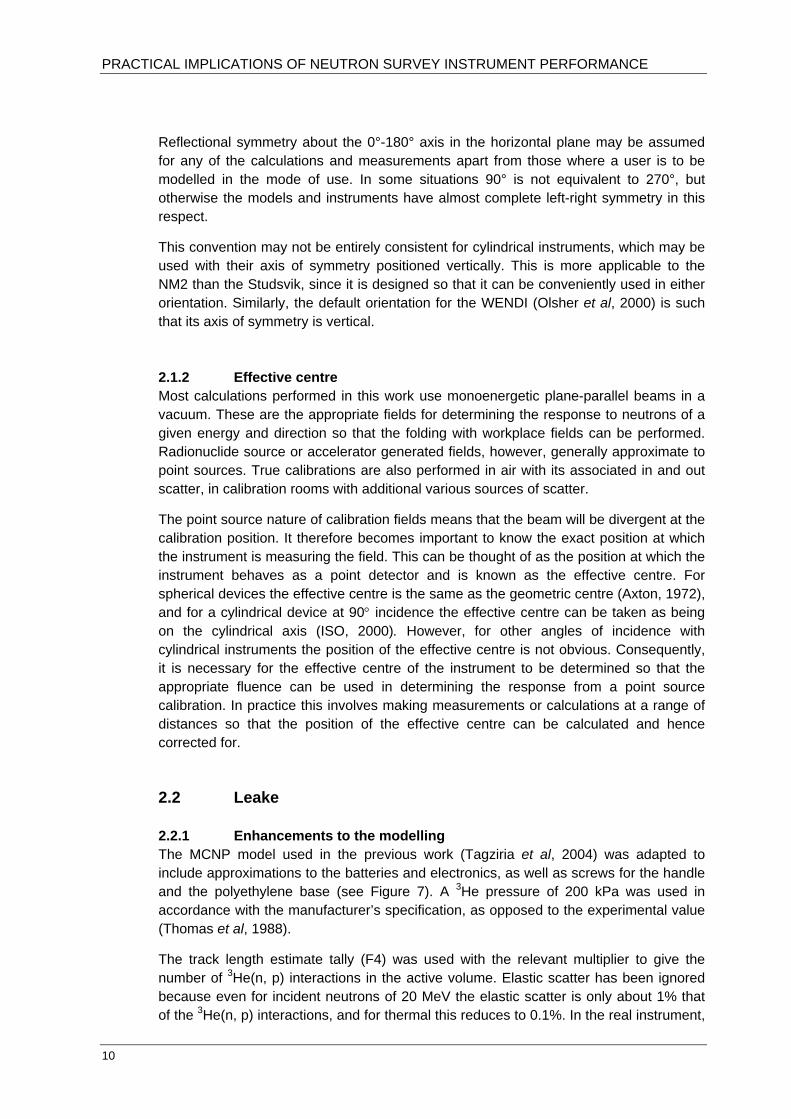
2.2.1 Enhancements to the modelling The MCNP model used in the previous work (Tagziria et al, 2004) was adapted to include approximations to the batteries and electronics, as well as screws for the handle and the polyethylene base (see Figure 7). A 3He pressure of 200 kPa was used in accordance with the manufacturer’s specification, as opposed to the experimental value (Thomas et al, 1988).
The track length estimate tally (F4) was used with the relevant multiplier to give the number of 3He(n, p) interactions in the active volume. Elastic scatter has been ignored because even for incident neutrons of 20 MeV the elastic scatter is only about 1% that of the 3He(n, p) interactions, and for thermal this reduces to 0.1%. In the real instrument,

MODELLING RESULTS AND MEASUREMENTS
11
the contribution of elastic scatter to the count rate would be further reduced by the internal discriminator. The weight window generator of MCNP was used to improve the convergence of the tallies.
FIGURE 7 The MCNP model of Leake 0949 sliced through its axis of symmetry.
2.2.2 Angle and model dependence of response The Leake design (Leake, 1965; Leake, 1968) is one of the most commonly used in the UK. It accounted for 57% of the instruments in use in a recent survey (Bartlett et al, 2002). One aspect of this instrument that is of interest to this study is the range of models that have been produced using this design, the variations being largely connected to the type and positioning of the electronics.
Three examples of this instrument are shown in Figure 8, the Harwell 0949 and the Nuclear Enterprises Mk7NRM, plus the John Caunt Scientific NMS017, the only version that is currently being marketed. Each of these has the same moderator, Centronic Ltd SP9 central detector and perforated cadmium layer located within the polyethylene moderator.
The differences between the instruments are primarily associated with the electronics. One version, the Mk7NRM, has significantly bulkier electronics since it was specifically designed to be more robust for use in the Royal Navy. Its orientation is, however, the same as that of the 0949. The NMS017 differs from the other two in one significant respect: the display is orientated so that the user can read the display during a survey with the electronics held closer to the body than the moderating ball. This is significant

PRACTICAL IMPLICATIONS OF NEUTRON SURVEY INSTRUMENT PERFORMANCE
12
because the reference direction would then be pointing towards the user’s perception of the primary direction of the neutron field. In the other two instruments the reference direction would probably be pointing in the opposite direction, ie antiparallel to the primary direction of the field, so the user would attenuate neutrons incident from the reference direction. At the same time, the electronics would attenuate neutrons incident from the primary direction of the radiation field. In practice, the user should be aware of this problem so measurements may be made with the instrument supported on a light stand and not hand held. Alternatively, it could be held so that the perceived primary direction of the radiation field is from the left or right.
FIGURE 8 Three models of the Leake design: Harwell 0949 (left), Nuclear Enterprises Mk7NRM (centre) and John Caunt NMS017 (right). The 0949 and Mk7NRM would naturally be held with the electronics away from the body and the NMS017 with the electronics towards the body. Calibration of each instrument would be performed from the end opposite the electronics.
Missing from Figure 8 is an alternative orientation of this design: the Harwell Instruments N91 or N91R. In that design, the electronics were placed on top of the instrument so that the normal mode of use would involve the reference direction being at effectively 90° rather than 0°. That instrument is no longer marketed, and accounted for only 12% of the instruments of this type according to the earlier survey. It is hence not explicitly included in this study although the implications of its use can be approximated by substituting 90° for 0° as the reference direction.
A recent development of this design is not yet commercially available, but the changes to its construction are more significant than any other single development since the 1960’s (Leake et al, 2004), although they are similar to changes made, but not commercialized about ten years earlier (Tan et al, 1996). These primarily involve replacing the perforated cadmium layer with a perforated boron-loaded rubber layer. This has a significant effect on the response because the cadmium has a very strong attenuating effect on the thermal component of the field at that depth in the moderator, but little effect on intermediate neutrons. It is for intermediate neutrons that the instrument has a significant over-response so the use of boron is preferable. Additionally, the instrument now uses denser polyethylene and the optimization has

MODELLING RESULTS AND MEASUREMENTS
13
been performed using MCNP-4C so it has been possible to reduce the overestimate to intermediate energy neutrons. This new design is not included in this study.
2.2.3 Comparison between calculations and measurements 2.2.3.1 Radionuclide source and monoenergetic measurements The MCNP model of the Leake design developed for the previous work and enhanced for this work is based on an 0949 instrument. The first stage of validating the model involved the use of a 252Cf source to determine the response at 15° intervals in the horizontal plane (θ). The results (Figure 9) show that the MCNP calculations and the measurements made using an 0949 never differ by more than 5%, after normalization to the response at 0°. The normalization is required to account for the detector efficiency, which has not been modelled.
FIGURE 9 Measured response to 252Cf neutrons for three designs of the Leake instrument and the MCNP modelling results for the 0949. Results are given for angles in the horizontal plane (θ) from 0° to 180°. Left-right symmetry (ie 90° = 270°) may be assumed for this instrument.
The comparison between the 0949 and NMS017 (Figure 9) shows that there is no statistically significant difference except for 180°. However, the Mk7NRM when irradiated through the electronics has a significantly lower response than either of the other instruments, which is unsurprising given the bulky nature of its electronics. All of the instruments, however, underestimate when irradiated through the electronics.

PRACTICAL IMPLICATIONS OF NEUTRON SURVEY INSTRUMENT PERFORMANCE
14
Irradiations using a 252Cf source performed in the vertical plane at 45° intervals again show good agreement between experiment and calculation (Figure 10). Again, the only area of disagreement is for irradiation through the electronics, which is unsurprising given the difficulty in accurately describing the geometry and materials that are involved in the construction of the electronics.
Overall, these experimental data do offer good validation of the MCNP model, even though there is the small discrepancy for irradiation through the electronics. This will not have a significant impact for the response for workplace fields, unless the primary direction of the radiation field is from the electronics. That orientation could, however, easily be envisaged for the 0949, 0075 and Mk7NRM models of this instrument when used for a hand held survey. If so, then the hard component of the neutron field may be subject to a greater under-response than the calculations predict. For that component of the field the error in the predicted response may be as much as 5%.
FIGURE 10 Measured responses to 252Cf neutrons for three designs of the Leake instrument and the MCNP modelling results for the 0949. Results are given for angles in the vertical plane (φ) from 0° to 360°. Note 0° = 360°.
2.2.3.2 Instrument to instrument response variations A test jig is available for checking and, if necessary, adjusting the response of the Leake detector. It is designed to accommodate a 1 curie 241Am-Be neutron source in an X3 capsule in one of two positions. The base of the detector locates in a ring with a holder for the foot under the box for the electronics. The source and detector geometry is therefore fixed and reproducible.
MODELLING RESULTS AND MEASUREMENTS
15
The “Technical Specification and User Guide” for the 0949 gives values for the indicated dose rate for both source positions in terms of the total emission rate of the source. Using the conversion factor recommended for the device to convert from count rate to dose rate, it is possible to derive a value for the expected count rate from the emission rate of the source used.
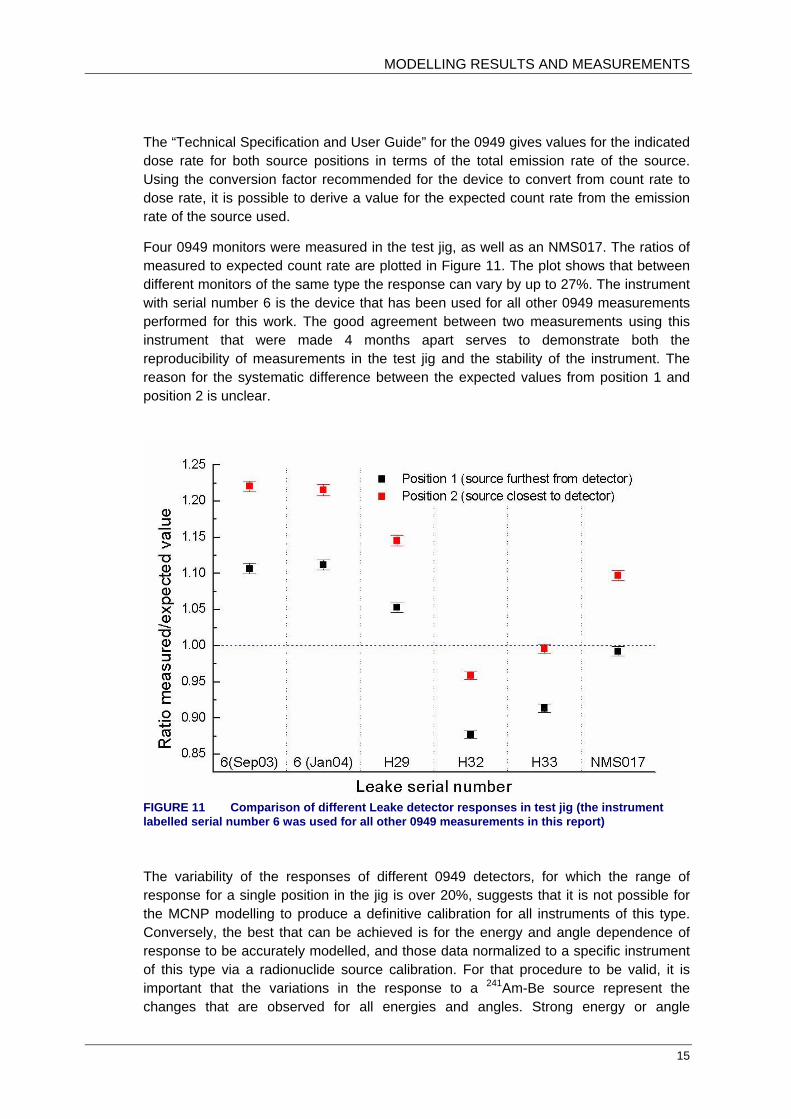
Four 0949 monitors were measured in the test jig, as well as an NMS017. The ratios of measured to expected count rate are plotted in Figure 11. The plot shows that between different monitors of the same type the response can vary by up to 27%. The instrument with serial number 6 is the device that has been used for all other 0949 measurements performed for this work. The good agreement between two measurements using this instrument that were made 4 months apart serves to demonstrate both the reproducibility of measurements in the test jig and the stability of the instrument. The reason for the systematic difference between the expected values from position 1 and position 2 is unclear.
FIGURE 11 Comparison of different Leake detector responses in test jig (the instrument labelled serial number 6 was used for all other 0949 measurements in this report)
The variability of the responses of different 0949 detectors, for which the range of response for a single position in the jig is over 20%, suggests that it is not possible for the MCNP modelling to produce a definitive calibration for all instruments of this type. Conversely, the best that can be achieved is for the energy and angle dependence of response to be accurately modelled, and those data normalized to a specific instrument of this type via a radionuclide source calibration. For that procedure to be valid, it is important that the variations in the response to a 241Am-Be source represent the changes that are observed for all energies and angles. Strong energy or angle

PRACTICAL IMPLICATIONS OF NEUTRON SURVEY INSTRUMENT PERFORMANCE
16
dependence of the instrument-to-instrument variations would make it very difficult to characterize the performance of instruments of a given type in workplace fields.
2.2.3.3 Calibration settings of the 0949 Leake counter The optimum calibration response of the Leake 0949 and other models has been specified (Leake, 1980; Leake, 1999) as 6 counts s-1 = 25 μSv h-1. This is equivalent to a response of one count = 1157 pSv or 0.864 nSv-1. This value is not the response to a pure radionuclide source, but is intended to give the best performance in the workplace. For irradiation with a 252Cf source, this means that the instrument would give a reading that is 0.85 times the reference value of H*(10) (Leake, 2002).
Calibration of the Leake devices is not straightforward, because the measured data show significant variation (Table 1). The measured results for a 252Cf source ranging from 0.246 cm2 to 0.308 cm2 and those for 241Am-Be from 0.223 cm2 to 0.281 cm2. The small statistical uncertainties on the individual measurements imply that these results are showing true instrument-to-instrument variation. However, the ratios of the responses to the two sources show very little variability. The MCNP results for the response are lower than the measurements in general, although there are two measurements for each source that are lower than the calculations. The MCNP results have a ratio for the responses to the two sources that is entirely consistent with the measured data.
The variability of the response measurements going back to 1979 and the variations seen in the calibration jig (Figure 11) indicate that the instrument settings may be different. This may be because they were set up differently or because the electronics have drifted with time. However, the consistency of multiple measurements for the same instrument indicate that the spread is genuine and not a measurement artefact.
The MCNP calculations assume that all 3He(n, p) events in the SP9 counter are detected and that the gas pressure is 200 kPa. The data from these calculations for irradiation with a 252Cf source show very close agreement with the measurements performed for this project (Table 1). The evidence from previous measurements is that the gas pressure tends to be a little lower (Thomas et al, 1994): on average the thermal neutron response of an SP9 counter was found to be about 2.65 cm2 corresponding to a pressure of roughly 191 kPa. The measured values varied from 2.53 to 2.74 cm2, a range of roughly 8.3% in the thermal neutron response. This corresponds to a range of about 11.1% in the gas pressure and 5.5% in the response of a Leake-type instrument, i.e. of the order of ±2.7% around the mean (Thomas et al, 1994).
Although the average measured pressure is roughly 5% lower than that used in the calculations, the effect on the response of a Leake counter will be less than 5%; because the SP9 counter has a high efficiency for thermal neutron capture and its efficiency therefore does not change linearly with pressure. A 5% change in the gas pressure will correspond to a change of about 2.5% in the response of a device consisting of an SP9 counter surrounded by an 8" polyethylene sphere, roughly the diameter of the Leake counter (Thomas, 1992). One might therefore expect the measurement to be perhaps 2.5% lower than the calculation, although this would depend on the filling of the specific SP9 counter.

MODELLING RESULTS AND MEASUREMENTS
17
Whilst the gas pressure variation seen in SP9 counters indicates a range of roughly 5.5% in the Leake counter response, that measured for this counter is much larger, of the order of 25% (Figure 11 and Table 1). It would thus appear that effects other than different gas fillings have influenced the response of the range of Leake type instruments. Principal amongst these is the discriminator setting. In earlier models of this instrument is it likely that the discriminator for the SP9 detector was set at about 350 keV, so that pulses from gamma rays could be rejected (Leake, 1968; Harrison, 1979). This would result in an 11% reduction in the response compared to that for a discriminator set just below 191 keV, which is the lower limit for energy deposition in the counter following a 3He(n, p) reaction: i.e. a discriminator set just below 191 keV would result in all 3He(n, p) reactions being counted. The most recent paper by Leake (Leake et al, 2004), however, outlines the history of how the discriminator has been set on the commercial instruments over the years. Although the precise setting for any particular instrument is not clear, it seems the procedure of setting the discriminator at 350 keV has been replaced by setting it below 191 keV.
TABLE 1 252Cf and 241Am-Be measurement results for Leake type devices and the MCNP calculations of response to those sources. All data are for irradiation from the reference direction (0°).
252Cf 241Am-Be Ratio
Reference Model RΦ, Cf (cm2) RΦ, Am (cm2) RΦ, Cf/RΦ, Am MCNP: (n, p) only 0949 0.298 (0.003)b 0.270 (0.003)b 1.105 (0.02)b
MCNP: (n, p) & elastic 0949 0.300 (0.003)b 0.272 (0.003)b 1.103 (0.02)b
Measured: this work 0949 0.296 (0.003)b - -
Measured: this worka 0949 0.301 (0.003)b - -
Measured: this work 0949 0.293 (0.004)b - -
Measured: this work 0949 0.300 (0.004)b - -
Lewis, 2003 Mk7 NRM 0.246 (0.005)c 0.223 (0.004)c 1.10 (0.01)b
Lewis, 2000 0949 0.290 (0.007)c 0.262 (0.006)c 1.11 (0.02)b
Lewis, 1998 0949 0.308 (0.004)c 0.273 (0.004)c 1.13 (0.01)b
Harrison, 1979 95/0075 0.297 (0.004)b - -
Taylor, 2001 N91 0.291 (0.006)c - -
Taylor, 2001 Mk7 NRM - 0.279 (0.015)c -
Taylor, 2001 Mk7 NRM - 0.271 (0.015)c -
Taylor, 2001 Mk7 NRM - 0.281 (0.015)c -
Alberts et al, 1979 95/0075 0.306 (0.015)b 0.276 (0.014)b 1.11 (0.08)b
Alberts et al, 1979 95/0075 0.266 (0.013)b 0.252 ( 0.013)b 1.06 (0.08)b
a Measurement made in the vertical plane of the source
b Type A uncertainty, coverage factor 1
c Type A uncertainty, coverage factor 2
2.2.3.4 Monoenergetic and thermal neutron measurements Whilst the tests with a bare 252Cf source do offer a good validation of the model for the fast neutron component of the field, which is generally responsible for most of the dose

PRACTICAL IMPLICATIONS OF NEUTRON SURVEY INSTRUMENT PERFORMANCE
18
equivalent, the model also needs to be validated for other neutron energies. This was done using 565 keV and 144 keV neutrons for 45° intervals in the horizontal plane and also with thermal neutrons incident at 0°, 90° and 180° (Figures 12 and 13).
The results for 144 keV and 565 keV show very good agreement for all angles (Figure 12), even through the electronics (180°). The agreement for thermal neutrons is less good (Figure 13), with there being significant discrepancies for both 0° and 180°, although these discrepancies are in one case an overestimate and the other an underestimate. Of particular concern is the 0° irradiation, since this shows the largest discrepancy (50%), but the geometry is not difficult to describe from that direction. In this case the measurement is 50% higher than the calculation. For irradiation from 180°, the measurement is about a third lower than the calculation.
FIGURE 12 Measured responses to 144 and 565 keV neutrons and unnormalized MCNP results for the 0949 for angles in the horizontal plane (θ) from 0° to 180°
These are significant differences for thermal neutrons. However, the measurements are complex, with the instrument perturbing the field, fast neutron contamination needing to be subtracted, and the field not being unidirectional. The good agreement between measurement and calculation for other energies may support there being some greater difficulty in gaining an accurate thermal neutron measurement than there is in calculating the thermal neutron response. However, thermal neutrons can have their penetration strongly affected by small gaps along which they can channel. These could be caused by errors in the construction of the instrument or in the Monte Carlo model. The source of the differences remains unresolved.

MODELLING RESULTS AND MEASUREMENTS
19
2.2.3.5 Comparison with response measurements for other energies Comparison of the unnormalized MCNP fluence response data with measurements made using fields other than radionuclide sources shows considerable scatter around the calculated values (Figure 14). There does not appear to be any systematic deviation in the range from 1 keV to 2 MeV, but for energies above this range and thermal neutrons the measured responses are higher than the calculations. Individual measurements deviate significantly from the trend of both the calculations and the measurements.
FIGURE 13 Measured response to thermal neutrons for the 0949 and NMS017 and unnormalized MCNP results for the 0949 for angles for θ = 0° - 180°
The scatter in the measured results may be caused by either changes to the instrument design or intrinsic instrument-to-instrument variation in the magnitude of the response. The measurements span a seventeen-year period, the most recent being from 1985 so they cover a period in which significant changes were made to the electronics and batteries. To eliminate these effects as far as possible, the measured data have been normalized to give the same response to a 252Cf source as those obtained from the MCNP calculations (Figure 15). Where no 252Cf irradiation was performed, a monoenergetic response measurement in the 1-3 MeV energy range was selected for the normalization instead. Consequently, the normalized data should show improved agreement for that energy range, which they do, and systematic differences outside that energy range should be more easily detected. However, there remains substantial scatter, although the agreement for thermal neutrons is improved.

PRACTICAL IMPLICATIONS OF NEUTRON SURVEY INSTRUMENT PERFORMANCE
20
Some measured response values that lie far from the calculated response may result from questionable measurements. This is particularly true for measurements at energies where other measurements agree closely with the MCNP results. For the highest energies, the difference appears systematic. This could result either from deficiencies in the calculations, which could be caused by problems with the tallying or cross-sections, or from problems with lower energy contamination of the neutron field. If the response due to that component of the field has not been properly eliminated, it will impact significantly on the measured response because the fluence response is higher for the lower energy contamination that it is for the intended calibration energy. Whilst these differences require further investigation, the response for high energies will not have a significant effect on the results of folding the response with workplace fields: the fields that are included in this study contain only a small fraction of dose equivalent from energies greater than a few MeV.
10-2 10-1 100 101 102 103 104 105 106 107
En (eV)
0.005
0.01
0.05
0.1
0.5
RΦ
(cm
2 )
Leake, 1968
Hunt et al, 1985
Hunt et al, 1980
Harrison et al, 1978
Douglas & Marshall, 1974
Alberts et al, 1979
Cosack & Lesiecki, 1981
Alberts and Lesiecki, 1982
Alberts and Schwartz, 1985
Thompson, 1982
FIGURE 14 Unnormalized MCNP results for the 0949 compared to response measurements for other energies
2.2.4 Full energy and angle dependence of response Detailed energy and angle dependence of response data are required for the response to a rotationally isotropic field to be determined. That response is required for the determination of the spectrum averaged response in the workplace fields because that is to be one of the three main geometries considered. Relatively fine angular increments

MODELLING RESULTS AND MEASUREMENTS
21
are required for this calculation, for which it is not possible to define a source to do the simulation in one step in MCNP.
Plane parallel beams of monoenergetic neutrons in a vacuum were modelled for 30° angular increments between 0° and 180° in the horizontal plane, the cross-sectional area of each beam being large enough to irradiate the whole instrument. Left-right symmetry can be assumed, so there was no need for the modelling to use angles from 180° to 360°. The model was orientated horizontally, so these data (Figure 16) are most applicable to models such as the Mk7/NRM, 0075, 0949 and NMS017, which would naturally be used in that orientation. Care should be taken when applying them to the N91 and N91R because those instruments have a vertical axis of symmetry.
10-2 10-1 100 101 102 103 104 105 106 107
En (eV)
0.005
0.01
0.05
0.1
0.5
RΦ
(cm
2 )
Leake, 1968
Hunt et al, 1985
Hunt et al, 1980
Harrison et al, 1978
Douglas & Marshall, 1974
Alberts et al, 1979
Cosack & Lesiecki, 1981
Alberts & Lesiecki, 1982
Alberts & Schwartz, 1985
Thompson, 1982
FIGURE 15 Unnormalized MCNP results for the 0949 compared to response measurements for other energies. The measured data have been normalized to the calculations using the response to a bare 252Cf source where possible. Where no 252Cf measurement was made, the nearest appropriate energy has been used.
The response data (Figure 16 and Appendix B) show that the electronics and batteries most significantly perturb the response. For low energies, the response from 150° and 180° is the highest, because the shielding provided is not very effective for thermal neutrons, whereas at high energies those angles have the lowest response because the electronics and batteries provide excessive attenuation. The spherical symmetry of the moderator causes the response, where not perturbed by the electronics, to be relatively insensitive to angle of incidence.

PRACTICAL IMPLICATIONS OF NEUTRON SURVEY INSTRUMENT PERFORMANCE
22
FIGURE 16 Unnormalized fluence response calculated for the 0949 for plane parallel beams from seven different angles in the horizontal plane (θ). Error bars only represent the Monte Carlo statistics (coverage factor = 1).
2.2.5 Response from 0° and for isotropic fields The response data for irradiation from the reference direction are of primary importance, in this case from opposite the electronics (0°), since when used correctly the instrument should be orientated so that the primary direction of the field is from that direction. Calibration of the Leake-type instruments should always be performed from that angle, except for the N91 or N91R, for which the reference direction is 90° because the electronics are on the top. There is, however, relatively little difference between the response from 0° and that from 90° (Figure 16).
Irradiation from 180° may have particular significance for the Mk7/NRM, 0949 and 0075, because the user may naturally hold the instrument so that the primary direction of the radiation field is from that direction. This would not be appropriate use of the instrument, but it must be recognized that it is probable. However, to simplify the analysis in terms of the response of the instrument to workplace fields it is preferable for the response to be calculated for rotational and spherical isotropy. These geometries may be representative of the true situation in the workplace, particularly for situations where there are multiple sources or large amounts of scattering. In such circumstances it may not be possible for the user to orientate the instrument so that the deficiencies of its response characteristics for irradiation through the electronics are irrelevant.
The detailed energy and angle dependence of response can be used to obtain the response to a rotationally isotropic field by averaging. They can also provide the response for spherical isotropy but the preferred method is to use an isotropic source
MODELLING RESULTS AND MEASUREMENTS
23
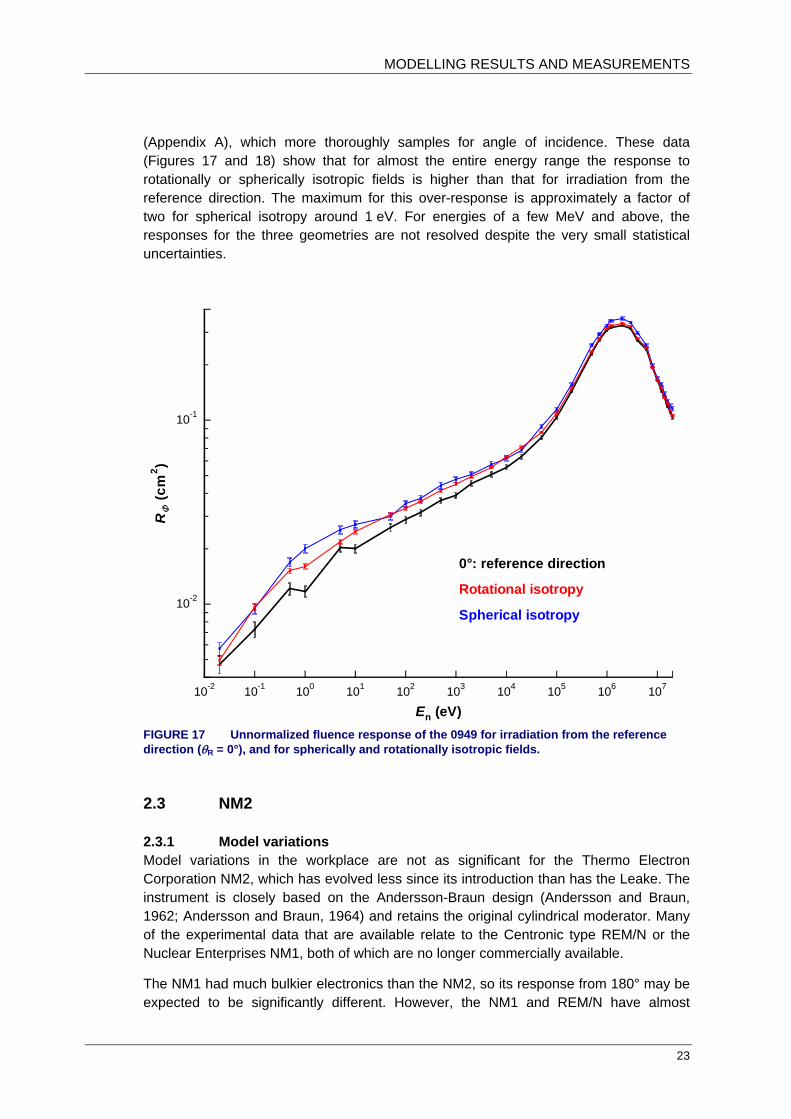
(Appendix A), which more thoroughly samples for angle of incidence. These data (Figures 17 and 18) show that for almost the entire energy range the response to rotationally or spherically isotropic fields is higher than that for irradiation from the reference direction. The maximum for this over-response is approximately a factor of two for spherical isotropy around 1 eV. For energies of a few MeV and above, the responses for the three geometries are not resolved despite the very small statistical uncertainties.
10-2 10-1 100 101 102 103 104 105 106 107
10-2
10-1
RΦ
(cm
2 )
En (eV)
Rotational isotropy
Spherical isotropy
0°: reference direction
FIGURE 17 Unnormalized fluence response of the 0949 for irradiation from the reference direction (θR = 0°), and for spherically and rotationally isotropic fields.
2.3 NM2
2.3.1 Model variations Model variations in the workplace are not as significant for the Thermo Electron Corporation NM2, which has evolved less since its introduction than has the Leake. The instrument is closely based on the Andersson-Braun design (Andersson and Braun, 1962; Andersson and Braun, 1964) and retains the original cylindrical moderator. Many of the experimental data that are available relate to the Centronic type REM/N or the Nuclear Enterprises NM1, both of which are no longer commercially available.
The NM1 had much bulkier electronics than the NM2, so its response from 180° may be expected to be significantly different. However, the NM1 and REM/N have almost

PRACTICAL IMPLICATIONS OF NEUTRON SURVEY INSTRUMENT PERFORMANCE
24
disappeared from the workplace because they are effectively obsolete. Consequently, there was no need for them to be modelled in this project.
10-2 10-1 100 101 102 103 104 105 106 107
En (eV)
0.1
1
10
H*(
10) r
espo
nse
(nS
v-1)
Rotational isotropy
Spherical isotropy
0°: reference direction
FIGURE 18 Unnormalized H*(10) response of the 0949 for irradiation from θR, and for spherically and rotationally isotropic fields.
2.3.2 Changes to the model No changes were made to the geometry used to describe the moderator and central detector of the NM2B model (Figure 19). The main features of the electronics, handles and feet were also not altered.
The main change was the replacement of the old models of the batteries with more realistic versions. The previous model included an accurate representation of a “dry cell”, which used zinc, graphite and ammonium chloride as materials. Those batteries were replaced with Energizer Alkaline (Zn/MnO2) cells, which are much more likely to be used in a modern instrument. The change is not very critical for the NM2, because it has only two D-cells, both of which are located away from the axis of symmetry of the device. They are hence not close to the point where the signals from the BF3 tube are extracted, so their precise description does not affect the response of the instrument significantly.
Because the Studsvik 2202D and most variations of the Leake designs have batteries that shield the point where the signal is extracted from the central detector (180°), they tend to under-respond from that direction, particularly for thermal neutrons. The

MODELLING RESULTS AND MEASUREMENTS
25
accuracy of the description of the batteries and their holder is hence very important for those instruments. The NM2 conversely, over-responds to thermal neutrons from that direction (180°), precisely because the batteries are not providing significant shielding. This is seen in the MCNP model (Figure 19) where the slice through the 180° ↔ 0° axis does not cut any significant features in the electronics.
FIGURE 19 Slice through the MCNP model of the NM2 showing the BF3 detector gas in dark blue, the polyethylene in turquoise, boron loaded neoprene in purple and air in yellow. Note that this slice though cuts no batteries or significant features in the electronics.
2.3.3 Measurements using radionuclide sources An NM2B belonging to HPA (serial no. 443) was used to make measurements in the low scatter area of B47, NPL on 28-29th July 2003 with 252Cf and 241Am-Be sources (Figure 20 and Tables 2-4). The 252Cf emission rate was derived from a fit to manganese bath measurements that allows for the presence of 250Cf. The 241Am-Be emission rate was calculated by decay-correcting the most recent manganese bath measurement and adding on 1.04% to allow for the change in the correction factors (Roberts, 2001). The anisotropy factors can be used to compare the results to those for an isotropic point source in MCNP. For instance, the 252Cf source could be approximated as a point source with an emission rate of 1.579 x 10⁷ s-1. Room and air scatter were corrected for by making measurements with a shadow cone and subtracting that count rate from the count rate without a shadow cone for each angle. Air attenuation was corrected for by using calculated air attenuation coefficients for the 252Cf and 241Am-Be spectra.
The source anisotropy has been included in the calculations of the count rates per source neutron so that the results are equivalent to an isotropic point source in MCNP. As the effective centre of the tube is unknown, the count rates per unit fluence cannot

PRACTICAL IMPLICATIONS OF NEUTRON SURVEY INSTRUMENT PERFORMANCE
26
be interpreted as efficiencies except for the 90° case where the effective centre can be reasonably assumed to be at the midpoint of the tube, along the axis of the cylinder.
The uncertainties quoted (Tables 3 and 4) are for a coverage factor of 1 and are due only to counting statistics. The uncertainties in the emission rate of the source, anisotropy factor, and air attenuation coefficient are correlated for all angles and so can be neglected if the results are normalised to either the 0° or 90° measurement. Uncertainties in detector position and angle, and inherent uncertainties in the shadow cone technique will not be correlated for all angles. When these are included, a more realistic estimate of the uncertainty for each angle might be 2%.
FIGURE 20 Experimental set-up (the source shown is 1 Ci 241Am-Be, 125 cm from the NM2 origin, θ = 135°)
The results for the radionuclide source measurements (Tables 3 and 4) show that the response of the NM2 is highest for irradiation from the reference direction for these hard neutron fields (Figure 21). The response is lowest for irradiation through the electronics, which is also the direction for which the difference between the responses to the two sources is greatest. The results show lower response for 0° and 45° relative to 90° when compared to the equivalent data for the Studsvik 2202D because the NM2 does not have the end of its cylindrical moderator rounded off.
When the results of the experimental measurements are compared to the MCNP-4C calculations there are seen to be statistically significant deviations between the two sets of data (Figure 22). The MCNP calculated data have already been corrected for the systematic difference between the two sets of data, which probably results from the 100% efficiency assumption in the calculations, whereby all 10B(n, α) reactions are

MODELLING RESULTS AND MEASUREMENTS
27
tallied. The average ratio of the measured to calculated response for 252Cf and 241Am-Be (Table 5) is 0.806. This factor, which must be applied to the calculated data to get good agreement with the measurements made for this work, is larger than may be expected, given the energy of the pulses that are obtained from a BF3 tube. The size of this correction may derive from uncertainties in the BF3 pressure or its effective volume. The full angle dependence of response has also been calculated for 252Cf and 241Am-Be sources (Figure 23).
The difference between measurement and calculation is most significant for 0°, although the magnitude of the difference is still only 5%. These results hence validate the model for fast neutrons: the differences that are noted for experimental measurements with different instruments are large compared to the 5% discrepancies between measurement and calculation.
TABLE 2 Details of sources used 252Cf 241Am-Be Identifier 4774NC 1095
Encapsulation Modified X35 X3
Emission rate on day of measurement (s-1) 1.547 107 2.430 106
Anisotropy factor 1.0207 1.0276
TABLE 3 252Cf measurement results
θ x (cm) y (cm) Count rate (s-1) Count per Φ (cm2) Counts per neutron
0° 0.0 148.8 16.43 0.2894 1.040 (0.007)a 10-6
45° 105.9 105.9 17.51 0.3123 1.109 (0.007)a 10-6
90° 149.7 0.0 22.18 0.3955 1.404 (0.008)a 10-6
135° 105.9 -105.9 15.73 0.2805 9.961 (0.062)a 10-7
180° 0.0 -151.1 11.83 0.2150 7.493 (0.075)a 10-7
a Type A uncertainty, coverage factor = 1
TABLE 4 241Am-Be measurement results
θ x (cm) y (cm) Count rate (s-1) Count per Φ (cm2) Counts per neutron
0° 0.0 124.9 3.748 0.2942 1.501 (0.014)a 10-6
90° 124.5 0.0 4.944 0.3857 1.980 (0.019)a 10-6
180° 0.0 -124.6 3.039 0.2374 1.217 (0.015)a 10-6
a Type A uncertainty, coverage factor = 1
2.3.4 Comparison with other measurements 2.3.4.1 Radionuclide sources There are fewer published data for the response of NM2 type instruments for 252Cf or 241Am-Be (Table 5) sources than there are for the Leake or Studsvik designs. Many of the available data are for an earlier model, the Centronic REM/N, the calibration response of which appears to be about 25% lower. This difference may derive from

PRACTICAL IMPLICATIONS OF NEUTRON SURVEY INSTRUMENT PERFORMANCE
28
changes to the BF3 tube since the moderator has not changed. It may hence be inferred that the energy dependence of response is unlikely to have changed as a result of this increase in sensitivity.
The ratio of the responses to the 252Cf and 241Am-Be sources shows good consistency, within the statistical uncertainties. However, the variation in the magnitude of the responses to these sources varies considerably, with the range of values for 252Cf corresponding to ± 25%, which is far greater than the statistical uncertainties on the measurements. This probably derives from differences in the BF3 tube and threshold set in the electronics. It is hence clear that it is not possible to determine the absolute response of this instrument using Monte Carlo methods, because the uncertainties associated with the calculations are smaller than the differences between different instruments of this type.
Results from only one previous angle dependence of response measurement with a radionuclide source are available for comparison with the calculated data from this work (Hunt, 1988). That measurement with a 252Cf source was performed at NPL and gave a ratio of R(0°) to R(90°) of 0.70 (0.01)*. For these measurements, the ratio is 0.732 (0.007)*. The ratio of R(0°) to R(90°) for the new 241Am-Be measurement is 0.76, but there are no previous results to compare it with.
0 45 90 135 180
Angle (°)
0.2
0.3
0.4
Flu
en
ce r
esp
on
se (
cm2)
252Cf
241Am-Be
FIGURE 21 Variation of counts per unit fluence at the midpoint of the BF3 tube with angle for 241Am-Be and 252Cf measurements
* Type A uncertainty with a coverage factor of 1
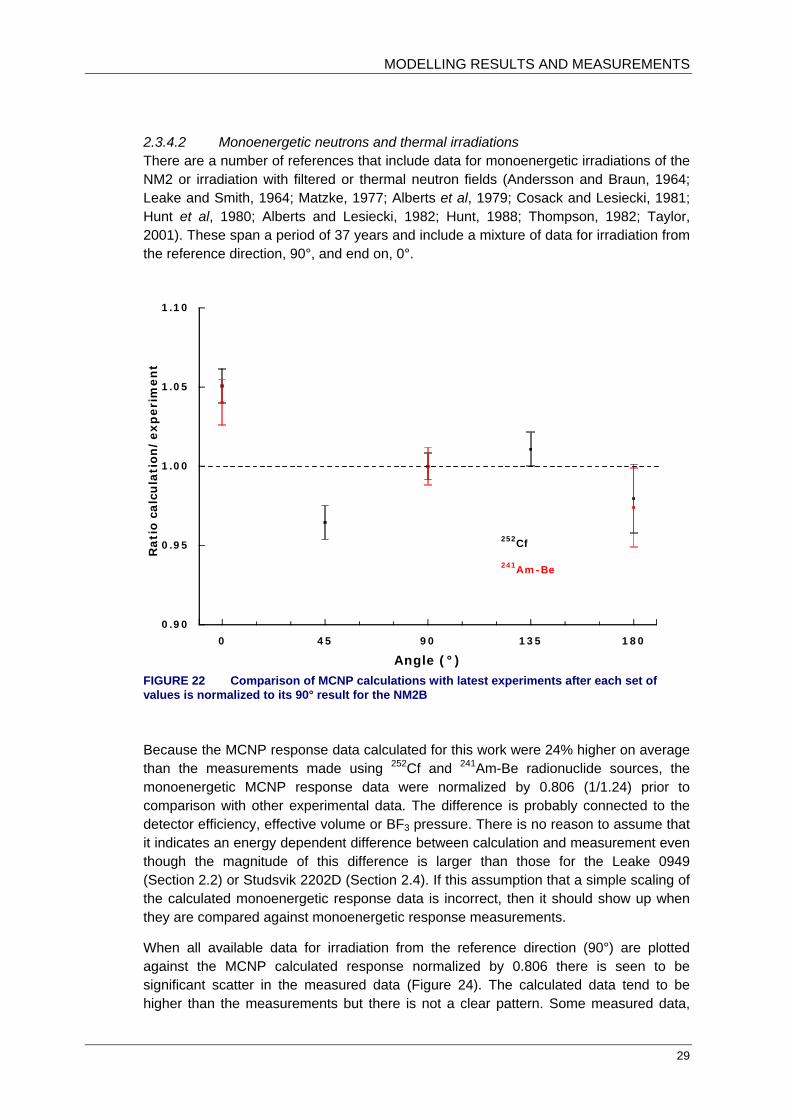
MODELLING RESULTS AND MEASUREMENTS
29
2.3.4.2 Monoenergetic neutrons and thermal irradiations There are a number of references that include data for monoenergetic irradiations of the NM2 or irradiation with filtered or thermal neutron fields (Andersson and Braun, 1964; Leake and Smith, 1964; Matzke, 1977; Alberts et al, 1979; Cosack and Lesiecki, 1981; Hunt et al, 1980; Alberts and Lesiecki, 1982; Hunt, 1988; Thompson, 1982; Taylor, 2001). These span a period of 37 years and include a mixture of data for irradiation from the reference direction, 90°, and end on, 0°.
0 45 90 135 180
Angle (°)
0.90
0.95
1.00
1.05
1.10
Rati
o c
alc
ula
tion
/exp
eri
men
t
252Cf
241Am-Be
FIGURE 22 Comparison of MCNP calculations with latest experiments after each set of values is normalized to its 90° result for the NM2B
Because the MCNP response data calculated for this work were 24% higher on average than the measurements made using 252Cf and 241Am-Be radionuclide sources, the monoenergetic MCNP response data were normalized by 0.806 (1/1.24) prior to comparison with other experimental data. The difference is probably connected to the detector efficiency, effective volume or BF3 pressure. There is no reason to assume that it indicates an energy dependent difference between calculation and measurement even though the magnitude of this difference is larger than those for the Leake 0949 (Section 2.2) or Studsvik 2202D (Section 2.4). If this assumption that a simple scaling of the calculated monoenergetic response data is incorrect, then it should show up when they are compared against monoenergetic response measurements.
When all available data for irradiation from the reference direction (90°) are plotted against the MCNP calculated response normalized by 0.806 there is seen to be significant scatter in the measured data (Figure 24). The calculated data tend to be higher than the measurements but there is not a clear pattern. Some measured data,

PRACTICAL IMPLICATIONS OF NEUTRON SURVEY INSTRUMENT PERFORMANCE
30
particularly for high energies, are significantly higher than the calculations, but otherwise the measurements tend to be lower. The most recent measurements do show very good agreement with the calculated response data, the poorest agreement being for measurements made in the 1960s.
To eliminate instrument-to-instrument variations in the magnitude of the response, the measured data for irradiation from the reference direction have been normalized by the ratio of the 252Cf response measured in the original reference to that measured in this work (Figure 25). The agreement between the calculated and measured response data is then seen to be better, although some of the measured datasets that already gave good agreement (Figure 24) have been omitted because they did not include a 252Cf measurement. It is clear that for the oldest data (Leake and Smith, 1964; Andersson and Braun 1964) the agreement is improved for energies up to around 5 MeV, which perhaps indicates that the central detector efficiency has increased. An exception to this is the 7 keV measurement (Leake and Smith, 1964) which looks unreliable: it is a factor of 2 lower than the calculated data, in an energy range where the more recent measurements show good agreement with the calculations.
0 45 90 135 180
Angle (°)
0.50
0.75
1.00
Norm
alized
resp
on
se
252Cf
241Am-Be
FIGURE 23 MCNP calculations for two radionuclide point sources normalized to its 90° result
For one dataset (Alberts et al, 1979) the agreement is poorer for some energies and better for others after the data have been normalized to account for the response to a 252Cf source. In particular, the 24 keV and 100 keV response measurements from that reference show increased disagreement with other data, because they were already higher than the calculated data and other measurements in the same energy range.
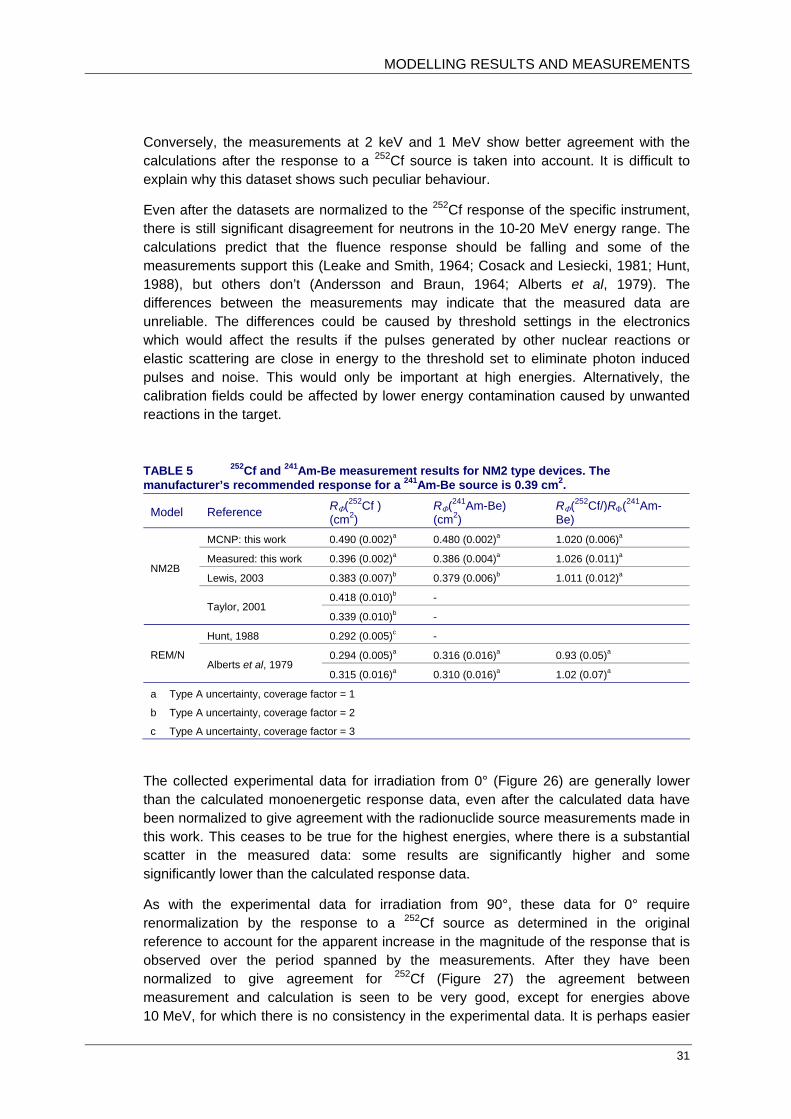
MODELLING RESULTS AND MEASUREMENTS
31
Conversely, the measurements at 2 keV and 1 MeV show better agreement with the calculations after the response to a 252Cf source is taken into account. It is difficult to explain why this dataset shows such peculiar behaviour.
Even after the datasets are normalized to the 252Cf response of the specific instrument, there is still significant disagreement for neutrons in the 10-20 MeV energy range. The calculations predict that the fluence response should be falling and some of the measurements support this (Leake and Smith, 1964; Cosack and Lesiecki, 1981; Hunt, 1988), but others don’t (Andersson and Braun, 1964; Alberts et al, 1979). The differences between the measurements may indicate that the measured data are unreliable. The differences could be caused by threshold settings in the electronics which would affect the results if the pulses generated by other nuclear reactions or elastic scattering are close in energy to the threshold set to eliminate photon induced pulses and noise. This would only be important at high energies. Alternatively, the calibration fields could be affected by lower energy contamination caused by unwanted reactions in the target.
TABLE 5 252Cf and 241Am-Be measurement results for NM2 type devices. The manufacturer’s recommended response for a 241Am-Be source is 0.39 cm2.
Model Reference RΦ(252Cf ) (cm2)
RΦ(241Am-Be) (cm2)
RΦ(252Cf/)RΦ(241Am-Be)
MCNP: this work 0.490 (0.002)a 0.480 (0.002)a 1.020 (0.006)a
Measured: this work 0.396 (0.002)a 0.386 (0.004)a 1.026 (0.011)a
Lewis, 2003 0.383 (0.007)b 0.379 (0.006)b 1.011 (0.012)a
0.418 (0.010)b -
NM2B
Taylor, 2001 0.339 (0.010)b -
Hunt, 1988 0.292 (0.005)c -
0.294 (0.005)a 0.316 (0.016)a 0.93 (0.05)a REM/N Alberts et al, 1979
0.315 (0.016)a 0.310 (0.016)a 1.02 (0.07)a
a Type A uncertainty, coverage factor = 1
b Type A uncertainty, coverage factor = 2
c Type A uncertainty, coverage factor = 3
The collected experimental data for irradiation from 0° (Figure 26) are generally lower than the calculated monoenergetic response data, even after the calculated data have been normalized to give agreement with the radionuclide source measurements made in this work. This ceases to be true for the highest energies, where there is a substantial scatter in the measured data: some results are significantly higher and some significantly lower than the calculated response data.
As with the experimental data for irradiation from 90°, these data for 0° require renormalization by the response to a 252Cf source as determined in the original reference to account for the apparent increase in the magnitude of the response that is observed over the period spanned by the measurements. After they have been normalized to give agreement for 252Cf (Figure 27) the agreement between measurement and calculation is seen to be very good, except for energies above 10 MeV, for which there is no consistency in the experimental data. It is perhaps easier

PRACTICAL IMPLICATIONS OF NEUTRON SURVEY INSTRUMENT PERFORMANCE
32
to simulate the instrument from this direction, because the electronics and asymmetry of the detector have less impact on the response. Additionally, variations in the electronics over the period spanned by the measurements should cause smaller differences between the experimental datasets than it does for irradiation from 90°. It may be anticipated that the agreement between experimental datasets and with calculations will both be better for this angle of incidence. Conversely, if there were monoenergetic measured data for irradiation from 180°, through the electronics, consistency between measurements would probably be poorer as would be the agreement between measurement and calculation.
10-2 10-1 100 101 102 103 104 105 106 107
En (eV)
10-2
10-1
RΦ
(cm
2 )
Matzke, 1977Andersson & Braun, 1964
Cosack & Lesiecki, 1981
Alberts et al, 1979Hunt et al, 1980
Alberts & Lesiecki, 1982Hunt, 1988 (measured 1982)
Leake & Smith, 1964Normalized MCNP 90°
FIGURE 24 Comparison between MCNP calculations and collected measured data for irradiation of the NM2 from 90°. The MCNP-4C response data have been multiplied by 0.806 to give good agreement with the 252Cf and 241Am-Be measurements.
2.3.5 Energy and angle dependence of response To facilitate the calculation of the response for rotationally isotropic fields, the response was calculated for monoenergetic plane parallel beams with energies from 25.3 meV to 20 MeV. Angles of incidence (θ) of 0°, 45°, 90°, 135° and 180° were used with the source area sufficient to ensure that the entire instrument was irradiated for all angles (Figure 28). All the calculations were performed in a vacuum, but cavities within the instrument were filled with air.
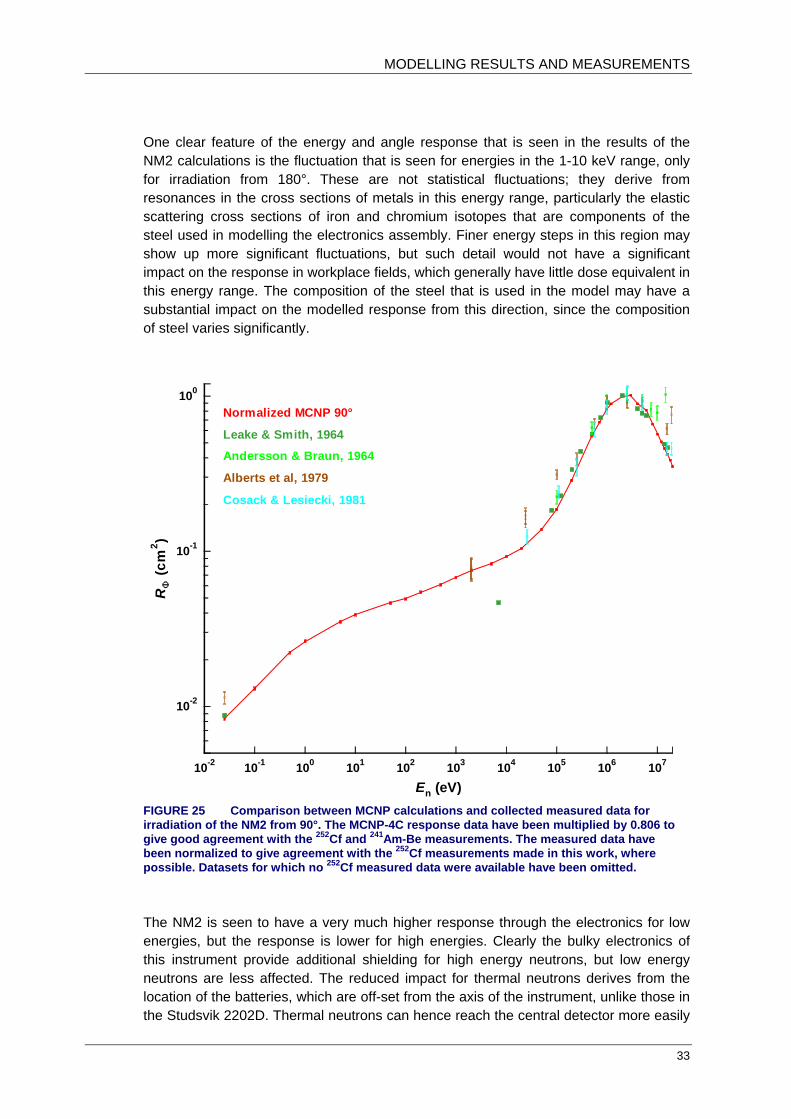
MODELLING RESULTS AND MEASUREMENTS
33
One clear feature of the energy and angle response that is seen in the results of the NM2 calculations is the fluctuation that is seen for energies in the 1-10 keV range, only for irradiation from 180°. These are not statistical fluctuations; they derive from resonances in the cross sections of metals in this energy range, particularly the elastic scattering cross sections of iron and chromium isotopes that are components of the steel used in modelling the electronics assembly. Finer energy steps in this region may show up more significant fluctuations, but such detail would not have a significant impact on the response in workplace fields, which generally have little dose equivalent in this energy range. The composition of the steel that is used in the model may have a substantial impact on the modelled response from this direction, since the composition of steel varies significantly.
10-2 10-1 100 101 102 103 104 105 106 107
En (eV)
10-2
10-1
100
RΦ
(cm
2 )
Andersson & Braun, 1964
Cosack & Lesiecki, 1981
Normalized MCNP 90°
Alberts et al, 1979
Leake & Smith, 1964
FIGURE 25 Comparison between MCNP calculations and collected measured data for irradiation of the NM2 from 90°. The MCNP-4C response data have been multiplied by 0.806 to give good agreement with the 252Cf and 241Am-Be measurements. The measured data have been normalized to give agreement with the 252Cf measurements made in this work, where possible. Datasets for which no 252Cf measured data were available have been omitted.
The NM2 is seen to have a very much higher response through the electronics for low energies, but the response is lower for high energies. Clearly the bulky electronics of this instrument provide additional shielding for high energy neutrons, but low energy neutrons are less affected. The reduced impact for thermal neutrons derives from the location of the batteries, which are off-set from the axis of the instrument, unlike those in the Studsvik 2202D. Thermal neutrons can hence reach the central detector more easily

PRACTICAL IMPLICATIONS OF NEUTRON SURVEY INSTRUMENT PERFORMANCE
34
when incident from this direction because they are less likely to encounter hydrogenous material.
When these same data are normalized to the response from the reference direction, the angle dependence of response is easier to visualize (Figure 29). It is then clear that the response to thermal neutrons incident from 180° is a factor of seven higher than the response from 90°. For 1 MeV neutrons the response for 180° is more than a factor of two lower than that from 90°. Two additional angles are shown: 150° and 165°. These show that the effect of the resonances in the metals on the response of the instrument through the electronics are only significant for a small solid angle.
10-2 10-1 100 101 102 103 104 105 106 107
En (eV)
10-2
10-1
RΦ (
cm2)
Matzke, 1977
Andersson & Braun, 1964
Cosack & Lesiecki, 1981
Normalized MCNP 0°
Alberts et al, 1979
Hunt et al, 1980
Thomson, 1982
FIGURE 26 Comparison between MCNP calculations and collected measured data for irradiation of the NM2 from 0°. The MCNP-4C response data have been multiplied by 0.806 to give good agreement with the 252Cf and 241Am-Be measurements.
The implications of the energy and angle dependence of response are clearer if the H*(10) response is calculated (Figure 30). It is then evident that the high response to thermal neutrons for incidence through the electronics (180°) causes the instrument to over-respond significantly in terms of dose equivalent, but the over-response is still not as large as that for all other angles of incidence in the 1-10 keV energy range. Because most workplace fields have more dose equivalent in the thermal energy region than in the intermediate energy range, the consequences of the over-response through the electronics could be more significant in some cases.
Perhaps of greater significance than the response characteristics in the thermal and intermediate energy ranges, is the angle dependence of response to fast neutrons. The response is a maximum for irradiation from the reference direction (90°), so calibration

MODELLING RESULTS AND MEASUREMENTS
35
of this instrument with a bare radionuclide source from that direction, will tend to produce underestimates of the fast component of the H*(10) of the field.
10-2 10-1 100 101 102 103 104 105 106 107
En (eV)
10-2
10-1
100
RΦ (
cm2)
Andersson & Braun, 1964
Cosack & Lesiecki, 1981
Normalized MCNP 0°
Alberts et al, 1979
Hunt et al, 1980
Thomson, 1982
FIGURE 27 Comparison between MCNP calculations and collected measured data for irradiation of the NM2 from 0°. The MCNP-4C response data have been multiplied by 0.806 to give good agreement with the 252Cf and 241Am-Be measurements. The measured data have been normalized to give agreement with the 252Cf measurements made in this work, where possible. Datasets for which no 252Cf measured data were available have been omitted.
2.3.6 Response to isotropic fields The response to an isotropic field has been calculated using MCNP-4C with an isotropic source generated as an inwardly directed field from a sphere that encompasses the model of the instrument. In the absence of any specified direction distribution for the field this has been demonstrated to be a spherically isotropic field (Appendix A). Consequently, the model has been sampled for all possible angles of incidence, given the assumption that the source has been adequately sampled. The response to an isotropic field (Figure 31 and Appendix B) calculated in this manner is more accurate than that which could be obtained by a solid angle weighted average of the response to plane parallel beams incident for angles in the horizontal plane.
Since an equivalent source cannot be specified in MCNP for rotational isotropy, the response to such a field has had to be constructed from the angle-weighted average of the response from 0°, 45°, 90°, 135° and 180°. The response to a rotationally isotropic field (Figure 31 and Appendix B) is hence that which applies for a measurement made with the axis of the instrument lying in the plane for which the field is rotationally isotropic. For example, if the field has approximate rotational isotropy in the horizontal

PRACTICAL IMPLICATIONS OF NEUTRON SURVEY INSTRUMENT PERFORMANCE
36
plane, this response characteristic would apply for a measurement made with the instrument placed so that its axis is horizontal.
For most measurements where the direction distribution of the field approximates to rotational isotropy, it would actually be preferable for the instrument to be stood on its end. For such a measurement, the response to the field would then approximate to that from the reference direction for all angles in the horizontal plane. This calculated response to a rotationally isotropic field may hence be most appropriate for the NM2 instrument only when it is being inappropriately used. In other circumstances, if components of the field can be approximated as unidirectional, rotational and isotropic (eg the fields in Section 5.7), this may not be an inappropriate orientation for the instrument.
10-2 10-1 100 101 102 103 104 105 106 107
En (eV)
10-2
10-1
0.5
RΦ
(cm
2 )
0°45°90°135°
180°
FIGURE 28 Calculated NM2 fluence response as a function of angle of incidence in the horizontal plane (θ) for plane parallel irradiation in a vacuum. Extra energies have been used for irradiation from 180° to show the effects of the resonances in metals in the electronics
Comparison of the calculated NM2 response for rotationally and spherically isotropic sources, normalized to the response for irradiation from 90° shows that the differences are as large as a factor of more than 2 for thermal neutrons (Figure 32). The maximum difference, for thermal neutrons incident with rotational isotropy, derives from the over-response to thermal neutrons incident through the electronics. The effect on the response to a spherically isotropic field is smaller, because a smaller fraction of the

MODELLING RESULTS AND MEASUREMENTS
37
incident neutrons pass through the electronics. Since isotropic irradiation is commonly a good approximation of the thermal neutron component, this problem is not as serious as may be implied by the response to thermal neutrons incident with rotational symmetry.
At higher energies, the response to a rotationally isotropic field produces an underestimate of up to 30% in the 100 keV to 1 MeV energy range. This is caused by the excessive shielding of fast and intermediate energy neutrons that is provided by the electronics and batteries. Again, the effect is less marked for spherically isotropic incidence, since the electronics don’t perturb the response to such a significant degree. Rotational isotropy is perhaps a more realistic approximation of the geometry of some hard neutron fields.
10-2 10-1 100 101 102 103 104 105 106 107
0.5
1.0
5.0
10.0
R(E
n, θ
)/R(E
n, 9
0°)
En (eV)
0°
45°
135°
180°
165°
150°
FIGURE 29 Calculated NM2 fluence response as a function of angle of incidence in the horizontal plane (θ) for plane parallel irradiation in a vacuum, normalized to irradiation from the reference direction, 90°
Both the response calculated using an isotropic source and that calculated by averaging the results for individual angles are presented. Whilst the two response characteristics are not resolved for the two lowest energies used, for all energies of 0.5 eV and above, the use of an isotropic source produces a lower response. This implies that the shielding provided by the electronics for angles of 135°, 150°, 165° and 180° is not sufficient to represent irradiation on a continuum of angles from 135° to 180°. In turn, this implies

PRACTICAL IMPLICATIONS OF NEUTRON SURVEY INSTRUMENT PERFORMANCE
38
that the result for rotational isotropy may be calculated to be lower for fast neutrons, if more angles of incidence were used for irradiation through the electronics.
Whilst the representation in Figure 32 shows how the response at a specific energy is affected by the angle of incidence of the neutrons, the energy and angle dependence of response compared to a calibration response is more significant (Figure 33). When the ambient dose equivalent response data are plotted for irradiation from the reference direction, rotational isotropy and spherical isotropy, the overestimate to thermal neutrons in a rotational field ceases to look bad. In fact, the “over-response” is seen to correct the under-response to thermal neutrons; the response to thermal neutrons is poorest for irradiation from the reference direction.
10-2 10-1 100 101 102 103 104 105 106 107
En (eV)
10-1
1.0
10
H*(
10) r
espo
nse
(nS
v-1)
0°
45°90°135°180°
FIGURE 30 H*(10) response of the NM2 at five different angles in the horizontal plane (θ). The responses for angles of 150° and 165° were also calculated, but they are omitted from this figure for clarity. They can be seen depicted in a different representation in Figure 29.
At higher energies (Figure 33), the shielding effect of the electronics causes the instrument to under-respond to a rotationally isotropic field, by as much as 40% in the 100-500 keV energy range: it performs better for irradiation from the reference direction and also for spherical isotropy since the solid angle covered by the electronics is greatest for rotational isotropy. Additionally, the good angle dependence of fluence response above 10 MeV (Figure 31) is seen to be an under-response in terms of ambient dose equivalent for all angles of incidence (Figure 33).

MODELLING RESULTS AND MEASUREMENTS
39
10-2 10-1 100 101 102 103 104 105 106 107
En (eV)
10-2
10-1
RΦ
(cm
2 )
Rotational isotropy
Isotropic (mean of angles)
90°: reference direction
Isotropic source
FIGURE 31 Comparison of the calculated NM2 fluence response as a function of energy for irradiation from θR and isotropic sources
2.4 Studsvik 2202D
2.4.1 Modelling enhancements The MCNP model (Figure 34) developed for the earlier study had accurate specification of the main moderator and central detector, but less precision in the electronics. It also had no handle or feet, which should not influence the response greatly, but metal intrusions into the polyethylene moderator can aid penetration by low energy neutrons. Additionally, for higher energies they can contribute some (n, 2n) reactions, but since the feet and handles are made from aluminium, and are so remote from the central detector, this will not be a very significant effect.
The first change made to the geometry was a shift of the geometric centre of the instrument from to the origin. This was simply intended to aid the angle dependence of response calculations and should have no influence on the modelling results. Alterations that are more significant involved small changes to the materials, the specifications of which were sometimes imprecise, and enhancements were made to the geometric description where the signal from the central detector is extracted.
Changes were also made to the polyethylene moderator. The most significant of these was a change in the radius of the cylinder used to define the outer dimensions of the moderator from 10.82 cm to 10.75 cm. This latter figure is the value specified by the manufacturer as the radius of the moderator, whereas the former is the radius measured

PRACTICAL IMPLICATIONS OF NEUTRON SURVEY INSTRUMENT PERFORMANCE
40
for a specific instrument. Whilst the use of dimensions measured from a real instrument do help with the characterization of that instrument, it was decided that a radius of 10.75 cm would better represent all models of this type that are in use. The calculations were also accelerated by including additional surfaces within the polyethylene for variance reduction purposes (Figure 34): these extra surfaces were used to improve the efficiency of the Monte Carlo transport by allowing increased particle splitting.
10-2 10-1 100 101 102 103 104 105 106 107
En (eV)
0.5
1.0
2.0
3.0
R(E
n)/R
(En,
90°
)
Full isotropy (sum of angles)Rotational isotropy
Full isotropic source
FIGURE 32 Comparison of the calculated NM2 response as a function of angle with those for isotropic sources, all normalized to the response for irradiation from 90°
The battery description and that of the battery holder was significantly altered. The previous model had a relatively accurate description of nine Duracell® D-cells with a simple box to hold them. It is this design that is owned by NPL which was used in the irradiations for this study. Consequently, the model retains this configuration and size for the batteries, although the HPA 2202D has a more lightweight arrangement with 9 C-cells oriented in three orthogonal blocks. The existing MCNP model was modified so that it now contains nine Energizer D-cells (Energizer, 2004) encased in a holder made from glass-reinforced nylon, which has small air gaps around each battery. The battery description is as accurate as is reasonable, although the complex shape of the negative steel cover and its nylon seal are not reproduced. The accuracy of the modelling has been verified by checking the total mass of the battery description against the 141.9 g

MODELLING RESULTS AND MEASUREMENTS
41
specified by the manufacturer*. Users of the response data for the Studsvik 2202D should be aware that its characteristics for irradiation through the electronics may be significantly different if their version of the instrument uses nine C-cells. The current version of this instrument, the Studsvik or Wedholm Medical 2222, uses six C-cells so the shielding provided will be significantly reduced compared to the model used in this work.
10-2 10-1 100 101 102 103 104 105 106 107
En (eV)
0.1
1.0
10.0
H*(
10) r
espo
nse
(nS
v-1)
Isotropic
Reference direction: 90°
Rotational isotropy
R(241Am-Be, 90°)
FIGURE 33 Comparison of the calculated NM2 H*(10) response for irradiation from the reference direction with the response to isotropic sources. Also plotted is the calculated response to a 241Am-Be source incident from the reference direction (0.92 nSv-1).
The critical aspect of the battery description is probably its manganese content, since manganese has high neutron cross-sections (Figure 35), notably for radiative capture, which is 13 b for thermal neutrons, and for elastic scattering which reaches 1972 b at 316 eV. The batteries that are modelled are zinc-manganese dioxide, so accurate reproduction of the manganese content will be very important for irradiation from 180°.
Once the electronics and battery descriptions had been enhanced, the materials had been more accurately described and additional surfaces had been introduced to aid variance reduction, the problem was found to exceed the maximum dynamically allocated storage limit (MDAS). To get around this problem the material specifications * http://data.energizer.com/

PRACTICAL IMPLICATIONS OF NEUTRON SURVEY INSTRUMENT PERFORMANCE
42
were simplified in a manner that should not affect the accuracy of the modelling. These simplifications were:
a Chromium was specified as the natural material instead of a combination of 50Cr, 52Cr, 53Cr, and 54Cr, thereby reducing the dynamically allocated storage requirement for this element by a factor of four.
b Iron was specified as the natural material instead of a combination of 54Fe, 56Fe, 57Fe, and 58Fe, thereby reducing the dynamically allocated storage requirement for this element by a factor of four.
c Nickel was specified as the natural material instead of a combination of 58Ni, 60Ni, 61Ni, 62Ni and 64Ni, thereby reducing the dynamically allocated storage requirement for this element by a factor of five.
d Copper was specified as the natural material instead of a combination of 63Cu and 65Cu, thereby reducing the dynamically allocated storage requirement for this element by a factor of two.
FIGURE 34 Slice through the 2202D model in the vertical plane along the axis of symmetry: CH2 = mauve; BF3 gas =dark blue; air = bright yellow; boron-loaded neoprene = orange; aluminium = lime green; steel = pale blue. Three of the nine D-cells (LR20) are seen on the right. The arrow coming from the left represents the location of the effective centre (Table 7) for irradiation from that direction (0°). The upper right arrow represents the effective centre (252Cf) for the instrument as drawn, with nine D-cells, from 180°. The lower right arrow represents the effective centre of an instrument with nine C-cells (LR14).
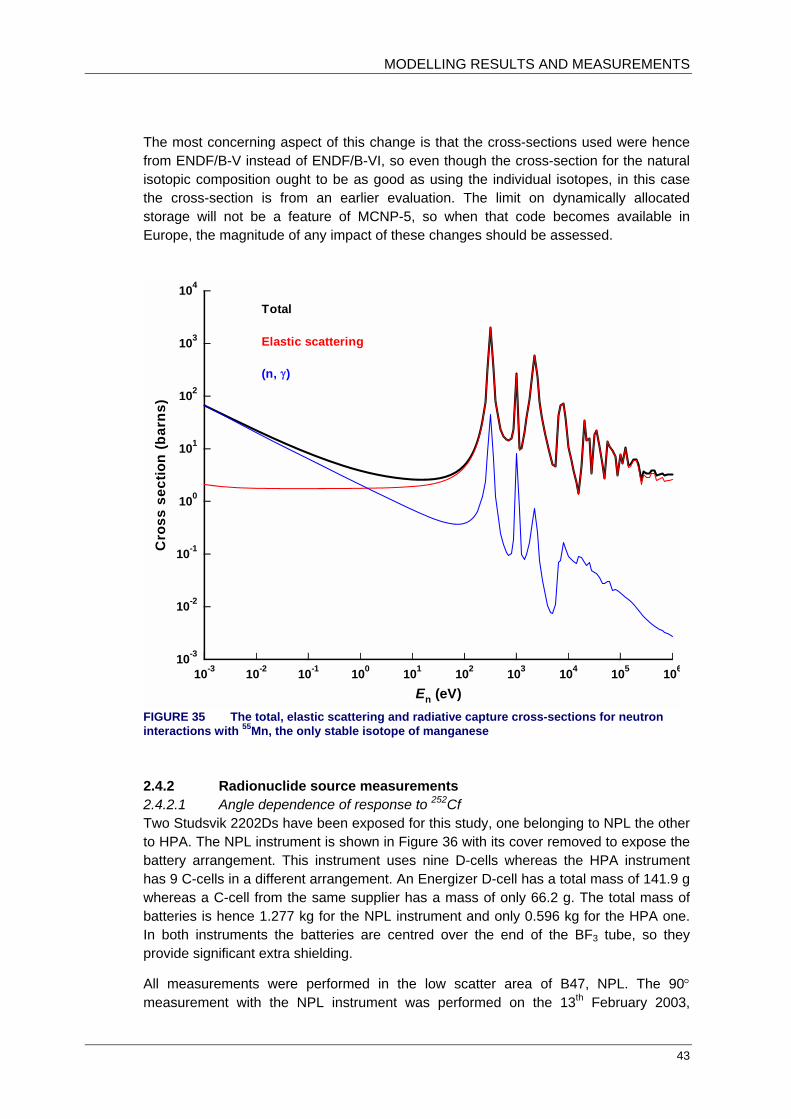
MODELLING RESULTS AND MEASUREMENTS
43
The most concerning aspect of this change is that the cross-sections used were hence from ENDF/B-V instead of ENDF/B-VI, so even though the cross-section for the natural isotopic composition ought to be as good as using the individual isotopes, in this case the cross-section is from an earlier evaluation. The limit on dynamically allocated storage will not be a feature of MCNP-5, so when that code becomes available in Europe, the magnitude of any impact of these changes should be assessed.
10-3 10-2 10-1 100 101 102 103 104 105 106
En (eV)
10-3
10-2
10-1
100
101
102
103
104
Cro
ss s
ectio
n (b
arns
)
Total
(n, γ)
Elastic scattering
FIGURE 35 The total, elastic scattering and radiative capture cross-sections for neutron interactions with 55Mn, the only stable isotope of manganese
2.4.2 Radionuclide source measurements 2.4.2.1 Angle dependence of response to 252Cf Two Studsvik 2202Ds have been exposed for this study, one belonging to NPL the other to HPA. The NPL instrument is shown in Figure 36 with its cover removed to expose the battery arrangement. This instrument uses nine D-cells whereas the HPA instrument has 9 C-cells in a different arrangement. An Energizer D-cell has a total mass of 141.9 g whereas a C-cell from the same supplier has a mass of only 66.2 g. The total mass of batteries is hence 1.277 kg for the NPL instrument and only 0.596 kg for the HPA one. In both instruments the batteries are centred over the end of the BF3 tube, so they provide significant extra shielding.
All measurements were performed in the low scatter area of B47, NPL. The 90° measurement with the NPL instrument was performed on the 13th February 2003,

PRACTICAL IMPLICATIONS OF NEUTRON SURVEY INSTRUMENT PERFORMANCE
44
whereas the 0° and 180° measurements took place between 13th February and 4th March 2003. The HPA instrument was exposed on 12th September 2003. The source details are given in Table 6 where the 252Cf emission rate is taken from a fit to manganese bath measurements that allows for the presence of 250Cf.
FIGURE 36 NPL Studsvik 2202D with the cover removed to show the electronics and battery arrangement. Note that other versions of this instrument have a different battery arrangement; the nine D-cells pictured were replaced by nine of the smaller C-cells in some versions of this instrument.
As a detector with cylindrical geometry, the effective centre of the Studsvik 2202D is not equivalent to the geometric centre for irradiations from angles other than 90°. For this reason, the irradiations at 0° and 180° needed to be performed at a range of distances to obtain the fluence responses from those directions. These effective centre measurements give results that differ significantly from the geometric centre, the centre of the sensitive volume (Appendix C). For example, when the instrument is irradiated from 0°, such that the source is on the cylindrical axis of the instrument beyond the rounded polyethylene end, the effective centre is 10 cm closer to the source than the

MODELLING RESULTS AND MEASUREMENTS
45
geometric centre. When irradiated from the opposite direction, 180°, the effective centre is 2.4 cm further away than the geometric centre.
The measurements of the 252Cf response include measurements with and without a shadow cone. A 5% increase in the shadow cone count rate has been applied to allow for self-shadowing (Taylor and Thomas, 1998) for the 0° and 180° measurements. The results show a strong dependence of response with angle of incidence (Table 7).
TABLE 6 Specifications of the 252Cf source Identifier 4774NC
Encapsulation Modified X35
Emission rate on 13th February 2003 (12 noon GMT) 1.730 107 s-1
Anisotropy factor 1.0207
TABLE 7 Measured 252Cf fluence response and effective centres (EC) of the NPL and HPA Studsvik 2202D instruments. The locations of the effective centres are indicated in Figure 34.
Instrument θ RΦ (cm2) ECa (cm) ECb (cm)
0° 0.348 (0.006) -6.5 (0.8) -10.0 (0.8)
90° 0.413 (0.007) 0 0 NPL 2202D: 9 D-cells
180° 0.206 (0.005) -18.7 (1.4) -2.4 (1.4)
0° - - -
90° 0.498 (0.005) 0 0 HPA 2202D: 9 C-cells
180° 0.291 (0.007) -15.7 (2.0) 0.6 (2.0)
a Distance from the end of the instrument to the effective centre. Positive values would indicate a displacement towards the source from that end of the instrument. Negative values indicate the displacement on the instrument side of that surface.
b Distance from the geometric centre to the effective centre. Negative values are displacements in the direction of 0° from the geometric centre, positive values are displacements towards 180°.
Values in parentheses represent type A uncertainty (coverage factor = 1)
The ratio of the responses to 252Cf from the reference direction, 90°, of the HPA 2202D to the NPL 2202D is 1.206 (0.024), so there is clearly a difference in their response that is much greater than the statistical uncertainty. This difference is unlikely to arise from the threshold setting on the instrument, since the pulses from the Q-value of the 10B(n,α)7Li reaction is 2.79 MeV. The efficiency should hence be close to 100%. The difference could arise from the uncertainty in the BF3 pressure or changes to its active volume, or from other manufacturing variations. Whatever the source of the difference, it is clear that a definitive normalization value for the MCNP calculations cannot be obtained from these data such that the calculated response characteristics can be applied to all instruments of this type without instrument specific normalization.
When the measured response data (Table 7) are normalized to the 90° response for each instrument, it is seen that the response of the HPA instrument is relatively higher from 180° than that of the NPL instrument (Table 8). This is to be expected because the shielding provided by the batteries is less.

PRACTICAL IMPLICATIONS OF NEUTRON SURVEY INSTRUMENT PERFORMANCE
46
The MCNP model that had previously been developed was for the 9 D-cell instrument owned by NPL. This is consequently the battery arrangement in the model and the one that needs to be compared with the experimental data. These calculations required the use of a point source to simulate the experiment accurately, so in this respect these simulations differ from the remaining response calculations for this instrument which otherwise all relate to plane parallel or isotropic fields.
Intermediate angles have been calculated for the point source (Table 9 and Figure 37), but not measured. They are included only to give an indication of the probable trend in response for a point source, but since the effective centre has not been measured for those angles of incidence, there is some uncertainty over the correct source position. The fit that has been used is plausible, because it changes most rapidly at 0° and 180°, and most slowly at 90°, but there could be significant effects caused by aspects of the geometry, especially for angles of incidence close to 180°, that make this interpolation unreliable. Ideally, these measured data would be used to normalize the calculated data to account for the assumed 100% efficiency of the MCNP BF3 tube. However, the results for the two instruments are very different (Table 10).
TABLE 8 Studsvik fluence responses for 252Cf normalized to 90°. The uncertainties take account of correlations in the source emission rate and anisotropy uncertainty components. The quoted uncertainties are Type A with a coverage factor of 1.
NPL instrument: 9 D-cells (LR20) HPA instrument: 9 C-cells (LR14)
θ R(θ)/R(90) R(θ)/R(90) 0° 0.843 (0.015) -
90° 1.000 (0.017) 1.000 (0.010)
180° 0.499 (0.012) 0.584 (0.014)
Values in parentheses represent type A uncertainty (coverage factor = 1)
Previous measurements of the fluence response of Studsvik 2202 detectors with a 252Cf source vary from 0.318 to 0.496 cm2 (Table 11). It is difficult to determine exactly what model of the instrument was used for each measurement and exactly how the measurement was made, but clearly, this is a considerable range of responses. The quoted uncertainties are generally small, although there could be problems with the direction used and any correction factors that have been applied, or which should have been applied. Most of these measurements will have been made from the reference direction (90°), perhaps all.
The current manufacturer of this instrument, Wedholm Medical AB, quantifies the typical instrument-to-instrument variation‡. It gives a range for the dose equivalent response of 1.3 – 1.8 nSv-1 although it does not specify the source. The variation amounts to approximately ±20%, which is about the same as is observed for the collected measured data, which span a 29 year period (Table 11). It should be noted that these dose equivalent responses, although they do not specify the source or the dose quantity, are high compared to the collected measured data, which range from 0.83 to 1.3 nSv-1.
‡ http://www.wedholmmedical.se/download/2222.pdf

MODELLING RESULTS AND MEASUREMENTS
47
There may hence have been an increase in the BF3 pressure used in the central detector. None of the measured data are for a Studsvik or Wedholm Medical 2222: all relate to earlier models of the same instrument.
TABLE 9 Studsvik 2202D efficiency calculation: RΦ, Norm(θ) is the normalized MCNP result. The quoted uncertainties are Type A with a coverage factor of 1.
θ (o) S – GCa (cm) RΦ, MCNP(θ) (cm2) RΦ, Expt(θ) (cm2) Efficiency, ε (%) RΦ, Norm(θ) (cm2) 0 155.2 0.411 (0.006) 0.348 (0.006) 84.7 (1.9) 0.358 (0.008)
15 153.9 0.428 (0.006) 0.373 (0.008)
30 152.6 0.424 (0.006) 0.370 (0.008)
45 151.5 0.449 (0.007) 0.391 (0.008)
60 150.7 0.482 (0.007) 0.420 (0.009)
75 150.2 0.497 (0.007) 0.433 (0.009)
90 150.0 0.489 (0.007) 0.413 (0.007) 84.4 (1.9) 0.426 (0.009)
105 150.1 0.484 (0.007) 0.422 (0.009)
120 150.3 0.430 (0.007) 0.374 (0.008)
135 150.7 0.370 (0.006) 0.323 (0.008)
150 151.2 0.304 (0.006) 0.265 (0.007)
165 151.8 0.244 (0.005) 0.212 (0.006)
180 152.4 0.229 (0.005) 0.206 (0.005) 89.9 (2.9) 0.200 (0.005)
Mean 86.3 (1.8)
a Source (S) to geometric centre (GC) distance. This has been allowed to vary so that the source to effective centre distance approximates to 150 cm for all angles of incidence. Different ksin(θ) fits have been used for 0°-90° and 90°-180°. ksin(θ) was selected so that the rate of change of the source to effective centre distance is greatest at 0° and 180°, and smallest at 90°.
Values in parentheses represent type A uncertainty (coverage factor = 1)
There is a weak trend in the data, whereby the response appears to have increased with time. The exact age of each instrument is difficult to decipher from the references, but this probably indicates that the BF3 pressure has been increased during the period in which these instruments were manufactured. Alternatively, it may simply demonstrate the intrinsic instrument-to-instrument variation.
The small uncertainties quoted for the 252Cf response (Table 11) indicate the relatively large numbers of counts that are obtained for a short exposure, the consequent statistical uncertainties being quite small. There may be systematic uncertainties that have not been accounted for in some of these measurements, which could cause some additional variation, but the differences between the results are certainly not always statistical. One instrument was used for three of the measurements at NPL, the results being 0.413 (0.007)* cm2, 0.411 (0.009)† cm2 and 0.410 (0.004)† cm2. Other NPL measurements, with different instruments show significant deviations from these values,
* Type A uncertainty with a coverage factor of 1 † Type A uncertainty with a coverage factor of 2

PRACTICAL IMPLICATIONS OF NEUTRON SURVEY INSTRUMENT PERFORMANCE
48
the maximum being more than 20% higher. These other NPL data, and the data from other laboratories, strongly support the variations in measured response deriving from intrinsic instrument-to-instrument variations. The MCNP data for this instrument will hence be used unnormalized to experimental measurements. If the data are to be used to interpret the readings of a specific instrument then that instrument should be calibrated using a 252Cf or 241Am-Be radionuclide source and the MCNP data normalized by the appropriate factor.
0 15 30 45 60 75 90 105 120 135 150 165 180Angle of incidence, θ (°)
0
0.1
0.2
0.3
0.4
RΦ
( θ) (
cm2 )
Measured
MCNP, corrected for efficiency
FIGURE 37 252Cf response of the Studsvik 2202D versus angle of incidence
TABLE 10 Studsvik 2202D response for measured 252Cf for irradiation from 90°, normalized to the MCNP calculated response for both the HPA-RPD and NPL instruments
NPL instrument: 9 D-cells HPA-RPD instrument: 9 C-cells R(90°)Expt/R(90°)MCNP R(90°)Expt/R(90°)MCNP 0.844 (0.019)a 1.018 (0.017)a
a Uncertainty takes account of correlations in the source emission rate and anisotropy components
Values in parentheses represent type A uncertainty (coverage factor = 1)
There is only one set of results for the angle dependence of response with a 252Cf source that have been identified (Hankins and Cortez, 1975). The response values, normalised to 90°, are given as 0.9 for 0° and 0.6 for 180°, but since these values must be read from a line graph, no uncertainties can be given. It is not clear from the
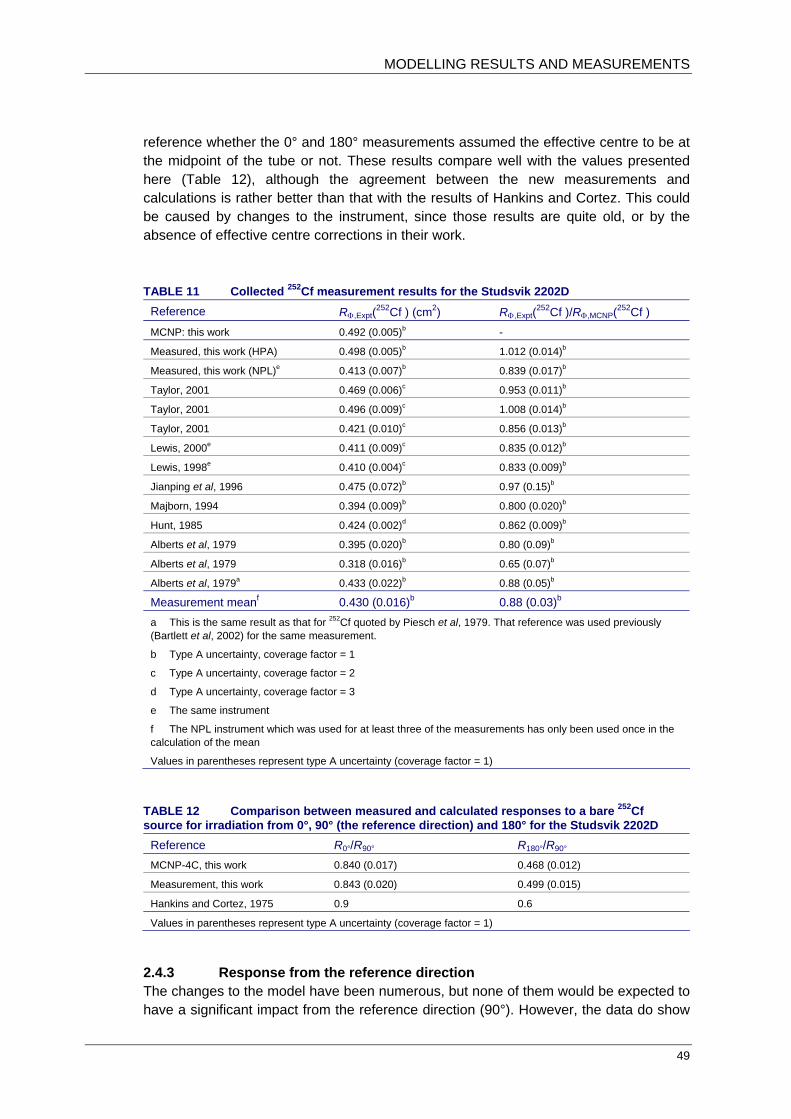
MODELLING RESULTS AND MEASUREMENTS
49
reference whether the 0° and 180° measurements assumed the effective centre to be at the midpoint of the tube or not. These results compare well with the values presented here (Table 12), although the agreement between the new measurements and calculations is rather better than that with the results of Hankins and Cortez. This could be caused by changes to the instrument, since those results are quite old, or by the absence of effective centre corrections in their work.
TABLE 11 Collected 252Cf measurement results for the Studsvik 2202D Reference RΦ,Expt(
252Cf ) (cm2) RΦ,Expt(252Cf )/RΦ,MCNP(252Cf )
MCNP: this work 0.492 (0.005)b -
Measured, this work (HPA) 0.498 (0.005)b 1.012 (0.014)b
Measured, this work (NPL)e 0.413 (0.007)b 0.839 (0.017)b
Taylor, 2001 0.469 (0.006)c 0.953 (0.011)b
Taylor, 2001 0.496 (0.009)c 1.008 (0.014)b
Taylor, 2001 0.421 (0.010)c 0.856 (0.013)b
Lewis, 2000e 0.411 (0.009)c 0.835 (0.012)b
Lewis, 1998e 0.410 (0.004)c 0.833 (0.009)b
Jianping et al, 1996 0.475 (0.072)b 0.97 (0.15)b
Majborn, 1994 0.394 (0.009)b 0.800 (0.020)b
Hunt, 1985 0.424 (0.002)d 0.862 (0.009)b
Alberts et al, 1979 0.395 (0.020)b 0.80 (0.09)b
Alberts et al, 1979 0.318 (0.016)b 0.65 (0.07)b
Alberts et al, 1979a 0.433 (0.022)b 0.88 (0.05)b
Measurement meanf 0.430 (0.016)b 0.88 (0.03)b a This is the same result as that for 252Cf quoted by Piesch et al, 1979. That reference was used previously (Bartlett et al, 2002) for the same measurement.
b Type A uncertainty, coverage factor = 1
c Type A uncertainty, coverage factor = 2
d Type A uncertainty, coverage factor = 3
e The same instrument
f The NPL instrument which was used for at least three of the measurements has only been used once in the calculation of the mean
Values in parentheses represent type A uncertainty (coverage factor = 1)
TABLE 12 Comparison between measured and calculated responses to a bare 252Cf source for irradiation from 0°, 90° (the reference direction) and 180° for the Studsvik 2202D
Reference R0°/R90° R180°/R90° MCNP-4C, this work 0.840 (0.017) 0.468 (0.012)
Measurement, this work 0.843 (0.020) 0.499 (0.015)
Hankins and Cortez, 1975 0.9 0.6
Values in parentheses represent type A uncertainty (coverage factor = 1)
2.4.3 Response from the reference direction The changes to the model have been numerous, but none of them would be expected to have a significant impact from the reference direction (90°). However, the data do show

PRACTICAL IMPLICATIONS OF NEUTRON SURVEY INSTRUMENT PERFORMANCE
50
a slight increase in the response in the energy range from 1 eV to 100 keV (Figure 38). It is not clear why this should be, since the response below 1 eV is unchanged. It is perhaps connected to the change to the overall radius of the instrument or the changes to the materials. Since few workplace fields contain a large fraction of dose equivalent in this energy range, the impact on the predicted response from the reference direction will be negligible.
10-2 10-1 100 101 102 103 104 105 106 107
Neutron energy (eV)
0.01
0.1
RΦ
(90°
) (cm
2 )
0.01
0.1
RΦ
(180
°) (c
m2 )
NRPB-R333(rev)
Current work
Reference direction
Through electronics
NRPB-R333(rev)
Current work
FIGURE 38 Comparison between the calculated responses for 90° and 180° for the Studsvik 2202D from Bartlett et al, 2002 (labelled NRPB-R333(rev)) and those from the current work

MODELLING RESULTS AND MEASUREMENTS
51
The effect of the changes to the model is much more pronounced for irradiation through the electronics (Figure 38). This is most significant for energies between 0.1 eV and 100 keV, where the new calculation of the response is about a factor of two lower than the old calculation. For thermal and fast neutrons the effect is less, but the response is lower for all energies up to 20 MeV. This is probably caused more by the inclusion of a realistic battery holder than the changes to the batteries themselves, because the shielding provided by the whole assembly is now much more significant.
If the instrument is exposed from 180°, then these new response data (Appendix B) should be used to interpret the instrument response or significant errors will result. In practice, such an orientation for workplace measurements should be avoided. However, workplace fields are not unidirectional, so there will always be neutrons incident on the device from this direction, so the difference between the response from this angle and that from the reference direction will have an impact.
The data for irradiation from 180° were not tabulated in the earlier work, but they were used in the computation of the response to rotationally and spherically isotropic fields. The magnitude of the difference will cause the new calculations of the response to these geometries to change significantly, particularly that for rotational isotropy, because solid angle considerations will cause this direction to have less impact on the response to a field with spherical isotropy.
2.4.4 Angle dependence of response The response to plane parallel beams incident at 30° intervals in the horizontal plane has been calculated for the instrument lying with its axis of symmetry in the horizontal plane. Twenty-three energies from 25.3 meV to 20 MeV have been used (Figure 39 and Appendix B). These data are not used explicitly for folding with the workplace fields but were calculated so that the response to a rotationally isotropic field can be constructed. The behaviour is seen to be a relatively smooth function of angle, so taking the average of the values at a given energy will give the response to a rotationally isotropic field (Figure 40).
Whilst the detailed energy and angle dependence of response data could have been used to obtain the response to a spherically isotropic field, the preferred option, as with the other instruments, was to use a spherically isotropic source. The resultant responses to spherically and rotationally isotropic sources are not seen to deviate very significantly from the response from the reference direction, although the response from 90° is always the highest of the three, for the energy range up to 20 MeV.
The response to rotationally isotropic fields is always lower than that for irradiation from the reference direction, with the maximum difference being more than 20% for 1 MeV neutrons (Figure 41). Because incidence from 90°, the reference direction, has the highest solid angle, the response for a spherically isotropic field is always higher than that for rotational isotropy, for which irradiation through the electronics receives the same weighting as any other angle. The underestimates relative to the response from the reference direction should not be interpreted as underestimates of dose equivalent, because the H*(10) response is also energy dependent. For example, the lower values for the response to a rotationally or spherically isotropic field when compared to the

PRACTICAL IMPLICATIONS OF NEUTRON SURVEY INSTRUMENT PERFORMANCE
52
response from 90°, actually represent smaller overestimates of H*(10) in the intermediate energy range.
10-2 10-1 100 101 102 103 104 105 106 107
En (eV)
10-2
10-1
0.2
1
7
RH
*(10
) (nS
v-1)
RΦ
(cm
2 )
120°
150°
0°
90°
30°
60°
180°
120°
150°
0°
90°
30°
60°
180°
FIGURE 39 Fluence and H*(10) response of the Studsvik 2202D plotted versus energy for seven different azimuthal angles of incidence. 90° is the reference direction for this instrument. These calculations are for a nine D-cell battery configuration.
2.4.5 Comparison with prior experimental data There are quite a few sources of data for monoenergetic calibrations of the Studsvik (or Alnor) 2202D, but the literature search has uncovered no data for the Studsvik (now Wedholm Medical) 2222. Hence, all of the data in this section relate to the older model. The published data (Widell and Svansson, 1973; Majborn, 1994; Thompson and Lavender, 1976; Hankins and Cortez, 1975; Alberts et al, 1979; Cosack and Lesiecki, 1981; Hunt, 1985; Jianping et al, 1996) span a twenty-three year period and include different subsets of energies between thermal and 19 MeV.

MODELLING RESULTS AND MEASUREMENTS
53
These published data show a substantial scatter about the unnormalized MCNP-4C response values (Figure 42) with some quite significant deviations across the energy range. In particular, the oldest data set (Widell and Svansson, 1973) deviates very significantly at high energies and also includes a 50% higher response for thermal neutrons. The difference in the responses for 19 MeV is approximately a factor of three.
10-2 10-1 100 101 102 103 104 105 106 107
En (eV)
10-2
10-1
RΦ
(cm
2 )
0.2
1
7
RH
*(10
) (nS
v-1)
Rotational isotropy
Reference direction, 90°
Spherical isotropy
FIGURE 40 Fluence and H*(10) response of the Studsvik 2202D from the reference direction and also for rotationally and spherically isotropic fields
Because the radionuclide source data have indicated that the response is strongly instrument-to-instrument dependent, the response data from the collected references

PRACTICAL IMPLICATIONS OF NEUTRON SURVEY INSTRUMENT PERFORMANCE
54
have been normalized using the 252Cf response where possible (Figure 43). This was not possible for every dataset, so alternative normalizations were used in some cases: Widell and Svansson, 1973 was normalized to 2.02 MeV; Cosack and Lesiecki, 1981 to 1.0 MeV; one of four instruments in Alberts et al, 1979 to 241Am-Be, the other three to 252Cf. The only measurement in Thompson and Lavender, 1976 was a thermal neutron measurement, so this could not be renormalized.
10-2 10-1 100 101 102 103 104 105 106 107
Neutron energy (eV)
0.8
0.9
1.0
Res
pons
e no
rmal
ized
to R
(90°
)
Rotational isotropy
Spherical isotropy
FIGURE 41 Rotationally and spherically isotropic responses normalized to the response from the reference direction (90°) for the same energy. Note that the variation of the H*(10) with energy is greater than this angle dependence of response variation, once rotational or spherical isotropy is introduced (Figure 40).
Once the measured data are normalized to try to eliminate instrument specific variations, the agreement with the MCNP-4C data is much improved. It is noticeable that the data from Alberts, which relate to four separate instruments of this type, now have much reduced scatter. The general underestimate that was evident in the 1-5 MeV energy range is now no longer present.
Some data still show significant deviations from the calculations. Quite noticeable in this regard is the 8 keV measurement of Jianping et al, which gives a much higher response than MCNP. Similarly the measured results for 26 keV are generally a little higher than the calculation. The dose rates for these irradiations are probably very low, and there could be source contamination or room scatter problems with the measurements.

MODELLING RESULTS AND MEASUREMENTS
55
There is a more convincing difference between the measurements and calculations for high energies. For measurements in the 15-19 MeV energy range, the response is higher than that calculated in almost all cases. This could be a real effect, because there are other reactions with 10B, 11B and 19F in the BF3 gas that have threshold energies in the 5-15 MeV energy range. Many of these generate charged particles that will produce detectable pulses in the central detector. Additionally, elastic scattering reactions can produce recoiling boron or fluorine nuclei that deposit enough energy to produce pulses that will be above the threshold that is set to discriminate against photon events.
10-2 10-1 100 101 102 103 104 105 106 107 108
En (eV)
0.005
0.01
0.05
0.1
0.5
RΦ (
cm2)
Thompson & Lavender, 1976
Widell & Svansson, 1973
Cosack & Lesiecki, 1981
Normalised MCNP 90o
Majborn, 1978
Jianping et al, 1996
Hunt, 1988
Hankins & Cortez, 1975
Alberts et al, 1979
FIGURE 42 Calculated, unnormalized fluence response for the Studsvik 2202D from this work compared to prior experimental data. Note that these data have not been corrected for instrument to instrument variation in the magnitude of the response.
Additionally, 19 MeV calibration fields are prone to contamination with lower energy neutrons from other reactions in the target, so if these have not been properly accounted for, there may be errors in the measurements. However, there are also problems with the calculations in this energy range, since other reactions could contribute significantly to the response of the instrument, and the pulses from those reactions cannot be replicated in MCNP. Fortunately, even for such high energies the response will be dominated by thermalized neutrons, and the calculations should prove reliable. Judging by the variation in the measured data, they may be more reliable than measurements for 19 MeV. Whilst this area is worthy of further investigation, none of the workplace fields in this study have a significant component of either fluence or dose equivalent for energies above 5-6 MeV. Hence, if there is a problem with the calculated data for this energy range, it will not have a significant impact on the results of the folding part of this project.

PRACTICAL IMPLICATIONS OF NEUTRON SURVEY INSTRUMENT PERFORMANCE
56
10-2 10-1 100 101 102 103 104 105 106 107 1080.005
0.01
0.05
0.1
0.5RΦ (
cm2)
En (eV)
Widell & Svansson, 1973
Cosack & Lesiecki, 1981
Normalised MCNP 90o
Majborn, 1978
Jianping et al, 1996
Hunt, 1988
Hankins & Cortez, 1975
Alberts et al, 1979
FIGURE 43 Calculated, unnormalized fluence response for the Studsvik 2202D from this work compared to prior experimental data normalized to 252Cf where possible, or to a response around 2 MeV where no 252Cf irradiation was performed
3 SENSITIVITY OF MODELLING RESULTS
Monte Carlo codes such as MCNP use large numbers of starting particles to model the radiation field. The results from these calculations, the tally, may be scored over a volume or a surface as either fluence or the fluence multiplied by a conversion coefficient, or in this work a cross-section. The result is quoted as the mean of the tallied quantity divided by the total number of histories*. This mean then has a standard deviation that can be calculated conventionally, and a standard uncertainty that then scales by the square root of the reciprocal of the number of starting particles. Hence, to halve the statistical precision of a tally, it is generally necessary to increase the number of starting particles by a factor of four.
This statistical uncertainty that MCNP routinely quotes for all results is a very important parameter in assessing the reliability of results. The manual asserts that if the statistical uncertainty is less than 5% of the tally result, then the results are “generally reliable” for all types of detector (Briesmeister, 2000). In practice, it is quite easy with a fast personal computer to obtain statistical uncertainties that are significantly smaller than 5%. For the instruments modelled in this work this is particularly true for the higher energies that
* The chain of particles generated by a single source particle. It may not be the original source particle that is ultimately scored, or there may be more than one scoring particle from a single history.

SENSITIVITY OF MODELLING RESULTS
57
have been modelled, although for less strongly penetrating neutrons, the computations are quite demanding.
In Section 2 the uncertainties quoted on the calculated results are exclusively the statistical component (Type A) of the overall uncertainty. According to the central limit theorem, the probability that the true mean lies within this range is 68%, given a well-behaved tally*, for which the random error has been correctly computed. There are a number of checks performed routinely on the data, which should indicate any problems with the calculation of this statistical uncertainty.
Monte Carlo calculations that use very large numbers of histories, so that the statistical precision on the results implies great certainty, can be misleading. There may be significant uncertainties on components of the problem that lead to the true uncertainty being very much greater. A simple method of testing the sensitivity of the results to a certain parameter would be to change the input file and simply run the calculation again. However, that method would involve a lot of extra work, and more importantly run the risk of failure to resolve the magnitude of the effect because both runs would have uncorrelated histories: if the sensitivity to the parameter is less than the statistical uncertainties, then it will not be resolvable.
MCNP-4C and later versions offer a useful alternative method of determining the sensitivity of the tally to various input parameters. By perturbing the transport using Taylor series expansions, two calculations are performed for each history, one with the original data, the other with the perturbed data. The default method uses the first and second order terms of the Taylor series. This is the most detailed method available, and is the method that has been used throughout this work.
The advantage of using the perturbation method is that the histories have correlated uncertainties which means that the sensitivity to the parameter that is being perturbed can be determined even when the magnitude of the change that is caused is smaller than the statistical uncertainty on the results. An example of this is shown in Figure 44 where the perturbation of the tally is plotted for five different changes to the polyethylene density, for increasing numbers of source neutrons. The error bars in this figure are the 68% confidence level, but the fluctuation of the perturbation is much smaller than would be expected for such large statistical uncertainties. This is because the histories are correlated. The error bars have been plotted throughout this section because although they overstate the uncertainty on the perturbation, they indicate the meaningful uncertainty on the result.
Unfortunately, MCNP-4C offers limited scope for perturbing parameters. The only perturbations that are allowed are perturbations of the materials, which allows more scope for investigations of this type than is at first evident. The simplest change is simply to change the density, which is a parameter that does have real uncertainty for some materials. For example, polyethylene has a wide range of commercial brands available, each of which has a precisely specified, but slightly different density
* If the scores contributed by different histories are very variable, for example very energy dependent, then MCNP can give falsely small statistical uncertainties. This can be a particular problem for point or ring detectors, or where energy dependent variance reduction is applied.

PRACTICAL IMPLICATIONS OF NEUTRON SURVEY INSTRUMENT PERFORMANCE
58
(Table 13). For instruments such as neutron area survey instruments this is a critical parameter. The data for commercially available polyethylene products indicate that there is an approximate ±0.5% variation in the density of low-density polyethylene. However, other products have significantly higher densities, 0.95 g cm-3 (+3%) and 0.98 g cm-3 (+5%) being noticeably different from the general spread of densities.
FIGURE 44 Response of the Leake detector for five different perturbations of the polyethylene density plotted against number of source neutrons (10 keV)
In addition to the “low density polyethylene” products specified in Table 13, there are other categories of polyethylene. Of these, “ultra/very low density”, for which the density range quoted* is 0.905-0.913 g cm-3, is mainly for thin films, so it may not have any relevance to neutron survey instruments. Hence, the minimum density of 0.915 g cm-3 may be the lowest realistic density for polyethylene in this project. “Medium density” polyethylene is specified* as having a density of up to 0.95 g cm-3 and “high density polyethylene” as up to 1.4 g cm-3. Many of the high-density products are copolymers or have additives, which will mean that the CH2 specification will no longer apply. Hence, it may be unrealistic to increase the density too greatly, since a denser product with lower hydrogen content may not moderate neutrons as efficiently as 0.92 g cm-3 polyethylene.
Changes to the material composition and its density can be used to perturb the magnitude of cross-sections. MCNP-4C allows a reaction number to be specified, so the
* www.matweb.com

SENSITIVITY OF MODELLING RESULTS
59
perturbation can apply only to that reaction, otherwise the method will perturb the total cross-section. Additionally, energy intervals can be specified so that the perturbation does not apply across the entire energy range.
Geometric perturbations are not explicitly allowed. However, by perturbing the materials, the effect can be simulated. For example, if the diameters of the holes in the thermal neutron absorbing layer are to be perturbed, this can be done by changing the material of a thin increment from air to boron loaded neoprene or cadmium, or doing the process in reverse. If the sensitivity of the result to the geometrical change is sufficient, then these perturbations can be simulated conventionally using separate runs with different input files.
TABLE 13 Low Density Polyethylene (LDPE) density survey Grade ρ (g cm-3) Chevron Phillips KN 226 LDPE 0.925
Bapolene® Grade LD1052 Polyethylene 0.92
Elf Atochem Lacqtene® 1070 MG 24 LDPE 0.924
Dow LDPE 4005M Low Density Polyethylene 0.916
Eastman TENITE Polyethylene 1810A LDPE 0.921
Voridian 18BOA Low Density Polyethylene 0.919
Equistar Microthene® MN 711-20 LDPE 0.915
Exxon Escorene® LD-506 LDPE 0.923
Global ST-1018 Low Density Polyethylene 0.916
PolyOne Maxxam® FR PE 112 LDPE 0.98
Huntsman PE2018 0.92
RTP Company RTP 700A LDPE 0.92
Prima Plastics PRIMATHON 950 0.925
BASF Lupolen® 1800 H LDPE 0.919
John Caunt Scientific, JCPEP 0.95
Mean 0.920
σn-1 0.003 (0.36%)
Maximum (excluding PolyOne Maxxam, JCPEP) 0.925 (+0.54%) Minimum 0.915 (-0.54%)
3.1 Leake, 0949
3.1.1 Holes in the cadmium layer The Leake design (Leake, 1965; Leake 1968) uses a perforated cadmium layer to suppress the response to intermediate energy neutrons. These holes have a radius of 0.238 cm and are stamped out of a sheet of cadmium. The systematic error in the radius of a hole may hence be constant, since the stamp will have a defined radius. Because geometric perturbations are difficult to implement in MCNP-4C, the perturbations have been simulated using repeat runs with changes to the hole radii.

PRACTICAL IMPLICATIONS OF NEUTRON SURVEY INSTRUMENT PERFORMANCE
60
The range of hole sizes that has been used for the perturbed calculations is large compared to the plausible magnitude for this variation, since the normal radius of a hole is 2.38 mm, and errors of up to 1 mm have been simulated. The range, however, allows the trend to be established, and the smallest variations used, ± 0.25 mm, are plausible manufacturing errors. These are seen to produce more than 20% changes to the response for thermal and epithermal neutrons, which is about twice the percentage change in the radius of the holes (Table 14 and Figure 45). It is approximately proportional to the percentage change in the hole area.
TABLE 14 Changes to the radius (Δr) and area (ΔA) used in the perturbation of the holes in the cadmium layer for the 0949
Δr (mm) Δr (%) ΔA (%) +1.00 +42.0% +102%
+0.50 +21.0% +46.4%
+0.25 +10.5% +22.0%
-0.25 -10.5% -19.9%
-0.50 -21.0% -37.6%
-1.00 -42.0% -66.4%
FIGURE 45 Leake response as a function of energy, for irradiation from the reference direction, for changes to the radii of the holes in the cadmium layer. The response at each energy has been normalized to the response at that energy for the unperturbed geometry.

SENSITIVITY OF MODELLING RESULTS
61
For fast neutrons the magnitude of the change in the response is reduced compared to that observed for lower energies. This is because a larger part of the response is generated by neutrons that are moderated by the polyethylene that is inside the cadmium layer, and the holes in the cadmium have little influence on the ability of fast neutrons to penetrate the cadmium. It is hence seen that the hole radii, if systematically perturbed, will have an energy dependent influence on the response: increases in the hole radii will increase the low energy neutron response more than the fast neutron response so calibration of the instrument with a hard radionuclide source spectrum may not enable the response to thermal neutrons to be predicted. For reductions in the hole radii, the reverse of this argument will apply. Additionally, any extra gaps that are present in the cadmium layer can be predicted to have a significant impact on the response of the instrument, particularly in soft fields.
3.1.2 Polyethylene density Polyethylene is widely used for moderating neutrons because of its high hydrogen content. Generally, the density quoted for “low density polyethylene” is in the range from 0.915-0.925 g cm-3, ±0.54% (Table 13), although the manufacturers do not, in general quote tolerances on their precisely specified values. It hence seems reasonable to assume that ±0.5% is a typical perturbation for the density, but that larger perturbations may also be of interest. The former may represent natural variations of the product, whereas the latter could indicate the sort of errors that could result if an incorrect product were used.
Five perturbations of the polyethylene density (Δρ) were used: -1%, -0.5%, +0.5%, +1.0% and +2.5% (Figure 46). These show that the energy dependence of the instrument response is a strong function of polyethylene density, with the change in response for a given Δρ being approximately -4 Δρ for energies up to about 100 keV, and about +2 Δρ for energies of 10 MeV and above. In the energy range from 1-2 MeV, the response is almost independent of polyethylene density. These effects are caused by the higher density polyethylene moderating more effectively the fast neutrons, and the lower density polyethylene attenuating less well the low energy neutrons. The sensitivity of the effect is quite significant, particularly for low energy neutrons.
3.2 NM2
3.2.1 Polyethylene density The range of polyethylene density variations used for the NM2 perturbation study was -0.5% to +2.5% (Figure 47). These show a very similar pattern and magnitude of effect as that observed for the 0949 (Figure 46). Despite the different symmetry of the NM2 when compared to the spherical 0949, the principle is the same, and the influence of the density on the response virtually identical.
3.2.2 Holes in the boron-loaded layer The attenuating layer located in the polyethylene moderator is made from boron-loaded neoprene in the NM2, with holes punched out of a flat rubber sheet. The rubber sheet is

PRACTICAL IMPLICATIONS OF NEUTRON SURVEY INSTRUMENT PERFORMANCE
62
then rolled to form a cylinder. As with the Leake design, an error in the hole diameter would be expected to be systematic not random, with holes that are too large allowing more low energy neutrons through. The effect would be expected to be related to the area of the holes, although the energy dependence may be different from that for the Leake, which has cadmium instead of boron as an attenuating layer: cadmium is much more selective against thermal neutrons.
FIGURE 46 Response of the 0949 versus energy, for irradiation from the reference direction, for a plausible variation in polyethylene density. The response values at each energy have been normalized to the response at that energy for the unperturbed density.
Although the absolute incremental changes for the radius are the same as those selected for the Leake, the fractional change in the radius and hence the hole area is smaller (Table 15), so the effect is not as significant (Figure 48). The percentage change in the response to low energy neutrons is hence found to be about 1.5 times the percentage change in the hole area, whereas for fast neutrons the percentage change in response is about half the change in the hole area. The general pattern is, however, almost identical to that observed for the Leake, so the difference between the boron-loaded neoprene and cadmium attenuating layers does not appear significant.
3.2.3 BF3 pressure More recent designs of proportional counter have had higher 3He or BF3 pressures in order to increase their sensitivity. Given the general increase in the responses of the measured data for these instruments with time, this could account for some of the

SENSITIVITY OF MODELLING RESULTS
63
observed increase in the magnitude of the response. However, whilst there may be intentional increases in the gas pressure, it is also a parameter that has an intrinsic uncertainty which will also influence the scatter on the measured data that come from several different instruments of the same type.
10-8 10-7 10-6 10-5 10-4 10-3 10-2 10-1 1 10En (eV)
0.85
0.90
0.95
1.00
1.05
1.10
Rat
io: p
ertu
rbed
/unp
ertu
rbed
-0.5%
+0.5%
+1.0%
+2.5%
FIGURE 47 NM2 response as a function of energy, for irradiation from the reference direction, for a plausible variation in polyethylene density
The BF3 gas pressure in the NM2 is seen to have an almost energy-independent sensitivity (Figure 49). The magnitude of the change in the response is slightly smaller than the change in the pressure, which indicates that there is a significant probability of a thermalized neutron re-emerging from the detector. Hence, increasing the fill pressure increases the magnitude of the response, but it does not produce a proportionate increase in the response.
A +5% increase in the number of 10B atoms present in the detector produces a 3.5-3.7% increase in the calculated response, with a mean of +3.6%. The increase is very slightly larger for higher energy neutrons, which may indicate that the probability of a neutron traversing the detector is slightly reduced when the pressure is increased. The decrease in the response for a given energy is comparable for a 5% decrease in BF3 pressure, the mean decrease being 3.7%. It may be inferred from these results that the variation of response with gas pressure in the detector will practically affect only the magnitude of the response. There is also energy dependence of response associated with the gas

PRACTICAL IMPLICATIONS OF NEUTRON SURVEY INSTRUMENT PERFORMANCE
64
pressure, but it is too weak to be influential when compared to the strong energy dependence effects associated with perturbing the polyethylene density or the hole size in the boron-loaded layer.
TABLE 15 Changes to the radius (Δr) and area (ΔA) used in the perturbation of the holes in the boron-loaded layer for the NM2. The unperturbed holes have a radius of 5.0 mm.
Δr (mm) Δr (%) ΔA (%) +1.00 +20.0% +44.0%
+0.50 +10.0% +21.0%
+0.25 +5.0% +10.3%
-0.25 -5.0% -9.8%
-0.50 -10.0% -19.0%
-1.00 -20.0% -36.0%
10-2 10-1 100 101 102 103 104 105 106 107
En (eV)
0.4
0.6
0.8
1.0
1.2
1.4
1.6
Rat
io: p
ertu
rbed
/unp
ertu
rbed
-20 %
+20 %
-5 %+5 %
-10 %
+10 %
FIGURE 48 NM2 response as a function of neutron energy for irradiation from the reference direction for a plausible systematic uncertainty in the diameter of the holes in the boron-loaded layer
3.3 Studsvik 2202D
The initial input files developed for the sensitivity calculations exceeded the maximum dynamically allocated storage limit (MDAS) allowed in MCNP-4C. This was despite most
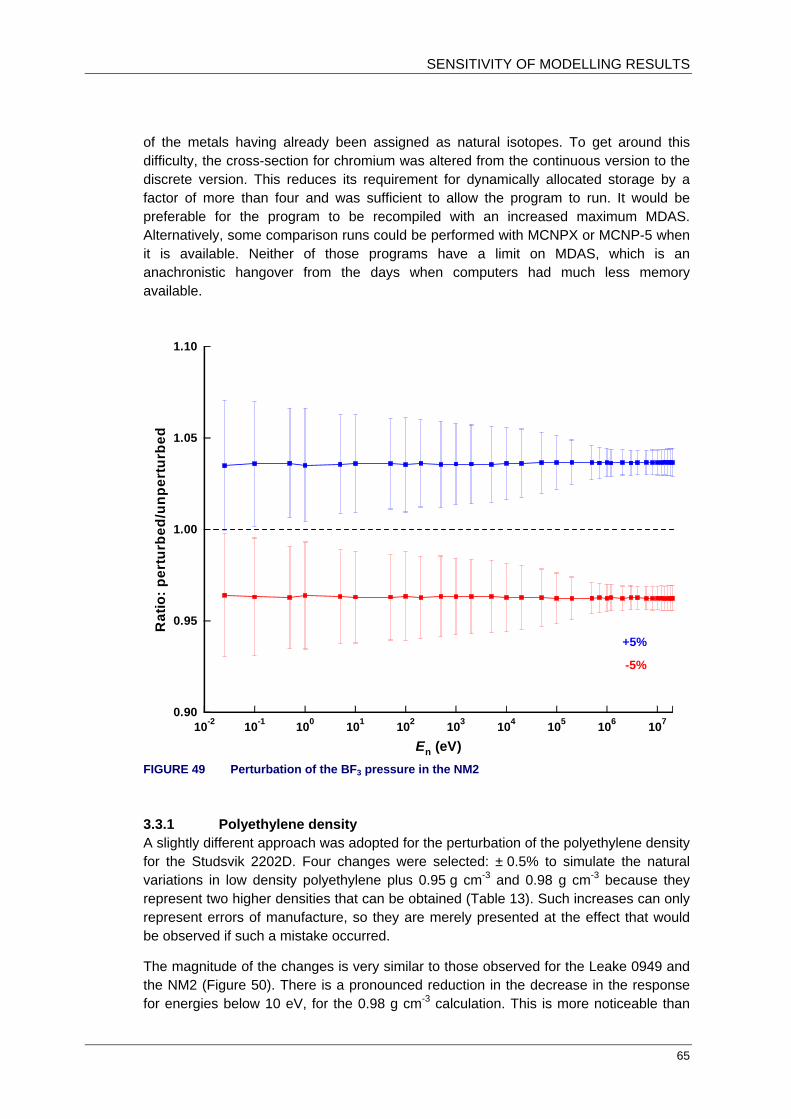
SENSITIVITY OF MODELLING RESULTS
65
of the metals having already been assigned as natural isotopes. To get around this difficulty, the cross-section for chromium was altered from the continuous version to the discrete version. This reduces its requirement for dynamically allocated storage by a factor of more than four and was sufficient to allow the program to run. It would be preferable for the program to be recompiled with an increased maximum MDAS. Alternatively, some comparison runs could be performed with MCNPX or MCNP-5 when it is available. Neither of those programs have a limit on MDAS, which is an anachronistic hangover from the days when computers had much less memory available.
10-2 10-1 100 101 102 103 104 105 106 107
En (eV)
0.90
0.95
1.00
1.05
1.10
Rat
io: p
ertu
rbed
/unp
ertu
rbed
-5%
+5%
FIGURE 49 Perturbation of the BF3 pressure in the NM2
3.3.1 Polyethylene density A slightly different approach was adopted for the perturbation of the polyethylene density for the Studsvik 2202D. Four changes were selected: ± 0.5% to simulate the natural variations in low density polyethylene plus 0.95 g cm-3 and 0.98 g cm-3 because they represent two higher densities that can be obtained (Table 13). Such increases can only represent errors of manufacture, so they are merely presented at the effect that would be observed if such a mistake occurred.
The magnitude of the changes is very similar to those observed for the Leake 0949 and the NM2 (Figure 50). There is a pronounced reduction in the decrease in the response for energies below 10 eV, for the 0.98 g cm-3 calculation. This is more noticeable than

PRACTICAL IMPLICATIONS OF NEUTRON SURVEY INSTRUMENT PERFORMANCE
66
the same effect for the other instruments, because the density is higher than any used for them. It is seen, however, in the perturbation data for all three instruments.
The impact of the perturbation of the polyethylene density is more easily assessed from observation of the H*(10) response (Figure 51). This shows that the over-response in the intermediate energy range is reduced as the density of the polyethylene is increased, but there is a corresponding decrease in the response to thermal neutrons. Additionally, the under-response to neutrons around 100 keV is made slightly worse. Conversely, the response to high-energy neutrons is improved. In the workplace, the loss of response to thermal neutrons is likely to have a negative impact in many soft workplace fields. In harder workplace fields the increase in the high energy response is unlikely to make much difference because it is most marked for energies above those found around fission and (α, n) sources. Indeed for pure fission neutrons, the response is observed to have no sensitivity to polyethylene density (Figure 52).
10-2 10-1 100 101 102 103 104 105 106 1070.7
0.8
0.9
1.0
1.1
1.2
R(E
n, ρ
)/R(E
n, ρ
=0.9
2 g
cm-3
)
En (eV)
ρ = 0.98 g cm-3 (+6.5%)ρ = 0.9246 g cm-3 (+0.5%)
ρ = 0.9154 g cm-3 (-0.5%) ρ = 0.95 g cm-3 (+3.3%)
FIGURE 50 Studsvik 2202D response as a function of neutron energy for four different polyethylene densities, normalized at each energy to the response calculated for the manufacturer’s specified density of 0.92 g cm-2.
3.3.2 Boron loading of the neoprene layer The Studsvik 2202D uses a boron-loaded neoprene layer located in the polyethylene moderator to give the instrument an acceptable energy dependence of dose equivalent response. Without this layer, the instrument would have a much higher dose equivalent response to thermal and intermediate energy neutrons than it would have for fast
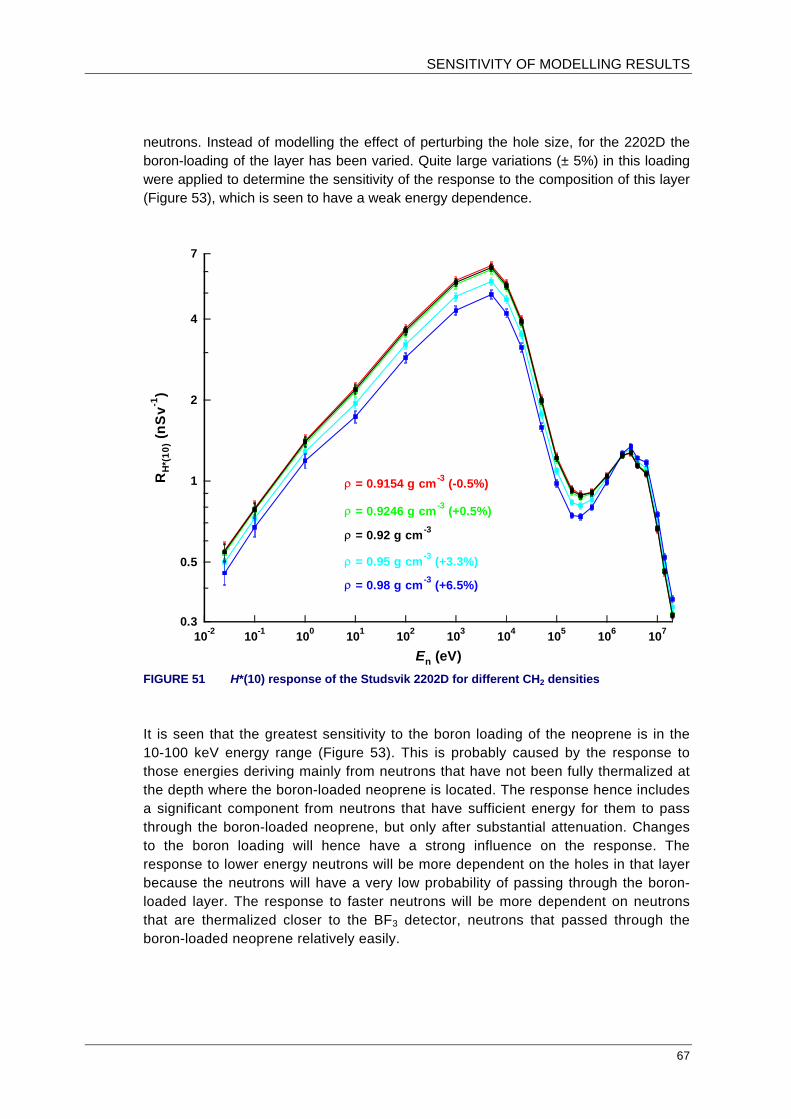
SENSITIVITY OF MODELLING RESULTS
67
neutrons. Instead of modelling the effect of perturbing the hole size, for the 2202D the boron-loading of the layer has been varied. Quite large variations (± 5%) in this loading were applied to determine the sensitivity of the response to the composition of this layer (Figure 53), which is seen to have a weak energy dependence.
10-2 10-1 100 101 102 103 104 105 106 107
En (eV)
0.3
0.5
1
2
4
7
RH
*(10
) (nS
v-1)
ρ = 0.98 g cm-3 (+6.5%)
ρ = 0.9246 g cm-3 (+0.5%)
ρ = 0.9154 g cm-3 (-0.5%)
ρ = 0.95 g cm-3 (+3.3%)
ρ = 0.92 g cm-3
FIGURE 51 H*(10) response of the Studsvik 2202D for different CH2 densities
It is seen that the greatest sensitivity to the boron loading of the neoprene is in the 10-100 keV energy range (Figure 53). This is probably caused by the response to those energies deriving mainly from neutrons that have not been fully thermalized at the depth where the boron-loaded neoprene is located. The response hence includes a significant component from neutrons that have sufficient energy for them to pass through the boron-loaded neoprene, but only after substantial attenuation. Changes to the boron loading will hence have a strong influence on the response. The response to lower energy neutrons will be more dependent on the holes in that layer because the neutrons will have a very low probability of passing through the boron-loaded layer. The response to faster neutrons will be more dependent on neutrons that are thermalized closer to the BF3 detector, neutrons that passed through the boron-loaded neoprene relatively easily.

PRACTICAL IMPLICATIONS OF NEUTRON SURVEY INSTRUMENT PERFORMANCE
68
-1.0 0.0 1.0 2.0 3.0 4.0 5.0 6.0 7.0CH2 density change (%)
0.7
0.8
0.9
1.0
1.1
1.2
R( ρ
)/R( ρ
= 0
.92
g cm
-3)
241Am-Be
20 MeV
1 keV
25.3 meV
252Cf
FIGURE 52 Response of the Studsvik 2202D as a function of polyethylene density normalized to the response for the manufacturer’s specified density of 0.92 g cm-2 for three selected neutron energies and two radionuclide sources
3.3.3 Perturbation of cross sections Given a perfect geometrical description of an instrument, and complete knowledge of the composition of its materials, there would still be uncertainties beyond the Monte Carlo statistics associated from the calculations. These derive from imperfect descriptions of the physics, an area that is of greatest concern for electron transport, and from uncertainties in the cross-section data.
Most of the cross-sections used in the modelling are ENDF/B-VI or in some cases the ENDF/B-V data. These are the best data available, but there are still uncertainties associated with their evaluations. In general, uncertainties are quoted only for the total cross-section, which is somewhat unsatisfactory, because the uncertainties on the cross-sections for different reactions and their angular distributions are all very important.
A number of elements are significant in the modelling of these instruments. Perhaps the most significant is hydrogen, since it is critical in the thermalization of the neutron field so that it can be detected in the BF3 tube. Small uncertainties in the cross-section could have a significant impact on the response. The quoted uncertainty on the ENDF/B-VI
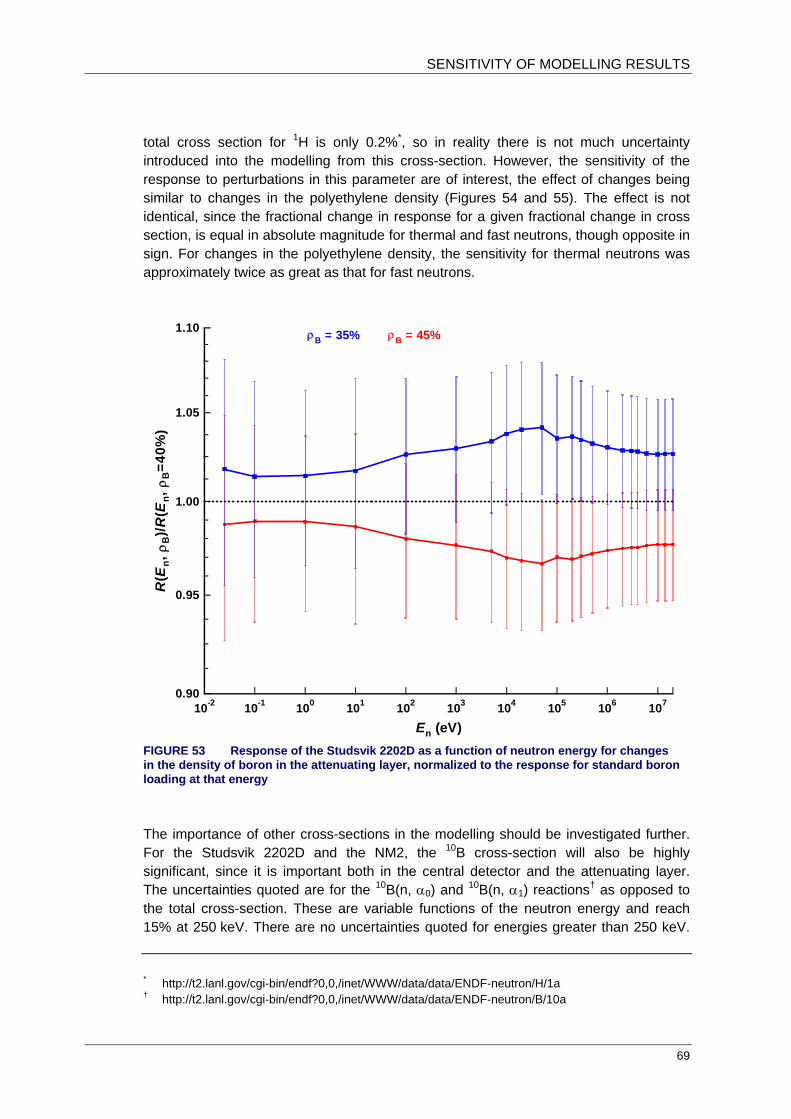
SENSITIVITY OF MODELLING RESULTS
69
total cross section for 1H is only 0.2%*, so in reality there is not much uncertainty introduced into the modelling from this cross-section. However, the sensitivity of the response to perturbations in this parameter are of interest, the effect of changes being similar to changes in the polyethylene density (Figures 54 and 55). The effect is not identical, since the fractional change in response for a given fractional change in cross section, is equal in absolute magnitude for thermal and fast neutrons, though opposite in sign. For changes in the polyethylene density, the sensitivity for thermal neutrons was approximately twice as great as that for fast neutrons.
10-2 10-1 100 101 102 103 104 105 106 107
En (eV)
0.90
0.95
1.00
1.05
1.10
R(E
n, ρ
B)/R
(En,
ρB=4
0%)
ρB = 35% ρB = 45%
FIGURE 53 Response of the Studsvik 2202D as a function of neutron energy for changes in the density of boron in the attenuating layer, normalized to the response for standard boron loading at that energy
The importance of other cross-sections in the modelling should be investigated further. For the Studsvik 2202D and the NM2, the 10B cross-section will also be highly significant, since it is important both in the central detector and the attenuating layer. The uncertainties quoted are for the 10B(n, α0) and 10B(n, α1) reactions† as opposed to the total cross-section. These are variable functions of the neutron energy and reach 15% at 250 keV. There are no uncertainties quoted for energies greater than 250 keV.
* http://t2.lanl.gov/cgi-bin/endf?0,0,/inet/WWW/data/data/ENDF-neutron/H/1a † http://t2.lanl.gov/cgi-bin/endf?0,0,/inet/WWW/data/data/ENDF-neutron/B/10a
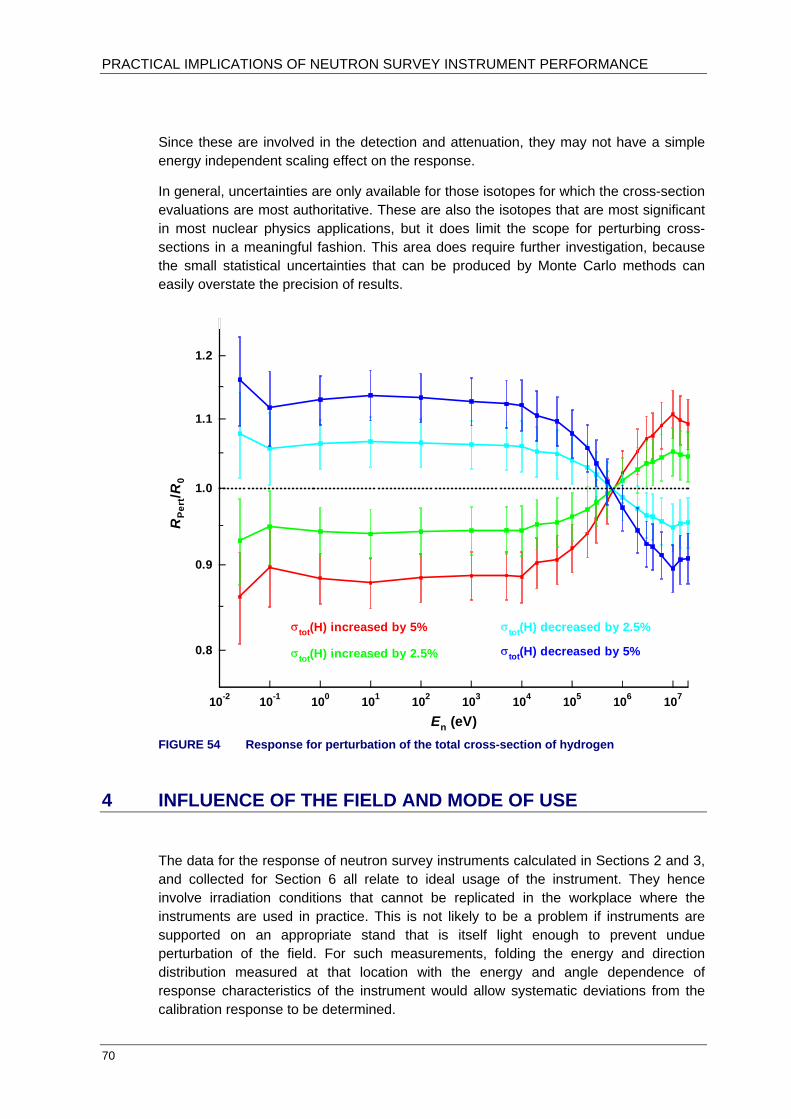
PRACTICAL IMPLICATIONS OF NEUTRON SURVEY INSTRUMENT PERFORMANCE
70
Since these are involved in the detection and attenuation, they may not have a simple energy independent scaling effect on the response.
In general, uncertainties are only available for those isotopes for which the cross-section evaluations are most authoritative. These are also the isotopes that are most significant in most nuclear physics applications, but it does limit the scope for perturbing cross-sections in a meaningful fashion. This area does require further investigation, because the small statistical uncertainties that can be produced by Monte Carlo methods can easily overstate the precision of results.
10-2 10-1 100 101 102 103 104 105 106 107
En (eV)
0.8
0.9
1.0
1.1
1.2
RP
ert/R
0
σtot(H) decreased by 5%σtot(H) increased by 2.5%
σtot(H) increased by 5% σtot(H) decreased by 2.5%
FIGURE 54 Response for perturbation of the total cross-section of hydrogen
4 INFLUENCE OF THE FIELD AND MODE OF USE
The data for the response of neutron survey instruments calculated in Sections 2 and 3, and collected for Section 6 all relate to ideal usage of the instrument. They hence involve irradiation conditions that cannot be replicated in the workplace where the instruments are used in practice. This is not likely to be a problem if instruments are supported on an appropriate stand that is itself light enough to prevent undue perturbation of the field. For such measurements, folding the energy and direction distribution measured at that location with the energy and angle dependence of response characteristics of the instrument would allow systematic deviations from the calibration response to be determined.

INFLUENCE OF THE FIELD AND MODE OF USE
71
Such practice might be expected for detailed measurements at locations of particular interest. However, that is not the main use for neutron survey instruments, which are more commonly used to survey the dose rates at a large number of locations within a facility. This will commonly be performed in hand-held mode, in which case the user may strongly perturb the field by providing shielding, moderation and inscatter. If the field is strongly directional and the user is aware of its primary direction, then the shielding and moderation will be of negligible importance, but inscatter could be significant. If, however, the user is unaware of the primary direction of the field, then they could perturb the field, and hence the instrument reading, significantly. Additionally, many fields will involve extended or multiple sources, plus substantial scattering, so a primary direction may not be definable or significant. In such instances hand held use may inevitably perturb the reading substantially.
-6 -4 -2 0 2 4 6 8Percentage change to σ(H)tot or ρ (CH2)
0.8
0.9
1.0
1.1
1.2
RP
ert/R
0
241Am-Be
1 keV
25.3 meV
20 MeV
252Cf
FIGURE 55 Comparison between perturbation of polyethylene density (open markers) and hydrogen cross-section (solid markers)
If the user is aware of the potential effect on the response that could be caused by their holding the instrument, but they do not have an appropriate stand available, then they may simply place the instrument on the floor. This is not ideal, because it means that the measurement is not taking place at a height where the human torso would be during normal working activities. It is not a very satisfactory way of measuring H*(10) as a

PRACTICAL IMPLICATIONS OF NEUTRON SURVEY INSTRUMENT PERFORMANCE
72
means of estimating effective dose because perturbation of the field by the floor may affect the reading of the instrument.
There are very many user-instrument-field orientations that could be considered. Additional considerations such as the effect of the floor and walls, other scattering bodies and the size of the user make a full study of these effects exhaustive. Hence, in this work, we concentrate on modelling:
a An instrument placed on a concrete floor b A person holding the instrument, standing on a concrete floor c A person holding an instrument, in different orientations
There is far greater scope for modelling of these influences on the response of neutron survey instruments. No reports have been found for previous studies of these effects, so this is an important new area of study: most prior work has focussed on ideal situations, which do not represent the general use of neutron survey instruments in the workplace. Measurements to systematically investigate these effects are probably impractical, so this is an area where the Monte Carlo modelling is of primary interest.
4.1 Influence of a concrete floor
It is not representative of any common practical situation for a point source to be simulated with an instrument sitting on the floor. If a radionuclide source were being used in calibration, then the calibration laboratory would undoubtedly have a stand for the instrument. It is also not very probable that a user conducting a survey would encounter a bare point source. Consequently, point sources were ruled out for studies of the influence of the floor on the instrument reading.
Plane parallel beams in the horizontal plane do not impinge on the floor, so their study is meaningless. They could be applied for a large range of angles outside the horizontal plane, but that would require a lot of work in order to generate fields with little practical significance. Hence, it was considered preferable for an isotropically emitted source to be modelled. This was emitted, inwardly directed but otherwise isotropic, from the upper hemisphere of a large sphere (Figure 56). At the centre of the sphere, sitting on a concrete floor, was an NM2B lying with its axis of symmetry in the horizontal plane. Air was used for the space between the concrete floor and the source, and for spaces within the NM2B.
There are a number of options for simulating a user holding the instrument, most of which would be over-complex. Perhaps the simplest model of a basic human form is the BOttle Manikin ABsorption (BOMAB) phantom (ISO, 2001b), which consists of ten cylindrical pieces to simulate head, neck, thorax, abdomen, thighs (x2), calves (x2) and arms (x2). These are generally made from hollow cylinders that can be filled with solutions containing radionuclides for the calibration of whole body monitors.
The MCNP model of the BOMAB phantom used in this study differed from the standard version because it was composed of solid ICRU 4-element tissue (ICRU, 1985), instead of hollow, water-filled polyethylene cylinders. This change to the material makes the
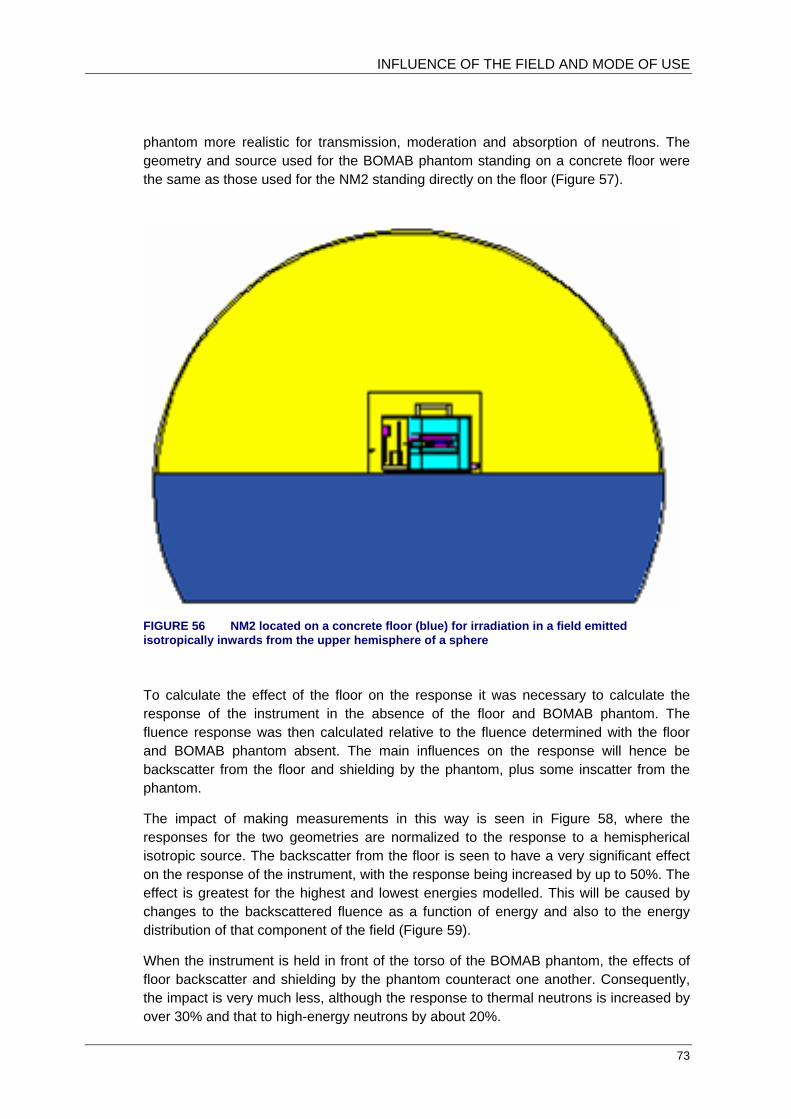
INFLUENCE OF THE FIELD AND MODE OF USE
73
phantom more realistic for transmission, moderation and absorption of neutrons. The geometry and source used for the BOMAB phantom standing on a concrete floor were the same as those used for the NM2 standing directly on the floor (Figure 57).
FIGURE 56 NM2 located on a concrete floor (blue) for irradiation in a field emitted isotropically inwards from the upper hemisphere of a sphere
To calculate the effect of the floor on the response it was necessary to calculate the response of the instrument in the absence of the floor and BOMAB phantom. The fluence response was then calculated relative to the fluence determined with the floor and BOMAB phantom absent. The main influences on the response will hence be backscatter from the floor and shielding by the phantom, plus some inscatter from the phantom.
The impact of making measurements in this way is seen in Figure 58, where the responses for the two geometries are normalized to the response to a hemispherical isotropic source. The backscatter from the floor is seen to have a very significant effect on the response of the instrument, with the response being increased by up to 50%. The effect is greatest for the highest and lowest energies modelled. This will be caused by changes to the backscattered fluence as a function of energy and also to the energy distribution of that component of the field (Figure 59).
When the instrument is held in front of the torso of the BOMAB phantom, the effects of floor backscatter and shielding by the phantom counteract one another. Consequently, the impact is very much less, although the response to thermal neutrons is increased by over 30% and that to high-energy neutrons by about 20%.

PRACTICAL IMPLICATIONS OF NEUTRON SURVEY INSTRUMENT PERFORMANCE
74
These results show that the response in an isotropic field will be significantly increased for all energies by placing it on the floor. It would hence be of interest to model the sensitivity of the response of the instrument to its height above the floor. In this example, the field does have a height dependence owing to the influence of the floor, but in a real workplace this would also be influenced by the source or sources of radiation plus the room geometry: bodies that are providing scatter, shielding and moderation will all cause inhomogeneities in the radiation field.
FIGURE 57 NM2 held by an operator (BOMAB phantom) standing on a concrete floor (blue) in an isotropic field
4.2 Influence of a person on the instrument reading
The results presented in Section 4.1 are a preliminary attempt to understand the problems associated with the presence of a user when a measurement is being made. The presence of a concrete floor makes the calculations somewhat unsatisfactory, because the field is perturbed by the floor and hence ceases to be monoenergetic. In this section, the floor is omitted and plane parallel beams incident in the horizontal plane are used to model the angle dependence of the effect and also to construct a response to a rotationally isotropic field. A spherically isotropic field is also used, which is quite artificial in the absence of a floor, but it does allow the field that is to be calculated to be defined properly.
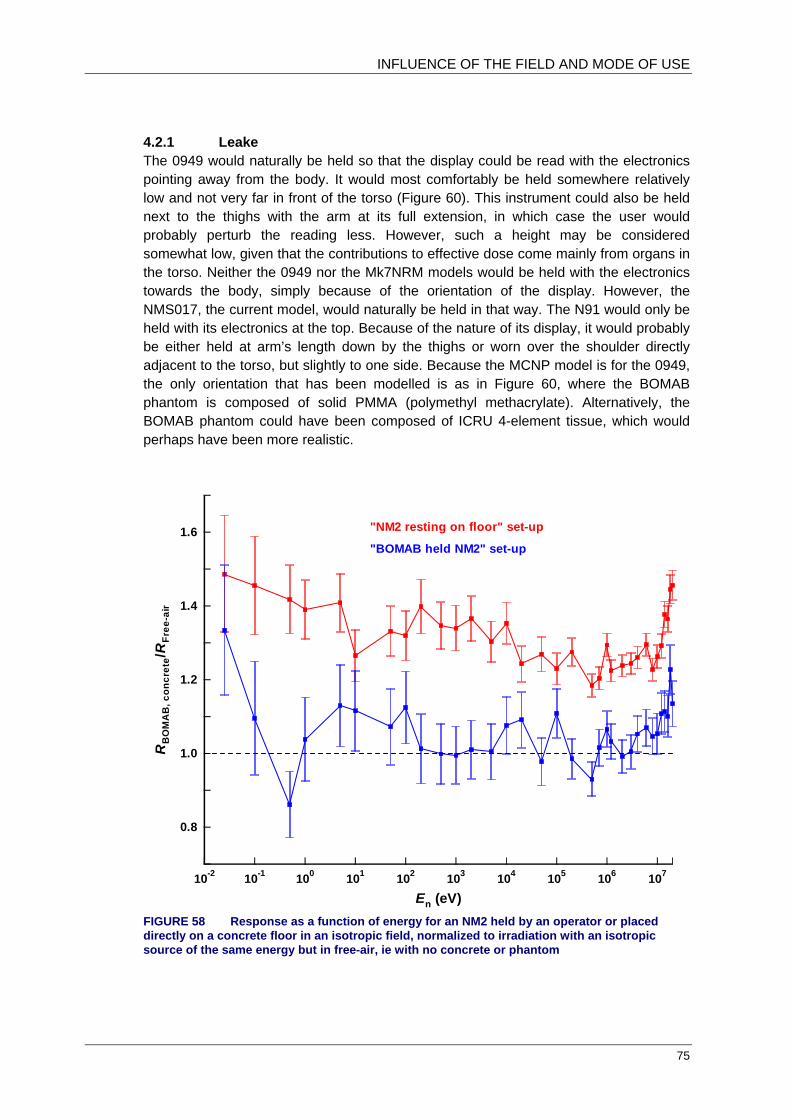
INFLUENCE OF THE FIELD AND MODE OF USE
75
4.2.1 Leake The 0949 would naturally be held so that the display could be read with the electronics pointing away from the body. It would most comfortably be held somewhere relatively low and not very far in front of the torso (Figure 60). This instrument could also be held next to the thighs with the arm at its full extension, in which case the user would probably perturb the reading less. However, such a height may be considered somewhat low, given that the contributions to effective dose come mainly from organs in the torso. Neither the 0949 nor the Mk7NRM models would be held with the electronics towards the body, simply because of the orientation of the display. However, the NMS017, the current model, would naturally be held in that way. The N91 would only be held with its electronics at the top. Because of the nature of its display, it would probably be either held at arm’s length down by the thighs or worn over the shoulder directly adjacent to the torso, but slightly to one side. Because the MCNP model is for the 0949, the only orientation that has been modelled is as in Figure 60, where the BOMAB phantom is composed of solid PMMA (polymethyl methacrylate). Alternatively, the BOMAB phantom could have been composed of ICRU 4-element tissue, which would perhaps have been more realistic.
10-2 10-1 100 101 102 103 104 105 106 107
En (eV)
0.8
1.0
1.2
1.4
1.6
RB
OM
AB
, con
cret
e/R
Free
-air
"BOMAB held NM2" set-up
"NM2 resting on floor" set-up
FIGURE 58 Response as a function of energy for an NM2 held by an operator or placed directly on a concrete floor in an isotropic field, normalized to irradiation with an isotropic source of the same energy but in free-air, ie with no concrete or phantom

PRACTICAL IMPLICATIONS OF NEUTRON SURVEY INSTRUMENT PERFORMANCE
76
The angles chosen to indicate the different field directions (Figure 61) relate to the instrument: they are θ as specified in Section 2.1.1. Hence, 0° represents irradiation from behind, since the user is in this case holding the reference direction of the instrument facing towards their torso.
10-9 10-8 10-7 10-6 10-5 10-4 10-3 10-2 10-1 1 101 102
En (eV)
10-4
10-3
10-2
10-1
1.0
Φi/l
n(E
i+1/
Ei)
"NM2 resting on floor" set-up
"BOMAB held NM2" set-up
Source: 252Cf
FIGURE 59 ISO 252Cf energy distribution and energy distributions at the measurement positions with the instrument absent. The low energy contribution derives from scatter from the floor and phantom.
Two fields have been used to determine the effect of the 0949 being held in this manner, one very hard the other very soft. The hard field chosen is the 252Cf spontaneous fission source (Section 5.2), whereas to provide a contrast a highly moderated field from the Calder Hall control room has also been modelled (Section 5.4.1). These fields were specified in the MCNP source card, so they were the actual source used for the Monte Carlo modelling.
For both the fields used, the response from 0° (postero-anterior) is seen to be very low, almost irrespective of field hardness (Figure 62 and Table 16): for the 252Cf field the response is only 7% of the response to a 252Cf source from that direction in the absence of the BOMAB. For the Calder Hall field, the relative response is only 2% of the unperturbed response.
If a user were performing a survey in a hard fission field, then the field could be strongly directional, although the source may be very extended. The 0° orientation represents a
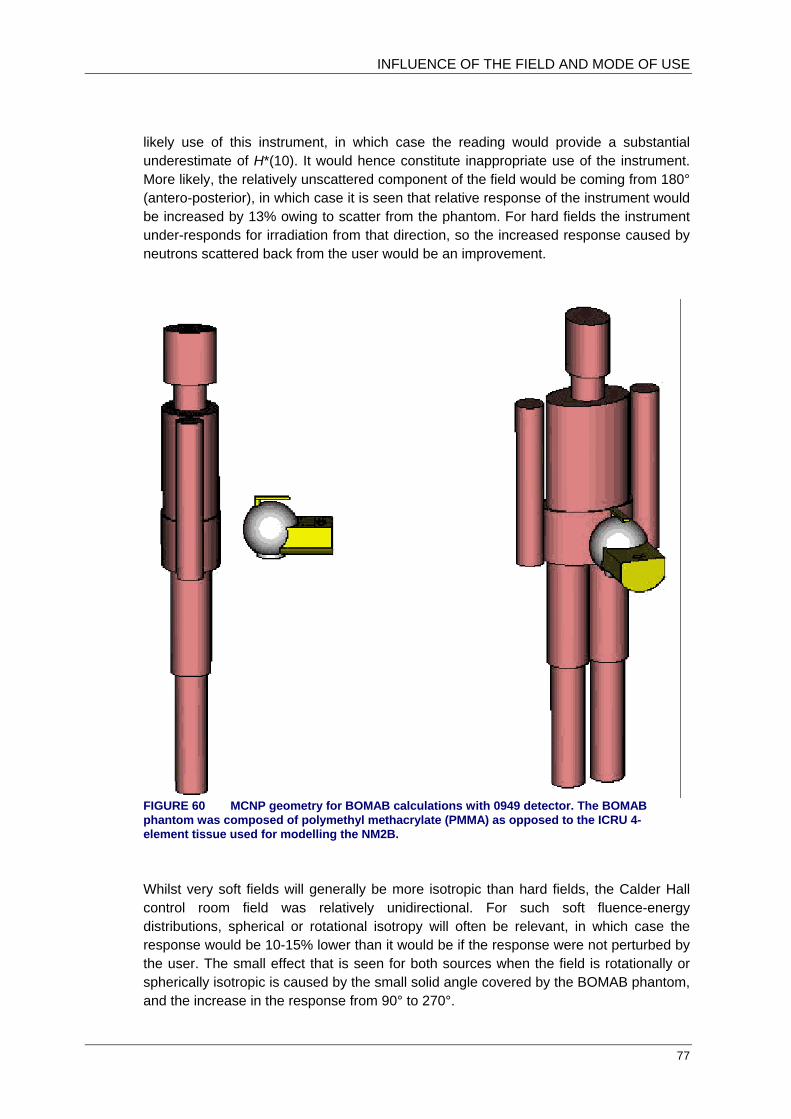
INFLUENCE OF THE FIELD AND MODE OF USE
77
likely use of this instrument, in which case the reading would provide a substantial underestimate of H*(10). It would hence constitute inappropriate use of the instrument. More likely, the relatively unscattered component of the field would be coming from 180° (antero-posterior), in which case it is seen that relative response of the instrument would be increased by 13% owing to scatter from the phantom. For hard fields the instrument under-responds for irradiation from that direction, so the increased response caused by neutrons scattered back from the user would be an improvement.
FIGURE 60 MCNP geometry for BOMAB calculations with 0949 detector. The BOMAB phantom was composed of polymethyl methacrylate (PMMA) as opposed to the ICRU 4-element tissue used for modelling the NM2B.
Whilst very soft fields will generally be more isotropic than hard fields, the Calder Hall control room field was relatively unidirectional. For such soft fluence-energy distributions, spherical or rotational isotropy will often be relevant, in which case the response would be 10-15% lower than it would be if the response were not perturbed by the user. The small effect that is seen for both sources when the field is rotationally or spherically isotropic is caused by the small solid angle covered by the BOMAB phantom, and the increase in the response from 90° to 270°.

PRACTICAL IMPLICATIONS OF NEUTRON SURVEY INSTRUMENT PERFORMANCE
78
0°
180°
90°
FIGURE 61 BOMAB phantom with the 0949 held in front of the torso, with the angles of incidence shown, taken from the reference direction of the instrument.
4.2.2 NM2 A number of options are available for modelling the response of the NM2 when held by an operator. Whilst ideally, if it is to be held at all when in use, it would be held at arm’s length away from the body, the mass of the instrument makes that position almost impossible to sustain for significant durations. Hence, only situations where the instrument is held close to the body have been considered in this section.
4.2.2.1 Held horizontally in front, 252Cf The NM2 could be hand-held for measurements in several different orientations. The first of these that was simulated has the instrument held in front of the torso, with the electronics facing the user so that the display can be read. This would require considerable strength, since the NM2 is very heavy, but it is conceivable that the user could hold the instrument in this way. In practice, it could be the preferable orientation in

INFLUENCE OF THE FIELD AND MODE OF USE
79
terms of the instrument’s response, because the instrument over-responds to thermal neutrons for incidence through the electronics. It is highly unlikely that the instrument would be held horizontally, with the electronics facing away from the body.
FIGURE 62 Effect of a BOMAB phantom on the response of the 0949 for 252Cf and gas cooled reactor (Calder Hall control room) fields as a function of irradiation angle (0° = postero-anterior), and for spherically and rotationally isotropic beams
TABLE 16 The effect of a BOMAB phantom on the response of the 0949 for 252Cf and Calder Hall control room fields as a function of irradiation angle (0° = postero-anterior), and for spherically and rotationally isotropic beams
Angle or isotropy 252Cf: RBOMAB/Rfree air Calder Hall control room: RBOMAB/Rfree air 0° 0.0702 (0.0019)¶ 0.0201 (0.0036)¶
45° 0.687 (0.014)¶ 0.528 (0.029)¶
90° 1.087 (0.017)¶ 1.026 (0.037)¶
135° 1.066 (0.018)¶ 1.134 (0.043)¶
180° 1.133 (0.018)¶ 1.163 (0.040)¶
Spherical isotropy 0.895 (0.013)¶ 0.921 (0.051)¶
Rotational isotropy 0.859 (0.014)¶ 0.879 (0.035)¶
Type A uncertainty, coverage factor = 1
The MCNP input geometry is illustrated in Figure 63. As with the 0949, the angles of incidence have been fixed to the instrument, which because of the different symmetry of the instrument causes a reflection of the angles relative to the user. 0° is now directed towards the front of the BOMAB phantom, whereas for the comparable 0949

PRACTICAL IMPLICATIONS OF NEUTRON SURVEY INSTRUMENT PERFORMANCE
80
calculations 0° is incidence on the back of the phantom. For this orientation there is left-right symmetry, so 90° is equivalent to 270°.
The influence of the BOMAB phantom on the response of the NM2B (Table 17 and Figure 64) is seen to be similar to that observed for the 0949 (Table 16 and Figure 62). The apparent attenuation provided by the phantom is marginally less, which is probably an indication of the higher response of the NM2B to thermal neutrons when irradiated through the electronics, compared to that of the 0949 from its reference direction (Figure 64). The increase caused by the presence of the BOMAB phantom for irradiation from the front is significantly larger for the 0949 than it is for the NM2B, probably because of the increased shielding of the phantom by the NM2B. Because the NM2B is longer, and its electronics will be held close to the body whereas those of the 0949 are plausibly held further from the body, the active volume of the NM2B is further from the user than is that of the 0949. This probably also influences the magnitude of the effect for irradiation from the front, but it is most evident for irradiation from “back-left” (45° for the 0949 and 135° for the NM2B), for which the NM2 response is unperturbed by the phantom and the 0949 is reduced by 30%.
FIGURE 63 NM2B held in front of the torso, horizontally, with the electronics facing towards the user. Note that the angles of incidence have been taken from the reference directions of θ for the NM2 and 0949, so there is a front-back reflection in the angles relative to those used for the 0949.
4.2.2.2 NM2 held in front, vertically, 252Cf If the NM2 is to be held in front of the torso, it will more likely be held in a vertical orientation (Figure 65). This is mainly because it will be easier to hold and read the
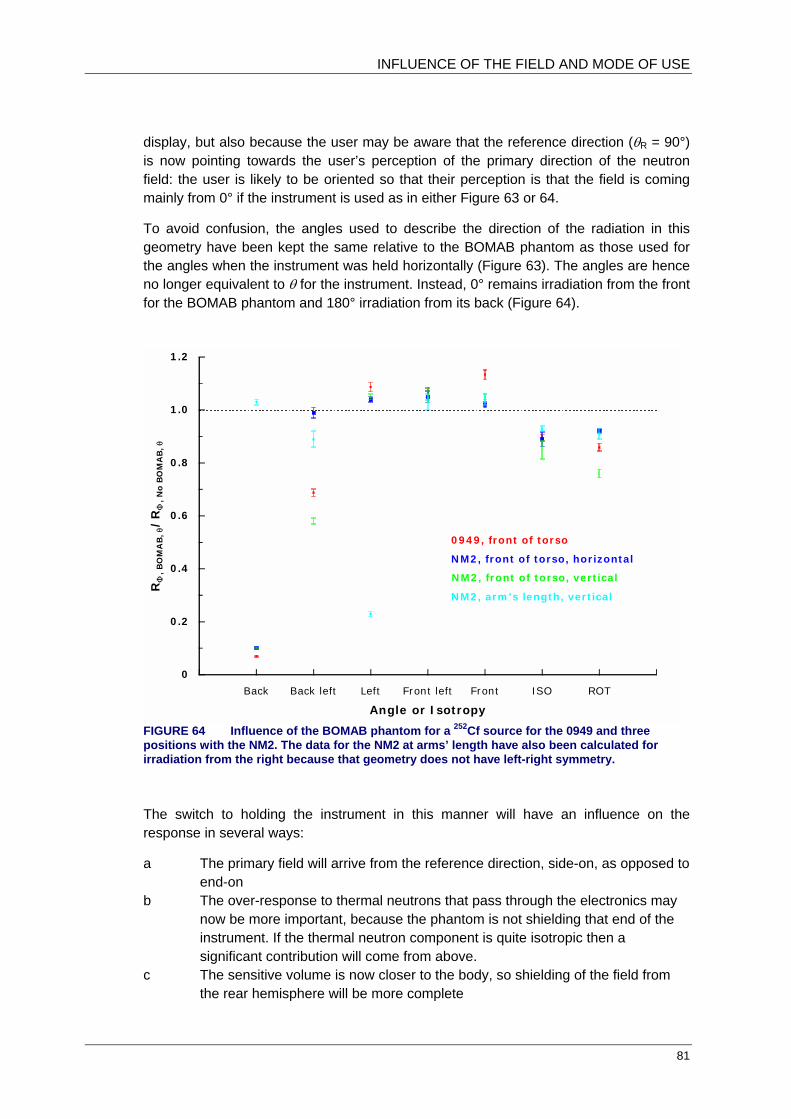
INFLUENCE OF THE FIELD AND MODE OF USE
81
display, but also because the user may be aware that the reference direction (θR = 90°) is now pointing towards the user’s perception of the primary direction of the neutron field: the user is likely to be oriented so that their perception is that the field is coming mainly from 0° if the instrument is used as in either Figure 63 or 64.
To avoid confusion, the angles used to describe the direction of the radiation in this geometry have been kept the same relative to the BOMAB phantom as those used for the angles when the instrument was held horizontally (Figure 63). The angles are hence no longer equivalent to θ for the instrument. Instead, 0° remains irradiation from the front for the BOMAB phantom and 180° irradiation from its back (Figure 64).
Back Back left Left Front left Front ISO ROT
0
0.2
0.4
0.6
0.8
1.0
1.2
RΦ
, B
OM
AB
, θ/
RΦ
, N
o B
OM
AB
, θ
Angle or Isotropy
0949, front of torso
NM2, front of torso, horizontal
NM2, front of torso, vertical
NM2, arm's length, vertical
FIGURE 64 Influence of the BOMAB phantom for a 252Cf source for the 0949 and three positions with the NM2. The data for the NM2 at arms’ length have also been calculated for irradiation from the right because that geometry does not have left-right symmetry.
The switch to holding the instrument in this manner will have an influence on the response in several ways:
a The primary field will arrive from the reference direction, side-on, as opposed to end-on
b The over-response to thermal neutrons that pass through the electronics may now be more important, because the phantom is not shielding that end of the instrument. If the thermal neutron component is quite isotropic then a significant contribution will come from above.
c The sensitive volume is now closer to the body, so shielding of the field from the rear hemisphere will be more complete

PRACTICAL IMPLICATIONS OF NEUTRON SURVEY INSTRUMENT PERFORMANCE
82
d The response to the component that has passed through the phantom may be lower, because the electronics are not facing towards the body
e The response to the in-scatter may be lower because the electronics no longer face the body
The most significant of these factors is seen to be the proximity to the body. This causes the response for irradiation from 135° (back-left) and 225° (back-right) (see Figure 65) to be significantly lower (Table 18). Consequently, the responses to rotationally and spherically isotropic fields are also lower.
TABLE 17 NM2 held in front of the torso, horizontally, with the electronics facing towards the user (see Figure 63), for a 252Cf energy distribution
Angle or isotropy Ratio: RBOMAB/Rfree air 0° 1.02 (0.01)¶
45° 1.05 (0.02)¶
90° 1.04 (0.01)¶
135° 0.99 (0.02)¶
180° 0.10 (0.02)¶
Rotational isotropy 0.92 (0.01)¶
Spherical isotropy 0.89 (0.03)¶
Type A uncertainty, coverage factor = 1
TABLE 18 Ratio of the NM2 response with and without the BOMAB phantom present when held in front of the torso with the instrument’s axis of symmetry vertical
Angle or isotropy Ratio: RBOMAB/Rfree air 0° 1.05 (0.01)¶
45° 1.06 (0.02)¶
90° 1.05 (0.01)¶
135° 0.58 (0.01)¶
180° 0.100 (0.002)¶
ROT 0.76 (0.02)¶
ISO 0.85 (0.03)¶
Type A uncertainty, coverage factor = 1
4.2.2.3 NM2 held at arm’s length Owing to its mass, if an NM2 were to be held during a survey, it would probably be held at arm’s length down by the side, next to the thighs (Figure 66). This would be particularly true if the instrument were used for extensive surveys, which would be more likely to be hand-held to save time. Unlike the other orientations for the NM2 or 0949, this orientation does not have left-right symmetry. Hence, 90° is very different from 270°. There is almost front back symmetry, but the displacement of the handle on top of the NM2 means that the instrument would be held slightly towards the front.
The BOMAB phantom in the model carries the NM2 in its right hand, which will be most common. However, in practice, owing to the weight of the instrument, it is likely that both

INFLUENCE OF THE FIELD AND MODE OF USE
83
right and left handed people will switch hands from time to time. If they have chosen their original orientation carefully, they will need to be aware that changing hands will have an impact.
FIGURE 65 NM2 held in front of the torso with the instrument’s axis of symmetry vertical
Whilst a handle is also provided for carrying the NM2 with its axis of symmetry in the horizontal plane, when that is done the display cannot be read. It hence seems unlikely that a survey would be performed whilst using that handle, so those calculations have not been performed.
Holding the NM2B at arm’s length by the side is less satisfactory than holding it in front of the torso in terms of the height used, because in that position it is lower than all of the main radiosensitive organs. However, the measurement will involve less perturbation of the reading for most fields, because the thighs will provide most shielding, and their mass is much less than that of the torso. This is evident from the result that the minimum response calculated is 23% of the phantom absent response (Table 19), whereas those for the other orientations were only 10% (Figure 64 and Table 17).

PRACTICAL IMPLICATIONS OF NEUTRON SURVEY INSTRUMENT PERFORMANCE
84
However, the true minimum is probably for an angle of about 100°, not 90°, since the instrument is held slightly forwards.
FIGURE 66 Most plausible hand-held orientation for the NM2B with an extended arm, by the side, using the handle on the end of the instrument. All directions in the horizontal plane are equivalent to the reference direction (90°) of the instrument. 0° points down and 180° up.
TABLE 19 NM2 held with an extended arm, by the side for a 252Cf energy distribution Angle or isotropy Ratio: RBOMAB/Rfree air 0° 1.04 (0.02)†
45° 1.03 (0.03)†
90° 0.230 (0.002)†
135° 0.89 (0.03)†
180° 1.03 (0.01)†
225° 1.00 (0.03)†
270° 1.02 (0.01)†
315° 1.02 (0.04)†
ROT 0.91 (0.02)†
ISO 0.93 (0.01)†
† Type A uncertainty, coverage factor = 1
4.2.2.4 Response to monoenergetic neutrons The data calculated so far using 252Cf energy distributions are interesting, but not easily applied to other workplaces. If the implications of hand held surveys are to be assessed for a wider range of fields, then it is necessary for the response to be calculated for monoenergetic neutrons. This has been done only for the most plausible survey orientation of the NM2: held with an extended arm by the side (Figure 66). The

INFLUENCE OF THE FIELD AND MODE OF USE
85
calculations have been performed for angles of 0°, 45°, 90°, 135°, 180°, 225°, 270°, 315° and a spherically isotropic field. The response ratio is plotted only for a subset of these angles, the isotropic field and for responses for a rotationally isotropic field constructed from the individual angles (Figure 67). Relatively small angular steps are required because of the rapid change in the response for irradiation from about 90°: for neutrons with energies of 1 MeV and below, the under-response for irradiation through the thighs is about 80%.
10-2 10-1 100 101 102 103 104 105 106 107
Neutron energy (eV)
0.2
0.4
0.6
0.8
1.0
1.2
1.4
Rat
io: p
hant
om p
rese
nt to
pha
ntom
abs
ent
0°
90°
ISO
ROT
270°
FIGURE 67 Response ratio of phantom present to phantom absent for the NM2 held with an extended arm by the side. The normalization is to the response at each energy and angle/isotropy with the phantom absent. 0° represents irradiation from the front, 90° from the left and 270° from the right, for a phantom holding the NM2 in its right hand.
This initial representation of the monoenergetic data for the BOMAB phantom holding the NM2B with an extended right arm by its side used normalization to irradiation without the phantom but with the same neutron energy (Figure 67). It hence shows the magnitude of the influence of the phantom on the response of the instrument. Of more relevance is the magnitude of the response relative to the response from the reference direction, without the phantom present (Figure 68). These results show the perturbation for each energy that is caused by the angle of incidence and the phantom.
Normalization to the response from the reference direction shows that the response to an isotropic field for thermal neutrons is 50% higher than for irradiation from the reference direction in ideal calibration conditions. This is, however, similar to the
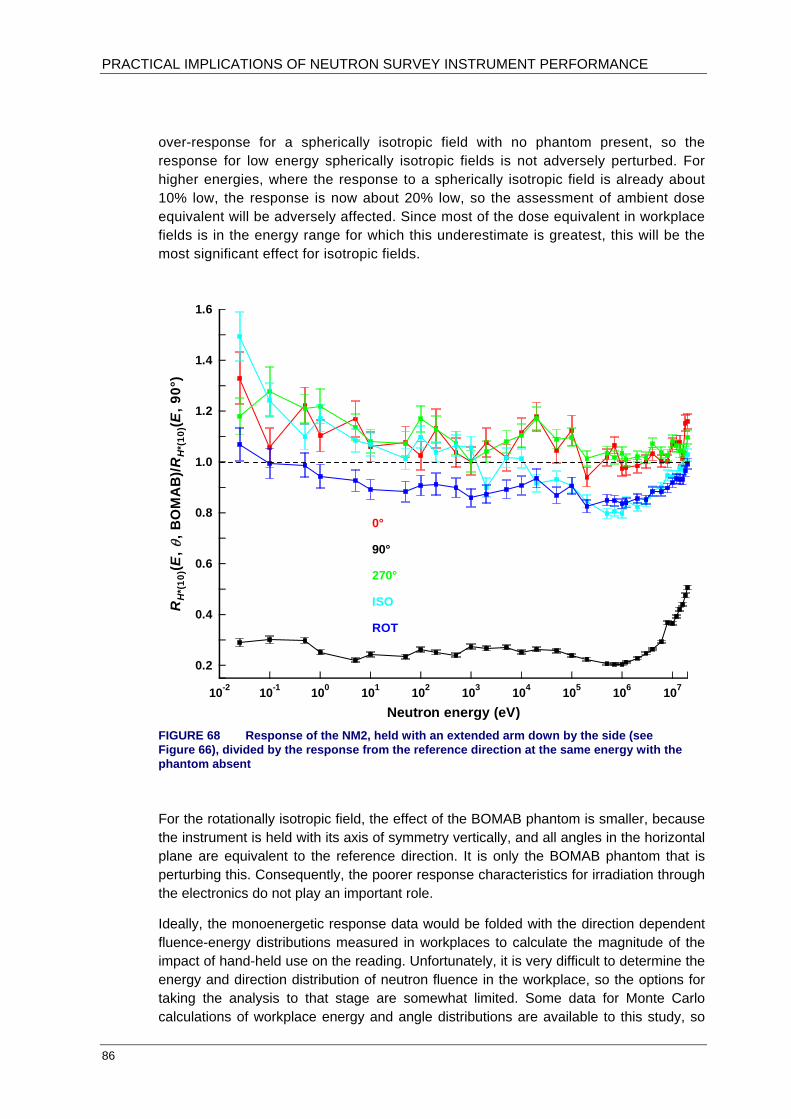
PRACTICAL IMPLICATIONS OF NEUTRON SURVEY INSTRUMENT PERFORMANCE
86
over-response for a spherically isotropic field with no phantom present, so the response for low energy spherically isotropic fields is not adversely perturbed. For higher energies, where the response to a spherically isotropic field is already about 10% low, the response is now about 20% low, so the assessment of ambient dose equivalent will be adversely affected. Since most of the dose equivalent in workplace fields is in the energy range for which this underestimate is greatest, this will be the most significant effect for isotropic fields.
10-2 10-1 100 101 102 103 104 105 106 107
Neutron energy (eV)
0.2
0.4
0.6
0.8
1.0
1.2
1.4
1.6
RH
*(10
)(E, θ
, BO
MA
B)/R
H*(
10)(E
, 90°
)
0°
90°
ISO
ROT
270°
FIGURE 68 Response of the NM2, held with an extended arm down by the side (see Figure 66), divided by the response from the reference direction at the same energy with the phantom absent
For the rotationally isotropic field, the effect of the BOMAB phantom is smaller, because the instrument is held with its axis of symmetry vertically, and all angles in the horizontal plane are equivalent to the reference direction. It is only the BOMAB phantom that is perturbing this. Consequently, the poorer response characteristics for irradiation through the electronics do not play an important role.
Ideally, the monoenergetic response data would be folded with the direction dependent fluence-energy distributions measured in workplaces to calculate the magnitude of the impact of hand-held use on the reading. Unfortunately, it is very difficult to determine the energy and direction distribution of neutron fluence in the workplace, so the options for taking the analysis to that stage are somewhat limited. Some data for Monte Carlo calculations of workplace energy and angle distributions are available to this study, so

INFLUENCE OF THE FIELD AND MODE OF USE
87
those data have been applied (see Section 7.10). Since those fields do not have detailed direction distribution information, it has been necessary to use the energy and angle dependence of response for irradiation from the front, 0° or antero-posterior (AP), plus rotational and spherical isotropy to assess the influence of the user on the reading. This will be representative of typical hand-held use of a survey instrument, because the user is likely to be aware of the dominant direction of the field.
The normalized H*(10) responses of the instrument (Figure 69), calculated using the H*(10) for the unperturbed field, show that the differences between the isotropic fields and irradiation from the front are quite small compared to that for irradiation through the phantom (90°). The response for the rotationally isotropic field is always smaller than the response for irradiation from the front, whereas that for the spherically isotropic field is the largest for low energies. This is probably caused by the greater inscatter for isotropic irradiation, which more than compensates for shielding by the phantom for the lowest energies.
10-2 10-1 100 101 102 103 104 105 106 107
En (eV)
10-1
1.0
10
H*(
10) (
nSv-1
)
ISO
0°
90°
ROT
270°
FIGURE 69 Normalized H*(10) response of the NM2B used as in Figure 66, held with an extended arm down by the side. In this orientation irradiation from 90° is directly through the thighs of the user, so the response from that direction is most significantly perturbed.
PRACTICAL IMPLICATIONS OF NEUTRON SURVEY INSTRUMENT PERFORMANCE
88
5 NEUTRON ENERGY DISTRIBUTIONS
5.1 Fluence-energy distributions
Measurements of neutron energy distributions in the workplace are necessary for a full interpretation of instrument or dosemeter readings at those locations because the quantities ambient dose equivalent, H*(10), and effective dose, E, are complex functions of neutron energy. The relationship between these quantities is also complex, with effective dose being smaller than ambient dose equivalent for most workplace fields, though not all.
In general, an accurate assessment of ambient dose equivalent will provide a conservative assessment of effective dose. However, no instrument has a perfect ambient dose equivalent response, so in order to avoid excessive overestimates in some fields the calibration is certain to allow underestimates in other fields. The significance of these can only be assessed if the energy distribution of the field is known.
Measurements of neutron energy distributions in workplaces are complex and expensive procedures that generally involve sequential measurements with a series of detectors at the location of interest. The responses of these detectors are optimized to different parts of the energy range of interest, but there is always overlap between them, and an interest in resolution of the energy range into many more energy bins than the number of detector readings.
The detector readings are transformed into an energy distribution via unfolding (Matzke, 2003). This generally requires pre-information in the form of a plausible energy distribution that can be used as an initial guess. The resultant energy distribution is dependent on the number and types of detectors used for the measurements, the unfolding algorithms and the guess spectrum.
Where the only detector systems that have been used are a Bonner sphere set (Bramblett et al, 1960), the resultant energy distributions have, in general, coarse energy bin structures because of the limited information that is available. Some of these measurements are augmented at high energies by the use of recoil counters that enable much more detailed structure to be determined in the fast-neutron energy region. This is to be noted in many of the energy distributions depicted in this section. In other instances, the use of a Monte Carlo generated guess spectrum has input fine structure that could not have come out of the unfolding process.
The thermal neutron content is generally determined by measuring with detectors shielded and unshielded by cadmium. This only really permits the content of a bin below 0.4 eV to be determined, so commonly this energy range is plotted as a single bin running from 1 meV to 0.4 eV, although the energies selected for the boundaries of the bin do vary. In other cases, a Maxwell-Boltzmann distribution has been assumed for this bin, or it was used in the guess spectrum and has remained in the final unfolded spectrum. This energy range rarely contributes significantly to the total H*(10) so the depiction of this bin is rarely very important in terms of the response of an instrument.

NEUTRON ENERGY DISTRIBUTIONS
89
( ) ( )⎟⎠
⎞⎜⎝
⎛ += +
21 ii
mid,iElnEln
expE
⎟⎟⎠
⎞⎜⎜⎝
⎛−
=+
+
i
i
iimean,i
EE
ln
EEE
1
1
The energy distributions are plotted without uncertainties because in general nothing more than an uncertainty on the total fluence is quoted. It is possible to achieve an uncertainty in the integral fluence of less than ±4% (Alevra, 1994), although the accuracy will depend on many factors, in particular the accuracy with which the individual instrument responses have been determined. The uncertainty on the dose equivalent will inevitably be larger, since the accuracy of the unfolding is very important, especially that for the fast neutron energy range where conversion coefficients change very rapidly. This uncertainty on dose equivalent has been estimated as being ±15% or less (Alevra et al, 1997). The energy distributions in this section come from trusted references, so some, especially those which have been aided by good Monte Carlo guess energy-distributions, may have smaller uncertainties than this. Since we do not have access to the variations caused by changing the guess energy distribution, it is not possible to assess its influence on the response of an instrument within this work.
For the Monte Carlo energy distributions, a statistical uncertainty is known for each energy bin. However, this still under-represents the true uncertainty on the content of the bin because there are many other sources of uncertainty: the accuracy of the descriptions of the materials and their dimensions will have a significant impact on the accuracy of the calculated energy distribution and the total fluence.
The plots in this section are of paired fluence and H*(10) energy-distributions. In each case, the fluence plots are actually normalized to the logarithmic energy-width of the bin, which corrects for changes in bin-width, which would otherwise generate the appearance of false structure in the energy distribution. This normalization by the logarithmic bin-width is performed after the total fluence in the energy distribution has been normalized to 1.0. The area under each curve is hence constant.
The H*(10) distributions have been generated using a 4-point log-log Lagrangian interpolation routine with the ICRU/ICRP conversion coefficients (ICRU, 1998; ICRP, 1996). The energy for the ith bin (Ei → Ei+1) has been taken as the logarithmic mid point of the bin according to Equation 1.
1
For a 1/E spectrum, which would look flat when normalized to the logarithmic bin-width, the mean energy of the bin, Ei,mean is given by Equation 2. For narrow energy bins, the difference between the mid-point and mean of the bin is very small, but for broad energy distributions the difference can become significant. If the response of the instrument or the conversion coefficient changes significantly between Ei and Ei+1, then the selection of the mid-point or mean energy will become significant. The mean energy of the bin has been used to calculate the fluence averaged mean energy quoted in the tables in this section of the report.
2
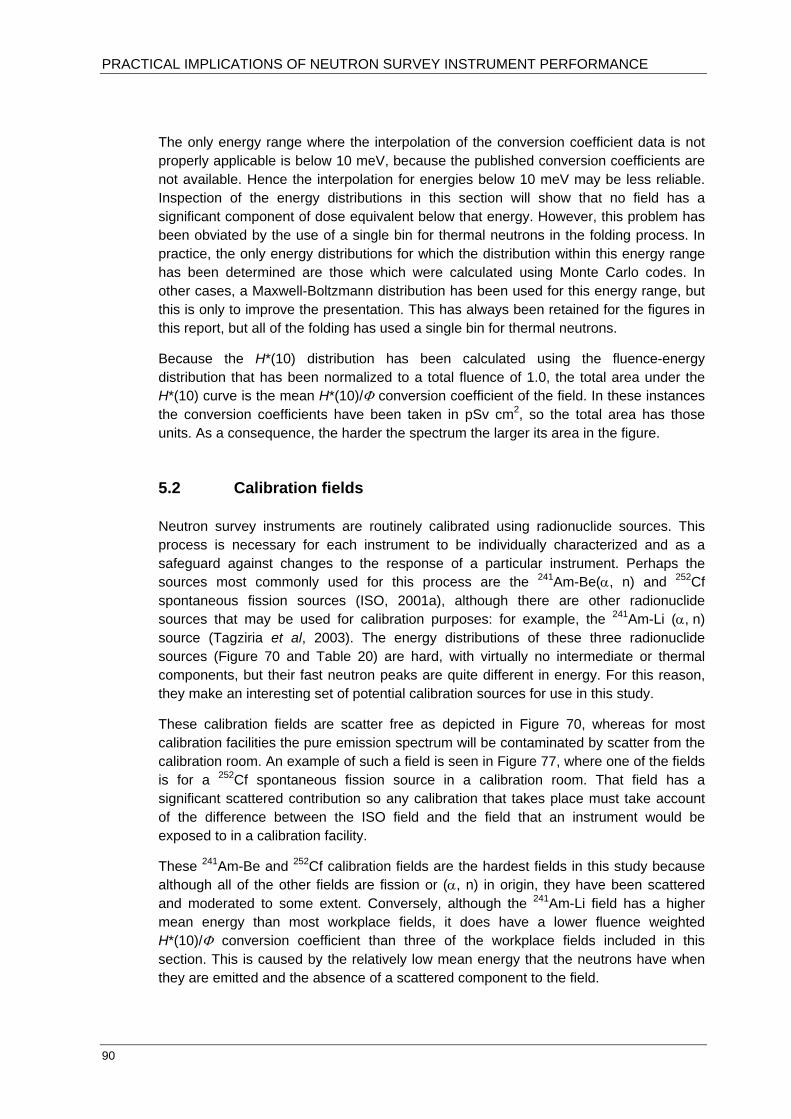
PRACTICAL IMPLICATIONS OF NEUTRON SURVEY INSTRUMENT PERFORMANCE
90
The only energy range where the interpolation of the conversion coefficient data is not properly applicable is below 10 meV, because the published conversion coefficients are not available. Hence the interpolation for energies below 10 meV may be less reliable. Inspection of the energy distributions in this section will show that no field has a significant component of dose equivalent below that energy. However, this problem has been obviated by the use of a single bin for thermal neutrons in the folding process. In practice, the only energy distributions for which the distribution within this energy range has been determined are those which were calculated using Monte Carlo codes. In other cases, a Maxwell-Boltzmann distribution has been used for this energy range, but this is only to improve the presentation. This has always been retained for the figures in this report, but all of the folding has used a single bin for thermal neutrons.
Because the H*(10) distribution has been calculated using the fluence-energy distribution that has been normalized to a total fluence of 1.0, the total area under the H*(10) curve is the mean H*(10)/Φ conversion coefficient of the field. In these instances the conversion coefficients have been taken in pSv cm2, so the total area has those units. As a consequence, the harder the spectrum the larger its area in the figure.
5.2 Calibration fields
Neutron survey instruments are routinely calibrated using radionuclide sources. This process is necessary for each instrument to be individually characterized and as a safeguard against changes to the response of a particular instrument. Perhaps the sources most commonly used for this process are the 241Am-Be(α, n) and 252Cf spontaneous fission sources (ISO, 2001a), although there are other radionuclide sources that may be used for calibration purposes: for example, the 241Am-Li (α, n) source (Tagziria et al, 2003). The energy distributions of these three radionuclide sources (Figure 70 and Table 20) are hard, with virtually no intermediate or thermal components, but their fast neutron peaks are quite different in energy. For this reason, they make an interesting set of potential calibration sources for use in this study.
These calibration fields are scatter free as depicted in Figure 70, whereas for most calibration facilities the pure emission spectrum will be contaminated by scatter from the calibration room. An example of such a field is seen in Figure 77, where one of the fields is for a 252Cf spontaneous fission source in a calibration room. That field has a significant scattered contribution so any calibration that takes place must take account of the difference between the ISO field and the field that an instrument would be exposed to in a calibration facility.
These 241Am-Be and 252Cf calibration fields are the hardest fields in this study because although all of the other fields are fission or (α, n) in origin, they have been scattered and moderated to some extent. Conversely, although the 241Am-Li field has a higher mean energy than most workplace fields, it does have a lower fluence weighted H*(10)/Φ conversion coefficient than three of the workplace fields included in this section. This is caused by the relatively low mean energy that the neutrons have when they are emitted and the absence of a scattered component to the field.

NEUTRON ENERGY DISTRIBUTIONS
91
Harder workplace fields than these do exist. For example, higher energy neutrons may be generated by accelerators or they may derive from cosmic rays. However, such fields are outside the remit of this study. Observation of the response characteristics of the instruments in this work show that the H*(10) response is very low for high-energy neutrons so none of the main instruments studied in detail here are really appropriate for use in those environments. The SWENDI is an exception, since the inclusion of tungsten in the moderator gives it a higher response to high energy neutrons because of the W(n, xn) that result.
10-1 100 101 102 103 104 105 106 107
Neutron energy (eV)
0
0.1
0.2
0.3
0.4
0.5
0.6
Φi/l
n(E
i+1/
Ei)
0
100
200
H*(
10) i/
ln(E
i+1/
Ei)
241Am-Be241Am-Li
252Cf
FIGURE 70 The three ‘calibration’ radionuclide source energy distributions plotted with total fluences normalised to unity. The areas under the H*(10) curves are proportional to the mean conversion coefficient of the field.
TABLE 20 Mean fluence to H*(10) conversion coefficients and fluence-weighted mean energy of three bare radionuclide sources. The H*(10) values have been calculated using the latest ICRU 57 (ICRU, 1998) and ICRP 74 (ICRP, 1996) conversion coefficients.
Source H*(10)/Φ (pSv cm2) Emean (keV) 241Am-Be 391 4160 252Cf 385 2130 241Am-Li 243 478

PRACTICAL IMPLICATIONS OF NEUTRON SURVEY INSTRUMENT PERFORMANCE
92
5.3 Simulated workplace fields
The differences between the bare radionuclide source energy distributions and those encountered in the workplace has led to the development of simulated workplace fields for calibration and characterization purposes. Three examples of such fields have been included in this study, a heavy water moderated 252Cf field (ISO, 1989) and two fields that are available at IRSN, Cadarache, France: CANEL (Chartier et al, 1992; Lacoste and Gressier, 2004; Gressier et al, 2004) and SIGMA (Lacoste et al, 2004) (Figure 71 and Table 21). These fields are designed to be very much softer than the bare radionuclide source fields that are also used for calibration purposes. They are hence more representative of the fields in which instruments are used.
10-3 10-2 10-1 100 101 102 103 104 105 106 107
Neutron energy (eV)
0
0.1
0.2
0.3
0.4
Φi/l
n(E
i+1/
Ei)
0
10
20
30
40
50
H*(
10) i/
ln(E
i+1/
Ei)
CANEL
252Cf(D2O)
SIGMA
FIGURE 71 Fluence and H*(10) distributions for three simulated workplace fields. The fluence distributions have been normalized to a total fluence of 1.0 and the area under the curve for the H*(10) distribution is proportional to the H*(10)/Φ conversion coefficient for the field.
All three of these fields have been developed with considerations of the differences between energy distributions of bare radionuclide sources and work place fields. However, they do not attempt to simulate workplace direction distributions. All are relatively unidirectional, though the source is more extended than for a bare radionuclide source. Such soft energy distributions, if encountered in a true workplace, would be expected to have quite isotropic direction distributions. Hence, the response measured

NEUTRON ENERGY DISTRIBUTIONS
93
with a dosemeter or instrument in these fields may not be representative of that which would be indicated in an equivalent workplace. However, they do provide useful calibration facilities, because the field in a true workplace will vary with time and hence it would be pointless attempting to characterize it for use as a calibration field. Additionally, calibration in a real workplace would be disruptive to normal working practice. Consequently, these simulated workplace fields have found favour for the calibration of instruments and dosemeters.
The fields shown for SIGMA and CANEL are not those that have been previously published but recent determinations that have used MCNP-4C2 calculations (Lacoste and Gressier, 2004) and Bonner sphere measurements (Gressier et al, 2004). The SIGMA field, which is generated using four 241Am-Be sources embedded in a large block of graphite, is the softest of these fields, but still contains about 50% of its dose equivalent in the fast neutron energy range.
TABLE 21 Mean fluence to H*(10) conversion coefficients and fluence-weighted mean energy of three bare radionuclide sources. The H*(10) values have been calculated using the latest ICRU 57 (ICRU, 1998) and ICRP 74 (ICRP, 1996) conversion coefficients.
Source H*(10)/Φ (pSv cm2) Emean (keV)
CANEL 44.5 75.2
SIGMA 22.3 79.0 252Cf(D2O) 108 539
5.4 Reactor fields
5.4.1 UK gas cooled reactor energy distributions These fields measured at UK gas cooled reactors (GCRs) are important for this study because of the number of workers at UK power plants who are exposed to neutrons. These fields are relevant to the Central Index of Dose Information (CIDI) categories ‘Nuclear Reactor Operations’ and ‘Nuclear Reactor Maintenance’, which account for 28.4% of the classified workers who are monitored for neutron doses via personal dosemeters (APPENDIX E). Those categories contribute 20.1% of the collective neutron dose so significant errors in the readings of neutron survey instruments could have a significant impact on the designation of controlled areas within these workplaces.
The fields in this category have been kept separate from the other reactor fields because they are all measured at the UK designed GCRs, whereas the remaining reactor fields are European determinations of pressurized water reactor (PWR) fields. These GCR fields are significantly softer the PWR fields which also indicates that they are best treated as a separate category.
The category comprises eight energy distributions (Table 22, Figure 72 and Figure 73) measured at Dungeness A, Hinkley Point A, Trawsfynydd and Calder Hall. Four were measured by AEAT (Delafield and Perks, 1992) and three by NPL (Bartlett et al, 1992; Thomas, 1996). The mean energies and conversion coefficients for the fields are given in Table 22. The extreme softness of these fields can be seen from a comparison with

PRACTICAL IMPLICATIONS OF NEUTRON SURVEY INSTRUMENT PERFORMANCE
94
SIGMA (Figure 71 and Table 21), which has a higher mean energy and conversion coefficient than any of this group.
TABLE 22 UK Gas cooled reactor fields Reference Field Emean (keV) H*(10)/Φ (pSv cm2)
Dungeness A boiler cell 8.61 15.8
Hinkley A filter gallery 5.96 14.3
Dungeness A walkway 16.7 21.4 Delafield and Perks, 1992
Dungeness A roof 17.9 22.0
Calder Hall 1 2.21 12.0 Bartlett et al, 1992 Calder Hall 2 4.26 13.3
Thomas, 1996 Trawsfynydd filter gallery 17.4 21.1
10-3 10-2 10-1 100 101 102 103 104 105 106 107
Neutron energy (eV)
0
0.05
0.10
0.15
Φi/l
n(E i
+1/E
i)
0
1
2
3
4
5
Hi/l
n(E i
+1/E
i)
Dungeness A boiler cellHinkley A filter galleryDungeness A walkwayDungeness A roof
FIGURE 72 Fluence-energy and H*(10) distributions measured by AEAT at UK gas cooled reactors
AEAT (Delafield and Perks, 1992) used a combination of multispheres, proton recoil counters and an alpha recoil counter to make their measurements of the fields in this category (Figure 72): multispheres were used for energies below 50 keV and recoil counters for higher energies. One unusual feature of the reference from which these energy distributions come is the treatment of thermal neutrons: these are expressed as a fraction of the total H*(10) in the field. This has been converted to fluence, but when
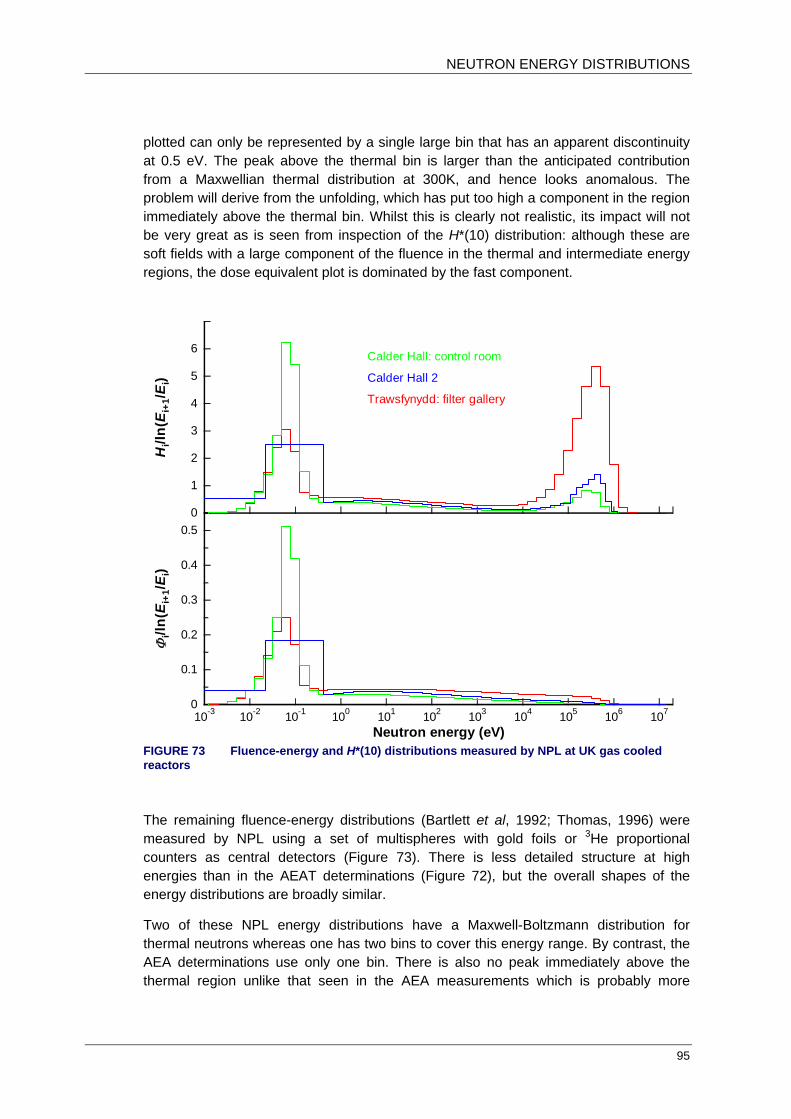
NEUTRON ENERGY DISTRIBUTIONS
95
plotted can only be represented by a single large bin that has an apparent discontinuity at 0.5 eV. The peak above the thermal bin is larger than the anticipated contribution from a Maxwellian thermal distribution at 300K, and hence looks anomalous. The problem will derive from the unfolding, which has put too high a component in the region immediately above the thermal bin. Whilst this is clearly not realistic, its impact will not be very great as is seen from inspection of the H*(10) distribution: although these are soft fields with a large component of the fluence in the thermal and intermediate energy regions, the dose equivalent plot is dominated by the fast component.
10-3 10-2 10-1 100 101 102 103 104 105 106 107
Neutron energy (eV)
0
0.1
0.2
0.3
0.4
0.5
Φi/l
n(E
i+1/
Ei)
0
1
2
3
4
5
6
Hi/l
n(E
i+1/
Ei)
Calder Hall: control room
Calder Hall 2
Trawsfynydd: filter gallery
FIGURE 73 Fluence-energy and H*(10) distributions measured by NPL at UK gas cooled reactors
The remaining fluence-energy distributions (Bartlett et al, 1992; Thomas, 1996) were measured by NPL using a set of multispheres with gold foils or 3He proportional counters as central detectors (Figure 73). There is less detailed structure at high energies than in the AEAT determinations (Figure 72), but the overall shapes of the energy distributions are broadly similar.
Two of these NPL energy distributions have a Maxwell-Boltzmann distribution for thermal neutrons whereas one has two bins to cover this energy range. By contrast, the AEA determinations use only one bin. There is also no peak immediately above the thermal region unlike that seen in the AEA measurements which is probably more

PRACTICAL IMPLICATIONS OF NEUTRON SURVEY INSTRUMENT PERFORMANCE
96
realistic. Overall, the content of the thermal bins is much more significant in the NPL energy distributions.
There is a difference in the high-energy ends of the fluence-energy distributions, which do not show the peaked structure in the NPL measurements. Part of this may be explained by the different reactors and locations within reactors. However, the locations ought to be sufficiently similar for the fields to show broadly similar features. The difference probably arises because of the different detector systems used, and the fine bin structure in the AEAT energy distributions.
When the NPL energy distributions are plotted in terms of dose equivalent, their appearance is markedly transformed: the thermal component remains significant, but the rapid rise in the conversion coefficients with energy for fast neutrons produces a peak that is not present in the fluence-energy distribution. This peak is slightly higher in energy than that in the AEA Technology energy distributions which will be the most significant factor in terms of dose equivalent response of the instruments.
5.4.2 PWR energy distributions: Gosgen and Ringhals The only pressurized water reactor (PWR) in the UK is Sizewell B. It would hence be preferable if some energy distributions from that reactor were available but there are none in the public domain. Instead, eight energy distributions measured at a variety of locations around PWRs in Sweden and Switzerland will be used (Figure 74 and Table 23). Whilst they were not measured in the UK they share common features, which makes it reasonable to assume that they are an acceptable model for the fields at Sizewell B.
Two of the energy distributions were measured inside the containment at the Gosgen PWR in Switzerland using a combination of multispheres to cover the energy range up to 50 keV, and above that energy, hydrogen filled recoil counters and an alpha recoil counter (Delafield and Perks, 1992). However, although there is very little fluence above 100 keV, and practically none above 1 MeV, most of the dose equivalent is contributed by neutrons with energies greater than 100 keV.
The other two fields were measured at the Ringhals site in Sweden (Lindborg and Klein, 1995; Bartlett et al, 1995; Lindborg et al, 1995): position G is inside the containment of PWR 2, whereas position L is inside the airlock in PWR 4. These were obtained from the results of five laboratories that used a combination of Bonner spheres and proton recoil counters. The fields are also very soft, although they have a much flatter structure in the region below 100 keV.
The remaining two fields were also measured at Ringhals by NPL in the same work (Lindborg and Klein, 1995; Bartlett et al, 1995; Lindborg et al, 1995). These have a Maxwell-Boltzmann distribution used for the thermal energy bin, unlike the single bin that is used for the other four energy-distributions. They are otherwise similar in appearance to the PTB determinations at Ringhals.

NEUTRON ENERGY DISTRIBUTIONS
97
10-3 10-2 10-1 100 101 102 103 104 105 106 107
Neutron energy (eV)
0
0.05
0.10
Φi/l
n(E i
+1/E
i)
0
5
10
15H
i/ln(
E i+1
/Ei) Gosgen 2
Ringhals L
Gosgen 1
Ringhals G
Ringhals F
Ringhals A
FIGURE 74 Fluence-energy and H*(10) distributions measured inside the containment at the Ringhals PWR in Sweden and the Gosgen PWR in Switzerland
TABLE 23 PWR fields Reference Field Emean (keV) H*(10)/Φ (pSv cm2)
Gosgen 1 31.1 42.2 Aroua, 1994
Gosgen 2 22.3 30.0
Ringhals G (PTB) 13.5 19.3
Ringhals L (PTB) 42.5 38.1
Ringhals F (NPL) 32.8 30.0 Lindborg and Klein, 1995
Ringhals A (NPL) 30.6 28.7
5.5 Fuel cycle and source production fields
These categories relate to the production of fuel rods, reprocessing of spent fuel and radionuclide source production. These are all activities where the work typically takes place in glove boxes, which limits the possibilities for shielding the worker. They are hence quite hard fields which would often have a very significant antero-posterior component whilst the worker is in position. Inverse square considerations make it likely that this will be the strongest component of the field, but there may be a number of sources in the room, so the situation may be more complex.

PRACTICAL IMPLICATIONS OF NEUTRON SURVEY INSTRUMENT PERFORMANCE
98
5.5.1 Fuel processing, reprocessing and storage These fields (Table 24) are among the most important for the UK, because BNFL Sellafield accounts for a high fraction of the UK occupational neutron personal dose equivalent. These seven energy distributions were measured at locations in the fuel cycle. They are much harder fields than the Gas Cooled Reactor group, but were measured at locations with varying levels of shielding. This is perhaps the most significant group of energy distributions available, owing to their applicability to the CIDI categories of ‘Nuclear Fuel Reprocessing’ (16.1% of workers, 41.8% of collective neutron dose) and ‘Nuclear Fuel Fabrication’ (2.6% of workers, 2.6% of collective neutron dose) (Appendix E).
TABLE 24 Fuel cycle and source production fields Reference Field Emean (keV) H*(10)/Φ (pSv cm2)
Pu finishing plant 1# 424 133
Pu finishing plant 2$ 73.8 34.8
Pu finishing plant 3¶ 1320 241
Pu finishing plant 4† 669 202
Bartlett et al, 1992
Fuel pin assembly 897 201
Posny, 1994 PuF4 work station 450 167
Alevra, 1989 Fission material depot 640 169
# Health physics office
$ Corridor
¶ Precipitation cell
† Furnace cell
Five of these energy distributions (Figure 75) were measured at a UK reprocessing and fuel fabrication plant (Bartlett et al, 1992). They are from the same work as those plotted in Figure 73, but are seen to have a significant fast neutron component. Despite their being quite hard fields, most contain very little fluence above 5 MeV. The exception is the fuel pin assembly field, which has a fast peak that is markedly higher in energy than those of the other energy distributions in this group. The reliability of the response data beyond 5 MeV may be more important for this field, but even this energy distribution has very little fluence around 10 MeV.
The other two energy distributions in this category (Figure 76) have narrower energy bins, but show quite comparable features. They come from a French PuF4 workstation (Posny, 1994) and a fission material depot in Germany (Alevra, 1989). Both measurements used Bonner sphere sets, but the French group also used proton recoil counters, which accounts for their better fast neutron energy resolution. Both of them use a Maxwellian distribution for the thermal neutrons, which will have been assumed rather than unfolded. The relatively large Maxwellian thermal peaks in the fluence-energy distributions are seen to be of no real significance in terms of dose equivalent.
Although neither of these fields were measured at UK facilities, they should be representative of the areas in which UK workers in the reprocessing industry are exposed. There is a larger highly scattered component in both of these energy

NEUTRON ENERGY DISTRIBUTIONS
99
distributions than in most of the UK measured energy distributions, but they are in fact harder than one of that set.
10-3 10-2 10-1 100 101 102 103 104 105 106 107
Neutron energy (eV)
0
0.1
0.2
0.3
0.4
0.5
Φi/l
n(E i
+1/E
i)
0
50
100
150
200
Hi/l
n(E i
+1/E
i)
Pu Finishing Plant, little shielding
Pu Finishing Plant, well shielded
Fuel Pin Assembly, little shielding
Pu Finishing Plant, little shielding
Fuel pin asssembly
FIGURE 75 Fluence-energy and H*(10) distributions measured by NPL in fuel processing, reprocessing and storage areas, reprocessing and storage areas
5.5.2 Source fabrication and source usage areas These are three relatively hard fields, two of which were measured in source fabrication plants (Figure 77 and Table 25). Their hardness derives from the limited shielding which is possible when workers are using glove boxes. These are relevant to the UK workforce, though perhaps less so than in the past owing to the current low level of radionuclide source manufacture: neutron sources are often imported now, so the exact situations for which these energy distributions were measured are no longer so common in the UK. There is a CIDI category ‘Application & Manipulation’ (2002: 0.5% of workers, 2.6% of collective dose) (Appendix E) that specifically covers this type of work, which makes it one of the easier categories to interpret.
These sources, encountered with relatively little moderation, may well be representative of other working environments so these fields may have importance outside the narrow field for which they are directly relevant. For example, workers in the two industrial radiography categories will also have potential for being exposed to moderately shielded radionuclide neutron source fields.

PRACTICAL IMPLICATIONS OF NEUTRON SURVEY INSTRUMENT PERFORMANCE
100
10-3 10-2 10-1 100 101 102 103 104 105 106 107
Neutron energy (eV)
0
0.1
0.2
Φi/l
n(E
i+1/
Ei)
0
20
40
60
80
100
120
Hi/l
n(E
i+1/
Ei)
PuF4 workstation
Fission material depot (FRG)
FIGURE 76 Fluence-energy and H*(10) distributions measured by PTB and IRSN in the fuel cycle
Two of the energy distributions in this category were measured in the source manufacture process (Thomas et al, 1992) using Bonner spheres:
a In the operator position for a glove box containing several 241Am-Be sources. The glove box was located in a row of glove boxes each of which contained 241Am-Be sources. Consequently, this field is the softest of this set, although it is still relatively hard. In this case it may be reasonable to assume that a large part of the scattered component comes from the other glove boxes, so the direction distribution of this field may play an important rôle: the bulk of the fast component is likely to be arriving A-P when the operator is working at the glove box, whilst the thermal peak will be primarily arriving at higher angles of incidence.
b Close to an americium assembly involving eight discs in ceramic form. The field is again very hard, but the fast peak is lower in energy than the others in this group.
The other energy distribution is quite distinct from the remainder: it was measured in an irradiation facility and is simply a bare 252Cf source with room scatter (Alevra et al, 1992). It has been included here, because it is also a relatively unmoderated radionuclide source energy distribution. In its measurement position, the scattered component will be arriving with almost full isotropy, but for other situations where this energy distribution is relevant, this may be less true. This energy distribution was also

NEUTRON ENERGY DISTRIBUTIONS
101
measured using a set of Bonner spheres. This field provides an interesting contrast with the ISO 252Cf energy distribution (Figure 70) since this field is more likely to be representative of that which dosemeters or instruments are exposed to in calibration facilities than the ISO field is. Of course the ISO field will be more applicable when the facility has been specially constructed to minimize scatter.
10-3 10-2 10-1 100 101 102 103 104 105 106 107
Neutron energy (eV)
0
0.1
0.2
0.3
0.4
0
50
100
150
Hi/l
n(E
i+1/
Ei)
Φi/l
n(E
i+1/
Ei)
241Am-Be in glove box
Am ceramic
252Cf in calibration room
FIGURE 77 Fluence-energy and H*(10) distributions measured in source fabrication and usage areas
TABLE 25 Source fabrication and source usage area fields Reference Field Emean (keV) H*(10)/Φ (pSv cm2)
241Am-Be in glove box 763 112 Thomas et al, 1992
241Am ceramic 961 277
Alevra et al, 1992 252Cf in calibration room 1320 260
5.6 Transport flasks
This is an important category including seven fields, which were unfortunately not measured in the UK (Table 26). However, high burn-up spent fuel when contained in transport flasks can generate fields with very high neutron to gamma dose equivalent rate ratios, so these are locations where the neutron dose rate can be of primary

PRACTICAL IMPLICATIONS OF NEUTRON SURVEY INSTRUMENT PERFORMANCE
102
concern. High neutron dose rates have been reported around such flasks, an example being for a measurement near an NTL11 flask bound for BNFL Sellafield, where the ambient dose equivalent rate was 141 µSv h-1 (Bolognese et al, 2004).This category contains two energy distributions measured using Bonner spheres near a transport flask for MOX fuel (Schraube, 1994). Both energy distributions were measured in the “unshielded environment of MOX element transport cask”, and are hence relatively hard (Figure 78). They contain little thermal fluence, but one of them does have quite a large component of its fluence between 100 eV and 100 keV. The absence of thermal neutrons in “MOX transport flask 2”may be caused by the presence of cadmium, but since “MOX transport flask 3” does contain a small thermal neutron contribution the difference between these two energy distributions may derive from uncertainty in the unfolding process. Otherwise, the large intermediate energy components and relatively low energy of the fast peak indicate that the scattering material is high A, so that relatively little energy is lost per collision. If there were significant amounts of low A material present then the thermalization of the field would be much more efficient.
TABLE 26 Fuel flask fields Reference Field Emean (keV) H*(10)/Φ (pSv cm2)
MOX 2 1080 274 Schraube, 1994
MOX 3 608 184
Aroua, 1994 Swiss PWR, 117 cm 311 164
Posny et al, 1992 LK100 La Hague 110 61.6
CLAB D, @ 1 m 68.7 46.9
CLAB E, @ 0.8 m 61.0 46.3 Lindborg & Klein 1995
CLAB P 75.8 57.1
Plotted with the two fields measured around MOX fuel flasks is one of three energy distributions that were measured at different distances from a Swiss PWR transport flask (Aroua, 1994). The two that have been omitted were simply made at different distances from the flask, one closer the other further away. They are very similar so only one of them has been included here. The energy distributions, however, are seen to become slightly softer with increasing distance from the flask. This is because the direct component of the field constitutes a decreasing fraction of the total field as the distance from the flask is increased.
The remaining five fields were measured close to PWR fuel flasks in Sweden (Lindborg and Klein, 1995) and France (Posny, 1992) (Figure 79). Whilst the locations are ostensibly similar to the other three fields, these are considerably softer than the others. This could be because the designs of the flasks provide significantly more shielding but is more likely to derive from a neutron shield placed over the flask or much greater room scatter.
The French field was measured near an LK100 transport flask at the La Hague reprocessing facility (Posny et al, 1992) using a combination of Bonner spheres, proton recoil counters and an NE213 scintillator. The result is a relatively soft field, with a large fluence in the intermediate energy range. The use of the scintillator has allowed greater

NEUTRON ENERGY DISTRIBUTIONS
103
structure to be determined in the fast-neutron energy range. A Maxwell-Boltzmann distribution has been used for the thermal neutron energy range.
10-3 10-2 10-1 100 101 102 103 104 105 106 107
Neutron energy (eV)
0
0.05
0.10
0.15
0.20
0.25
0.30
0.35
Φi/l
n(E i
+1/E
i)
0
20
40
60
80
100
120
140
Hi/l
n(E
i+1/
E i)
MOX transport flask 2
MOX transport flask 3
Swiss PWR @117 cm
FIGURE 78 Fluence-energy and H*(10) distributions measured by GSF near a MOX fuel transport flask and a field measured by PSI near a Swiss PWR fuel flask
The three remaining fields were measured in the same work programme as those from the Ringhals PWR (Lindborg and Klein, 1995), in a large hall at CLAB in Oskarshamn, Sweden, close to a transport cask that contained fuel rods from Ringhals. They are quite soft, with a large part of the fluence in the intermediate energy range. The dip in the fluence in the thermal region is possibly the result of thermal neutron absorbing material, probably cadmium, in the cask or a neutron shield. Despite the large intermediate-energy fluence component in these energy distributions, fast neutrons dominate the dose equivalent plot (Figure 79).
Clearly, more energy distribution measurements need to be made in these work areas, particularly if the use and transport of MOX fuel becomes more widespread. It is not satisfactory that there are no UK measured energy distributions in the public domain. The relevance of the available energy distributions to UK workers is questionable, because the field around fuel flasks will be influenced by the fuel inside, the shielding provided by the flask and scatter from outside the flask. The hardness of these fields indicates that the flasks provide little shielding, although this may not be true for different designs.

PRACTICAL IMPLICATIONS OF NEUTRON SURVEY INSTRUMENT PERFORMANCE
104
10-3 10-2 10-1 100 101 102 103 104 105 106 107
Neutron energy (eV)
0
0.02
0.04
0.06
0.08
0.10
Φi/l
n(E
i+1/
Ei)
0
5
10
15
20
25
30
35
Hi/l
n(E
i+1/
Ei)
CLAB D @ 1 m
CLAB E @ 0.8 m
CLAB P
LK100 La Hague
FIGURE 79 Fluence-energy and H*(10) distributions measured by GSF near a MOX fuel transport flask and a field measured by PSI near a Swiss PWR fuel flask
5.7 Calculated energy distributions
These fields were calculated using the code MCBEND (Answers Software Service, 1996) for the Sellafield MOX plant as depicted in Figure 80 (Haley, 1996; Cooper and Haley, 1998; Bartlett et al, 2001) as part of the design process. The plant to which they relate is now commissioned so these are now real workplaces for which it would be useful to also have measurements of the dose rate and energy distribution. However, as presented here (Figures 81 and 82), these fields are different from all others in this study, because they contain no information from measurements: the SIGMA and CANEL energy distributions were determined using a combination of MCNP-4C calculations and conventional neutron spectrometry.
There is no reason to believe that calculated energy distributions are intrinsically inferior to measured ones since the physics of the neutron transport are well known, as are most of the cross-sections for the materials present in the laboratory. The largest uncertainties may surround the precise geometry, composition of the materials and the source energy distribution. If these are also well known, the uncertainty in the energy distribution may be comparable, or even better than that for the measurements. Indeed, since the responses of the detectors used to make the measurements have often been calculated using Monte Carlo simulations, they too are reliant on the validity of such techniques.
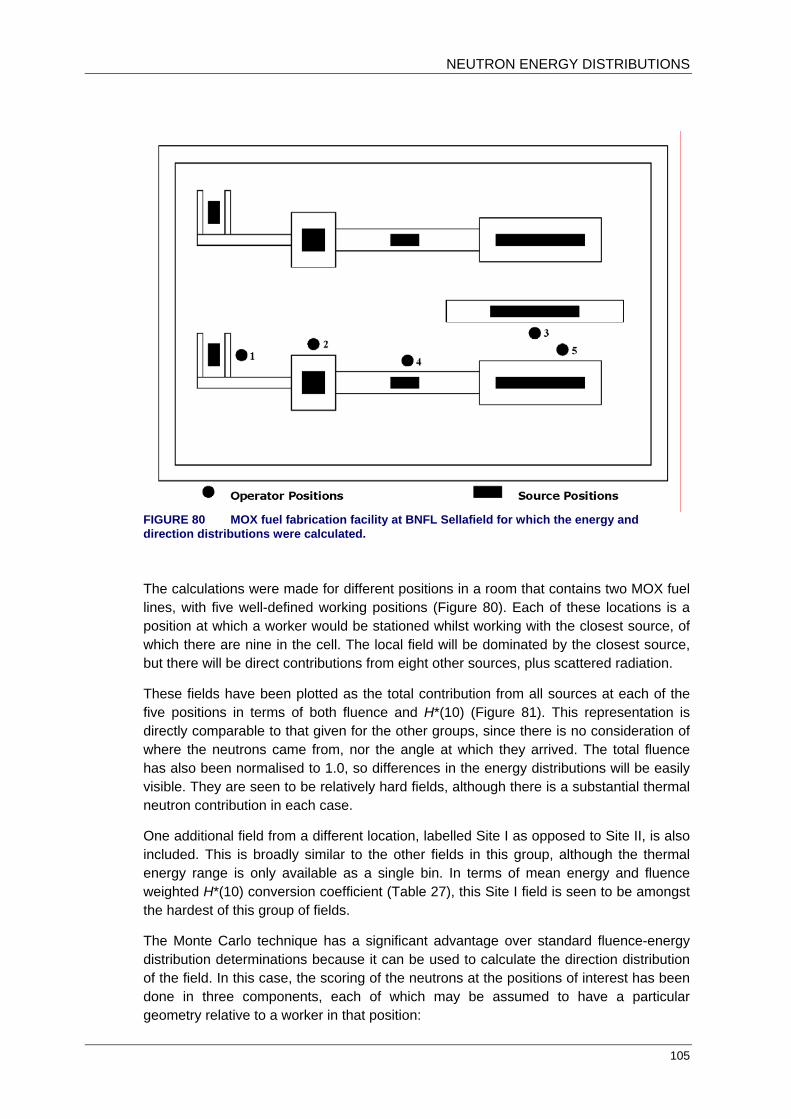
NEUTRON ENERGY DISTRIBUTIONS
105
FIGURE 80 MOX fuel fabrication facility at BNFL Sellafield for which the energy and direction distributions were calculated.
The calculations were made for different positions in a room that contains two MOX fuel lines, with five well-defined working positions (Figure 80). Each of these locations is a position at which a worker would be stationed whilst working with the closest source, of which there are nine in the cell. The local field will be dominated by the closest source, but there will be direct contributions from eight other sources, plus scattered radiation.
These fields have been plotted as the total contribution from all sources at each of the five positions in terms of both fluence and H*(10) (Figure 81). This representation is directly comparable to that given for the other groups, since there is no consideration of where the neutrons came from, nor the angle at which they arrived. The total fluence has also been normalised to 1.0, so differences in the energy distributions will be easily visible. They are seen to be relatively hard fields, although there is a substantial thermal neutron contribution in each case.
One additional field from a different location, labelled Site I as opposed to Site II, is also included. This is broadly similar to the other fields in this group, although the thermal energy range is only available as a single bin. In terms of mean energy and fluence weighted H*(10) conversion coefficient (Table 27), this Site I field is seen to be amongst the hardest of this group of fields.
The Monte Carlo technique has a significant advantage over standard fluence-energy distribution determinations because it can be used to calculate the direction distribution of the field. In this case, the scoring of the neutrons at the positions of interest has been done in three components, each of which may be assumed to have a particular geometry relative to a worker in that position:

PRACTICAL IMPLICATIONS OF NEUTRON SURVEY INSTRUMENT PERFORMANCE
106
a Anterior-Posterior (A-P): direct from the source that the worker is manipulating. This can be assumed to be arriving from the front whilst the worker is actively engaged.
b Rotationally Isotropic (ROT): unscattered neutrons from the other eight sources in the cell. These neutrons are all generated in the same horizontal plane, so they arrive at the worker with crude rotational isotropy.
c Isotropic (ISO): the scattered component from all sources, which arrives effectively with full spherical isotropy, given that it includes scatter from the floor and ceiling.
10-3 10-2 10-1 100 101 102 103 104 105 106 107
Neutron energy (eV)
0
0.05
0.10
0.15
0.20
0.25
Φi/
ln(E
i+1/E
i)
0
25
50
75
Hi/
ln(E
i+1/E
i) Site II, position 1
Site II, position 2
Site II, position 3
Site II, position 4
Site II, position 5
Site I
FIGURE 81 Fluence and H*(10) energy distributions calculated using MCBEND for five different positions in a MOX fuel cell. Total fluence is normalised to 1.0.
When these components of the total energy distribution are plotted in terms of both fluence and dose equivalent, there are seen to be significant differences between the components. For all five locations, the ISO component is significantly softer than either AP or ROT (Figure 82 and Table 27). This is likely to be representative of all workplaces where the unidirectional component of the field has suffered very little in scattering and moderation, whereas neutrons coming from other angles will have a much softer energy-distribution. It is hence possible to use the fields in this group to investigate the implications of the angle dependence of response of the instruments in the workplace.
Monte Carlo calculations can, in principle, be used to generate more detailed and reliable direction distribution data than these. MCNP, for example, can bin the neutrons according to their direction at the point of interest. This would be preferable because the
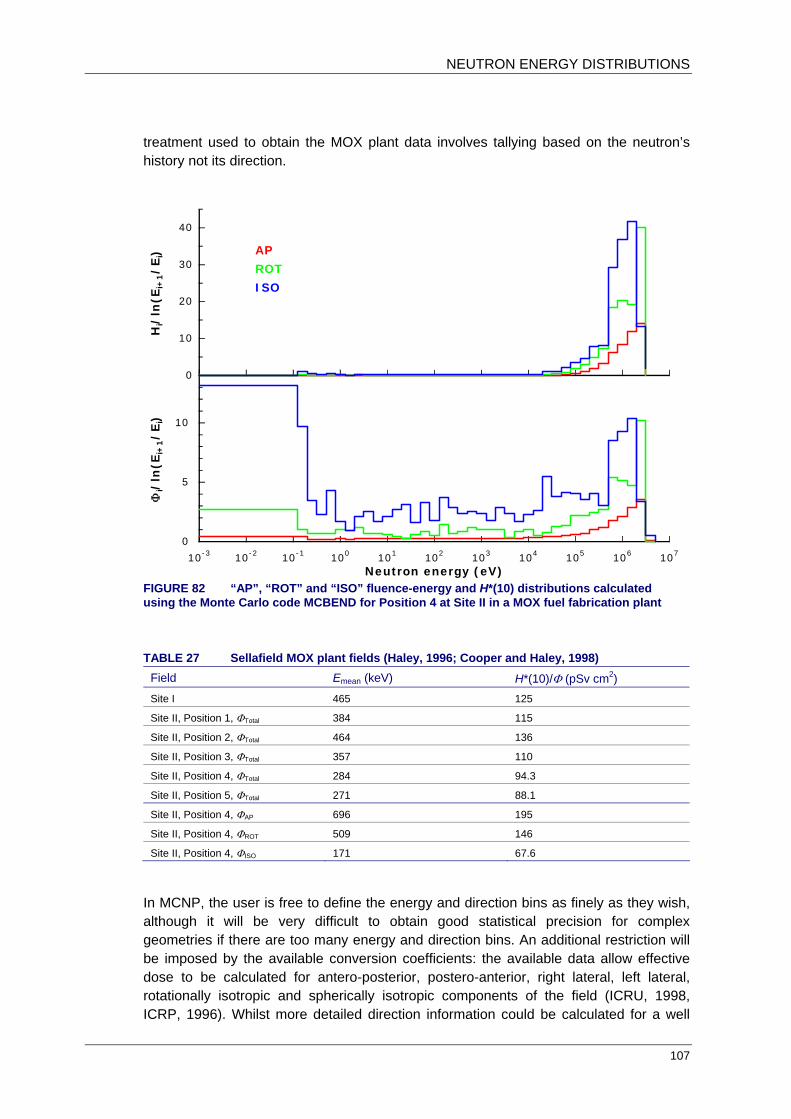
NEUTRON ENERGY DISTRIBUTIONS
107
treatment used to obtain the MOX plant data involves tallying based on the neutron’s history not its direction.
10-3 10-2 10-1 100 101 102 103 104 105 106 107
Neutron energy (eV)
0
5
10
Φi/
ln(E
i+1/E
i)
0
10
20
30
40
Hi/
ln(E
i+1/E
i) AP
ROT
ISO
FIGURE 82 “AP”, “ROT” and “ISO” fluence-energy and H*(10) distributions calculated using the Monte Carlo code MCBEND for Position 4 at Site II in a MOX fuel fabrication plant
TABLE 27 Sellafield MOX plant fields (Haley, 1996; Cooper and Haley, 1998) Field Emean (keV) H*(10)/Φ (pSv cm2) Site I 465 125
Site II, Position 1, ΦTotal 384 115
Site II, Position 2, ΦTotal 464 136
Site II, Position 3, ΦTotal 357 110
Site II, Position 4, ΦTotal 284 94.3
Site II, Position 5, ΦTotal 271 88.1
Site II, Position 4, ΦAP 696 195
Site II, Position 4, ΦROT 509 146
Site II, Position 4, ΦISO 171 67.6
In MCNP, the user is free to define the energy and direction bins as finely as they wish, although it will be very difficult to obtain good statistical precision for complex geometries if there are too many energy and direction bins. An additional restriction will be imposed by the available conversion coefficients: the available data allow effective dose to be calculated for antero-posterior, postero-anterior, right lateral, left lateral, rotationally isotropic and spherically isotropic components of the field (ICRU, 1998, ICRP, 1996). Whilst more detailed direction information could be calculated for a well

PRACTICAL IMPLICATIONS OF NEUTRON SURVEY INSTRUMENT PERFORMANCE
108
specified workplace, the data would need to be subsequently regrouped to form these six components before effective dose could be calculated.
5.8 Summary
The H*(10)/Φ, EAP/Φ, EROT/Φ and EISO/Φ conversion coefficients are summarized in Table 28a for the calibration, simulated workplace and reactor fields, in Table 28b for the other measured fields and in Table 28c for the MCBEND calculated fields. The geometries assumed for effective dose are very crude: the entire field is assumed to be unidirectional A-P, or have complete rotational or spherical isotropy. Whilst this is clearly not accurate, since none of these determinations has any information on the direction distribution it is not possible to treat this aspect of the analysis in a more sophisticated manner.
TABLE 28a Fluence to dose equivalent conversion coefficients for the calibration, simulated workplace and reactor fields. Group Field H*(10)/Φ
(pSv cm2)
EAP/Φ (pSv cm2)
EROT/Φ (pSv cm2)
EISO/Φ (pSv cm2)
241Am-Li 243 155 84.5 64.0 241Am-Be 391 412 281 223 Calibration 252Cf 385 337 209 162 252Cf(D2O) 108 98.9 61.8 47.8
CANEL 44.5 32.4 18.3 13.8 Simulated workplace
SIGMA 22.3 18.5 11.3 8.65
Dungeness A: boiler cell 15.8 15.3 8.83 6.54
Hinkley A: filter gallery 14.3 11.7 6.70 4.98
Dungeness A: walkway 21.4 18.9 10.9 8.12
Dungeness A: roof 22.0 19.3 11.1 8.30
Trawsfynydd: filter gallery 21.1 17.5 9.98 7.46
Calder Hall: blower hall 13.3 11.6 6.68 4.97
Gas Cooled Reactors
Calder Hall: control room 12.0 10.1 5.87 4.36
Gosgen 1 44.2 30.0 16.7 12.7
Gosgen 2 30.0 21.8 12.4 9.36
Ringhals F 30.0 24.3 13.8 10.3
Ringhals L 38.1 29.8 16.8 12.6
Ringhals A 28.7 23.4 13.3 9.93
Pressurized Water Reactors
Ringhals G 19.3 16.4 9.39 7.00
In practice the fast component of the field is likely to be much more strongly directional than the thermal and intermediate components, although for extended, multiple or distributed sources this may be less true. Additionally, worker movement can cause the field to acquire a degree of isotropy, typically rotational isotropy. For ambient dose equivalent such considerations are not relevant, although the angle dependence of

RESPONSE DATA FOR OTHER DESIGNS
109
response of the instrument does mean that the instrument orientation with respect to the field is important.
TABLE 28b Fluence to dose equivalent conversion coefficients for the fields measured source fabrication and usage areas, fuel manufacture, fuel reprocessing and near transport flasks containing spent fuel. Group Field H*(10)/Φ
(pSv cm2)
EAP/Φ (pSv cm2)
EROT/Φ (pSv cm2)
EISO/Φ (pSv cm2)
241Am-Be 112 104 66.8 52.1
Am ceramic 276 208 121 92.0 Source fabrication
252Cf 259 222 136 105
Pu finishing 1: HP office 133 99.4 57.9 44.2
Pu finishing 2: Corridor 34.8 27.4 15.8 12.0
Pu finishing 3: Precipitation cell 241 173 97.8 74.0
Pu finishing 4: Furnace cell 202 158 95.1 73.5
Fuel pin assembly 201 187 119 92.6
PuF4 work station 167 122 69.0 52.2
Fuel cycle
Fission material depot 169 134 79.4 60.8
MOX Flask 2 274 217 129 98.4
MOX Flask 3 184 140 81.3 62.0
La Hague LK100 61.6 44.9 25.3 19.1
Swiss PWR 164 109 60.2 45.7
CLAB D 46.9 35.7 20.0 15.0
CLAB E 46.3 34.6 19.4 14.6
Transport flasks
CLAB P 57.1 41.0 22.9 17.3
In the summary data for the fields calculated for the MOX fabrication plant (Table 28c), for Position 4 the field is broken down into its three components on the basis of their history. These are labelled AP, ROT and ISO as is considered most logical on the basis of their origin, but conversion coefficients are calculated for other geometries also. Those values should be applied with caution, since the field component that they represent may not be relevant for the geometry that has been assumed for the calculation of effective dose.
6 RESPONSE DATA FOR OTHER DESIGNS
The Leake design and Andersson-Braun designs, the latter in the guises of NM2 and Studsvik 2202/2222, do not account for all of the instruments that may be used in UK workplaces. The various members of the Leake family and the NM2 do account for most of the instruments in use, which partly reflects their country of origin but is also indicative of the instruments that have been actively marketed in the UK. Other designs are in widespread use in Europe or North America, where the Leake and NM2 are far less commonplace.

PRACTICAL IMPLICATIONS OF NEUTRON SURVEY INSTRUMENT PERFORMANCE
110
No other design of instrument really warrants inclusion in this report based on its usage in the UK, but other designs, particularly where they differ significantly from the Leake or Andersson-Braun are of interest. Hence, this study has been extended to include data from other designs of instrument, but not to model them using MCNP. Consequently, the analysis is restricted to that permitted by published data, which are almost exclusively for the reference direction of each instrument. Hence, no sophisticated energy and angle analysis is possible for any of the instruments dealt with in this section, and inevitably the sensitivity and mode-of-use aspects are also not dealt with.
All of the instruments discussed in detail in this report are moderator based, and hence operate in much the same manner as the Andersson-Braun and Leake. Some are more complex with more detectors: both multi-detector designs are actually no more than prototypes, but they have been included because good response data are available and they are intended to offer significant improvements over the single detector designs. They provide a genuine contrast with the Andersson-Braun and Leake designs.
TABLE 28c Summary of conversion coefficients for the MCBEND calculated MOX fuel fabrication fields. The effective dose values have been calculated using the assumption of one of three simple field geometries. In practice the direction distribution of the field would be much more complex. Field H*(10)/Φ
(pSv cm2) EAP/Φ (pSv cm2)
EROT/Φ (pSv cm2)
EISO/Φ (pSv cm2)
Site I 125 101 59.8 45.6
Site II: Position 1 115 91.7 53.8 40.9
Site II: Position 2 136 108 63.6 48.3
Site II: Position 3 110 86.5 50.7 38.5
Site II: Position 4 94.3 73.3 42.6 32.3
Site II: Position 5 88.1 69.0 40.3 30.6
Site II: Position 4 AP 195 156 91.9† 69.9†
Site II: Position 4 ROT 146 119† 71.9 55.1†
Site II: Position 4 ISO 67.6 51.1† 29.3† 22.1
† Note the apparent conflict between the field geometry applied and that assumed for this component of the field
6.1 Single detectors designs
6.1.1 LB6411 The LB6411 Neutron Dose Rate Monitor (Burgkhardt et al, 1997; Klett and Burgkhardt, 1997) manufactured by BERTHOLD TECHNOLOGIES GmbH & Co KG is widely used in Europe. However, no instruments of this type were reported when UK usage was assessed recently (Bartlett et al, 2001). Since it is marketed in the UK* it might have increased importance in the future.
* http://www.wolflabs.co.uk/radiation%20monitoring.htm

RESPONSE DATA FOR OTHER DESIGNS
111
The design is based on a 25.0 cm diameter spherical polyethylene moderator that is larger than the 20.8 cm diameter moderator of the Leake design. The principle is very similar to that of the Leake, with a 3He detector at the centre of a polyethylene sphere with perforated cadmium absorbers. None of the references describes the cadmium absorbers, so it is unclear whether these have been changed in order to alter the response characteristics.
The instrument is relatively sensitive, with an ambient dose equivalent response of about 3 nSv-1, which derives in part from the high pressure of its central detector. One early reference quotes the fill gas to be 3.5 bar of 3He and 1 bar of methane (Klett and Burgkhardt, 1997), but more recent references and the current web-page for this instrument make no reference to the presence of methane in the central detector. The reason for the methane being present was not explained, and it may no longer be added.
The calibration source recommended for this instrument is bare 252Cf and the manufacturer’s recommended response for a calibration source is 2.83 nSv-1 (Klett and Burgkhardt, 1997). However, the result obtained by folding the published response data with the energy distribution for a bare 252Cf is 3.08 nSv-1.
For most of the energy range of interest to this study, the LB6411* has similar response characteristics to the Leake design, but it does have a significantly lower response overestimate for intermediate energy neutrons (Figure 83). The main distinguishing feature, however, is that it has a very much lower response to thermal neutrons. The changes in the response for thermal and intermediate energy neutrons probably derive from the cadmium layer providing stronger attenuation: the total area of holes must be smaller.
6.1.1.1 LB 6411-Pb Neutron Dose Rate Probe for High Energy Neutrons Berthold Technologies have developed this modification† of the LB6411 that incorporates a 1 cm thick lead layer to improve the response at high energies. This has been shown to improve the response in the CERF simulated cosmic ray field at CERN via the (n, xn) reactions that take place in the lead layer: whilst the original LB6411 was found to underestimate by 31% in that field, the new instrument is found to give very good dose equivalent reading. The response of the instrument at lower energies will be slightly changed by this modification.
6.1.2 SWENDI-II There have been several attempts to improve the high-energy neutron response of survey instrument by reducing the energies of such neutrons and increasing the fluence via (n, xn) reactions. A recent design of this type is the LINUS (Birratari et al, 1990), an Andersson-Braun based design, modified by the use of lead in the moderator, to make
* http://www.berthold-online.com/ww/en/pub/strahlenschutz/produkte/rppldose/rpprodneutrondoselb123.cfm † http://www.berthold-online.com/ww/en/pub/strahlenschutz/produkte/rppldose/lb_6411_pb.cfm

PRACTICAL IMPLICATIONS OF NEUTRON SURVEY INSTRUMENT PERFORMANCE
112
use of the relatively favourable 208Pb(n, 2n) cross section. Based on the same principle, the SWENDI-II (Olsher et al, 2000) is a commercially available instrument that makes use of (n, xn) reactions to increase the high energy response, although it has also been designed to give good response in nuclear power and fuel cycle fields.
10-3 10-2 10-1 100 101 102 103 104 105 106 107
Neutron energy (eV)
0.1
0.3
0.5
0.7
1
3
5
7
10
Nor
mal
ized
H*(
10) r
espo
nse
SWENDI-IILB6411
BAE SYSTEMS
HPA/BNFL
FIGURE 83 Normalized H*(10) responses of the LB6411, SWENDI-II, HPA/BNFL design and Hybrid. The solid line for the LB6411 is for a calibration response of 3.08 nSv-1, as calculated in this work for the response to 252Cf, whereas the broken line is for a calibration of 2.83 Sv-1as specified by the manufacturer as the 252Cf calibration response (Klett and Burgkhardt, 1997). For the SWENDI-II the solid line is the response normalized to the manufacturer’s specification (4.08 nSv-1), whereas the broken line is for the same data normalized to the 252Cf response (4.90 nSv-1).
The original WENDI-38 (wide-energy neutron detector) was a spherical instrument with powdered tungsten distributed through the polyethylene moderator. That instrument retained the attenuating layer, although it used boron-loaded silicone rubber instead of cadmium. The WENDI-II, which has been commercialized as the SWENDI-II, dispensed with the spherical symmetry and the boron-loaded layer: the new geometry is cylindrical, with the axis of the cylinder oriented vertically. Instead of boron, it used tungsten in the moderator to both multiply the neutrons via (n, xn) reactions and attenuate them via (n, γ) reactions. The tungsten is not distributed throughout the moderator, as in the WENDI-I, but instead tungsten powder is packed into a layer in the polyethylene moderator. The use of tungsten was also favoured because it suppresses the photon field in the central detector, which is a particular problem for 3He detectors. The instrument is currently available in the UK from the Thermo Electron Corporation.

RESPONSE DATA FOR OTHER DESIGNS
113
This instrument has been well characterized (Olsher et al, 2000) using a combination of MCNP (Briesmeister 2000), MCNPX (Waters, 1999) and LAHET (Prael and Lichtenstein, 1989) calculations and measurements. It is both relatively sensitive, with a response to bare 252Cf of 2.74 nSv-1, and relatively heavy, with a total mass of about 14 kg, which includes 6 kg of tungsten. Its response, however, appears to have increased, with the sensitivity now quoted by the manufacturer* to be 4.08 nSv-1. The data available from the manufacturer give a response to bare 252Cf of 4.90 nSv-1, so the response data have been presented using both these normalizations (Figure 83). It is clear from this representation that the over-response to intermediate energy neutrons is greater than that for other designs, although the H*(10) responses to thermal and fast neutrons approximately balance. The H*(10) response increases for energies greater than 20 MeV, whereas those for instruments without the (n, xn) neutron multiplier fall quite steeply. This instrument would out-perform all of the others in this study for the high-energy component of cosmic ray fields and fields found near high-energy accelerators.
6.2 Multi-detector designs
Two multi-detector designs have been included in this work, although neither is in commercial production. The reason for their inclusion is that they are radically different, and are intended to offer significantly better dose equivalent response. Also, because they are multi-detector, have the possibility of determining crude direction distributions, and hence may be able to detect that a reading of H*(10) would be a substantial over-estimate of effective dose. The principle of the two designs is the same, with the six outer detectors optimized to detect the thermal and intermediate component of the field, and the inner detector intended to detect only the fast component. The combined signal from the inner and outer detectors then avoids the very significant over-estimate that is experienced by many of the single detector designs in the keV energy range.
An additional feature of this design is that it does offer the potential for a crude measurement of the field hardness, via the ratio of the inner and outer detector readings. This has proved useful in the Hybrid Survey Instrument, for which the inner to outer detector reading ratio is found to correlate strongly with the systematic error in the instrument reading caused by the field hardness. Consequently, it is possible for a correction to be made to the instrument reading based on this ratio.
6.2.1 HPA/BNFL novel survey instrument This design (Bartlett et al, 1997) used a complete layer of boron-loaded rubber (FLEX/BORON†) to make the response to thermal and intermediate neutrons effectively zero in the inner detector. The response to neutrons that could not penetrate the boron loaded layer with any meaningful efficiency was achieved via six outer detectors located close to the surface of the 26 cm diameter polyethylene sphere (Figure 84). The design
* http://www.thermo.com/com/cda/product/detail/1,1055,15767,00.html † http://www.thermo.com/com/cda/product/detail/1,1055,22399,00.html

PRACTICAL IMPLICATIONS OF NEUTRON SURVEY INSTRUMENT PERFORMANCE
114
was optimized using MCNP and verified using a limited number of measurements at the National Physical Laboratory. The resultant response characteristics (Figure 83) show that the over-response in the 1-10 keV energy range is almost eliminated, but only at the expense of a significant dip at around 100 keV.
The potential for readings having substantial systematic uncertainties is considerably reduced with this design, since the extremes of the response in monoenergetic fields are smaller than those for any of the other devices studied here. However, the improvement in the performance in the workplace may be smaller, because the extremes of response for the other designs are in energy ranges where few workplace fields contain a significant component of the total dose equivalent.
FIGURE 84 HPA/BNFL novel survey instrument. Polyethylene is shown in blue, FLEX/BORON in orange and the 3He central detector in pale blue. Four of the six outer detectors are shown, with a further two designated as left and right not in the plane of the figure.
6.2.2 Hybrid This instrument is the first step towards commercialization of the HPA/BNFL Novel Survey Instrument. It has been reduced in overall size from a 26 cm diameter to a 20.96 cm diameter, thereby reducing the mass of the moderator from 8.94 kg to 4.35 kg. It is, as yet, only a prototype for potential commercial production (Figure 85) but has been

RESPONSE DATA FOR OTHER DESIGNS
115
well characterized using MCNP (Winsby, 2002; Tanner 2003). It has also been used in a European programme of measurements in nuclear power and fuel cycle workplaces (Bolognese et al, 2004).
FIGURE 85 Hybrid survey instrument in prototype form
The response characteristics of the instrument are quite different from those of the HPA/BNFL Novel Survey Instrument, mainly because there is less complete separation of the inner and outer detector readings between the thermal/intermediate and fast components of the field. This is caused by a hole in the boron-loaded rubber (FLEX/BORON) that is needed to accommodate the stem of the central 3He detector.
The response of this instrument is more reminiscent of the single detector instruments such as the Leake and Andersson-Braun, but whilst its over-response relative to 252Cf in the 1-10 keV energy range does reach a factor of 4, this is smaller than the corresponding factor for the 0949, NM2 and Studsvik 2202. It is much smaller than that for the SWENDI-II and only slightly larger than that for the LB6411. Whilst its overestimate in the keV region is larger than that of the LB6411 it avoids having a large underestimate for thermal neutrons. It also avoids the significant underestimate at 100 keV that the original HPA/BNFL Novel Survey Instrument had.
For energies greater than 5 MeV the response drops rapidly. This is inevitable in an instrument with a moderator with such a low mass and may limit its use. None of the fields in this study will contain a significant fraction of dose equivalent from neutrons with energies greater than 5 MeV so the high-energy response will not be a significant problem in this subset of workplace fields.

PRACTICAL IMPLICATIONS OF NEUTRON SURVEY INSTRUMENT PERFORMANCE
116
6.3 Other designs
Some more radical designs have not been included because of lack of published data, and their being virtually unknown in UK workplaces. There are also some simple, moderator designs that have also not been included, primarily because they are insufficiently distinct from those that are already in this study.
6.3.1 The Canberra Dineutron* The Dineutron (Mourgues et al, 1985) contains two detectors, one each to detect the fast and soft components of the field, a design that presents difficulties with its effective centre and reference direction. There are few published data for its response, which would be expected to be highly direction dependent. It is currently marketed in the UK, but its usage is not widespread.
6.3.2 HPI Model REM 500† This TEPC based instrument is available from Far West Technology Inc. It has very different response characteristics from those of the moderator-based designs, but there are few published data for it (Thomas and Taylor, 1997), certainly too few for proper inclusion in this study. However, its tendency to underestimate between the thermal and fast neutron energy ranges would provide an interesting contrast with the moderator-type instruments. Very few have been sold in the UK.
6.3.3 REMbrandt™‡ This instrument is based on the acoustic detection of bubble formation in superheated drop detectors (Apfel and d’Errico, 2002). There are relatively few published data for its response, but those that are available show that it would underestimate in the keV energy range. For the remainder of the energy range up to 20 MeV the response appears to be very good. Since few workplace fields contain a significant component of dose equivalent in the keV energy range, the under-response to neutrons of those energies may not adversely affect the performance of the instrument.
Because the instrument does not rely on gas-filled detectors, its response is very high relative to other designs. The typical value of 8 bubbles per μSv is approximately 104 times that of typical moderator based designs.
6.3.4 E-600/NRD The E-600/NRD uses a cadmium loaded 9" (22.9 cm) diameter polyethylene moderator that is slightly larger than the 20.8 cm diameter moderator used in the Leake design. It is based on a 1960’s design from Los Alamos National Laboratory (Hankins, 1967). This
* http://www.canberra.com/products/594.asp † http://www.fwt.com/hpi/hpi_rem500ds.htm ‡ http://www.harpellassociates.com/na-pdf/398-399.pdf

RESPONSE DATA FOR OTHER DESIGNS
117
instrument, though marketed by the Thermo Electron Corporation*, is not in widespread use in the UK, partly because the same company already markets the NM2B and SWENDI-II. The quoted response of this instrument is 0.27 nSv-1.
6.3.5 FHT 750/751/752 BIOREM Neutron Detector† This suite of instruments is based on a cylindrical moderator with a vertical axis of symmetry. There is no rounding off of the moderator at the end opposite the electronics. The moderator is smaller than that of the Andersson-Braun: the diameter is 20 cm as opposed to 21.5 cm and the height is 22 cm as opposed to 26.4 cm. Consequently, the moderator mass is less than 7 kg, comparable to the Leake and significantly lighter than the NM2B or Studsvik/Wedholm Medical. The instrument is marketed by the Thermo Electron Corporation with either a BF3 or 3He detector, the response to a 252Cf source being about 1.8 nSv-1 for the BF3 detector and 7.2 nSv-1 for the 3He. Only data for the response to fast neutrons are available for this design.
6.3.6 Ludlum Model 12-4‡ The Ludlum Model 12-4 has identical specifications to the E-600/NRD, although its quoted response is 0.18 nSv-1 for a 241Am-Be source. It is also based on the 1967 Los Alamos design (Hankins, 1967).
6.3.7 Model 5080 Meridian§ This instrument from Far West Technology Incorporated is based on the standard Andersson-Braun design. It has a full cylindrical moderator like the NN2, but with detachable electronics. This instrument can be supplied with either a BF3 or 3He detector, but for irradiation from the reference direction, there is no reason to believe that its energy dependence of response will be very different from those of the NM2 or Wedholm Medical 2202D. The electronics and batteries do not shield the instrument when irradiated from either end, so the response, as a function of angle, may be quite different from that of the NM2.
6.3.8 Model 2080 Albatross Pulse Neutron Detector** This moderator-type design (Brown et al, 1980) differs significantly from the others that are available. It uses two Geiger-Muller counters, one of which has a silver foil located so that the delayed β-particles that follow radiative capture can be detected. The second Geiger-Muller counter is required to subtract the photon background. Because the instrument is detecting delayed β-particles, it may be used successfully in very intense or pulsed fields, where other instruments may suffer from dead time effects.
* http://www.thermo.com/com/cda/product/detail/1,1055,16072,00.html † http://www.esm-online.de/sm/product/group1/FHT750.htm ‡ http://www.ludlums.com/product/m12-4.htm § http://www.fwt.com/hpi/hpi_5085ds.htm ** http://www.fwt.com/hpi/hpi_2080ds.htm

PRACTICAL IMPLICATIONS OF NEUTRON SURVEY INSTRUMENT PERFORMANCE
118
It may be expected that the response of this instrument is significantly different from designs that use 10B or 3He. This is because the cross-section for radiative capture on silver does not show the 1/v behaviour, particularly in the keV energy range where there are a lot of strong resonances. The instrument will hence detect neutrons that have not been completely thermalized before entering the sensitive volume. There are few published response data for the instrument, so it is not possible to comment on how it might perform in the workplace. The data that are available are mainly for radionuclide sources (Brown et al, 1980) as opposed to monoenergetic fields. These show that the response falls quite rapidly from a ~ 240 keV (239Pu-Li) to 15 MeV, but that is no different from most of the moderator type designs. Of more interest would be the response to lower energy neutrons, for which the use of silver may produce significantly different results from those for 3He or 10B based detectors. There are not known to be any instruments of this type used in the UK, but the EPD-N from the Thermo Electron Corporation, detects thermal neutrons using the same reaction.
6.3.9 Prescila The Proton REcoil SCintillator – Los Alamos (PRESCILA) is a new device with a very different construction (Olsher et al, 2004). It uses fast and thermal neutron scintillators and a photomultiplier tube to produce a highly sensitive, light (~ 2 kg) instrument. The response has been extensively modelled using MCNP-4C up to 20 MeV, and measurements have been made in a wide range of workplace fields. The instrument is as sensitive as a SWENDI-II (~ 10 nSv-1), and has a very satisfactory energy dependence of response: the responses to thermal and fast neutrons are approximately equal, although there is a factor of 10 overestimate for neutrons with about 10 keV. The most significant difference in the response though is for higher energies. Moderator type instruments that do not have an (n, xn) converter such as lead or tungsten, tend to have a response that falls with increasing energy above about 5 MeV. The PRESCILA, however, has a response that is approximately a factor of two higher than that for 252Cf neutrons at 20 MeV.
6.3.10 Victoreen® Model 190N* The Victoreen® Model 190N is another example of the Andersson-Braun design. It is apparently unmodified, although it has the electronics mounted on top of the cylinder, although they are offset to accommodate the handle. Its response from the reference direction should be the same as that of an NM2, although the different electronics will make its angle dependence of response very different. It is fitted with a shoulder strap so it is likely to be used with the instrument held against the side of the torso: inscatter and shielding may be significant factors.
* http://www.elimpex.com/companies/victoreen/Catalog/RS3.pdf

RESPONSE IN WORKPLACES
119
6.3.11 Fuji Electric NSN10014* There is little information about this Japanese design in the public domain in English. The device has a spherical moderator with a mass of about 7 kg, which makes it comparable to the Leake design, but it is much more sensitive than any other instrument discussed in this report: the manufacturer’s quoted sensitivity is 4.5 cps (μSv–1 h-1) for a 252Cf source, which equates to about 16 nSv-1. The maximum neutron energy quoted for the design is 8 MeV, which indicates that there are no (n, xn) converters in the moderator.
It is not clear how such a high response is achieved. Without seeing the full energy dependence of response it is not possible to work out the implications of this high response to fast neutrons impacts on the response of the instrument in the workplace. Clearly, the instrument has obtained a big increase in response by some means, which will greatly enhance the practicality of making measurements in low dose rates.
6.3.12 Aloka Neutron Survey Meter TPS-451S† Very little information is available in the public domain on this instrument. It is a modified Andersson-Braun so its response characteristics are probably very similar to those of the NM2B or Studsvik. It has much more compact electronics than the NM2B and a rounded end to the moderator opposite the electronics, although the geometry of the moderator does not look exactly the same as that of the Studsvik 2202D or Wedholm Medical 2222.
6.3.13 Thermal neutron detectors There are also a number of very sensitive, light devices on the market, which concentrate on the detection of thermal neutrons. The current security situation has increased the demand for such instruments to detect small amounts of fissile material. They do not have a significant response to fast neutrons so their response characteristics are not good enough for an accurate assessment of H*(10). Although some of them describe themselves as neutron survey instruments, the label is a misnomer so they have not been included in this study.
7 RESPONSE IN WORKPLACES
7.1 Folding
The responses of the instruments in the workplace fields have been determined by folding the fluence response characteristics with the fluence-energy distributions using a program developed at NRPB (Bartlett and Greenhalgh, 1986). Similarly, fluence-weighted conversion coefficients have been calculated for each field and quantity by
* http://www.nro.nao.ac.jp/~lmsa/siteWG/neutron.html † http://211.4.176.26/english/products/view.cgi?select=survey.html
PRACTICAL IMPLICATIONS OF NEUTRON SURVEY INSTRUMENT PERFORMANCE
120
∑
∑+
Φ+
Φ →Φ
→Φ=
iii
imid,iii
)EE(
)E(R).EE(R
1
1
∑
∑+
Φ+
→Φ
→Φ=
Φi
ii
imid,i,ii
)EE(
)(*h).EE()(*H
1
1 1010
folding the conversion coefficient with the fluence-energy distribution. The dose equivalent response in the field is then ratio of the fluence-averaged response to the fluence averaged conversion coefficient. This procedure is accurate if the energy-bins are narrower than the scale of the structure in the response function or conversion coefficient: uneven bin widths are not important. If there is sufficient detail in both the data sets that are being folded together, the technique is of proven mathematical validity and will hence produce reliable results. However, uncertainties in the determination of the response characteristics and fluence-energy distribution will affect the accuracy of the result.
To fold an energy distribution with a function it is necessary to assign a value to that function for each bin. Since the response function and fluence to dose equivalent conversion coefficients are actually a set of tabulated point values, this is done using a 4 point log-log Lagrangian interpolation to get a value for the response or conversion coefficient at the logarithmic mid-point of the energy-bin. This value is then multiplied by the content of the bin to produce the contribution from that bin.
The sum of the contributions from all bins, normalised to the total fluence, then gives the fluence response of that dosemeter in that field. Mathematically this can be expressed using Equation 3, where RΦ is the fluence response per neutron for a given energy distribution, Φ(Ei !Ei+1) is the fluence in the ith bin, and RΦ(Ei, mid) is the interpolated response at the logarithmic mid-point of bin i.
3
Generation of the fluence to dose equivalent conversion coefficient for the energy distribution may be expressed using a similar equation. In this case an interpolation must be used to obtain the conversion coefficient for the logarithmic mid-point of the ith fluence bin, h*(10)Φ, i, mid. The product of the fluence in the bin and the conversion coefficient for the bin then gives the contribution of that bin to the total dose equivalent of the energy distribution. The sum of these divided by the total fluence then gives the fluence-weighted conversion coefficient for the energy distribution, as given in Equation 4.
4
7.2 Response in workplaces
The objective of this part of the analysis is to determine the ratio of the reading of the instrument to the true dose equivalent or dose equivalent rate. It is assumed that the user calibrates instruments in terms of ambient dose equivalent even when effective dose is being considered. Values lower than 1 represent underestimates and values larger than 1 overestimates. Each set of results is plotted with the ambient dose
RESPONSE IN WORKPLACES
121
CalCal,
WPWP,
)(*HR)(*HR
)(*H/MR
RR 10
1010
θ
θθ =
CalCal,
WPWP,ISOISO )(*HR
)(*HR)(*H/M
R1010
10θ
=
CalCal,
WP,APWP,AP )(*HR
ERE/M
R
RR 10θ
θθ =
CalCal,
WPWP,ROTROT )(*HR
)(*HR)(*H/M
R1010
10θ
=
equivalent fluence-weighted conversion coefficient on the ordinate, which is a good guide to the hardness of the field.
7.2.1 Ambient dose equivalent For the instruments that have full energy and angle dependence of response data available, the H*(10) response has been calculated in terms of each field using three geometries: unidirectional from the reference direction, rotationally isotropic (ROT) and fully isotropic (ISO). This full analysis, however, is only possible for the three instruments modelled in this work because none of the other instruments has such detailed response data available.
The H*(10) results are presented in terms of the instrument reading, M, divided by the calculated ambient dose equivalent for the field, which is independent of field geometry, unlike the response of the instrument. The bias in the instrument reading is the response calculated for the workplace field divided by the calibration response. Three plots are presented for the ambient dose equivalent response of the Leake, 2202D and NM2, and only one for the other instruments whose angle dependence of the response is not well known. The plotted parameters are given by Equations 5, 6 and 7, where θR is the reference direction, the subscript WP denotes calculation in the workplace field and the subscript Cal denotes calculation for the calibration field.
5
6
7
7.2.2 Effective dose The response has also been calculated in terms of effective dose for the three geometries. This analysis does not use a specific calibration for effective dose; the results are instead presented in terms of the H*(10) calibration. The derivation of the ratio of the instrument reading to effective dose is given by Equations 8 and 9 and 10.
8
PRACTICAL IMPLICATIONS OF NEUTRON SURVEY INSTRUMENT PERFORMANCE
122
CalCal,
WP,ROTWP,ROTROTROT )(*HR
ERE/M
R10θ
=
CalCal,
WP,ISOWP,ISOISOISO )(*HR
ERE/M
R10θ
=
9
10
7.3 Leake 0949
The H*(10) results for the 0949 show that it gives small underestimates for very hard fields regardless of the field geometry (Figure 86): the hardest field, 241Am-Be, produces the greatest under-response (24%) for irradiation from the reference direction. In some workplaces, around accelerators for example, fields can be higher in energy than any in this study, so for those fields the 0949 would produce bigger underestimates. The lightness of this instrument may hence make it inappropriate for use in very hard fields without a specific calibration for that type of workplace.
In most instances, the 0949 gives conservative estimates of H*(10) irrespective of the direction distribution of the neutrons, especially for soft fields, for which the overestimates reach 116%. Soft fields, however, can produce underestimates also, particularly when there is a large thermal component, but a small intermediate component. The calibration field SIGMA is the most extreme example of this: the underestimate is as much as 21%, which is caused by this field having a very small intermediate energy neutron contribution towards the total dose equivalent, whereas the thermal component is about 50% of the ambient dose equivalent. The 0949 under-responds to thermal neutrons so it under-responds in SIGMA.
The relatively good angle dependence of response of this spherical device means that the difference between the 0° response and those for spherical and rotational isotropy is never very great, but 0° represents the lowest value of the three for all of these fields. The response to rotationally isotropic fields is 2-10% higher and that for spherically isotropic fields 7-22% higher, the largest increases being for soft fields. Consequently, the instrument is less likely to give underestimates of fields with spherical and rotational isotropy, geometries that are more likely to apply to the softer fields.
There is a lower probability of the H*(10) assessment providing an underestimate of effective dose, because for almost all these fields effective dose is the smaller quantity (Figure 87). The exception is EAP for a bare 241Am-Be source, for which effective dose is larger. This is also the field which produces the biggest underestimate of H*(10) so the underestimate of EAP is as large as 28%. This is caused by the field being the hardest and the moderating sphere of the Leake design being relatively small.
For no other field in the study is there an underestimate of effective dose of more than 5%, which within the uncertainties of the field and response determination is not of any concern. Clearly, however, for fields that contain a significant fraction of dose equivalent from higher energy neutrons than are found in these fields, the instrument will underestimate significantly not just ambient dose equivalent but effective dose also.

RESPONSE IN WORKPLACES
123
For relatively unidirectional fuel cycle and reactor fields, incident from the reference direction, effective dose will be overestimated by up to a factor of about two. Because effective dose is much smaller for rotational and spherically isotropic fields, the over-response to those fields is larger: for rotationally isotropic fields the overestimates range from 8-268% and for spherically isotropic fields from 43-422%. These factors correlate with field hardness, with the largest overestimates being for soft fields and the smallest for hard fields. The correlation is not very good, however, since one of the softest fields, the SIGMA calibration field, produces an underestimate of EAP, and overestimates of EROT and EISO that are similar in magnitude to those calculated for hard fields. This is connected to its small intermediate energy component.
10 20 40 100 200 400H*(10)/Φ (pSv cm2)
0.5
1
2
M0°
/H*(
10)
1
2
MR
OT/
H*(
10)
1
2
MIS
O/H
*(10
)
Calibration Simulated workplaceGas cooled reactor
PWRFuel cycle
Source fabricationTransport flasks
MOx fabrication
FIGURE 86 H*(10) response of the Leake 0949 in workplace fields for irradiation from θR = 0°, and for spherical and rotational isotropy. The calibration used, 0.864 nSv-1, gives an under-response to bare 252Cf of 15% (Leake, 1999).

PRACTICAL IMPLICATIONS OF NEUTRON SURVEY INSTRUMENT PERFORMANCE
124
10 20 40 100 200 400H*(10)/Φ (pSv cm2)
0.5
1
2
1
2
MR
OT/
H*(
10)
1
2
MIS
O/H
*(10
)M
0°/H
*(10
)
Calibration Simulated workplaceGas cooled reactor
PWRFuel cycle
Source fabricationTransport flasks
MOx fabrication
FIGURE 87 Effective dose response of the Leake 0949 in workplace fields for irradiation from the reference direction (θR = 0°), and for spherical and rotational isotropy. The calibration used, 0.864 nSv-1, gives an under-response to bare 252Cf of 15% (Leake, 1999).
7.4 NM2B
The results in this section have been normalized to the response to a bare 241Am-Be source, incident from 90°, throughout.
7.4.1 Unperturbed response The calculated H*(10) response values for irradiation from the reference direction show that the NM2B estimates the quantity well (Figure 88): the range for the bias is –21% to +37%, with the scatter greatest for soft fields. The response varies most for irradiation with rotational isotropy: soft fields are overestimated and hard fields underestimated

RESPONSE IN WORKPLACES
125
because irradiation through the electronics causes an increased response for thermal neutrons but a decreased response for fast neutrons. This effect is less significant for spherically isotropic fields because the solid angle for irradiation from 180° is smaller.
10 20 40 100 200 400H*(10)/Φ (pSv cm2)
0.5
1
2
M0°
/EAP
1
2
3
45
MR
OT/
E RO
T
1
2
3
45
MIS
O/E
ISO
Calibration Simulated workplaceGas cooled reactor
PWRFuel cycle
Source fabricationTransport flasks
MOx fabrication
FIGURE 88 H*(10) response of the NM2B in workplace fields for irradiation from the reference direction (θR = 90°), and for spherical and rotational isotropy. The calibration used is for a bare 241Am-Be irradiation.
For rotational isotropy the bias ranges from –31% to +47% and that for spherical isotropy from –19% to +50%, so the NM2B can produce under and over-estimates of ambient dose equivalent for all three orientations considered. If unidirectional irradiation from 180° was also included, then the range of responses would be greater, but since that is not a plausible workplace orientation for this instrument those data have not been calculated.

PRACTICAL IMPLICATIONS OF NEUTRON SURVEY INSTRUMENT PERFORMANCE
126
In terms of EAP, the largest under-responses are 5% for SIGMA and 241Am-Be (Figure 89). For 241Am-Be this is simply caused by EAP being larger than H*(10) since this is the calibration source. The under-response in SIGMA is caused by its small intermediate-energy component. The over-responses for irradiation from the reference direction reach a maximum of 52%.
The effective dose over-responses for rotationally isotropic fields are in the range from 12-162% and those for spherically isotropic fields from 62-262%. These overestimates are largest for soft fields, the fields that are most likely to be incident with one of these geometries.
10 20 40 100 200 400
H*(10)/Φ (pSv cm2)
0.5
1
2
M9
0°/
EA
P
1
2
3
4
5
MR
OT/
ER
OT
1
2
3
4
5
MIS
O/
EIS
O
Calibration Simulated workplaceGas cooled reactor
PWRFuel cycle
Source fabricationTransport flasks
MOx fabrication
FIGURE 89 Effective dose response of the NM2B in workplace fields for irradiation from the reference direction (θR = 90°), and for spherical and rotational isotropy. The calibration used is for a bare 241Am-Be irradiation.
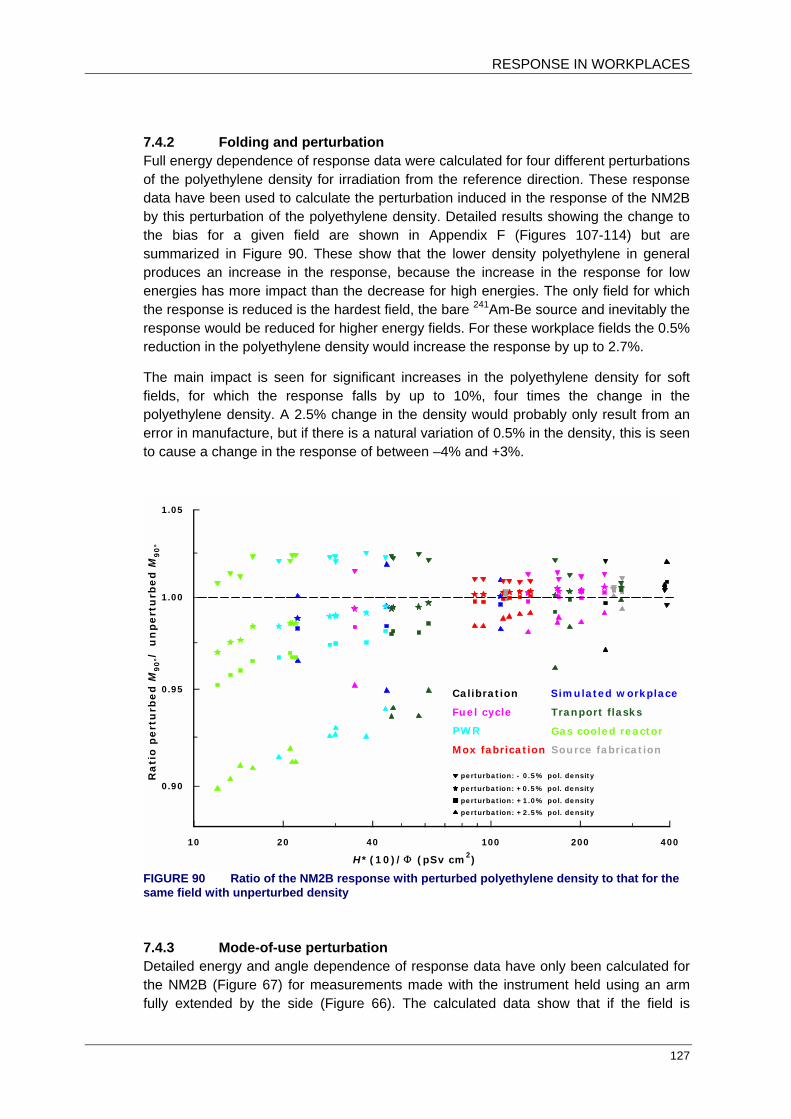
RESPONSE IN WORKPLACES
127
7.4.2 Folding and perturbation Full energy dependence of response data were calculated for four different perturbations of the polyethylene density for irradiation from the reference direction. These response data have been used to calculate the perturbation induced in the response of the NM2B by this perturbation of the polyethylene density. Detailed results showing the change to the bias for a given field are shown in Appendix F (Figures 107-114) but are summarized in Figure 90. These show that the lower density polyethylene in general produces an increase in the response, because the increase in the response for low energies has more impact than the decrease for high energies. The only field for which the response is reduced is the hardest field, the bare 241Am-Be source and inevitably the response would be reduced for higher energy fields. For these workplace fields the 0.5% reduction in the polyethylene density would increase the response by up to 2.7%.
The main impact is seen for significant increases in the polyethylene density for soft fields, for which the response falls by up to 10%, four times the change in the polyethylene density. A 2.5% change in the density would probably only result from an error in manufacture, but if there is a natural variation of 0.5% in the density, this is seen to cause a change in the response of between –4% and +3%.
10 20 40 100 200 400
H*(10)/Φ (pSv cm2)
0.90
0.95
1.00
1.05
Ra
tio
pe
rtu
rbe
d M
90°/
un
pe
rtu
rbe
d M
90°
perturbation: +1.0% pol. density
perturbation: +2.5% pol. density
Calibration
Fuel cycle
PWR
Mox fabrication
Simulated workplace
Gas cooled reactor
Tranport flasks
Source fabrication
perturbation: +0.5% pol. density
perturbation: - 0.5% pol. density
FIGURE 90 Ratio of the NM2B response with perturbed polyethylene density to that for the same field with unperturbed density
7.4.3 Mode-of-use perturbation Detailed energy and angle dependence of response data have only been calculated for the NM2B (Figure 67) for measurements made with the instrument held using an arm fully extended by the side (Figure 66). The calculated data show that if the field is
PRACTICAL IMPLICATIONS OF NEUTRON SURVEY INSTRUMENT PERFORMANCE
128
arriving unidirectionally from the side, so that it has to pass through the user’s thighs, then the response of the NM2B is suppressed by 50-80%, depending on the neutron energy. The response for incidence from that direction (90°) has not been used in the folding because it is not an appropriate use of the instrument, and the results are quite clear: the response for all of these fields would be suppressed by 70-80% because the response only rises significantly for neutrons with energies of 10 MeV and above, and none of the fields selected for this work have significant components of dose from neutrons with such high energies.
The geometries that have been used are for rotational and spherical isotropy and irradiation from the front, 0°. Spherical isotropy in particular is probably quite relevant for soft fields, and irradiation from the front is likely to be most common for hard fields. Rotational isotropy could be approximated for highly scattered neutrons or in environments where there are several sources located in the horizontal plane relative to the worker. It is, however, a geometry that is less relevant for survey instruments than for personal dosemeters, for which movement of the wearer can cause or increase rotational symmetry: for survey instruments it is very likely that the user will be stationary whilst making a measurement.
The results from the folding are presented as the parameters defined in Equations 5 to 9, both for phantom present and phantom absent. The systematic error in the unperturbed field is hence plotted alongside that in the perturbed field, the ordinate being the fluence averaged H*(10) conversion coefficient for the field (Equation 4).
The impact for irradiation from the front is seen to be negligible for hard fields, but for softer fields, inscatter from the phantom causes a significant increase in the response. This effect is caused by the fluence response of the instrument: the fluence response to the inscatter from high-energy neutrons will be lower than that for the unscattered component, whereas for lower energies the fluence responses to the direct and scattered components will be comparable. In some cases, this is for fields that are already overestimated so the effect is for the overestimate to increase. However, the soft fields for which this is a problem, are unlikely to be unidirectional.
The most significant impact is seen for rotational isotropy, for which the BOMAB phantom has a larger solid angle than for spherical isotropy. These data have been treated slightly differently, because the orientation of the instrument is different from that used to calculate the response of the NM2B to a rotationally isotropic field (Figures 31 and 33): in these calculations, its axis of symmetry is vertical, whereas previously it was horizontal. Consequently, the unperturbed response for a rotationally isotropic field is equivalent to irradiation from the reference direction. Hence, those data are used here for the unperturbed response to a rotationally isotropic field.
The impact of the BOMAB phantom in rotationally isotropic fields is greatest for hard fields (Figure 91), because the fluence response to the inscatter is low. Shielding by the phantom is the dominant influence, so the response to all of these fields is reduced. Consequently, ambient dose equivalent is overestimated only for a few very soft fields, though not for the three softest fields in the study.
The effective dose response data for rotationally isotropic fields (Figure 92), are presented using the unperturbed data for the response from 0°, but are calculated using

RESPONSE IN WORKPLACES
129
EROT/Φ. This is again required because of the change in the instrument orientation compared to the reference data that were calculated previously (Figure 31). The effect of the BOMAB phantom is a reduction in the overestimate of EROT for all fields (Figure 92), the magnitude of the reduction being greatest for hard fields. This is probably caused by the hard fields gaining less response from inscatter from the BOMAB phantom but suffering similar shielding from it, when compared to the softer fields.
10 20 40 100 200 400
H*(10)/Φ (pSv cm2)
0.5
1
2
M0
°/H
*(1
0)
1
2
MR
OT/
H*
(10
)
1
2
MIS
O/
H*
(10
) Phantom present Phantom absent
Calibration Simulated workplaceGas cooled reactor
PWRFuel cycle
Source fabricationTransport flasks
MOx fabricationPWR
FIGURE 91 NM2B H*(10) response for irradiation from the front (0°, antero-posterior), and for spherically and rotationally isotropic fields, both with and without the BOMAB phantom present. The results apply to the NM2B held at arm’s length by the side.
The overestimates are caused by EROT being significantly smaller than H*(10), so an under-response in terms of H*(10) makes the estimate of EROT better. For harder fields,

PRACTICAL IMPLICATIONS OF NEUTRON SURVEY INSTRUMENT PERFORMANCE
130
the decrease in the response caused by the BOMAB phantom is greater so the assessment of EROT is significantly improved. The same effects are seen for the spherically isotropic fields, but because the solid angle subtended by the phantom is relatively small, the effects are less significant. For antero-posterior irradiation, the effective dose response increases for all fields, because there is no shielding at all. For three of the four fields for which effective dose was previously underestimated, there is now a small overestimate. The effect is much less marked for hard fields.
10 20 40 100 200 400
H*(10)/Φ (pSv cm2)
0.5
1
2
M0
°/E
AP
1
2
3
45
MR
OT/
ER
OT
1
2
3
45
MIS
O/
EIS
O
Calibration Simulated workplaceGas cooled reactor
PWRFuel cycle
Source fabricationTransport flasks
MOx fabricationPWR
Phantom present Phantom absent
FIGURE 92 NM2B effective dose response for irradiation from the front (0°, antero-posterior), and for spherically and rotationally isotropic fields, both with and without the BOMAB phantom present. The results apply to the NM2B held at arm’s length by the side.
Greater influence on the response would be noted for specific angles of incidence and for other ways of holding the instrument. If it were held higher, so that the attenuating

RESPONSE IN WORKPLACES
131
and scattering part of the body were more massive, both effects would be larger. This would be more likely for a lighter instrument, especially the Leake design, which would very plausibly be held in front of the torso. The NM2B is, however, the second heaviest instrument in the study (the SWENDI-II is heavier), so it is less likely to be affected by more significant perturbations caused by the user.
It is easier to visualize the magnitude of the influence of the BOMAB phantom on the response of the NM2B held at arms length by the right side of the body, when the response data for each field geometry are divided by the response calculated without the BOMAB phantom (Figure 93). Then, it is seen that the response in an ISO field is always lower when the BOMAB phantom is present. The magnitude of the difference is 5-8% for all the fields and shows little correlation with field hardness.
10 20 40 100 200 400
H*(10)/Φ (pSv cm2)
0.8
1.0
1.2
0.8
1.0
1.2
0.8
1.0
1.2
Rati
o p
han
tom
pre
sen
t/p
han
tom
ab
sen
t
Calibration
Simulated workplaceGCRPWR
Fuel cycle Source fabricationTransport flasks
MOx fabrication
MROT
MISO
M0°
FIGURE 93 Ratio of the NM2B response for irradiation from the front (0°, antero-posterior), and for spherically and rotationally isotropic fields with the BOMAB phantom present to the response without the BOMAB phantom. The results apply to the NM2B held at arms length by the side.
PRACTICAL IMPLICATIONS OF NEUTRON SURVEY INSTRUMENT PERFORMANCE
132
For rotationally isotropic fields, the difference does correlate with field hardness (Figure 93): for soft fields the magnitude is close to that for spherically isotropic fields, whereas for hard fields it is much larger. The range of the effect is from 5% to 15%, its increased magnitude for hard fields being a reflection of the reduced fluence response to the scattered component of the field. The difference between the spherically and rotationally isotropic trends derives from the orientation of the instrument: the unperturbed response to a rotationally isotropic field is the same as that for the reference direction, whereas that for the spherically isotropic field is significantly perturbed by neutrons entering through the electronics.
For irradiation from the front, the perturbation of the response decreases as the field increases in hardness. The maximum increase in the response is for the softest fields, for which it is about 15% higher than it is with the phantom absent. For the hardest fields, the change in the response is negligible. This trend is again caused by the lower energy of the scattered component of the field, which consequently has a markedly lower fluence response compared to the direct component for hard fields. The soft fields, for which the presence of the phantom increases the response most significantly, are the least likely to be unidirectional.
7.5 Studsvik 2202D
The 2202D provides conservative estimates of H*(10) for most fields when incident from the reference direction (Figure 94): the most significant underestimate is 13% for the SIGMA field. Generally, it overestimates in soft fields, because of its over-response to intermediate energy neutrons, but the SIGMA field has almost no intermediate component, which leads it to underestimate. Since SIGMA is so unrepresentative of soft fields for this instrument, this one result cannot be regarded as being indicative of a potential problem in such fields.
Since this instrument has cylindrical symmetry, rotational isotropy could be defined in one of two distinct ways: with the instrument’s axis of symmetry oriented horizontally or vertically. In the latter case, rotational isotropy is equivalent to irradiation from the reference direction, so it is not very interesting. It is also not a very likely orientation because the cylindrical moderator is rounded off and the instrument would not be very stable in that position. Consequently, rotational isotropy in the following analysis is for the instrument with its axis of symmetry horizontal.
Because the H*(10) response for rotational and spherical isotropy is lower, especially for hard fields, the instrument is seen to produce underestimates of up to 26% for fields with those geometries. This is caused by the excessive shielding provided by the electronics so the response in a rotationally isotropic field is lower than that for a spherically isotropic field.
For hard neutron fields, the 2202D estimates H*(10) within ±10%, but for softer fields the over-response to intermediate energy neutrons can cause significant overestimates. These reach 64% for one gas cooled reactor spectrum incident from the reference direction. However, for very soft fields, with a smaller component of dose equivalent in

RESPONSE IN WORKPLACES
133
the intermediate energy range, the over-response is smaller, and for rotationally isotropic fields this can lead to an underestimate.
10 20 40 100 200 400H*(10)/Φ (pSv cm2)
0.7
1.0
2.0
1.0
2.0
1.0
2.0
M0°
/H*(
10)
MR
OT/
H*(
10)
MIS
O/H
*(10
)
Calibration
Simulated workplaceGas cooled reactor
PWRFuel cycle
Source fabricationTransport flasksMOX fabrication
FIGURE 94 H*(10) response of the Studsvik 2202D in workplace fields for irradiation from the reference direction (θR = 90°), and for spherical and rotational isotropy. The calibration used is for a bare 241Am-Be irradiation.
For effective dose (Figure 95), the instrument underestimates only for its own calibration spectrum: EAP/Φ is lower than H*(10)/Φ for 241Am-Be, so an underestimate is inevitable. Otherwise, the smallest overestimate is for the SIGMA field, which is caused by it having a smaller intermediate energy component than most of the other fields. In practice, a field as soft as SIGMA is likely to be less directional so a true workplace energy

PRACTICAL IMPLICATIONS OF NEUTRON SURVEY INSTRUMENT PERFORMANCE
134
distribution of this type would have a lower effective dose rate: the actual direction distribution for SIGMA most closely approximates antero-posterior, but a true workplace field of this type is likely to have a lot of isotropic scatter. The overestimates of EAP reach 71%, whereas those for EROT and EISO are 22-165% and 56-265% respectively. These biases are not strongly dependent on field hardness.
10 20 40 100 200 400H*(10)/Φ (pSv cm2)
0.5
1
2
M90
°/EAP
1
2
3
45
MR
OT/
E RO
T
1
2
345
MIS
O/E
ISO
Calibration Simulated workplaceGas cooled reactor
PWRFuel cycle
Source fabricationTransport flasks
MOX fabrication
FIGURE 95 Effective dose response of the Studsvik 2202D in workplace fields for irradiation from the reference direction (θR = 90°), and for spherical and rotational isotropy. The calibration used is for a bare 241Am-Be irradiation.
7.6 LB 6411
Because no direction dependence of response results are available for the LB6411, the H*(10) analysis is restricted to response from the reference direction. The effective dose

RESPONSE IN WORKPLACES
135
response is considered for unidirectional irradiation from θR, spherical isotropy and rotational isotropy (Figure 96). Since the θR response has been used throughout, the differences between the effective dose responses reflect only the differences between the quantities.
10 20 40 100 200 400
H*(10)/Φ (pSv cm2)
0.5
1
2
M0
°/D
ose
equiv
ale
nt
1
2
3
45
M0
°/E
RO
T
1
2
3
45
M0
°/E
ISO
Calibration Simulated workplaceGas cooled reactor
PWR
Fuel cycle
Source fabricationTransport flasks
MOx fabrication
solid square: EAP
open square: H*(10)
FIGURE 96 H*(10) and effective dose response of the Berthold LB6411 in workplace fields for irradiation from θR = 0°, and for spherical and rotational isotropy. The isotropic fields are only considered for effective dose. The calibration used is 2.834 nSv-1, the manufacturer’s specified response to 252Cf (Burgkhardt and Klett, 1997).
The analysis is complicated by the folding performed in this work giving a different response for the recommended calibration source, bare 252Cf, than that calculated using the same response data as the manufacturer (Burgkhardt and Klett, 1997). This has a significant impact on the results, because the 252Cf response calculated in this work, is

PRACTICAL IMPLICATIONS OF NEUTRON SURVEY INSTRUMENT PERFORMANCE
136
9% higher. The two calibrations (Figures 96 and 97) both lead to underestimates of H*(10) in a significant number of fields. The manufacturer’s value gives a more appropriate calibration, but if calibration with a 252Cf source is used, then the instrument will be used as shown in Figure 97.
10 20 40 100 200 400
H*(10)/Φ (pSv cm2)
0.5
1
2
M0
°/D
ose
equiv
ale
nt
1
2
3
45
M0
°/E
RO
T
1
2
3
45
M0
°/E
ISO
Calibration Simulated workplaceGas cooled reactor
PWR
Fuel cycle
Source fabricationTransport flasks
MOx fabrication
solid square: EAP
open square: H*(10)
FIGURE 97 H*(10) and effective dose response of the Berthold LB6411 in workplace fields for irradiation from the θR (0°), and for spherical and rotational isotropy. The calibration used is 3.083 nSv-1, the response to 252Cf calculated in this work from the response data (Burgkhardt and Klett, 1997).
Using either calibration the instrument is likely to underestimate H*(10) in very soft fields by about 40%, although the underestimate in effective dose disappears for rotationally and spherically isotropic fields. These are the fields that are most likely to be quite

RESPONSE IN WORKPLACES
137
isotropic so perhaps the instrument’s under-response to soft fields incident from the reference direction may not affect its performance in the workplace.
For harder fields, using either calibration the instrument always provides a conservative estimate of effective dose. Because it uses a relatively large polyethylene sphere, its high-energy response is somewhat better than smaller spheres such as the Leake.
7.7 SWENDI-II
As for the LB6411, monoenergetic response data for the SWENDI-II are only available for its reference direction. Consequently, the responses calculated for this instrument (Figure 98) differ only because of the differences in the dose quantities. The H*(10) response is calculated for irradiation from the reference direction only, but the cylindrical nature of the moderator will inevitably introduce some angle dependence of response. The cylindrical moderator has a diameter that is approximately equal to its height, but it is not rounded off like that of the 2202D/2222 design, so there will be inevitable variation with angle of incidence out of the horizontal plane. A boron-loaded rubber patch is used to avoid an over-response for irradiation from the top, where the cable enters the moderator, but the published data for a 252Cf (D2O) source show that the instrument over-responds from that direction by more than 10% (Olsher et al, 2000). It does not over-respond for the unmoderated source, so those data may indicate only a significant over-response for intermediate-energy neutrons.
The effective dose analysis applies the conversion coefficients for antero-posterior, rotational isotropy and spherical isotropy. The differences between the three results would probably be increased if the response data for spherical isotropy were available, because the 252Cf (D2O) data indicate that the response is probably higher for spherical isotropy, which will increase the over-response in terms of that quantity. The data for rotational isotropy will be unaffected since the instrument response will be independent of angle of incidence in the horizontal plane.
This instrument has its calibration response specified as 4.08 nSv-1, so this has been used to normalize the results of the folding. Inspection of the results (Figure 98) indicates that the calibration is inappropriate for the fields in this study, because it implies an overestimate of H*(10) for all of them. The overestimates of effective dose are larger still for spherically isotropic irradiation. The problem derives from this instrument being intended for use in higher energy fields, for which the response would be lower, despite the tungsten layer. It is exacerbated by the over-response to intermediate energy neutrons being larger for this instrument than any of the others, so the calibration will cause overestimates when the instrument us used in nuclear power and fuel cycle fields.
To give a better idea of the potential of this instrument, its response results have also been normalized after performing a χ2 fit to the H*(10) response values obtained in this work. These give a response for the workplace fields in this study of 6.40 nSv-1, 57% higher than the manufacturer’s recommendation. The results from using this calibration are better, with the over-response in terms of EROT ranging up to 200% instead of 400% and those for EISO peaking at 400% instead of 600% (Figure 99). In unidirectional fields,

PRACTICAL IMPLICATIONS OF NEUTRON SURVEY INSTRUMENT PERFORMANCE
138
the slight underestimates of ambient dose equivalent for hard fields provide good estimates of effective dose. For softer fields, the overestimates of effective dose are almost 100%, whereas for the manufacturer’s calibration the overestimates could be as much as 200%.
10 20 40 100 200 400
H*(10)/Φ (pSv cm2)
0.5
1
2
3
M0
°/D
ose
equiv
ale
nt
0.5
1
2
3
45
M0
°/E
RO
T
0.5
1
2
3
5
7
M0
°/E
ISO
Calibration Simulated workplaceGas cooled reactor
PWR
Fuel cycle
Source fabricationTransport flasks
MOx fabrication
solid square: EAP
open square: H*(10)
FIGURE 98 H*(10) and effective dose response of the SWENDI-II in workplace fields for irradiation from the reference direction (θR = 90°), and for spherical and rotational isotropy. The isotropic fields are only considered for effective dose. The manufacturer’s specified calibration response of 4.08 nSv-1 has been used.
7.8 HPA/BNFL Novel Area Survey Meter
As for the LB6411 and SWENDI-II this instrument has only been considered for irradiation from its reference direction. Its calibration response has been optimized for

RESPONSE IN WORKPLACES
139
workplace fields such that it over-responds in terms of ambient dose equivalent by 17% for a 252Cf irradiation or by 30% for 241Am-Be. If the instrument did not have an over-response to those radionuclide fields, then the dip in the response around 100 keV (Figure 83) would cause significant under-response in some fields (Figure 100). Using this calibration, the under-response for this selection of fields is at most 30% for ambient dose equivalent, and never more than 4% for effective dose. The largest over-responses in terms of H*(10) are for very soft (35%) and very hard fields (30%).
10 20 40 100 200 400
H*(10)/Φ (pSv cm2)
0.5
1
2
3
M0
°/D
ose
equiv
ale
nt
1
2
3
45
M0
°/E
RO
T
1
2
3
45
M0
°/E
ISO
Calibration Simulated workplaceGas cooled reactor
PWR
Fuel cycle
Source fabricationTransport flasks
MOx fabrication
solid square: EAP
open square: H*(10)
FIGURE 99 H*(10) and effective dose response of the SWENDI-II in workplace fields for irradiation from the reference direction (θR = 90°), and for spherical and rotational isotropy. The isotropic fields are only considered for effective dose. The calibration used is 4.80 nSv-1, the response to 252Cf that is calculated in this work from the response data for this instrument. Note that the manufacturer specifies a calibration response of 4.08 nSv-1.

PRACTICAL IMPLICATIONS OF NEUTRON SURVEY INSTRUMENT PERFORMANCE
140
The improved energy dependence of response of this instrument does appear to have some benefits in terms of its performance in workplace fields. It does not produce any very significant systematic errors in the fields studied, and its potential for larger errors in other workplace fields is less than that for most other instruments because its H*(10) response varies less. However, although the instrument estimates H*(10) with less potential for bias than most of the other instruments, in reality it produces larger overestimates than some of the alternatives.
10 20 40 100 200 400
H*(10)/Φ (pSv cm2)
0.5
1
2
M0
°/D
ose
eq
uiv
ale
nt
1
2
3
45
M0
°/E
RO
T
1
2
3
45
M0
°/E
ISO
Calibration Simulated workplaceGas cooled reactor
PWR
Fuel cycle
Source fabricationTransport flasks
MOx fabrication
solid square: EAP
open square: H*(10)
FIGURE 100 H*(10) and effective dose response of the HPA/BNFL Novel Survey Instrument in workplace fields for irradiation from the reference direction (θR = 0°), and for spherical and rotational isotropy. The isotropic fields are only considered for effective dose. The calibration used is 0.856 times the H*(10) response to 252Cf.

RESPONSE IN WORKPLACES
141
The instrument has relatively good spherical symmetry. Its six outer detectors provide relatively isotropic response for the soft component of the field, whereas the inner detector is surrounded by an almost complete spherical shell of FLEX/BORON. The main perturbation to this spherical symmetry is the small hole in the FLEX/BORON that is required for the central detector’s cable wich will affect irradiation from the top most significantly. It is a relatively small hole, but for this analysis it may affect the spherically isotropic response adversely: the response to thermal and intermediate-energy neturons will be slightly higher from above. Hence, for EISO the overestimates may be slightly larger than calculated (Figure 100), but not by a very significant amount.
Estimation of ambient dose equivalent produces a conservative estimate of effective dose for almost all of these fields, the maximum underestimates being only 4%. These underestimates occur for two relatively soft fields that have a significant component of dose equivalent around 100 keV, the minimum of the dose equivalent response of the instrument. The largest overestimate of effective dose for irradiation from the reference direction is 60%, which is relatively small for the instruments in this study. The overestimates of effective dose for isotropic fields do not depend very strongly on field hardness. The absence of a substantial over-response to neutrons in the 1-10 keV energy range means that the instrument cannot over-respond significantly in soft fields.
7.9 Hybrid
The Hybrid Survey Instrument is also only considered for irradiation from its reference direction. Its response, like that of the HPA/BNFL Novel Survey Instrument on which it is based, has been normalized so that its response to a bare 252Cf source is a 6% overestimate. It has had an additional correction factor applied in determining its response that is derived from the ratio of the inner and outer detector response ratio.
Its ambient dose equivalent response shows very little variation about the calibration value (Figure 101), with the SIGMA field proving most problematic. This is connected to its small intermediate-energy component, which prevents the over-response for those energies from balancing the under-response to thermal neutrons.
Although this design has a spherical moderator, its internal asymmetry may affect its angle dependence of response. This will not be a problem for irradiation from angles in the horizontal plane, for which its response will be approximately isotropic. However, the response for soft fields will be very different for irradiation from the top and bottom. Hence, the spherical isotropic response will be substantially perturbed, but the reference direction and rotationally isotropic responses will not. Since this instrument is only a prototype, this is a problem that would be addressed before commercialization.
For fields incident from the reference direction, effective dose is only underestimated for the SIGMA field and bare 241Am-Be. The latter is not surprising because the instrument is very light, so it will have the same problems with high energy neutrons as the Leake: there is not enough moderating mass. However, none of these underestimates is very large and EAP is not overestimated by as much as 50% in any of the fields.

PRACTICAL IMPLICATIONS OF NEUTRON SURVEY INSTRUMENT PERFORMANCE
142
Significant overestimates of effective dose for the isotropic fields cannot be avoided, simply because of the conversion coefficients. However, since the instrument does not have very large overestimates of EAP, its overestimates in the isotropic fields are also not so large. Additionally, this instrument and the HPA/BNFL Novel Survey Instrument, offer the potential for determining that the field is soft and isotropic. What they cannot determine is the direction distribution of a hard field, but hard fields are probably quite unidirectional.
10 20 40 100 200 400
H*(10)/Φ (pSv cm2)
0.5
1
2
M0
°/ D
ose
equiv
ale
nt
1
2
3
45
M0
°/E
RO
T
1
2
3
45
M0
°/E
ISO
Calibration Simulated workplaceGas cooled reactor
PWR
Fuel cycle
Source fabricationTransport flasks
MOx fabrication
solid square: EAP
open square: H*(10)
FIGURE 101 H*(10) and effective dose response of the Hybrid Survey Instrument in workplace fields for irradiation from the reference direction (θR = 0°), and for spherical and rotational isotropy. The isotropic fields are only considered for effective dose. The calibration used is 0.94 times the H*(10) response to 252Cf.

RESPONSE IN WORKPLACES
143
Situations may exist where a hard field has a component that has approximate rotational isotropy because there may be a number of relatively unshielded sources in the same room. That would cause these multi-detector systems some difficulty. However, they can probably be used to determine effective dose well for unidirectional, hard fields, and use a different calibration when the field is determined to be both soft and isotropic.
7.10 Sellafield MOX Plant fields
Because the calculated fields for the Sellafield MOX Plant have a known direction distribution it is possible to more correctly understand the response of these instruments in those fields, particularly the ones that have known angle dependence of response. To do this, the calculation initially assumes that the entire fluence is coming from the reference direction (labelled “Total” in Tables 29-32). This is the same calculation that was performed for the reference direction previously and gives the systematic error that would result, both in terms of ambient dose equivalent and effective dose for antero-posterior irradiation.
TABLE 29 Results for the Leake 0949 in the Sellafield MOX plant, Site II, position 4. The calibration of the instrument that is assumed would give a 15% underestimate of H*(10) for a bare 252Cf source incident from the reference direction.
Component Fraction, f f.RΦ f.RH*(10) f.RE f.RH*(10)/RCal f.RE/RCal
(cm2) (nSv-1) (nSv-1) Total field 1.000 7.83 10-2 0.83 1.07 0.96 1.23
AP 0.069 1.09 10-2 0.06 0.12 0.06 0.14
ROT 0.228 2.74 10-2 0.19 0.50 0.22 0.57
ISO 0.703 4.46 10-2 0.66 0.87 0.76 1.01
AP + ROT + ISO 1.000 8.29 10-2 0.90 1.49 1.06 1.75
TABLE 30 Results for the NM2B in the Sellafield MOX plant, Site II, position 4. The calibration of the instrument is for H*(10) with a bare 241Am-Be source incident from the reference direction.
Component Fraction, f f.RΦ f.RH*(10) f.RE f.RH*(10)/RCal f.RE/RCal
(cm2) (nSv-1) (nSv-1) Total field 1.000 9.24 10-2 0.98 1.26 1.02 1.32
AP 0.069 1.36 10-2 0.07 0.09 0.07 0.09
ROT 0.228 2.60 10-2 0.18 0.36 0.19 0.38
ISO 0.703 4.25 10-2 0.63 1.92 0.66 2.01
AP + ROT + ISO 1.000 8.21 10-2 0.88 2.37 0.92 2.48
If this field is assumed to be unidirectional, then the ratio of the reading to the true ambient dose equivalent using the 0949 would be 0.96, whilst those for the NM2B and Studsvik 2202D would 1.02 and 1.06 respectively. For the NM2B, this would become 1.04 if it were held at arm’s length down by the side. For effective dose, the ratios for the 0949, NM2B and Studsvik 2202D are 1.23, 1.32 and 1.37 respectively, using this simple

PRACTICAL IMPLICATIONS OF NEUTRON SURVEY INSTRUMENT PERFORMANCE
144
treatment. For the NM2B held at arm’s length, the ratio for effective dose increases to 1.33.
TABLE 31 Results for the NM2B held at arm’s length down by the side of the BOMAB phantom in the Sellafield MOX plant, Site II, position 4. The calibration of the instrument is for H*(10) with a bare 241Am-Be source incident from the reference direction.
Component Fraction, f f.RΦ f.RH*(10) f.RE f.RH*(10)/RCal f.RE/RCal
(cm2) (nSv-1) (nSv-1) Total field 1.000 9.34 10-2 0.99 1.28 1.04 1.33
AP 0.069 1.36 10-2 0.07 0.09 0.07 0.09
ROT 0.228 2.81 10-2 0.19 0.39 0.20 0.41
ISO 0.703 3.95 10-2 0.58 1.78 0.61 1.87
AP + ROT + ISO 1.000 8.11 10-2 0.85 2.26 0.88 2.37
TABLE 32 Results for the Studsvik 2202D in the Sellafield MOX plant, Site II, position 4. Calibration of the instrument is for H*(10) with a bare 241Am-Be source incident from the reference direction.
Component Fraction, f f.RΦ f.RH*(10) f.RE f.RH*(10)/RCal f.RE/RCal
(cm2) (nSv-1) (nSv-1) Total field 1.000 1.25 10-1 1.33 1.71 1.06 1.37
AP 0.069 1.81 10-2 0.09 0.12 0.07 0.09
ROT 0.228 3.54 10-2 0.24 0.49 0.19 0.39
ISO 0.703 5.53 10-2 0.82 2.50 0.65 2.00
AP + ROT + ISO 1.000 1.09 10-2 1.15 3.11 0.92 2.48
When the fields are broken into their constituent parts, and the appropriate response for each geometry is applied in the folding, the ratio of the reading to the true H*(10) for the 0949 becomes 1.06 (Table 29). This is caused by the response from the reference direction (0°) being lower than those for rotational or spherical isotropy for all energies below a few MeV. The method has more impact on the estimation of effective dose, because ambient dose equivalent is an isotropic quantity whereas effective dose is not. The simple assumption that the field is unidirectional and that the person is facing the field gives a ratio for effective dose of 1.26. If the field were entirely rotationally isotropic then the ratio would be 1.91 or for spherical isotropy, it would be 2.66. However, when effective dose is more accurately assessed, the ratio is seen to be 1.75, although this still assumes that the person is facing the closest source of neutrons.
For the NM2B, the impact of the breakdown of the field into its directional components could have a major impact, because for soft fields its response can be significantly higher if the field is isotropic. Conversely, for hard fields the response can be significantly lower when the field is isotropic. In this case, the two effects virtually cancel, so the ambient dose equivalent response changes by only 1% (Table 30). The impact in harder or softer fields would be greater.
The impact on the reading calculated for the NM2B in terms of effective dose is much more significant. The dominance of the isotropic component, for which the response is higher, causes the ratio calculated reading to the true effective dose to be 2.48. The
RESPONSE IN WORKPLACES
145
simple assumption that the field is unidirectional gives a ratio of only 1.26, whereas that for rotational isotropy would be 1.76 or for spherical isotropy 2.63.
When the instrument is held by the BOMAB phantom, at arms length down by the side, the ratio of the reading to true ambient dose equivalent would be 0.88 instead of 1.02 (Table 31). The assumption of antero-posterior irradiation when held by the BOMAB would have increased the ratio to 1.04. The impact on the effective dose assessment, however, is not so great: the ratio falls from 2.48 to 2.37.
The data for the Studsvik 2202D show that the ratio of the reading to true ambient dose equivalent changes from 1.06 to 0.92 when the true direction distribution of the field is considered (Table 32). Hence an implied 6% overestimate becomes an 8% underestimate. For effective dose, the ratio becomes 2.48, when the assumption of irradiation from the reference direction in a unidirectional AP field would give 1.37. For rotationally and spherically isotropic fields the ratios would be 1.89 and 2.73 respectively.
For this relatively isotropic field, the assessment of ambient dose equivalent that is made using the assumption of unidirectional irradiation from the reference direction is not very different from that which is obtained by using the calculated direction distribution. The difference amounts to about 10% in each case, although the response is increased for the 0949 and decreased for the NM2B and Studsvik 2202D. This is because the instruments have relatively good direction dependence of response and ambient dose equivalent is an isotropic quantity. For effective dose, however, the direction distribution is seen to be very important. Each of the instruments has a small overestimate of effective dose for irradiation only from the reference direction: the ratio of reading to EAP ranges from 1.23 to 1.37. However, if the worker is facing the glove-box they are working with, so that the unscattered component from that glove-box is truly incident antero-posterior, then the ratio of the reading to effective dose is actually in the range from 1.75 to 2.51. The instruments as calibrated hence give quite substantial overestimates of effective dose in this practical situation, when the simple calculation implies that the overestimates are small.
When the NM2B is held during the measurement, shielding by the body reduces the reading significantly. There is a consequent underestimate of ambient dose equivalent. This conclusion may be affected by local changes to the field, since when used in this manner the instrument will be lower than is ideal. In terms of effective dose, the reduced response translates to a reduced overestimate. Hence, for this situation, whilst there would be a detrimental affect on the ambient dose equivalent assessment, the assessment of effective dose would be marginally improved. For other workplaces, the influence of the user may have more significant impact, especially where a strong component of the field is shielded by the body or legs.

PRACTICAL IMPLICATIONS OF NEUTRON SURVEY INSTRUMENT PERFORMANCE
146
8 CONCLUSIONS
8.1 Modelling and experimental data
The MCNP models of the Leake 0949 and Studsvik 2202D have been significantly improved, especially for irradiation through the electronics. Both of these models, and that for the NM2B, were hence ready for experimental validation using radionuclide sources and some monoenergetic fields at the National Physical Laboratory.
The magnitudes of the experimental and calculated response characteristics have been difficult to reconcile for all instruments without assuming there to be significant instrument-to-instrument variation. This variability is evident between instruments of the same model, although differences between models of the same instrument type are seen to be larger.
There has been a general increase in the response to radionuclide sources with time, which is probably caused by changes to the central detector. The fill-gas pressure may be the main factor involved, since the relative price of the gases has fallen, and there is little or no scope for the active volume to be increased for spherical central detectors. Cylindrical central detectors, however, do contain significant inactive volumes and the internal construction has varied over the 30-40 years in which they have been used in this application. Their active volume could have increased.
An additional factor may be the discriminator setting: it is set to eliminate photon induced pulses, which have been found to be less problematic for the Leake detector than originally thought (Leake, 2004). The discriminator setting has hence been lowered, and the response increased. This increase should be almost independent of incident neutron energy, although the pulses due to elastic scattering of high-energy neutrons may mean that there is a weak energy dependence. Photon induced pulses are less problematic for BF3 tubes because of the higher Q-value for the 10B(n, α) reaction (2790 keV) compared to that for the 3He(n, p) reaction (764 keV). Hence, there is less likelihood that the discriminator settings can have been responsible for increases in the response of the Andersson-Braun designs.
There is no evidence that changes to the magnitude of the calibration response of the instrument will affect its energy and angle dependence. For this reason, the response data that have been calculated in this work are recommended for use only after normalization by the measured response of a specific instrument. That measurement could be made with either a radionuclide source or a monoenergetic field, but it is important that the field should not be significantly perturbed by room scatter. National standards or other laboratories with low scatter facilities should be used for such calibrations.
Once the instrument-to-instrument variability of the magnitude of the response has been taken into account, there is seen to be good agreement between the prior experimental data for irradiation from the reference direction and for other angles of incidence. This has been supported by irradiations performed specifically for this work with both radionuclide sources and monoenergetic neutrons. The least good agreement is seen

CONCLUSIONS
147
for irradiation through the electronics, but that direction will always be difficult to accurately represent in an MCNP model: an unfeasible amount of effort would be required to describe all of the electronic components and there would remain some uncertainty about the materials from which they are constructed. Additionally, major changes to the electronics are marked by changes to the model number, but comparisons between ostensibly identical instruments show up small differences. Consequently, a model that truly represents a particular instrument for irradiation through the electronics may fail to represent all instruments of that type.
Agreement between the normalized MCNP response values and measured data is not so good in the 15-20 MeV energy range. Some, but not all, experimental data are higher than the calculated data, sometimes by quite a large amount. The cause of this is unclear, although it could be either connected to the difficulty in performing calculations or making measurements in this energy range.
The calculations for higher energies are more complicated because there are interactions other than 10B(n, α) or 3He(n, p) that can take place in the central detector could contribute to the response. One of these is simply elastic scattering, which can generate recoiling nuclei with sufficient energy for pulses to be above the set threshold once the neutron energy is high enough. However, there are other reactions that have threshold energies and negative Q-values, which will also produce pulses. The situation for the 3He detector is simpler than that for the BF3 detector, because of the limited options for reactions. However, none of these other reactions appears to have a very significant impact on the response (Figure 102).
The fraction of the events in the BF3 tube that could generate detectable pulses does contain an increasing fraction that are not 10B(n, α) reactions (Table 33), but it is still less than 5% of the total at 20 MeV. It is difficult, however, to calculate what fraction of these other events would produce detectable pulses because they don’t all transfer a fixed amount of energy. Elastic scattering in particular transfers relatively little energy for small angle scattering and the energy transferred is smaller for heavier scattering nuclei. Because 19F accounts for 81% of the elastic scattering events, and elastic scattering accounts for 90% of non 10B(n, α) events, the number of additional pulses will be very low. Other factors will also reduce the detection efficiency of these other events: they have negative Q-values; some of the events, such as (n, n′ α), transfer variable amounts of energy.
Whilst some of the experimental data for the 15-20 MeV energy range do agree with the calculated data, some are 20-50% higher. A few very old results (Andersson and Braun, 1964; Widell and Svansson, 1973) are even higher still. Discrepancies of this magnitude are hard to explain via simplifications in the modelling, since the results for the Studsvik 2202D indicate that the maximum number of events that have been incorrectly omitted is 4.4% at 20 MeV, but it is likely that very few of these would be detected. The problem is more likely to lie with the measurements. Many of the data in question relate to the response at 19 MeV, for which the reaction used is T(d, n)α. Whilst the target used will vary in composition, contamination of the neutron field by other reactions in the target will inevitably complicate the irradiation field. For example, the experimental verification of the calculated data for the SWENDI-II was performed in a field that had 27% contamination with 5.8 MeV neutrons from the D(d, n)3He reaction. The effect of this

PRACTICAL IMPLICATIONS OF NEUTRON SURVEY INSTRUMENT PERFORMANCE
148
component will be magnified by the response of all of the survey instruments considered here having substantially higher response at 5.8 MeV than at 19 MeV. It is hence plausible that the poor agreement at high energies is caused by either a lack of appreciation of the need for a subtraction of the signal due to contamination of the field, or poor enactment of that subtraction.
6 8 10 12 14 16 18 20
En (MeV)
10-10
10-8
10-6
10-4
Even
ts p
er
sou
rce n
eu
tron
10B(n, α)
11B elastic
10B(n, other)
11B(n, all)
19F(n, all)
19F elastic
10B elastic
FIGURE 102 Events in the active volume of the BF3 tube in the Studsvik 2202D calculated using MCNP. Only the 10B(n, α) reaction is considered for the response of the instrument. The labels “other” and “all” include (n, p), (n, d), (n, t), (n, n’α) and (n, t2α) reactions.
TABLE 33 Fraction of events that could generate pulses in the detector that would be obtained by tallying only 10B(n, α) events. For lower energies this fraction will become 100%.
Source neutron energy (MeV) 10B(n, α) reactions as fraction of total 6 97.4%
8 97.1%
10 96.7%
12 96.6%
14 96.2%
16 96.0%
18 95.8%
20 95.6%
Generally, the electronics have become smaller and the battery requirements reduced, so the data for irradiation through the electronics can only be applied to the model of each instrument that has been simulated. This also applies to a lesser extent to the
CONCLUSIONS
149
responses for isotropic sources, particularly that for rotational isotropy, both of which involve irradiation through the electronics. This should not impair the validity of the results because when they are used in the workplace the electronics should not face the primary source of neutrons. Consequently, deficiencies in the calculated response from that direction should not have a significant impact on the conclusions that can be drawn about the response of the instruments in the workplace. However, this depends on the user being aware of both the correct orientation for the instrument and the primary direction of the neutron field. If the design of the instrument causes it to be held most naturally with the electronics away from the body, then a naïve user may orient it in precisely the most inappropriate manner.
8.2 Response in workplaces
Once confidence had been gained in the accuracy of the modelling, detailed energy and angle dependence of response data were calculated for the instruments. These data are for plane parallel beams in the horizontal plane, so they can be used to construct the response to rotationally isotropic fields. Additional data have been generated using spherically isotropic fields.
Interpretation of the response of the instruments in the workplace could use the detailed energy and angle response data, but workplace fields do not have such detailed determinations of their direction distribution so they would be difficult to apply. Additionally, whilst unscattered fission and (α, n) neutrons will have a strong direction distribution, the field at the measurement position will have a large scattered component, which will be more isotropic. Consequently, interpretation of the instrument responses uses only irradiation from the reference direction plus rotationally and spherically isotropic fields. However, the data available in this report will enable a user to determine the response of an instrument for their particular application, if they have a known energy and direction distribution.
Most of the instruments included in this study work on very similar principles: a central detector whose response is effectively 1/v, surrounded by a polyethylene moderator which contains a perforated thermal-neutron absorbing layer located at an appropriate depth. The absorbing layer varies in composition, as do the shapes of the central detectors and moderators, but this principle is the basis of all of the instruments of this type. Their responses are seen to differ significantly but have the same basic form: there is an overestimate for intermediate energy neutrons, an underestimate for thermal neutrons, approximate dose equivalent response for fast neutrons and a falling response for higher energies.
The balance between the under-response to thermal neutrons and the over-response to intermediate energy neutrons tends to be the decisive factor when the accuracy in a particular workplace is considered. For the lightest instrument, the Leake, the manufacturer’s recommended setting leads to small underestimates of ambient dose equivalent for hard fields. This is intended to counterbalance the overestimate that is seen for soft fields, for which this instrument can overestimate ambient dose equivalent by up to 100% using this calibration (Figure 86). If a soft field contains little dose

PRACTICAL IMPLICATIONS OF NEUTRON SURVEY INSTRUMENT PERFORMANCE
150
equivalent in the intermediate energy range, the assessment of ambient dose equivalent is good.
Practical considerations must also be taken into account. This instrument is the most widely used in the UK, in part because of its historic connection to the UK nuclear power industry, but also because of its lightness. Total mass has a strong influence on the quality of the dose equivalent response that is achievable and has an equally strong influence on its ease of use. This will be particularly important when surveys are performed in large facilities, where it may be necessary to carry the instrument significant distances between measurements, and in cramped facilities: the health and safety aspects of manual handling of heavy objects must be considered.
Some of the deficiencies of the response of the Leake design have recently been addressed (Leake, 2004). The new specifications for this instrument, which is intended for commercial production, will make significant improvements to its sensitivity and energy dependence of response. Since the design of this instrument has been modified further since publication, no attempt was made to include it fully in this study.
The NM2B does not overestimate soft fields as significantly as the Leake, because its over-response in the intermediate energy range is smaller (Figure 88). Consequently, it can be calibrated without causing it to under-respond to hard fields. Generally, this instrument performs well in workplace fields, rarely producing substantial biases in terms of ambient dose equivalent. Its direction dependence of response is less satisfactory, because the model indicates that thermal neutrons penetrate too efficiently through the electronics. Conversely, the electronics over-shield fast neutrons. This has an impact on the response to isotropic fields, especially rotationally isotropic fields. Given its cylindrical symmetry and its not having a rounded end to the cylindrical moderator, it would be expected to have poorer angle dependence of response than the spherical Leake, but the influence of the electronics makes the difference larger than it would otherwise be.
Although the Studsvik 2202D is also based on the Andersson-Braun design (Andersson and Braun, 1963), with the modification that it has a rounded end to its cylindrical moderator, its ambient dose equivalent response is more conservative in the workplace: there are fewer fields in which it is calculated to under-respond, but it can over-respond by more than the NM2B. This is a characteristic that is observed for soft fields only, the difference deriving from its having a higher response to thermal and intermediate energy neutrons than the NM2B. The better angle dependence of response of the 2202D enables it to give better estimates of ambient dose equivalent than the NM2B for isotropic fields, especially hard rotationally isotropic fields. Such fields, however, may not be encountered frequently in the workplace.
The BERTHOLD TECHNOLOGIES GmbH & Co KG LB6411, the first instrument that was studied but not modelled in this work, has response characteristics that differ significantly from those of the Leake, NM2B and Studsvik 2202. It has a much smaller over-response in the keV energy region, which does help it to avoid overestimates in some relatively soft fields. However, the relative response to thermal neutrons is a lot lower than those of the other instruments in the study, which causes it to under-respond in terms of ambient dose equivalent for very soft fields. Consequently, the instrument

CONCLUSIONS
151
provides less conservative estimates of ambient dose equivalent than the other instruments studied. These can cause underestimates of effective dose in some of those fields, although that would require the field to be relatively unidirectional, which soft fields are unlikely to be. To complicate matters, the calibration response specified by the manufacturer, which is taken from the reference (Burgkhardt and Klett, 1997) that generated the response data used in this project, does not match those response data. Calibration using the response to a bare 252Cf source that has been calculated for this project would lead to larger underestimates of ambient dose equivalent.
The final single-detector instrument considered, the SWENDI-II, is considerably different. It is designed to cover a much wider energy range, which it achieves by using tungsten as an attenuator instead of boron or cadmium, with the added benefit of the tungsten acting as a multiplier for high-energy neutrons. It is also heavier than any of the other designs that have been considered here. Use of the manufacturer’s recommended response would lead to substantial overestimates of ambient dose equivalent in the workplaces that have been considered for this work. That calibration may be appropriate for its use in higher energy neutron fields, but would cause it to overestimate ambient dose equivalent in all of these fields, with the consequent overestimates of effective dose being larger still. As an alternative means of presenting the data, they have also been normalized to the bare 252Cf response, which gives better performance, though the overestimates for soft fields can still be exceed a factor of two. Application of a χ2 fit to the ambient dose equivalent responses to the fields in this work gives an optimum response that is 1.33 times the bare 252Cf response. That may be the best option for use of this instrument in nuclear power and fuel cycle fields, though it would allow underestimates of ambient dose equivalent in hard fields.
Two quite different instruments have also been considered. These dispense with the perforations in the absorbing layer, and use an array of detectors located close to the surface of the moderator to detect thermal and epithermal neutrons. Their response to monoenergetic neutron fields is seen to be a significant enhancement over those of prior designs, but large variations in the monoenergetic response characteristics do not necessarily cause very significant errors in workplace energy distributions. Neither instrument is in commercial production, but they have been included because they provide an interesting contrast with prior designs.
The first instrument of this type, the HPA/BNFL Novel Survey Instrument, performs well in terms of ambient dose equivalent response in workplace fields, but perhaps not as well as may be anticipated from its energy dependence of response. The reason for this is that whilst this instrument has a small range in its energy dependence of response, the largest deviation is at an important energy for workplace fields: it under-responds between 50 keV and 500 keV where workplace fields contain a significant fraction of dose equivalent.
Because EAP/Φ is only 68% of H*(10)/Φ at 100 keV, the effective dose performance of this instrument is not adversely affected by the underestimate of ambient dose equivalent that is caused by the low 100 keV response. Indeed, by avoiding any significant overestimates of either effective dose or ambient dose equivalent, the instrument also avoids extreme overestimates of effective dose for either rotationally or spherically isotropic fields. Additionally, the instrument has the potential for detecting

PRACTICAL IMPLICATIONS OF NEUTRON SURVEY INSTRUMENT PERFORMANCE
152
that the soft component of the field is isotropic, so it ought to be able to provide an assessment of effective dose for the workplace. That assessment would have to be made using the assumption that the fast component of the field is strongly directional.
The Hybrid Survey Instrument has a slightly less satisfactory energy dependence of response because it does not avoid having a significant over-response in the keV region. However, this is seen to be less significant than the underestimate at 100 keV for the HPA/BNFL Novel Survey Instrument, because the ambient dose equivalent response in the workplace is better. The maximum overestimate is approximately the same, but potential underestimates are smaller. Both instruments perform well, and do seem to offer an improvement over single detector systems, but the lightness of this configuration compared to the original HPA/BNFL design, makes it significantly more commercially viable.
8.3 Perturbation studies
The perturbation studies have yielded very interesting results for a number of parameters. Principal amongst these is probably the sensitivity of the response to the polyethylene density, a parameter that does vary in practice. Varying the density has a very similar effect for all of the instruments, with the fractional change in the response for low energies being a factor of minus four times the fractional change in the density. For high energies, this fractional change is twice the change in the density. This shows how sensitive the response can be to small variations in manufacture.
When studied in workplace fields, the influence of the polyethylene density on the response is seen to be smaller, because the change in the response for the low-energy and high-energy components is opposite in sign. The response in the softest fields could still be perturbed by up to ± 2.5% by the natural 0.5% variation in the polyethylene density. If higher density polyethylene were to be used by mistake, the response could be suppressed by up to 10%.
The accuracy with which the thermal neutron attenuating layer is constructed also has a very strong impact on the response of these instruments. This was modelled by varying the sizes of the holes in this layer and its composition. For the hole size perturbation, it was assumed that the holes all change by the same amount on the basis that they are stamped out using the same punch for every hole. In this case, the change in the response has the same sign as the change in the hole size for all energies, so the impact of this could be quite significant. Its effect would be greatest for soft fields, for which the change in the response is approximately proportional to the change in the hole area. Consequently, a 5% change in the hole diameter causes an approximate 10% change in the response.
The energy-independence of the change in the response caused by changes in the central detector gas pressure was verified. This result is important because were this not true the presumed variation of this parameter from instrument-to-instrument, and its apparent increase with time, would affect the validity of the folding process. Since this perturbation was not energy dependent, it may be assumed that the normalization process that is advocated for the calculated results is valid.

CONCLUSIONS
153
No strong dependence of the response on the boron loading of the rubber attenuating layer was found. The small perturbation in the response is found to be slightly energy dependent, but this does not appear to be a very significant parameter. This is because the low energy neutrons have to pass through the holes or they are captured and the high energy neutrons pass through the layer almost irrespective of whether they encounter a hole or not.
Perturbation of the hydrogen cross-section was seen to be almost analogous to changing the polyethylene density. Uncertainty in this parameter will have an impact on all Monte Carlo calculations, but relatively large changes were required to affect the response significantly. This cross-section was selected for perturbation because of its significance in the moderation process. However, it is well known, so it is very much less important than variation in the polyethylene density. For the Andersson-Braun instruments, it would probably be of more interest for the 10B cross-sections to be perturbed. These are less well known, and they feature in both the attenuation and the detection of the neutrons.
Overall, the perturbation results are a new and important part of this report. None of the references included in this report has considered anything beyond the Monte Carlo counting statistics associated with the modelling. The potential impact in the workplace is reduced compared to that calculated for monoenergetic fields, but variation in manufacture could account for some of the variability observed in the measured responses of these instruments.
8.4 Mode-of-use
Great care is taken to characterize and calibrate neutron area survey instruments in controlled conditions. Ideally, when they are used in the workplace such care will be replicated, with the reading of the instrument being an assessment of the field at the measurement point. However, if the instrument is not placed at an appropriate height, the field that it is trying to assess may not be the same as that at the point of interest. Additionally, if the user is holding the instrument, shielding, moderation and inscatter all become significant perturbations of the field.
Hand held usage is likely to be common during surveys, where measurements may be made in a large number of locations within a facility. This will be particularly true for high dose rate areas where the measurement duration is short. For lower dose rates, when the instrument is to be left for significant durations, it is much less likely to be hand held because of its weight. Consequently, the readings may be taken when the instrument is being held only for the most significant measurements made with them.
Initial calculations investigated the effect of a concrete floor. These showed that the instrument would read up to 50% higher in a highly scattered field if placed on the floor instead of at a reasonable height. When held by a user standing on the concrete floor, the effects of shielding by the phantom counteracted the inscatter from the floor for much of the energy range, although not for thermal and fast neutrons. These investigations have very many variables that can still be investigated, such as:

PRACTICAL IMPLICATIONS OF NEUTRON SURVEY INSTRUMENT PERFORMANCE
154
a Height of the instrument above the floor b Composition of the concrete c The effect of more realistic rooms with walls and a ceiling. d More methods of holding the instrument
The bulk of the mode-of-use calculations concentrated on the effect of a BOMAB phantom on the reading of the instrument. These calculations used both the model of the Leake 0949 and the NM2B, the latter for three different methods of holding it.
Two methods of holding the Leake 0949 whilst making a measurement were considered: in front of the torso and at arm’s length by the side. The first of these was considered to be the most likely way of using the instrument in the workplace so only that one was modelled. When held in front of the torso the instrument is at a height that is appropriate for the assessment of the field, but the influence of the phantom will be greater because the torso is bulkier than the legs. Interestingly, this method of holding the instrument involves pointing the reference direction of the instrument towards the body. The current manufacturer of this design has recognized this and has reoriented the instrument so that the JCS NMS017* now has a handle that makes it natural to hold the electronics towards the body. The reference direction for the instrument will then be pointed towards the user’s perception of the primary direction of the radiation field.
A bare 252Cf field and a very soft field from the control room of the Calder Hall, Magnox reactor in the UK were used directly in the MCNP modelling. For angles where the phantom was not directly shielding the instrument, the influence of the phantom was quite similar for the two fields: a small increase in the response of up to 16% was observed for backscatter from the phantom. However, for irradiation from behind, the Calder Hall field was more significantly attenuated so the response was lower. For unidirectional irradiation through the phantom, the response was only 98% lower with the phantom present for the Calder Hall field, whereas that for the 252Cf field was 93% lower. The Calder Hall field is very soft and highly scattered, so although the neutrons in that location were coming preferentially from one direction, they were not unidirectional. The 252Cf result may hence have more significance for unidirectional irradiation.
The responses for spherically and rotationally isotropic fields were not significantly perturbed by the presence of the phantom. The effects of shielding by the phantom outweighed the inscatter caused by it, so the responses to the two fields were 8-14% lower. This represents the typical underestimate in the response caused by holding this instrument in a soft neutron field. Conversely, the effect for the hard, unidirectional field would be +9% if the user were facing the field, +13% if stood side-on to the field or –93% if stood facing away from the field. It is unlikely that the last option is very common in the workplace, but it would cause a substantial underestimate.
Two orientations for holding the NM2B in front of the torso were investigated using a bare 252Cf energy distribution as the MCNP source. In one of these, the instrument was held with the electronics facing towards the body, and for the other with the electronics at the top. This is a very heavy instrument, so it could not be held in either of these
* http://ds.dial.pipex.com/johncaunt/neutron/pages/nms017.html

CONCLUSIONS
155
positions for very long, if at all. A relatively high dose rate would be necessary for the user to get a significant reading, which may make it more likely that these orientations would be used for hard fields.
The results from these calculations were similar in pattern to those with the Leake 0949. The inscatter was less significant, with the reading being about 5% higher for irradiation from the front or side. Attenuation of the field was also slightly less significant, with the response being 90% lower (cf 93%) for irradiation from the back. When the instrument was held vertically, its active volume was held closer to the body, so the response was more perturbed for irradiation from behind. Consequently, the responses to isotropic fields were lower for this orientation than for the instrument held horizontally, particularly for the rotationally isotropic field for which the response was 24% lower because of the presence of the phantom.
The most detailed modelling was saved for the most plausible method of holding the NM2B, carried using a straight arm next to the right thigh. This is a heavy instrument, and it if is to be held for significant periods this is the only realistic way to do it. The potential for attenuation by unidirectional fields is less, because the thighs are thin relative to the torso. It is a less satisfactory height at which to make the measurements because it does not represent the height at which the main radiosensitive organs would be exposed. Hence, an assessment of ambient dose equivalent at this height is less able to represent effective dose to a worker. However, the reduced perturbation of the reading probably makes it a preferable method of making measurements whilst holding the instrument. For example, the response in a rotationally isotropic 252Cf field is 9% lower with the phantom present, whereas that for the instrument held vertically in front of the torso was 24% lower.
Full energy and angle dependence of response calculations were performed for the NM2B held adjacent to the right thigh. These were used for folding the instrument response with workplace fields. For irradiation from the front, the assessment of ambient dose equivalent was found to be slightly increased for hard fields, but for softer fields the inscatter from the phantom was more significant. Since the instrument tends to overestimate for such fields, the general overestimate was increased, although these fields are the least likely to be unidirectional.
For isotropic fields, in particular rotationally isotropic fields, the response for soft fields is significantly lower, there being a general tendency to underestimate ambient dose equivalent. This does not have an adverse affect on the conservative nature of the ambient dose equivalent assessment relative to effective dose. There are two sets of fields for which the effective dose assessment is worse; hard rotationally isotropic fields and soft unidirectional fields are overestimated by a larger factor. The latter category is not very realistic so for soft fields it is hence likely that holding the NM2B will improve the assessment of effective dose. For harder fields the isotropic geometries are less realistic, so the hand-held measurements are seen to only be a problem if the primary component of the field is shielded, in which case large underestimates will inevitably occur for the energy range considered in this work.

PRACTICAL IMPLICATIONS OF NEUTRON SURVEY INSTRUMENT PERFORMANCE
156
8.5 Summary
This project includes perhaps the most detailed modelling performed to date on neutron area survey instruments. Not only have the geometric specifications of the instruments been improved, but the energy and angle dependence of response have been modelled in smaller increments than are available in any of the published references. This has enabled the response characteristics to be applied to understanding the response of the instrument in workplaces, given assumptions about the direction distributions of the fields. Such assumptions are required to account for the angle dependence of response of the instruments. They are also needed to assess whether the ambient dose equivalent assessment made using the instrument provides a conservative estimate of effective dose, because effective dose is not an isotropic quantity.
In addition to analysing the response of the Leake 0949, the NM2B and the Studsvik 2202D in workplace fields, the published data for the LB6411 and SWENDI-II have been included in the study. Unfortunately, angle dependence of response data are not available for either of the latter instruments, so analysis of their response in terms of effective dose has had to assume isotropic response.
All of these single detector designs are found to make generally conservative estimates of ambient dose equivalent. The Leake 0949, which has the smallest and hence lightest moderator, has a recommended calibration that allows underestimates of ambient dose equivalent in hard neutron fields to avoid excessive overestimates in soft fields. The significantly heavier NM2B and Studsvik 2202D have better ambient dose equivalent response in workplace fields, although their direction dependence is less satisfactory. The spherical symmetry of the Leake is clearly preferable in this respect.
The two newer designs perhaps perform poorer in terms of ambient dose equivalent response, although this depends on the workplace application. The LB6411 has a reduced overestimate in the 1-10 keV energy region but this leads to a significant under-response to thermal neutrons. In workplaces, this is seen to give it very good ambient dose equivalent response, unless the field is very soft. This effect is most significant for a sub-set of the UK gas cooled reactor fields, but is also noted for some PWR fields and the SIGMA calibration field. There is some confusion over the correct calibration response of this instrument, since the data that are published for its response to a 252Cf field do not match the response that is calculated for that field from the response data in that same reference. If the instrument were to be calibrated using a bare 252Cf exposure, then its calibration response may be too high, and significantly larger underestimates of ambient dose equivalent would result.
The other additional single detector survey instrument that has been studied, the SWENDI-II, requires a slightly more complex analysis. This is because its calibration has been specified for higher energy neutron fields than are included in this work. It hence has a large overestimate in terms of ambient dose equivalent, and would overestimate all of the fields in this study. This is exacerbated by it having the highest response in the keV energy range relative to its response to neutrons from 1-5 MeV of all of the instruments that have been included in this project. To avoid subjective judgements about the correct calibration response, the data have also been presented

CONCLUSIONS
157
for a bare 252Cf calibration. This is more appropriate, but a higher calibration response would perhaps be preferable for the workplace fields that have been used in the folding.
Generally, the instruments through being calibrated in terms of ambient dose equivalent avoid underestimates of effective dose. There are exceptions, such as the LB6411 for unidirectional, very soft fields. However, fields that are so soft will have encountered considerable scattering and hence they will not be unidirectional. In terms of the isotropic geometries considered, these estimates of effective dose are still conservative.
One field that causes problems for the instruments in this respect is the bare 241Am-Be calibration field. EAP/Φ is higher than H*(10)/Φ for this field alone amongst those included in this work. Hence, if the instrument is calibrated using this field it will underestimate effective dose by 5%. This makes the field particularly problematic for the lightest instrument, the Leake, for which there is a 28% underestimate of effective dose. The unscattered field from a point source will be unidirectional so the assumption of some degree of isotropy is not realistic for that field.
Because A-P irradiation represents the maximum for effective dose for the energies considered here, when rotational or spherical isotropy is assumed large overestimates of effective dose tend to result. This is particularly true for soft fields for the Leake, for which the instrument overestimates ambient dose equivalent. Consequently, for spherically isotropic fields the instrument can overestimate effective dose by up to a factor of six. All of the instruments suffer from this to differing degrees, but when the ambient dose equivalent from thermal neutrons is not underestimated, the problem is more severe. The SWENDI-II is the prime example of this.
Two more sophisticated instruments have also been included in the study. Neither is commercially available, but they have sufficiently different response characteristics for them to be of interest. Both designs have a smaller overestimate for neutrons in the 1-10 keV energy range than do prior designs and the potential for producing systematic errors in monoenergetic fields is much reduced. Inspection of their energy dependence of response (Figure 83) gives the impression that they will perform significantly better than the single detector designs simply because the maximum deviations from the calibration response are smaller.
In workplace fields, the enhancement to their performance is not as significant as might be anticipated from inspection of the plotted response to monoenergetic neutrons. For the HPA/BNFL Novel Survey Instrument, this is because it has a significant underestimate at 100 keV, an important energy in many of the fields. However, despite its underestimating ambient dose equivalent in some of these fields by up to 30%, it does not underestimate effective dose in any field by more than 4%. The avoidance of any significant overestimates of ambient dose equivalent assists the effective dose performance: the overestimates of isotropic fields reach a factor of 3.5, which is slightly more than the maximum for the LB6411, equivalent to the NM2B and better than the other single detector instruments.
The Hybrid Survey Instrument, despite being lighter than the original HPA/BNFL design, performs better. Its estimates of ambient dose equivalent are within the range from -26% to +31% of the true value. The corresponding values for the HPA/BNFL version are -30% to +35% and those for the best single detector design in this respect, the NM2B,

PRACTICAL IMPLICATIONS OF NEUTRON SURVEY INSTRUMENT PERFORMANCE
158
-25% to +31%. Clearly, these designs do not offer a major advance over the single detector systems in this regard, although they do have the potential to make corrections to the reading based on the direction dependence and hardness of the field.
The validity of the modelling results has been assessed using perturbations in order to understand whether the intrinsic variability of the response between instruments is caused by manufacturing uncertainties. Several parameters have been tested:
a Polyethylene density b Accuracy of attenuating layer construction, specifically the sizes of the holes c Composition of the attenuating layer d Central detector gas pressure e Accuracy of the cross-section data for hydrogen
Of these, the polyethylene density is found to be the most likely cause of natural variation between instruments. Commercial products have a range of densities and the density has an energy-dependent influence on the response: for low energies the response is approximately inversely proportional to the density, whereas for high energies it is proportional to the density. This is found to have a potentially significant impact on the response in workplace fields: the ambient dose equivalent response for some fields falls by up to 10% relative to the calibration response for plausible changes to the polyethylene density. The severity of the effect is ameliorated by the calibration sources having energy distributions around the energy where the impact changes from positive to negative. An extreme case of this is the Studsvik 2202D, for which the response to a bare 252Cf source is found to be independent of polyethylene density.
The response is found to be even more sensitive to the sizes of the holes in the thermal neutron attenuation layer. The likely variation in this parameter is not so easy to assess, but the energy dependence of the effect is quite strong. Additionally, since the Andersson-Braun designs use a flat boron-loaded rubber sheet, from which the holes are punched, prior to rolling it into a cylinder, the shape of the holes in the instrument is slightly distorted. The total area of the holes is found to be the crucial factor, so slight opening of all of the holes when the sheet is bent will increase the response in soft fields relative to the calibration field. A systematic error in the size of the punch will also have a systematic effect for all of the holes, so it is reasonable to assume that this will not be a statistical uncertainty.
Modelling of the effect of a user holding the instruments to make measurements has shown that the impact on the reading is not very significant, unless the user shields a significant component of the field. The shielding provided by the torso is more significant in terms of effect and solid angle than that provided by the legs, but in both cases the response of the instrument is suppressed by 90-95% for specific angles of incidence. This does not have a very large effect on the reading in isotropic fields, although it can reach 25% if the sensitive volume of the instrument is held close to the torso.

CONCLUSIONS
159
8.6 Future work
The models developed in this work have been exhaustively tested for energy and angle dependence of response. The new areas of study that have been developed, the sensitivity of the calculated results to the input parameters and natural variations in manufacture and mode-of-use, both show interesting preliminary results. These may be worthy of further development so that more conclusive analysis of the impact becomes possible.
Developments in neutron area survey instruments have been relatively few in the last 40 years. However, a recent paper (Leake, 2004) has announced the most significant change to the Leake design since it was introduced in the 1960’s. Although the instrument is not yet commercially available, it is likely to be commercialized soon. The response data warrant being treated in the same manner as those for the LB6411 and the SWENDI-II to assess whether the new design offers significant dosimetric improvement.
8.6.1 Direction distribution data Workplace direction distributions are vital to understanding effective dose. The only fields in this study that have direction information are the calculated fields, for which the direction resolution is crude. Consequently, the analysis of the response and dose quantities in the workplaces requires assumptions to be made. In reality, most of the fields in the study will have stronger direction dependence for the fast component of the field than they have for the soft component. Knowledge of this aspect of workplace fields will also have significant impact on the mode-of-use analysis.
Recent developments on measuring the energy and direction distribution of workplace fields are beginning to show real promise (Luszik-Bhadra et al, 2004). Preliminary results were in press (Bolognese et al, 2004), but were not ready for inclusion in the analysis for this report. Early results were for a boiling water reactor and locations near an NTL11 fuel flask at Krümmel in Germany plus the VENUS research reactor and Belgonucleaire fuel fabrication plant at Mol in Belgium. Measurements have also been performed in a PWR and near a fuel flask at Ringhals in Sweden and at another European nuclear facility storing special nuclear material. The data are now available (Schuhmacher et al, 2006) and they could form the basis of a very interesting extension to this project.
8.6.2 New ICRP Recommendations The new recommendations of ICRP are available in draft form (ICRP, 2006). These include proposals for changes to the quantity effective dose for all forms of incident radiation, which are linked to changes to the tissue weighting factors. For neutrons, there is also a change to the radiation weighting factor for energies of 1 MeV and below (Figure 103), which will reduce the effective dose for soft fields by as much as a factor of two. None of the changes affect ambient dose equivalent, so the impact will relate to the conservative nature of H*(10) measurements with respect to effective dose.

PRACTICAL IMPLICATIONS OF NEUTRON SURVEY INSTRUMENT PERFORMANCE
160
It is not possible here to assess the consequences of the new ICRP recommendations since they have not been formally accepted yet. Additionally, there are proposals for changes to the phantoms that are used for the effective dose calculations: the old MIRD (medical internal radiation dose) phantoms, which use geometric shapes to define the organs of the body, will be replaced with hybrid voxel-MIRD phantoms. These new phantoms are expected to be used for the updated conversion coefficient calculations with the new tissue and radiation weighting factors, so it is not yet possible to predict the magnitude of any effects until new conversion coefficients are published by the ICRP.
10-2
10-1
100
101
102
103
104
105
106
107
Neutron energy (eV)
0
5
10
15
20
wR
ICRP Publication 60
Proposed new wR
FIGURE 103 Current wR function recommended by ICRP and the new function proposed, but not yet accepted, in their new proposals. The existing conversion coefficients for effective dose were calculated using the function as plotted above, rather than the step function that is also given in ICRP Publication 60 (ICRP, 1991).
Generally, the changes are expected to lower the fluence to effective dose conversion coefficients for neutrons with energies below 1 MeV. This is intended because the current definition of effective dose causes the dose deposited by secondary photons to receive a weighting factor of at least 5. For lower neutron energies this is the dominant component of the dose deposited by the neutrons incident on the body, so the weighting of 5 is clearly inappropriate. Whilst precise specification of the implications of this change will have to wait until new conversion coefficients are published it is clear that the overestimates of effective dose for soft fields that have been calculated in this work will be increased. The impact on the instrument reading will be instrument dependent, but the overestimates of effective dose that have been calculated to be in the range 3-5

REFERENCES
161
in soft isotropic fields may become overestimates of 6-10 when the ICRP revisions are fully implemented.
9 ACKNOWLEDGEMENTS
The authors would like to thank the following bodies and people for their assistance in funding the project, the provision of data, assistance with the calibrations and work on an earlier contract to model neutron area survey instruments (Bartlett et, 2002):
a The National Measurement System Policy Unit of the Department of Trade and industry for funding this work
b Olof Andersson from Wedholm Medical AB for providing information on the response of the Studsvik Neutron Monitor 2222A
c Tim Daniels from HPA for the provision of survey instruments to help with the modelling and discussions on the current usage of survey instruments in the UK
d Nicky Horwood from the National Physical Laboratory for her help with the radionuclide source measurements
e Peter Kolkowski from the National Physical Laboratory for making the thermal pile measurements
f Hamid Tagziria of the JRC, Ispra, Italy for his development of the original MCNP models of the Leake design and the Studsvik 2202D
g Andy Winsby and Malcolm Joyce from the University of Lancaster and Jon Silvie from BAE Systems for assistance with the modelling of the BAE SYSTEMS Hybrid Survey Instrument
10 REFERENCES
Alberts WG, Cosack M, Kluge H, Lesiecki H, Wagner S and Zill HW (1979). European Workshop on Neutron Dosimetry for Radiation Protection. Braunschweig, Physikalisch-Technische Bundesanstalt. Report BTB-ND-17.
Alberts WG and Lesiecki H (1982). Neutron flux density measurements and rem counter calibration at the 24.5 keV filtered beam of the FMRB. Radiat Prot Dosim, 2, 241-244.
Alberts WG and Schwartz RB (1985). Comparison of the filtered-neutron beams at the NBS and PTB reactors by calibrating a spherical rem counter. IN Proceedings of the Fifth Symposium on Neutron Dosimetry, Neuherberg, 1984. EUR-9762. Luxembourg: European Commission. 629-636.
Alevra AV (1994). Accurate neutron fluence measurements using Bonner spheres. IN: Reactor Dosimetry, ASTM STP 1228 (Editors: Farrar H, Lippincott EP, Williams JG and Wehar DW). Philadelphia, PA: American Nuclear Society.
Alevra AV, Klein J, Knauf K, Wittstock J and Wolber G (1997). Neutron spectrometry and dosimetry in the environment and at workplaces. IN: Proceedings of the IRPA Regional Symposium on Radiation Protection in Neighbouring Countries of Central Europe, Prague, September 1997. (Editor: Sabol J). 214-218. Prague: Czech Technical University.

PRACTICAL IMPLICATIONS OF NEUTRON SURVEY INSTRUMENT PERFORMANCE
162
Apfel RE and d’Errico F (2002). A neutron spectrometer based on temperature variations in superheated drop compositions. Nucl Instrum Methods, A476, 298-303.
Andersson IÖ and Braun J (1963). A neutron rem counter with uniform sensitivity from 0.025 eV to 10 MeV. IN Neutron Dosimetry (Symposium Proceedings, Harwell, 1962), 2, 85-89. Vienna: IAEA.
Andersson IÖ and Braun J (1964). A neutron rem counter. Nucleonik, 6, 237-241.
Answers Software Service (1996). MCBEND. A Monte Carlo program for general radiation transport solutions. User guide for version 9A. Harwell: AEA Technology.
Aroua A (1994). Institut de Radiophysique Appliqué, Lausanne, Switzerland. Personal Communication.
Axton EJ (1972). The effective centre of a moderating sphere when used as an instrument for fast neutron flux measurement. Journal of Nuclear Energy, 26, 581-583.
Bartlett DT and Greenhalgh JR (1986). Calculations of effective dose equivalent, ambient dose equivalent and individual dose equivalent for a set of reference neutron spectra and field geometries. Health Physics, 50(4), 548-550.
Bartlett DT, Britcher AR, Bardell AG, Thomas DJ and Hudson IF (1992). Neutron Spectra, Radiological Quantities and Instrument and Dosemeter Responses at a Magnox Reactor and a Fuel Reprocessing Installation. Radiat Prot Dosim, 44 (1/4), 233-238.
Bartlett DT, Tanner RJ and Jones DG (1997). A New Design of Neutron Dose Equivalent Survey Instrument. Radiat Prot Dosim, 74 (4), 267-271.
Bartlett DT, Drake P, Lindborg L, Klein H, Schmitz T and Tichy M (1999). Determination of the neutron and photon dose equivalent at workplaces in nuclear facilities of Sweden - An SSI-EURADOS comparison exercise, Part II: Evaluation. SSI-Report 99-13, Stockholm.
Bartlett DT, Hager LG, Tanner RJ, Haley RM and Cooper AJ (2001). Comparison of Neutron Dose Quantities, and Instrument and Dosemeter Readings in a MOX Fabrication Plant. Nucl Instrum Meth, A476 446-451.
Bartlett DT, Tanner RJ, Tagziria H, and Thomas DJ (2002). Response characteristics of neutron survey instruments. Chilton, NRPB-R333(rev). Chilton: NRPB.
Birratari C, Ferrari A, Nuccetelli C, Pelliccioni M and Silari M (1990). An extended range rem counter. Nucl Instrum Meth, A297, 250-257.
Bolognese-Milsztajn T, Bartlett D, Boschung M, Coeck M, Curzio G, d’Errico F, Fiechtner A, Giusti V, Gressier V, Kyllönen J, Lacoste V, Lindborg L, Luszik-Bhadra M, Molinos C, Pelcot G, Reginatto M, Schuhmacher H, Tanner R, Vanhavere F and Derdau D (2004). Individual neutron monitoring in workplaces with mixed neutron/photon radiation. Radiat Prot Dosim, 170 (1-4), 753-758.
Bramblett RL, Ewing RI and Bonner TW (1960). A new type of neutron spectrometer. Nuclear Instrum Methods, 9, 1-12.
Briesmeister JF (Ed) (2000). MCNP – a general Monte Carlo n-particle transport code, Version 4C. Report No. LA-13709-M. Los Alamos, LANL.
Brown, D, Buchanan RJ and Koelle AR (1980). A microcomputer-based portable radiation survey instrument for measuring pulsed neutron dose rates. Health Phys, 38, 507-521.
Burgkhardt B, Fieg G, Klett A, Plewnia A and Siebert BRL (1997). The neutron fluence and H*(10) response of the new LB6411 remcounter. Radiat Prot Dosim, 70 (1-4), 361-364.
Chartier J-L, Posny F and Buxerolle M (1992). Experimental assembly for the simulation of realistic neutron spectra. Radiat Prot Dosim, 44 (1/4), 125-130.
Cooper AJ and Haley RM (1998). Considerations of dosimetry quantities in dose and ALARP assessments. ANS Radiation Protection and Shielding Division Topical Conference, April 19-23 1998, Nashville, Tennessee. Illinois, American Nuclear Society.
Cosack M and Lesiecki H (1981). Dependence of the response of eight neutron dose equivalent survey meters with regard to the energy and direction of incident neutrons. IN Proceedings of Fourth Symposium on Neutron Dosimetry, Neuherberg 1981. EUR-7448, 407-420. Luxembourg, European Commission.

REFERENCES
163
Delafield HJ and Perks CA (1992). Neutron spectrometry and dosimetry measurements made at nuclear power stations with derived dosemeter responses. Radiat Prot Dosim, 44 (1/4), 227-232.
Douglas JA and Marshall M (1974). Unpublished data taken from a graph (Harrison, 1979).
Gressier V, Lacoste V, Lebreton L, Muller H, Pelcot G, Bakali M, Fernández F, Tómas M, Roberts NJ, Thomas DJ, Reginatto M, Wiegel B and Wittstock J (2004). Characterization of the IRSN CANEL/T400 facility producing realistic neutron fields for calibration and test purposes. Radiat Prot Dosim, 110 (1-4), 523-527.
Haley RM (1996). BNFL, Risley, UK. Personal Communication.
Hankins, DE (1967). A modified-sphere neutron detector. Los Alamos National Laboratory Report, LA 3395. Los Alamos: LANL.
Hankins DE and Cortez JR (1975). Energy dependence of four neutron remmeter instruments. Los Alamos National Laboratory Report, LA 5528. Los Alamos: LANL.
Harrison KG, Harvey JR and Boot SJ (1978). The calibration of neutron instruments and dosimeters at intermediate energies. Nucl Instrum Methods, 148, 511-520.
Harrison KG (1979). The response of a spherical neutron survey meter. Nucl Instrum Meth, 166, 197-201.
Hunt JB, Harrison KG and Wilson R (1980). Calibration of a Dephanger long counter and two neutron survey monitors at 21.5 keV. Nuclear Instrum Methods, 169, 477-482.
Hunt JB, Cosack M and Lesiecki H (1985). The calibration of neutron survey meters over the energy range 1 to 30 keV with accelerator produced monoenergetic neutrons. IN Proceedings of the Fifth Symposium on Neutron Dosimetry, Neuherberg, 1984. EUR-9762. Luxembourg: European Commission. 607-616.
Hunt JB (1988). National Physical Laboratory. Private communication.
International Commission on Radiation Units and Measurements (1985). Determination of dose equivalents resulting from external radiation sources. ICRU Report 39. Bethesda, ICRU.
International Commission on Radiation Units and Measurements (1998). Conversion coefficients for use in radiological protection against external radiation. ICRU Report 57. Bethesda, ICRU.
International Commission on Radiological Protection (1991). 1990 Recommendations of the International Commission on Radiological Protection. ICRP Publication 60, Ann ICRP, 21 (1-3).
International Commission on Radiological Protection (1996). Conversion coefficients for use in radiological protection against external radiation. ICRP Publication 74, Ann ICRP, 26 (3/4).
International Commission on Radiological Protection (2006). Basis for dosimetric quantities used in radiological protection (Annex B of Main Recommendations). http://www.icrp.org/dosimetry.pdf
International Organization for Standardization (2000). Reference neutron radiations – Part 2: Calibration fundamentals of radiation protection devices related to the basic quantities characterizing the radiation field. ISO 8529-2:2000(E). Geneva: ISO.
International Organization for Standardization (2001a). Reference neutron radiations – Part 1: characteristics and methods of production. ISO 8529-1:2001(E). Geneva: ISO.
International Organization for Standardization (2001b). Radiation protection - Performance criteria for radiobioassay - Part 1: General principles. ISO 12790-1:2001. Geneva: ISO.
Jianping L, Tang Y, Shudong L, Ban S, Suzuki T, Iijima K and Nakamura H (1996). Neutron energy response of a modified Andersson-Braun rem counter. Radiat Prot Dosim, 67, 179-185.
Klett A and Burgkhardt B (1997). The new remcounter LB6411: measurement of neutron ambient dose equivalent H*(10) according to ICRP60 with high sensitivity. IEEE Transactions on Nuclear Science, 44 (3), 757-759.
Lacoste V and Gressier V (2004). MCNP4C simulation of the IRSN CANEL/T400 realistic mixed neutron-photon radiation field. Radiat Prot Dosim, 110 (1-4), 123-127.
Lacoste V, Gressier V, Muller H and Lebreton L (2004). Characterization of the IRSN graphite moderated americium-beryllium neutron field. Radiat Prot Dosim,110 (1-4), 135-139.
Leake JW and Smith JW (1964). Calibration of a neutron rem counter. AERE-R4524. Harwell, UKAEA.

PRACTICAL IMPLICATIONS OF NEUTRON SURVEY INSTRUMENT PERFORMANCE
164
Leake JW (1965). A spherical dose equivalent neutron detector. Nucl Instrum Meth, 45, 151-156.
Leake JW (1968). An improved spherical dose equivalent neutron detector. Nucl Instrum Meth, 63, 329-332.
Leake JW (1980). Spherical dose equivalent neutron detector type 0075. Nucl Instrum Meth, 178, 287-288.
Leake JW (1999). The effect of ICRP (74) on the response of neutron monitors. Nucl Instrum Meth, A421, 365-367.
Leake JW (2002). Private communication.
Leake JW, Lowe T and Mason RS (2004). Improvements to the Leake neutron detector I. Nucl Instrum Meth, A519, 636-646.
Lewis VE (1998). First IRMF intercomparison of calibrations of neutron area survey instruments 1995-1996. NPL Report CIRM 14. Teddington, National Physical Laboratory.
Lewis VE (2000). Second IRMF intercomparison of calibrations of neutron area survey instruments 1998-1999. NPL Report CIRM 34. Teddington, National Physical Laboratory.
Lewis VE (2003). Third IRMF intercomparison of calibrations of neutron area survey instruments 2001-2002. NPL Report CIRM 57. Teddington, National Physical Laboratory.
Lindborg L, Bartlett DT, Drake P, Klein H, Schmitz T and Tichy M (1995). Determination of Neutron and Photon Dose Equivalent at Workplaces in Nuclear Facilities in Sweden. Radiat Prot Dosim, 61 (1-3), 89-100.
Luszik-Bhadra M, Reginatto M and Lacoste V (2004). Measurement of energy and directional distribution of neutron and photon fluences at workplace fields. Radiat Prot Dosim, 110 (1-4), 237-241.
Majborn B (1994). The response of a neutron rem counter to thermal, to intermediate energy, and to fast neutrons. Risø National, Laboratory Report M=1994. Roskilde, Risø National Laboratory.
Matzke M (1977). Response of a portable neutron monitor to thermal neutrons. PTB-Mitteilungen, 87 (1/77). Braunschweig, Physikalisch-Technische Bundesanstalt.
Matzke M (2003). Unfolding procedures. Radiat Prot Dosim, 107 (1-3), 155-174.
Mourgues M, Carossi JC and Portal G (1985). A light rem-counter of advanced technology. IN: Proc of Fifth Symp on Neutron Dosimetry, Munich/Neuherberg, September 1984. EUR 9762, 1, 387-401. Luxembourg: CEC.
Olsher, RH, Seagraves DT, Eisele SL, Bjork CW, Martinez WA, Romero LL, Mallet MW, Duran MA and Hurlbut CR (2004). PRESCILA: a new lightweight neutron REM counter. Health Phys, 86 (6), 603-612.
Olsher RH, Hsiao-Hua H, Beverding A, Kleck JH, Casson WH, Vasilik DG and Devine RT (2000). WENDI: an improved neutron rem meter. Health Phys, 79, 170-181.
Piesch E, Burgkhardt B and Hofmann I (1979). Calibration of neutron detectors in radiation protection, KfK Report KfL 287. Karlsruhe, Kernforschungzentrum.
Posny F, Chartier J-L and Buxerolle M (1992). Neutron spectrometry system for radiation protection: measurements at work places and in calibration fields. Radiat Prot Dosim, 44 (1/2), 239-242.
Posny F (1994). IPSN, Fontenay-aux-Roses, France. Personal Communication.
Prael RE and Lichtenstein H (1989). User guide to LCS: the LAHET code system. Los Alamos National Laboratory Report, LA-UR-89-3014. Los Alamos, NM: Los Alamos National Laboratory.
Roberts NJ (2001). MCNP calculations of correction factors for radionuclide neutron source emission rate measurements using the manganese bath. CIRM 45, ISSN: 1369-6793. Teddington: NPL.
Roberts NJ, Bartlett DT, Hager L, Jones LN, Molinos C, Tanner RJ, Taylor GC and Thomas DJ (2004). Angle dependence of response characteristics of neutron survey instruments. Radiat Prot Dosim, 110 (1-4), 187-193.
Schraube H (1994). GSF, Neuherberg, Germany. Personal Communication.
REFERENCES
165
Schuhmacher H, Bartlett D, Bolognese-Milsztajn T, Boschung M, Coeck M, Curzio G, d’Errico F, Fiechtner A, Kyllönen J-E, Lacoste V, Lindborg L, Reginatto M, Tanner R and Vanhavere F (2006). Evaluation of individual dosimetry in mixed neutron and photon radiation fields. PTB-N-49. Braunschweig: Physikalisch-Technische Bundesanstalt.
Tagziria H, Roberts NJ, and Thomas DJ (2003). Measurement of the 241Am-Li radionuclide neutron source spectrum. Nucl Instrum Meth, A510, 346-356.
Tagziria H, Tanner RJ, Bartlett DT and Thomas DJ (2004). Evaluation and Monte Carlo modelling of the response function of the Leake neutron area survey instrument. Nucl Instrum Meth, A531 (3), 596-606.
Tan M, Chen CM, Wang Z and Wen YQ (1996). Angular and collimated beam responses of a neutron dose equivalent counter. Radiat Prot Dosim, 64 (3), 239-241.
Tanner R J, Thomas D J, Bartlett D T, Hager L G, Horwood N and Taylor G C (2002). Effect of the energy dependence of response of neutron personal dosemeters routinely used in the UK on the accuracy of dose estimation. NRPB W25. Chilton: NRPB.
Tanner (2003). NRPB internal publication.
Tanner RJ, Bartlett DT, Hager LG, Jones LN, Molinos C, Roberts NJ, Taylor GC and Thomas DJ (2004). Practical implications of neutron survey instrument performance. Radiat Prot Dosim, 110 (1-4), 763-767.
Taylor GC, and Thomas DJ (1998). Neutron scatter characteristics of the low-scatter facility of the Chadwick Building, NPL. CIRM 17, Teddington, NPL.
Taylor GC (2001). National Physical Laboratory. Private communication.
Thomas DJ (1988). Determination of the 3He number density for the proportional counter used in the NPL Bonner sphere system. NPL Report RS(EXT)104. Teddington, National Physical Laboratory.
Thomas DJ, Waker AJ, Hunt JB, Bardell AG and More BR (1992). An intercomparison of neutron field dosimetry systems. Radiat Prot Dosim, 44 (1/2), 219-222.
Thomas DJ (1992). Use of the program ANISN to calculate response functions for a Bonner sphere set with a 3He detector. NPL Report RSA(EXT) 31.
Thomas DJ, Alevra AV, Hunt JB and Schraube H (1994). Experimental determination of the response of four Bonner sphere sets to thermal neutrons. Radiat Prot Dosim, 54, 25-31.
Thomas DJ and Taylor GC (1997). Response function measurements for the REM 500: a microdosimetric counter based area survey instrument. Proceedings of International Conference on Radiation Dosimetry and Safety, March 31- Apr 2, Taipei, Taiwan, 285-289.
Thomas DJ and Klein H (eds) (2003). A handbook on - neutron and photon spectrometry techniques for radiation protection. Radiat Prot Dosim, 107 (1-3).
Thompson IMG (1982). Personal communication.
Waters LS (1999). MCNPX user’s manual, version 2.1.5. Los Alamos National Laboratory Report, TPO-E83-G-UG-X-00001. Los Alamos, NM: Los Alamos National Laboratory.
Winsby A (2002). Department of Engineering, University of Lancaster. Private communication.

ISOTROPIC SOURCE IN MCNP
166
APPENDIX A
Isotropic Source in MCNP
Calculation of the response to an isotropic field is significantly aided if an isotropic field can be described in MCNP. This is preferred because the geometry is irradiated from all directions, so any directions for which the response deviates significantly from the response from the reference direction must be sampled. A simpler approach is to perform calculations for a representative series of angles of incidence, and average those results after correction for solid angle. That approach, however, means that not all angles are sampled, which makes it less satisfactory. It also requires significantly greater effort.
Whilst an isotropic point source is commonly used in MCNP calculations, the manual (Briesmeister, 2000) does not give a good indication of how to describe an isotropic field. However, if a surface source is described with a normal (NRM) but no direction specified (DIR card), then the neutrons generated on that surface will all come out on the side specified by NRM, but they will be generated isotropically. This applies to any surface.
To verify that this interpretation of the source was correct, and that the resultant field is isotropic, the source was tested using a sphere with NRM = -1* that enclosed a vacuum. The test that was performed used five detectors (Figure 104) placed within the spherical surface on which neutrons were generated. The field was measured at those points using F1 tallies, which measure particles crossing a surface, with cosine bins applied to sort the field into angular bins. Because this is an F1 tally, and not the F2 fluence tally, the result from each tally was normalized by the solid angle of the bin. This then gives the true fluence, although the coarseness of the angular bins will affect the accuracy of this method of calculating it.
The results from this test (Table 34) show the field to be truly isotropic, within statistical uncertainties. This is true for both the total fluence for the five detectors and also for the direction distribution at each detection point. This result is most satisfactory and assists the calculation of the response for this geometry significantly. Unfortunately, the response for rotational isotropy cannot be calculated in the same way, since MCNP does not allow a cylinder to be used in this way. Those response calculations hence required an averaging of the response from calculations in the horizontal plane.
* The normal in MCNP simply defines the sense of the surface. In this case, if a sphere is used for the surface source, and NRM = 1 is specified, neutrons will be generated in an outward direction. If NRM = -1, then only inwardly directed neutrons will be generated.

APPENDIX B
167
FIGURE 104 Cut through the z = 0 plane of the simple geometry set up to demonstrate the isotropy of the source. The outer circle is a slice through the sphere on which the source particles are generated, inwardly directed but otherwise isotropically. The five detector positions are shown.
TABLE 34 Fluences in each angular bin for five different detectors placed to demonstrate the isotropy of the source. The fluence data in each angular bin have been normalized to solid angle. (x, y, z) (-50, 0, 0) (50, 0, 0) (0, -50, 0) (0, 50, 0) (0, 0, 0) Mean Bin (°) Φa (s) Φa (s) Φa (s) Φa (s) Φa (s) Φa (s)
180-150 6.45 (0.08) 6.28 (0.08) 6.31 (0.08) 6.21 (0.08) 6.32 (0.08) 6.31 (0.09)
150-120 6.31 (0.05) 6.47 (0.05) 6.32 (0.05) 6.27 (0.05) 6.33 (0.05) 6.34 (0.08)
120-90 6.25 (0.04) 6.32 (0.04) 6.23 (0.04) 6.37 (0.04) 6.29 (0.04) 6.29 (0.06)
90-60 6.30 (0.04) 6.33 (0.04) 6.31 (0.04) 6.31 (0.04) 6.36 (0.04) 6.32 (0.03)
60-30 6.39 (0.05) 6.36 (0.05) 6.30 (0.05) 6.34 (0.05) 6.28 (0.05) 6.33 (0.04)
30-0 6.31 (0.08) 6.30 (0.08) 6.25 (0.08) 6.54 (0.09) 6.26 (0.08) 6.33 (0.11)
Φb 7.60 (0.03) 7.61 (0.03) 7.54 (0.03) 7.61 (0.03) 7.57 (0.03) 7.59 (0.03)
a fluence in units of 10-7 cm-2 sr-1
b fluence in units of 10-6 cm-2
Values in parentheses represent type A uncertainty (coverage factor = 1)

CALCULATED RESPONSE DATA
168
APPENDIX B
Calculated response data
This Appendix contains the fluence response data for the Leake, NM2B and Studsvik 2202D for irradiation from the reference direction, with spherical isotropy and with rotational isotropy. These data are given without any normalization to experiment for the Leake and the Studsvik, because the calculated response values are within the approximate range of normal instrument variation. For the NM2B the data have been normalized to experiments made for this project using 241Am-Be and 252Cf sources so that the values given are realistic in magnitude. This difference is not considered to be important because variations in the fill pressure and effective volume of the central detector, and the thresholds setting for pulse-height, will cause a scaling rather than an energy and angle dependent sensitivity.
There will be natural instrument-to-instrument variations in response caused by normal variations in the manufacture. This is seen in the experimental data presented in this work, which show significant variation instrument-to-instrument. The manufacturer of the Studsvik 2222 (formerly the Studsvik 2202D but now manufactured by Wedholm Medical AB) is the only one that quantifies the instrument-to-instrument variation‡, giving a range of 0.35 - 0.5 s-1 (μSv h-1)-1 (= 1.3 – 1.8 nSv-1) for the response. This amounts to approximately ±20% for this source of variability in the response.
Because of the intrinsic variation between instruments, the data in this Appendix should only be used when the measured response of the instrument in question has been used to normalize them. To aid this approach the response to 252Cf and 241Am-Be sources are given in the tables. Hence, a specific instrument should be calibrated in a low scatter environment from its reference direction using one of those sources and the fluence response data in these tables then normalized by the ratio of the calculated response of the instrument to the measured response of the instrument. Alternatively, a different radionuclide source, a realistic field or a monoenergetic irradiation could be used. The calibration field would then need to be folded with the fluence response data to obtain the normalization factor that is specific to the instrument in question.
‡ http://www.wedholmmedical.se/download/2222.pdf

APPENDIX B
169
B1 LEAKE
TABLE 35 Unnormalized MCNP calculations for the fluence response (RΦ) of the Leake 0949 Energy Reference direction, 0° Spherically isotropic Rotationally isotropic (eV) RΦ (cm2) RΦ (cm2) RΦ (cm2)
2.53 10-8 4.71 (0.52) 10-3 5.73 (0.46) 10-3 4.93 (0.28) 10-3
1.00 10-7 7.28 (0.69) 10-3 9.47 (0.61) 10-3 9.62 (0.40) 10-3
5.00 10-7 1.21 (0.09) 10-2 1.69 (0.09) 10-2 1.52 (0.05) 10-2
1.00 10-6 1.17 (0.08) 10-2 2.01 (0.11) 10-2 1.60 (0.05) 10-2
5.00 10-6 2.03 (0.11) 10-2 2.53 (0.12) 10-2 2.19 (0.06) 10-2
1.00 10-5 2.01 (0.11) 10-2 2.71 (0.12) 10-2 2.47 (0.06) 10-2
5.00 10-5 2.61 (0.12) 10-2 3.00 (0.14) 10-2 3.06 (0.07) 10-2
1.00 10-4 2.87 (0.13) 10-2 3.50 (0.14) 10-2 3.30 (0.07) 10-2
2.00 10-4 3.14 (0.13) 10-2 3.74 (0.16) 10-2 3.60 (0.07) 10-2
5.00 10-4 3.65 (0.14) 10-2 4.40 (0.18) 10-2 4.13 (0.08) 10-2
1.00 10-3 3.90 (0.14) 10-2 4.75 (0.17) 10-2 4.50 (0.01) 10-2
2.00 10-3 4.53 (0.15) 10-2 5.06 (0.18) 10-2 4.92 (0.01) 10-2
5.00 10-3 5.09 (0.16) 10-2 5.76 (0.19) 10-2 5.54 (0.01) 10-2
1.00 10-2 5.55 (0.15) 10-2 6.19 (0.19) 10-2 6.31 (0.01) 10-2
2.00 10-2 6.34 (0.17) 10-2 6.88 (0.21) 10-2 7.12 (0.01) 10-2
5.00 10-2 8.05 (0.17) 10-2 9.25 (0.24) 10-2 8.60 (0.01) 10-2
1.00 10-1 1.04 (0.02) 10-1 1.14 (0.03) 10-1 1.09 (0.01) 10-1
2.00 10-1 1.44 (0.02) 10-1 1.55 (0.03) 10-1 1.48 (0.01) 10-1
5.00 10-1 2.30 (0.03) 10-1 2.56 (0.04) 10-1 2.36 (0.01) 10-1
7.00 10-1 2.73 (0.03) 10-1 2.94 (0.05) 10-1 2.77 (0.02) 10-1
1.00 100 3.07 (0.03) 10-1 3.26 (0.05) 10-1 3.14 (0.02) 10-1
1.20 100 3.20 (0.03) 10-1 3.47 (0.05) 10-1 3.27 (0.02) 10-1
2.00 100 3.29 (0.03) 10-1 3.57 (0.05) 10-1 3.36 (0.02) 10-1
3.00 100 3.15 (0.03) 10-1 3.40 (0.05) 10-1 3.24 (0.02) 10-1
4.00 100 2.73 (0.03) 10-1 2.99 (0.05) 10-1 2.78 (0.02) 10-1
6.00 100 2.42 (0.03) 10-1 2.55 (0.04) 10-1 2.47 (0.01) 10-1
8.00 100 1.93 (0.02) 10-1 1.99 (0.04) 10-1 1.92 (0.01) 10-1
1.00 100 1.64 (0.02) 10-1 1.69 (0.04) 10-1 1.65 (0.01) 10-1
1.20 100 1.44 (0.02) 10-1 1.57 (0.03) 10-1 1.49 (0.01) 10-1
1.40 100 1.33 (0.02) 10-1 1.39 (0.03) 10-1 1.33 (0.01) 10-1
1.60 100 1.19 (0.02) 10-1 1.26 (0.03) 10-1 1.23 (0.01) 10-1
1.80 100 1.11 (0.02) 10-1 1.19 (0.03) 10-1 1.12 (0.01) 10-1
2.00 100 1.03 (0.02) 10-1 1.16 (0.03) 10-1 1.05 (0.01) 10-1 252Cf‡ 2.84 (0.03) 10-1 2.76 (0.05) 10-1 2.62 (0.02) 10-1 241Am-Be‡ 2.57 (0.03) 10-1 3.07 (0.05) 10-1 2.90 (0.02) 10-1
‡ Data calculated by folding the energy distribution of the ISO source with the monoenergetic response data.
Values in parentheses represent type A uncertainty (coverage factor = 1)
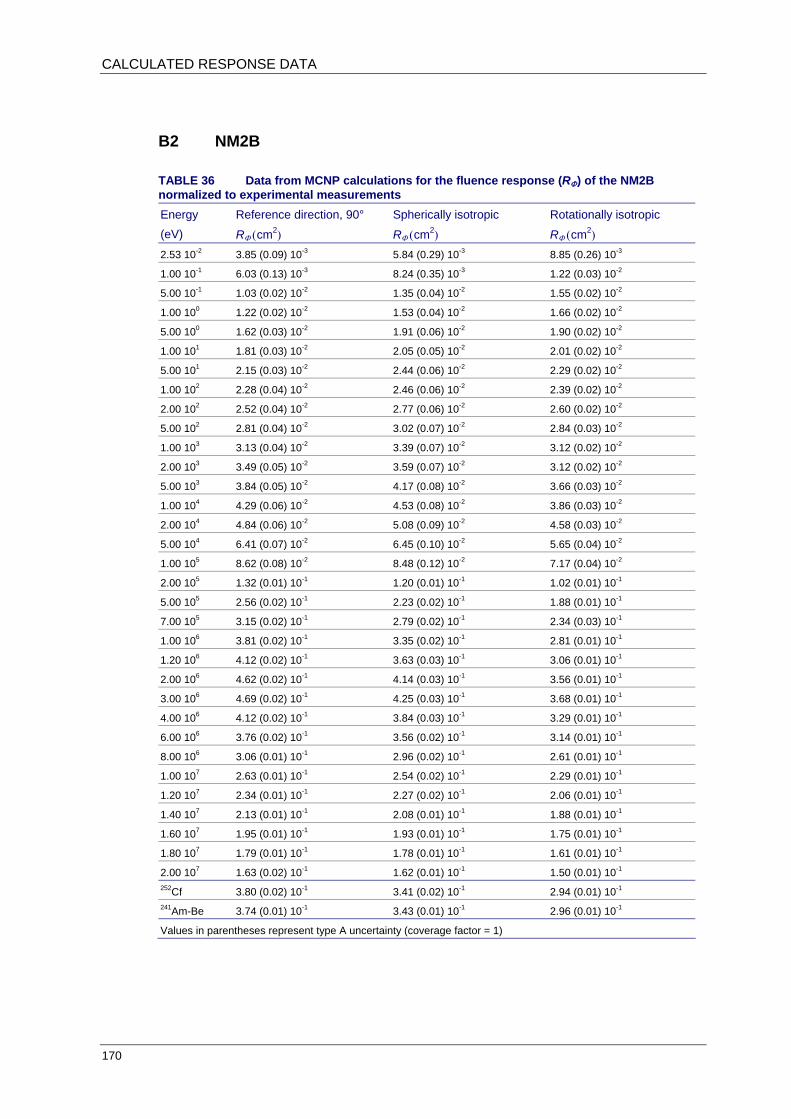
CALCULATED RESPONSE DATA
170
B2 NM2B
TABLE 36 Data from MCNP calculations for the fluence response (RΦ) of the NM2B normalized to experimental measurements Energy Reference direction, 90° Spherically isotropic Rotationally isotropic (eV) RΦ (cm2) RΦ (cm2) RΦ (cm2)
2.53 10-2 3.85 (0.09) 10-3 5.84 (0.29) 10-3 8.85 (0.26) 10-3
1.00 10-1 6.03 (0.13) 10-3 8.24 (0.35) 10-3 1.22 (0.03) 10-2
5.00 10-1 1.03 (0.02) 10-2 1.35 (0.04) 10-2 1.55 (0.02) 10-2
1.00 100 1.22 (0.02) 10-2 1.53 (0.04) 10-2 1.66 (0.02) 10-2
5.00 100 1.62 (0.03) 10-2 1.91 (0.06) 10-2 1.90 (0.02) 10-2
1.00 101 1.81 (0.03) 10-2 2.05 (0.05) 10-2 2.01 (0.02) 10-2
5.00 101 2.15 (0.03) 10-2 2.44 (0.06) 10-2 2.29 (0.02) 10-2
1.00 102 2.28 (0.04) 10-2 2.46 (0.06) 10-2 2.39 (0.02) 10-2
2.00 102 2.52 (0.04) 10-2 2.77 (0.06) 10-2 2.60 (0.02) 10-2
5.00 102 2.81 (0.04) 10-2 3.02 (0.07) 10-2 2.84 (0.03) 10-2
1.00 103 3.13 (0.04) 10-2 3.39 (0.07) 10-2 3.12 (0.02) 10-2
2.00 103 3.49 (0.05) 10-2 3.59 (0.07) 10-2 3.12 (0.02) 10-2
5.00 103 3.84 (0.05) 10-2 4.17 (0.08) 10-2 3.66 (0.03) 10-2
1.00 104 4.29 (0.06) 10-2 4.53 (0.08) 10-2 3.86 (0.03) 10-2
2.00 104 4.84 (0.06) 10-2 5.08 (0.09) 10-2 4.58 (0.03) 10-2
5.00 104 6.41 (0.07) 10-2 6.45 (0.10) 10-2 5.65 (0.04) 10-2
1.00 105 8.62 (0.08) 10-2 8.48 (0.12) 10-2 7.17 (0.04) 10-2
2.00 105 1.32 (0.01) 10-1 1.20 (0.01) 10-1 1.02 (0.01) 10-1
5.00 105 2.56 (0.02) 10-1 2.23 (0.02) 10-1 1.88 (0.01) 10-1
7.00 105 3.15 (0.02) 10-1 2.79 (0.02) 10-1 2.34 (0.03) 10-1
1.00 106 3.81 (0.02) 10-1 3.35 (0.02) 10-1 2.81 (0.01) 10-1
1.20 106 4.12 (0.02) 10-1 3.63 (0.03) 10-1 3.06 (0.01) 10-1
2.00 106 4.62 (0.02) 10-1 4.14 (0.03) 10-1 3.56 (0.01) 10-1
3.00 106 4.69 (0.02) 10-1 4.25 (0.03) 10-1 3.68 (0.01) 10-1
4.00 106 4.12 (0.02) 10-1 3.84 (0.03) 10-1 3.29 (0.01) 10-1
6.00 106 3.76 (0.02) 10-1 3.56 (0.02) 10-1 3.14 (0.01) 10-1
8.00 106 3.06 (0.01) 10-1 2.96 (0.02) 10-1 2.61 (0.01) 10-1
1.00 107 2.63 (0.01) 10-1 2.54 (0.02) 10-1 2.29 (0.01) 10-1
1.20 107 2.34 (0.01) 10-1 2.27 (0.02) 10-1 2.06 (0.01) 10-1
1.40 107 2.13 (0.01) 10-1 2.08 (0.01) 10-1 1.88 (0.01) 10-1
1.60 107 1.95 (0.01) 10-1 1.93 (0.01) 10-1 1.75 (0.01) 10-1
1.80 107 1.79 (0.01) 10-1 1.78 (0.01) 10-1 1.61 (0.01) 10-1
2.00 107 1.63 (0.02) 10-1 1.62 (0.01) 10-1 1.50 (0.01) 10-1 252Cf 3.80 (0.02) 10-1 3.41 (0.02) 10-1 2.94 (0.01) 10-1 241Am-Be 3.74 (0.01) 10-1 3.43 (0.01) 10-1 2.96 (0.01) 10-1
Values in parentheses represent type A uncertainty (coverage factor = 1)

APPENDIX B
171
B3 STUDSVIK 2202D
TABLE 37 Unnormalized calculated fluence response (RΦ) of the Studsvik 2202D. The detailed angle dependence of response was not calculated for all energies used for the reference direction. Type A uncertainties (in parentheses) are for a coverage factor of 1. Energy Reference direction, 90° Spherically isotropic Rotationally isotropic (eV) RΦ (cm2) RΦ (cm2) RΦ (cm2)
2.53 10-8 6.85 (0.23) 10-3 6.54 (0.12) 10-3 5.82 (0.06) 10-3
1.00 10-7 1.09 (0.02) 10-2 1.05 (0.02) 10-2 9.38 (0.09) 10-3
5.00 10-7 1.88 (0.04) 10-2
1.00 10-6 2.09 (0.04) 10-2 1.81 (0.03) 10-2 1.71 (0.01) 10-2
5.00 10-6 2.76 (0.05) 10-2
1.00 10-5 2.98 (0.06) 10-2 2.65 (0.04) 10-2 2.43 (0.02) 10-2
5.00 10-5 3.60 (0.06) 10-2
1.00 10-4 3.83 (0.08) 10-2 3.48 (0.05) 10-2 3.15 (0.02) 10-2
2.00 10-4 4.27 (0.09) 10-2
5.00 10-4 4.44 (0.09) 10-2
1.00 10-3 4.93 (0.09) 10-2 4.51 (0.06) 10-2 4.03 (0.03) 10-2
2.00 10-3 5.25 (0.09) 10-2
5.00 10-3 6.04 (0.11) 10-2 5.57 (0.07) 10-2 5.04 (0.03) 10-2
1.00 10-2 6.48 (0.19) 10-2 6.27 (0.08) 10-2 5.55 (0.04) 10-2
2.00 10-2 7.43 (0.19) 10-2 7.07 (0.10) 10-2 6.24 (0.04) 10-2
5.00 10-2 9.43 (0.23) 10-2 9.05 (0.12) 10-2 7.99 (0.05) 10-2
1.00 10-1 1.23 (0.03) 10-1 1.11 (0.01) 10-1 1.03 (0.01) 10-1
2.00 10-1 1.81 (0.03) 10-1 1.62 (0.02) 10-1 1.49 (0.01) 10-1
3.00 10-1 2.41 (0.02) 10-1 2.09 (0.02) 10-1 1.95 (0.01) 10-1
5.00 10-1 3.39 (0.05) 10-1 3.01 (0.03) 10-1 2.69 (0.01) 10-1
7.00 10-1 4.23 (0.05) 10-1
1.00 100 5.05 (0.06) 10-1 4.33 (0.04) 10-1 3.95 (0.01) 10-1
1.20 100 5.41 (0.06) 10-1
2.00 100 6.10 (0.06) 10-1 5.37 (0.04) 10-1 4.91 (0.02) 10-1
3.00 100 6.14 (0.06) 10-1 5.38 (0.04) 10-1 5.00 (0.02) 10-1
4.00 100 5.37 (0.05) 10-1 4.79 (0.03) 10-1 4.46 (0.01) 10-1
6.00 100 4.90 (0.05) 10-1 4.44 (0.03) 10-1 4.16 (0.01) 10-1
8.00 100 3.93 (0.04) 10-1
1.00 101 3.33 (0.03) 10-1 3.12 (0.02) 10-1 2.97 (0.01) 10-1
1.20 101 3.03 (0.03) 10-1
1.40 101 2.79 (0.02) 10-1 2.59 (0.02) 10-1 2.48 (0.01) 10-1
1.60 101 2.56 (0.02) 10-1
1.80 101 2.39 (0.02) 10-1
2.00 101 2.21 (0.02) 10-1 2.08 (0.02) 10-1 2.00 (0.01) 10-1 252Cf 4.92 (0.05) 10-1 4.35 (0.04) 10-1 4.00 (0.01) 10-1 241Am-Be 4.84 (0.05) 10-1 4.37 (0.03) 10-1 4.04 (0.01) 10-1

CALCULATED RESPONSE DATA
172
TABLE 38 Fluence response (RΦ) data for the Studsvik 2202D for irradiation from 0°, 30°, 60° and 90°. The quoted Type A uncertainties (in parentheses) are for a coverage factor of 1.
En (eV) RΦ,0° (cm2) RΦ, 30° (cm2) RΦ,60° (cm2) RΦ,90° (cm2)
2.53 10-2 3.48 (0.05) 10-3 4.47 (0.08) 10-3 6.01 (0.12) 10-3 6.85 (0.23) 10-3
1.0 10-1 5.73 (0.14) 10-3 7.59 (0.15) 10-3 9.59 (0.21) 10-3 1.09 (0.02) 10-2
1.0 100 1.24 (0.02) 10-2 1.44 (0.03) 10-2 1.81 (0.04) 10-2 2.09 (0.04) 10-2
1.0 101 1.90 (0.02) 10-2 2.22 (0.04) 10-2 2.62 (0.05) 10-2 2.98 (0.06) 10-2
1.0 102 2.83 (0.03) 10-2 3.10 (0.05) 10-2 3.49 (0.07) 10-2 3.83 (0.08) 10-2
1.0 103 4.09 (0.04) 10-2 4.47 (0.06) 10-2 4.88 (0.08) 10-2 4.93 (0.09) 10-2
5.0 103 5.41 (0.05) 10-2 5.63 (0.07) 10-2 5.97 (0.09) 10-2 6.04 (0.11) 10-2
1.0 104 6.16 (0.06) 10-2 6.40 (0.08) 10-2 6.59 (0.10) 10-2 6.48 (0.19) 10-2
2.0 104 6.17 (0.07) 10-2 7.29 (0.11) 10-2 7.76 (0.11) 10-2 7.43 (0.19) 10-2
5.0 104 9.11 (0.09) 10-2 9.44 (0.12) 10-2 9.66 (0.15) 10-2 9.43 (0.23) 10-2
1.0 105 1.23 (0.01) 10-1 1.24 (0.01) 10-1 1.27 (0.02) 10-1 1.23 (0.03) 10-1
2.0 105 1.75 (0.01) 10-1 1.78 (0.02) 10-1 1.87 (0.02) 10-1 1.81 (0.03) 10-1
3.0 105 2.24 (0.02) 10-1 2.29 (0.02) 10-1 2.38 (0.03) 10-1 2.41 (0.02) 10-1
5.0 105 3.02 (0.02) 10-1 3.09 (0.03) 10-1 3.35 (0.03) 10-1 3.39 (0.05) 10-1
1.0 106 4.25 (0.03) 10-1 4.49 (0.04) 10-1 4.95 (0.04) 10-1 5.05 (0.06) 10-1
2.0 106 5.07 (0.04) 10-1 5.37 (0.04) 10-1 5.82 (0.05) 10-1 6.10 (0.06) 10-1
3.0 106 5.09 (0.04) 10-1 5.38 (0.04) 10-1 5.87 (0.05) 10-1 6.14 (0.06) 10-1
4.0 106 4.50 (0.03) 10-1 4.75 (0.04) 10-1 5.23 (0.04) 10-1 5.37 (0.05) 10-1
6.0 106 4.22 (0.03) 10-1 4.38 (0.04) 10-1 4.72 (0.04) 10-1 4.90 (0.05) 10-1
1.0 107 2.99 (0.02) 10-1 3.13 (0.03) 10-1 3.31 (0.03) 10-1 3.33 (0.03) 10-1
1.4 107 2.44 (0.02) 10-1 2.59 (0.02) 10-1 2.74 (0.02) 10-1 2.79 (0.03) 10-1
2.0 107 1.95 (0.02) 10-1 2.05 (0.02) 10-1 2.20 (0.02) 10-1 2.21 (0.02) 10-1

APPENDIX C
173
TABLE 39 Fluence response (RΦ) data for the Studsvik 2202D for irradiation from 120°, 150° and 180°. The quoted Type A uncertainties (in parentheses) are for a coverage factor of 1.
En (eV) RΦ,120° (cm2) RΦ,150° (cm2) RΦ,180° (cm2)
2.53 10-2 7.25 (0.11) 10-3 5.11 (0.11) 10-3 7.60 (0.26) 10-3
1.0 10-1 1.15 (0.02) 10-2 7.85 (0.17) 10-3 1.25 (0.04) 10-2
1.0 100 2.18 (0.05) 10-2 1.43 (0.03) 10-2 1.79 (0.04) 10-2
1.0 101 3.12 (0.06) 10-2 2.01 (0.04) 10-2 2.15 (0.04) 10-2
1.0 102 3.81 (0.07) 10-2 2.48 (0.05) 10-2 2.52 (0.05) 10-2
1.0 103 4.70 (0.08) 10-2 2.87 (0.05) 10-2 2.23 (0.04) 10-2
5.0 103 5.66 (0.09) 10-2 3.52 (0.06) 10-2 3.03 (0.05) 10-2
1.0 104 6.10 (0.09) 10-2 3.89 (0.06) 10-2 3.25 (0.06) 10-2
2.0 104 7.08 (0.11) 10-2 4.40 (0.08) 10-2 3.53 (0.07) 10-2
5.0 104 8.43 (0.13) 10-2 5.33 (0.09) 10-2 4.57 (0.08) 10-2
1.0 105 1.06 (0.02) 10-1 6.46 (0.10) 10-2 5.07 (0.09) 10-2
2.0 105 1.54 (0.02) 10-1 9.50 (0.12) 10-2 7.41 (0.12) 10-2
3.0 105 2.03 (0.03) 10-1 1.26 (0.02) 10-1 1.02 (0.01) 10-1
5.0 105 2.85 (0.03) 10-1 1.81 (0.02) 10-1 1.35 (0.02) 10-1
1.0 106 4.21 (0.03) 10-1 2.71 (0.03) 10-1 1.97 (0.02) 10-1
2.0 106 5.32 (0.04) 10-1 3.74 (0.03) 10-1 2.92 (0.03) 10-1
3.0 106 5.39 (0.04) 10-1 3.98 (0.03) 10-1 3.18 (0.03) 10-1
4.0 106 4.82 (0.03) 10-1 3.62 (0.03) 10-1 2.94 (0.02) 10-1
6.0 106 4.46 (0.03) 10-1 3.54 (0.03) 10-1 2.86 (0.02) 10-1
1.0 107 3.16 (0.02) 10-1 2.63 (0.02) 10-1 2.22 (0.02) 10-1
1.4 107 2.65 (0.02) 10-1 2.23 (0.02) 10-1 1.92 (0.02) 10-1
2.0 107 2.14 (0.01) 10-1 1.87 (0.02) 10-1 1.61 (0.01) 10-1

EFFECTIVE CENTRE MEASUREMENTS
174
APPENDIX C
Effective centre measurements
C1 STUDSVIK 2202D
Because the Studsvik 2202D has cylindrical geometry, the position of the effective centre (ie the position at which it behaves as a point detector) is unknown and will depend on the angle of irradiation. For 90° incidence, the effective centre can reasonably be taken as being on the wire of the tube. To determine the effective centre for 0° and 180° incidence, measurements were made at approximately 40 source to detector distances ranging from 135.7 to 457.7 cm. By fitting a straight line to a graph of (corrected count rate)-½ against distance the effective centre and efficiency can hence be derived.
For the measurements at 0° and 180°, room and air scatter were corrected for by making measurements with a shadow cone and subtracting the count rate from the count rate without a shadow cone. A 5% increase in the scatter count rate was applied to allow for neutrons that pass straight through the instrument, then scatter back into the instrument before interacting in the tube. These neutrons are incorrectly measured as direct neutrons when the shadow cone technique is used. A 5% component was added in quadrature to the statistical uncertainty in the scatter measurement for each distance to allow for the uncertainty in this effect.
For 90° incidence, the scatter contribution was obtained from a fit to previous shadow cone measurements with a Studsvik 2202D detector, and the program SC-CAL was used for the analysis. Air attenuation was corrected for by using calculated air attenuation coefficients for the 252Cf spectrum. Because the 0° and 180° irradiations were made over an extended period, a decay correction was made to all measurements.
C1.1 Results: 90° The effective centre was taken to be the wire of the central detector. The efficiency of the instrument was determined to be = 0.413 (0.007) cm-2. The uncertainty (in parentheses) was calculated from a complete analysis.
C1.2 Results: 0° From the linear fit to the 0° data (Figure 105), the distance from the flat polyethylene end of the instrument to the effective centre, EC, can be found from the x and y intercepts, and the gradient, g, using Equation 11. The negative sign indicates that the effective centre is further from the source than the end of the instrument. This means that the effective centre is 6.5 cm in from the polyethylene face, which is closer to that end of the

APPENDIX C
175
cm8056001430009230
00
).(...
g)x(y
)y(xEC
−=
−=
=−=
==
instrument than the active volume of the BF3. The uncertainty quoted is only due to statistics and represents a coverage factor of 1.
11
The efficiency, ε, of the instrument for irradiation with a plane parallel beam of 252Cf neutrons incident from the end opposite the electronics (0°), can then be found using Equation 12, where A is the source emission rate and α the anisotropy factor. The quoted uncertainty is for a coverage factor of 1 and includes components due to the source emission rate and anisotropy factor.
12
FIGURE 105 0° Studsvik effective centre measurement with 252Cf source
2
72
2
cm0050348002071107301001430
4
4
).(..x..
Ag
=××
=
=
πα
πε

EFFECTIVE CENTRE MEASUREMENTS
176
cm41718001860034820
00
).(..
.g
)x(y)y(xEC
−=
−=
=−=
==
C1.3 Results: 180° From the linear fit to the 180° data (Figure 106), the distance from the end of the electronics to the effective centre, EC, is given by Equation 13. This means that the effective centre is 18.7 cm in from the electronics face, which is about the start of the active volume of the BF3 detector. The uncertainty is only due to statistics and is for a coverage factor of 1.
13
The efficiency of the Studsvik 2202D for irradiation with a plane parallel beam of 252Cf neutrons incident through the electronics (180°), is then found using Equation 14. The uncertainty quoted is for a coverage factor of 1 and includes components for the source emission rate and anisotropy factor.
FIGURE 106 180° Studsvik effective centre measurement with the 252Cf source
2
722
cm00502060
0207110730100186044
).(.
.x..Ag
=
××==
πα
πε

APPENDIX D
177
APPENDIX D
Additional measured data
D1 STUDSVIK 2202D
TABLE 40 Data for the fluence response of the Studsvik 2202D from the reference direction taken from Alberts et al, 1979. These results relate to four different instruments labelled 111, 113, 114 and 115 in the original reference. Instrument 112 in that reference is also a Studsvik 2202D, probably the same instrument as 111, but it was irradiated at 0° as opposed to 90°, the reference direction.
111 113 114 115 Energy/field
RΦ (s) (cm2) RΦ (s) (cm2) RΦ (s) (cm2) RΦ (s) (cm2)
Thermal 5.5 (0.5) 10-3 5.3 (0.5) 10-3
2 keV 4.9 (0.7) 10-2 4.5 (0.7) 10-2 3.6 (0.6) 10-2
24 keV 8.0 (1.0) 10-2 1.16 (0.14) 10-1 7.4 (0.9) 10-2
94 keV 1.07 (0.08) 10-1
100 keV 1.03 (0.07) 10-1 6.6 ( 0.5) 10-2 9.8 (0.7) 10-2
219 keV 1.71 (0.12) 10-1
250 keV 1.76 (0.14) 10-1 1.23 (0.10) 10-1 1.75 (0.14) 10-1
313 keV 2.12 (0.15) 10-1
405 keV 2.61 (0.18) 10-1
495 keV 2.94 (0.21) 10-1
570 keV 2.91 (0.20) 10-1 2.30 (0.16) 10-1
675 keV 3.50 (0.25) 10-1
870 keV 3.54 (0.25) 10-1
1 MeV 4.09 (0.20) 10-1 3.00 (0.15) 10-1
1.01 MeV 3.86 (0.19) 10-1
1.30 MeV 3.58 (0.25) 10-1
1.59 MeV 3.90 (0.27) 10-1
2.5 MeV 4.89 (0.29) 10-1 3.89 (0.23) 10-1 4.61 (0.28) 10-1
5.0 MeV 4.09 (0.25) 10-1 3.03 (0.18) 10-1
15.5 MeV 2.21 (0.15) 10-1 2.02 (0.14) 10-1 2.10 (0.15) 10-1
19.0 MeV 2.81 (0.34) 10-1 2.37 (0.28) 10-1 252Cf 3.95 (0.20) 10-1 3.18 (0.16) 10-1 4.33 (0.22) 10-1 238Ra-Be 3.61 (0.18) 10-1 3.67 (0.18) 10-1 241Am-Be 3.86 (0.19) 10-1 3.22 (0.16) 10-1 3.81 (0.19) 10-1 3.77 (0.19) 10-1
Values in parentheses represent type A uncertainty (coverage factor = 1)
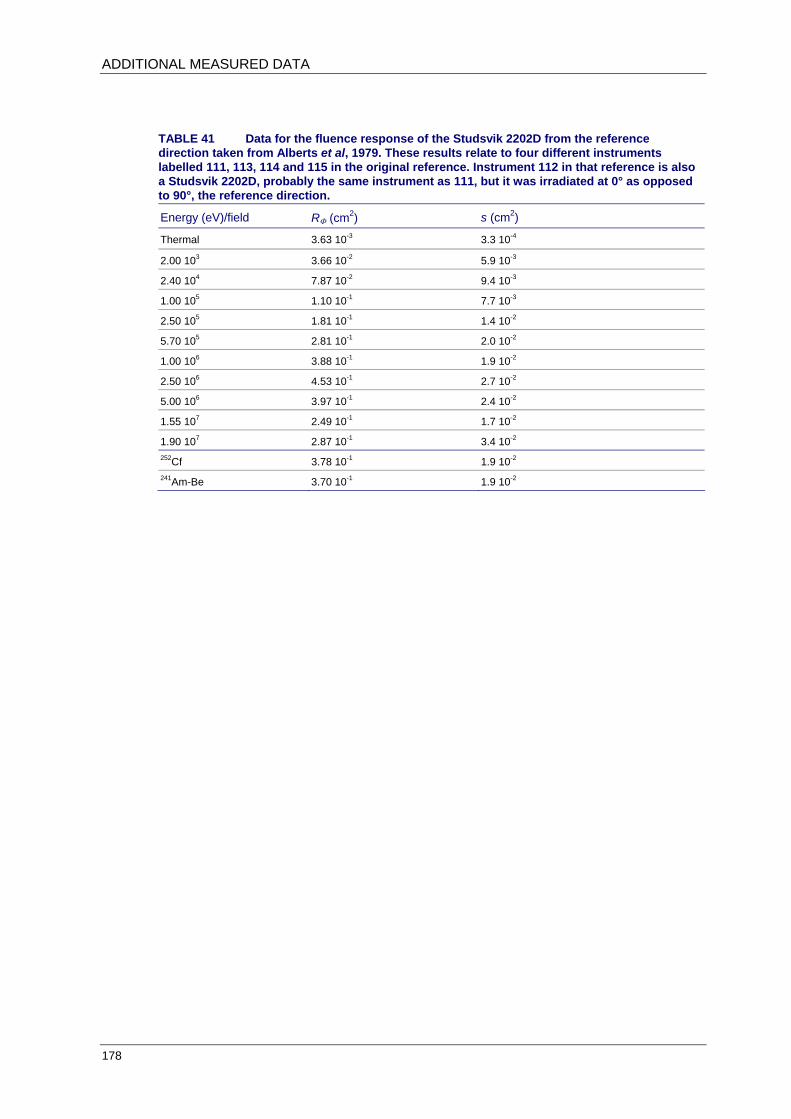
ADDITIONAL MEASURED DATA
178
TABLE 41 Data for the fluence response of the Studsvik 2202D from the reference direction taken from Alberts et al, 1979. These results relate to four different instruments labelled 111, 113, 114 and 115 in the original reference. Instrument 112 in that reference is also a Studsvik 2202D, probably the same instrument as 111, but it was irradiated at 0° as opposed to 90°, the reference direction.
Energy (eV)/field RΦ (cm2) s (cm2)
Thermal 3.63 10-3 3.3 10-4
2.00 103 3.66 10-2 5.9 10-3
2.40 104 7.87 10-2 9.4 10-3
1.00 105 1.10 10-1 7.7 10-3
2.50 105 1.81 10-1 1.4 10-2
5.70 105 2.81 10-1 2.0 10-2
1.00 106 3.88 10-1 1.9 10-2
2.50 106 4.53 10-1 2.7 10-2
5.00 106 3.97 10-1 2.4 10-2
1.55 107 2.49 10-1 1.7 10-2
1.90 107 2.87 10-1 3.4 10-2 252Cf 3.78 10-1 1.9 10-2 241Am-Be 3.70 10-1 1.9 10-2

APPENDIX F
179
APPENDIX E
Central Index of Dose Information Data (CIDI) 2003*
TABLE 42 CIDI data for collective neutron doses to classified workers in 2003 taken from personal dosemeter readings. Most of the readings will have been assessments of Hp(10).
Classified workers Collective dose (man mSv) Occupational Category Total Fraction E Fraction Nuclear site radiography 1 0.0% 0 0.0%
Nuclear reactor operations 551 3.5% 13 7.2%
Nuclear reactor maintenance 394 2.5% 7 3.9%
Nuclear fuel fabrication 500 3.2% 6 3.3%
Nuclear fuel reprocessing 3447 21.8% 65 36.1%
Nuclear industrial - other 7786 49.3% 34 18.9%
Nuclear decommission 1005 6.4% 15 8.3%
Veterinary work 1 0.0% 0 0.0%
Medical radiography 7 0.0% 0 0.0%
Medical physics 4 0.0% 0 0.0%
Medical - other 8 0.1% 0 0.0%
Academic research + teaching 259 1.6% 0 0.0%
Industrial research 229 1.4% 10 5.6%
Mining - offshore work 489 3.1% 2 1.1%
Mining - onshore drilling 14 0.1% 0 0.0%
Mining coal surface 2 0.0% 0 0.0%
Other mining surface 2 0.0% 0 0.0%
Quarrying 7 0.0% 0 0.0%
Ionising radiation machinery 172 1.1% 6 3.3%
Application + manipulation 113 0.7% 6 3.3%
Other industrial applications 61 0.4% 2 1.1%
NDT - industrial radiography 14 0.1% 0 0.0%
NDT - site radiography 137 0.9% 5 2.8%
Radioactive waste treatment 32 0.2% 0 0.0%
Radiation protection 161 1.0% 3 1.7%
Rad. transport 6 0.0% 0 0.0%
Defence - other 5 0.0% 0 0.0%
Others 397 2.5% 5 2.8%
Total workers 15804 100% 180 100%
* http://www.hse.gov.uk/radiation/ionising/doses/dose2003.htm

INFLUENCE OF POLYETHYLENE DENSITY ON NM2 RESPONSE
180
APPENDIX F
Influence of polyethylene density on NM2 response
The plots in this Appendix show the impact in terms of the various dose quantities of small changes to the polyethylene density. The results are presented for four different increments in the density all normalized to the response of the NM2 with unperturbed density to a 241Am-Be source incident from the reference direction, 90°.
10 20 40 100 200 400
H*(10)/Φ (pSv cm2)
0.5
1
2
Ra
tio
M90°/
H*
(10
)
1
2
Calibration Simulated workplace
Gas cooled reactor
PWR
Fuel cycle
Source fabrication
Transport flasks
MOx fabrication
perturbed: -0.5% pol. density
unperturbed
perturbed: +0.5% pol. density unperturbed
FIGURE 107 H*(10) response of the NM2 for workplace fields incident from the reference direction for -0.5% and +0.5% changes to the polyethylene density plotted alongside the unperturbed response

APPENDIX F
181
10 20 40 100 200 400
H*(10)/Φ (pSv cm2)
0.5
1
2
Ra
tio
M90°/
H*
(10
)
1
2
Calibration Simulated workplace
Gas cooled reactor
PWR
Fuel cycle
Source fabrication
Transport flasks
MOx fabrication
perturbed: +1.0% pol. density unperturbed
perturbed: +2.5% pol. density
unperturbed
FIGURE 108 H*(10) response of the NM2 for workplace fields incident from the reference direction for +1.0% and +2.5% changes to the polyethylene density plotted alongside the unperturbed response
10 20 40 100 200 400
H*(10)/Φ (pSv cm2)
0.5
1
2
Ra
tio
M90°/
EA
P
1
2
Calibration Simulated workplace
Gas cooled reactor
PWR
Fuel cycle
Source fabrication
Transport flasks
MOx fabrication
perturbed: -0.5% pol. density unperturbed
perturbed: +0.5% pol. density
unperturbed
FIGURE 109 EAP response of the NM2 for workplace fields incident from the reference direction for –0.5% and +0.5% changes to the polyethylene density plotted alongside the unperturbed response

INFLUENCE OF POLYETHYLENE DENSITY ON NM2 RESPONSE
182
10 20 40 100 200 400
H*(10)/Φ (pSv cm2)
0.5
1
2
Ra
tio
M90°/
EA
P
1
2
Calibration Simulated workplace
Gas cooled reactor
PWR
Fuel cycle
Source fabrication
Transport flasks
MOx fabrication
perturbed: +1.0% pol. density
unperturbed
perturbed: +2.5% pol. density unperturbed
FIGURE 110 EAP response of the NM2 for workplace fields incident from the reference direction for +1.0% and +2.5% changes to the polyethylene density plotted alongside the unperturbed response
10 20 40 70 100 200 400
H*(10)/Φ (pSv cm2)
0.5
1
2
3
4
5
Ra
tio
M90°/
ERO
T 1
2
3
4
5
Calibration Simulated workplace
Gas cooled reactor
PWR
Fuel cycle
Source fabrication
Transport flasks
MOx fabrication
perturbed: -0.5% pol. density
unperturbed
perturbed: +0.5% pol. density
unperturbed
FIGURE 111 EROT response of the NM2 for workplace fields incident from the reference direction for -0.5% and +0.5% changes to the polyethylene density plotted alongside the unperturbed response
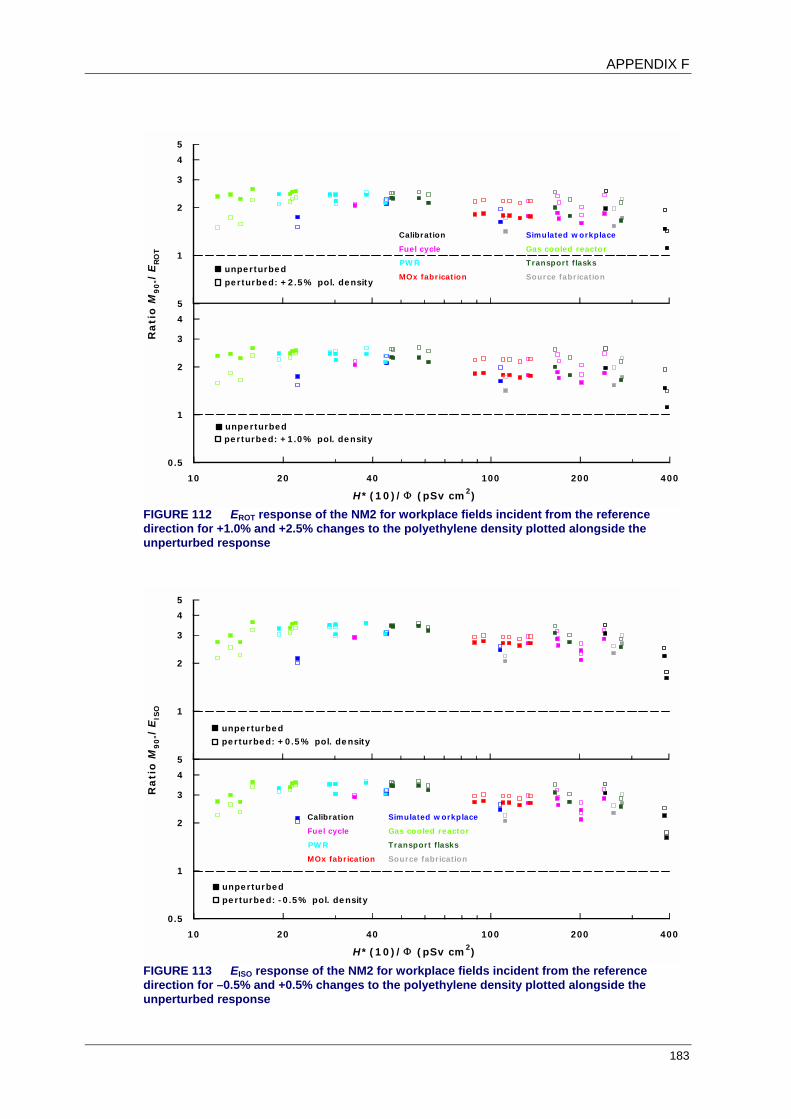
APPENDIX F
183
10 20 40 100 200 400
H*(10)/Φ (pSv cm2)
0.5
1
2
3
4
5
Ra
tio
M90°/
ERO
T 1
2
3
4
5
Calibration Simulated workplace
Gas cooled reactor
PWR
Fuel cycle
Source fabrication
Transport flasks
MOx fabrication
perturbed: +1.0% pol. density unperturbed
perturbed: +2.5% pol. density unperturbed
FIGURE 112 EROT response of the NM2 for workplace fields incident from the reference direction for +1.0% and +2.5% changes to the polyethylene density plotted alongside the unperturbed response
10 20 40 100 200 400
H*(10)/Φ (pSv cm2)
0.5
1
2
3
4
5
Ra
tio
M90°/
EIS
O 1
2
3
4
5
Calibration Simulated workplace
Gas cooled reactor
PWR
Fuel cycle
Source fabrication
Transport flasks
MOx fabrication
perturbed: -0.5% pol. density unperturbed
perturbed: +0.5% pol. density unperturbed
FIGURE 113 EISO response of the NM2 for workplace fields incident from the reference direction for –0.5% and +0.5% changes to the polyethylene density plotted alongside the unperturbed response

INFLUENCE OF POLYETHYLENE DENSITY ON NM2 RESPONSE
184
10 20 40 100 200 400
H*(10)/Φ (pSv cm2)
0.5
1
2
3
4
5
Ra
tio
M9
0°/
EIS
O 1
2
3
4
5
Calibration Simulated workplace
Gas cooled reactor
PWR
Fuel cycle
Source fabrication
Transport flasks
MOx fabrication
perturbed: -0.5% pol. density unperturbed
perturbed: +0.5% pol. density unperturbed
FIGURE 114 EISO response of the NM2 for workplace fields incident from the reference direction for +1.0% and +2.5% changes to the polyethylene density plotted alongside the unperturbed response