Embed Size (px)
Citation preview
Practical Assessment of Merits of Methods for QPA
Arnt Kern, Ian Madsen, Nicola Scarlett
This document was presented at PPXRD -Pharmaceutical Powder X-ray Diffraction Symposium
Sponsored by The International Centre for Diffraction Data
This presentation is provided by the International Centre for Diffraction Data in cooperation with the authors and presenters of the PPXRD symposia for the express purpose of educating the scientific community.
All copyrights for the presentation are retained by the original authors.
The ICDD has received permission from the authors to post this material on our website and make the material available for viewing. Usage is restricted for the purposes of education and scientific research.
ICDD Website - www.icdd.comPPXRD Website – www.icdd.com/ppxrd

Rietveld Refinement Round Robin (http://www.iucr.org/iucr-top/comm/cpd/)
• Hill, R.J. (1992): "Rietveld Refinement Round Robin. I. Analysis of Standard X-ray and Neutron Data for PbSO4". J. Appl. Cryst., 25, 589-610
• Hill, R.J. & Cranswick, L.M.D (1994): "Rietveld Refinement Round Robin. II. Analysis of Monoclinic ZrO2". J. Appl. Cryst., 27, 802-844
QPA Round Robin (http://www.iucr.org/iucr-top/comm/cpd/)
• Madsen, I.C. et al. (2001): "Outcomes of the International Union of Crystallography Commission on Powder Diffraction Round Robin on Quantitative Phase Analysis: samples 1a to 1h". J. Appl. Cryst., 34, 409-426
• Scarlett, N.V.Y. et al. (2002): "Outcomes of the International Union of Crystallography Commission on Powder Diffraction Round Robin on Quantitative Phase Analysis: samples 2, 3, 4, synthetic bauxite, natural granodiorite and pharmaceuticals". J. Appl. Cryst., 35, 383-400
Biannual "Reynold's Cup" series (http://www.clays.org/SOCIETY%20AWARDS/RCintro.html)
Quantitative Rietveld Phase Analysis of Pharmaceuticals"
• Fawcett T.G., Needham, F., Faber, J.N. & Crowder, C.E. (2010): "International Centre for Diffraction Data Round Robin on Quantitative Rietveld Phase Analysis of Pharmaceuticals". Powder Diffraction, 25 (1), 1-8
Suggested Reading Round Robins
PPXRD 14 2
Quantitative phase analysis
• Madsen, I.C. and Scarlett, N.V.Y. (2008) Quantitative Phase Analysis In "Powder Diffraction: Theory and Practice." Dinnebier, R.E. and Billinge, S.J.L., Editors. The Royal Society of Chemistry: Cambridge, UK, 582 pages.
• Madsen, I.C., Scarlett, N.V.Y. and Kern, A. (2011) Description and survey of methodologies for the determination of amorphous content via X-ray powder diffraction. Z. Krist., 226, 944-955.
• Kern, A., Madsen, I.C. and Scarlett, N.V.Y. (2012) Quantifying amorphous phases. Uniting Electron Crystallography and Powder Diffraction. Editors: Kolb, U., Shankland, K., Meshi, L., Avilov, A. & David, W. Springer, 434 pages.
• Madsen, I.C. and Scarlett, N.V.Y., Riley, D.P. and Raven, M.D. (2012) Quantitative Phase Analysis using the Rietveld Method In "Modern Diffraction Methods", Mittemeijer, E.J. and Welzel, U., Editors. Wiley-VCH, 554 pages.
• Madsen, I.C., Scarlett, N.V.Y. and Webster, N.A.S. (2012) Quantitative phase analysis. Uniting Electron Crystallography and Powder Diffraction. Editors: Kolb, U., Shankland, K., Meshi, L., Avilov, A. & David, W. Springer, 434 pages.
3
Suggested Reading Recent Reviews
PPXRD 14
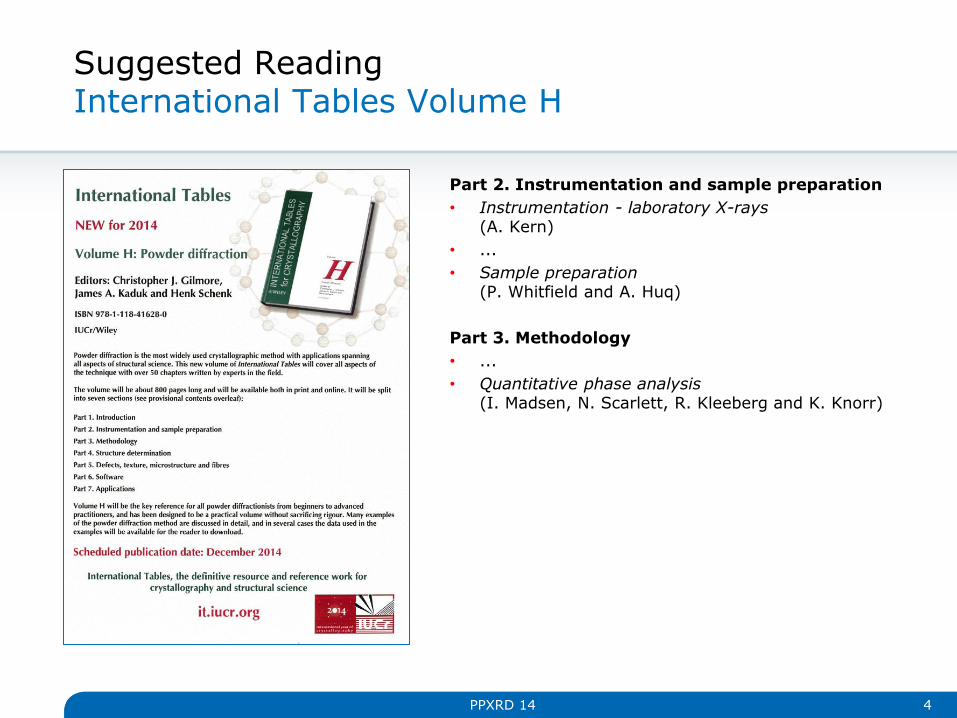
Suggested Reading International Tables Volume H
PPXRD 14 4
Part 2. Instrumentation and sample preparation
• Instrumentation - laboratory X-rays (A. Kern)
• ...
• Sample preparation (P. Whitfield and A. Huq)
Part 3. Methodology
• ...
• Quantitative phase analysis (I. Madsen, N. Scarlett, R. Kleeberg and K. Knorr)

Quantitative Phase Analysis by XRD Classification
Methods described in this study
• Single peak method
• Whole pattern methods
• Traditional Rietveld method
• Internal Standard method
• External Standard method
• PONKCS method
• Degree of Crystallinity (DOC)
5
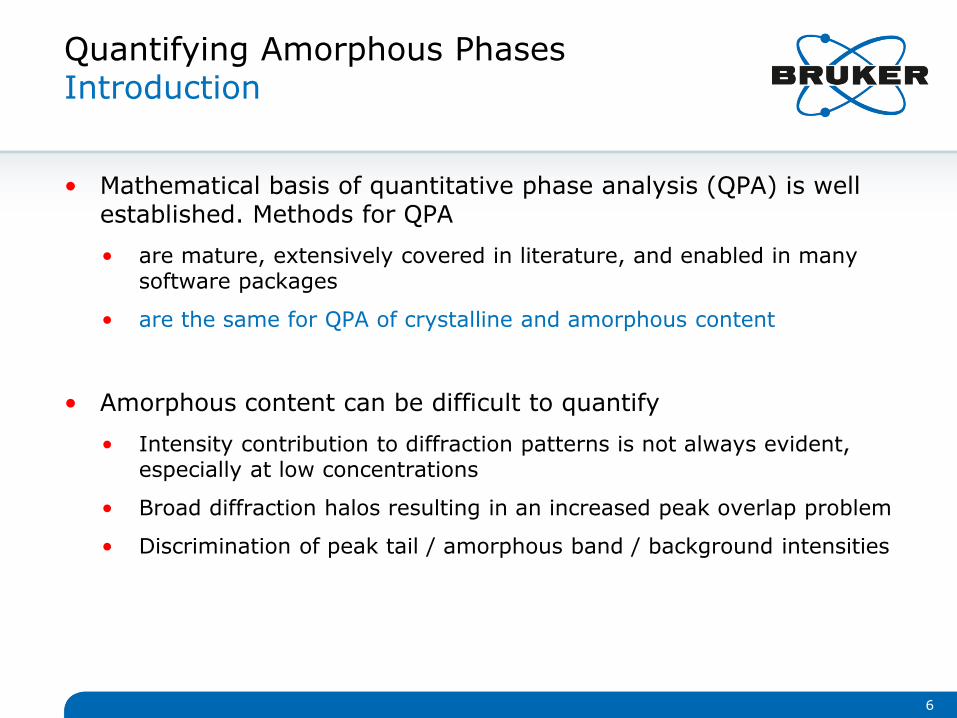
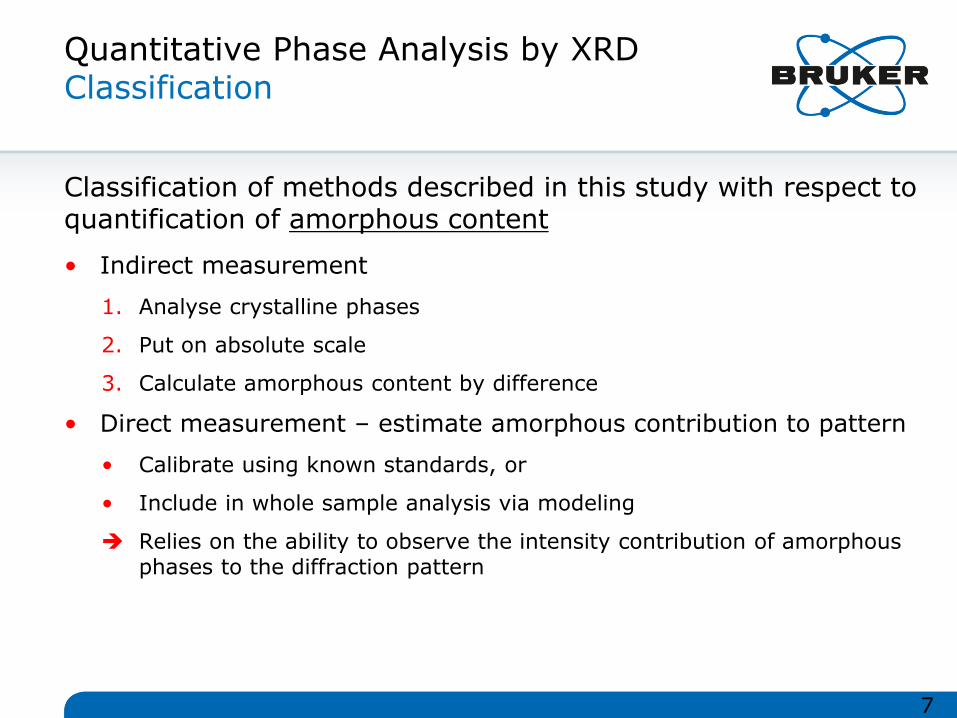
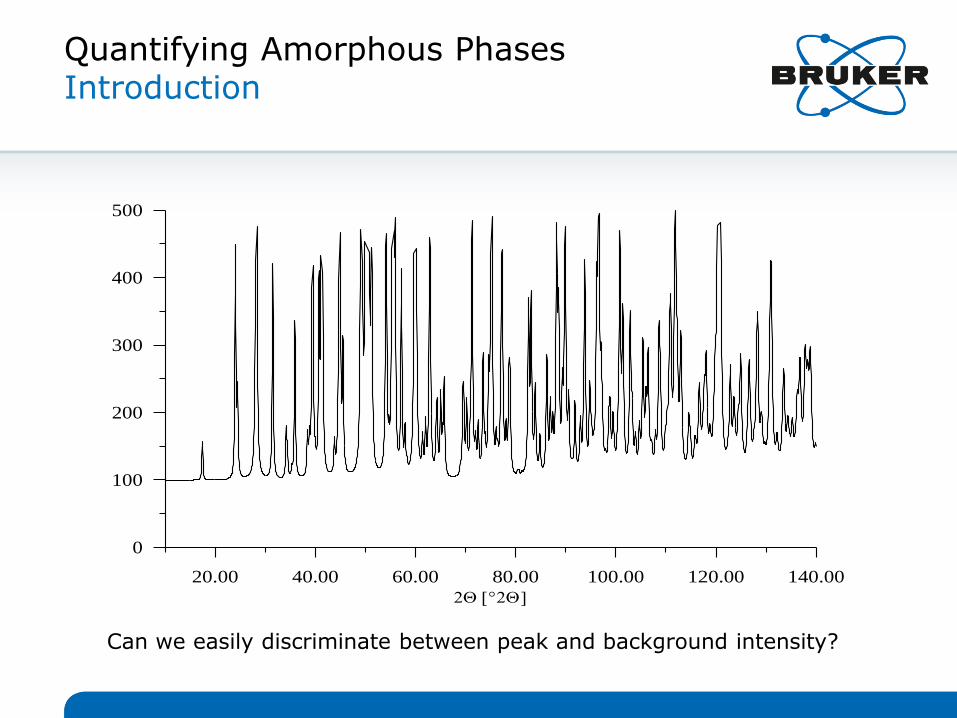
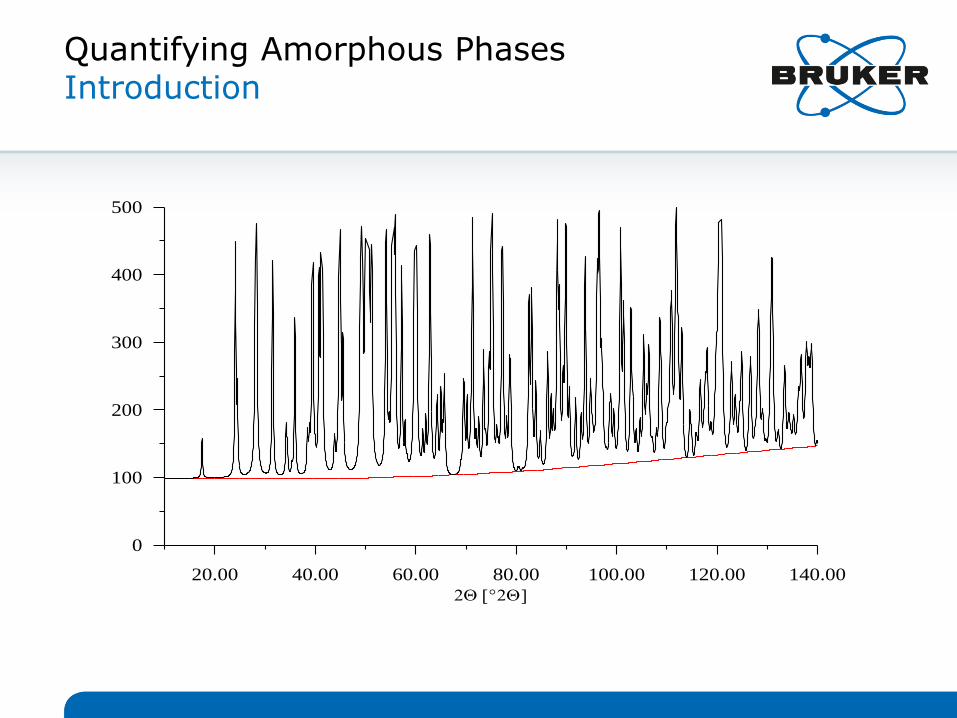
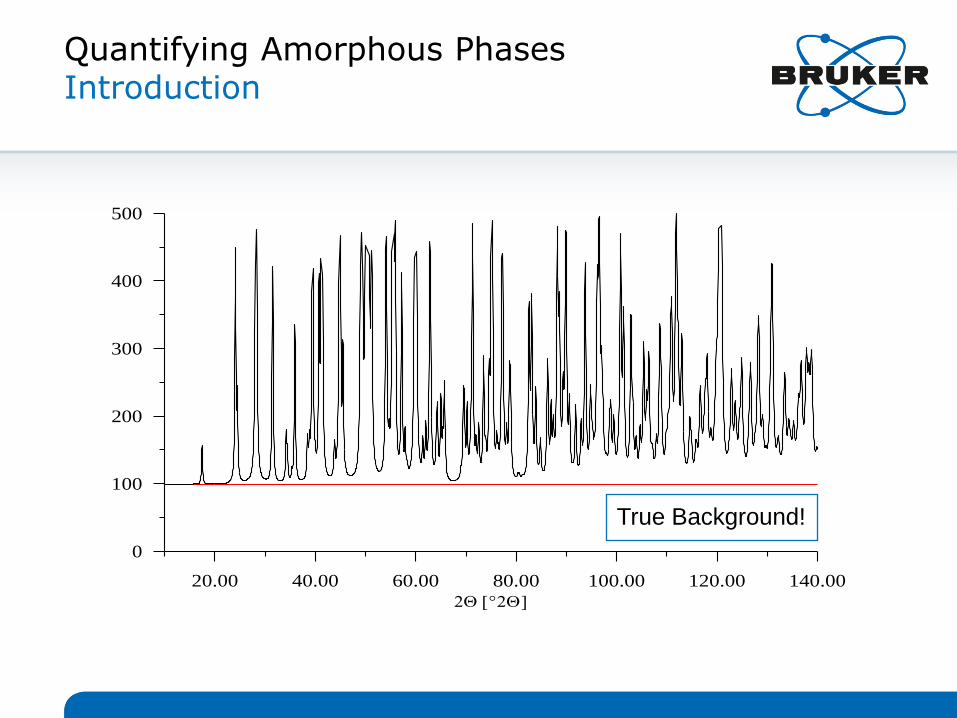
Quantifying Amorphous Phases Introduction
• Mathematical basis of quantitative phase analysis (QPA) is well established. Methods for QPA
• are mature, extensively covered in literature, and enabled in many software packages
• are the same for QPA of crystalline and amorphous content
• Amorphous content can be difficult to quantify
• Intensity contribution to diffraction patterns is not always evident, especially at low concentrations
• Broad diffraction halos resulting in an increased peak overlap problem
• Discrimination of peak tail / amorphous band / background intensities
6
Quantitative Phase Analysis by XRD Classification
Classification of methods described in this study with respect to quantification of amorphous content
• Indirect measurement
1. Analyse crystalline phases
2. Put on absolute scale
3. Calculate amorphous content by difference
• Direct measurement – estimate amorphous contribution to pattern
• Calibrate using known standards, or
• Include in whole sample analysis via modeling
Relies on the ability to observe the intensity contribution of amorphous phases to the diffraction pattern
7
Quantifying Amorphous Phases Introduction
20.00 40.00 60.00 80.00 100.00 120.00 140.00
0
100
200
300
400
500
Can we easily discriminate between peak and background intensity?

Quantifying Amorphous Phases Introduction
20.00 40.00 60.00 80.00 100.00 120.00 140.00
0
100
200
300
400
500
Quantifying Amorphous Phases Introduction
20.00 40.00 60.00 80.00 100.00 120.00 140.00
0
100
200
300
400
500

Quantifying Amorphous Phases Introduction
20.00 40.00 60.00 80.00 100.00 120.00 140.00
0
100
200
300
400
500
Quantifying Amorphous Phases Introduction
20.00 40.00 60.00 80.00 100.00 120.00 140.00
0
100
200
300
400
500
True Background!
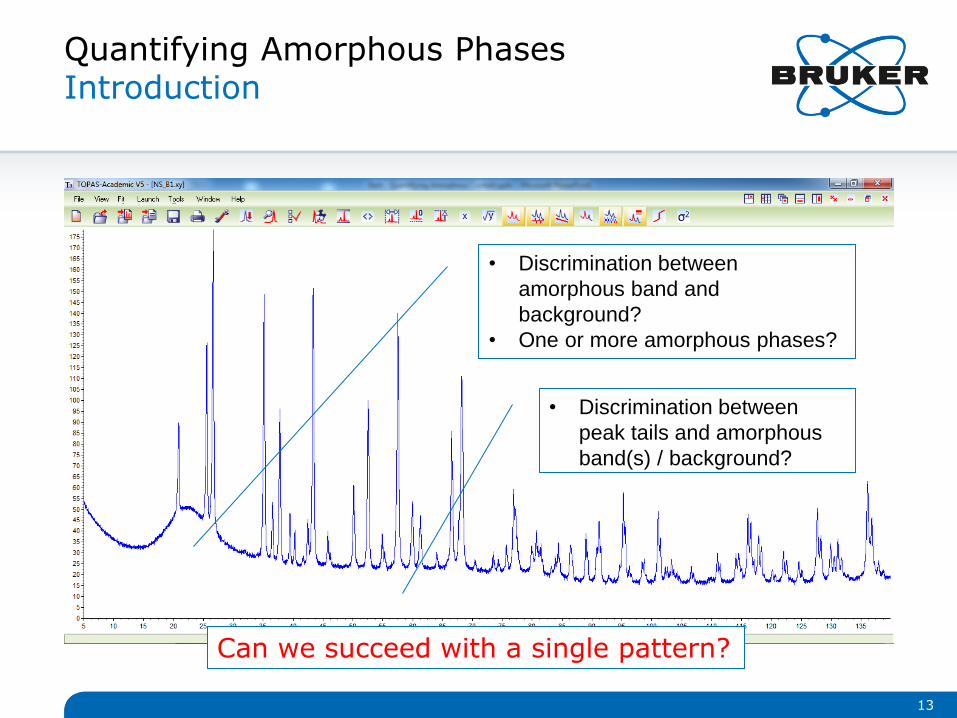
Quantifying Amorphous Phases Introduction
13
• Discrimination between
amorphous band and
background?
• One or more amorphous phases?
• Discrimination between
peak tails and amorphous
band(s) / background?
Can we succeed with a single pattern?

Quantifying Amorphous Phases Intensity Discrimination
14
Mixture
"Standard"
Amorphous phase
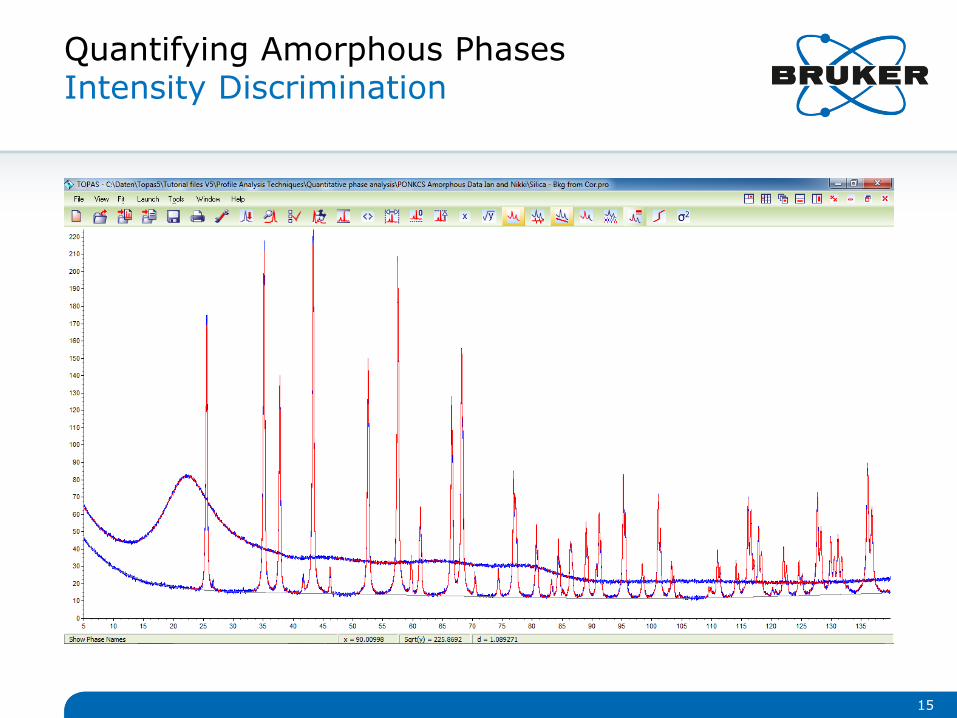
Quantifying Amorphous Phases Intensity Discrimination
15

Quantifying Amorphous Phases Intensity Discrimination
16
Amorphous content model
Instrument background
SAXS signal

Quantifying Amorphous Phases Intensity Discrimination
17
Surface refinement with common background
and (amorphous model + scale factor)

Methodology
Single Peak Method
18
Single Peak Method
General procedure
1. Prepare a series of standards containing the crystalline or amorphous phase of interest at known concentrations
2. Obtain a measure of the crystalline or amorphous phase’s intensity which is related to its concentration
3. Generate a calibration curve, e.g.
where Wa is the fraction of the crystalline or amorphous phase and Ia is the measure of the intensity of the crystalline or amorphous phase
‼ Needs redetermination to compensate for tube ageing and any instrument configuration change
19
BIAW aa *

Telmisartane Form Beta in Form Alpha
Form beta
Accuracy better than 0.2% for all samples
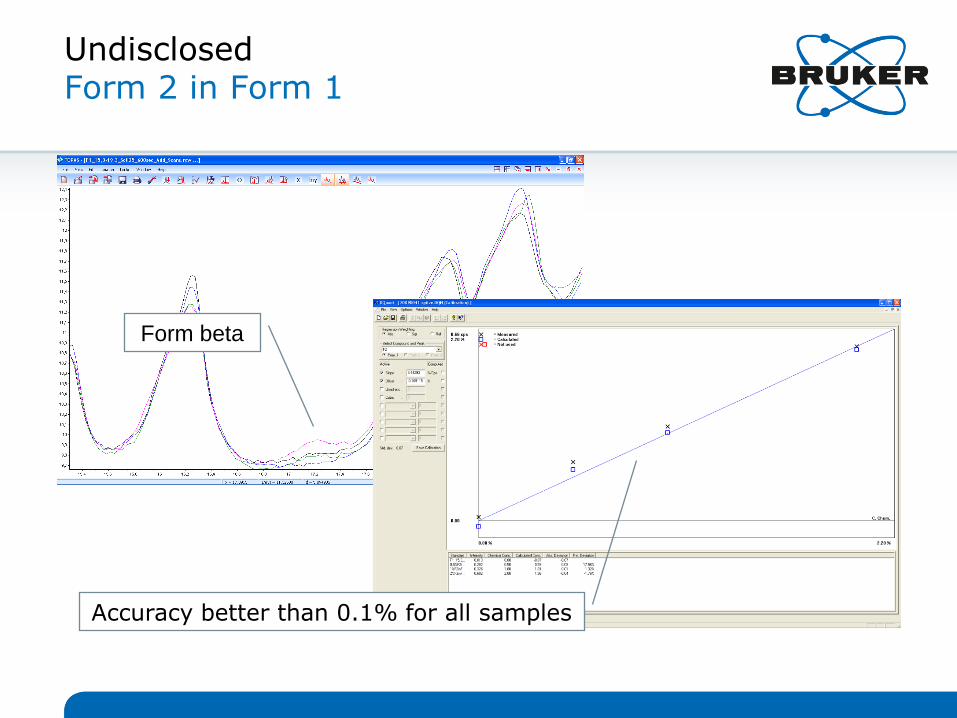
Undisclosed Form 2 in Form 1
Form beta
Accuracy better than 0.1% for all samples

Single Peak Method
Benefits
• Highly accurate, specifically for phases close to the detection limit
• There is no need to characterize all phases in the mixture
• No need to determine the background. Note: If so, the calibration curve wont go through the origin
• More than one amorphous phase can be analyzed (this will usually require profile fitting)
Limitations
• Need access to region of pattern free from excessive peak overlap
• Requires access to materials for preparation of standards
• Method only applicable to mixtures similar to calibration suite
• Sample properties must not change (chemistry, preferred orientation, ...)
• Needs redetermination to compensate for tube ageing and any instrument configuration changes
• Direct method for determination of amorphous content
22

Methodology
Traditional Rietveld method Internal Standard method External Standard method
PONKCS method Degree of Crystallinity
23
Whole Pattern Methods Traditional Rietveld Method
• The basic principle of the Rietveld method is the description of all data points of a powder pattern using an appropriate refinement model
• The parameters of this model, consisting of crystal structure, sample, instrument and background parameters, are refined simultaneously using least squares methods
• Minimize the differences between the calculated and measured powder diffraction pattern
• Rietveld analysis is a standardless1) method and thus does not require any standards or calibration
1) Note: Instead of standards, accurate crystal structure are required for each crystalline phase in the sample. The impact of poor or wrong crystal structures on QPA results is widely underestimated.
24
Whole Pattern Methods Traditional Rietveld Method
Benefits
• Requires no standards or calibration1)
1) Note: Instead of standards, crystal structures are required for each crystalline phase in the sample. The impact of poor or wrong crystal structures on QPA results is widely underestimated.
Limitations
• The Rietveld method assumes that all phases are crystalline and included in the analysis
• Accurate crystal structure required for all phases
• Amorphous components cannot be considered
• Produces only relative phase abundances
• The relative weight fractions of the crystalline phases are normalized to 100%
• Crystalline phases may be overestimated if non-identified and/or amorphous phases are present
25
Whole Pattern Methods Traditional Rietveld Method - Quantifying Amorphous Phases
• Relies on finding a crystal structure which adequately models the positions and relative intensities of the observable bands of an amorphous component in a diffraction pattern
• e.g. Le Bail, 1995; Lutterotti et al., 1998
• Allowance for extreme peak broadening provides peak widths and shapes which represent those of the amorphous bands in the observed data
• Since this approach treats all components as crystalline and includes them in the analysis, the amorphous phase abundance can be obtained using the traditional Rietveld methodology (Hill and Howard, 1987):
26

Whole Pattern Methods Traditional Rietveld Method - Quantifying Amorphous Phases
27
Cristobalite Structure
Madsen et al. (2011), Kern et al. (2012)
Whole Pattern Methods Traditional Rietveld Method - Quantifying Amorphous Phases
Benefits
• Requires no standards or calibration
• More than one amorphous phase can be analyzed
Limitations
• Direct method for determination of amorphous content
• Some amorphous material will not have a representative crystal structure
• Available crystal structures (with long-range order) may not accurately represent material which only has short-range order (e.g. glasses).
28
Methodology
Traditional Rietveld method Internal Standard method External Standard method
PONKCS method Degree of Crystallinity
29
Whole Pattern Methods Internal Standard
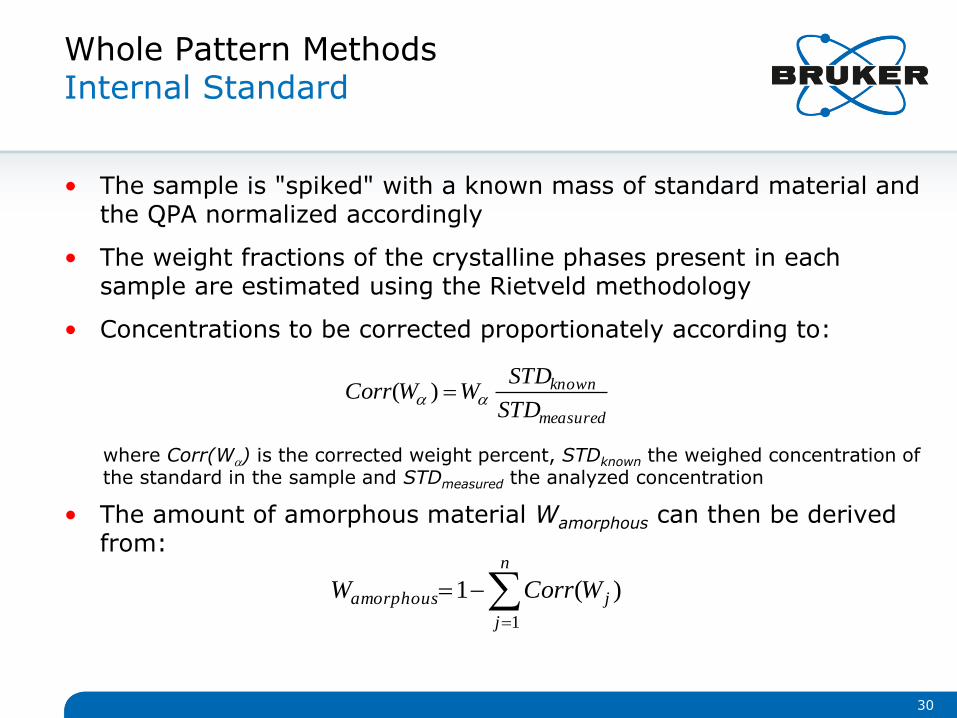
• The sample is "spiked" with a known mass of standard material and the QPA normalized accordingly
• The weight fractions of the crystalline phases present in each sample are estimated using the Rietveld methodology
• Concentrations to be corrected proportionately according to:
where Corr(Wa) is the corrected weight percent, STDknown the weighed concentration of the standard in the sample and STDmeasured the analyzed concentration
• The amount of amorphous material Wamorphous can then be derived from:
30
measured
known
STD
STDWWCorr aa )(
n
j
jamorphous WCorrW
1
)(1
Whole Pattern Methods Internal Standard
Benefits
• Indirect method for determination of amorphous content
• The Internal Standard Method is enabled in many Rietveld analysis packages
Limitations
• Only the sum of all amorphous and unidentified phases can be reported
• The sample is contaminated
• The standard addition process is laborious (weighing, mixing), and not feasible in industrial, automated sample preparation environments
31

Methodology
Traditional Rietveld method Internal Standard method External Standard method
PONKCS method Degree of Crystallinity
32

Quantifying Amorphous Phases External Standard Method
• An external standard is used to determine a "normalisation constant" K for the experimental setup
• Independent of sample and phase related parameters
• A single measurement is sufficient for analysis
• Requires the mass absorption coefficient for the entire sample – µm*
• Amorphous content derived in same way as internal standard method
• Puts the determined crystalline components on an absolute scale and derives the amorphous content by difference
33
K
ZMVSW m
abs
*
)(
)( aaa
O’Connor and Raven (1988), Powder Diffraction, 3(1), 2-6
Quantifying Amorphous Phases External Standard Method
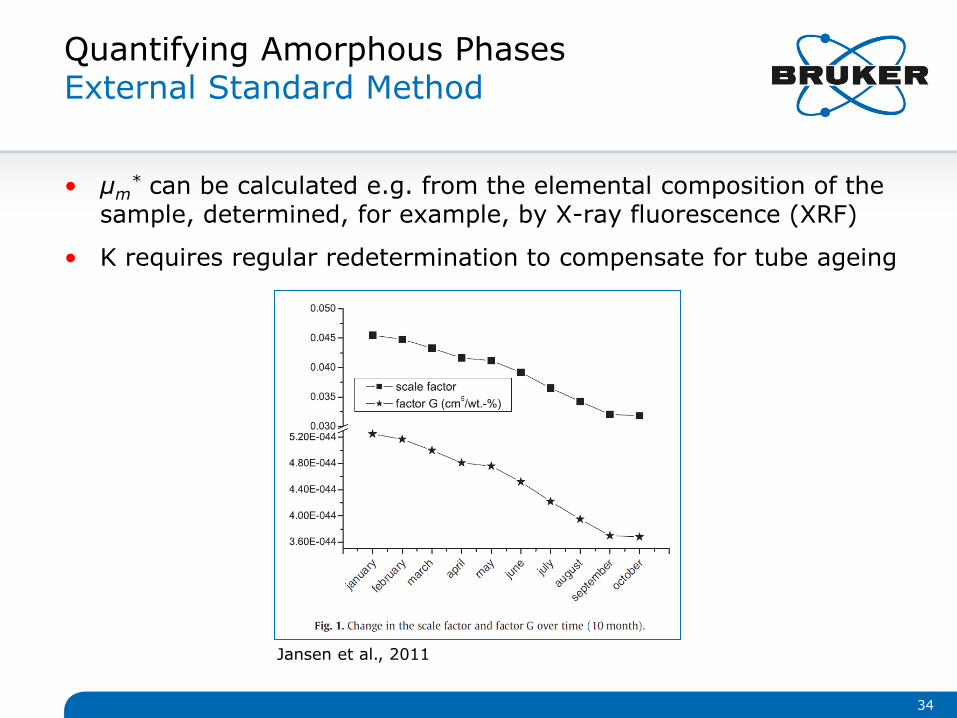
• µm* can be calculated e.g. from the elemental composition of the
sample, determined, for example, by X-ray fluorescence (XRF)
• K requires regular redetermination to compensate for tube ageing
34
Jansen et al., 2011
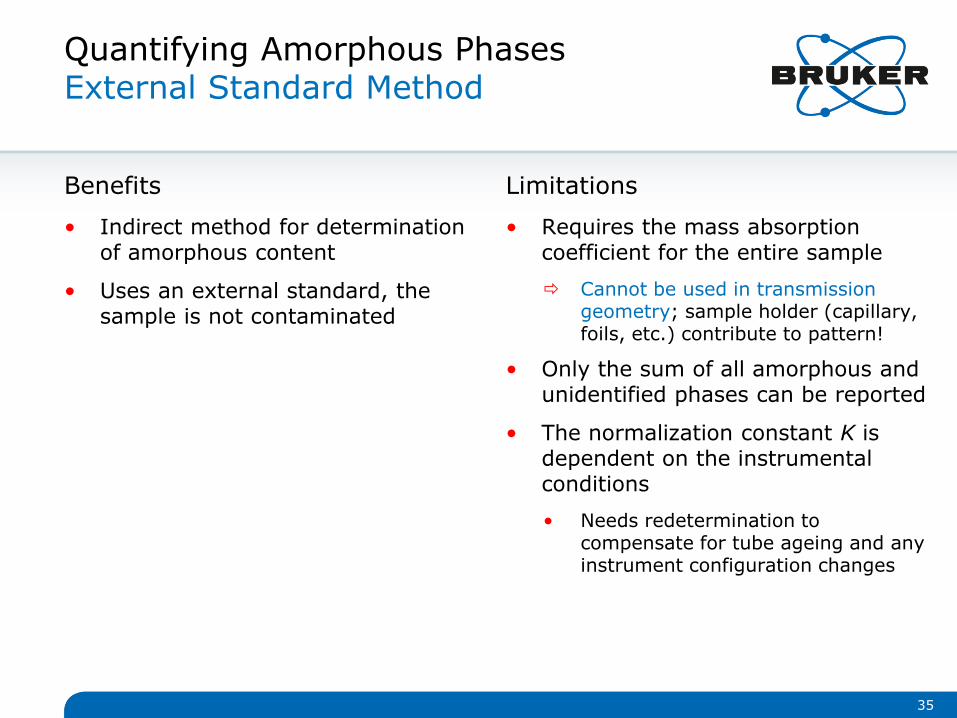
Quantifying Amorphous Phases External Standard Method
Benefits
• Indirect method for determination of amorphous content
• Uses an external standard, the sample is not contaminated
Limitations
• Requires the mass absorption coefficient for the entire sample
Cannot be used in transmission geometry; sample holder (capillary, foils, etc.) contribute to pattern!
• Only the sum of all amorphous and unidentified phases can be reported
• The normalization constant K is dependent on the instrumental conditions
• Needs redetermination to compensate for tube ageing and any instrument configuration changes
35
Methodology
Traditional Rietveld method Internal Standard method External Standard method
PONKCS method Degree of Crystallinity
36
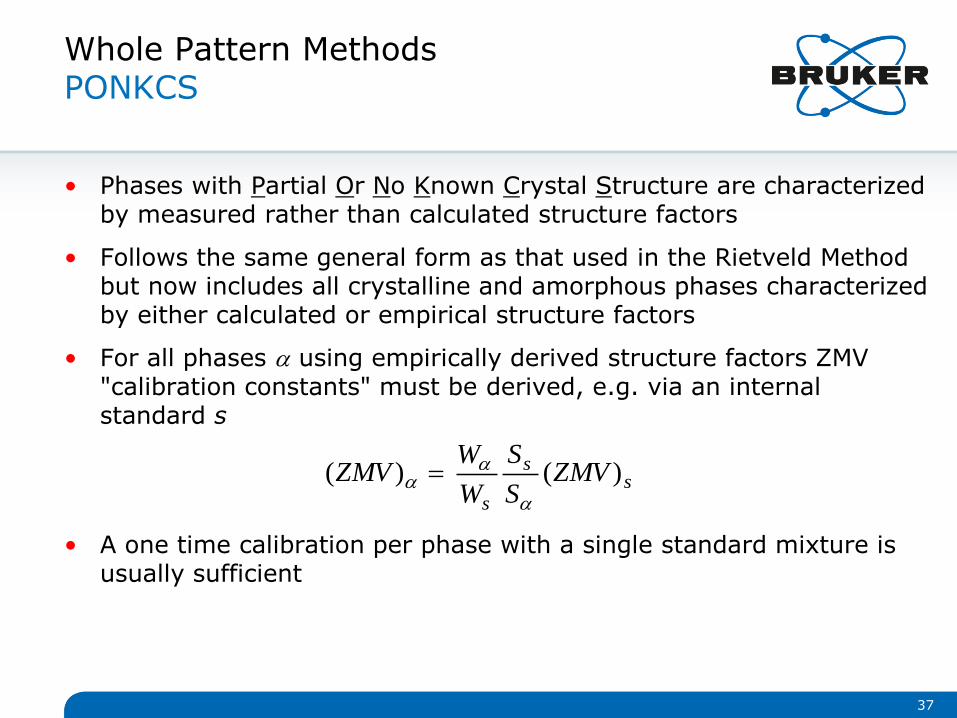
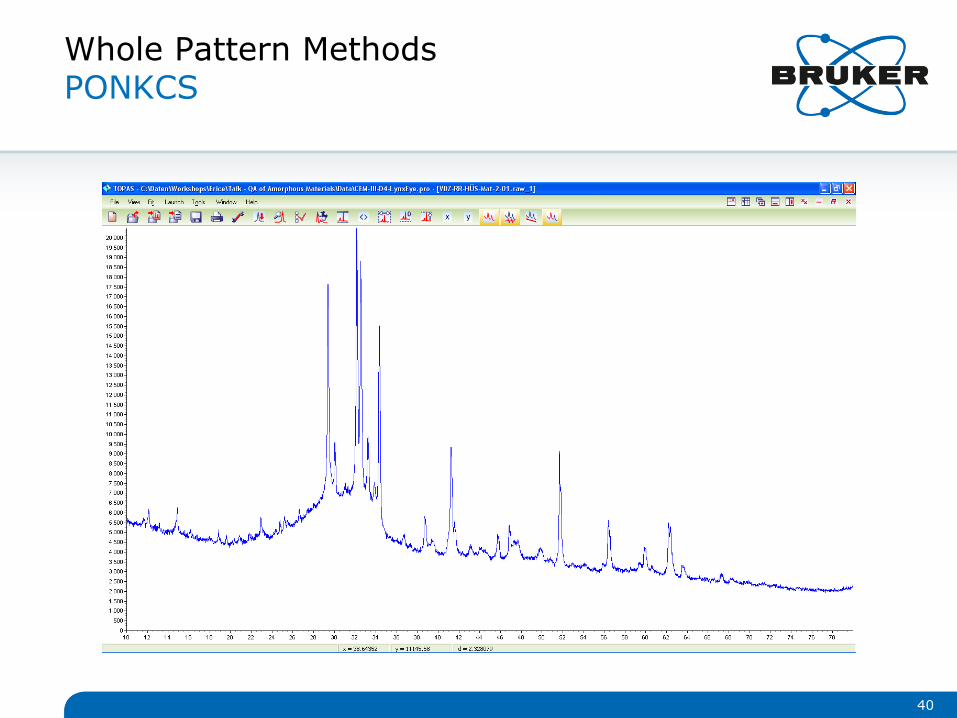
Whole Pattern Methods PONKCS
• Phases with Partial Or No Known Crystal Structure are characterized by measured rather than calculated structure factors
• Follows the same general form as that used in the Rietveld Method but now includes all crystalline and amorphous phases characterized by either calculated or empirical structure factors
• For all phases a using empirically derived structure factors ZMV "calibration constants" must be derived, e.g. via an internal standard s
• A one time calibration per phase with a single standard mixture is usually sufficient
37
ss
s
ZMVS
S
W
WZMV )( )(
a
aa
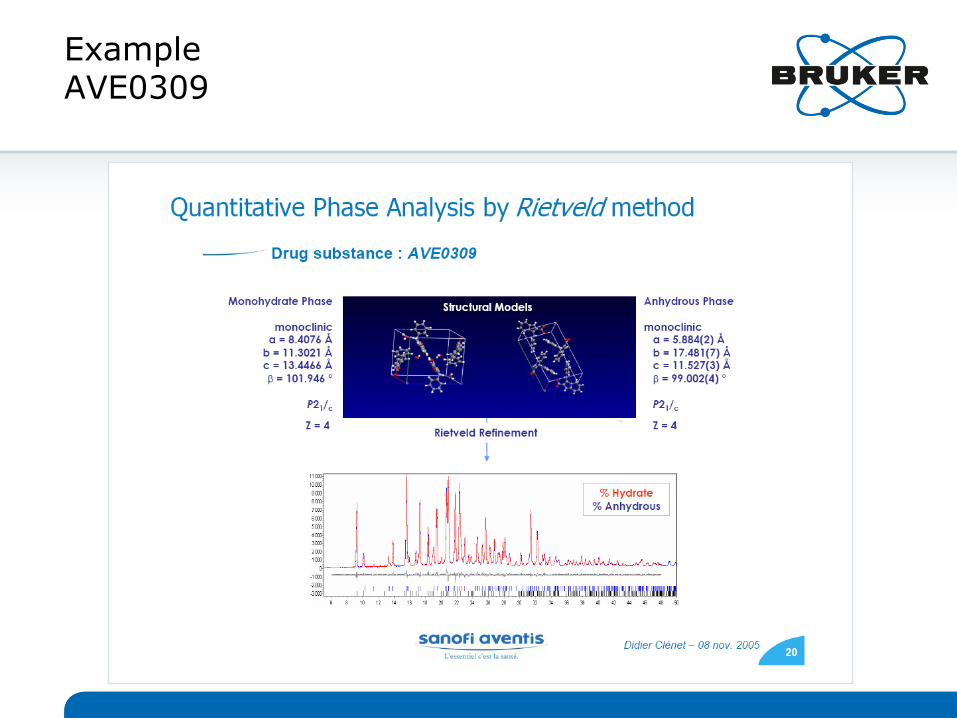
Example AVE0309

Example AVE0309
Known
composition Clenet (2005)
Rietveld Clenet (2005)
PONKCS
1) Hydrate
Anhydrate
13.6 %
86.4 %
14.6 %
85.4 %
14.05 %
85.95 %
2) Hydrate
Anhydrate
50.3 %
49.7 %
50.1 %
49.9 %
50.69 %
49.31 %
Dmax ~ 1% Dmax ~0.4%
Whole Pattern Methods PONKCS
40
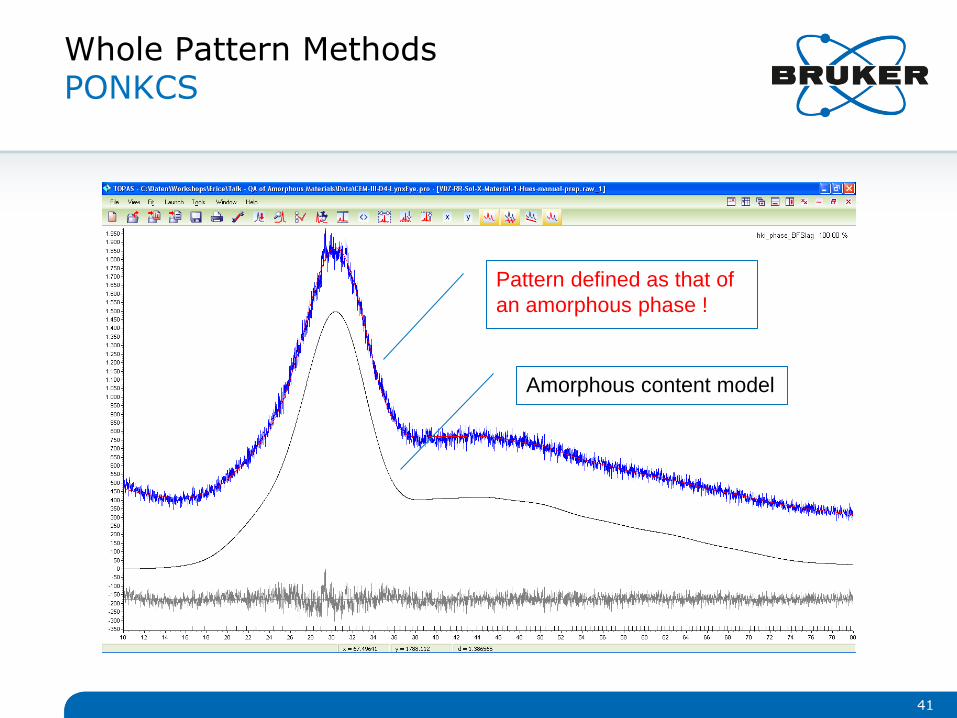
Whole Pattern Methods PONKCS
41
Amorphous content model
Pattern defined as that of
an amorphous phase !

Whole Pattern Methods PONKCS
Amorphous phase
25.1% (25%)
67.2% (67%)
71.7% (72%)
Whole Pattern Methods PONKCS
Benefits
• Allows quantification of phases without known crystal structure
• Crystalline and amorphous phases are included in the analysis model
• More than one amorphous phase can be analyzed
Limitations
• Requires availability of a standard mixture to derive an empirical ZMV
• Direct method for determination of amorphous content
43

Methodology
Traditional Rietveld method Internal Standard method External Standard method
PONKCS method Degree of Crystallinity
44
Whole Pattern Methods Degree of Crystallinity
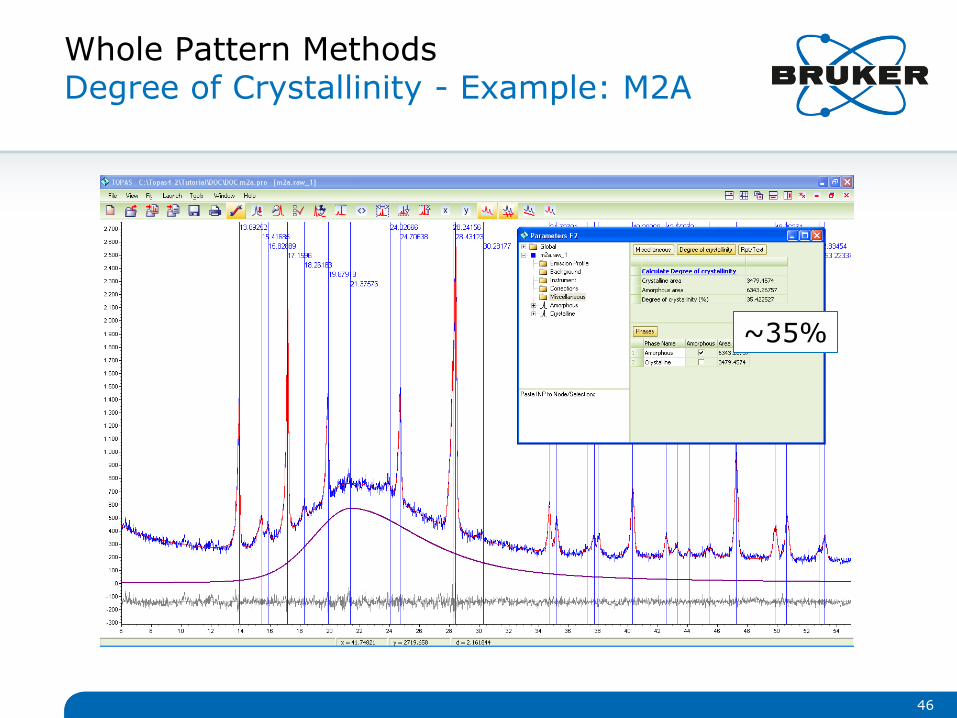
• Based on the estimation of the total intensity or area contributed to the overall diffraction pattern by each component in the analysis
• The degree of crystallinity, DOC, is calculated from the total areas under the defined crystalline and amorphous components from
• The weight fraction of the amorphous material, Wamorph, can be calculated from
• The method only delivers accurate results, if the chemistry of the amorphous phase is identical to that of the whole sample
• If this is not the case, then an additional calibration step is required to obtain absolute phase amounts
45
AreaAmorphousAreaeCrystallin
AreaeCrystallinDOC
DOCWamorph 1
46
Whole Pattern Methods Degree of Crystallinity - Example: M2A
~35%
Whole Pattern Methods Degree of Crystallinity
Benefits
• More than one amorphous phase can be analyzed
• The method is enabled in many software packages
Limitations
• Direct method for determination of amorphous content
47

Summary
48
Summary
49
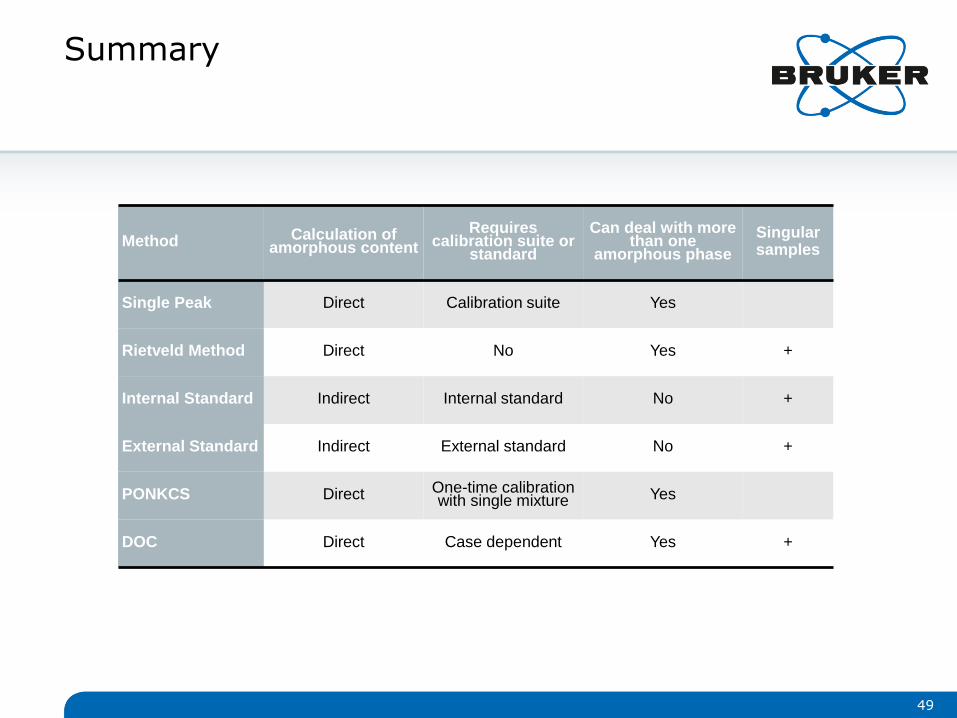
Method Calculation of amorphous content
Requires calibration suite or
standard
Can deal with more than one
amorphous phase
Singular samples
Single Peak Direct Calibration suite Yes
Rietveld Method Direct No Yes +
Internal Standard Indirect Internal standard No +
External Standard Indirect External standard No +
PONKCS Direct One-time calibration with single mixture Yes
DOC Direct Case dependent Yes +
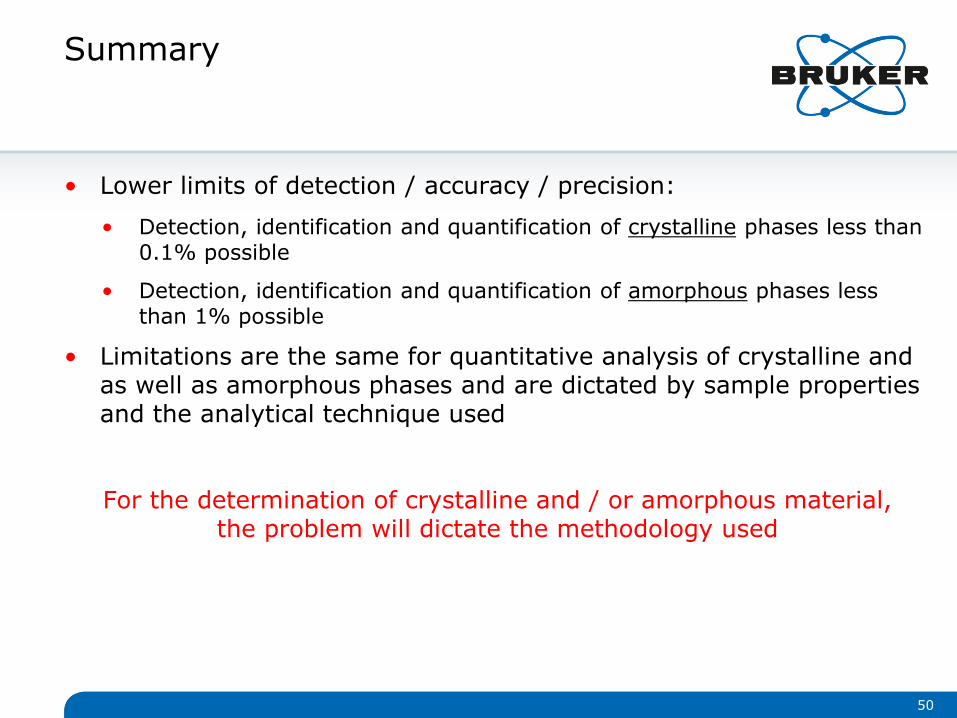
Summary
• Lower limits of detection / accuracy / precision:
• Detection, identification and quantification of crystalline phases less than 0.1% possible
• Detection, identification and quantification of amorphous phases less than 1% possible
• Limitations are the same for quantitative analysis of crystalline and as well as amorphous phases and are dictated by sample properties and the analytical technique used
For the determination of crystalline and / or amorphous material, the problem will dictate the methodology used
50

Summary
• The traditional Rietveld method only delivers relative phase amounts by default; in the presence of amorphous and/or any amount of unidentified crystalline phases, the analyzed crystalline weight fractions may be significantly overestimated
• Most phase abundances reported in literature, obtained via Rietveld analysis, are provided in a manner suggesting absolute values
Where no allowance of amorphous and/or unidentified phases has been made/reported, it is reasonable to assume relative phase abundances instead
51

Summary
• Calibration based methods usually have the potential to achieve the highest accuracy, as most aberrations are included in the calibration function
• Any calibration sample and standard will contain amorphous materials which, if not accounted for, will decrease accuracy
• Any material possesses a non-diffracting surface layer with some degree of disorder / inclusion of surface reaction products and adsorbed species
• Such a layer can easily account for a mass fraction of several percent in a finely divided solid
52
Summary
• Singular samples do not afford the luxury of making a calibration suite
• Intensity contributions of amorphous phases to the diffraction pattern are not always evident, especially at low concentrations
• Indirect methods will usually perform better
• Where intensity contributions of amorphous phases are evident, any method based on modeling amorphous bands provides improved accuracy (direct methods)
• Usually a sample of pure amorphous material, or a sample where the amorphous content is high, is required to establish an accurate model.
53