Embed Size (px)
Citation preview
ASIAN DEVELOPMENT BANK PPA: PAK 19056
PROJECT PERFORMANCE AUDIT REPORT
ON THE
WAPDA TENTH POWER (SECTOR LOAN) PROJECT (Loan 824-PAK)
IN
PAKISTAN
November 1999
CURRENCY EQUIVALENTS
Currency Unit – Pakistan Rupee (Pre/PRs)

2
At Appraisal At Project Completion At Operations Evaluation (September 1986) (August 1996) (August 1999) PRe1.00 = $0.0579 $0.0320 $0.0189 $1.00 = PRs17.26 PRs31.5079 PRs52.80
ABBREVIATIONS DISCO ? distributing company DRP ? distribution rehabilitation program EIRR ? economic internal rate of return FIRR ? financial internal rate of return KESC ? Karachi Electric Supply Corporation LPDP ? least-cost power development plan LRMC ? long-run marginal cost O&M ? operation and maintenance OEM ? Operations Evaluation Mission PCR ? project completion report PPAR ? project performance audit report TA ? technical assistance USAID ? United States Agency for International Development WAPDA ? Water and Power Development Authority
MEASURES GWh (gigawatt-hour) ? 1,000 megawatt-hours km ? kilometer kV (kilovolt) ? 1,000 volts kWh (kilowatt-hour) ? 1,000 watt-hours MVA (megavolt-ampere) ? 1,000 kilovolt-amperes MW (megawatt) ? 1,000 kilowatts MWh (megawatt-hour) ? 1,000 kilowatt-hours V (volt) ? unit of electrical pressure Wh (watt-hour) ? unit of electrical energy
NOTES
(i) The fiscal year (FY) of the Government and WAPDA ends on 30 June. (ii) In this report, “$” refers to US dollars.
Operations Evaluation Office, PE-528
CONTENTS Page
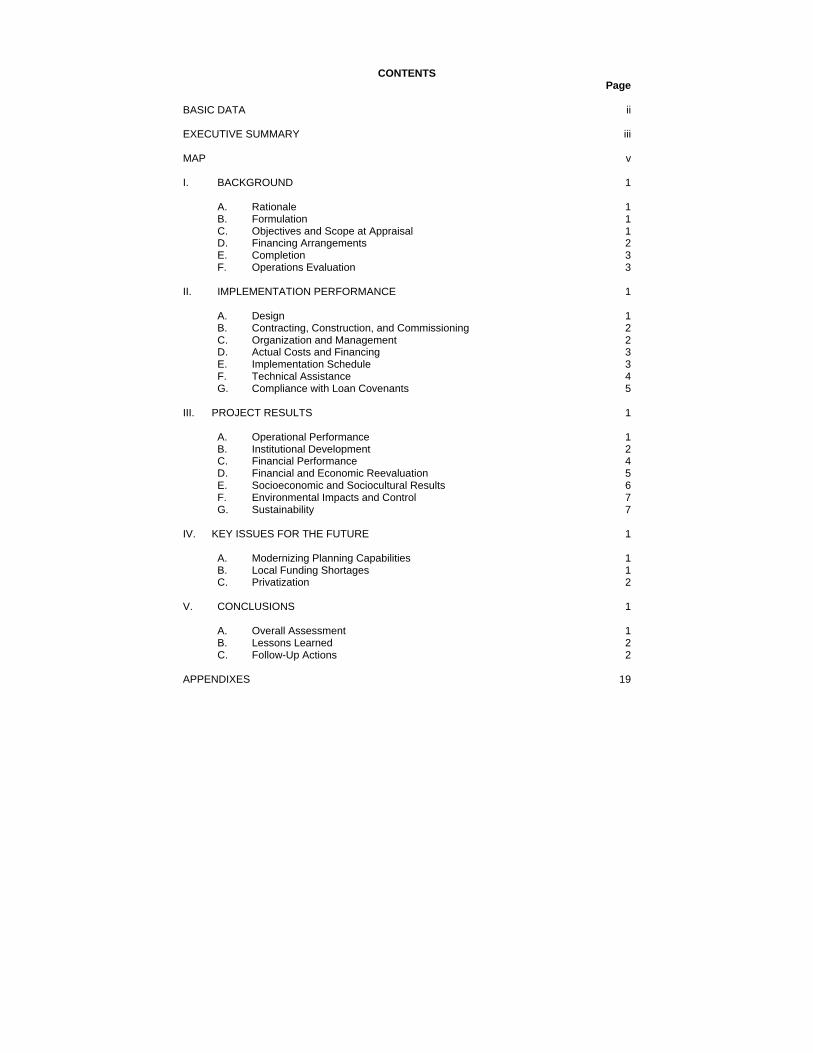
BASIC DATA ii EXECUTIVE SUMMARY iii MAP v I. BACKGROUND 1 A. Rationale 1 B. Formulation 1 C. Objectives and Scope at Appraisal 1 D. Financing Arrangements 2 E. Completion 3 F. Operations Evaluation 3 II. IMPLEMENTATION PERFORMANCE 1 A. Design 1 B. Contracting, Construction, and Commissioning 2 C. Organization and Management 2 D. Actual Costs and Financing 3 E. Implementation Schedule 3 F. Technical Assistance 4 G. Compliance with Loan Covenants 5 III. PROJECT RESULTS 1 A. Operational Performance 1 B. Institutional Development 2 C. Financial Performance 4 D. Financial and Economic Reevaluation 5 E. Socioeconomic and Sociocultural Results 6 F. Environmental Impacts and Control 7 G. Sustainability 7 IV. KEY ISSUES FOR THE FUTURE 1 A. Modernizing Planning Capabilities 1 B. Local Funding Shortages 1 C. Privatization 2 V. CONCLUSIONS 1 A. Overall Assessment 1 B. Lessons Learned 2 C. Follow-Up Actions 2 APPENDIXES 19
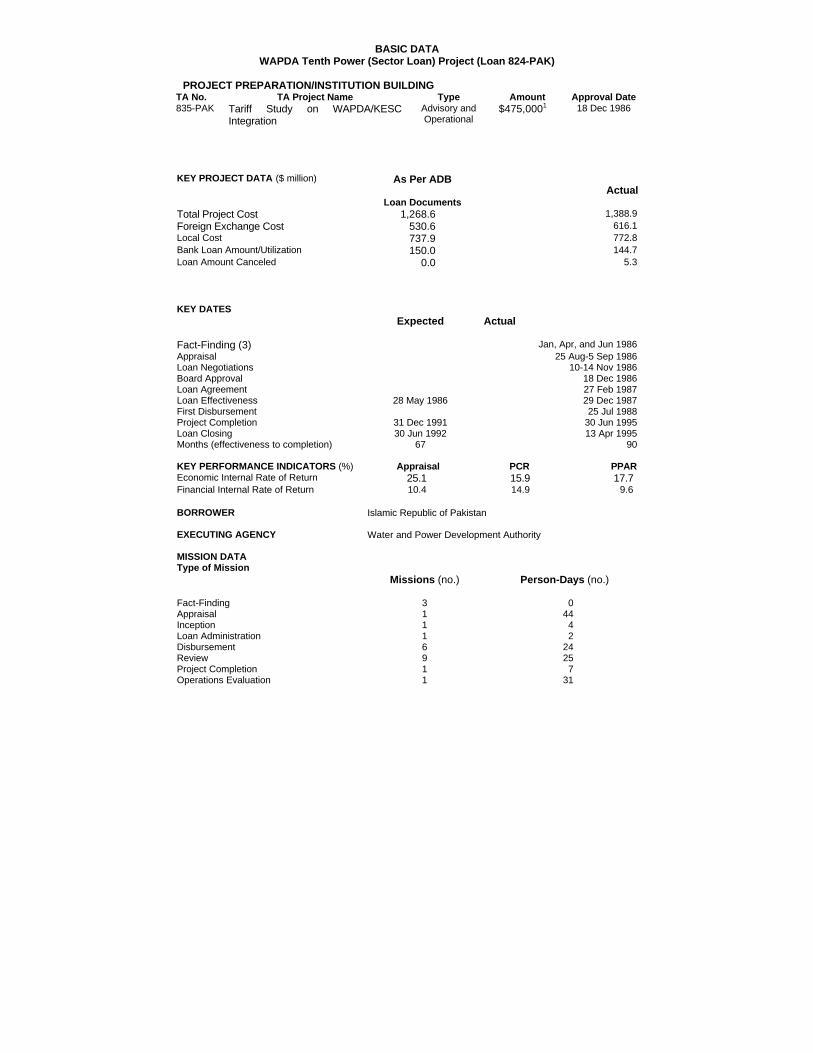
BASIC DATA WAPDA Tenth Power (Sector Loan) Project (Loan 824-PAK)
PROJECT PREPARATION/INSTITUTION BUILDING
TA No. TA Project Name Type Amount Approval Date 835-PAK Tariff Study on WAPDA/KESC
Integration Advisory and Operational
$475,0001 18 Dec 1986
KEY PROJECT DATA ($ million) As Per ADB
Loan Documents
Actual
Total Project Cost 1,268.6 1,388.9 Foreign Exchange Cost 530.6 616.1 Local Cost 737.9 772.8 Bank Loan Amount/Utilization 150.0 144.7 Loan Amount Canceled 0.0 5.3
KEY DATES Expected Actual
Fact-Finding (3) Jan, Apr, and Jun 1986 Appraisal 25 Aug-5 Sep 1986 Loan Negotiations 10-14 Nov 1986 Board Approval 18 Dec 1986 Loan Agreement 27 Feb 1987 Loan Effectiveness 28 May 1986 29 Dec 1987 First Disbursement 25 Jul 1988 Project Completion 31 Dec 1991 30 Jun 1995 Loan Closing 30 Jun 1992 13 Apr 1995 Months (effectiveness to completion) 67 90 KEY PERFORMANCE INDICATORS (%) Appraisal PCR PPAR Economic Internal Rate of Return 25.1 15.9 17.7 Financial Internal Rate of Return 10.4 14.9 9.6 BORROWER Islamic Republic of Pakistan EXECUTING AGENCY Water and Power Development Authority MISSION DATA Type of Mission
Missions (no.) Person-Days (no.)
Fact-Finding 3 0 Appraisal 1 44 Inception 1 4 Loan Administration 1 2 Disbursement 6 24 Review 9 25 Project Completion 1 7 Operations Evaluation 1 31

2
________________________
ADB = Asian Development Bank, PCR = project completion report, PPAR = project performance audit report. 1 Funded by the European Economic Commission.
EXECUTIVE SUMMARY
The overall donor-assisted Project aimed to (i) improve the reliability of power supply and reduce losses in the power distribution system of the Water and Power Development Authority (WAPDA), and (ii) facilitate balanced and orderly growth in WAPDA’s generation and transmission facilities to meet load forecasts through FY1995. The Project was formulated as a two-year time slice of WAPDA’s distribution rehabilitation program and least-cost power development plan for FY1986-FY1993. The project scope for part A was to upgrade and rehabilitate about half of WAPDA’s 2,400 11 kilovolt (kV) feeders and associated low-voltage (0.4 kV) lines where overloading and distribution losses were highest. The project scope for part B was to expand generation capacity and associated transmission and substation requirements for subprojects selected from WAPDA’s least-cost power development plan.
A computerized network analysis program was applied to all of WAPDA’s 2,400 11 kV feeders to identify prospective subprojects under part A. The Asian Development Bank (ADB) funding was envisaged for financing the rehabilitation material costs of 250-300 kilometers of the 11 kV feeders. Prospective subprojects under part B identified for ADB funding included augmenting power generation at the Mangla, Chashma, and Guddu stations by 200 megawatts each. In addition, ADB funding was earmarked to apply to the construction of a 190 kilometers 500 kV transmission line between Ludewala and Daudkhel, and for low-voltage transmission facilities to be identified during project implementation. Training of WAPDA personnel in improved operation and maintenance of distribution systems was to be part of the technical assistance (TA) for part A provided by the United States Agency for International Development. Consulting services under part B were to be engaged as required and for subprojects supported with ADB funding in accordance with the ADB’s Guidelines on the Use of Consultants. Attached to the ADB loan was a TA to study the least-cost option of integrating the reserve capacity requirements of the Karachi Electric Supply Corporation and WAPDA. An appraisal mission involving extensive coordination among cofinanciers was completed in September 1986, and the ADB loan and TA were approved on 18 December 1986. The Project was completed in June 1995 with an overall delay of three years and six months. The delay was attributed to the (i) cumulative effects of slow procedures for appraising rehabilitation subprojects, (ii) shortages of materials due to funding constraints, and (iii) the need for more time to finalize financing arrangements with cofinanciers. The final project cost of $1,389 million was 9 percent more than the appraisal estimate and included an overrun of $85.5 million (16 percent) in foreign exchange costs and $34.9 million (5 percent) in local currency costs. The additional expenditure was required to meet cost inflation and the nonspecific nature of the project scope. Total disbursements were $5.3 million less than the approved ADB loan amount of $150 million. The ADB loan represented 11 percent of the total project cost. Other external financing amounted to 23 percent, and financing by WAPDA and the Government totaled 66 percent. The project rationale of reducing technical losses, improving reliability, and expanding generation and distribution was sound. Without the Project, overall system losses would have been at least 4 percent higher and the acute power shortages experienced in 1994 would have been more severe. Technical improvements at substations, construction of new substations, and improved transmission capacity helped reduce transmission losses over the 132 kV lines and 11 kV lines by about 2 percent and reduced system losses by up to 5 percent over the connected low-voltage transmission lines. Without these improvements, voltage reliability across the low- voltage transmission lines would have remained impaired and caused consumer appliances and electric motors designed for 220 voltage to burn out.

2
Overall investment expenditure on WAPDA’s distribution rehabilitation program and least-
cost development plan during FY1986-FY1993 was 55 percent of that planned. Actual expenditure under the program was largely to expand generation and distribution, which met overall system objectives to double generation capacity but did so at the expense of nonproject transmission and rehabilitation needs. The Project’s objectives to augment WAPDA’s generation and reduce WAPDA’s overall system losses were achieved, although with significant delay and increasing system losses after 1991. Reflecting the reduced overall investment in WAPDA’s least-cost development program, WAPDA’s financial statements reveal slower growth and smaller income returns than those forecast at appraisal. The financial loan covenants pertaining to WAPDA’s total operations, which were in compliance at appraisal, show deterioration with higher than targeted system losses, delayed tariff adjustments, and the need to import electricity at a cost higher than WAPDA’s own supply cost. The time-slice economic internal rate of return (EIRR) of 17.7 percent, compared with the appraisal estimate of 25.1 percent, attests to the Project’s lower effectiveness caused by implementation delays, funding shortages, and lack of ongoing attention to distribution rehabilitation.
Long delays in rehabilitation implementation, which had occurred in the past and which the project design specifically tried to address; and the variable but weakening financial performance of WAPDA after FY1992 detract from the overall performance assessment. Notwithstanding these distractions, which are reflected in the EIRR and financial internal rate of return reestimates, the Project is rated generally successful. This assessment is based on (i) the satisfactory time-slice EIRR, which exceeds ADB’s reference benchmark of 10 percent; (ii) the satisfactory EIRRs of subprojects, which range from 23 percent to more than 50 percent and attest to the viability of subproject selection; and (iii) the supportive time-slice financial internal rate of return of 9.6 percent for WAPDA’s investments. The benefits of the Project are considered sustainable, given the Government’s commitments to the enhanced structural adjustment facility of the International Monetary Fund to restructure WAPDA, financial recovery signals for FY1999, and WAPDA’s announcement in July 1999 of building on recovery achievements, focusing on reducing technical losses, and moving toward privatization.
Key issues for the future are (i) modernizing planning capabilities and reducing the overall appraisal time for selecting future subprojects for distribution rehabilitation, (ii) addressing more rigorously WAPDA and Government capacity to meet local funding requirements, and (iii) accelerating the privatization of WAPDA and ensuring recommendations include policies for redeploying displaced staff and compensating for benefits foregone.
Two significant lessons were learned from the Project: (i) ADB should be more circumspect in its appraisal of project objectives and the reality for achieving them, particularly where targets depend on the scale and availability of local funding; and (ii) a more time-effective appraisal system should be introduced for identifying and approving distribution subproject proposals so that achieving project objectives is not impaired. Less significant lessons apply to strengthening financial management and controls on future project procurement. By way of follow-up, the Government is encouraged to (i) provide WAPDA with stricter financial eligibility criteria for new connections and with support for expediting recovery mechanisms that deal with outstanding customer accounts, errant staff, and contractors; (ii) promote public awareness and support for improving services; and (iii) ensure privatization recommendations include acceptable plans for staff redeployment. WAPDA is encouraged to provide more focused leadership and management to reduce power system losses and install efficiency controls on the design and rehabilitation of the distribution system.

3

I. BACKGROUND
A. Rationale
1. The Project’s rationale reflected (i) the nation’s power development investment requirements, (ii) the need to sustain development expenditures, and (iii) the Asian Development Bank’s (ADB’s) continuing assistance strategy for improving operational efficiencies and mobilizing cofinancing to the energy sector. At appraisal, the ADB determined that the Project would be designed to mobilize funding and address the urgent problems of systems loss, load management, system efficiency, and the need to alleviate the chronic power supply shortage in Pakistan.
B. Formulation
2. The overall donor-assisted Project was formulated to meet the foreign exchange costs of (i) two-year time slice under the Water and Power Development Authority’s (WAPDA’s) distribution rehabilitation program (DRP), and (ii) a least-cost power development plan (LPDP) for expanding and rehabilitating Pakistan’s power system.1 The ADB loan was provided in coordination with officials of the major aid agencies to Pakistan’s energy sector.2 No direct project preparatory technical assistance (TA) was provided. The ADB’s appraisal mission for the Project was completed in September 1986, and the ADB loan and TA were approved on 18 December 1986.3
C. Objectives and Scope at Appraisal
3. The objectives of the overall Project were to (i) improve the reliability of power supply and reduce losses in the distribution system through implementing a DRP (FY1986-FY1993), and (ii) facilitate balanced and orderly growth in WAPDA’s generation and transmission facilities to meet load forecasts through FY1995. The attached TA (footnote 3) was provided to conduct a tariff study of Karachi Electric Supply Corporation (KESC) and WAPDA based on the least-cost option of integrating the reserve capacity requirements of the two power systems (para. 22). The project scope comprised part A, for rehabilitating WAPDA’s distribution system covering a 1 WAPDA’s DRP (FY1986-FY1993) provided for upgrading the distribution system where overloading was highest,
and for a comprehensive reorganization of WAPDA’s distribution wing, more appropriate staffing, intensive training, adoption of better design standards, computer-based mapping and planning, and modern and more cost-effective methods of operation and maintenance. The program also included major improvements in accounting and financial controls, inventory, and construction management, as well as billing and collection procedures. WAPDA’s LPDP (FY1986-FY1993) envisaged doubling the installed generating capacity of about 5,000 megawatts (MW), and expanding and reinforcing transmission facilities.
2 Prior to loan approval, two meetings were held in Islamabad in September 1985, and in Washington, DC in July 1986. The aid agencies in attendance included the Canadian International Development Agency, Kreditanstalt für Wiederaufbau, Overseas Development Administration, and the World Bank. The aid agencies coordination meetings endorsed a core program of energy investments.
3 Loan 824-PAK: WAPDA Tenth Power (Sector Loan) Project, for $150 million, approved on 18 December 1986; TA 835-PAK: Tariff Study on WAPDA/KESC Integration, for $475,000, approved on 18 December 1986.
2
two-year time slice within FY1986-FY1993,4 and part B, for expanding WAPDA’s generation and transmission facilities covering several subprojects.5 4. The distribution rehabilitation component (part A) was expected to improve reliability of supply, and enhance operational capability with emphasis on reducing system losses. The generation and transmission component (part B) was expected to (i) augment power supplies and increase transmission capacity to meet forecast future loads, and (ii) improve operational efficiency and system reliability. Importantly, the ADB loan was expected to play a catalytic role in mobilizing bilateral and commercial funds needed for the Project. The attached TA (footnote 3) was expected to evaluate the overall savings in reserve capacity requirements arising from integration and to produce a more efficient structure of tariffs between KESC and WAPDA. Further details of the project scope, locations of the lines and substations, and expected outcomes are provided in Appendixes 1 and 2.
D. Financing Arrangements
5. The total project cost at appraisal was $1,269 million, with a foreign exchange cost of $530 million. The ADB loan of $150 million was to finance $55 million (94 percent) of the foreign exchange cost of part A, and $95 million (20 percent) of that of part B. Of the $380 million balance of the foreign exchange cost, $242 million was expected to be financed from export and supplier credits, $100 million from the World Bank, $35 million from other bilateral credits, and $3 million from the United States Agency for International Development (USAID). The local cost of $739 million equivalent was to be funded by the Government and from internally generated sources of WAPDA. The ADB loan was drawn from ordinary capital resources with a repayment period of 25 years and grace period of 5 years, and was re-lent as a subsidiary loan from the Borrower to WAPDA. The subsidiary loan to WAPDA provided for interest at 11 percent per annum (inclusive of a foreign exchange risk fee). The multilateral and bilateral credits were to be finalized as cofinancing arrangements satisfactory to the ADB.6 WAPDA was the Executing Agency for the project loan and joint executing agency (with KESC) for the TA study. 6. Prior to the ADB’s loan for the Project, Pakistan’s energy sector had received 22 ADB loans totaling $861.9 million and five TA grants totaling $0.9 million.7 The ADB loan was the first sector loan to the energy sector in Pakistan. Subsequent to approval of the ADB loan, the energy sector received from the ADB an additional six sector loans totaling $765 million, one project loan of $300 million, and eight TA grants totaling $2.4 million. The ADB’s TA grants include $0.475 million funded by the European Economic Commission and $0.3 million funded by the Japan Special Fund.
4 The ADB loan was envisaged to be used to finance (i) the rehabilitation material costs of 250-300 overloaded
11 kilovolt (kV) feeders and associated low-voltage lines, (ii) the cost of capacitors installed on the 11 kV and low-voltage lines, (iii) the cost of time switches installed on feeders to tubewell pump sets, and (iv) the cost of pilfer-proof meter boxes.
5 The ADB loan was envisaged as likely to finance subprojects involving (i) additional generation capacity of 200 MW at Mangla, 200 MW at Chashma, and 300 MW at Guddu hydropower stations; (ii) construction of a 500-kV transmission line between Ludewala and Daudkhel; and (iii) expansion and rehabilitation of grid stations and transmission lines selected from WAPDA’s LPDP.
6 The opportunity lending rate in local currency was 15 percent and in dollars, 6.5 percent (excluding foreign exchange cover).
7 Six of these loans were for projects financed with funding from both the ADB’s Asian Development Fund and ordinary capital resources. For administrative purposes, these are structured as two separate loans.
3
E. Completion
7. A project completion report (PCR) prepared in October 1996 by the ADB’s Energy Division West found the Project was implemented substantially as conceived though with considerable delay (para. 21) and with stated project costs 24 percent higher than envisaged.8 The delays were attributed to the additional time needed to finalize subproject proposals, award contracts, and finish cofinancing arrangements. The PCR concluded that the Project was successful because it (i) augmented the commercial energy supply and improved operational efficiency, (ii) helped the country’s efforts at import substitution, (iii) assisted the country’s export promotion efforts by improving power supply reliability, and (iv) facilitated balanced regional development of electricity. Using a time-slice approach, the financial internal rate of return (FIRR) reestimate was 14.9 and the economic internal rate of return (EIRR) reestimate was 15.9 percent. These compare with the appraisal estimates of an FIRR of 10.4 and an EIRR of 25.1 percent.9 However, the PCR noted that WAPDA was unable to fully comply with the ADB’s financial covenants, and while system losses initially fell from 26.4 percent, they increased from 22.8 percent in FY1991 to 24.4 percent in FY1995. Because the needs to comply with financial covenants and to decrease system losses were being addressed through the ADB’s Twelfth Power Sector Loan Project,10 no specific follow-up actions were recommended. Attention was drawn to the need to properly maintain distribution and transmission facilities under the Project. Continuation of the sector loan approach was recommended.
F. Operations Evaluation
8. This project performance audit report (PPAR) evaluates the findings of the PCR and reassesses the Project’s operating performance, particularly in reducing or avoiding distribution losses (part A), meeting load expansion requirements (part B), assessing the effectiveness of TA and identifying the progress and constraints to WAPDA’s privatization, and evaluating related policy issues underlying project objectives (para. 3). The PPAR is based on (i) a review of the ADB’s records relating to the Project, (ii) discussions with ADB staff and meetings with KESC, WAPDA, and other agencies of the Borrower during the Operations Evaluation Mission (OEM) that visited the Project 19 July-7 August 1999, (iii) completion of a questionnaire sent to KESC and WAPDA for discussion during the OEM, and (iv) site visits to four sample feeder 11 kV and low-voltage (0.4 kV) subprojects, the Guddu hydropower station, and two substations involved with transmission improvements. Copies of the draft PPAR were provided to the
8 Compared with evaluation for this project performance audit report of 9 percent. 9 The calculation of the PCR estimate is discussed in paras. 43 and 44. 10 Loan 1143/1144-PAK(SF): WAPDA Twelfth Power Sector, for $250 million, approved on 13 December 1991.

4
Government, KESC, WAPDA, and ADB staff concerned for review and comment. Comments received were considered in finalizing the PPAR.
II. IMPLEMENTATION PERFORMANCE
A. Design
9. The Project’s general scope did not change (para. 3). However, after detailed preparation of part A, the required rehabilitation materials and equipment per subproject were less than envisaged, allowing more 11 kV feeder subprojects to be rehabilitated. Altogether, 1,276 11 kV feeder subprojects (out of a total of 2,400 feeders) and 14,000 associated low-voltage lines were identified under the Project for rehabilitation (part A). Of these, the ADB helped to fund 225 11 kV feeders and about 1,850 low-voltage lines. Under part B, from the various subprojects identified for generation and transmission expansion with funding from the ADB (footnote 5), only generation expansion at Guddu was included.11 The power output of the two gas turbines proposed for Guddu was increased from 2 x 100 megawatts (MW) to 2 x 136 MW, and that for the steam turbine from 100 MW to 143 MW.12 The subprojects for expansion (and the reinforcement of transmission lines and substations) comprised (i) constructing 500 kilometers (km) of 132 kV lines, 111 km of 66 kV lines, and 110 km of 33 kV lines; and (ii) constructing 30 new substations and extending and reinforcing 32 substations. These subprojects were implemented largely as envisaged. 10. The project design required subprojects proposed for ADB funding to be identified, and for materials procured under project implementation to be separately managed and monitored.13 Equipment and materials were procured in bulk, stored at central depots in Lahore, and distributed to the provincial administration centers as subproject proposals were approved. These requirements proved useful but imposed difficulties and delays in trying to satisfy the ADB’s requirements, particularly for distribution rehabilitation, where material and equipment items were common to all rehabilitation subprojects and could not be practically separated according to funding source. 11. The project design endeavored to reduce implementation constraints by procuring in advance 75 percent of the equipment and materials. The Project’s cumbersome subproject appraisal and selection procedures negated this design objective requiring materials to be stored for more than two years. With the urgent need for rehabilitation materials and equipment elsewhere, an approval practice developed in which project materials in storage were diverted to nonsubprojects with the intention of replacement. This practice led to delays and an imbalance of materials available to the Project. In addition, materials released for subprojects
11 The Punjab Government in October 1988 expressed concerns about the sufficiency of water to meet both irrigation
and power generation requirements, causing postponement of the planned generation expansion at Chashma. Expansion was postponed for funding approved under Loan 1143-PAK/1144-PAK(SF) (footnote 10), and the project scope varied to provide consulting services for preparatory works on the Chashma station.
12 The capacity of 2 x 100 MW gas turbine units was increased to 2 x 136 MW units because of the advantages of procuring standard designs. As two 136 MW units will support a steam turbine of 143 MW, the overall nameplate capacity for total generation was increased to 415 MW. ADB funding proposed for augmenting generation at Mangla and Chashma was used to meet the foreign exchange cost of the attached 143 MW steam turbine.
13 All subprojects identified were part of WAPDA’s broader development program (footnote 1) and cofinanced under the Project. While it was intended that the subprojects for ADB financing would include separately identifiable transmission lines and substations, the approach was to purchase equipment and materials in bulk for the program and then allocate requirements to lines and substations as their designs were finalized.
2
and used in excess of planning requirements contributed to insufficient materials being available. 12. Weaknesses in the method used to select distribution rehabilitation subprojects are discussed in para. 53. Significant weaknesses in the technical designs of rehabilitated subprojects impaired the effort to reduce system losses.14 As a consequence, weaknesses in training and subject knowledge were revealed. Details are provided in Appendix 3.
B. Contracting, Construction, and Commissioning
13. Project implementation was satisfactory with respect to selection of consultants, awarding of contracts, and management by WAPDA. The time needed to appraise subprojects and to put in place cofinancing arrangements was underestimated and delayed overall completion (para. 53). 14. USAID-financed consultants provided consulting services to the project implementation office and prepared bid documents for initial procurement covering 75 percent of the equipment and materials envisaged at appraisal. Bid documents were prepared according to the ADB’s Guidelines for Procurement. The consultants and the contractors responsible for supplying the materials performed satisfactorily. The procurement balance was determined after detailed preparation of the subprojects selected. 15. Subproject-specific consultants for the Guddu and Chashma components under part B were engaged by WAPDA in compliance with the Loan Agreement and with qualifications and terms of reference acceptable to ADB. WAPDA reported that both sets of consultants fulfilled their tasks satisfactorily. Because the Chashma subproject was postponed (footnote 11), the consultant’s tasks were reduced. 16. WAPDA reported the international and domestic contractors and suppliers for the Project performed satisfactorily. Equipment and materials supplied under the Project complied with WAPDA’s specifications, and had no significant defects. All equipment and materials inspected at the subproject sites visited by the OEM were functioning satisfactorily.
C. Organization and Management
17. The organization and management were consistent with arrangements envisaged at appraisal and proved satisfactory. WAPDA was appointed the Executing Agency for the Project, and enough qualified staff were appointed to facilitate project implementation. For part A, a planning and engineering directorate was created within each of the eight electricity area boards15 to enhance the analysis capability, expedite development proposals, and oversee work progress in the field. Under part B, the general manager (coordination) of WAPDA was responsible for overall coordination of procurement and cofinancing arrangements. Three project directors were appointed with responsibilities for subprojects at the Guddu hydropower
14 The noninclusion of distribution capacitors and improperly located transformers resulted in a higher level of losses
than need be the case with an optimal design. 15 Covering Faisalabad, Gujranwala, Hyderabad, Islamabad, Lahore, Multan, Peshawar, and Quetta.
3
station, construction and reinforcement of transmission lines and substations, and consulting services for the Chashma hydropower plant. 18. ADB provided adequate monitoring and supervision during project implementation, with nine review missions, two disbursement missions, one inception mission, and one loan administration mission. Coordination meetings were held during the review missions with WAPDA and other funding agencies to solve problems and minimize delays. WAPDA considered the number of mission reviews and their purposes to be appropriate and helpful.
D. Actual Costs and Financing
19. The actual project cost of $1,389 million exceeded the appraisal estimate of $1,269 million by 9 percent. The foreign exchange cost of $616.1 million exceeded the appraisal estimate by 16 percent and the local currency cost of $772.8 million by 5 percent. Apart from cost increases caused by variations to the scope (para. 9), the overrun was primarily due to inflation associated with the overall delay in implementation. The nonspecific nature of the details for the project scope, accounted for some of the variation in appraisal estimates.16 These details were finalized during implementation. Under part A, significant foreign exchange savings were realized for equipment procurement because of reduced volume. However, unit prices of equipment for parts A and B were generally higher than at appraisal. 20. Total disbursements under the ADB loan amounted to $144.7 million equivalent. An undisbursed balance of $5.3 million equivalent was canceled. The ADB financed (i) the entire part A foreign exchange costs of $52.7 million, which was $2.3 million less than projected at appraisal; and (ii) 16 percent ($92 million) of the part B foreign exchange costs. The balance of the part B foreign expenditure was financed by the World Bank, bilateral agencies, and suppliers to the major contracts. WAPDA and the Government financed the local currency expenditures of $772.8 million equivalent for the Project.17 The appraisal costs are compared with actual costs in Appendix 4.
E. Implementation Schedule
21. The Project was completed in June 1995 with an overall delay of 3.5 years. The planned schedule did not change as a result of detailed preparation. However, because of delays in awarding contracts, the closing date on the ADB’s loan had to be extended twice, 34 months beyond the original closing date, to 13 April 1995.18 Implementation was slowed by
16 Cost estimates at appraisal for procurement of materials for distribution and rehabilitation were defined on the basis
of line length, equipment requirements, and unit costs. Detailed costings were to be made after prioritization and loan approval.
17 Actual costs are as affirmed by WAPDA for the PCR. WAPDA was unable to reaffirm actual expenditure for the OEM.
18 Under implementation arrangements for part B, subprojects for financing were to be selected from WAPDA’s LPDP (FY1986-FY1993) and submitted with the appraisal to ADB for approval in 1987. Cofinancing arrangements were expected to be completed by the end of 1988, and supply, construction, and commissioning of works were to be carried out during 1988-1991, recognizing that implementation of some subprojects might extend into 1993. Under the project implementation arrangements for part A, procurement was expected to be completed in 1988 and rehabilitation work to take an additional two years.
4
(i) procedures for appraising all subprojects before prioritizing their selection,19 (ii) equipment and material shortages, and (iii) the additional time needed to finalize financing arrangements with cofinanciers. The actual implementation schedule is compared with the appraisal schedule in Appendix 5.
F. Technical Assistance
22. WAPDA’s LPDP (para. 2) was formulated with the help of a TA consulting team financed by USAID. The LPDP was prepared on a least-cost basis and designed to improve power system reliability and operational efficiency, reduce system losses, and alleviate generation constraints. The Project was structured from the LPDP which covered FY1986-FY1993 and the two-year period FY1987-FY1988. The ADB was previously involved with WAPDA in 12 projects, providing the ADB with considerable insight into WAPDA’s operations. Interaction with other aid agencies added to the ADB’s understanding, so no ADB project preparatory TA was provided. The OEM reviewed WAPDA’s power development plans for FY1986-FY1993 and found the technical solutions, system controls, and equipment specified appropriate for projected load demands. 23. The attached TA (footnote 3) was made available to conduct a tariff study for the integrated operations of KESC and WAPDA.20 The TA was administered by ADB in a coordinating role with KESC and WAPDA, each of which appointed a project director and support staff for the study and made office and transport facilities available. The consultants reviewed the load forecasts of KESC and WAPDA as an integrated operation, considering the necessary technical improvements and planned improvements for each system over the next 10 years. In light of these load forecasts, the study was required to provide recommendations for an electricity tariff structure based on (i) the long-run marginal cost (LRMC) for generation, transmission, and distribution; and (ii) the LRMC adjusted to meet financial loan covenants as agreed with the ADB and the World Bank. Recommendations were also required for a formula to make future tariff adjustments. 24. The outputs of the study reflect a merger of the ADB’s study objectives and a parallel study approved by the World Bank.21 As a consequence, the study recommendations cover tariff settings for end consumers, and tariffs for selling power between KESC and WAPDA. The consultants found (i) expansion of hydroelectric generation was the most attractive option, thereby confirming the Government’s power development strategy; (ii) planned capital investment savings of $100 million (1990/91 prices) could be obtained; and (iii) discounted savings of $1 billion could be derived from integrating the two power systems.22 For tariff structures, the consultants recommended adopting single tariffs for customers supplied at 132 kV, 11 kV, and 0.4 kV based on LRMC considerations, but with seasonal and time of day
19 The project design expectation of surveying all of Pakistan’s 2,400 11 kV feeders and as a prelude to computer
mapping and network analysis of 300 for evaluating and submitting for ADB approval was overly optimistic and the prime reason for the implementation delay at the beginning of rehabilitation (para. 53).
20 Integration was defined in terms of integrating the two power systems so that power could be exchanged on the most economical load dispatch and without merging the two systems and/or changing their legal ownership structures.
21 It was agreed between the ADB and the World Bank in 1987 to merge the objectives of the two studies, thereby avoiding duplication, and that the World Bank would finance additional costs of the study not covered by the ADB.
22 This was equal to about 6 percent of the present value of system costs, and based on the higher use of existing and new hydropower schemes and greater replacement of oil by coal.
5
variations. For residential low-voltage commercial categories, it was recommended that the existing six slab system of pricing (based on consumption) be reduced in the medium term to three slabs. To meet the financial objectives for KESC and WAPDA as agreed with the ADB and the World Bank, tariffs for domestic use and agriculture would need to increase in real terms by 10 percent per annum for FY1992-FY1995. The existing six slab system of tariff pricing was reduced to one and two slabs. Actual tariffs increased by 3 percent in real terms (para. 39). Changing circumstances and the elimination of load shedding rendered the study’s recommendations for integrating the reserve capacity of the two power systems somewhat hypothetical.23 25. TA implementation was satisfactory. The TA recommendations for restructuring the consumer tariff system were adopted in new tariff schedules for both KESC and WAPDA. The LRMC estimates at generation, transmission and distribution, and their basis for calculation, were subsequently used in planning proposals for the commercialization of KESC and WAPDA’s power systems. Taking into account the satisfactory implementation, usefulness and outcomes of the study recommendations, the TA is assessed generally successful.
G. Compliance with Loan Covenants
26. The Borrower and WAPDA generally complied with the ADB’s loan covenants. However, the Borrower was unable to meet the system loss targets and financial covenants requiring WAPDA to (i) reduce its overall system loss to a level not exceeding 23 percent by June 1988, (ii) adjust tariffs to enable sufficient cash generation to finance not less than 40 percent of WAPDA’s capital investment average over three years, (iii) maintain a debt service ratio of not less than 1.5, and (iv) keep accounts receivables of within three months. Improvements were achieved in reducing system losses, although not to the level targeted by June 1988, and after 1991 a deteriorating trend occurred. Partial compliance was achieved in meeting financial covenants but not sustainably (paras. 37 and 38).
23 In 1986, the Government directed that there should be no more augmentation of generation capacity by KESC and
that future capacity requirements should be supplied from the private sector. The study, although planned for implementation during 1987, was not completed until 1990. By then, KESC had no significant surplus to offer WAPDA, and both power systems were in need of additional generation capacity.

III. PROJECT RESULTS
A. Operational Performance
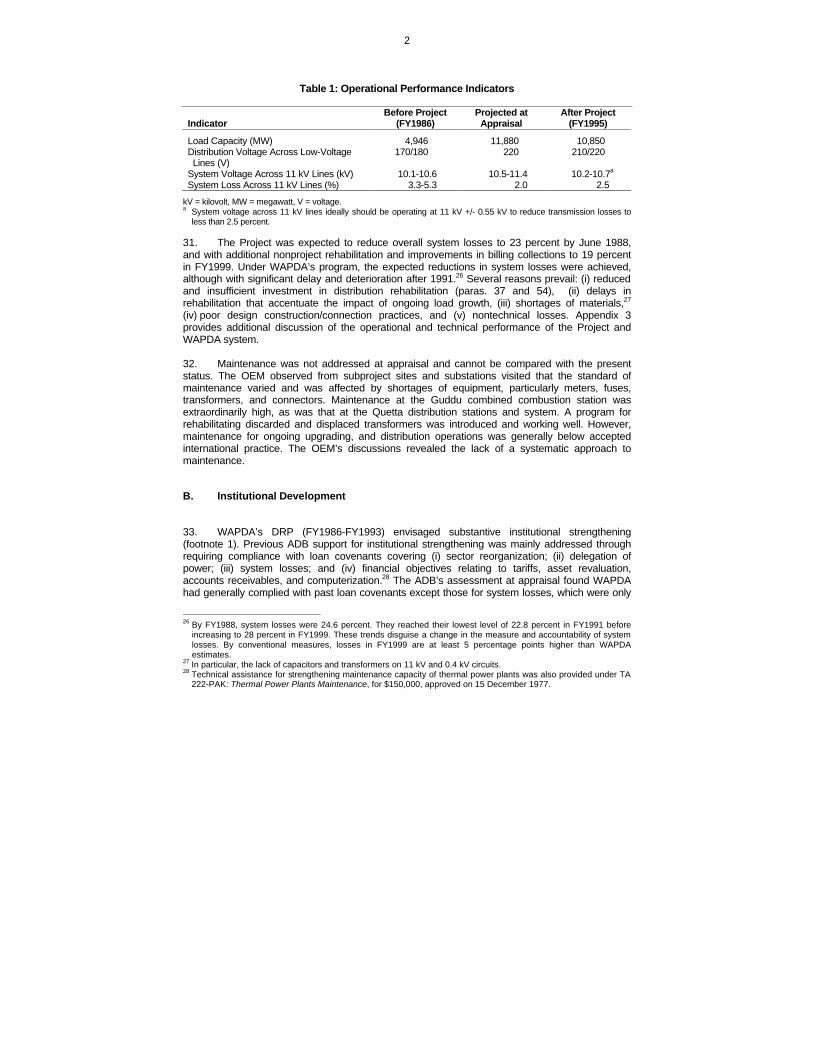
27. Operational performance is measured in terms of the Project’s achievements relative to expectations at appraisal to (i) meet the demand for power, (ii) augment generation capacity, (iii) extend transmission to reinforce overloaded subtransmission systems, (iv) reduce system losses, and (v) improve voltage levels and system reliability. The adequacy of maintenance is also reviewed. Performance indicators relating to the growth parameters of WAPDA and consumers are discussed in paras. 47 and 48 and summarized in Appendix 6. 28. WAPDA’s power energy sales were projected at appraisal to increase to 38,770 gigawatt-hours (GWh) by 1995 and its installed generation capacity to 11,880 MW. The actual installed capacity was 10,850 MW, 91 percent of WAPDA’s program target, and sufficient to meet actual sales of 36,060 GWh. The ADB’s loan augmented WAPDA’s generation capacity by 415 MW and reduced the need for load shedding. Maximum load shedding as a ratio of energy sales was reduced from 43 percent in FY1986 to 19 percent in FY1995. 29. Reinforcing the transmission system from 33 kV and 66 kV to 132 kV helped to reduce system losses across the 11 kV and 0.4 kV lines.24 System losses across the rehabilitated 11 kV distribution feeders were typically reduced by 2-3 percentage points, while system losses across the rehabilitated 0.4 kV lines were reduced by 5 percentage points (Table 1). 30. For the distribution rehabilitation subprojects visited by the OEM, voltage levels had improved markedly. Typically, voltage at residential and commercial connections was increased from 170-180 volts (V) to the designed level of 210-220 V.25 Reliability in terms of reduced outages and trippings occurred in line with improvements in load shedding.
24 New lines of 11 kV and 0.4 kV were constructed for new areas. 25 Without the improvement in voltage, appliances and machinery do not run at their design specification and burn out
with continued use.
2
Table 1: Operational Performance Indicators
Indicator
Before Project (FY1986)
Projected at Appraisal
After Project (FY1995)
Load Capacity (MW) 4,946 11,880 10,850 Distribution Voltage Across Low-Voltage Lines (V)
170/180 220 210/220
System Voltage Across 11 kV Lines (kV) 10.1-10.6 10.5-11.4 10.2-10.7a System Loss Across 11 kV Lines (%) 3.3-5.3 2.0 2.5
kV = kilovolt, MW = megawatt, V = voltage. a System voltage across 11 kV lines ideally should be operating at 11 kV +/- 0.55 kV to reduce transmission losses to
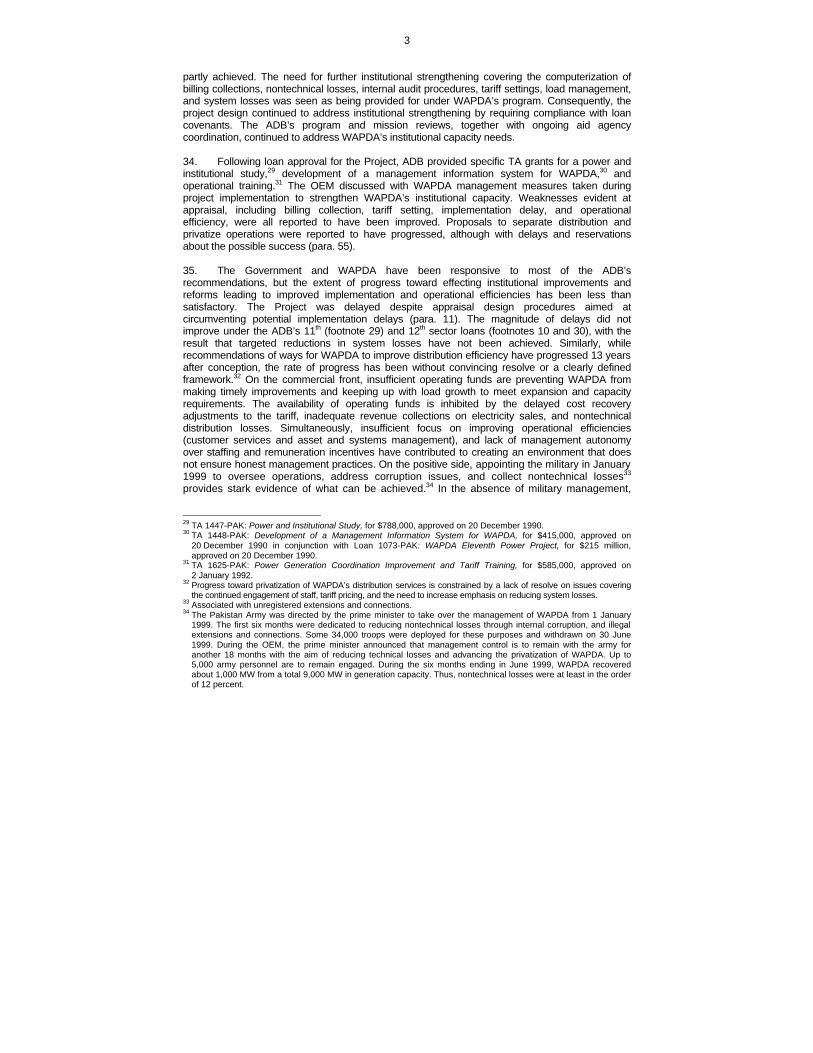
less than 2.5 percent. 31. The Project was expected to reduce overall system losses to 23 percent by June 1988, and with additional nonproject rehabilitation and improvements in billing collections to 19 percent in FY1999. Under WAPDA’s program, the expected reductions in system losses were achieved, although with significant delay and deterioration after 1991.26 Several reasons prevail: (i) reduced and insufficient investment in distribution rehabilitation (paras. 37 and 54), (ii) delays in rehabilitation that accentuate the impact of ongoing load growth, (iii) shortages of materials,27 (iv) poor design construction/connection practices, and (v) nontechnical losses. Appendix 3 provides additional discussion of the operational and technical performance of the Project and WAPDA system. 32. Maintenance was not addressed at appraisal and cannot be compared with the present status. The OEM observed from subproject sites and substations visited that the standard of maintenance varied and was affected by shortages of equipment, particularly meters, fuses, transformers, and connectors. Maintenance at the Guddu combined combustion station was extraordinarily high, as was that at the Quetta distribution stations and system. A program for rehabilitating discarded and displaced transformers was introduced and working well. However, maintenance for ongoing upgrading, and distribution operations was generally below accepted international practice. The OEM’s discussions revealed the lack of a systematic approach to maintenance.
B. Institutional Development
33. WAPDA’s DRP (FY1986-FY1993) envisaged substantive institutional strengthening (footnote 1). Previous ADB support for institutional strengthening was mainly addressed through requiring compliance with loan covenants covering (i) sector reorganization; (ii) delegation of power; (iii) system losses; and (iv) financial objectives relating to tariffs, asset revaluation, accounts receivables, and computerization.28 The ADB’s assessment at appraisal found WAPDA had generally complied with past loan covenants except those for system losses, which were only
26 By FY1988, system losses were 24.6 percent. They reached their lowest level of 22.8 percent in FY1991 before
increasing to 28 percent in FY1999. These trends disguise a change in the measure and accountability of system losses. By conventional measures, losses in FY1999 are at least 5 percentage points higher than WAPDA estimates.
27 In particular, the lack of capacitors and transformers on 11 kV and 0.4 kV circuits. 28 Technical assistance for strengthening maintenance capacity of thermal power plants was also provided under TA
222-PAK: Thermal Power Plants Maintenance, for $150,000, approved on 15 December 1977.
3
partly achieved. The need for further institutional strengthening covering the computerization of billing collections, nontechnical losses, internal audit procedures, tariff settings, load management, and system losses was seen as being provided for under WAPDA’s program. Consequently, the project design continued to address institutional strengthening by requiring compliance with loan covenants. The ADB’s program and mission reviews, together with ongoing aid agency coordination, continued to address WAPDA’s institutional capacity needs. 34. Following loan approval for the Project, ADB provided specific TA grants for a power and institutional study,29 development of a management information system for WAPDA,30 and operational training.31 The OEM discussed with WAPDA management measures taken during project implementation to strengthen WAPDA’s institutional capacity. Weaknesses evident at appraisal, including billing collection, tariff setting, implementation delay, and operational efficiency, were all reported to have been improved. Proposals to separate distribution and privatize operations were reported to have progressed, although with delays and reservations about the possible success (para. 55). 35. The Government and WAPDA have been responsive to most of the ADB’s recommendations, but the extent of progress toward effecting institutional improvements and reforms leading to improved implementation and operational efficiencies has been less than satisfactory. The Project was delayed despite appraisal design procedures aimed at circumventing potential implementation delays (para. 11). The magnitude of delays did not improve under the ADB’s 11th (footnote 29) and 12th sector loans (footnotes 10 and 30), with the result that targeted reductions in system losses have not been achieved. Similarly, while recommendations of ways for WAPDA to improve distribution efficiency have progressed 13 years after conception, the rate of progress has been without convincing resolve or a clearly defined framework.32 On the commercial front, insufficient operating funds are preventing WAPDA from making timely improvements and keeping up with load growth to meet expansion and capacity requirements. The availability of operating funds is inhibited by the delayed cost recovery adjustments to the tariff, inadequate revenue collections on electricity sales, and nontechnical distribution losses. Simultaneously, insufficient focus on improving operational efficiencies (customer services and asset and systems management), and lack of management autonomy over staffing and remuneration incentives have contributed to creating an environment that does not ensure honest management practices. On the positive side, appointing the military in January 1999 to oversee operations, address corruption issues, and collect nontechnical losses33 provides stark evidence of what can be achieved.34 In the absence of military management,
29 TA 1447-PAK: Power and Institutional Study, for $788,000, approved on 20 December 1990. 30 TA 1448-PAK: Development of a Management Information System for WAPDA, for $415,000, approved on
20 December 1990 in conjunction with Loan 1073-PAK: WAPDA Eleventh Power Project, for $215 million, approved on 20 December 1990.
31 TA 1625-PAK: Power Generation Coordination Improvement and Tariff Training, for $585,000, approved on 2 January 1992.
32 Progress toward privatization of WAPDA’s distribution services is constrained by a lack of resolve on issues covering the continued engagement of staff, tariff pricing, and the need to increase emphasis on reducing system losses.
33 Associated with unregistered extensions and connections. 34 The Pakistan Army was directed by the prime minister to take over the management of WAPDA from 1 January
1999. The first six months were dedicated to reducing nontechnical losses through internal corruption, and illegal extensions and connections. Some 34,000 troops were deployed for these purposes and withdrawn on 30 June 1999. During the OEM, the prime minister announced that management control is to remain with the army for another 18 months with the aim of reducing technical losses and advancing the privatization of WAPDA. Up to 5,000 army personnel are to remain engaged. During the six months ending in June 1999, WAPDA recovered about 1,000 MW from a total 9,000 MW in generation capacity. Thus, nontechnical losses were at least in the order of 12 percent.

4
more focused management commitment and enforcement of powers are needed to eliminate corruption and ensure customers comply with terms of power and distribution supply.
C. Financial Performance
36. At appraisal, WAPDA was considered a financially sound utility. During FY1981-FY1986, (except for FY1985), WAPDA easily attained the ADB’s covenanted self-financing ratio of 40 percent and debt service ratio of 1.5.35 Net profit, before depreciation and interest charges, increased from PRs2.56 billion to PRs3.95 billion, equivalent to an average 9 percent per annum. Helping maintain operating income at acceptable performance levels, accounts receivables were less than 3 months for every year, system losses were reduced from 31.3 percent to 26.4 percent, and WAPDA’s average annual tariff was increased in excess of inflation.36 37. WAPDA’s investment program for FY1986-FY1993 projected a total investment of PRs218.1 billion. A decline of 3.4 percentage points in system losses was expected by FY1988. Associated with the projected improvement in system losses, WAPDA forecast that (i) average revenues would increase at 12 percent a year in nominal terms, (ii) operating profit before depreciation and interest would increase by 17.9 percent per annum, (iii) the debt service ratio would range from 2.2-3.3, and (iii) the rate of return on historical assets would increase from 15 percent to 26 percent. Actual total investment expenditure was PRs120.7 billion or 55 percent of that planned.37 Actual average revenues increased at 7.8 percent per year, operating profit before depreciation and interest increased by 17.1 percent per annum, and WAPDA’s debt service ratio decreased from 1.8 to 1.2. Because WAPDA’s assets are revalued in current terms, the OEM could not monitor the rate of return on historical assets. 38. Actual earnings38 increased by a strong 24 percent per annum for six years to PRs8.06 billion in FY1992, fell to PRs5.42 billion in FY1993, and climbed to PRs16.96 billion in FY1996 followed by two years of losses and a recovery to a record PRs18.35 billion in FY1999.39 Together with WAPDA’s variable earnings performance, WAPDA’s equity to total assets ratio fluctuated around 42 percent, and the current asset ratio decreased from 3.0 to 1.3 in FY1993 and further declined to 0.9 in FY1997. WAPDA’s covenanted self-financing ratio of 40 percent fell to a low 19 percent in FY1994. The debt service ratio fell from 1.15 in FY1994 to 0.9 in FY1997. WAPDA’s less than projected financial performance is attributed to (i) irregular and inadequate adjustment of electricity tariffs (para. 39), (ii) reduced investment and attention to improving system efficiencies (para. 31), and (iii) growing nontechnical losses (footnote 33). Appendix 6 summarizes WAPDA’s financial performance with other indicators through FY1999.
35 The self-financing ratio was 53.7 percent in FY1986. 36 During FY1975-FY1985, the average tariff revenues increased by nearly 13 percent per annum compared with the
consumer price index of 8.3 percent per annum. 37 Foreign development expenditures were PRs55.7 billion and equivalent to 73 percent of those planned. 38 Net profit after depreciation and financial charges and before extraordinary profit/loss items. 39 The unaudited net profit recovery in FY1999 before extraordinary profit/loss items is higher than in any previous
year, despite having to meet higher costs of generation from independent power producers. WAPDA’s financial losses during FY1997 and FY1998 are attributable to (i) loan servicing costs associated with operating at too low an equity-assets ratio; (ii) nonrevenue sales arising from system losses, particularly nontechnical losses; (iii) increased cost of importing generation from independent power producers; and (iv) underpriced tariffs. The unaudited improvement in net operating income for FY1999 reflects an expansion in imported energy at the expense of thermal generation, a significant increase in additional surcharge revenues, and reduced capacity payments on imported generation.
5
1. Tariff Adjustments
39. Since 1986, WAPDA has adjusted tariffs 20 times, resulting in an average yearly increase of 12 percent between FY1986 and FY1999 compared with an average inflation rate of 9 percent per annum.40 Reflecting these adjustments, average revenues per kilowatt-hour (kWh) increased by 4.2 times from PRs74.4/kWh to PRs311.1/kWh. Average unit costs of sales increased by 6 percent per annum. Thus, while electricity tariffs increased in real terms, and their impact was supported by improved cost efficiencies, the increase was insufficient to meet the financial performance covenants preagreed with the ADB and the World Bank (para. 26), and in consequence, meeting in a time-effective manner the full financial costs of WAPDA’s operating, rehabilitation, and expansion programs. 40. The issue of determining an appropriate tariff structure for WAPDA is complicated by the size of system losses and suboptimal design features associated with WAPDA’s generation, transmission, and distribution systems. Present tariff levels are 30 percent less than the LRMC at current system loss levels. Past pricing and approvals based on social equity and affordability considerations have led to a lack of commercial focus and affected WAPDA’s capacity to produce sufficient funding from internally generated sources to meet all expansion, rehabilitation, and reinforcement requirements. WAPDA’s less-than-satisfactory operational effectiveness associated with insufficient operational funds (para. 54) provides evidence of the need for higher tariffs in the absence of reducing system losses.
2. Auditing Arrangements
41. External audit of WAPDA’s accounts relies on the statutory auditor general of Pakistan. During project implementation, training programs (with assistance from the Netherlands) were provided to introduce performance auditing procedures and increase the number of trained audit officers. While auditing procedures are believed to comply with the Government’s requirements and standards, WAPDA’s accounts and disclosure details were not fully prepared according to accepted international practice. Important areas requiring more transparency include (i) provisions for exchange rate changes on foreign currency liabilities; (ii) adjustments on revalued assets; (iii) provisions for equity, customer deposits, Government, and provincial government contributions; and (iv) treatment of unpaid consumer bills.
D. Financial and Economic Reevaluation
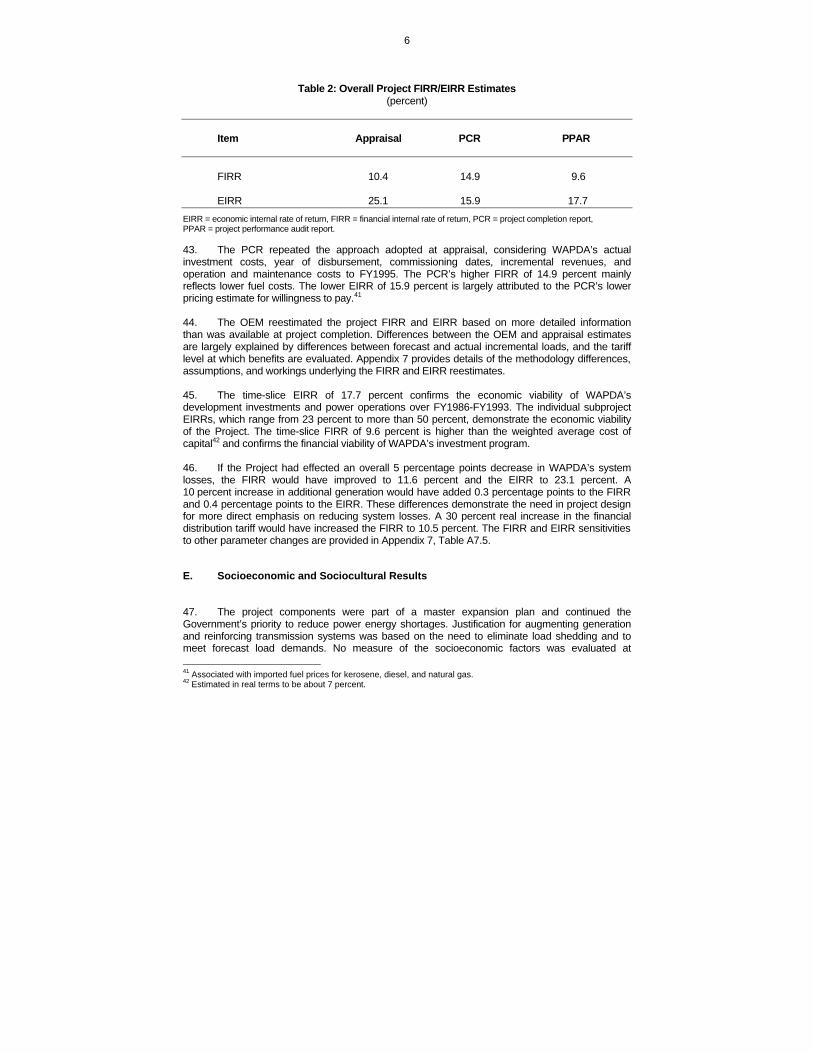
42. Estimates at appraisal for the project FIRR and EIRR were calculated based on expected incremental increases in power generated and distributed under WAPDA’s DRP for FY1986-FY1993. The base-case benefits were considered conservative in terms of pricing, incremental output, and implementation arrangements sufficient to enable completion of the Project as scheduled. Sensitivity tests showed the results were reasonably robust against increases in capital costs, operational expenses, and reduced revenues. The FIRR/EIRR appraisal estimates are compared with the reestimates at project completion and for this PPAR in Table 2.
40 As measured by the national consumer price index.
6
Table 2: Overall Project FIRR/EIRR Estimates
(percent) Item Appraisal PCR PPAR FIRR 10.4 14.9 9.6 EIRR 25.1 15.9 17.7
EIRR = economic internal rate of return, FIRR = financial internal rate of return, PCR = project completion report, PPAR = project performance audit report. 43. The PCR repeated the approach adopted at appraisal, considering WAPDA’s actual investment costs, year of disbursement, commissioning dates, incremental revenues, and operation and maintenance costs to FY1995. The PCR’s higher FIRR of 14.9 percent mainly reflects lower fuel costs. The lower EIRR of 15.9 percent is largely attributed to the PCR’s lower pricing estimate for willingness to pay.41 44. The OEM reestimated the project FIRR and EIRR based on more detailed information than was available at project completion. Differences between the OEM and appraisal estimates are largely explained by differences between forecast and actual incremental loads, and the tariff level at which benefits are evaluated. Appendix 7 provides details of the methodology differences, assumptions, and workings underlying the FIRR and EIRR reestimates. 45. The time-slice EIRR of 17.7 percent confirms the economic viability of WAPDA’s development investments and power operations over FY1986-FY1993. The individual subproject EIRRs, which range from 23 percent to more than 50 percent, demonstrate the economic viability of the Project. The time-slice FIRR of 9.6 percent is higher than the weighted average cost of capital42 and confirms the financial viability of WAPDA’s investment program. 46. If the Project had effected an overall 5 percentage points decrease in WAPDA’s system losses, the FIRR would have improved to 11.6 percent and the EIRR to 23.1 percent. A 10 percent increase in additional generation would have added 0.3 percentage points to the FIRR and 0.4 percentage points to the EIRR. These differences demonstrate the need in project design for more direct emphasis on reducing system losses. A 30 percent real increase in the financial distribution tariff would have increased the FIRR to 10.5 percent. The FIRR and EIRR sensitivities to other parameter changes are provided in Appendix 7, Table A7.5.
E. Socioeconomic and Sociocultural Results
47. The project components were part of a master expansion plan and continued the Government’s priority to reduce power energy shortages. Justification for augmenting generation and reinforcing transmission systems was based on the need to eliminate load shedding and to meet forecast load demands. No measure of the socioeconomic factors was evaluated at 41 Associated with imported fuel prices for kerosene, diesel, and natural gas. 42 Estimated in real terms to be about 7 percent.
7
appraisal or during implementation. Electrification of new areas formed part of the projected load demand picture, but the Project’s emphasis was to improve the supply system to better cope with anticipated aggregate area load demands rather than to expand to meet new connections.43 48. Notwithstanding the Project’s limited social objectives, connections under WAPDA’s LPDP increased an average of 7.1 percent per annum, from 4.9 million in FY1986 to 9.1 million in FY1995. This rate exceeds the average growth rate in the workforce, and indicates the extent to which expansion of electrification is meeting social demand. During the same period, average consumption per connection increased from 265 to 322 kWh/month as a result of increased household affluence and increased demand from industrial and commercial users. Improved reliability, better voltage, and fewer outages were evident at all subprojects visited by the OEM.44 While the OEM could not reliably measure the social benefits of improved electricity supply, it was clearly being used to help with livelihood opportunities. Additionally, the improved supply widened the scope of commercial activities, enhanced lighting, and improved the environments in which people work. Benefits accrued to women as a result of the increased availability and distribution of power to residences. 49. WAPDA’s expansion under the Project sustained the engagement of a workforce in technological, construction, and supply management skills. Construction works are estimated to have directly employed more than 8,000 people. Wages and salaries together with local procurement of materials totaled an estimated PRs2.8 billion. The new and expanded substations and the expansion at Guddu created permanent positions for 160 technical and 640 nontechnical staff. WAPDA employed 122,000 people in FY1998.
F. Environmental Impacts and Control
50. The appraisal did not specifically address environmental aspects. During the OEM’s visit to selected project sites, no adverse environmental impacts of any significance were observed. The transmission lines were at or above minimum height clearances and were mainly constructed across clear areas, with only minimal encroachment upon urban boundaries. The substations were fenced off and noise from transformers was not audible outside the substation fence boundaries. Personnel safety measures against accidental high voltage electrocution were incorporated into new substation designs. However, design construction for distribution lines, particularly for 400 V and 230 V, does not generally comply with accepted international practices.
G. Sustainability
51. Under the Project, system losses across the rehabilitated 11 kV and low-voltage feeders were reduced by 3-4 percent. Consequently, overall system loss savings of about 1 percent were generated. The sustainability of these savings, improved voltage reliability, and reduced outages depend on generation sufficiency and continued optimal system management. Actual transmission line capacity under the Project is sufficient to meet the load growth for several years. However, transformer capacity is near maximum on most feeders, and higher transformer 43 Because of delays (para. 21), improvements to the supply system in terms of reduced system losses were less
effective than planned. 44 The actual take-up of electricity across all feeders rehabilitated was surveyed by WAPDA in 1997 and found to be in
line with forecast load requirements.
8
capacities will be needed to meet peak demand and avoid transformer failures with attendant load shedding.45 More capacitors on 11 kV and 0.4 kV circuits are generally needed in order to counter reactive power loads and reduce losses. Assuming generation capacity matches load growth requirements and optimal systems management practices prevail, the technical benefits of the Project are sustainable. 52. The scaled-down involvement of the military at the end of June 1999 leaves the sustainability of recovery on nontechnical losses uncertain.46 However, WAPDA is committed to maintain recovery levels. The need remains to adjust electricity tariffs in line with long-run average costs to ensure sufficient funds to match load growth and to maintain efficient power operations. At the same time, the continued effectiveness of WAPDA’s institutional capacity depends on a continuing commitment toward enhancing operational efficiencies and moving goals toward privatization. The commitments under the International Monetary Fund’s enhanced structural adjustment facility include provisions for restructuring and progressing with the privatization of WAPDA.
45 Overloaded transformers lead to increased failures and load shedding. Where transformers are not upgraded, load
demand will be suppressed by 5 percent. WAPDA is aware of the needed increase in transformer capacity. Under military direction, more than 1,000 distribution transformers of a total installed stock of 80,000 will be upgraded with new or rehabilitated units during FY2000.
46 Also, just prior to the release of this PPAR, a military takeover of the Government was announced on 12 October 1999. Implications for the continued management of WAPDA had still to be clarified.
IV. KEY ISSUES FOR THE FUTURE
A. Modernizing Planning Capabilities
53. A computer program (CADPAD) for selecting and identifying distribution feeders for rehabilitation was introduced in 1987 to optimize investment returns consistent with minimizing technical losses.47 The program provided a detailed network analysis that identified the equipment and lengths of conductor requiring rehabilitation for each 11 kV feeder. The CADPAD program proved extremely beneficial, but the system is now obsolete. Network analysis with a competent operator using the CADPAD program takes on average four hours for each feeder, and because the program is run from a centralized system, only one feeder can be analyzed at a time. WAPDA’s planning capabilities need to be enhanced by decentralizing and making each distribution company responsible for planning requirements covering its network area. More user-friendly and powerful network analysis programs are now available that can enhance planning capabilities and reduce overall appraisal time. Additionally, personal computer systems need to be provided at planning stations if technical improvements aimed at reducing distribution losses are to be effective.
B. Local Funding Shortages
54. WAPDA’s investment program for FY1986-FY1993 provided for a total (in current prices) of PRs218.1 billion. About two thirds (PRs148 billion) was expected to be financed from WAPDA’s internally generated sources and/or from the Government. In FY1986, WAPDA’s net profit was PRs2.2 billion, depreciation was PRs1.4 billion, capital contributions about 0.7 billion, cash reserves of PRs0.5 billion, and net receivables were in approximate balance.48 WAPDA could not in all reasonableness meet local funding requirements depicted under either the Project or the much larger overall investment program.49 Actual funding (foreign and local) proved considerably lower than the investment amounts envisaged (para. 37) and was largely applied to meeting overall program targets for doubling WAPDA’s generation capacity and expanding distribution, at the expense of nonproject transmission and rehabilitation plans. The constant constraint of funding and material shortages to meet the Project’s appraisal schedules appear to have pervaded all aspects of the Project, particularly intentions for transmission and rehabilitation improvements. Project results may have been better if at the outset, ADB had paid more rigorous attention to ascertaining the availability of funding and the implications for meeting project objectives.
47 The total 2,400 11 kV feeders in WAPDA’s system were first ranked in order of the aggregate of their projected
power losses for five years, and those with the largest losses, including those for potential funding by the ADB, chosen for computerized mapping and network analysis using CADPAD.
48 Additionally, no substantive investments or securities could be readily liquefied. 49 Local currency required for the Project from WAPDA was PRs12.7 billion.
2
C. Privatization
55. While some progress has been made since appraisal toward reorganizing WAPDA to improve distribution efficiency by enhancing the autonomy of the eight area electricity boards (now referred to as distributing companies [DISCOs]), the urgency for faster and more convincing progress is underlined by the growing demand for power from residential consumers (evident by the increased applicants awaiting connection). The proposal to privatize one of the DISCOs as a pilot study is sound in concept but is likely to take several years without comprehensive consideration for autonomy requirements and policies that address staff displacements and benefits. In the interim to privatization, continuing financial support is needed to meet in a timely fashion ongoing requirements for rehabilitation and expansion of the nonprivatized DISCOs. Accelerated support is needed to address financial constraints, effect recoveries on billings, and reduce system losses. Technical assistance is required to implement asset management principles, meet planning requirements, address customer needs, and streamline accounting and management information systems.
V. CONCLUSIONS
A. Overall Assessment
56. The Project’s objective to rehabilitate WAPDA’s distribution system and expand WAPDA’s generation and transmission capacity followed implementation arrangements, except for a time overrun of three and one-half years and a cost overrun of 9 percent. Implementation delays occurred because of (i) overly optimistic estimates of the time needed to appraise and select subprojects, (ii) delays in finalizing arrangements for cofinancing, (iii) shortages of materials caused by management approval practices that gave priority to nonproject subprojects, and (iv) shortages in local funding from WAPDA’s internal sources. The Project’s cost overrun was largely attributable to cost variations caused by variations to the scope and overall delay in implementation. 57. The Project’s rationale to reduce technical losses, improve reliability, and expand generation and distribution was sound. Without improvement to WAPDA’s distribution system, overall system losses would have been at least 4 percent higher and the acute shortages in power supply experienced in 1994 would have been more severe. Technical improvements at substations, construction of new substations, and improved transmission capacity helped to reduce transmission losses over the 132 kV and 11 kV lines by 2 percentage points and reduce system losses by up to 5 percentage points over the connected low-voltage transmission lines. Without these improvements, voltage reliability across the low-voltage transmission lines would have remained impaired and caused consumer appliances and electric motors designed for 220 voltage to burn out. Augmentation of generation at the Guddu power station increased WAPDA’s generation capacity by 415 MW during a time of critical shortages in generation capacity. Consulting services for detailed preparation of generation expansion at the Chashma power station were completed satisfactorily. 58. Overall investment expenditure on WAPDA’s program for FY1986-FY1993 was 55 percent of that planned. Actual expenditure under the program was largely applied to expand generation and distribution, which met overall system objectives to double generation capacity and meet distribution targets, but did so at the expense of nonproject transmission and rehabilitation improvements. The objectives of the Project to augment WAPDA’s generation and double installed generation capacity and to reduce overall system losses to 23 percent were achieved, although with significant delay. Reflecting the reduced overall investment, WAPDA’s financial statements reveal slower growth and smaller income returns than were forecast at appraisal. Financial indicators pertaining to WAPDA’s total operations, which initially improved in line with appraisal expectations, deteriorated after 1991 with higher than targeted system losses, delayed tariff adjustments, and the need to import generation at higher than WAPDA’s own supply cost. The time-slice EIRR of 17.7 percent, compared with the appraisal estimate of 25.1 percent, attests to the lower effectiveness of the Project. 59. Long delays in rehabilitation implementation, which the project design specifically tried to address, and the variable but weakening financial performance of WAPDA after FY1992 detract from the overall performance assessment as does the insufficiency of ongoing rehabilitation to sustain WAPDA’s overall system losses at the Project’s covenanted target of 23 percent.

2
60. Notwithstanding these detractions which are reflected in the EIRR and FIRR reestimates, the Project is rated generally successful. This assessment is based on the satisfactory time-slice EIRR which exceeds the ADB’s reference benchmark; the satisfactory EIRRs of subprojects, which range from 21 percent to more than 50 percent and attest to the viability of subproject selection; and the supportive time-slice FIRR of 9.6 percent for WAPDA’s investments. The benefits of the Project are considered sustainable, given the Government’s restructuring commitments to the International Monetary Fund’s enhanced structural adjustment facility, recovery signals on unaudited account for FY1999, and WAPDA’s announcement in July 1999 to focus on reducing technical losses and moving toward privatization.
B. Lessons Learned
61. The key lessons derived from the Project are the need (i) to tighten approval practices that enable management interventions to divert available project materials to nonproject subprojects (para. 11); (ii) to strengthen financial management and the transparency of financial statements (para. 41); (iii) to introduce a more time-effective appraisal system for selecting and approving distribution subproject proposals (para. 53); and (iv) for the ADB to be more circumspect in its appraisal of sector project objectives and the reality of achieving them, particularly where targets depend on scale and availability of local funding (para. 54). See paras. 63 and 64 for other lessons from implementation experience and the OEM’s observations.
C. Follow-Up Actions
62. The ADB should continue to support the sector approach to lending and ensure sector loan projects are planned (i) to take into account appraisal practices that cause materials to be directed to nonproject subprojects (para. 11), (ii) with stronger conditionalities for tariff adjustments in the absence of a sustainable and compensating reduction in system losses (para. 40), (iii) to strengthen financial management and the transparency of financial statements (para. 41), and (iv) with more rigorous attention to financial critical path management (para. 54). 63. The Government should initiate measures aimed at (i) providing WAPDA with support and effective recovery mechanisms for dealing with nontechnical losses, outstanding customer accounts, and errant staff and contractors; and (ii) facilitating moving toward privatization through policies that delineate how staff will be redeployed and how displaced staff will be compensated for benefits forgone (para. 55). 64. WAPDA should aim to provide more focused leadership and management to (i) reduce power system losses and develop a corporate culture for improving operational efficiencies (para. 35); and (ii) initiate reforms for improving customer relations, billing, and recovery mechanisms, and introduce strict management controls on the design and rehabilitation of the distribution system (paras. 31 and 53).

3
APPENDIXES
Number Title Page Cited on (page, para.)
1 Scope and Locations of the Project 20 2, 4 Financed from the Asian Development Bank Loan 2 Objectives, Targets, and Actual Outcomes 21 2, 4 3 Technical Performance 23 4, 12 4 Project Costs 25 6, 20 attachments\pe528-app4-2.xls 5 Implementation Schedule for the WAPDA 27 6, 21 Tenth Power (Sector Loan) Project 6 Financial Results 28 8, 27 7 Financial and Economic Performance 30 13, 44

OBJECTIVES, TARGETS, AND ACTUAL OUTCOMES Overall Donor-Assisted Project
Objectives/Scope
Targets
Actual Outcomes and Impact
1. Sector ?? Expand power generation capacity through new and
existing plants ?? Double generation capacity by FY1993 from 4,339 megawatts (MW) 8,152 MW
?? Expand transmission capacity ?? Extend grid to 90 percent of villages by June 1990 from 48 percent 91 percent ?? Ensure transmission and distribution network expansion is
consistent with the Water and Power Development Authority’s (WAPDA’s) power system master plan
?? Establish distribution control centers at major towns and a national load dispatch center at Islamabad
Completed
?? Improve system reliability and power distribution efficiency
through rehabilitation and reinforcement of existing transmission and distribution systems
?? Eliminate load shedding by 1990 and reduce system losses to 23 percent by FY1988
Not achieved 22.8 percent by FY1991 24.1 percent by FY1995
?? Review tariff structure and remove internal cross subsidies ?? Ensure tariff pricing reforms reflect long-run marginal costs of supply
and formal objectives of loan agencies Not achieved but tariff increases exceeded inflation and unit costs
2. Project
?? Improve system reliability and power distribution efficiency for a two-year time slice of the WAPDA’s FY1986-FY1993 distribution rehabilitation program
Part A: Distribution Rehabilitation ?? Rehabilitation of 1,200 11-kilovolt (kV) feeders and associated 0.4-
kV feeders ?? Installation of capacitors and time switches
Exceeded target: 1,276 11-kV feeders/ 14,000 0.4-kV lines About one third of target
?? Expand WAPDA’s generation, transmission, and
distribution capacity to meet the anticipated growth in power requirements through the end of FY1995, and for a two-year time slice of WAPDA’s least-cost power development plan within FY1986-FY1993
Part B: Generation and Transmission Expansion ?? Installation of 200 MW at each of Mangla, Chashma, and Guddu ?? Construction of Ludewala-Daudkhel 500-kV transmission line with a
total length of 190 kilometers (km) ?? Construction of a Tarbella-Lahore 500-kV transmission line with a
total length of 332 km ?? Construction and reinforcement of secondary transmission involving
- 280 km of 220-kV lines - 3,458 km of 132-kV lines - 1,077 km of 66-kV lines - 139 new substations - 86 existing substations
415 MW at Guddu Proposal canceled
Completed
Completed substantially as envisaged
Objectives/Scope
Targets
Actual Outcomes and Impact
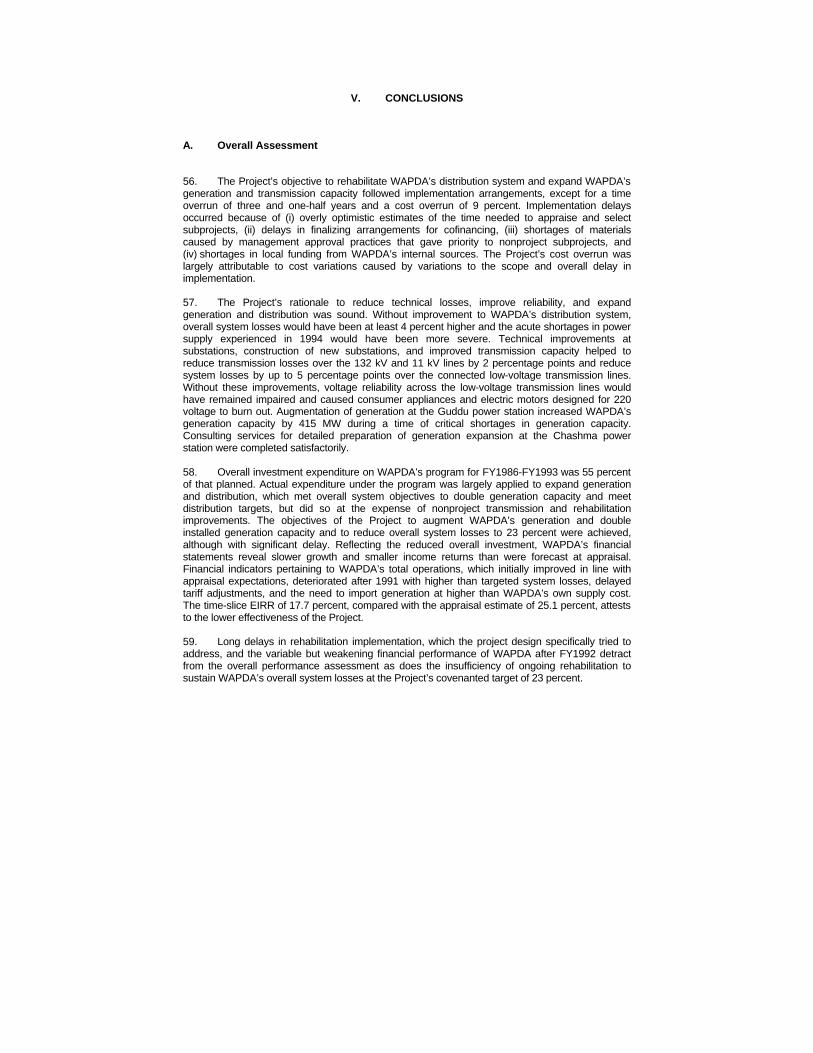
?? Provide institutional strengthening, training, and financial reforms
?? Staff training on - distribution design - CADPADa operation - capacitor installation - capacitor maintenance - distribution operation and maintenance
Training completed
?? Karachi Electric Supply Corporation (KESC) and WAPDA tariff study for integrating the power generation systems of each
Completed; recommendations rendered redundant by changing circumstances
?? Reduce system losses ?? Reduction of system losses to below 23 percent 22.8 percent for FY1991,
increasing to 28 percent for FY1999
?? Improve power reliability ?? Elimination of load shedding Eliminated FY1999 ?? Financial internal rate of return (FIRR) of 10.4 percent FIRR = 2.2 percent ?? Economic internal rate of return (EIRR) of 25.1 percent EIRR = 8.4 percent
3. Project Activities/Inputs
?? Procurement and delivery of equipment and materials ?? Rehabilitation/upgrading of 11-kV lines and associated
distribution feeders
?? Project costs (equipment, consulting services, physical and price contingencies, taxes and duties): Part A: $114.4 million Part B: $1,154.2 million TA: $0.475 million
Project costs Part A: $98.39 million Part B: $1,293.55 million TA: $0.481 million
?? Installation of generation units ?? Construction of transmission lines and substations,
including supervision ?? Financing Plan (excluding TA)
ADB: $150 million Government: $663.3 million Other external: $310.3 million
Financing ADB: $144.7 million Government: $777.4 million Cofinancing: $466.34 million
?? Technical assistance (TA) for KESC/WAPDA tariff study
ADB = Asian Development Bank. a CADPAD is a computer program for selecting and identifying distribution feeders for rehabilitation.

Appendix 3, page 1
TECHNICAL PERFORMANCE A. Distribution Rehabilitation 1. The objective was to rehabilitate the most cost-effective of 2,400 11-kilovolts (kV) distribution feeders throughout the Water and Power Development Authority (WAPDA) system. Cost effectiveness was based on the recovery of technical losses that could be achieved with rehabilitation/upgrading consistent with the least-cost alternative means of modification. After determining the status of each feeder in terms of overload, power factor, reactive loading, losses and load forecast, the feeders were ranked according to a power loss index, and the top 250-300 of these not already being modified were chosen. The selected feeders were then evaluated for their economic viability, considering the least-cost method of modification. 2. Feeders with reactive loadings were to be upgraded with capacitors. Other typical modifications included replacing phase cable with heavier cable, adding distribution transformers, and relocating them to even the load between phase wires, and installing metering equipment. Inspection of rehabilitated feeders in Lahore and Quetta revealed they were heavily loaded with power factors of about 80 percent. Based on data submitted by the engineers prior to and after rehabilitation, losses decreased by 2-3 percent. It could also be inferred from forecast loadings that without rehabilitation, losses of 2.5-5 percent would have been incurred. 3. For the associated low-tension lines, upgrading typically involved replacing circuits with osprey conductors, replacement and relocation of transformers, and the addition of three-phase capacitor banks. It is estimated that the low-tension losses were reduced on average by 4-5 percent, and by an additional 2 percent where capacitors were installed. 4. Rehabilitation/upgrading, in terms of design and quality of work, was generally substandard, with the result that rehabilitation had the effect of avoiding an inevitable increase in losses as opposed to avoiding and reducing system losses. With appropriate materials, design, and quality of work,1 losses could have been reduced by about 1-2 percent more. 5. For some of the feeders and associated lines inspected, capacitors and drop-out fuses were obviously missing where they should have been installed. Discussions with planning engineers revealed the situation reflected shortages of materials and funds. Aside from not reducing losses to a lower level (by up to 2 percentage points), unnecessary tripping with overloading would result. 6. The intended provision of time switches on feeders supplying tubewells appears to have been defeated by the well owners and/or to have failed after short lives. B. Augmentation of Generation and Transmission 7. This portion of the Project was aimed at increasing the capacity of WAPDA’s generation and transmission system according to the least-cost development plan. Several subprojects were identified at appraisal for the Asian Development Bank funding (Appendix 1). The Operations Evaluation Mission (OEM) visited the Guddu combined cycle addition, the new substation at Ludewala, and the associated high-tension transmission lines. 8. The Guddu contract award was on a turnkey basis. The two gas turbine units (11 and 12) were commissioned in July and September 1992, and the steam turbine in March 1994. The units
1 Including proper connection practices.
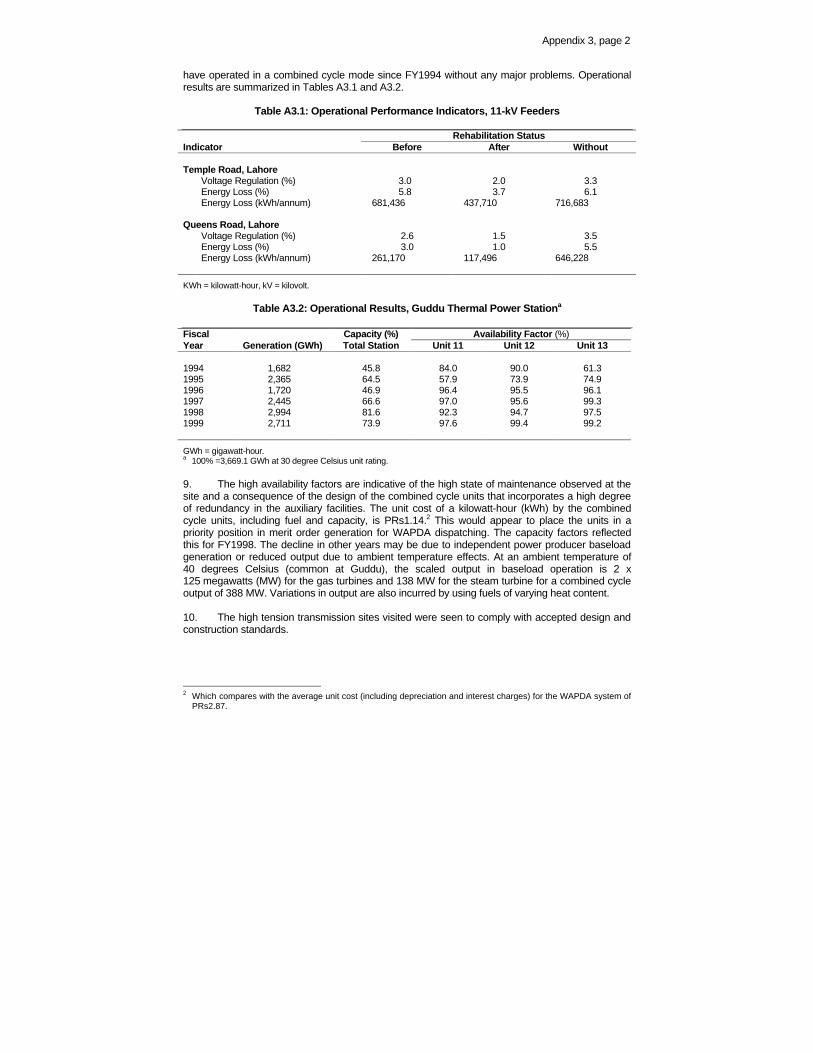
Appendix 3, page 2
have operated in a combined cycle mode since FY1994 without any major problems. Operational results are summarized in Tables A3.1 and A3.2.
Table A3.1: Operational Performance Indicators, 11-kV Feeders Rehabilitation Status Indicator Before After Without Temple Road, Lahore Voltage Regulation (%) 3.0 2.0 3.3 Energy Loss (%) 5.8 3.7 6.1 Energy Loss (kWh/annum) 681,436 437,710 716,683 Queens Road, Lahore Voltage Regulation (%) 2.6 1.5 3.5 Energy Loss (%) 3.0 1.0 5.5 Energy Loss (kWh/annum) 261,170 117,496 646,228
KWh = kilowatt-hour, kV = kilovolt.
Table A3.2: Operational Results, Guddu Thermal Power Stationa Fiscal Capacity (%) Availability Factor (%) Year Generation (GWh) Total Station Unit 11 Unit 12 Unit 13 1994 1,682 45.8 84.0 90.0 61.3 1995 2,365 64.5 57.9 73.9 74.9 1996 1,720 46.9 96.4 95.5 96.1 1997 2,445 66.6 97.0 95.6 99.3 1998 2,994 81.6 92.3 94.7 97.5 1999 2,711 73.9 97.6 99.4 99.2
GWh = gigawatt-hour. a 100% =3,669.1 GWh at 30 degree Celsius unit rating. 9. The high availability factors are indicative of the high state of maintenance observed at the site and a consequence of the design of the combined cycle units that incorporates a high degree of redundancy in the auxiliary facilities. The unit cost of a kilowatt-hour (kWh) by the combined cycle units, including fuel and capacity, is PRs1.14.2 This would appear to place the units in a priority position in merit order generation for WAPDA dispatching. The capacity factors reflected this for FY1998. The decline in other years may be due to independent power producer baseload generation or reduced output due to ambient temperature effects. At an ambient temperature of 40 degrees Celsius (common at Guddu), the scaled output in baseload operation is 2 x 125 megawatts (MW) for the gas turbines and 138 MW for the steam turbine for a combined cycle output of 388 MW. Variations in output are also incurred by using fuels of varying heat content. 10. The high tension transmission sites visited were seen to comply with accepted design and construction standards.
2 Which compares with the average unit cost (including depreciation and interest charges) for the WAPDA system of
PRs2.87.
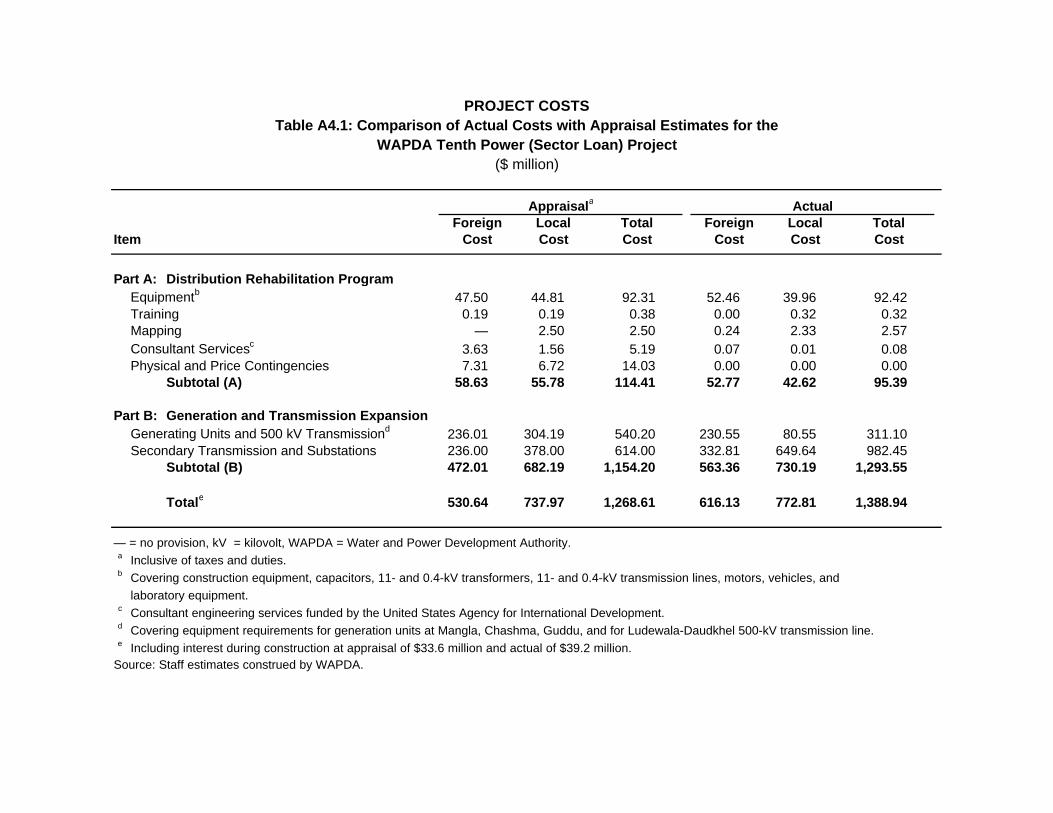
Item
Distribution Rehabilitation ProgramEquipmentb 47.50 44.81 92.31 52.46 39.96 92.42Training 0.19 0.19 0.38 0.00 0.32 0.32Mapping — 2.50 2.50 0.24 2.33 2.57Consultant Servicesc 3.63 1.56 5.19 0.07 0.01 0.08Physical and Price Contingencies 7.31 6.72 14.03 0.00 0.00 0.00
Subtotal (A) 58.63 55.78 114.41 52.77 42.62 95.39
Generation and Transmission ExpansionGenerating Units and 500 kV Transmissiond 236.01 304.19 540.20 230.55 80.55 311.10Secondary Transmission and Substations 236.00 378.00 614.00 332.81 649.64 982.45
Subtotal (B) 472.01 682.19 1,154.20 563.36 730.19 1,293.55
Totale 530.64 737.97 1,268.61 616.13 772.81 1,388.94
— = no provision, kV = kilovolt, WAPDA = Water and Power Development Authority.a Inclusive of taxes and duties.b Covering construction equipment, capacitors, 11- and 0.4-kV transformers, 11- and 0.4-kV transmission lines, motors, vehicles, and
laboratory equipment. c Consultant engineering services funded by the United States Agency for International Development.d Covering equipment requirements for generation units at Mangla, Chashma, Guddu, and for Ludewala-Daudkhel 500-kV transmission line.e Including interest during construction at appraisal of $33.6 million and actual of $39.2 million.
Source: Staff estimates construed by WAPDA.
($ million)
TotalAppraisala
ForeignForeign
Part B:
PROJECT COSTSTable A4.1: Comparison of Actual Costs with Appraisal Estimates for the
Local TotalActual
Part A:
Local
WAPDA Tenth Power (Sector Loan) Project
Cost CostCost Cost Cost Cost
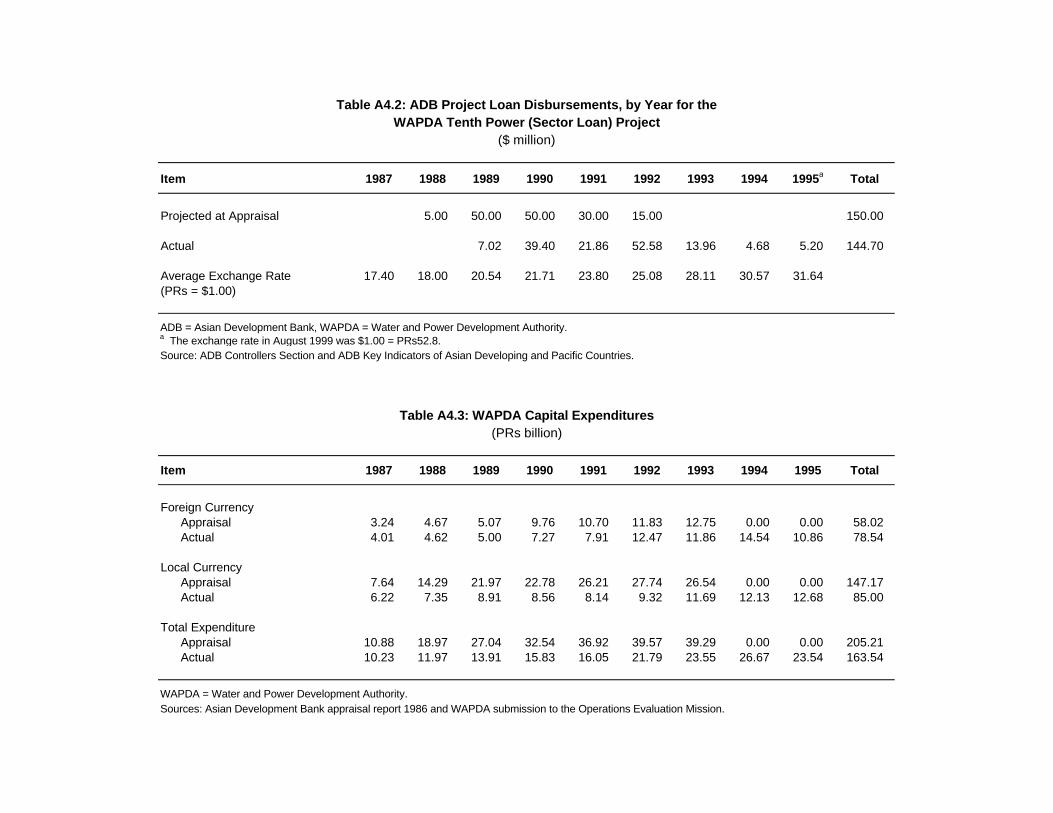
Item
Projected at Appraisal 5.00 50.00 50.00 30.00 15.00 150.00
Actual 7.02 39.40 21.86 52.58 13.96 4.68 5.20 144.70
Average Exchange Rate 17.40 18.00 20.54 21.71 23.80 25.08 28.11 30.57 31.64(PRs = $1.00)
ADB = Asian Development Bank, WAPDA = Water and Power Development Authority.a The exchange rate in August 1999 was $1.00 = PRs52.8.Source: ADB Controllers Section and ADB Key Indicators of Asian Developing and Pacific Countries.
Item
Foreign CurrencyAppraisal 3.24 4.67 5.07 9.76 10.70 11.83 12.75 0.00 0.00 58.02Actual 4.01 4.62 5.00 7.27 7.91 12.47 11.86 14.54 10.86 78.54
Local CurrencyAppraisal 7.64 14.29 21.97 22.78 26.21 27.74 26.54 0.00 0.00 147.17Actual 6.22 7.35 8.91 8.56 8.14 9.32 11.69 12.13 12.68 85.00
Total ExpenditureAppraisal 10.88 18.97 27.04 32.54 36.92 39.57 39.29 0.00 0.00 205.21Actual 10.23 11.97 13.91 15.83 16.05 21.79 23.55 26.67 23.54 163.54
WAPDA = Water and Power Development Authority.Sources: Asian Development Bank appraisal report 1986 and WAPDA submission to the Operations Evaluation Mission.
Table A4.2: ADB Project Loan Disbursements, by Year for theWAPDA Tenth Power (Sector Loan) Project
1987 1992 1993 1994 1995a1988 1989
($ million)
Table A4.3: WAPDA Capital Expenditures(PRs billion)
1990 1991 Total
1987 1988 1989 1990 1995 Total1991 1992 1993 1994

Item
Gross Energy Generation (GWh) 23,630.0 27,451.0 28,898.0 34,435.0 40,791.0 46,126.0 50,782.0 53,261.0 54,082.0Energy Growth (% per annum) 12.2 16.2 5.3 9.6 9.2 6.5 5.0 4.9 1.5
Total Energy Sales (GWh) 17,745.0 20,702.0 21,982.0 26,584.0 31,272.0 35,032.0 38,529.0 39,422.0 38,939.0Sales Growth (% per annum) 14.5 16.7 6.2 10.5 8.8 6.0 5.0 2.3 (1.2)Systems Loss (%) 24.9 24.6 23.9 22.8 23.3 24.1 24.1 26.0 28.0
Average Sales Revenue (PRs/kWh) 0.70 0.83 0.94 1.17 1.26 1.63 2.33 2.72 3.11Operating Revenue (PRs billion) 12.9 17.4 21.2 31.6 40.1 57.9 90.8 109.4 122.4Operating Income (PRs billion) 5.8 7.7 10.4 16.4 16.7 25.8 14.9 14.4 41.9Net Profit Before Tax (PRs billion) 1.6 2.8 4.8 7.4 5.4 9.9 (1.4) (1.5) 16.0
Total Equity (PRs billion) 25.1 29.1 35.2 53.4 69.0 88.6 121.7 127.9 146.5Total Assets (PRs billion) 60.6 73.8 91.0 135.5 183.4 232.5 297.0 335.3 344.6Asset Growth (% per annum) 20.1 21.8 23.3 24.4 17.7 13.4 13.9 12.9 2.8
Net Profit After Tax/Equity (%) 6.3 9.7 13.6 13.8 7.9 11.2 (1.2) (1.2) 10.9Net Profit After Tax/Operating Revenues (%) 12.2 16.2 22.6 23.3 13.5 17.1 (1.6) (1.4) 13.0 Long-Term Liabilities/Equity (%) 127.3 134.2 138.7 134.5 136.6 125.5 101.3 96.7 82.5Equity/Total Assets (%) a 41.4 39.4 38.7 39.4 37.6 38.1 40.9 38.2 42.5Retained Earnings/Total Assets (%) 2.6 3.8 5.2 5.4 3.0 4.3 (0.5) (0.5) 4.6
Current Assets — Current Liabilities (ratio) 2.1 1.8 2.0 2.1 1.3 1.0 0.9 0.8 0.9Current Liabilities/Total Liabilities (%) 5.8 7.6 7.7 7.6 10.9 14.0 17.7 24.9 22.4Long-Term Liabilities/Total Assets (%) 52.7 52.9 53.6 53.0 51.4 47.9 41.5 36.9 35.1
GWh = gigawatt-hour, kWh = kilowatt-hour, WAPDA = Water and Power Development Authority.a Equity includes consumer deposits.
Sources: WAPDA and staff estimates.
1993 1995 1997
FINANCIAL RESULTSTable A6.1: Key Performance Indicators for WAPDA Tenth Power (Sector Loan) Project, Selected Years 1987-1999
(PRs million)
1998 19991987 1988 1989 1991
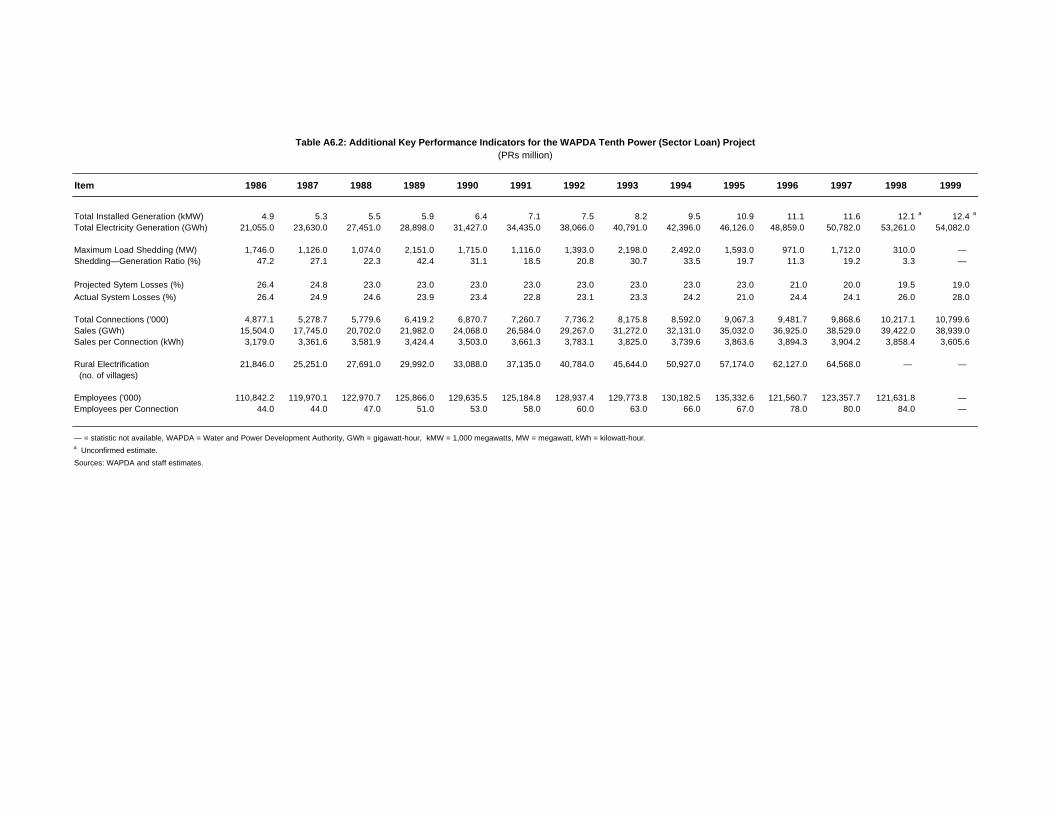
Item
Total Installed Generation (kMW) 4.9 5.3 5.5 5.9 6.4 7.1 7.5 8.2 9.5 10.9 11.1 11.6 12.1 a 12.4 a
Total Electricity Generation (GWh) 21,055.0 23,630.0 27,451.0 28,898.0 31,427.0 34,435.0 38,066.0 40,791.0 42,396.0 46,126.0 48,859.0 50,782.0 53,261.0 54,082.0
Maximum Load Shedding (MW) 1,746.0 1,126.0 1,074.0 2,151.0 1,715.0 1,116.0 1,393.0 2,198.0 2,492.0 1,593.0 971.0 1,712.0 310.0 —Shedding—Generation Ratio (%) 47.2 27.1 22.3 42.4 31.1 18.5 20.8 30.7 33.5 19.7 11.3 19.2 3.3 — Projected Sytem Losses (%) 26.4 24.8 23.0 23.0 23.0 23.0 23.0 23.0 23.0 23.0 21.0 20.0 19.5 19.0Actual System Losses (%) 26.4 24.9 24.6 23.9 23.4 22.8 23.1 23.3 24.2 21.0 24.4 24.1 26.0 28.0
Total Connections ('000) 4,877.1 5,278.7 5,779.6 6,419.2 6,870.7 7,260.7 7,736.2 8,175.8 8,592.0 9,067.3 9,481.7 9,868.6 10,217.1 10,799.6Sales (GWh) 15,504.0 17,745.0 20,702.0 21,982.0 24,068.0 26,584.0 29,267.0 31,272.0 32,131.0 35,032.0 36,925.0 38,529.0 39,422.0 38,939.0Sales per Connection (kWh) 3,179.0 3,361.6 3,581.9 3,424.4 3,503.0 3,661.3 3,783.1 3,825.0 3,739.6 3,863.6 3,894.3 3,904.2 3,858.4 3,605.6 Rural Electrification 21,846.0 25,251.0 27,691.0 29,992.0 33,088.0 37,135.0 40,784.0 45,644.0 50,927.0 57,174.0 62,127.0 64,568.0 — — (no. of villages) Employees ('000) 110,842.2 119,970.1 122,970.7 125,866.0 129,635.5 125,184.8 128,937.4 129,773.8 130,182.5 135,332.6 121,560.7 123,357.7 121,631.8 —Employees per Connection 44.0 44.0 47.0 51.0 53.0 58.0 60.0 63.0 66.0 67.0 78.0 80.0 84.0 —
— = statistic not available, WAPDA = Water and Power Development Authority, GWh = gigawatt-hour, kMW = 1,000 megawatts, MW = megawatt, kWh = kilowatt-hour.a Unconfirmed estimate.
Sources: WAPDA and staff estimates.
(PRs million)Table A6.2: Additional Key Performance Indicators for the WAPDA Tenth Power (Sector Loan) Project
1986 1987 1988 1989 1990 1991 1992 1993 1998 19991994 1995 1996 1997
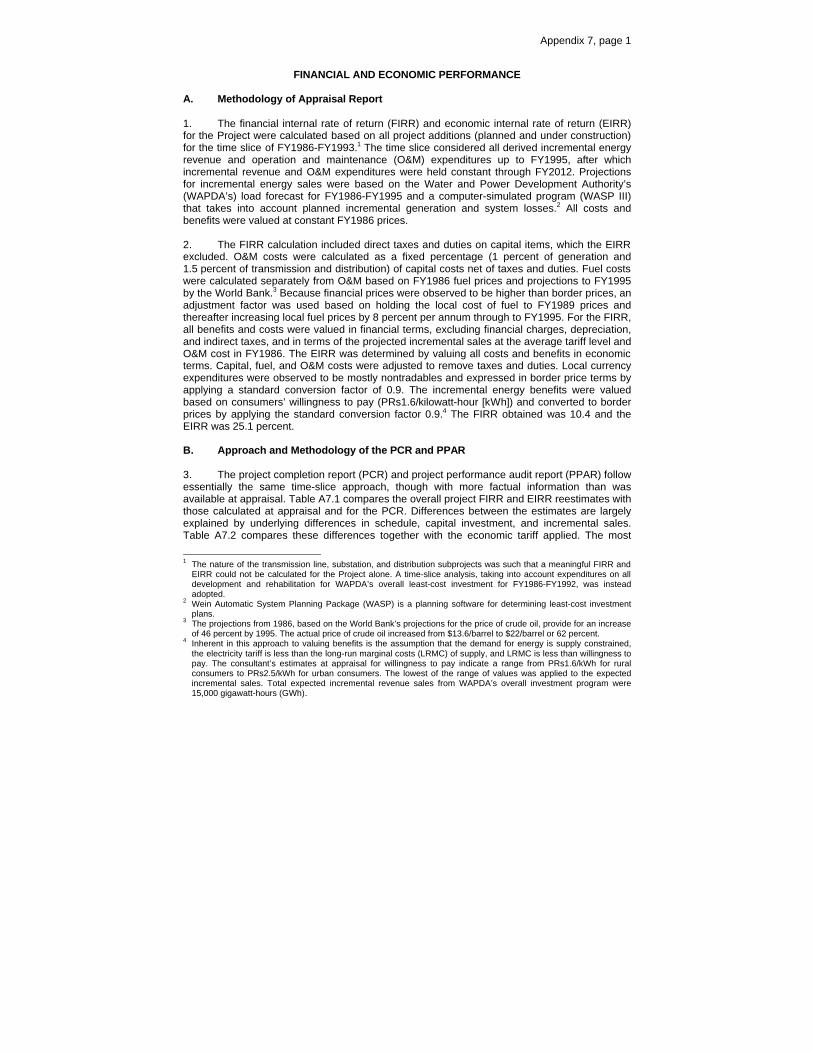
Appendix 7, page 1
FINANCIAL AND ECONOMIC PERFORMANCE A. Methodology of Appraisal Report 1. The financial internal rate of return (FIRR) and economic internal rate of return (EIRR) for the Project were calculated based on all project additions (planned and under construction) for the time slice of FY1986-FY1993.1 The time slice considered all derived incremental energy revenue and operation and maintenance (O&M) expenditures up to FY1995, after which incremental revenue and O&M expenditures were held constant through FY2012. Projections for incremental energy sales were based on the Water and Power Development Authority’s (WAPDA’s) load forecast for FY1986-FY1995 and a computer-simulated program (WASP III) that takes into account planned incremental generation and system losses.2 All costs and benefits were valued at constant FY1986 prices. 2. The FIRR calculation included direct taxes and duties on capital items, which the EIRR excluded. O&M costs were calculated as a fixed percentage (1 percent of generation and 1.5 percent of transmission and distribution) of capital costs net of taxes and duties. Fuel costs were calculated separately from O&M based on FY1986 fuel prices and projections to FY1995 by the World Bank.3 Because financial prices were observed to be higher than border prices, an adjustment factor was used based on holding the local cost of fuel to FY1989 prices and thereafter increasing local fuel prices by 8 percent per annum through to FY1995. For the FIRR, all benefits and costs were valued in financial terms, excluding financial charges, depreciation, and indirect taxes, and in terms of the projected incremental sales at the average tariff level and O&M cost in FY1986. The EIRR was determined by valuing all costs and benefits in economic terms. Capital, fuel, and O&M costs were adjusted to remove taxes and duties. Local currency expenditures were observed to be mostly nontradables and expressed in border price terms by applying a standard conversion factor of 0.9. The incremental energy benefits were valued based on consumers’ willingness to pay (PRs1.6/kilowatt-hour [kWh]) and converted to border prices by applying the standard conversion factor 0.9.4 The FIRR obtained was 10.4 and the EIRR was 25.1 percent. B. Approach and Methodology of the PCR and PPAR 3. The project completion report (PCR) and project performance audit report (PPAR) follow essentially the same time-slice approach, though with more factual information than was available at appraisal. Table A7.1 compares the overall project FIRR and EIRR reestimates with those calculated at appraisal and for the PCR. Differences between the estimates are largely explained by underlying differences in schedule, capital investment, and incremental sales. Table A7.2 compares these differences together with the economic tariff applied. The most
1 The nature of the transmission line, substation, and distribution subprojects was such that a meaningful FIRR and
EIRR could not be calculated for the Project alone. A time-slice analysis, taking into account expenditures on all development and rehabilitation for WAPDA’s overall least-cost investment for FY1986-FY1992, was instead adopted.
2 Wein Automatic System Planning Package (WASP) is a planning software for determining least-cost investment plans.
3 The projections from 1986, based on the World Bank’s projections for the price of crude oil, provide for an increase of 46 percent by 1995. The actual price of crude oil increased from $13.6/barrel to $22/barrel or 62 percent.
4 Inherent in this approach to valuing benefits is the assumption that the demand for energy is supply constrained, the electricity tariff is less than the long-run marginal costs (LRMC) of supply, and LRMC is less than willingness to pay. The consultant’s estimates at appraisal for willingness to pay indicate a range from PRs1.6/kWh for rural consumers to PRs2.5/kWh for urban consumers. The lowest of the range of values was applied to the expected incremental sales. Total expected incremental revenue sales from WAPDA’s overall investment program were 15,000 gigawatt-hours (GWh).
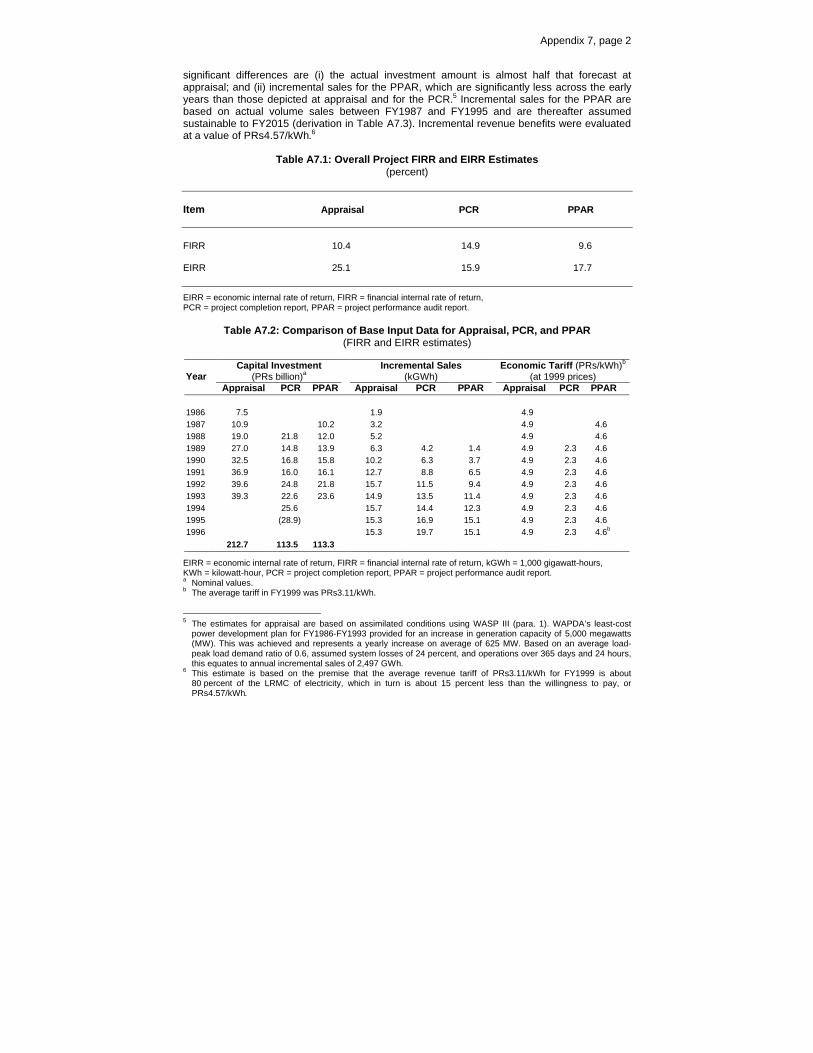
Appendix 7, page 2
significant differences are (i) the actual investment amount is almost half that forecast at appraisal; and (ii) incremental sales for the PPAR, which are significantly less across the early years than those depicted at appraisal and for the PCR.5 Incremental sales for the PPAR are based on actual volume sales between FY1987 and FY1995 and are thereafter assumed sustainable to FY2015 (derivation in Table A7.3). Incremental revenue benefits were evaluated at a value of PRs4.57/kWh.6
Table A7.1: Overall Project FIRR and EIRR Estimates (percent)
Item Appraisal PCR PPAR FIRR 10.4 14.9 9.6 EIRR 25.1 15.9 17.7
EIRR = economic internal rate of return, FIRR = financial internal rate of return, PCR = project completion report, PPAR = project performance audit report.
Table A7.2: Comparison of Base Input Data for Appraisal, PCR, and PPAR (FIRR and EIRR estimates)
Year
Capital Investment (PRs billion)a
Incremental Sales (kGWh)
Economic Tariff (PRs/kWh)b (at 1999 prices)
Appraisal PCR PPAR Appraisal PCR PPAR Appraisal PCR PPAR 1986 7.5 1.9 4.9 1987 10.9 10.2 3.2 4.9 4.6 1988 19.0 21.8 12.0 5.2 4.9 4.6 1989 27.0 14.8 13.9 6.3 4.2 1.4 4.9 2.3 4.6 1990 32.5 16.8 15.8 10.2 6.3 3.7 4.9 2.3 4.6 1991 36.9 16.0 16.1 12.7 8.8 6.5 4.9 2.3 4.6 1992 39.6 24.8 21.8 15.7 11.5 9.4 4.9 2.3 4.6 1993 39.3 22.6 23.6 14.9 13.5 11.4 4.9 2.3 4.6 1994 25.6 15.7 14.4 12.3 4.9 2.3 4.6 1995 (28.9) 15.3 16.9 15.1 4.9 2.3 4.6 1996 15.3 19.7 15.1 4.9 2.3 4.6b
212.7 113.5 113.3
EIRR = economic internal rate of return, FIRR = financial internal rate of return, kGWh = 1,000 gigawatt-hours, KWh = kilowatt-hour, PCR = project completion report, PPAR = project performance audit report. a Nominal values. b The average tariff in FY1999 was PRs3.11/kWh.
5 The estimates for appraisal are based on assimilated conditions using WASP III (para. 1). WAPDA’s least-cost
power development plan for FY1986-FY1993 provided for an increase in generation capacity of 5,000 megawatts (MW). This was achieved and represents a yearly increase on average of 625 MW. Based on an average load- peak load demand ratio of 0.6, assumed system losses of 24 percent, and operations over 365 days and 24 hours, this equates to annual incremental sales of 2,497 GWh.
6 This estimate is based on the premise that the average revenue tariff of PRs3.11/kWh for FY1999 is about 80 percent of the LRMC of electricity, which in turn is about 15 percent less than the willingness to pay, or PRs4.57/kWh.

Appendix 7, page 3
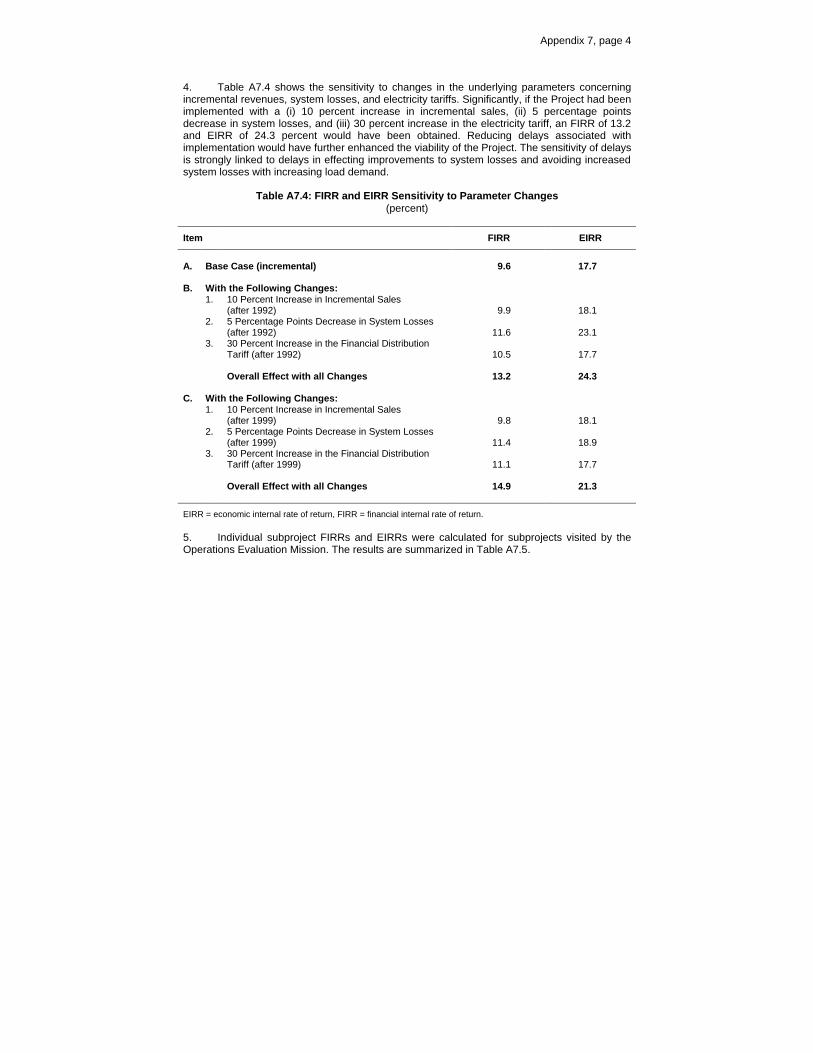
Appendix 7, page 4
4. Table A7.4 shows the sensitivity to changes in the underlying parameters concerning incremental revenues, system losses, and electricity tariffs. Significantly, if the Project had been implemented with a (i) 10 percent increase in incremental sales, (ii) 5 percentage points decrease in system losses, and (iii) 30 percent increase in the electricity tariff, an FIRR of 13.2 and EIRR of 24.3 percent would have been obtained. Reducing delays associated with implementation would have further enhanced the viability of the Project. The sensitivity of delays is strongly linked to delays in effecting improvements to system losses and avoiding increased system losses with increasing load demand.
Table A7.4: FIRR and EIRR Sensitivity to Parameter Changes (percent)
Item FIRR EIRR
A. Base Case (incremental) 9.6 17.7 B. With the Following Changes: 1. 10 Percent Increase in Incremental Sales
(after 1992)
9.9
18.1 2. 5 Percentage Points Decrease in System Losses
(after 1992)
11.6
23.1 3. 30 Percent Increase in the Financial Distribution
Tariff (after 1992)
10.5
17.7 Overall Effect with all Changes 13.2 24.3 C. With the Following Changes: 1. 10 Percent Increase in Incremental Sales
(after 1999)
9.8
18.1 2. 5 Percentage Points Decrease in System Losses
(after 1999)
11.4
18.9 3. 30 Percent Increase in the Financial Distribution
Tariff (after 1999)
11.1
17.7 Overall Effect with all Changes 14.9 21.3
EIRR = economic internal rate of return, FIRR = financial internal rate of return. 5. Individual subproject FIRRs and EIRRs were calculated for subprojects visited by the Operations Evaluation Mission. The results are summarized in Table A7.5.
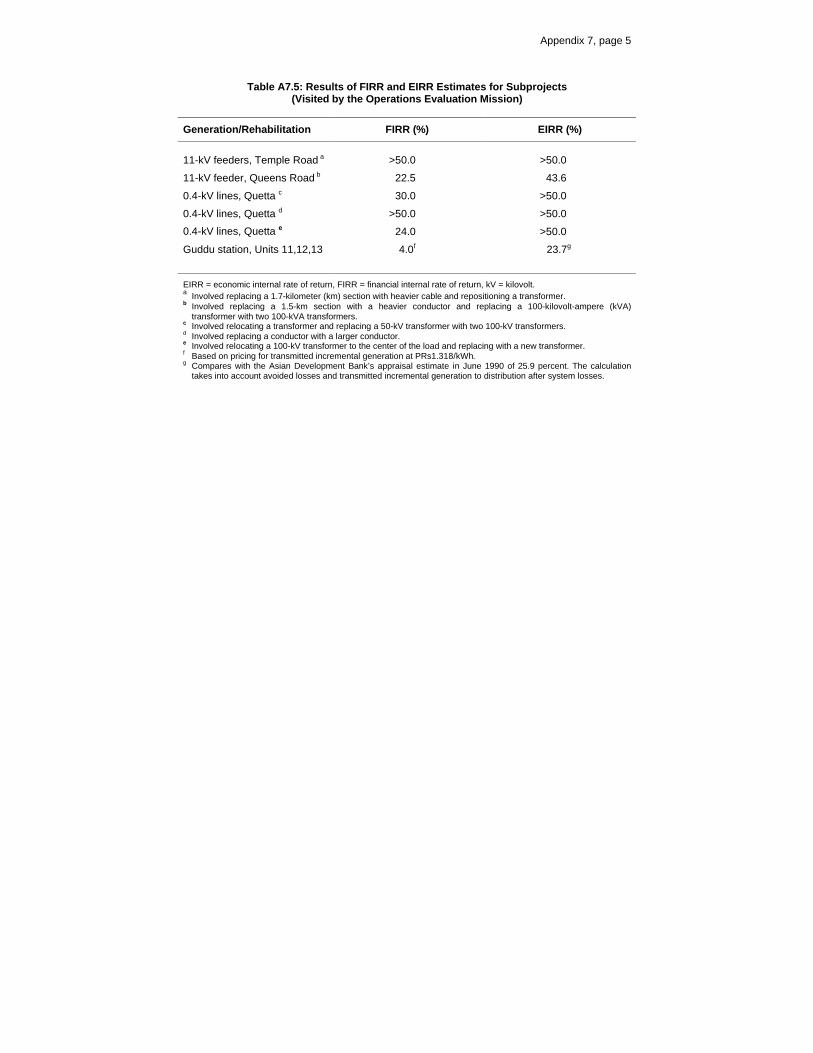
Appendix 7, page 5
Table A7.5: Results of FIRR and EIRR Estimates for Subprojects
(Visited by the Operations Evaluation Mission)
Generation/Rehabilitation FIRR (%) EIRR (%)
11-kV feeders, Temple Road a
>50.0
>50.0
11-kV feeder, Queens Road b 22.5 43.6
0.4-kV lines, Quetta c 30.0 >50.0
0.4-kV lines, Quetta d >50.0 >50.0
0.4-kV lines, Quetta e 24.0 >50.0
Guddu station, Units 11,12,13 4.0f 23.7g
EIRR = economic internal rate of return, FIRR = financial internal rate of return, kV = kilovolt. a Involved replacing a 1.7-kilometer (km) section with heavier cable and repositioning a transformer. b Involved replacing a 1.5-km section with a heavier conductor and replacing a 100-kilovolt-ampere (kVA)
transformer with two 100-kVA transformers. c Involved relocating a transformer and replacing a 50-kV transformer with two 100-kV transformers. d Involved replacing a conductor with a larger conductor. e Involved relocating a 100-kV transformer to the center of the load and replacing with a new transformer. f Based on pricing for transmitted incremental generation at PRs1.318/kWh. g Compares with the Asian Development Bank’s appraisal estimate in June 1990 of 25.9 percent. The calculation
takes into account avoided losses and transmitted incremental generation to distribution after system losses.