Embed Size (px)
Citation preview
Power System Issues for Bulk Wind Generation: Status and Needs
Robert ZavadilVice President & Principal Consultant
EnerNex Corporation448 N. Cedar Bluff Road
Suite 349Knoxville, TN 37923Tel: (865) [email protected]
Stanford GCEP Energy WorkshopApril 26, 2004
Frances C. Arrillaga Alumni Center, Stanford University
Development of Large Scale Wind Generation in the U.S.
Confined to California until mid 1990’sLarge plants now operating in many control areas
Great Plains (MN, IA)TexasPacific Northwest
Changing “utility” perspectivesInstalled capacity forecast to grow significantlyInfluence on behavior of grid can no longer be ignoredSystem-level impacts will likely need to be addressed as wind capacity increases
Power industry evolution creates turbulent backdropCompetitive marketsNew organizations and alliancesNew business practices“New” emphasis on reliability
Fundamental Power System Engineering Challenges
Wind generation technology is novel relative to conventional generating equipment and systemsWind generation is an energy resource in a capacityworldExperience with wind generation is nonexistent compared with conventional resources

Engineering Practice for Large Power Systems
Based on computer tools and computational techniques for “predicting” performance and behavior – no “plug and play”Methods require appropriate characterization of each system element – generators, loads, transmission, etc.Experience also critical to understanding what system states are of most interest (what to study)
Major Categories of Power System Studies
InterconnectionPlanningForensicSpecial

Present FocusInterconnection Evaluations
Mandated for connection of any new element to gridMust evaluate:
- Voltage control / reactive power management- Thermal considerations / equipment ratings- Short-circuit behavior- Large-signal dynamic behavior- Reliability / security
Integration StudiesIncreasing concern as wind generation capacity in a given control area growsFocuses on the normal operation of the system
- Voltage regulation and frequency control- Short-term system planning and scheduling- Transmission utilization and congestion issues- Influence on overall production cost- Ancillary services - Market influences and impacts
Modeling Challenges for Wind Generation
Uneasy “fit” with conventional toolsinduction machines rather than synchronous generators “novel” control technology – e.g. flux-vector control of induction machinesUnfamiliar mechanical system & prime moverMany small generators vs. few large generatorsExpansive plant electrical system
Unique operational characteristicsNot dispatchableMore difficult to identify appropriate “states” to be analyzed
Interconnection Challenges for Wind Generation
Remote facilitiesTypically interconnection to weak transmission networkDesigns can be challenging
Reactive power managementCritical for controlling voltageDynamic character of wind generation Reactive power planning for network must be coordinated with wind plants
Interconnection requirements are evolvingWere typically very simpleEvolving to voltage control, dynamic reactive power management

Wind Plant Interconnect BusVoltageas function of P and Q for Weak Network
1.10 pu
1.05 pu
1.00 pu

Evolving Interconnection Requirements are driving Wind Technology Development
More robust turbine designsLow-voltage ride-throughMore desirable dynamic response characteristics
Better wind plant designsPlant-level planning of reactive compensationInterconnection bus behavior within specsImproved medium-voltage collector system design
Ongoing needsValidated modelsNew modelsExperience
ERCOT Dynamic Model Development
Urgent need in wind and power industries for modelsERCOT took industry lead in addressing issueLaunched 12-month effort to develop and validate dynamic windplantmodels for PSS/E platformProject began late July, 2002Monitoring effort included to provide field data for validating modelsPSS/E user models delivered September, 2003

Ed
L5 L3 L1
L4L6L2
L3
L6
G3 G5
G2G6G4
L1
L4
0.001
0.001
0.001
L5
L2G
3G
5G
4G
1
Ila
Ilb
Ilc
G6
G2
IarIcr
DC
BK
SB
RK
2500
0.0
DC
BK
0.01
Id
Iar
Ibr
Icr
wm
G12
G12
G5
2S6
2G2
2S4
2G3
SBRK
Ias
Ibs
Ics
A
B
C
BR
K2
BRK3BRK2
A
B
C
0.005
0.005
0.005
Vrab
Vrbc
TimedBreaker
LogicClosed@t0
Vrbc
Vrab
BRK3
A
B
CTimed
BreakerLogic
Closed@t0
*-1.0
Td IbrIar
Modulatorw/
Interpolation
I1cmd
I2cmd
I1act
I2act
S1
S2
S3
S4
S5
S6
wmTd
TE
TorqueComputer
wm
TactTd
TL N
C
A
BI M
b c
Te
W a
Mul
timas
s
TeW
pu( I
ndM
/c)
TLConverterControl
Ias
Ics
Icr
In1
In2
Iard
Ibrd
Icrd
IarGen-Side
RPM
GE Wind 1.5 MW –PSCAD/EMTDC Model
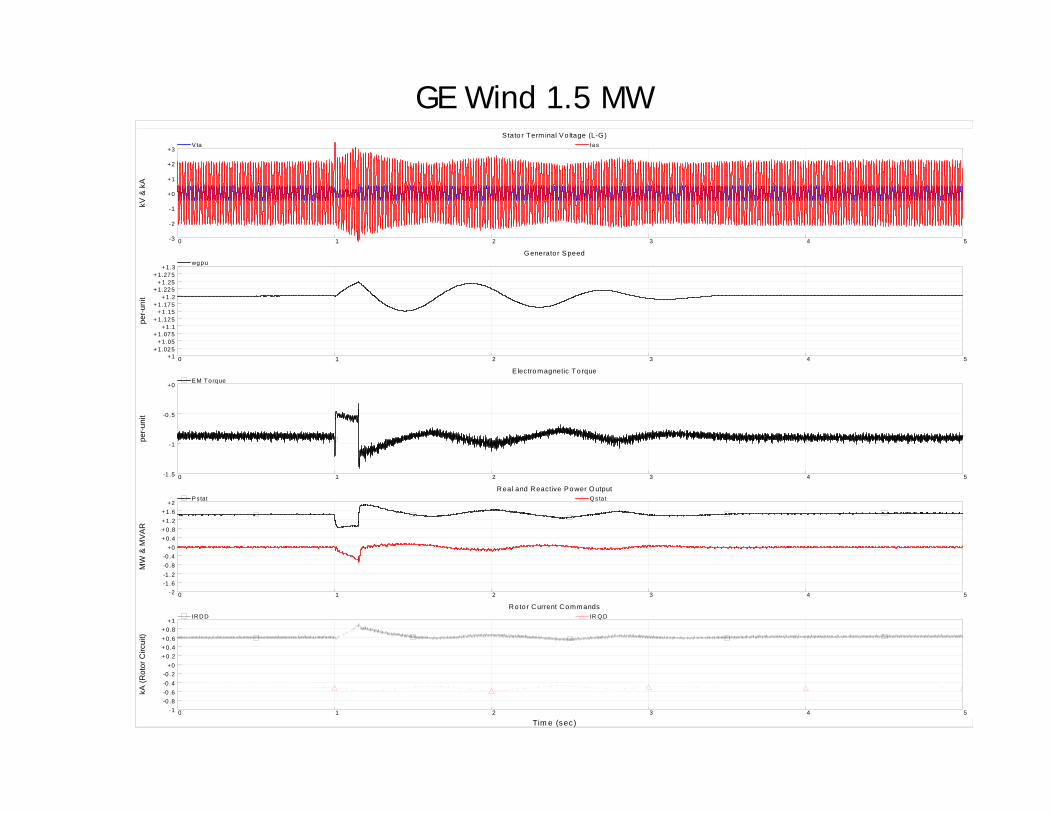
Tim e (sec)
S tato r Term inal V o ltage (L-G)
0 1 2 3 4 5
kV &
kA
-3
-2
-1
+0
+1
+2
+3V ta Ias
Generato r S peed
0 1 2 3 4 5
per-u
nit
+1+ 1 .025
+ 1.05+ 1 .075
+ 1.1+ 1 .125
+ 1.15+ 1 .175
+ 1.2+ 1 .225
+ 1.25+ 1 .275
+ 1.3wgpu
E lectro magnetic T o rque
0 1 2 3 4 5
per-u
nit
-1 .5
-1
-0 .5
+0EM Torque
Real and Reactive Power Output
0 1 2 3 4 5
MW
& M
VA
R
-2-1 .6-1 .2-0 .8-0 .4 +0
+ 0 .4+ 0 .8+ 1 .2+ 1 .6 +2
Pstat Q sta t
Ro to r Current Commands
0 1 2 3 4 5
kA (R
otor
Circ
uit)
-1-0 .8-0 .6-0 .4-0 .2 +0
+ 0 .2+ 0 .4+ 0 .6+ 0 .8 +1
IR DD IR Q D
GE Wind 1.5 MW

Time (sec)
Mechanical Torque
0 1 2 3 4 5
per u
nit
+0
+0.2
+0.4
+0.6
+0.8
+1Tmech
Blade Pitch
0 1 2 3 4 5
degr
ees
-1
+9
+19
+29
+39
+49beta betastar PitchComp
Lambda (Tip-Speed Ratio)
0 1 2 3 4 5 +0
+2.4
+4.8
+7.2
+9.6
+12lambda
Speed Error and Cp
0 1 2 3 4 5-0.1
+0
+0.1
+0.2
+0.3
+0.4Cp werr
GE Wind 1.5 MW (cont.)

Time (sec)
Real Power Generation
0 1 2 3 4 5
MV
AR
+2.5
+2.75
+3
+3.25
+3.5
+3.75
+4
+4.25
+4.5
+4.75
+5Pstat
Rotor Speed
0 1 2 3 4 5
per-unit
+1.15
+1.16
+1.17
+1.18
+1.19
+1.2
+1.21
+1.22
+1.23
+1.24
+1.25wgpu
Time (sec)
Terminal Voltage
0 1 2 3 4 5
per unit
+0.5
+0.6
+0.7
+0.8
+0.9
+1
+1.1
+1.2
+1.3
+1.4
+1.5Vrms
Reactive Power Generation
0 1 2 3 4 5
MV
AR
-1
-0.5
+0
+0.5
+1
+1.5
+2
+2.5
+3
+3.5
+4Qstat


Interconnection SummaryEarly plants experienced start-up problems due to inadequate facility and interconnect designLessons learned are being incorporated into new plant designsSignificant challenges and needs remain:
Better characterization of wind turbine and plant performancePlant and turbine modeling for power system studies not well developedModels and assumptions for wind generation require validationPower system engineering practice for wind plant design is stillrelatively immature
AssessmentPlaying “catch upMaking progress
Energy vs. Capacity
Engineering evaluations biased toward capacityDesign for peak conditionsVoltage can be related directly to power, not energyTransmission capacity
System operators deal with “MW for the hour” not MWHSystem security and reliability linked more closely to capacityShort-term operations planning and scheduling, market mechanisms utilize predictions and forecasts
Wind generation is the ultimate “as-available” generating resource
Forecast power production vs. time can only be done approximatelySubstantial amounts of as-available or non-dispatchable resources are a poor fit with tools and analytical methods for power system operation

0
5 0
1 0 0
1 5 0
2 0 0
2 5 0
1 / 1 / 0 0 0 : 0 0 1 /8 / 0 0 0 : 0 0 1 / 1 5 /0 0 0 :0 0 1 / 2 2 /0 0 0 :0 0 1 / 2 9 /0 0 0 : 0 0
0
5 0
1 0 0
1 5 0
2 0 0
2 5 0
2 / 1 / 0 0 0 : 0 0 2 / 8 /0 0 0 : 0 0 2 / 1 5 / 0 0 0 :0 0 2 /2 2 / 0 0 0 : 0 0 2 / 2 9 / 0 0 0 : 0 0
0
5 0
1 0 0
1 5 0
2 0 0
2 5 0
1 2 / 1 / 0 0 0 : 0 0 1 2 / 8 /0 0 0 : 0 0 1 2 /1 5 / 0 0 0 : 0 0 1 2 /2 2 / 0 0 0 : 0 0 1 2 /2 9 / 0 0 0 : 0 0
Winter 2000 Actual Hourly Wind Generation
0
0.02
0.04
0.06
0.08
0.1
0.12
0.14
-3.0
5E+0
7
-2.5
5E+0
7
-2.0
5E+0
7
-1.5
5E+0
7
-1.0
5E+0
7
-5.5
0E+0
6
-5.0
0E+0
5
4.50
E+0
6
9.50
E+0
6
1.45
E+0
7
1.95
E+0
7
2.45
E+0
7
2.95
E+0
7
Watts
Freq
uenc
y
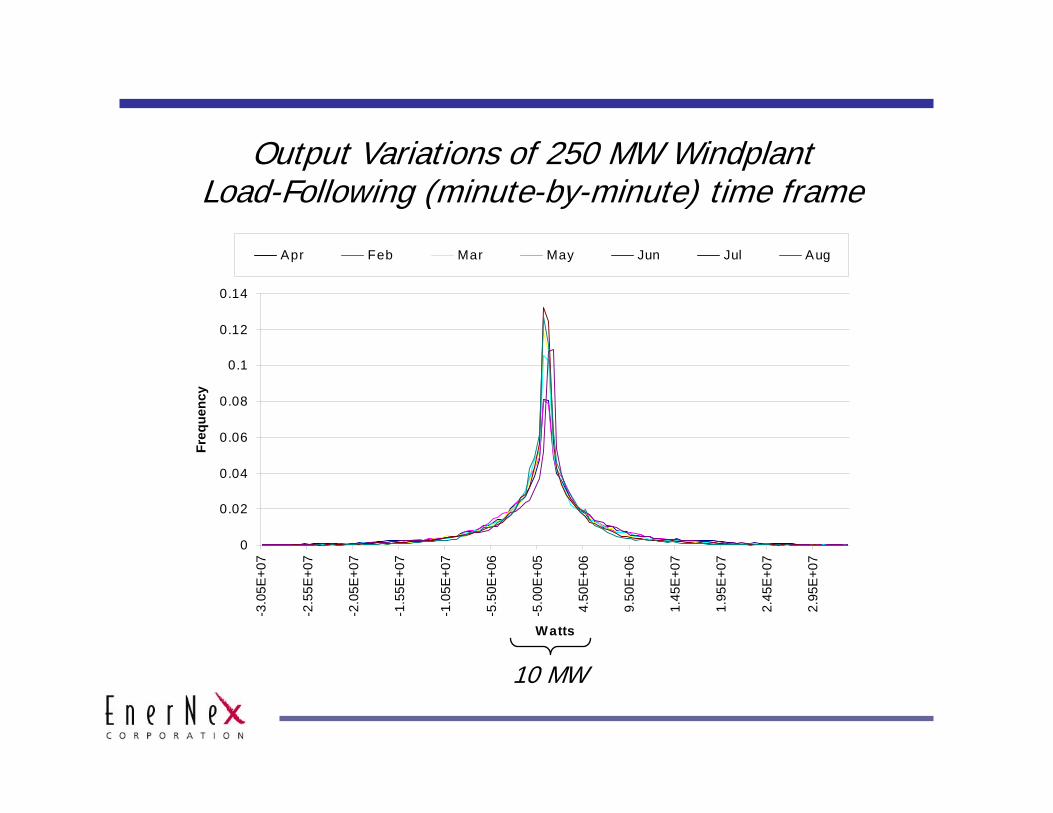
Apr Feb Mar May Jun Jul Aug
Output Variations of 250 MW WindplantLoad-Following (minute-by-minute) time frame
10 MW

Wind Generation Integration
Definition: Quantifying the affects of the unique characteristics of wind generation on the rest of the system, marketsIssue is increasing in importance
Level of concern proportional to installed wind capacity/control area capacityEvolving power markets add more complexity
Multiple studies conducted, underway“screening” assessments related to RPS-driven wind generation procurementsSome analytical studiesMarket-based assessments

Status: Large-Scale Grid-Connected Wind Generation
Efforts focused on fitting wind generation into existing practice and methodologies
Real-time operationsShort-term planning, scheduling, and optimizationLonger-term capacity valuation
Industry transition and conventional practice dictate current perspectives on wind energy
Reliability and security assessmentEvolution of market-mechanisms
Long-term BarriersTransmission – moving large amounts of energy long distancesOperations – creating structures and mechanisms that accommodate energy sources

Grid Integration Opportunities
TransmissionMaximizing utilization of existing gridAdvanced technologies - FACTS, HVDC, higher-phase order (e.g. six-phase)
OperationsUtilizing advanced technologies like forecastingSophisticated systems for real-time operationsNew methodologies for short-term planning and scheduling
Storage