Embed Size (px)
Citation preview

POTENTIAL NEW USES FOR POTENTIAL NEW USES FOR OLD GAS FIELDS: OLD GAS FIELDS:
SEQUESTRATION OF SEQUESTRATION OF CARBON DIOXIDECARBON DIOXIDE
Paul R. KnoxSusan D. Hovorka
Bureau of Economic GeologyJackson School of GeosciencesThe University of Texas at Austin
Curtis M. OldenburgLawrence Berkeley National Laboratory

AGENDAAGENDA
• Overview of sequestration issues
• Application in oil and gas fields
• Enhanced gas recovery
• Pressure maintenance
• Wet intervals
• Summary
BureauofEconomic
Geology

GLOBAL CLIMATE CHANGE GLOBAL CLIMATE CHANGE INITIATIVEINITIATIVE
• “Today, I’m announcing a new environmental approach . . .”
• “We must foster economic growth in ways that protect our environment”
• “. . . set path to slow GHG emissions, and as science justifies - stop and then reverse that growth”
President BushFebruary 14, 2002
Compliments of H.D. Guthrie, NETL, DOE
BureauofEconomic
Geology

GCCI PATHWAY TO 2012:GCCI PATHWAY TO 2012:
120
140
160
180
200
2000 2004 2008 2012
1800
2200
2600
3000
3400
Gre
enh
ou
se G
as I
nte
nsi
ty (T
C/$
MM
GD
P)
Gre
enh
ou
se G
as E
mis
sio
ns
(MM
TC
E)
GCCI
EIA Reference Case
150 MMTCE Gapin 2012
18% REDUCTION IN GHG INTENSITY
Compliments of S.M. Klara, NETL, DOE

THE OPTIONSTHE OPTIONS
Reduce CarbonIntensity
Sequester
Energy efficiency
New technology
Fuel choice
Stop leaks, flares
Venting
Disposal Value-Added
Saline aquifers
Deep oceans
Biomass
EOR
EGR
ECBM
BureauofEconomic
Geology

ECONOMIC REALITIESECONOMIC REALITIES
• Early sequestration will be in value-added settings, where geographically available
• Gas fields: distributed volumes where subsurface is well-known
• Gulf Coast represents a combination of many CO2 sources and high-injectivity intervals
• Pipeline networks provide deliverability• Mechanisms to address emissions credits are in
the planning stages• Major oil companies have demonstrated
significant interest in geologic sequestrationBureauofEconomic
Geology
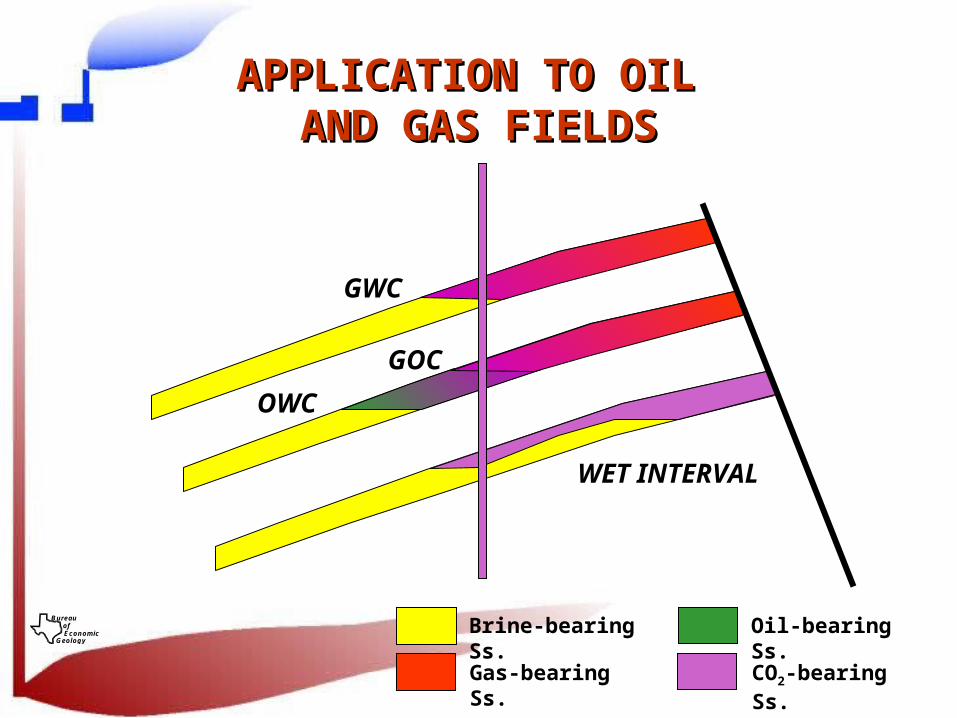
APPLICATION TO OIL APPLICATION TO OIL AND GAS FIELDSAND GAS FIELDS
GWC
GOC
OWC
WET INTERVAL
Brine-bearing Ss.
Gas-bearing Ss.
Oil-bearing Ss.
CO2-bearing Ss.
BureauofEconomic
Geology
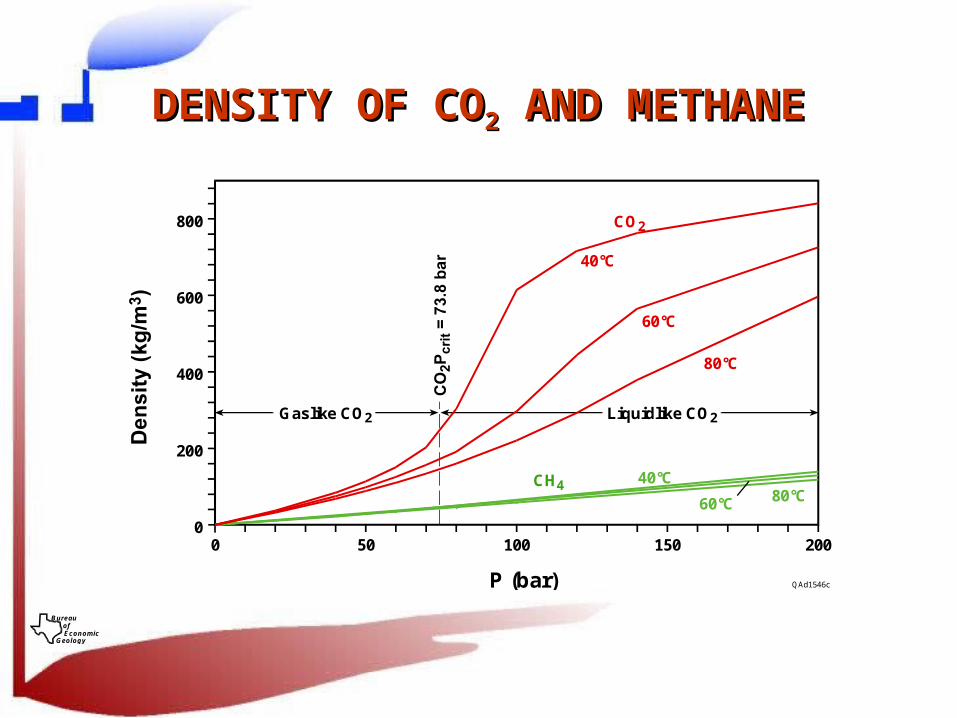
DENSITY OF CODENSITY OF CO22 AND METHANE AND METHANE
BureauofEconomic
Geology
P (bar)
0 50 100 150 200
800
600
400
200
0
Gaslike CO2 Liquidlike CO2
60°C
80°C
80°C60°C
40°C
40°C
CO2
QAd1546c
CH4

VISCOSITY OF COVISCOSITY OF CO22 AND METHANE AND METHANE
QAd1547cP (bar)
60°C
40°C
80°C
60°C
80°C
40°C
CO27.0E-05
6.0E-05
5.0E-05
4.0E-05
3.0E-05
2.0E-05 CH4
0 50 100 150 200
BureauofEconomic
Geology

AGENDAAGENDA
• Overview of sequestration issues
• Application in oil and gas fields
• Enhanced gas recovery
• Pressure maintenance
• Wet intervals
• Summary
BureauofEconomic
Geology

MODEL SET-UPMODEL SET-UP
CO2 injection
CH4 production
Gas reservoir
Water table
BureauofEconomic
Geology
QAd1548c
6600 m100 m
Scenario I – No production during CO2 injectionScenario II – Production rate offsetting injection rate

MODEL RUNSMODEL RUNS
BureauofEconomic
Geology
Scenario II

PRESSURE AND GAS FRACTIONPRESSURE AND GAS FRACTION
BureauofEconomic
Geology
1
0.9
0.8
0.7
0.6
0.5
130
120
110
100
90
80
70
60
50
40
30
Year
1940 1950 1960 1970 1980 1990 2000 2010
III
II
IP
Historical CH4 production
CH4Xgas
QAd1550c
Scenario I – No production during CO2 injectionScenario II – Production rate offsetting injection rate

INCREMENTAL PRODUCTIONINCREMENTAL PRODUCTION
BureauofEconomic
Geology
1950 1960 1970 1980 1990 2000 20202010
Historical production period Projected
1.5E+08
1E+08
5E+07
0
Year
II
I
No CSEGR
Q Ad1 551 cScenario I – No production during CO2 injectionScenario II – Production rate offsetting injection rate
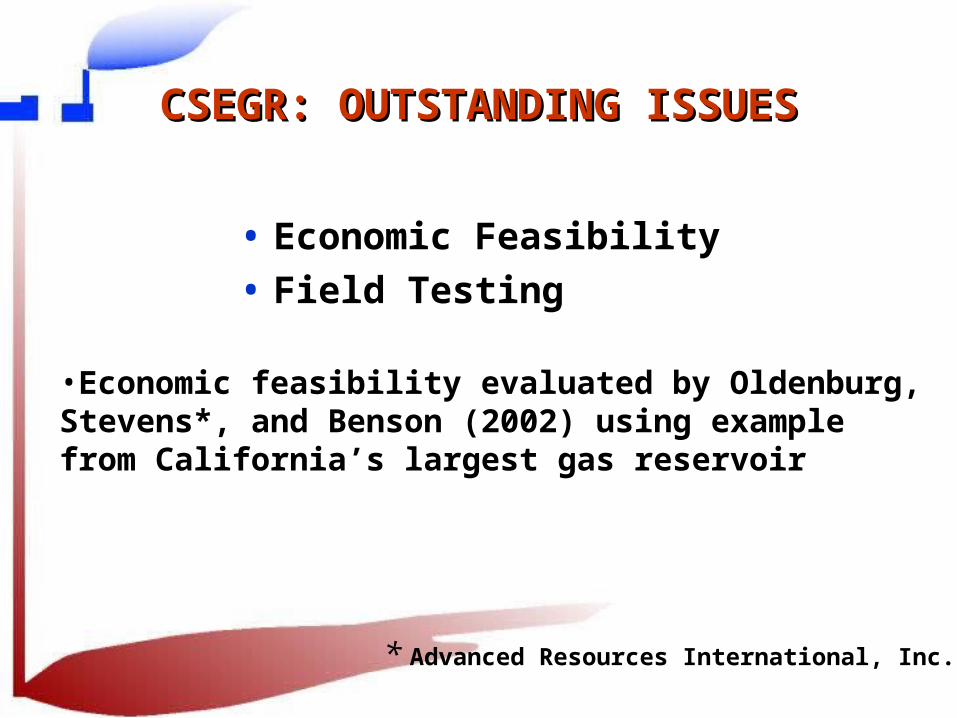
CSEGR: OUTSTANDING ISSUESCSEGR: OUTSTANDING ISSUES
• Economic Feasibility
• Field Testing
•Economic feasibility evaluated by Oldenburg, Stevens*, and Benson (2002) using example from California’s largest gas reservoir
* Advanced Resources International, Inc.

ECONOMIC PARAMETERSECONOMIC PARAMETERS
• Interval is high-porosity, high-permeability sandstone at 5,000 ft depth (Rio Vista field)
• 25 injectors (125 MMcfd, 6,500 tons/d)• 18 producers (peak 45 – 90 MMcfd)• 8 monitor wells• 15 years duration• Costs included mix of new and recompleted
wells, pipelines• Produced gas CO2 content:1-5 yrs = 0%, 5-10 yrs
= 5%, 10-15 yrs = 25%
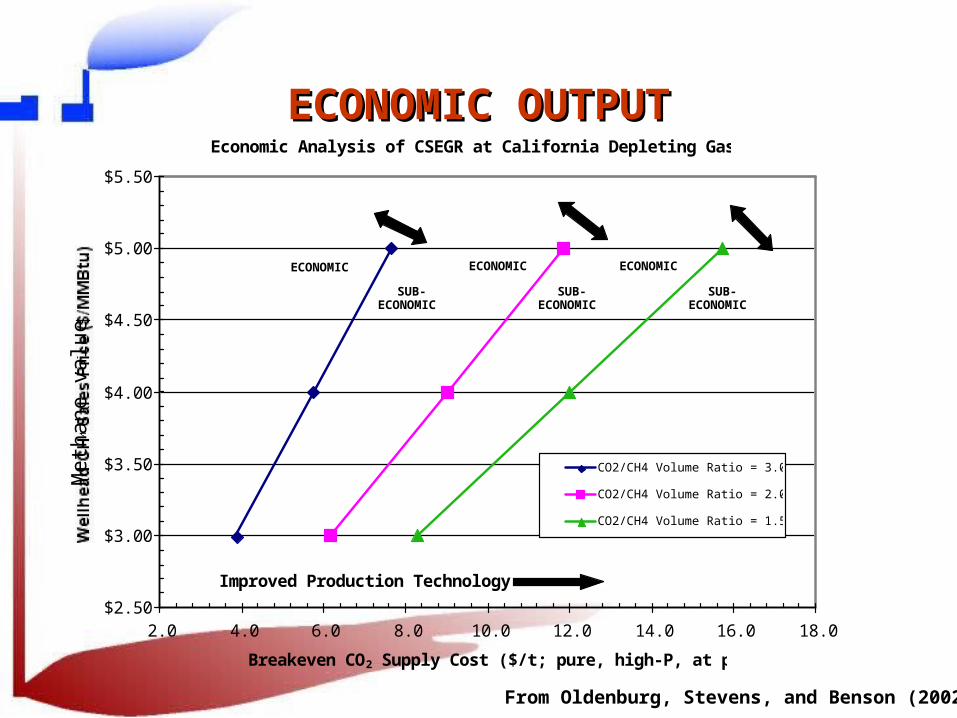
ECONOMIC OUTPUTECONOMIC OUTPUTEconomic Analysis of CSEGR at California Depleting Gas Field
$2.50
$3.00
$3.50
$4.00
$4.50
$5.00
$5.50
2.0 4.0 6.0 8.0 10.0 12.0 14.0 16.0 18.0
Breakeven CO2 Supply Cost ($/t; pure, high-P, at pipeline)
CO2/CH4 Volume Ratio = 3.0
CO2/CH4 Volume Ratio = 2.0
CO2/CH4 Volume Ratio = 1.5
ECONOMIC
SUB-ECONOMIC
ECONOMIC
SUB-ECONOMIC
SUB-ECONOMIC
ECONOMIC
Improved Production Technology
Met
hane
val
ue
From Oldenburg, Stevens, and Benson (2002)

BOTTOM LINEBOTTOM LINE
• For CO2/CH4 volume ratio = 1.5, need CO2 cost ~ $10/t.
• Economics are sensitive to physical processes, specifically
CO2/CH4 volume ratio, mixing, and breakthrough times.
• Economic feasibility will be reservoir-specific.
• Overall conclusion is that CSEGR will require subsidy under
current conditions, but that increases in CH4 price or
decreases in CO2 supply costs can make CSEGR profitable at a
field like Rio Vista.
• Field demonstration project essential to realistic assessment
in the Gulf Coast
AGENDAAGENDA
• Overview of sequestration issues
• Application in oil and gas fields
• Enhanced gas recovery
• Pressure maintenance
• Wet intervals
• Summary
BureauofEconomic
Geology
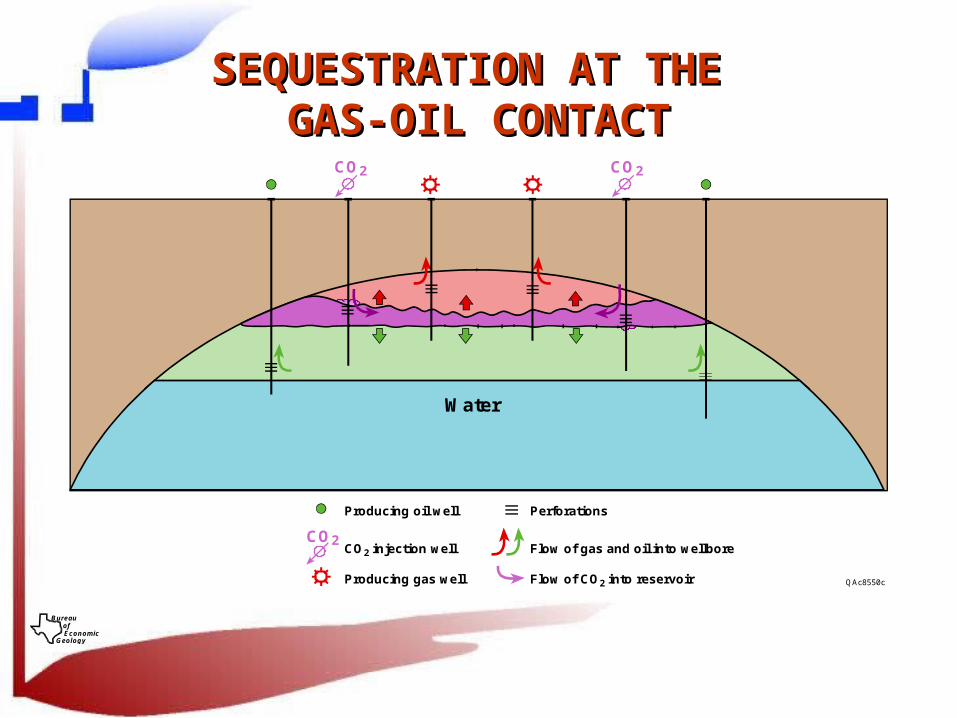
SEQUESTRATION AT THE SEQUESTRATION AT THE GAS-OIL CONTACTGAS-OIL CONTACT
BureauofEconomic
Geology
Water
CO2Flow of gas and oil into wellbore
Flow of CO2 into reservoir
Perforations
Producing gas well
Producing oil well
CO2 injection well
QAc8550c
CO2 CO2
AGENDAAGENDA
• Overview of sequestration issues
• Application in oil and gas fields
• Enhanced gas recovery
• Pressure maintenance
• Wet intervals
• Summary
BureauofEconomic
Geology
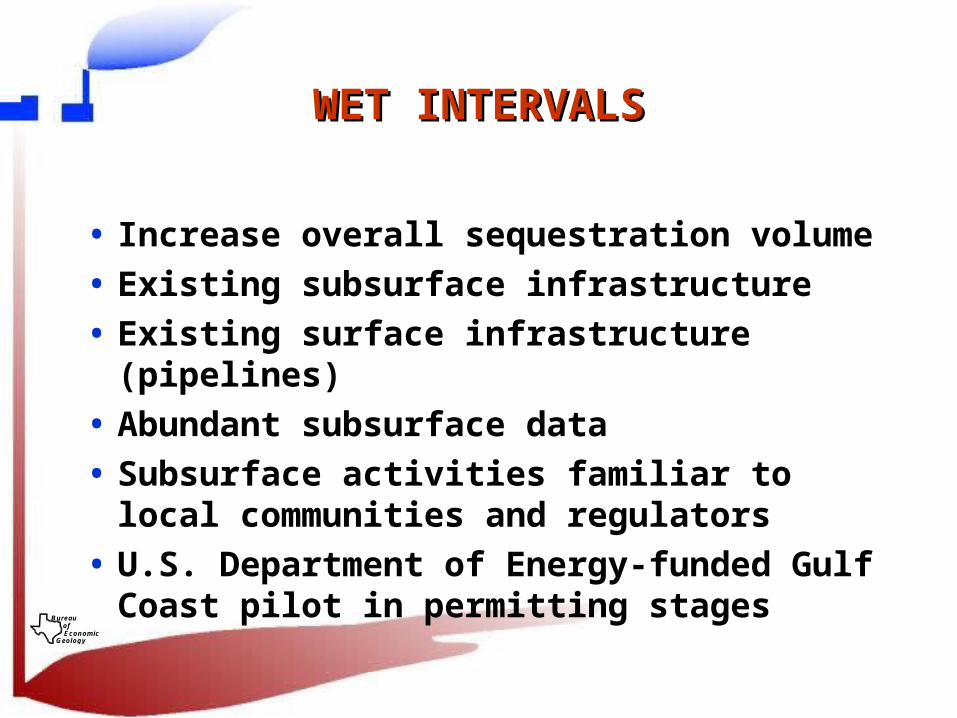
WET INTERVALSWET INTERVALS
• Increase overall sequestration volume
• Existing subsurface infrastructure
• Existing surface infrastructure (pipelines)
• Abundant subsurface data
• Subsurface activities familiar to local communities and regulators
• U.S. Department of Energy-funded Gulf Coast pilot in permitting stages
BureauofEconomic
Geology

BRINE PILOTBRINE PILOT
• Purpose: demonstrate feasibility and monitoring techniques, evaluate model predictions
• Setting: salt dome flank, Frio sandstone, 5,000 ft depth.
• Scope: < 5,000 tonnes (90 MMcf) over 20 days of injection
• Monitoring: tracers, pressure and temperature, logs, seismic
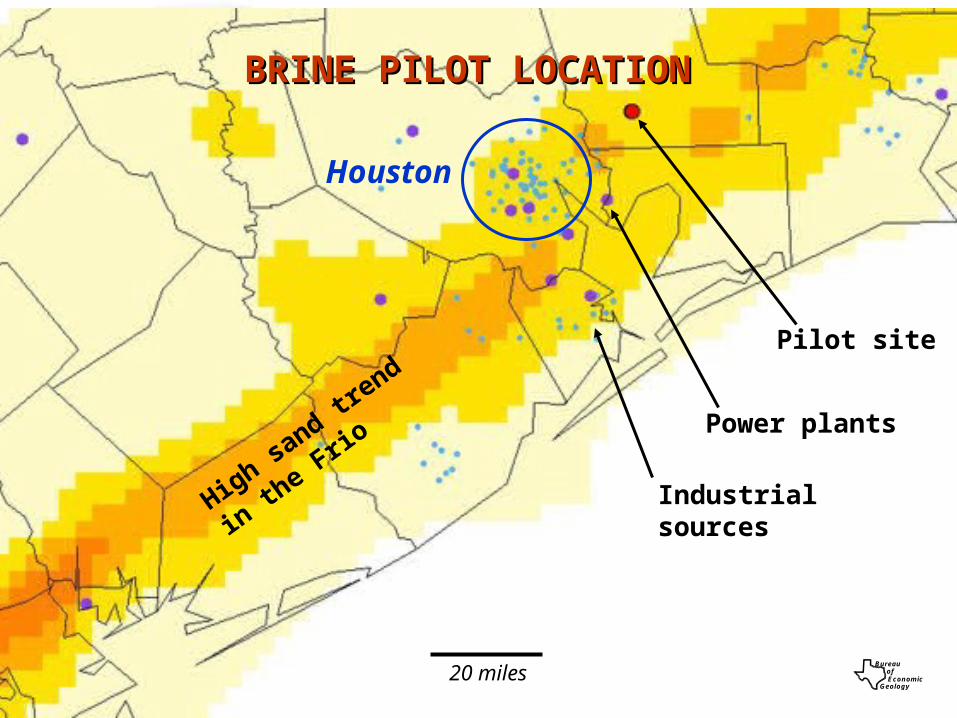
Power plants
Industrial sourcesHigh sand trend
in the Frio
Houston
20 milesBureau
ofEconomic
Geology
BRINE PILOT LOCATIONBRINE PILOT LOCATION
Pilot site
CONCLUSIONSCONCLUSIONS
• Preparations are being made in the event that geologic sequestration becomes necessary
• Sequestration can substantially enhance production from mature gas reservoirs and is economic with low-cost CO2 supplies
• Sequestration seems a logical option to maintain reservoir pressure and facilitate simultaneous oil and gas production
• Sequestration has the potential to extend field life, increase ultimate recoveries, increase production rates, and add new revenue streams to mature fields.
BureauofEconomic
Geology
ACKNOWLEDGEMENTSACKNOWLEDGEMENTS
This work was supported in part by the
Assistant Secretary for Fossil Energy,
Office of Coal and Power Systems through the
National Energy Technology Laboratory, and by
Lawrence Berkeley National Laboratory under
Department of Energy
Contracts No. DE-AC03-76SF00098 and
No. DE-AC26-98FT40417