Embed Size (px)
Citation preview
CM03 - Model homework
1
Post-tensioned prestressed concrete bridge - assignment
Design a post-tensioned prestressed concrete bridge of a three-span arrangement. The
construction is prestressed at the age of 7 days and put into operation at the age of 100 days. The
durability is expected to be 100 years. The structure is loaded by the dead load g0 + gadd and live
load q.
Individually assigned input parameters are:
L [m] length of the middle span
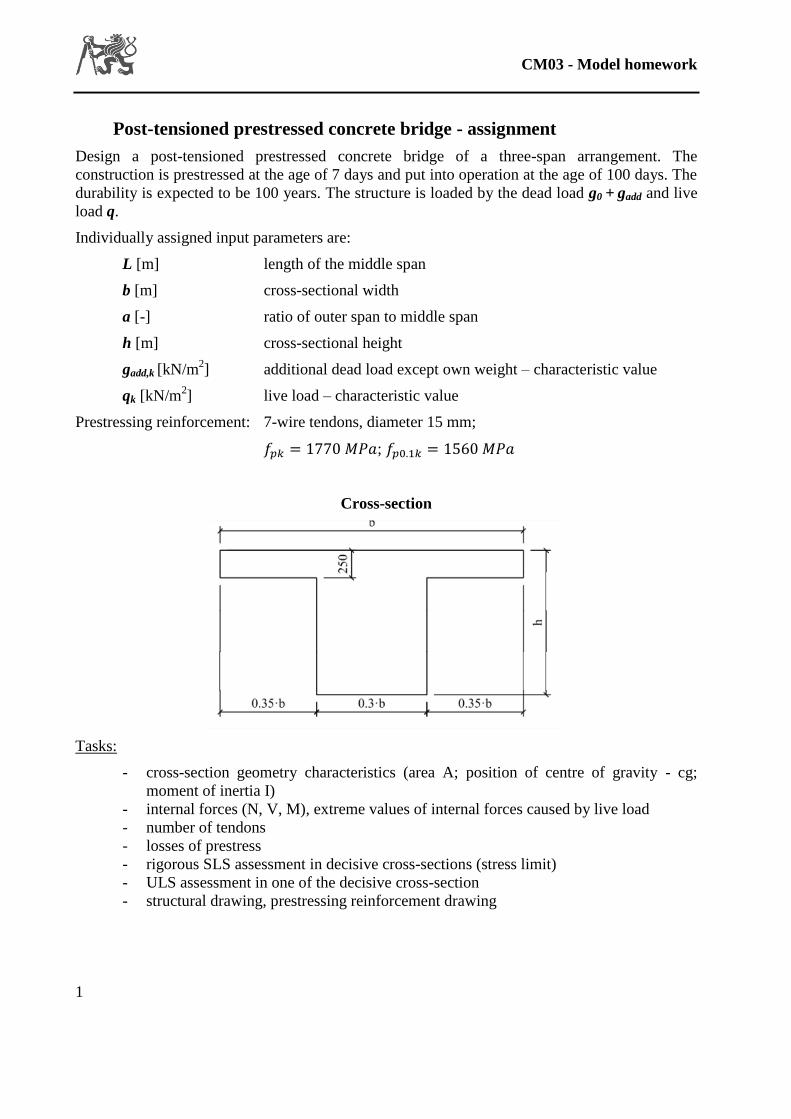
b [m] cross-sectional width
a [-] ratio of outer span to middle span
h [m] cross-sectional height
gadd,k [kN/m2] additional dead load except own weight – characteristic value
qk [kN/m2] live load – characteristic value
Prestressing reinforcement: 7-wire tendons, diameter 15 mm;
𝑓𝑝𝑘 = 1770 𝑀𝑃𝑎; 𝑓𝑝0.1𝑘 = 1560 𝑀𝑃𝑎
Cross-section
Tasks:
- cross-section geometry characteristics (area A; position of centre of gravity - cg;
moment of inertia I)
- internal forces (N, V, M), extreme values of internal forces caused by live load
- number of tendons
- losses of prestress
- rigorous SLS assessment in decisive cross-sections (stress limit)
- ULS assessment in one of the decisive cross-section
- structural drawing, prestressing reinforcement drawing
CM03 - Model homework
2
Following model homework uses model input parameters. In your homework, use your own
parameters obtained in the first lesson.
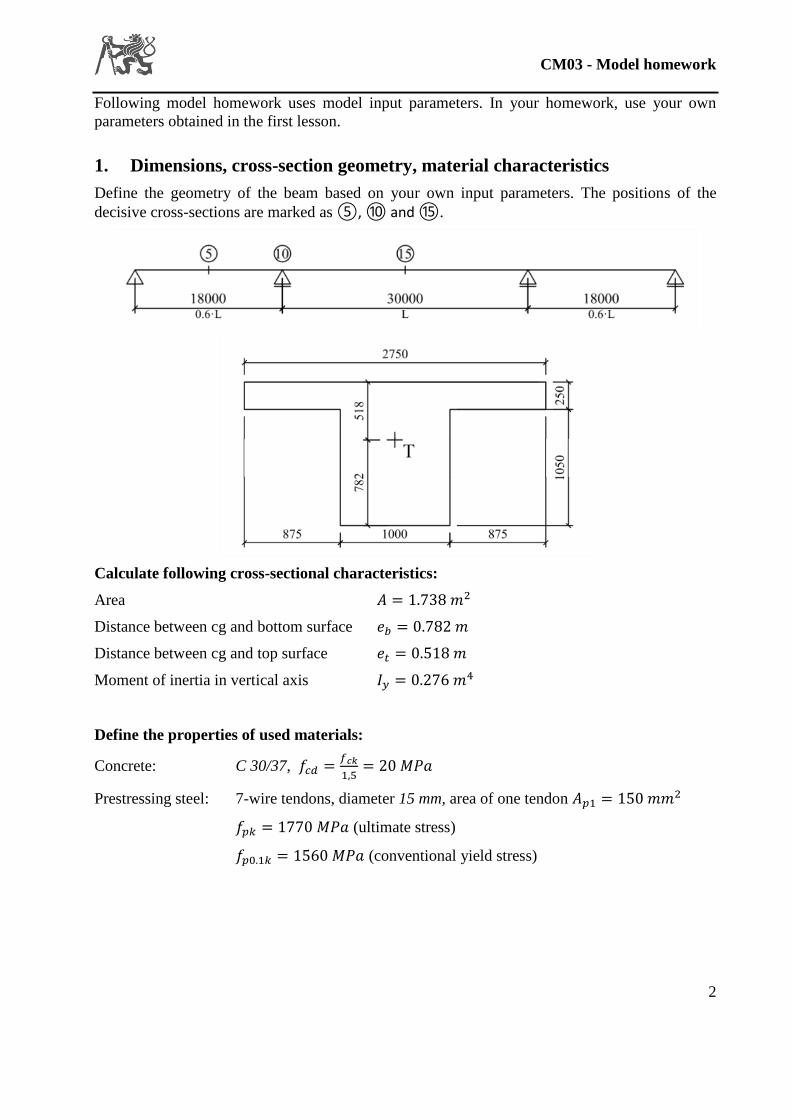
1. Dimensions, cross-section geometry, material characteristics
Define the geometry of the beam based on your own input parameters. The positions of the
decisive cross-sections are marked as ⑤, ⑩ and ⑮.
Calculate following cross-sectional characteristics:
Area 𝐴 = 1.738 𝑚2
Distance between cg and bottom surface 𝑒𝑏 = 0.782 𝑚
Distance between cg and top surface 𝑒𝑡 = 0.518 𝑚
Moment of inertia in vertical axis 𝐼𝑦 = 0.276 𝑚4
Define the properties of used materials:
Concrete: C 30/37, 𝑓𝑐𝑑 =𝑓𝑐𝑘
1,5= 20 𝑀𝑃𝑎
Prestressing steel: 7-wire tendons, diameter 15 mm, area of one tendon 𝐴𝑝1 = 150 𝑚𝑚2
𝑓𝑝𝑘 = 1770 𝑀𝑃𝑎 (ultimate stress)
𝑓𝑝0.1𝑘 = 1560 𝑀𝑃𝑎 (conventional yield stress)
CM03 - Model homework
3
2. Loading
Dead load gk [kN.m-1
] γf [-] gd [kN.m-1
]
Weight of structure g0 43.45 1.35 58.66
Other dead load g-g0 7.56 1.35 10.21
Total 51.01 - 68.87
Imposed load qk [kN.m-1
] γf [-] qd [kN.m-1
]
Live load q 16.5 1.5 24.75
Total 16.5 - 24.75
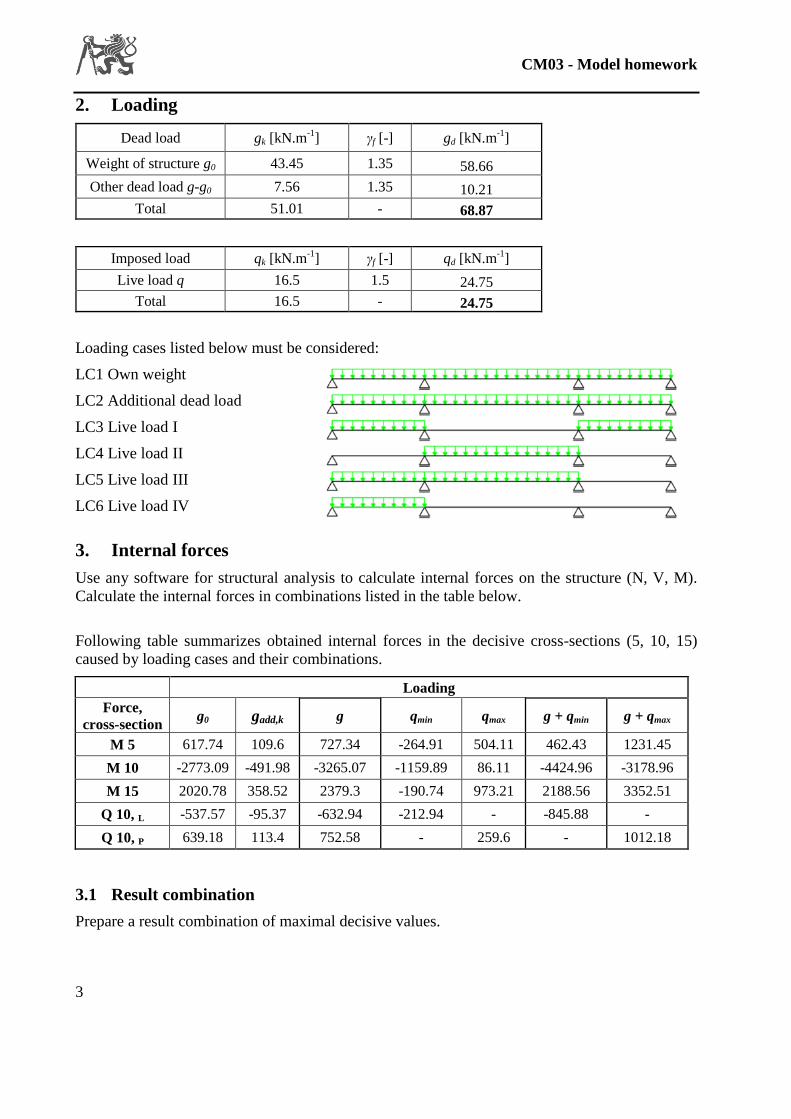
Loading cases listed below must be considered:
LC1 Own weight
LC2 Additional dead load
LC3 Live load I
LC4 Live load II
LC5 Live load III
LC6 Live load IV
3. Internal forces
Use any software for structural analysis to calculate internal forces on the structure (N, V, M).
Calculate the internal forces in combinations listed in the table below.
Following table summarizes obtained internal forces in the decisive cross-sections (5, 10, 15)
caused by loading cases and their combinations.
Loading
Force,
cross-section g0 gadd,k g qmin qmax g + qmin g + qmax
M 5 617.74 109.6 727.34 -264.91 504.11 462.43 1231.45
M 10 -2773.09 -491.98 -3265.07 -1159.89 86.11 -4424.96 -3178.96
M 15 2020.78 358.52 2379.3 -190.74 973.21 2188.56 3352.51
Q 10, L -537.57 -95.37 -632.94 -212.94 - -845.88 -
Q 10, P 639.18 113.4 752.58 - 259.6 - 1012.18
3.1 Result combination
Prepare a result combination of maximal decisive values.
CM03 - Model homework
4
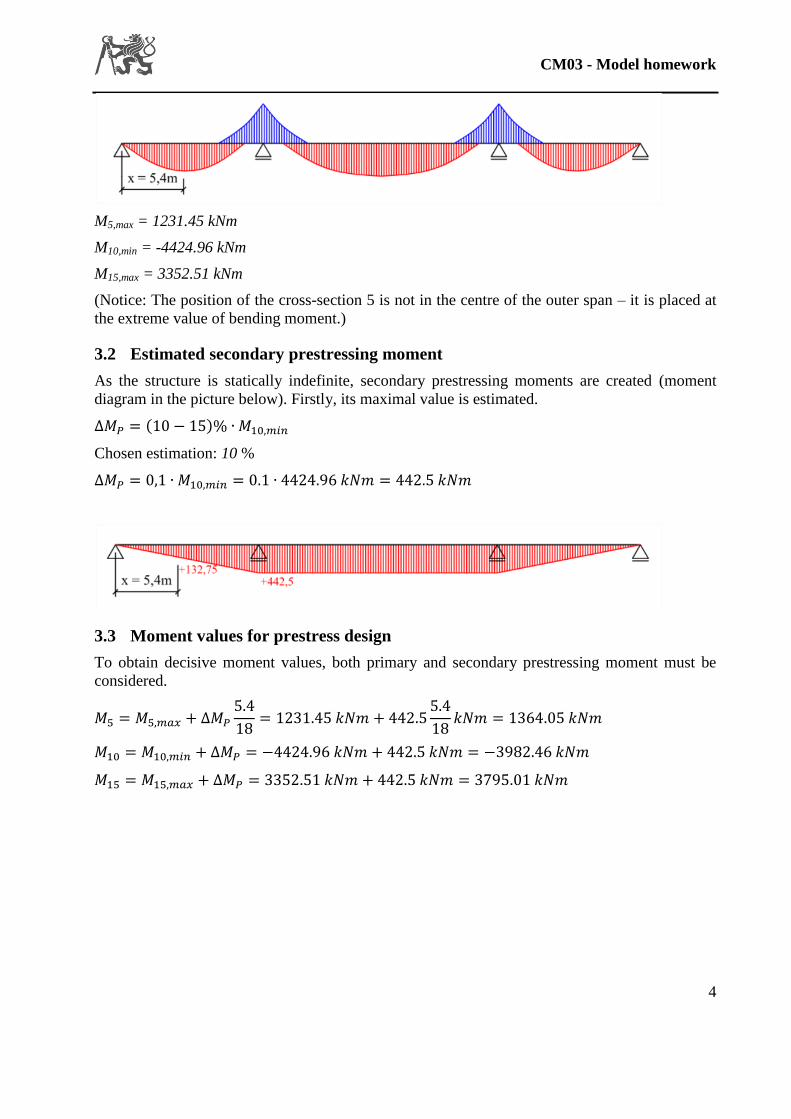
M5,max = 1231.45 kNm
M10,min = -4424.96 kNm
M15,max = 3352.51 kNm
(Notice: The position of the cross-section 5 is not in the centre of the outer span – it is placed at
the extreme value of bending moment.)
3.2 Estimated secondary prestressing moment
As the structure is statically indefinite, secondary prestressing moments are created (moment
diagram in the picture below). Firstly, its maximal value is estimated.
∆𝑀𝑃 = (10 − 15)% ∙ 𝑀10,𝑚𝑖𝑛
Chosen estimation: 10 %
∆𝑀𝑃 = 0,1 ∙ 𝑀10,𝑚𝑖𝑛 = 0.1 ∙ 4424.96 𝑘𝑁𝑚 = 442.5 𝑘𝑁𝑚
3.3 Moment values for prestress design
To obtain decisive moment values, both primary and secondary prestressing moment must be
considered.
𝑀5 = 𝑀5,𝑚𝑎𝑥 + ∆𝑀𝑃
5.4
18= 1231.45 𝑘𝑁𝑚 + 442.5
5.4
18𝑘𝑁𝑚 = 1364.05 𝑘𝑁𝑚
𝑀10 = 𝑀10,𝑚𝑖𝑛 + ∆𝑀𝑃 = −4424.96 𝑘𝑁𝑚 + 442.5 𝑘𝑁𝑚 = −3982.46 𝑘𝑁𝑚
𝑀15 = 𝑀15,𝑚𝑎𝑥 + ∆𝑀𝑃 = 3352.51 𝑘𝑁𝑚 + 442.5 𝑘𝑁𝑚 = 3795.01 𝑘𝑁𝑚
CM03 - Model homework
5
4. Tendon design (position, prestressing force)
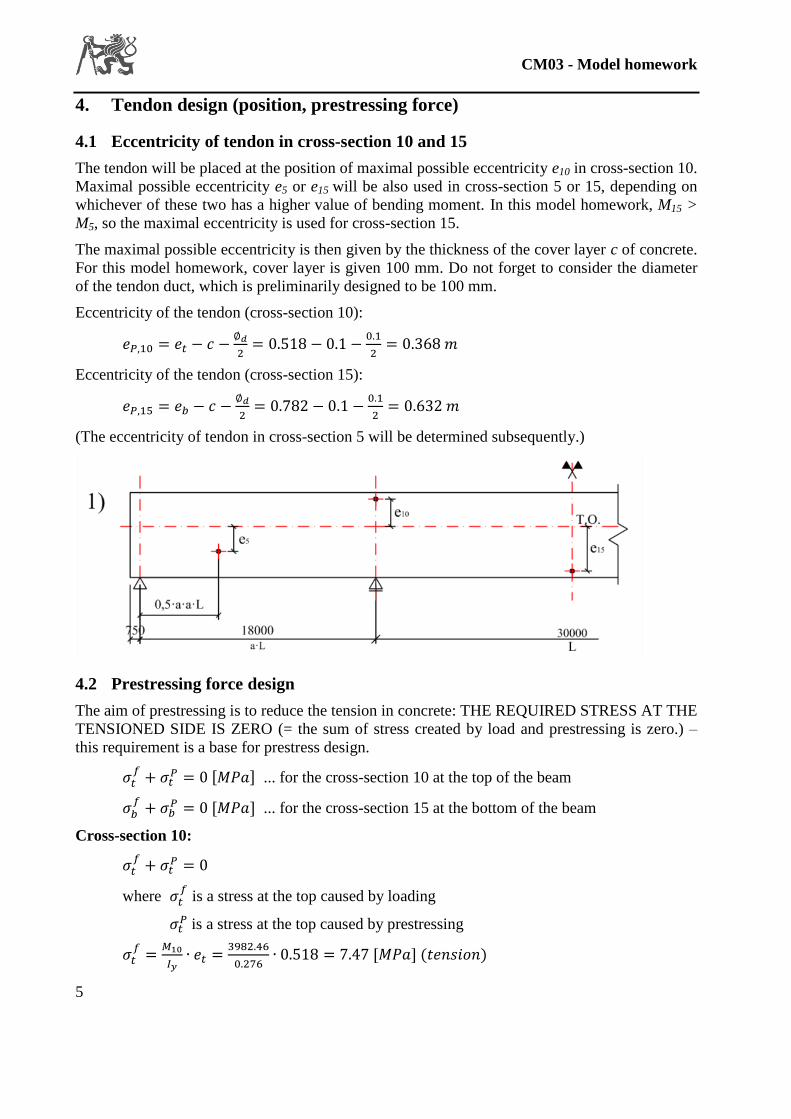
4.1 Eccentricity of tendon in cross-section 10 and 15
The tendon will be placed at the position of maximal possible eccentricity e10 in cross-section 10.
Maximal possible eccentricity e5 or e15 will be also used in cross-section 5 or 15, depending on
whichever of these two has a higher value of bending moment. In this model homework, M15 >
M5, so the maximal eccentricity is used for cross-section 15.
The maximal possible eccentricity is then given by the thickness of the cover layer c of concrete.
For this model homework, cover layer is given 100 mm. Do not forget to consider the diameter
of the tendon duct, which is preliminarily designed to be 100 mm.
Eccentricity of the tendon (cross-section 10):
𝑒𝑃,10 = 𝑒𝑡 − 𝑐 −∅𝑑
2= 0.518 − 0.1 −
0.1
2= 0.368 𝑚
Eccentricity of the tendon (cross-section 15):
𝑒𝑃,15 = 𝑒𝑏 − 𝑐 −∅𝑑
2= 0.782 − 0.1 −
0.1
2= 0.632 𝑚
(The eccentricity of tendon in cross-section 5 will be determined subsequently.)
4.2 Prestressing force design
The aim of prestressing is to reduce the tension in concrete: THE REQUIRED STRESS AT THE
TENSIONED SIDE IS ZERO (= the sum of stress created by load and prestressing is zero.) –
this requirement is a base for prestress design.
𝜎𝑡𝑓
+ 𝜎𝑡𝑃 = 0 [𝑀𝑃𝑎] ... for the cross-section 10 at the top of the beam
𝜎𝑏𝑓
+ 𝜎𝑏𝑃 = 0 [𝑀𝑃𝑎] ... for the cross-section 15 at the bottom of the beam
Cross-section 10:
𝜎𝑡𝑓
+ 𝜎𝑡𝑃 = 0
where 𝜎𝑡𝑓 is a stress at the top caused by loading
𝜎𝑡𝑃 is a stress at the top caused by prestressing
𝜎𝑡𝑓
=𝑀10
𝐼𝑦∙ 𝑒𝑡 =
3982.46
0.276∙ 0.518 = 7.47 [𝑀𝑃𝑎] (𝑡𝑒𝑛𝑠𝑖𝑜𝑛)
CM03 - Model homework
6
𝜎𝑡𝑝 = −
𝑁𝑃,∞10
𝐴−
𝑁𝑃,∞10 ∙𝑒𝑃,10
𝐼𝑦∙ 𝑒𝑡
Combining equations above, necessary prestressing force at the time of 100 years:
𝑁𝑃,∞10 =
𝜎𝑡𝑓
1
𝐴+
𝑒𝑃,10∙𝑒𝑡
𝐼𝑦
[𝑘𝑁]
𝑁𝑃,∞10 =
7 470 0001
1.738+
0.368∙0.518
0.276
= 5900.28 [𝑘𝑁]
Cross-section 15: (If M15 < M5, continue with cross-section 5 instead of 15)
𝜎𝑏𝑓
+ 𝜎𝑏𝑃 = 0
where 𝜎𝑏𝑓 is a stress at the bottom caused by loading
𝜎𝑏𝑃 is a stress at the bottom caused by prestressing
𝜎𝑏𝑓
=𝑀15
𝐼𝑦∙ 𝑒𝑏 =
3795.01
0.276∙ 0.782 = 10.75 [𝑀𝑃𝑎](𝑡𝑒𝑛𝑠𝑖𝑜𝑛)
𝜎𝑏𝑝 = −
𝑁𝑃,∞15
𝐴−
𝑁𝑃,∞15 ∙𝑒𝑃,15
𝐼𝑦∙ 𝑒𝑏
Combining equations above, necessary prestressing force at the time of 100 years:
𝑁𝑃,∞15 =
𝜎𝑏𝑓
1
𝐴+
𝑒𝑃,15∙𝑒𝑏𝐼𝑦
[𝑘𝑁]
𝑁𝑃,∞15 =
10 750 0001
1,738+
0,632∙0,782
0,276
= 4543.46 [𝑘𝑁]
The decisive value of prestressing force:
There can be only one value of prestressing force in the tendon – it is necessary to choose the
highest value for the design:
𝑁𝑃,∞ = max[𝑁𝑃,∞10 ; 𝑁𝑃,∞
15 ] = max [5900.28; 4543.46] = 5900.28 [𝑘𝑁]
Due to losses of prestress, the force changes during the life of the structure. The prestressing
force calculated above is designed for the age of 100 years of the construction.
4.3 Eccentricity of tendon in cross-section 5
To design the eccentricity in the cross-section 5, the ratio of primary moments will be used as a
proportionality coefficient (This applies only for case M15 > M5, otherwise the process is
reverse):
𝑀5
𝑀15=
1231.45
3352.51= 0.37
𝑒5 = 𝑒15 ∗𝑀5
𝑀15= 0.632 ∗ 0.37 = 0.234 𝑚
(The position of the tendon peak in cross-section 5 is at the place of maximal bending moment,
not in the mid-span).
CM03 - Model homework
7
Notice: If the extreme value of bending moment is higher in cross-section 5 than in cross-section
15, the prestressing force 𝑁𝑃,∞ should be determined based on the equation 𝜎𝑏𝑓
+ 𝜎𝑏𝑃 = 0 [𝑀𝑃𝑎]
in cross-section 5 (not 15). Then the decisive value of prestressing force should be determined
as: 𝑁𝑃,∞ = max[𝑁𝑃,∞5 ; 𝑁𝑃,∞
10 ].
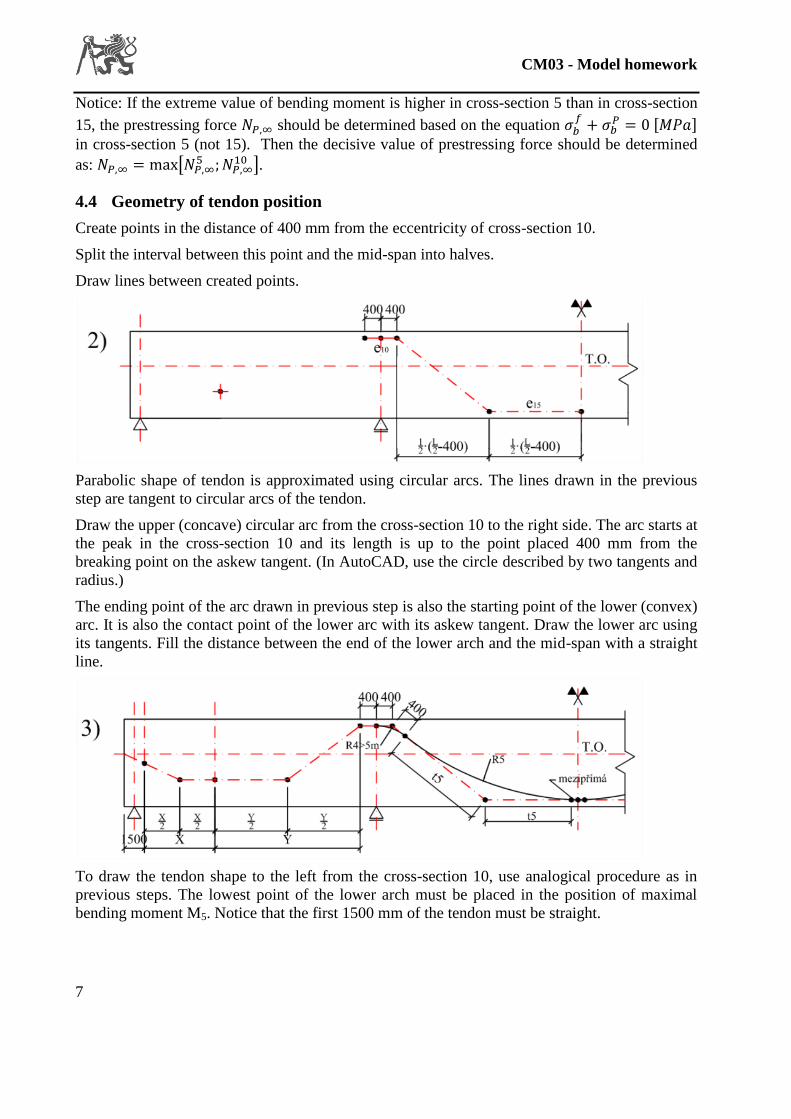
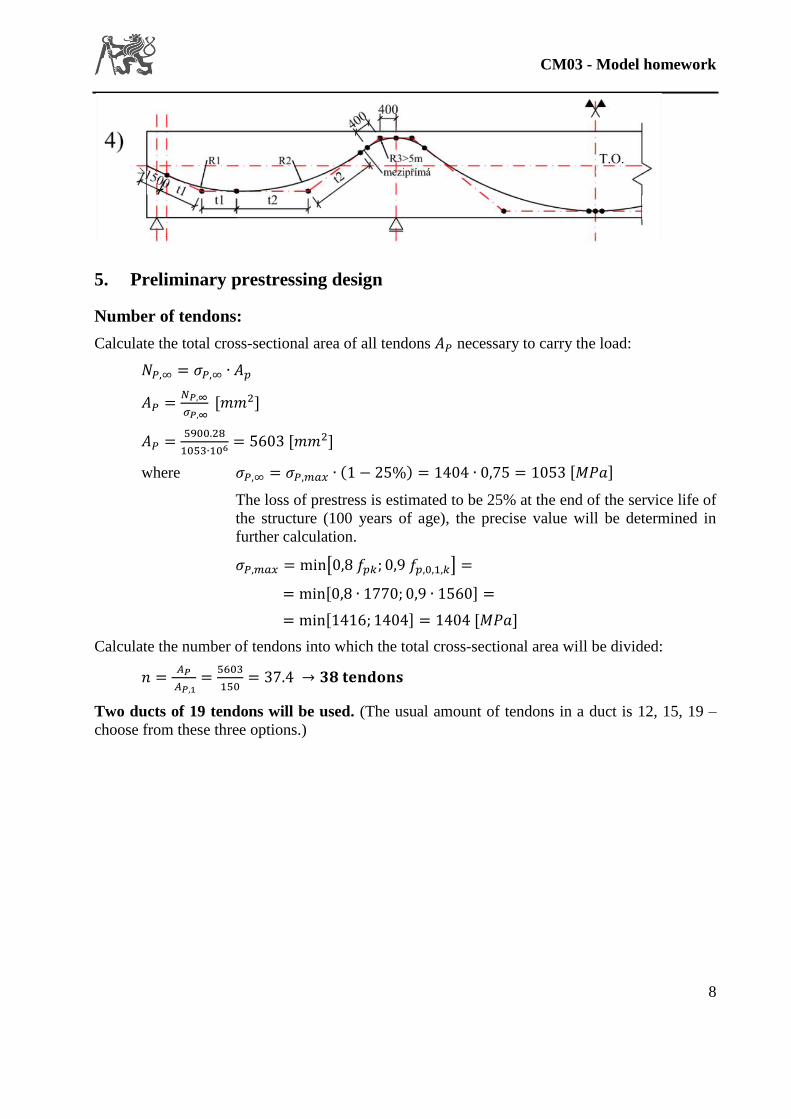
4.4 Geometry of tendon position
Create points in the distance of 400 mm from the eccentricity of cross-section 10.
Split the interval between this point and the mid-span into halves.
Draw lines between created points.
Parabolic shape of tendon is approximated using circular arcs. The lines drawn in the previous
step are tangent to circular arcs of the tendon.
Draw the upper (concave) circular arc from the cross-section 10 to the right side. The arc starts at
the peak in the cross-section 10 and its length is up to the point placed 400 mm from the
breaking point on the askew tangent. (In AutoCAD, use the circle described by two tangents and
radius.)
The ending point of the arc drawn in previous step is also the starting point of the lower (convex)
arc. It is also the contact point of the lower arc with its askew tangent. Draw the lower arc using
its tangents. Fill the distance between the end of the lower arch and the mid-span with a straight
line.
To draw the tendon shape to the left from the cross-section 10, use analogical procedure as in
previous steps. The lowest point of the lower arch must be placed in the position of maximal
bending moment M5. Notice that the first 1500 mm of the tendon must be straight.
CM03 - Model homework
8
5. Preliminary prestressing design
Number of tendons:
Calculate the total cross-sectional area of all tendons 𝐴𝑃 necessary to carry the load:
𝑁𝑃,∞ = 𝜎𝑃,∞ ∙ 𝐴𝑝
𝐴𝑃 =𝑁𝑃,∞
𝜎𝑃,∞ [𝑚𝑚2]
𝐴𝑃 =5900.28
1053∙106 = 5603 [𝑚𝑚2]
where 𝜎𝑃,∞ = 𝜎𝑃,𝑚𝑎𝑥 ∙ (1 − 25%) = 1404 ∙ 0,75 = 1053 [𝑀𝑃𝑎]
The loss of prestress is estimated to be 25% at the end of the service life of
the structure (100 years of age), the precise value will be determined in
further calculation.
𝜎𝑃,𝑚𝑎𝑥 = min[0,8 𝑓𝑝𝑘; 0,9 𝑓𝑝,0,1,𝑘] =
= min[0,8 ∙ 1770; 0,9 ∙ 1560] =
= min[1416; 1404] = 1404 [𝑀𝑃𝑎]
Calculate the number of tendons into which the total cross-sectional area will be divided:
𝑛 =𝐴𝑃
𝐴𝑃,1=
5603
150= 37.4 → 𝟑𝟖 𝐭𝐞𝐧𝐝𝐨𝐧𝐬
Two ducts of 19 tendons will be used. (The usual amount of tendons in a duct is 12, 15, 19 –
choose from these three options.)
CM03 - Model homework
9
6. Losses of prestress
In previous step, the losses of prestress in the end of the service life were estimated to be 25% of
the initial prestress. In further text, the losses of prestress are calculated precisely.
6.1 Immediate losses of prestress
6.1.1 Loss due to friction
There is a friction between the tendon and the tendon duct in the curved parts. Also, there is
friction in the straight tendon parts caused by presence of the duct supports. The friction forces
along the length of the tendon are in opposite direction to the prestressing force in the tendon,
decreasing it. This is the cause of the loss of prestress.
∆𝜎𝑃,1 = −𝜎𝑃,𝑚𝑎𝑥 ∙ (1 − 𝑒−𝜇∙(𝛼+𝑘∙𝑙))
where μ… friction coefficient in curved part
α… central angle of circular arc in particular interval
k… friction coeficient in straight part (related to 1m of length)
l… length of particular interval
μ = 0.19 (for metal duct)
k = 0.01 m -1
angles: (cross-section 5) 𝛼 = 𝛼1 = 0.06527 [𝑟𝑎𝑑]
(cross-section 10) 𝛼 = 𝛼1 + 𝛼2 + 𝛼3 = 0.06527 + 0.10097 + 0.10097 =0.26721 [𝑟𝑎𝑑]
(cross-section 15) 𝛼 = 𝛼1 + 𝛼2 + 𝛼3 + 𝛼4 + 𝛼5 = 0.06527 + 0.10097 + 0.10097 +0.11835 + 0.11835 = 0.50391 [𝑟𝑎𝑑]
lengths: (cross-section 5) 𝑙 = 𝑙1 + 𝑙2 = 1.503 + 4.653 = 6.156 [𝑚]
(cross-section 10) 𝑙 = 𝑙1 + 𝑙2 + 𝑙3 + 𝑙4 + 𝑙5 = 1.503 + 4.653 + 0.369 +11.453 + 0.799 = 18.777 [𝑚]
(cross-section 15) 𝑙 = 𝑙1 + 𝑙2 + 𝑙3 + 𝑙4 + 𝑙5 + 𝑙6 + 𝑙7 + 𝑙8 = 1.503 + 4.653 +0.369 + 11.453 + 0.799 + 0.799 + 13.887 + 0.349 = 33.812 [𝑚]
Loss of prestress due to friction:
∆𝜎𝑃,1,5 = −1404 ∙ (1 − 𝑒−0.19∙(0.06527+0.01∙6.156)) = −33.43 [𝑀𝑃𝑎]
∆𝜎𝑃,1,10 = −1404 ∙ (1 − 𝑒−0.19∙(0.26721+0.01∙18.777)) = −116.27 [𝑀𝑃𝑎]
∆𝜎𝑃,1,15 = −1404 ∙ (1 − 𝑒−0.19∙(0.50391+0.01∙33.812)) = −207.57 [𝑀𝑃𝑎]
6.1.2 Anchorage set loss
At the moment of anchoring, the anchor wedge slips into the anchor head, causing length
reduction of the tendon, which leads to the loss of prestress. The slip is decreased by the friction
– that means that the effect of slip decreases with the length of the tendon.
Initial slip: 𝑤 = 0.005 𝑚
CM03 - Model homework
10
Hooke’s law applies:
∆𝜎 = 𝐸𝑝∆𝜀 = 𝐸𝑝
𝑤
𝐿
𝑤 =∆𝜎𝐿
𝐸𝑝=
𝐴𝑤
𝐸𝑝
𝐴𝑤 = 𝑤 ∙ 𝐸𝑃 = 0.005 ∙ 195 000 = 975 [𝑀𝑃𝑎]
where Aw is the area under the stress-length curve
changes of stress related to 1m of length in straight tendon:
𝑝𝑃 = 𝜎𝑃,0,𝑚𝑎𝑥 ∙ (1 − 𝑒−𝜇∙(∆𝛼+𝑘∙𝑙)) = 1404 ∙ (1 − 𝑒−0.19∙(0+0.01∙1)) = 2.665 [𝑀𝑃𝑎]
changes of stress related to 1m of length in curved part no. 1:
𝑝1 = 𝜎𝑃,0,𝑚𝑎𝑥 ∙ (1 − 𝑒−𝜇∙(∆𝛼1+𝑘∙𝑙)) = 1404 ∙ (1 − 𝑒−0.19∙(0.01403+0.01∙1)) = 6.395 [𝑀𝑃𝑎]
where: ∆𝛼1 =𝑎1
𝐿1=
0.06527
4.653= 0.01403 [𝑟𝑎𝑑 ∙ 𝑚−1]
changes of stress related to 1m of length in curved part no. 2:
𝑝2 = 𝜎𝑃,0,𝑚𝑎𝑥 ∙ (1 − 𝑒−𝜇∙(∆𝛼2+𝑘∙𝑙)) = 1404 ∙ (1 − 𝑒−0.19∙(0.00882+0.01∙1)) = 5.011 [𝑀𝑃𝑎]
where: ∆𝛼2 =𝑎2
𝐿1=
0.10097
11.453= 0.00882 [𝑟𝑎𝑑 ∙ 𝑚−1]
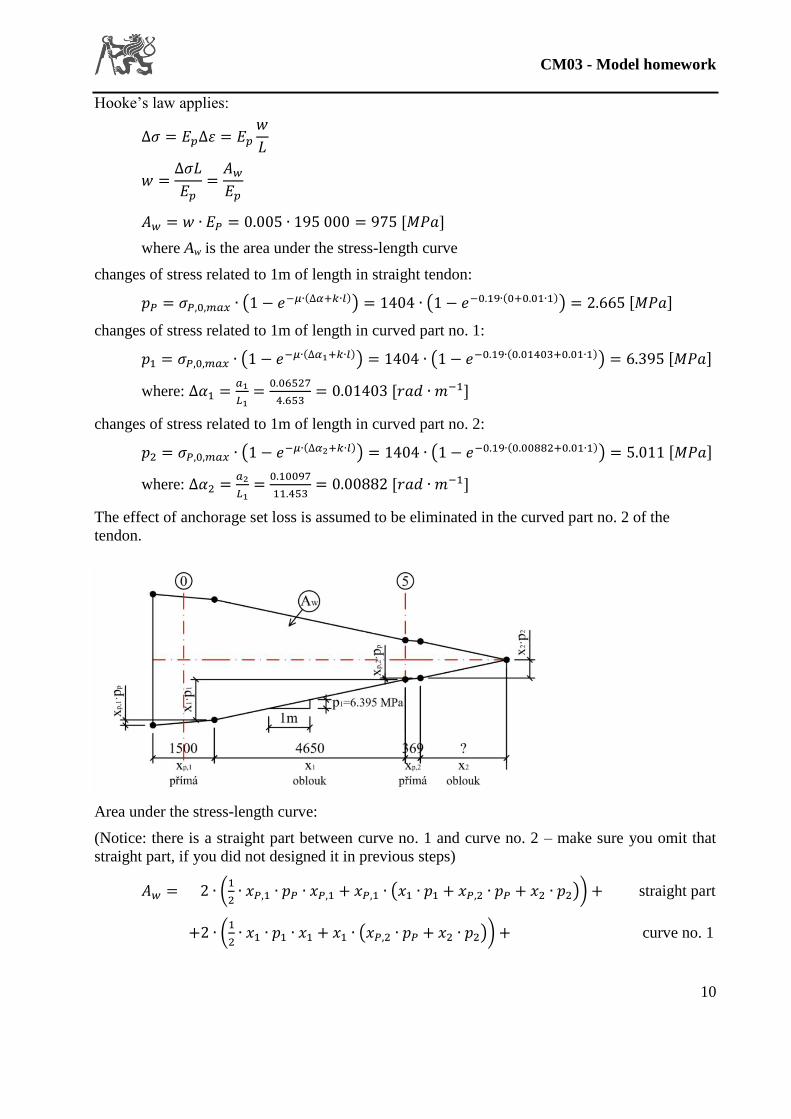
The effect of anchorage set loss is assumed to be eliminated in the curved part no. 2 of the
tendon.
Area under the stress-length curve:
(Notice: there is a straight part between curve no. 1 and curve no. 2 – make sure you omit that
straight part, if you did not designed it in previous steps)
𝐴𝑤 = 2 ∙ (1
2∙ 𝑥𝑃,1 ∙ 𝑝𝑃 ∙ 𝑥𝑃,1 + 𝑥𝑃,1 ∙ (𝑥1 ∙ 𝑝1 + 𝑥𝑃,2 ∙ 𝑝𝑃 + 𝑥2 ∙ 𝑝2)) + straight part
+2 ∙ (1
2∙ 𝑥1 ∙ 𝑝1 ∙ 𝑥1 + 𝑥1 ∙ (𝑥𝑃,2 ∙ 𝑝𝑃 + 𝑥2 ∙ 𝑝2)) + curve no. 1
CM03 - Model homework
11
+2 ∙ (1
2∙ 𝑥𝑃,2 ∙ 𝑥𝑃,2 ∙ 𝑝𝑃 + 𝑥𝑃,2 ∙ (𝑥2 ∙ 𝑝𝑃)) + (straight part)
+2 ∙1
2∙ 𝑥2 ∙ 𝑥2 ∙ 𝑝2 + curve no. 2
𝐴𝑤 = 2 ∙ (1
2∙ 1.5 ∙ 2.655 ∙ 1.5 + 1.5 ∙ (4.65 ∙ 6.395 + 0.369 ∙ 2.665 + 𝑥2 ∙ 5.011)) +
+2 ∙ (1
2∙ 4.65 ∙ 6.395 ∙ 4.65 + 4.65 ∙ (0.369 ∙ 2.665 + 𝑥2 ∙ 5.011)) +
+2 ∙ (1
2∙ 0.369 ∙ 0.369 ∙ 2.665 + 0.369 ∙ (𝑥2 ∙ 5.011)) +
+2 ∙1
2∙ 𝑥2 ∙ 𝑥2 ∙ 5.011
𝐴𝑤 = 5.011𝑥22 + 65.333𝑥2 + 245.936 = 975
The solution of x2 (only one reasonable):
𝑥2 = 7.192 [𝑚]
Length of the tendon where the anchorage set loss is effective xw:
𝑥𝑤 = 𝑥𝑃,1 + 𝑥1 + 𝑥𝑃,2 + 𝑥2 = 1.5 + 4.65 + 0.369 + 7.192 = 13.711 [𝑚]
The result shows that the effect of anchorage set loss will affect only the cross-section 5.
Total anchorage set loss:
∆𝜎𝑃,𝑤 = −2 ∙ (𝑥𝑃,1 ∙ 𝑝𝑃 + 𝑥1 ∙ 𝑝1 + 𝑥𝑃,2 ∙ 𝑝𝑃 + 𝑥2 ∙ 𝑝2)
= −2(1.5 ∙ 2.665 + 4.65 ∙ 6.395 + 0.369 ∙ 2,665 + 7.192 ∙ 5.011)= −141.51 [𝑀𝑃𝑎]
Anchorage set loss in cross-section 5:
∆𝜎𝑃,2,5 = − (141.51 − 2 ∙ (𝑥𝑃,1 ∙ 𝑝𝑃 + 𝑥1 ∙ 𝑝1))
= −(141.51 − 2 ∙ (1.5 ∙ 2.665 + 4.65 ∙ 6.395)) = −74.04 [𝑀𝑃𝑎]
Stresses in tendons after immediate losses – summary:
𝜎𝑃0̅̅ ̅̅ = 𝜎𝑃,0,𝑚𝑎𝑥 + ∆𝜎𝑃,1 + ∆𝜎𝑃,2
Cross-section σP,0,max ∆σP,1 ∆σP,2 𝜎𝑃0̅̅ ̅̅ μ
5 1404 -33.43 -74.04 1296.53 0.733
10 1404 -116.27 0 1287.73 0.728
15 1404 -207.57 0 1196.43 0.676
(Notice: μ in this table does not stand for the friction coefficient)
𝜇 =𝜎𝑃0̅̅ ̅̅ ̅
𝑓𝑃𝑘 , where 𝑓𝑝𝑘 = 1770 𝑀𝑃𝑎
CM03 - Model homework
12
6.2 Long-term losses of prestress
6.2.1 Loss due to relaxation of prestressing reinforcement
Metal reinforcement bars have “the ability to relax” when elongated. This means, that the stress
in the tendon decreases over time even though their elongation was not reduced.
∆𝜎𝑝,𝑟 = −𝜎𝑃0̅̅ ̅̅ ∙ 0.66 ∙ 2.5 ∙ 𝑒9.1∙𝜇 ∙ (𝑡
1000)
0.75∙(1−𝜇)
∙ 10−5
where t is the time after prestressing [hours]
Loss of prestress at the time of 100 days:
Cross-section 5
∆𝜎𝑃,𝑟.5100 = −1296.53 ∙ 0.66 ∙ 2.5 ∙ 𝑒9.1∙0.733 ∙ (
2400
1000)
0.75∙(1−0.733)
∙ 10−5
= −20.10 [𝑀𝑃𝑎]
Cross-section 10
∆𝜎𝑃,𝑟,10100 = −1287.73 ∙ 0.66 ∙ 2.5 ∙ 𝑒9.1∙0.728 ∙ (
2400
1000)
0.75∙(1−0.728)
∙ 10−5
= −19.14 [𝑀𝑃𝑎]
Cross-section 15
∆𝜎𝑃,𝑟,15100 = −1196.43 ∙ 0.66 ∙ 2.5 ∙ 𝑒9.1∙0.676 ∙ (
2400
1000)
0.75∙(1−0.676)
∙ 10−5
= −11.46 [𝑀𝑃𝑎]
Loss of prestress at the end of the service life (100 years):
Total relaxation ∆𝜎𝑃𝑟𝑐𝑎𝑝𝑎𝑐𝑖𝑡𝑦
for t = 500 000 h (approx. 57 years) – it is assumed that after this
time the relaxation has no effect:
Cross-section 5
∆𝜎𝑃,𝑟,5∞ = −1296.53 ∙ 0.66 ∙ 2.5 ∙ 𝑒9,1∙0,733 ∙ (
500 000
1000)
0.75∙(1−0.733)
∙ 10−5
= −58.56 [𝑀𝑃𝑎]
Cross-section 10
∆𝜎𝑃,𝑟,10∞ = −1287.73 ∙ 0.66 ∙ 2.5 ∙ 𝑒9.1∙0.728 ∙ (
500 000
1000)
0.75∙(1−0.728)
∙ 10−5
= −56.89 [𝑀𝑃𝑎]
Cross-section 15
∆𝜎𝑃,𝑟,15∞ = −1196.43 ∙ 0.66 ∙ 2.5 ∙ 𝑒9.1∙0.676 ∙ (
500 000
1000)
0.75∙(1−0.676)
∙ 10−5
= −41.96 [𝑀𝑃𝑎]
CM03 - Model homework
13
6.2.2 Loss due to creep
Concrete as a material is slightly viscous. As a result, its deformation increases even though the
loading conditions are constant. As the concrete creeps, there is loss of prestress in the
prestressing reinforcement.
Force in the tendon after prestressing:
𝑁𝑃,05̅̅ ̅̅ ̅ = 𝜎𝑃,0
5̅̅ ̅̅ ̅ ∙ 𝑛 ∙ 𝐴𝑃1 = 1296.53 ∙ 38 ∙ 150 = 7390.22 [𝑘𝑁]
𝑁𝑃,010̅̅ ̅̅ ̅ = 𝜎𝑃,0
10̅̅ ̅̅ ̅ ∙ 𝑛 ∙ 𝐴𝑃1 = 1287.73 ∙ 38 ∙ 150 = 7340.06 [𝑘𝑁]
𝑁𝑃,015̅̅ ̅̅ ̅ = 𝜎𝑃,0
15̅̅ ̅̅ ̅ ∙ 𝑛 ∙ 𝐴𝑃1 = 1196.43 ∙ 38 ∙ 150 = 6819.65 [𝑘𝑁]
Bending moments caused by dead load and secondary prestressing moment:
𝑀𝑔5 = 727.34 + 132.75 = 860.09 [𝑘𝑁𝑚]
𝑀𝑔10 = −3265.07 + 442.50 = −2822.57 [𝑘𝑁𝑚]
𝑀𝑔15 = 2379.30 + 442.50 = 2821.8 [𝑘𝑁𝑚
Elastic stress in concrete at the place of cg of the tendon:
𝜎𝑐𝑃𝑔+𝑃
= −𝑁𝑃,0̅̅ ̅̅ ̅
𝐴𝑖−
𝑁𝑃,0̅̅ ̅̅ ̅ ∙ 𝑒𝑃,𝑖
𝐼𝑦,𝑖∙ 𝑒𝑃,𝑖 +
𝑀𝑔
𝐼𝑦,𝑖∙ 𝑒𝑃,𝑖
𝜎𝑐𝑃,5(𝑔+𝑃)
= −7.390
1.757−
7.390 ∙ (0.25 − (0.782 − 0.78))2
0.277+
0.860
0.277∙ (0.25 − (0.782 − 0.78)) = −5.08 [𝑀𝑃𝑎]
𝜎𝑐𝑃,10(𝑔+𝑃)
= −7.340
1.757−
7.340 ∙ (0.368 − (0.786 − 0.782))2
0.278+
2.823
0.278∙ (0.368 − (0.786 − 0.782)) = −3.98 [𝑀𝑃𝑎]
𝜎𝑐𝑃,15(𝑔+𝑃)
= −6,820
1.757−
6.820 ∙ (0.5 − (0.782 − 0.777))2
0.280+
2.822
0.280∙ (0.5 − (0.782 − 0.777)) = −4.86 [𝑀𝑃𝑎]
Loss of prestress due to creep:
∆𝜎𝑃𝑐 = −𝐸𝑝
𝐸𝑐(𝜏)∙ 𝜎𝑐𝑃
𝑔+𝑃∙ 𝜑(𝑡; 𝜏)
where τ…time of prestressing τ = 7 day
t…time in the life of the beam 𝑡1 = 100 days, 𝑡2 = 100 years
The values of the Young’s modulus at the time of 7 days (Ec(τ)) and the creep coefitient of the
concrete (𝜑(𝑡; 𝜏)) are usually determined using software. For the purpose of this homework, the
values are given defaultly:
CM03 - Model homework
14
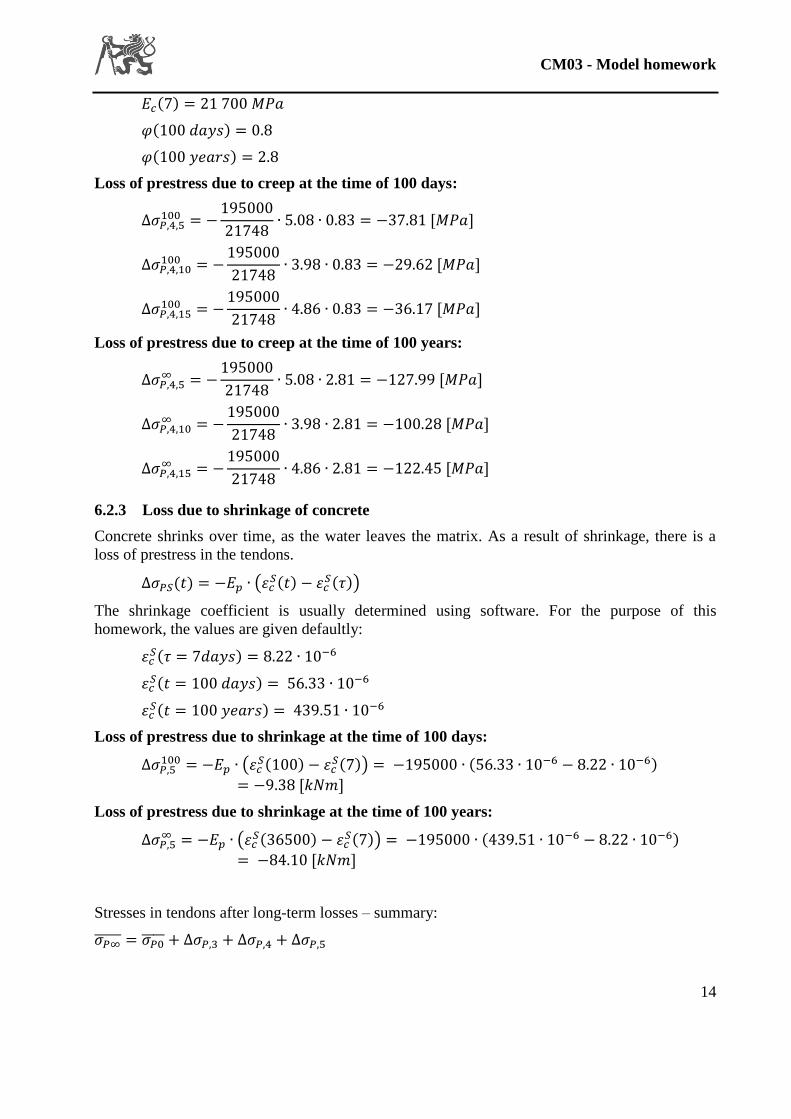
𝐸𝑐(7) = 21 700 𝑀𝑃𝑎
𝜑(100 𝑑𝑎𝑦𝑠) = 0.8
𝜑(100 𝑦𝑒𝑎𝑟𝑠) = 2.8
Loss of prestress due to creep at the time of 100 days:
∆𝜎𝑃,4,5100 = −
195000
21748∙ 5.08 ∙ 0.83 = −37.81 [𝑀𝑃𝑎]
∆𝜎𝑃,4,10100 = −
195000
21748∙ 3.98 ∙ 0.83 = −29.62 [𝑀𝑃𝑎]
∆𝜎𝑃,4,15100 = −
195000
21748∙ 4.86 ∙ 0.83 = −36.17 [𝑀𝑃𝑎]
Loss of prestress due to creep at the time of 100 years:
∆𝜎𝑃,4,5∞ = −
195000
21748∙ 5.08 ∙ 2.81 = −127.99 [𝑀𝑃𝑎]
∆𝜎𝑃,4,10∞ = −
195000
21748∙ 3.98 ∙ 2.81 = −100.28 [𝑀𝑃𝑎]
∆𝜎𝑃,4,15∞ = −
195000
21748∙ 4.86 ∙ 2.81 = −122.45 [𝑀𝑃𝑎]
6.2.3 Loss due to shrinkage of concrete
Concrete shrinks over time, as the water leaves the matrix. As a result of shrinkage, there is a
loss of prestress in the tendons.
∆𝜎𝑃𝑆(𝑡) = −𝐸𝑝 ∙ (𝜀𝑐𝑆(𝑡) − 𝜀𝑐
𝑆(𝜏))
The shrinkage coefficient is usually determined using software. For the purpose of this
homework, the values are given defaultly:
𝜀𝑐𝑆(𝜏 = 7𝑑𝑎𝑦𝑠) = 8.22 ∙ 10−6
𝜀𝑐𝑆(𝑡 = 100 𝑑𝑎𝑦𝑠) = 56.33 ∙ 10−6
𝜀𝑐𝑆(𝑡 = 100 𝑦𝑒𝑎𝑟𝑠) = 439.51 ∙ 10−6
Loss of prestress due to shrinkage at the time of 100 days:
∆𝜎𝑃,5100 = −𝐸𝑝 ∙ (𝜀𝑐
𝑆(100) − 𝜀𝑐𝑆(7)) = −195000 ∙ (56.33 ∙ 10−6 − 8.22 ∙ 10−6)
= −9.38 [𝑘𝑁𝑚]
Loss of prestress due to shrinkage at the time of 100 years:
∆𝜎𝑃,5∞ = −𝐸𝑝 ∙ (𝜀𝑐
𝑆(36500) − 𝜀𝑐𝑆(7)) = −195000 ∙ (439.51 ∙ 10−6 − 8.22 ∙ 10−6)
= −84.10 [𝑘𝑁𝑚]
Stresses in tendons after long-term losses – summary:
𝜎𝑃∞̅̅ ̅̅ ̅ = 𝜎𝑃0̅̅ ̅̅ + ∆𝜎𝑃,3 + ∆𝜎𝑃,4 + ∆𝜎𝑃,5
CM03 - Model homework
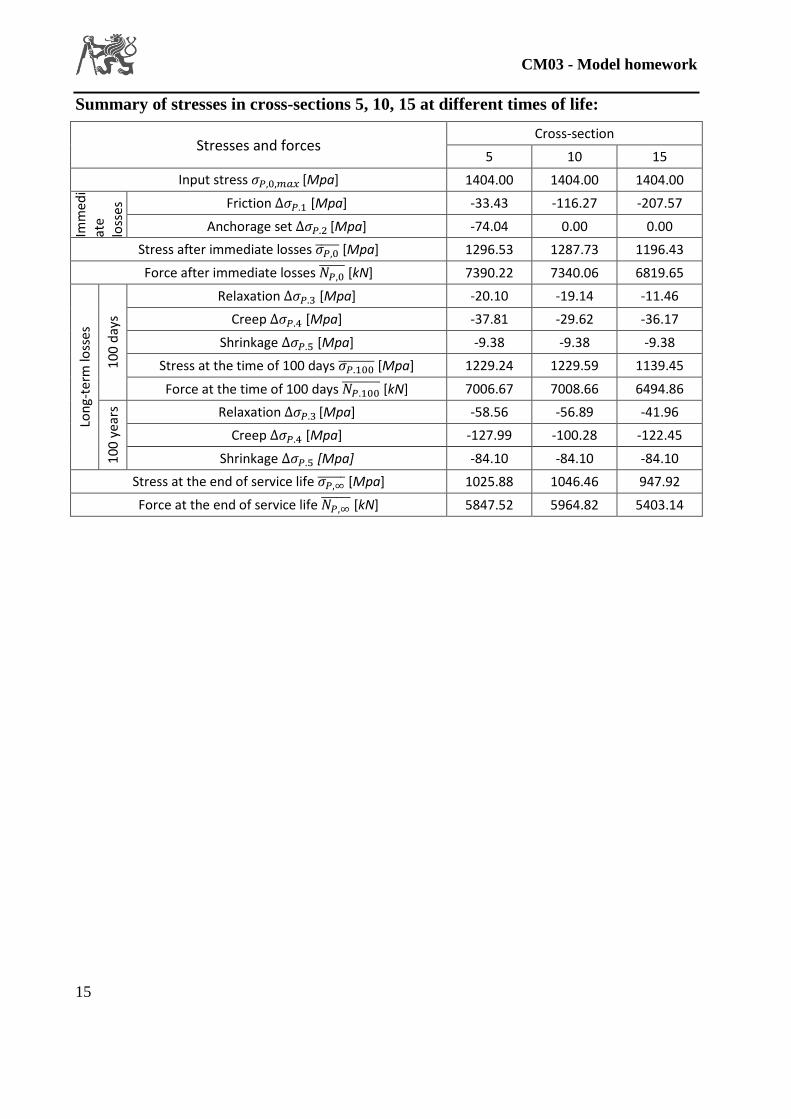
15
Summary of stresses in cross-sections 5, 10, 15 at different times of life:
Stresses and forces Cross-section
5 10 15
Input stress 𝜎𝑃,0,𝑚𝑎𝑥 [Mpa] 1404.00 1404.00 1404.00
Imm
edi
ate
loss
es Friction ∆𝜎𝑃.1 [Mpa] -33.43 -116.27 -207.57
Anchorage set ∆𝜎𝑃.2 [Mpa] -74.04 0.00 0.00
Stress after immediate losses 𝜎𝑃,0̅̅ ̅̅ ̅ [Mpa] 1296.53 1287.73 1196.43
Force after immediate losses 𝑁𝑃,0̅̅ ̅̅ ̅ [kN] 7390.22 7340.06 6819.65
Lon
g-te
rm lo
sses
10
0 d
ays
Relaxation ∆𝜎𝑃.3 [Mpa] -20.10 -19.14 -11.46
Creep ∆𝜎𝑃.4 [Mpa] -37.81 -29.62 -36.17
Shrinkage ∆𝜎𝑃.5 [Mpa] -9.38 -9.38 -9.38
Stress at the time of 100 days 𝜎𝑃.100̅̅ ̅̅ ̅̅ ̅̅ [Mpa] 1229.24 1229.59 1139.45
Force at the time of 100 days 𝑁𝑃.100̅̅ ̅̅ ̅̅ ̅̅ [kN] 7006.67 7008.66 6494.86
10
0 y
ears
Relaxation ∆𝜎𝑃.3 [Mpa] -58.56 -56.89 -41.96
Creep ∆𝜎𝑃.4 [Mpa] -127.99 -100.28 -122.45
Shrinkage ∆𝜎𝑃.5 [Mpa] -84.10 -84.10 -84.10
Stress at the end of service life 𝜎𝑃,∞̅̅ ̅̅ ̅̅ [Mpa] 1025.88 1046.46 947.92
Force at the end of service life 𝑁𝑃,∞̅̅ ̅̅ ̅̅ [kN] 5847.52 5964.82 5403.14