Embed Size (px)
Citation preview

Research ArticleBehavior of Strengthened Composite Prestressed ConcreteGirders under Static and Repeated Loading
Abbas AbdulMajeed Allawi
Department of Civil Engineering, University of Baghdad, 17001 Baghdad, Iraq
Correspondence should be addressed to Abbas AbdulMajeed Allawi; [email protected]
Received 23 June 2017; Revised 5 October 2017; Accepted 1 November 2017; Published 27 December 2017
Academic Editor: Ghassan Chehab
Copyright © 2017 Abbas AbdulMajeed Allawi.�is is an open access article distributed under the Creative Commons AttributionLicense, which permits unrestricted use, distribution, and reproduction in any medium, provided the original work is properlycited.
�e use of external posttensioning technique for strengthening reinforced concrete girders has been considerably studied bymanyresearchers worldwide. However, no available data are seen regarding strengthening full-scale composite prestressed concretegirders with external posttensioned technique under static and repeated loading. In this research, four full-scale compositeprestressed I-shape girders of 16m span were fabricated and tested under static and repeated loading up to failure. Accordingly,two girders were externally strengthened with posttensioned strands, while the other two girders were left without strengthening.�e experimental tests include de�ection, cracking load, ultimate strength and strains at midspan, and loading stages. Test resultswere compared with the design expressions mentioned in AASHTO LRFD speci�cations and ACI 318-2014 code. Also,a nonlinear analysis was conducted using the �nite element method (FEM). �e presented analysis models were veri�ed bycomparing the model results with test results. �e general theme abstracted from both experimental tests and numerical analysisre�ects that the performance and procedure of strengthening with external prestressing of girders were found to be e�ective inincreasing the load carrying capacity of the strengthened girders.
1. Introduction
Repairing and strengthening of deteriorated, damaged, andsubstandard infrastructure has become one of the im-portant challenges facing structural engineers worldwide.�ere are signi�cant and growing needs for strengtheningexisting reinforced concrete structures. Although the useof unbonded tendons as the major prestressing tech-nique in design and rehabilitation has been favored forreasons of ease of construction, cost-e�ectiveness, andmaintenance, the overall structural behavior of prestressedwith externally unbonded tendon under �exural loading isyet to be well understood, as little work has been done inthis �eld [1].
Bending failure of beams with unbonded tendons wasstudied by Naaman and Alkhairi [2]. �ey have proposeda simpli�ed methodology for ultimate strength limit stateanalysis by extending the concept of elastic cracked strainreduction coe�cient to include the limit state. Accordingly,
the authors suggested the following expression, depend-ing on the bond reduction factor, for the ultimate tendonstress fps:
fps � fpe +ΩuEpεcudpc− 1( ) L1
L2≤ 0.94fpy(MPa), (1)
in which fpe and fpy are, respectively, the e�ective and yieldstresses in the steel tendons, Ωu is the bond reduction factorwhich is equal to k/(L/dp), k� 1.5 for one-point loading and3.0 for third-point and uniform loading, L is the span length,dp is the depth from the extreme compression �ber to thecentroid of the prestressing steel, Ep is Young’s modulus forthe steel tendons, εcu is the ultimate compressive strain inconcrete and is taken equal to 0.003, c is the neutral axisdepth, L1 is the length of loaded span or sum of loaded spansa�ected by the same unbonded tendon, and L2 is the totallength of the unbonded tendons between end anchorages.
In prestressed concrete girders with unbonded tendons(internal or external), the stress increment in tendons depends
HindawiAdvances in Civil EngineeringVolume 2017, Article ID 3619545, 13 pageshttps://doi.org/10.1155/2017/3619545
on the geometrical and material deformations of the member.So it cannot be determined from individual section analysis.AASHTO LRFD [3] (provisions (5.7.3.1.2)) states the followingexpression for the stress in unbonded tendons fps, which isbased on Pannell’s deformation-based model:
fps � fpe +6300 dp − c( )
le(MPa), (2)
where le� L/(1+N/2), in which L is the length of tendonbetween anchorages or fully bonded deviators and N is thenumber of support hinges required to form a failuremechanism crossed by the tendon, dp is distance from theextreme compression �ber to the centroid of the prestressingsteel, and c is the neutral axis depth.
�e ACI 318-2014 code [4] provision (20.3.2.4.1) in-troduces the following relation to calculate fps:
fps � fpe + 70 + f′cλρp
(MPa), (3)
where ρp�Ap/bdp, for span/depth ratio equal or less than 35,λ is equal to 100 and fps shall not be taken greater than thelesser of fpy and (fpe + 420), and for span/depth ratio morethan 35, λ is taken as 300 and fps shall not be taken greaterthan the lesser of fpy and (fpe + 210).
It can be pointed out that external prestressing is con-sidered to be one of the useful techniques for strengtheningor renovation of structures in service.�is system had grownrecently to occupy a signi�cant share of the constructionmarket. Also, the external prestressing system is simpler toinstall and easier to inspect and maintain as compared withthe internal tendon system, and it has been proposed in thedesign and construction of new segmental bridges [5].
An experimental investigation was carried out to studythe �exural behavior of continuous concrete beams pre-stressed using external tendons by Harajli et al. [6]. �eyexamined experimentally the behavior of continuous ex-ternally prestressed members and developed an analyticalapproach to predict their ultimate �exural response, takinginto consideration the in�uence of the second-order e�ectsand rotation capacity in the plastic region and other im-portant parameters that were not taken into account in theACI 318 Building Code. Tan and Tjandra [7] tested four two-span continuous externally prestressed T-beams. �e resultsshowed that the strengthened beam could fail in shear,particularly at the high-shear region near the interior sup-port, due to the limited enhancement in shear capacity.
Ng and Tan [8] conducted an experimental work toinvestigate the �exural behavior of nine reinforced concretebeams with T-section strengthened by two external tendonsunder static two-point loading. Two groups of specimenswere tested where the main parameters are the span to depthratios and number of deviators. It is worth to mention thatthe stress in external tendons increased as the number ofdeviators increased, especially beyond the cracking load,where the increase became larger as the loading was pro-gressing to the yield and ultimate stages.
Sivaleepunth et al. [9] conducted an experimental in-vestigation on three prototypes of prestressed concrete
beams with external tendons by varying the geometry ofloading. All beams are T-section, simply supported withoverall length of 3300mm. Two draped 7-wire prestressingtendons, with a nominal diameter of 15.24mm, were usedfor each specimen as external tendons with e�ective pre-stress fpe of about 0.55 fpu and e�ective depth at midspan of200mm. �e load geometries, which are considered as themain parameter for this study, are one-point loading atmidspan, two-point loading with a length of pure momentzone of 500mm and two-point loading with a length of puremoment zone of 1000mm. Accordingly, a comparison hasbeen done of the test results of the stress in tendon at ul-timate stage with the results of equations recommended byACI 318-99 and AASHTO LRFD (2004) design codes [5].
Lee et al. [10] investigated the shear strengthening ofcontinuous concrete beams using externally prestressed steelbars with a V-shape pro�le. �ree beams of 400× 600mmrectangular section and 9400mm total length each one weretested. One beam was considered as unstrengthened controlbeam, while the remaining beams were strengthened with 18or 22mm steel bars. �e steel bars were prestressed up to35% of the nominal yield stress. �e shear capacity of thesecontinuous beams was calculated according to the pro-visions of both ACI 318-11 code and AASHTO LRFDspeci�cations for prestressed girders. �ey suggested thatboth code provisions give good prediction for the shearstrength of externally prestressed beams.
Elrifai et al. [11] studied the fatigue performance ofreinforced concrete beams strengthened with externallyposttensioned (CFRP) tendons. In their work, �veunstrengthened and thirteen strengthened RC beams withdi�erent strengthening schemes were tested under di�erentfatigue load ranges up to failure. �e behavior ofstrengthened beams with CFRP tendons showed good fa-tigue performance with respect to the unstrengthenedbeams. �e �exural behavior of strengthened continuousunbonded posttensioned concrete beams with end-anchoredCFRP laminates was examined by Ghasemi et al. [12] byadopting two di�erent con�gurations of end-anchoragemethods. Five beams of two span unbonded post-tensioned of 6000mm total length were experimentallytested, in which four beams were strengthened with CFRPlaminates with di�erent widths. It was concluded that, forcontinuous beams, the increase in �exural capacity is morepronounced at the serviceability stage than ultimate stage.Also, Chan and Au [13] studied the behavior of continuousprestressed concrete beams with external unbonded tendonswith respect to moment–curvature curves and momentredistribution. Design equations are suggested to calculatethe curvature ductility index of such cases.
El-Zohairy and Salim [14] performed a parametric studyfor posttensioned composite beams with external tendons.An FEM model is presented to simulate composite beamstrengthened with externally posttensioned tendons, and theanalysis results are veri�ed with existing test data.Strengthening parameters include drap or straight tendons,tendon length, eccentricity, and shear connection details.Analysis results show that the trapezoidal pro�le gives goodbehavior rather than straight pro�le with the same
2 Advances in Civil Engineering
eccentricity for the strengthened composite beams, but withless ductility. Also, it is noted that a better performance ofthe external posttensioning strengthening scheme can beobtained when the degree of shear connections is greaterthan 80%. �e objective of this paper is to examine ex-perimentally and numerically the bene�ts of using externalprestressing in strengthening of composite prestressedconcrete girders to evaluate its e�ect on both the service loadbehavior and the load carrying capacity under monotonicstatic and repeated loadings.
2. Experimental Program
2.1. Test Girder Details and Fabrication. In an attempt toevaluate the performance and carrying capacity of compositeprestressed concrete girders under static and repeatedloading, four full-scale partially prestressed concrete com-posite girders have been designed, fabricated, and tested tofailure, and they are divided into two groups. �e �rst groupincluded unstrengthened girder G1 and strengthened girderP1 which were tested under static load condition, whereas
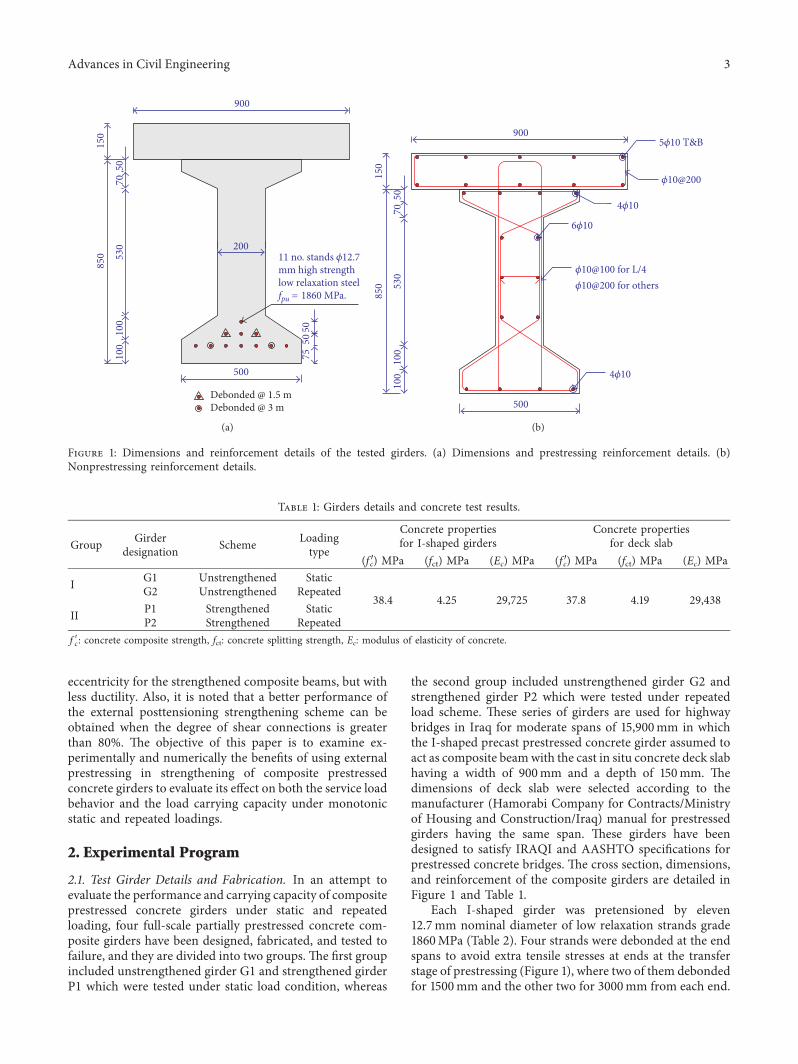
the second group included unstrengthened girder G2 andstrengthened girder P2 which were tested under repeatedload scheme. �ese series of girders are used for highwaybridges in Iraq for moderate spans of 15,900mm in whichthe I-shaped precast prestressed concrete girder assumed toact as composite beamwith the cast in situ concrete deck slabhaving a width of 900mm and a depth of 150mm. �edimensions of deck slab were selected according to themanufacturer (Hamorabi Company for Contracts/Ministryof Housing and Construction/Iraq) manual for prestressedgirders having the same span. �ese girders have beendesigned to satisfy IRAQI and AASHTO speci�cations forprestressed concrete bridges. �e cross section, dimensions,and reinforcement of the composite girders are detailed inFigure 1 and Table 1.
Each I-shaped girder was pretensioned by eleven12.7mm nominal diameter of low relaxation strands grade1860MPa (Table 2). Four strands were debonded at the endspans to avoid extra tensile stresses at ends at the transferstage of prestressing (Figure 1), where two of them debondedfor 1500mm and the other two for 3000mm from each end.
5070
530
100
100
200
7550
50
850
90015
0
500
Debonded @ 1.5 mDebonded @ 3 m
11 no. stands 12.7mm high strengthlow relaxation steelfpu = 1860 MPa.
(a)
5070
530
100
100
850
500
410
610
10@100 for L/410@200 for others
410
900
150
510 T&B
10@200
(b)
Figure 1: Dimensions and reinforcement details of the tested girders. (a) Dimensions and prestressing reinforcement details. (b)Nonprestressing reinforcement details.
Table 1: Girders details and concrete test results.
Group Girderdesignation Scheme Loading
type
Concrete propertiesfor I-shaped girders
Concrete propertiesfor deck slab
(f ′c) MPa (fct) MPa (Ec) MPa (f ′c) MPa (fct) MPa (Ec) MPa
I G1 Unstrengthened Static
38.4 4.25 29,725 37.8 4.19 29,438G2 Unstrengthened Repeated
II P1 Strengthened StaticP2 Strengthened Repeated
f′c: concrete composite strength, fct: concrete splitting strength, Ec: modulus of elasticity of concrete.
Advances in Civil Engineering 3

Also, the concrete girders were reinforced with four lon-gitudinal nonprestressed steel bars 10mm nominal diameterin compression and tension zones where the yield strength is540MPa. To avoid shear failure, transverse steel bars of10mm diameter were used that spaced at 100mm c/c at theend quarters and 200mm at the middle of the span. Ac-cordingly, these bars extended above the extreme topconcrete :bers of the I-shaped girder for 100mm to achievethe role of shear connector with the concrete deck. It isworth to mention that all girders were fabricated and cast atthe same time after the prestressing strands were preten-sioned to the design prestress level. +e prestressing forcewas released 10 hours after concrete casting using 5amecutting, where the concrete compressive strength attainedabout 80% of the expected strength at 28 days by using theaccelerated steam curing method.
+e deck slabs were cast 14 days after casting theI-shaped girders. During this period, camber progress wasmonitored on daily basis under the e?ect of the prestressingforce and the self-weight moment. +e recorded averagevalue at midspan, for all I-shaped girders just before castingof the deck slab, was 27mm. +e I-shaped girders wereunshored during the casting process of the deck slabs. So,loading a?ecting them are the prestressing force, the self-weight of the girder, and the weight of the deck slab. It wasobserved that, at the completion of casting the deck slab, theresidual camber value was 22mm. It should be mentionedthat composite girders G1 and P1 were tested under staticmonotonic loading, while girders G2 and P2 were testedunder nonreverse repeated loading. External posttensioningstrengthening technique was selected to resolve the de-:ciency due to moment carrying capacity. Compositegirders G2 and P2 were externally posttensioning using two15.24mm nominal diameter low relaxation strands grade1860MPa (Table 2) [15], which were located at symmetricaldistances of 25mm from either side relative to the longi-tudinal axis of the girder (Figure 1) in which the additionalinduced stresses at extreme :bers of composite concretesection were checked with the permissible stresses stated inboth ACI 318-2014 code and AASHTO LRFD speci:cations
at the initial stage. A jaw-and-barrel system was used to gripthe steel strands. +e two strands were tensioned simulta-neously from one end using the same ram used in tensioningthe internal prestressing strands. Special care was exercisedto balance the prestressing force in strands to avoid biaxialbending of the specimens. According to AASHTO limita-tions, the target e?ective prestress force in external pre-stressing strands was 60% of the breaking strength.
+e corresponding stress was monitored accuratelyusing the readings of the pressure gauge of the hydraulicram used in the prestressing operation. During the externalprestressing, the composite girders de5ected upward wherethe accumulative camber value was 38mm. +e wedge-anchored prestressing strands were supported directly ona specially designed U-shaped steel anchor assemblieswhich attached to both ends of the girder using eighteen20mm diameter high-strength steel bolts. +e U-shapedsteel anchor assembly consists of steel channel sections ofC240mm depth and 600mm length covered, at ends, bytwo welded steel bearing plates of 150mm wide × 240mmdepth × 24mm thick used for the deviated strands tocomply with their inclined pro:le, in addition to two steelbrackets which are welded back to back to the steel channel(Figures 2 and 3(a)).
+ese brackets were :xed to both sides of the girder web,and each of them included one steel plate of 16mm thickwelded with one-tapered steel sti?eners of the same thick-ness. +e U-shaped anchor assembly D1 was located at thecenter of the composite concrete end section to eliminate theeccentricity of the prestressing strands at these sections(Figures 3(b) and 3(c)). To perform the draped pro:le for thestrands, two steel deviators D2 were used at 5300mm fromeach end section. Each deviator consisted of 50mm diametercylindrical shaft with 20mm groove welded to 200mmwide× 12mm thick× 500mm long rectangular steel plateattached at the soCt of the girder at those sections using six10mm steel bolts as shown in Figure 3(d). +e externalstrands were located 75mm below the soCt of the girders. Atthe completion of the external prestressing process, theaccumulative camber value was 31mm.
Table 2: Properties of the strands.
Nominaldiameter, mm Grade, MPa Nominal
area, mm2Breaking
strength, kNModulus of
elasticity, MPa εy εu
12.7 1860 98.7 183.7 190,000 0.01 0.0315.24 1860 140 260.7 190,000 0.01 0.054
Figure 2: External prestressing scheme for strengthening.
4 Advances in Civil Engineering

2.2. Testing Setup, Instrumentation, and Procedure. �e testwas conducted using a closed loop rig 2600mm overallheight× 2200mm total width which equipped by 2000 kNcapacity hydraulic actuator with stroke and load controlcapabilities (Figure 4). �e hydraulic actuator has 600mmtotal stroke length, 10 kN division, and 0–15 kN/min loadingrate. �e actuator was �xed to closed loop rig at the midspanof the tested girder. Two elastomeric bearing pads, 200mmwide× 300mm long× 64mm thick, were used beneath theends of the girder that achieved a span of 15,600mm for thetested specimen. �e bearing pads provided the requiredarea for transmitting the load and allowed angular move-ment of the girder ends and, hence, simulated the actualsupporting case in service in structural bridge systems overpiers or abutments. To provide pure bending moment zoneof 3600mm long, all girders were tested to failure undera static third-point loading (Figure 5).
To identify crack appearance and propagation, thefrontal side of the girder was prepared and painted withwhite water-based emulsion. �e strains in strands andconcrete during testing were measured at midspan usingelectrical resistance uniaxial strain gauges, foil type, whichare attached to the strands and top of concrete deck slab.Moreover, at midspan across the cross section height, demecpoints have been installed to measure the concrete strain atdi�erent �ber levels using mechanical dial gauge with0.002mm unit division.
De¡ection was measured at midspan section and sec-tions located 3900mm from the center of the supporting
elastomeric bearing pads, at quarter of the span at either sideof the specimen, using three mechanical digital typetransducers of 600mm total linear displacement capacity.Also, two mechanical dial gauges, with 0.01mm unit di-vision, were used to �x the vertical displacement at supports.Wireless microscope with 200 times magnifying capacitywas used for crack detecting and determining crack width.At the end of each test, the cracks propagation was marked,and the crack pattern and mode of failure for each specimenwere carefully examined. Composite girders G1 and P1 weretested under static monotonic load with a loading rate of5 kN/min and 10 kN load increment, respectively, up tofailure. Girders G2 and P2 were subjected to nonreversedrepeated loading regime depending on the failure load ofgirders G1 and P1, respectively.
�e repeated loading test sequence of the tested girdersG2 and P2 was started by increasing the applied load up to
15900
5300 5300 5300
15600
D2 D1
A
A
(a)
60057
5
1000
150
5070
530
100
100
100
100
C240
Pl-24 mm6 M20 each side
Pl-16 mm
Tapered Pl-16 mm
(b)
5070
530
100
100
850
900
150
500
600
200
575
20 hole
M20
C240
Pl-24 mm
(c)
200
100Pulley 15.24 mm
(d)
Figure 3: Strengthening technique details. (a) Longitudinal pro�le. (b) Detail D1 (anchor assembly). (c) View A-A. (d) Detail D2 (deviator).
Figure 4: Testing rig.
Advances in Civil Engineering 5

a load level slightly higher than the cracking load of girdersG1 and P1, respectively. �e girders were then unloaded.�en, they have been reloaded gradually again at the rate of5 kN/min and 10 kN load increment up to (75%) of theultimate static failure load of the control girders G1 and P1,respectively, to study the behavior of those girders when theyare subjected to a load level beyond the fatigue load, and thenthe load was gradually released to zero with 5 cycles ofloading and unloading. After that, the two girders werereloaded gradually up to failure. In all specimens, the testwas terminated when de¡ection increases dramaticallyunder, approximately, constant load.
2.3. Test Results for Girders Exposed to Monotonic StaticLoading. �e typical crack patterns for girders G1 and P1are illustrated in Figures 6 and 7. �e �rst visible cracksgenerally appeared at midspan at total load level of 270 kNand 333 kN, respectively. �e appearance of the �rst crackfor girder P1 was delayed due to the e�ect of externalprestressing. Flexural cracks were gradually spreadinghorizontally from the midspan region toward the outersupports. Numbers of cracks started to increase with loadingincrement; wider cracks were developed after the initiatingof the �rst crack. Main cracks for girder P1 were widespreading out of the pure moment zone rather than thecontrol girder G1.
As the load is increased, more visible cracks were ob-served with an increase in number and width and extendedvertically toward the section compression zone. Figures 8and 9 focus on the cracking propagation at the pure momentzone of composite girders G1 and P1, respectively. As in-dicated in Figure 10, the load–net de¡ection response forboth girders exhibited three regions of behavior prior torupture, which are precracking, postcracking, and post-serviceability regions. In the precracking region, the load–de¡ection curve was essentially a straight line de�ning fullelastic behavior of the girders, and the girders were crackfree. �is region stopped at the initiation of the �rst ¡exuralcrack, when the concrete stress reached the value of modulusof rupture. In the postcracking region, girders G1 and P1underwent varying degree of cracking along the span.Hence, cracks were wider and deeper at pure moment zones,whereas only narrow, minor cracks developed near supports.Accordingly, as the magnitude of cracking increased, girdersti�ness continued to decrease resulting in less steepload–de¡ection curves.
In the postserviceability region, the substantial loss insti�ness due to the extensive cracking and considerablewidening of cracks throughout the span led to that theload–de¡ection curves were considerably ¡atter than inthe precracking regions. As the load continued to increase,the strain in strands and nonprestressed steel, at the tensionzone of the section, continued to increase. After that, the rate
15900
3600 60006000
P
Figure 5: Load pattern for composite girders. Note: all dimensions are in mm.
Figure 6: Crack pattern of girder G1 after testing.
Figure 7: Crack pattern of girder P1 after testing.
6 Advances in Civil Engineering

of de¡ection is rapidly increased and at load level of 550 kNand 675 kN for girders G1 and P1, respectively, a hearablerupture of internal strands happened where the pressuregauge readings is slightly dropped down. Girders G1 and P1continued to de¡ect without considerable additional load-ing, and cracks continued to open. Finally, secondarycompression failure developed, leading to total crushing ofconcrete of the deck slab and buckling of compression re-inforcement bars in pure moment zone followed by failure atload levels of 565 kN and 684 kN for G1 and P1, respectively(Figures 8 and 9).
�emaximum strain in internal strands of girder G1 was0.026. For girder P1, the maximum recorded strain values inthe internal prestressing strands ranged between 0.009 and0.01, while for the external strand, the strain value rangedbetween 0.031 and 0.032. Figure 11 shows the increase ofstrain in prestressing strands versus applied load. Beforecracking, the strain in the internal tendons of unstrength-ened girder G1 and the external strand of strengthenedgirder P1 is slightly increased with load increments. Aftercracking, the strain is substantially increased with increasingload level at the ultimate stage. Obviously, these girdersexhibited semiductile ¡exural failure due to the presence oflongitudinal nonprestressed reinforcement overall the sec-tion. So, the maximum de¡ection values were 186mm and164mm for girders G1 and P1, respectively, while themaximum crack width was varied between 2mm and 3mm.For girder P1, it was noted that concrete cover at left deviatorwas fragmented at failure load due to thrust force exertedfrom unbonded tendon. �e residual net de¡ection afterunloading was 92mm and 78mm for girders G1 and P1,respectively.
2.4. Comparisons of Test Results for Girders Exposed toMonotonic Static Loading. Cracking moment for girders G1and P1 was calculated according to AASHTO LRFD [3] andACI 318-14 provisions. Table 3 shows the values of themeasured cracking moment and corresponding calculatedvalues. Both AASHTO LRFD [3] and ACI 318-14 showconservative values of Mcr for both girders.
Experimental and theoretical moment–curvature dia-grams for midspan section are illustrated in Figures 12 and13 for girders G1 and P1, respectively. �e values of cur-vature were calculated using strain compatibility analysisbased on e�ective stress value in unbonded tendons given inboth AASHTO LRFD (provisions (5.7.3.1.2)) [3] and ACI318:2014 (provision (20.3.2.4.1)). Table 4 presents a com-parison between these results. It should be mentioned that
2001751501251007550250−25−50
800
700
600
500
400
300
200
100
0
De�ection (mm)
Load
(kN
)
Girder G1Girder P1
Figure 10: Load–net de¡ection curves at midspan for girders G1and P1.
0.0400.0350.0300.0250.0200.0150.0100.0050.000
800
700
600
500
400
300
200
100
0
Increase in strain
Load
(kN
)
Girder G1, external strandGirder G1, internal strand
Figure 11: Increase of strain in prestressing strands of girders G1and P1.
Figure 8: Concrete crushing at midspan of girder G1.
Figure 9: Concrete crushing at midspan of girder P1.
Advances in Civil Engineering 7

the calculated values according to these codes were close tothe experimental results.
Values of yielding and ultimate moments were obtainedaccording to the strain compatibility analysis by adoptingthe measured strain value of 0.01 for the internal preten-sioned tendons, and the measured strain for externalunbonded posttensioned strand is 0.0032 according to thetest results.
Both code provisions for yielding and ultimate momentsare coinciding for girder G1. For girder P1, it is clearly seenthat the ACI 318-14 (provision (20.3.2.4.1)) gives smallervalue for the ultimate moment by 96.5% for the ultimatemoment, while the AASHTO LRFD [3] (provisions(5.7.3.1.2)) is considered closer for both experimental resultsand compatibility strain analysis approach based on mea-sured strain for the unbonded tendons. Hence, it can beconcluded that AASHTO LRFD [3] provisions can beadopted for case of girders with internal pretensioned andexternal strengthened with unbonded tendons. �e e�ect ofadding external posttensioned strands for girder P1 issummarized in Table 5. Relation between moments, de-¡ections, and the resulting curvatures, through loading, isnecessary to assess member ductility.
Before loading, both girders had a curvature of negativesign due to camber deformation after jacking process.Ductility index (the ratio of de¡ection at ultimate load (Δu)
to de¡ection at yield load (Δy)) is calculated to show thee�ect of strengthening on the ability to carry inelastic de-formation. Test results referred that a reduction in theductility index was observed for girder P1. On the otherhand, maximum de¡ection value for the strengthened girderP1 was reduced to 95.6% at yield and 88.7% at ultimate. Atservice load level (which is about 70% of ultimate load), thede¡ection was 36mm for girder G1 and 32mm for girder P1,which improves the serviceability limits. Also, there areenhancements in cracking moment, yield moment, andultimate moment of 117.5%, 125.8%, and 118.1%, re-spectively.�is increase in the moment capacity is due to theaxial force exerted by the external unbonded tendons. It canbe shown that the value of ductility index ratio was decreasedby 92.4% when using externally unbonded tendons as thestrengthening technique.
2.5. Test Results for Girders Exposed to Repeated StaticLoading. �e typical crack patterns for girders G2 and P2are illustrated in Figures 14 and 15. �e �rst visible cracksgenerally appeared at midspan at load level of 274 kN and327 kN, respectively, which is considered similar to thoseobtained for girders G1 and P1. �e repeated loading testsequence for the tested girders was started by increasing theapplied load up to a load level slightly higher than thecracking load of girders G1 and P1 (i.e., 280 kN and 340 kN,resp.), where these values are considered as Pmin. �e girderswere then unloaded which resulted in reducing the cambersof the girders by 3mm due to residual de¡ections. �en, thegirders were �rst reloaded gradually again at the rate of5 kN/min and 10 kN load increment up to Pmax and thensubjected to �ve statically applied load cycles between Pminand Pmax. While the level Pmax in repeated load was selectedin advance (about 75% of the total ultimate static failure loadof the control girders G1 and P1, i.e., 425 kN and 513 kN,resp.). �is is to study the behavior of those girders when
Table 3: Cracking moment Mcr values for girders G1 and P1.
Girder Mcr, kN·mexperimental
Mcr, kN·m accordingto AASHTO LRFD
and ACI(Mcr,cal./Mcr,exp.), %
G1 1085 998∗ 91.98P1 1275 1194∗ 93.65∗Mcr is calculated using modulus of rupture ( fr) at date of test and includingdead load e�ect according to Mcr � Sc ( fr+ fcpe), where Sc is the compositesection modulus and fcpe is the compressive stress in the concrete due toe�ective prestressing force.
3024181260
2200200018001600140012001000
800600400200
Curvature (1/mm)
Mom
ent (
kN.m
)
Exp.AASHTO & ACI
Figure 12: Moment–curvature for control girder G1.
3024181260
2200200018001600140012001000
800600400200
Curvature (1/mm)
Mom
ent (
kN.m
)
Exp.AASHTOACI
Figure 13: Moment–curvature for control girder P1.
8 Advances in Civil Engineering

they are subjected to a load level beyond the fatigue load, andthen the load was gradually released to zero with 5 cycles ofloading–unloading. After that, the two girders were reloadedgradually up to failure. When applying the :rst cycle ofloading, more cracks appeared at the bottom 5ange of
girders G2 and P2 when the load level reached to 425 kN and513 kN, respectively.
During the second cycle of loading, it was noted that thecracks reopened and propagated. +e maximum measuredcrack width for both girders was 0.06mm where all cracks
Table 4: Yielding and ultimate moment values for girders G1 and P1.
Girder
Experimental values +eoretical values
My,exp.∗,
kN·m Mu,exp.∗, kN·m
ACI 318-14 provisions AASHTO LRFD [3] provisions Strain compatibility analysisMy,cal., kN·m Mu,cal., kN·m My,cal., kN·m Mu,cal., kN·m My,cal., kN·m Mu,cal., kN·m(My,cal./My,exp.) (Mu,cal./Mu,exp.) (My,cal./My,exp.) (Mu,cal./Mu,exp.) (My,cal./My,exp.) (Mu,cal./Mu,exp.)
G1 1696 1969 1691 1859 1691 1859 1663 194199.7% 94.4% 99.7% 94.7% 98.0% 98.6%
P1 2134 2326 2112 2245 2154 2293 2102 231399.0% 96.5% 101.0% 98.6% 98.5% 99.4%
∗My and Mu are calculated considering the value of dead load moment.
Table 5: Summary of test results for girders G1 and P1.
Test results Girder G1 Girder P1 (P1/G1), %Initial camber, mm 22 31 140.9Total Pcr, kN 361.6 425 117.5Mcr, kN·m 1085 1275 117.5Δcr, mm∗ 32 42 131.3Total Py, kN 565.3 711.3 125.8My, kN·m 1696 2134 125.8Δy, mm∗ 96 92 95.6Curvature ϕy, 1/mm× 10−5 7.92 7.36 95.8Total Pu, kN 656.3 775.3 118.1Mu, kN·m 1969 2326 118.1Δu, mm∗ 186 165 88.7Residual de5ection, mm 92 78 84.8Curvature ϕu, 1/mm× 10−5 22.13 15.85 71.6Ductility index, Δu/Δy 1.94 1.79 92.4Δ at service load level (70% of ultimate load), mm# 36 32 88.9∗Total absolute measured downward net de5ection, #net de5ection after subtracting camber value.
Figure 14: Crack pattern of girder G2 after testing.
Figure 15: Crack pattern of girder P2 after testing.
Advances in Civil Engineering 9

appeared within the middle third of the span. At the thirdand fourth cycles, cracks initiated as the previous two cyclesbegan to increase in width which varied from 0.1mm to0.14mm. Spacing between cracks remained approximatelyconstant but cracks were deeper extending toward the deckslab. At the �fth cycle, the maximum crack width variedfrom 0.4mm to 0.6mm, average spacing between cracks was110mm at the bottom ¡ange, and the maximum depth ofcracks was 680mm. It should be noted that, at the end of the�fth loading cycle, cracks occupied the whole diapason of thespan up to the zone of 0.9m from each support. Also, asexpected, during the repeated loading, the residual de-¡ection was increased. After completing the repeatedloading process, both girders were loaded up to failure. �enumbers of cracks increased with loading increment, andwider cracks were developed. After that, the rate of de-¡ection rapidly increased, and at load level of 455 kN and610 kN for girders G2 and P2, respectively, a hearablerupture of internal strands was noted where the pressuregauge readings slightly dropped down. Girders G2 and P2continued to de¡ect without considerable additional load-ing, and cracks continued to open.
Finally, secondary compression failure developed, wheresuccessive falling of concrete pieces which led to totalcrushing of concrete of the deck slab and buckling ofcompression reinforcement bars in pure moment zone wasfollowed by failure at load levels of 520 kN and 618 kN for G2and P2, respectively (Figures 16 and 17). �e concrete ofdeck slab had a crushing area length of 1.1m to 1.3m long atmidspan, and the longitudinal reinforcement bent out due toloss of the con�nement of concrete cover. �e residual netde¡ection after unloading was 88mm and 76mm for girdersG2 and P2, respectively. Obviously, the crack patterns andmode of failure for the specimen exposed to repeated loadwere similar to that of girders tested under static load.
2.6. Comparisons of Test Results for Girders Exposed to Re-peated Static Loading. �e load–de¡ection response of the
specimens tested under repeated loading are shown inFigures 18 and 19. It is noticed that the load–de¡ectionbehavior is approximately identical for both girders. Itshould be observed that, at the same loading level; as thenumber of cycles was increased, the de¡ection of themember was increased accordingly. �e residual net de-¡ection after unloading was 119mm and 91mm for girdersG2 and P2, respectively. �e de¡ection values at yield andultimate loads were compared with that for the referencegirders as illustrated in Table 6. �e additional measuredstrain for external unbonded posttensioned strand of girderP2 was 0.0026. �is reduction in strain value was due to thechange in tendon eccentricity, that is, the second-order
Figure 16: Concrete crushing at midspan of girder G2.
Figure 17: Concrete crushing at midspan of girder P2.
2001751501251007550250−25−50
800
700
600
500
400
300
200
100
0
De�ection (mm)
Load
(kN
)
Girder G1Girder G2
Figure 18: Load–net de¡ection curves for girder G2 under repeatedloading.
2001751501251007550250−25−50
800
700
600
500
400
300
200
100
0
De�ection (mm)
Load
(kN
)
Girder P1Girder P2
Figure 19: Load–net de¡ection curves for girder P2 under repeatedloading.
10 Advances in Civil Engineering

e?ects which led to a reduction in the ultimate momentcapacity. Result of the tested girders G2 and P2 under re-peated loading including the yield moment, the ultimatemoment, and maximum de5ection are illustrated in Table 7,which reveals clearly that there is an increase in yield andultimate moments for the strengthened girders under re-peated loading as compared with corresponding referencegirders G1 and P1 by 128.4% and 116%, respectively. Also,the suggested strengthening leads to an improvement in theserviceability limits regarding maximum and residual de-5ection under repeated loading.
3. Finite Element Modeling (FEM)
3.1. Material Properties and Modeling. A three-dimensionalnonlinear :nite element analysis has been used to conducta numerical investigation on the general behavior of full-scale composite prestressed concrete girders strengthenedwith external posttensioning technique under static andrepeated loading up to failure. ANSYS Program–Release 14.5[16] software was utilized in this work. For modeling,concrete three-dimensional 8-node solid elements (SOLID65) have been used. +e element has eight corner nodes, andeach node has three degrees of displacement in x, y, and z.+e cracking of concrete is modeled as “smeared-crackingmodel.” A crack is represented by an in:nite number of
parallel :ssures across that part of the :nite element. +eelement is capable of cracking (in three orthogonal di-rections), crushing, and plastic deformation. Modeling ofreinforcing steel in connection with the :nite elementanalysis of reinforced concrete members is much simplerthan the modeling of concrete. +e steel bars are long andrelatively slender, and therefore, they can be assumed totransmit axial forces only. Accordingly, the embedded re-inforcement model with an elastic-linear work hardeningmodel is adopted to simulate the uniaxial stress–strainbehavior of reinforcing steel bars. +e steel reinforcementand prestressing strands were represented by using “barelements” (discrete representation) with one degree offreedom at each node. +e axial normal stress is assumed tobe uniform over the entire element length. Perfect bondbetween steel reinforcement and concrete and betweenconcrete and embedded tendons are assumed to occur [17].Element SOLID 45 was used to model the steel plates,sti?eners, and deviators.+is element consists of eight nodeswith three degrees of freedom for each node, translations inthe nodal x, y, and z directions.
+e four prestressed composite concrete girders havebeen analyzed to predict the ultimate 5exural response. +egirders were loaded in such manner like the experimentalspecimens with two-point loading. Due to symmetry, onehalf of each girder was used in the analysis and the required
Table 6: Summary of test results for girders G2 and P2.
Test results Girder G2 G2/G1, % Girder P2 P2/P1, % P2/G2, %Mcr, kN·m 1096 101 1255 98.4 114.5Δcr, mm∗ 32 100 44 104.8 137.5My, kN·m 1639 96.6 2104 98.6 128.4Δy, mm∗ 113 117.7 136 147.8 120.4Mu, kN·m 1834 93.1 2128 91.5 116.0Δu, mm∗ 163 87.6 153 92.7 93.9Residual de5ection, mm 119 129.3 91 116.7 76.6Ductility index, Δu/Δy 1.44 74.2 1.13 63.1 78.5Δ at service load level (70% of ultimate load), mm# 65 180 61 191 93.8∗Total absolute measured downward net de5ection, #net de5ection after subtracting camber value.
Table 7: Comparison between FEM and experimental results.
Girder Value Mcr, kN·m Δcr, mm My, kN·m Δy, mm Mu, kN·m Δu, mm
G1FEM 1138 30 1830 89 2096 209Exp. 1085 32∗ 1696 96∗ 1969 186∗
(FEM/Exp.) 104.9% 93.8% 107.9% 92.7% 106.5% 112.4%
G2FEM 1216 31.4 1708 115 1918 175Exp. 1096 32∗ 1639 113∗ 1834 163∗
(FEM/Exp.) 111% 98.1% 104.2% 101.8% 104.6% 107.4%
P1FEM 1348 40 2264 89 2417 179Exp. 1275 42∗ 2134 92∗ 2326 165∗
(FEM/Exp.) 105.7% 95.3% 106.1% 96.7% 103.9% 108.5%
P2FEM 1297 43.5 2137 125 2188 163Exp. 1255 44∗ 2104 129∗ 2128 153∗
(FEM/Exp.) 103.3% 98.9% 101.6% 96.9% 102.8% 106.7%∗Total absolute measured downward net de5ection.
Advances in Civil Engineering 11

displacement boundary conditions need to be applied at thesupport and symmetry line. �e �nite element mesh and theloading arrangement are shown in Figure 20. No externalpoint load was applied in the �rst load step, the initialprestrain due to prestressing was applied to the girders, andthe initial strains for real constant for prestressing strandswere determined from e�ective prestress (fpe) and themodulus of elasticity (Eps). Camber was observed in eachbeam. In the next step, the concentrated load was applied atthe top of girders. Uniform increments of load have beenused for applying the external load. �e nonlinear analysis isconducted using the full Newton–Raphson method. Aconvergence tolerance of 5% is used. Di�erent values for
shear transfer parameters are used for each girder to obtainacceptable results. Nonlinear geometry analysis is also in-corporated to include the second-order e�ect of the externalunbonded tendons due to large de¡ection at stages close tofailure load.
3.2. Comparisons of Experimental and FEMResults. �e loadversus net midspan de¡ection curves of the compositeprestressed concrete girders obtained from the �nite elementanalysis was compared with corresponding experimentaldata as shown in Figures 21–23 and Table 7 for all girders. Ingeneral, it can be noted that the �nite element analysesagreed well with the experimental results throughout the
(a)
(b)
Figure 20: Finite element mesh and loading arrangement. (a)Girders G1 and P1. (b) Girders G2 and P2.
2001751501251007550250−25−50
800
700
600
500
400
300
200
100
0
De�ection (mm)
Load
(kN
)
FEMExp.
Figure 22: Comparison of FEM and experimental load–net de-¡ection curves for girder G2.
Girder G1, Exp.Girder G1, FEM
Girder P1, Exp.Girder P1, FEM
2001751501251007550250−25−50
800
700
600
500
400
300
200
100
0
De�ection (mm)
Load
(kN
)
Figure 21: Comparison of FEM and experimental load–net de-¡ection curves for girders G1 and P1.
2001751501251007550250−25−50
800
700
600
500
400
300
200
100
0
De�ection (mm)
Load
(kN
)
FEMExp.
Figure 23: Comparison of FEM and experimental load–de¡ectioncurves for girder P2.
12 Advances in Civil Engineering

entire range of behavior.+e analysis results ranged between2.8% and 6.5% for the ultimate moment capacities andbetween 6.7% and 12.4% for themaximum de5ections.+esevalues of discrepancy could be considered within acceptablerange.
4. Conclusions
Four 15.9 m length composite prestressed concrete girdershave been tested under static and nonreverse repeatedloading. Two girders were unstrengthened and tested ascontrol girders, and other two girders were strengthenedwith external prestressing technique. Based on test resultsand FEM analysis, the following conclusions can bedrawn:
(i) Strengthening with external prestressing techniqueexhibited a reasonable increase in the load carryingcapacity. For the tested girders, the increase incracking, yield, and ultimate moments attained117.5%, 125.8%, and 118.1%, respectively.
(ii) Prestressed concrete girders strengthened withposttensioned unbonded tendons led to reductionin the ductility index and an improvement in theserviceability limits regarding de5ection control atservice load level.
(iii) +e AASHTO LRFD provisions for predicting theultimate tendon stress fps can be adopted for the caseof pretension prestressed girders externally strength-ened with unbonded tendons.
(iv) +e strengthening with external posttensionedtendons led to increase in the yield and ultimatemoments under repeated loading as compared withreference girders by 128.4% and 116 for the studiedcases, respectively. Also, an improvement in theserviceability limits regarding maximum and re-sidual de5ection was achieved.
(v) +e predicted numerical results by FEM usingANSYS software were in good agreement with theexperimental results regarding ultimate loads,load–de5ection response, and crack patterns forboth static and repeated loading.+e analysis resultsin a di?erence ranged between 2.8% and 6.5% forthe ultimate moments and between 6.7% and 12.4%for the maximum de5ections. +ese ranges areconsidered within acceptable agreement as com-pared with experimental results.
Conflicts of Interest
+e author declares that there are no con5icts of interest.
Acknowledgments
+is project is supported by Hamorabi Company forContracts (HCC), Ministry of Housing and Construction,Iraq, in testing and supplying raw materials needed toachieve this work. +e author gratefully acknowledges thesupport received from the HCC.
References
[1] A. F. Nasir and W. Zonglin, “Strengthening of Jiamusi pre-stressed highway bridge by using external post-tensioningtechnology in China,” ARPN Journal of Engineering andApplied Sciences, vol. 5, no. 11, pp. 60–69, 2010.
[2] A. E. Naaman and F. M. Alkhairi, “Stress at ultimate inunbonded post-tensioned tendons: Part 2–proposed meth-odology,” ACI Structural Journal, vol. 88, no. 6, pp. 683–692,1991.
[3] AASHTO LRFD,AASHTO LRFD Bridge Design Speci;cations,U.S. Customary Units with 2015 and Interim Revisions,American Association of State Highway and TransportationOCcials, Washington, DC, USA, 7th edition, 2016.
[4] Building Code Requirements for Structural Concrete, (ACI318–14), and Commentary (ACI 318R-14), American ConcreteInstitute, Farmington Hills, MI, USA, 2014.
[5] M. Harajli, N. Khairallah, and H. Nassif, “Externally pre-stressed members evaluation of second order e?ects,” Journalof Structural Engineering, vol. 125, no. 10, pp. 1151–1161, 1999.
[6] M. H. Harajli, M. E. Mabsout, and J. A. Al-Haji, “Response ofexternally post-tensioned continuous members,” ACI Struc-tural Journal, vol. 99, no. 5, pp. 671–680, 2002.
[7] K. Tan and R. A. Tjandra, “Shear de:ciency in reinforcedconcrete continuous beams strengthened with external ten-dons,” ACI Structural Journal, vol. 100, no. 5, pp. 565–572,2003.
[8] C. K. Ng and K. H. Tan, “Flexural behavior of externally pre-stressed beams. Part II: experimental investigation,” Engi-neering Structures Journals, vol. 28, no. 4, pp. 622–633, 2006.
[9] C. Sivaleepunth, J. Niwa, S. Tamura, and Y. Hamada, “Flexuralbehavior of externally prestressed concrete beams by con-sidering loading application,” Technical Paper, vol. 27, no. 2,pp. 553–558, 2005.
[10] S. H. Lee, H. D. Lee, K. J. Shin, and T. H. K. Kang, “Shearstrength of continuous concrete beams using externallyprestressed steel bars,” PCI Journal, vol. 59, no. 4, pp. 77–92,2014.
[11] A. Elrifai, J. West, and K. Soudki, “Fatigue of reinforcedconcrete beams strengthened with externally post-tensionedCFRP tendons,” Construction and Building Materials, vol. 29,pp. 246–256, 2012.
[12] S. Ghasemi, A. A. Maghsoudi, H. A. Bengar, and H. R. Ronagh,“Flexural strengthening of continuous unbonded post-tensioned concrete beams with end-anchored CFRP lami-nates,” Structural Engineering and Mechanics, vol. 53, no. 6,pp. 1083–1104, 2015.
[13] K. H. E. Chan and F. T. K. Au, “Behavior of continuousprestressed concrete beams with external tendons,” StructuralEngineering and Mechanics, vol. 55, no. 6, pp. 1099–1120, 2015.
[14] A. El-Zohairy and H. Salim, “Parametric study for post-tensioned composite beams with external tendons,” Ad-vances in Structural Engineering, vol. 20, no. 10, pp. 1433–1450,2017.
[15] ASTM, Standard Speci;cation for Low Relaxation, Seven-WireSteel Strand for Prestressed Concrete, ASTM A416/A416M–17,vol. A01.05, American Society for Testing and Materials, WestConshohocken, PA, USA, 2017.
[16] ANSYS, ANSYS Element Manual, Release 14.5, SwansonAnalysis System, Canonsburg, PA, USA, 2013.
[17] U. Kim, Y. Huang, P. Chakrabarti, and T. H. K. Kang,“Modeling of post-tensioned one-way and two-way slabs withunbonded tendons,” Computer and Concrete, vol. 13, no. 5,pp. 547–561, 2014.
Advances in Civil Engineering 13

RoboticsJournal of
Hindawi Publishing Corporationhttp://www.hindawi.com Volume 2014
Hindawi Publishing Corporationhttp://www.hindawi.com Volume 2014
Active and Passive Electronic Components
Control Scienceand Engineering
Journal of
Hindawi Publishing Corporationhttp://www.hindawi.com Volume 2014
International Journal of
RotatingMachinery
Hindawi Publishing Corporationhttp://www.hindawi.com Volume 2014
Hindawi Publishing Corporation http://www.hindawi.com
Journal of
Volume 201
Submit your manuscripts athttps://www.hindawi.com
VLSI Design
Hindawi Publishing Corporationhttp://www.hindawi.com Volume 201
Hindawi Publishing Corporationhttp://www.hindawi.com Volume 2014
Shock and Vibration
Hindawi Publishing Corporationhttp://www.hindawi.com Volume 2014
Civil EngineeringAdvances in
Acoustics and VibrationAdvances in
Hindawi Publishing Corporationhttp://www.hindawi.com Volume 2014
Hindawi Publishing Corporationhttp://www.hindawi.com Volume 2014
Electrical and Computer Engineering
Journal of
Advances inOptoElectronics
Hindawi Publishing Corporation http://www.hindawi.com
Volume 2014
The Scientific World JournalHindawi Publishing Corporation http://www.hindawi.com Volume 2014
SensorsJournal of
Hindawi Publishing Corporationhttp://www.hindawi.com Volume 2014
Modelling & Simulation in EngineeringHindawi Publishing Corporation http://www.hindawi.com Volume 2014
Hindawi Publishing Corporationhttp://www.hindawi.com Volume 2014
Chemical EngineeringInternational Journal of Antennas and
Propagation
International Journal of
Hindawi Publishing Corporationhttp://www.hindawi.com Volume 2014
Hindawi Publishing Corporationhttp://www.hindawi.com Volume 2014
Navigation and Observation
International Journal of
Hindawi Publishing Corporationhttp://www.hindawi.com Volume 2014
DistributedSensor Networks
International Journal of


![Modelling of Unbonded Post-Tensioned Concrete Slabs Under ... · unbonded post-tensioned slabs. The slabs were designed accord-ing to BS 8110-1 [22] and the Concrete Society Technical](https://img.dokumen.tips/doc/110x75/60f7151a886e554e76513f68/modelling-of-unbonded-post-tensioned-concrete-slabs-under-unbonded-post-tensioned.jpg)