Embed Size (px)
Citation preview
Population Pyramids &
Demographic Transition
Developed vs. Developing By
Patricia Bailey-Jones
Geographers use a variety of tools to help us understand population patterns in developed and developing countries. Population pyramids Demographic transitions
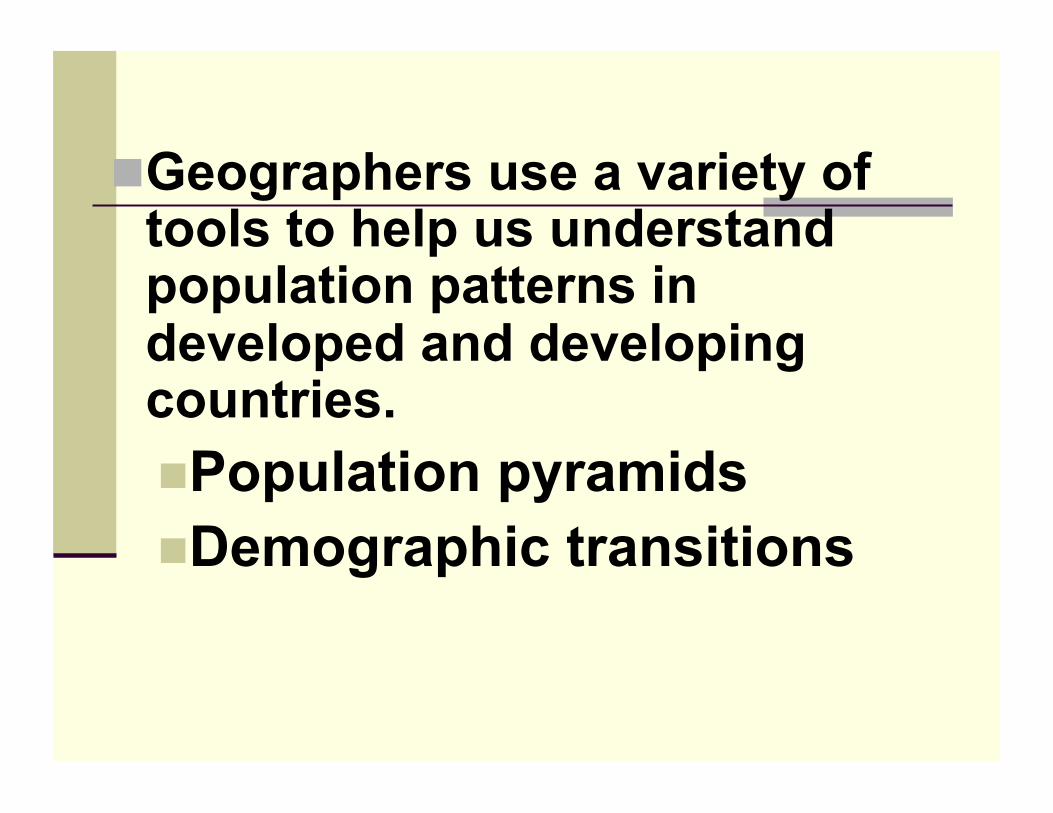
Population Pyramids
Definition
A population pyramid shows the percentage of males and females by age group in a country’s population.
Population pyramids help us understand population trends
Interpreting Shape Pyramids take different
shapes based on the composition of a population
Each type of shape tells us something about the place or country being graphed
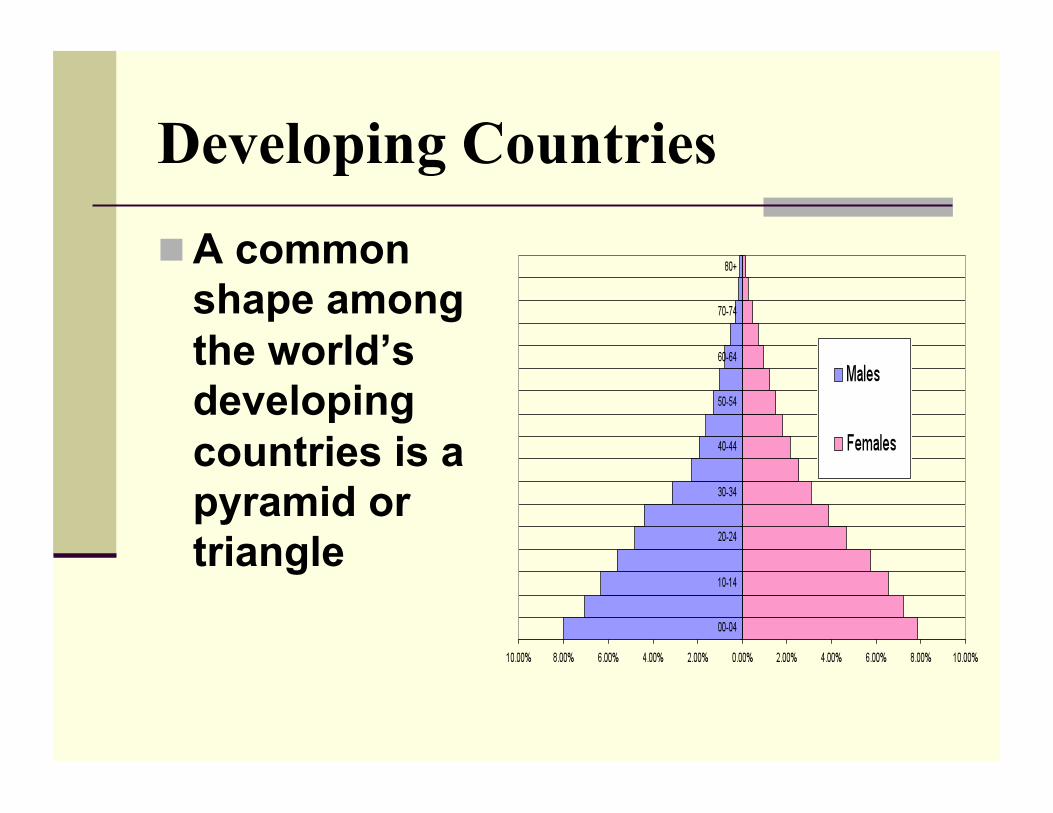
Developing Countries A common
shape among the world’s developing countries is a pyramid or triangle
These countries show a high birth rate and a declining death rate.
The majority of the population is very young, while only a small percentage lives to an old age – pop growing rapidly
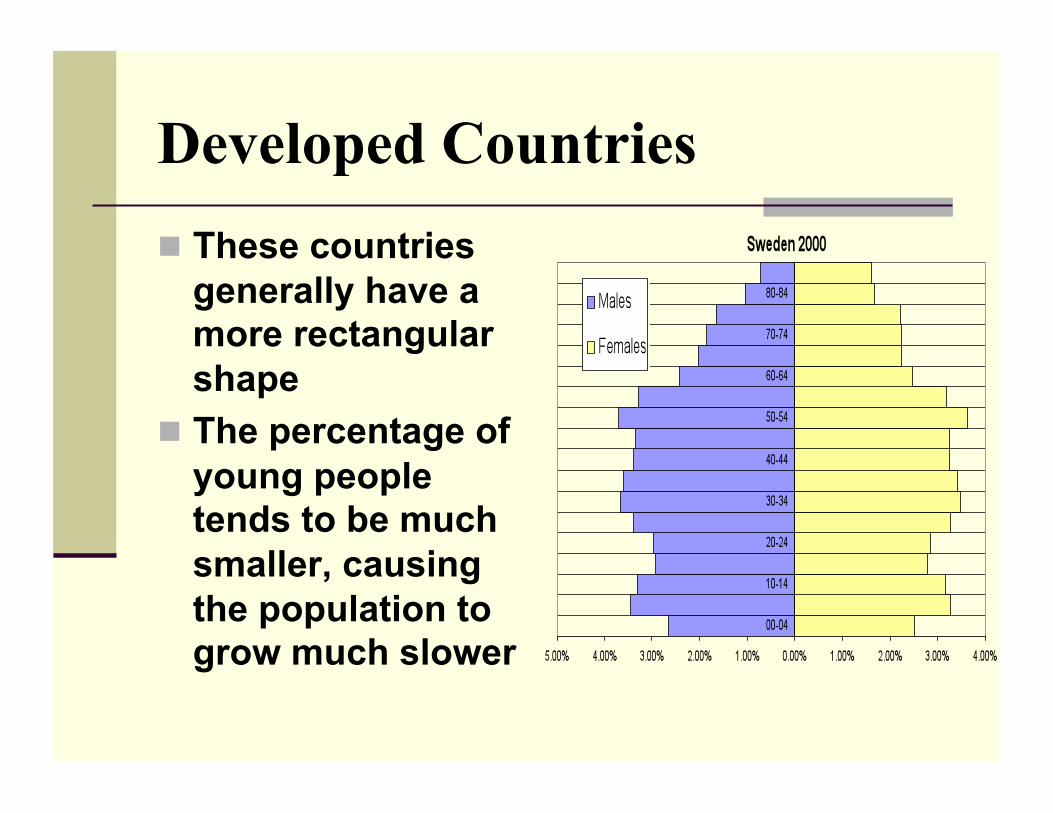
Developed Countries These countries
generally have a more rectangular shape
The percentage of young people tends to be much smaller, causing the population to grow much slower
Developed countries are highly urbanized and have relatively low birth rates and low death rates.

USA 1960
A recent increase in births will also be reflected in a certain shape.
Baby Boomers!
Cohorts
If we talk about people born in a specific year or range of years, we call the group a “birth cohort”, or simply cohort.
The baby boomers is a cohort of persons born between 1945-1960.

Missing Populations???
This pyramid show the effects of major wars. Males are more likely than females to be killed during war times.

10.00% 8.00% 6.00% 4.00% 2.00% 0.00% 2.00% 4.00% 6.00% 8.00% 10.00%
00-04
10-14
20-24
30-34
40-44
50-54
60-64
70-74
80+
Males
Females
Interpret the Shape
Interpret the Shape
Madison Wisconsin 1980 Note the large bulge in the population around
the ages of 20 – 30. In this city of 170,000, there is a University
with 40,000 students.
Interpret the Shape
Interpret the Shape
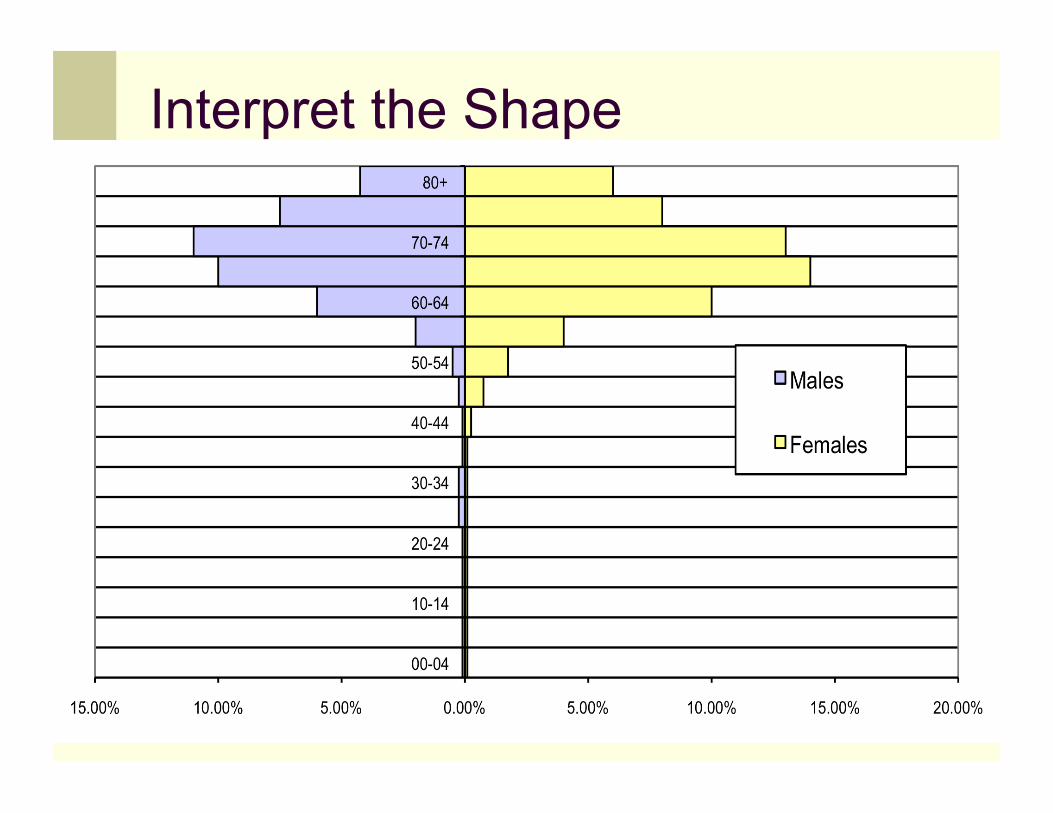
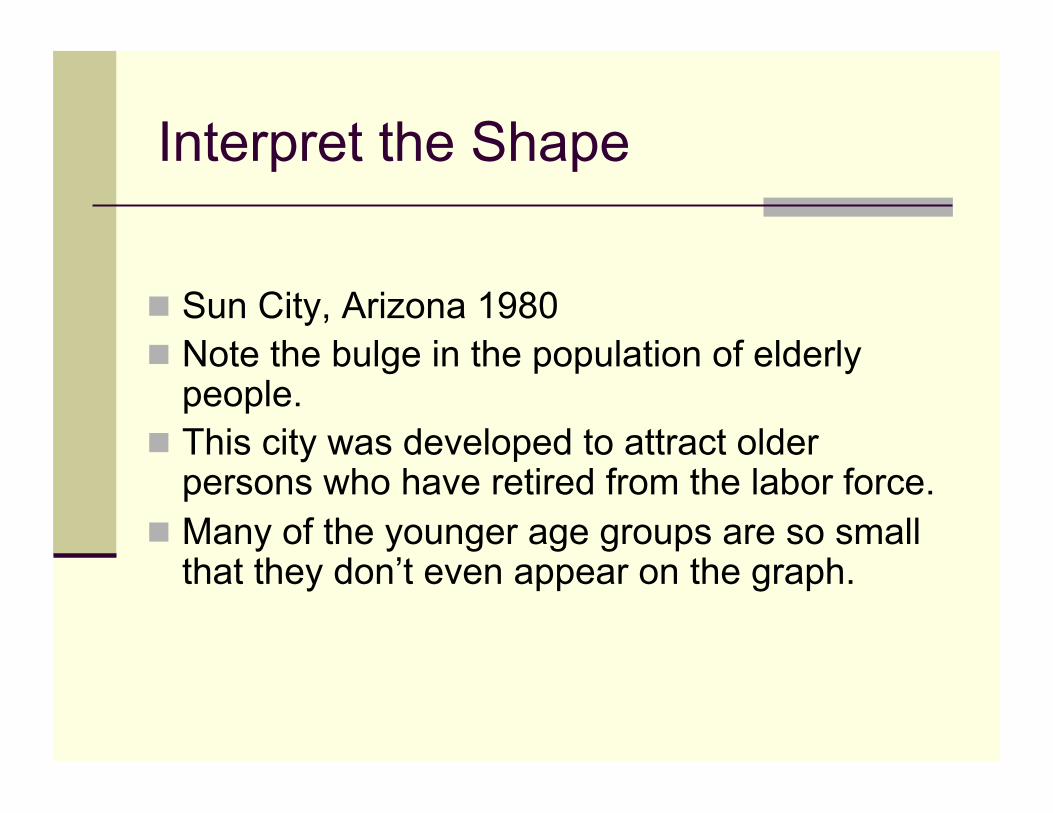
Sun City, Arizona 1980 Note the bulge in the population of elderly
people. This city was developed to attract older
persons who have retired from the labor force. Many of the younger age groups are so small
that they don’t even appear on the graph.
Interpret the Shape
Interpret the Shape
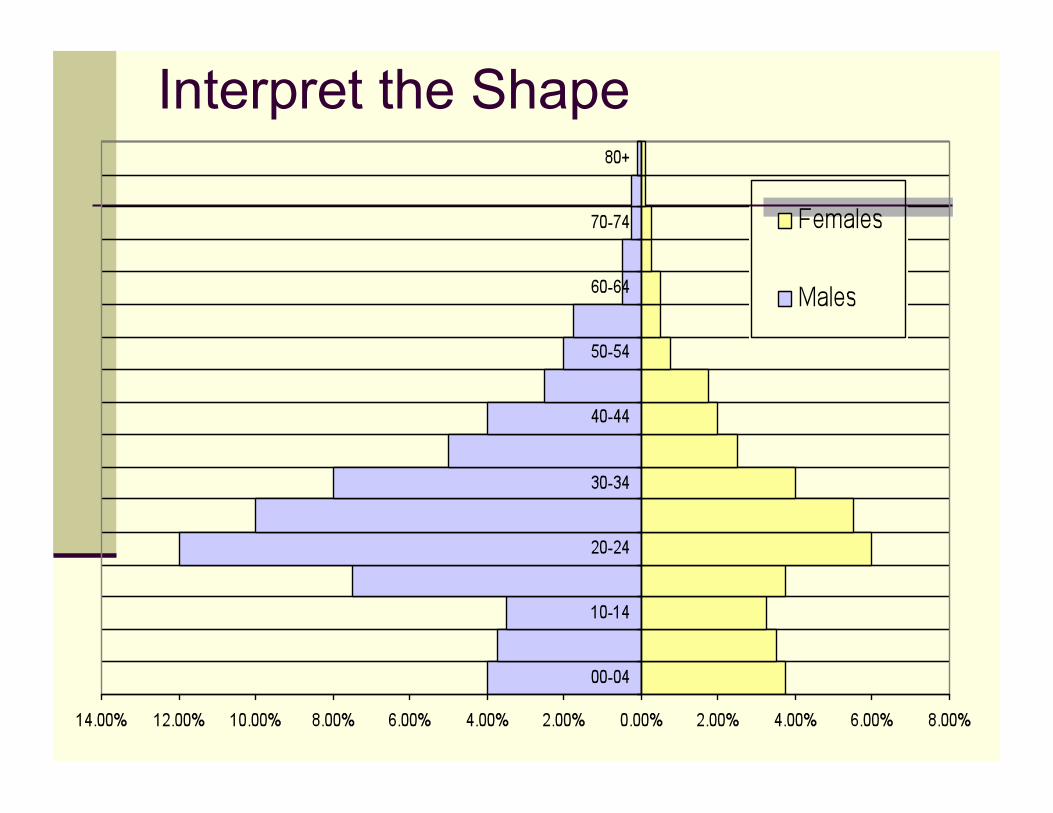
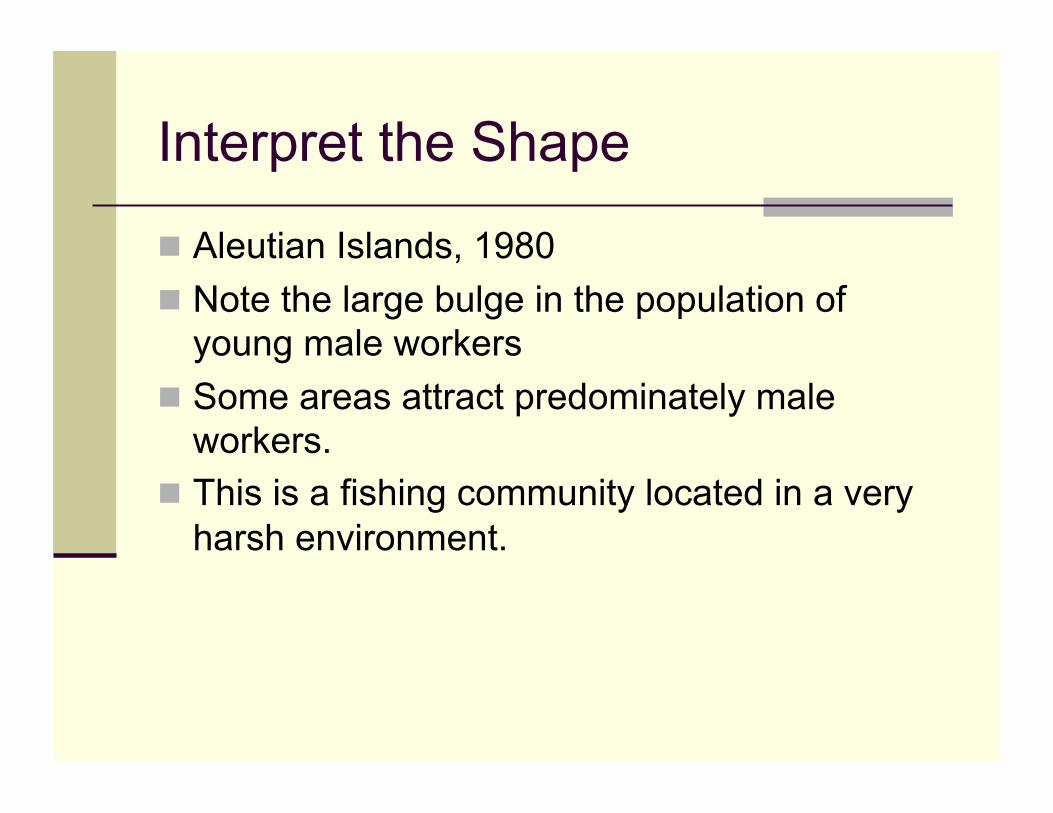
Aleutian Islands, 1980 Note the large bulge in the population of
young male workers Some areas attract predominately male
workers. This is a fishing community located in a very
harsh environment.

Demographic Transitions

Demographic Transitions
The demographic transition is a model that shows how birthrates and death rates dropped in many countries as they developed modern economies
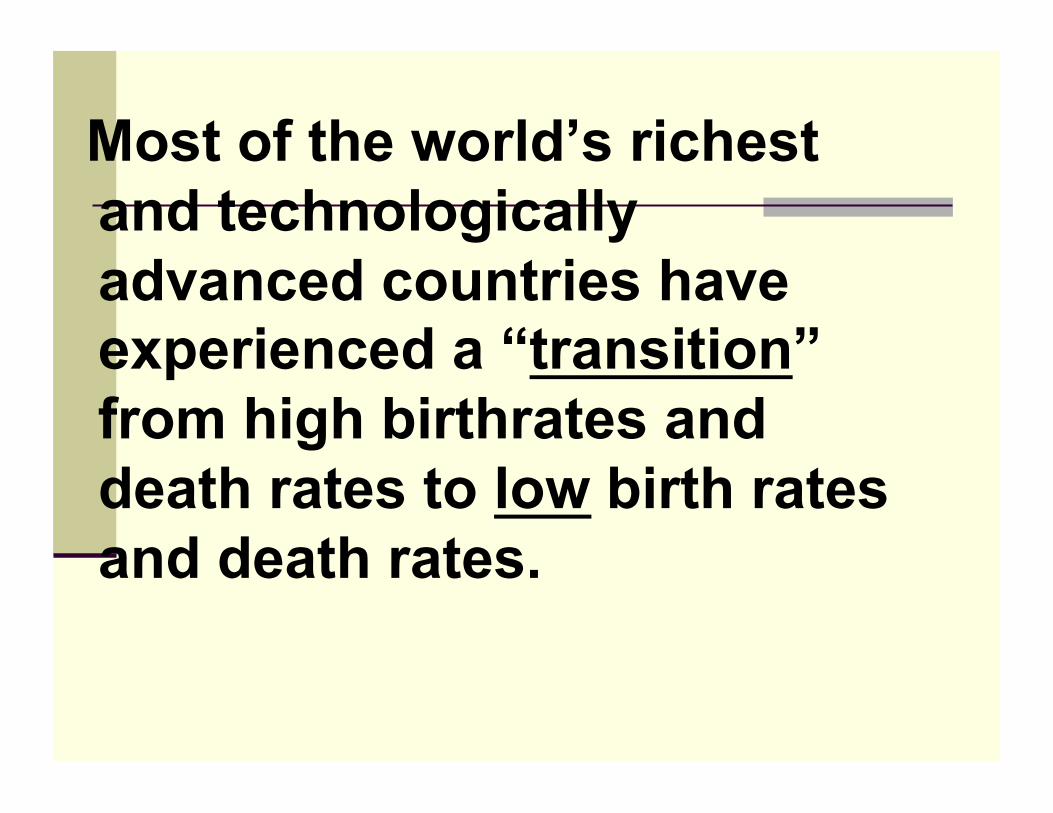
Most of the world’s richest and technologically advanced countries have experienced a “transition” from high birthrates and death rates to low birth rates and death rates.
Many of the world’s poorer countries are now in the middle of similar changes
The shift in growth rate with development has been called the demographic transition
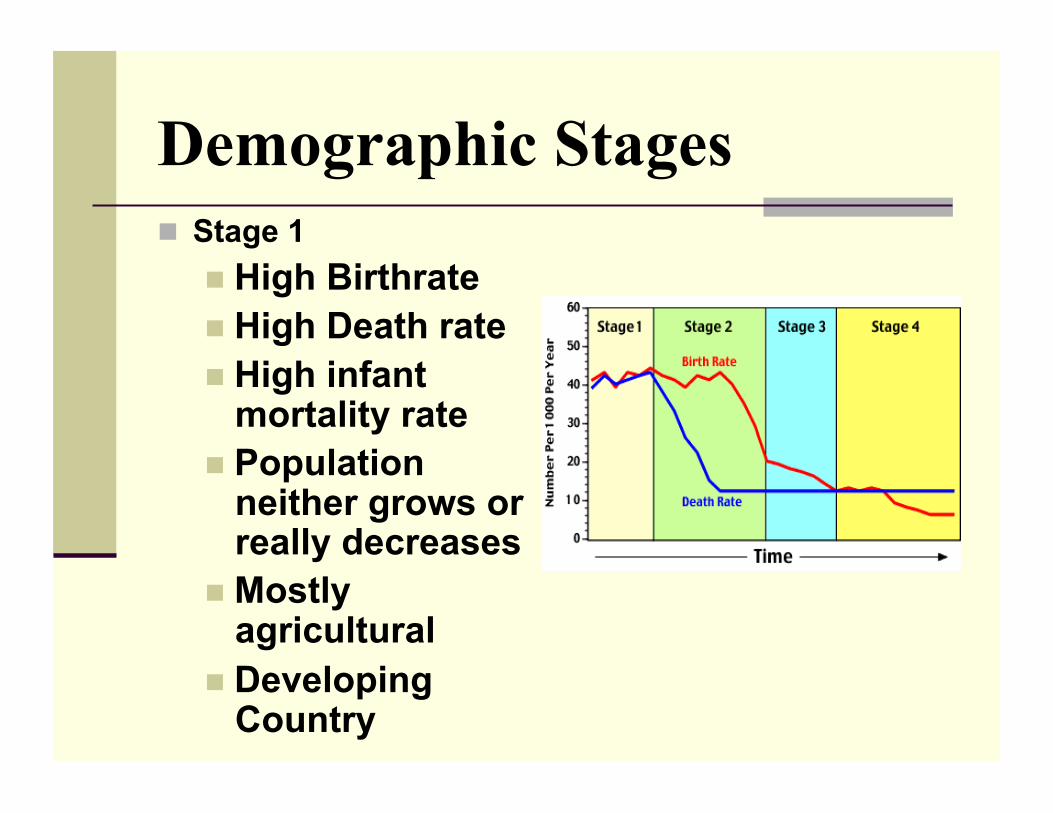
Demographic Stages Stage 1
High Birthrate High Death rate High infant
mortality rate Population
neither grows or really decreases
Mostly agricultural
Developing Country
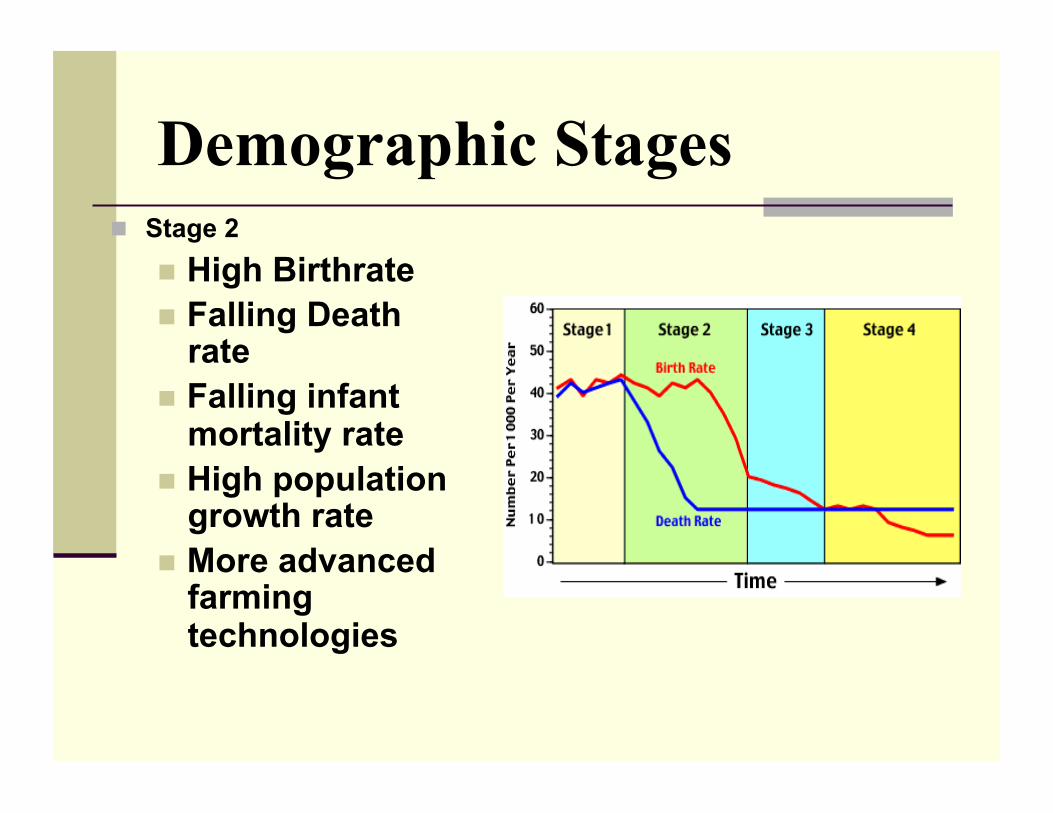
Demographic Stages Stage 2
High Birthrate Falling Death
rate Falling infant
mortality rate High population
growth rate More advanced
farming technologies
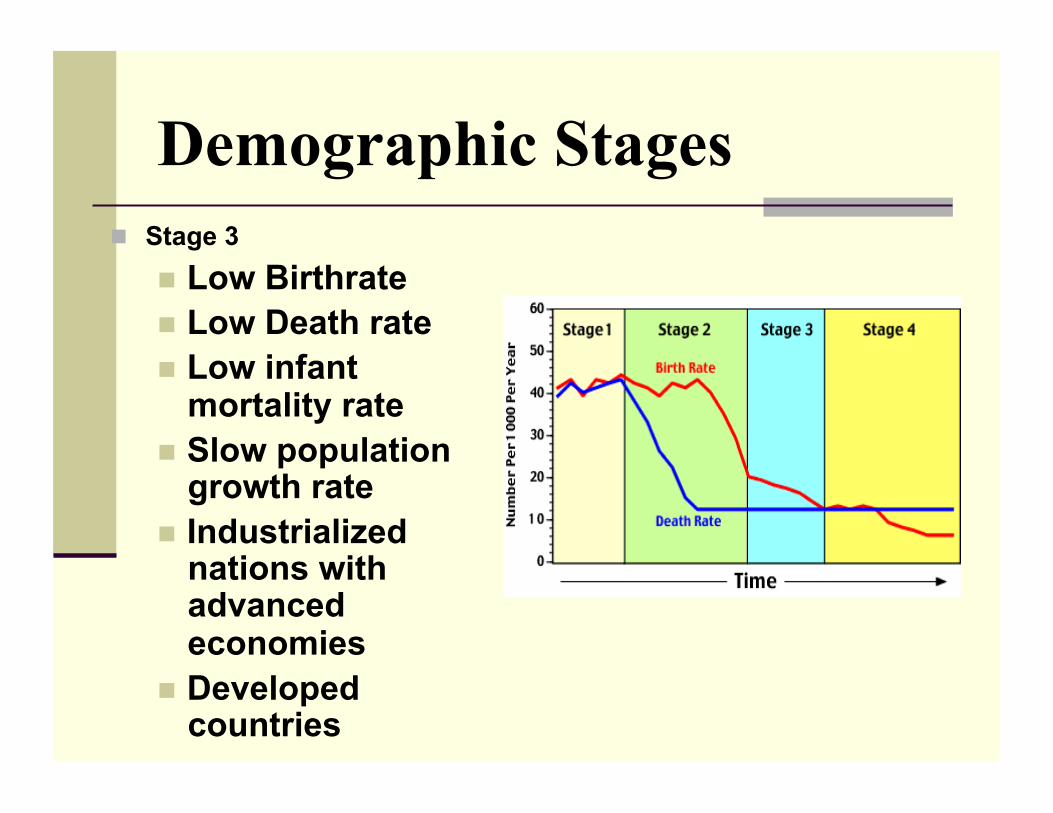
Demographic Stages Stage 3
Low Birthrate Low Death rate Low infant
mortality rate Slow population
growth rate Industrialized
nations with advanced economies
Developed countries
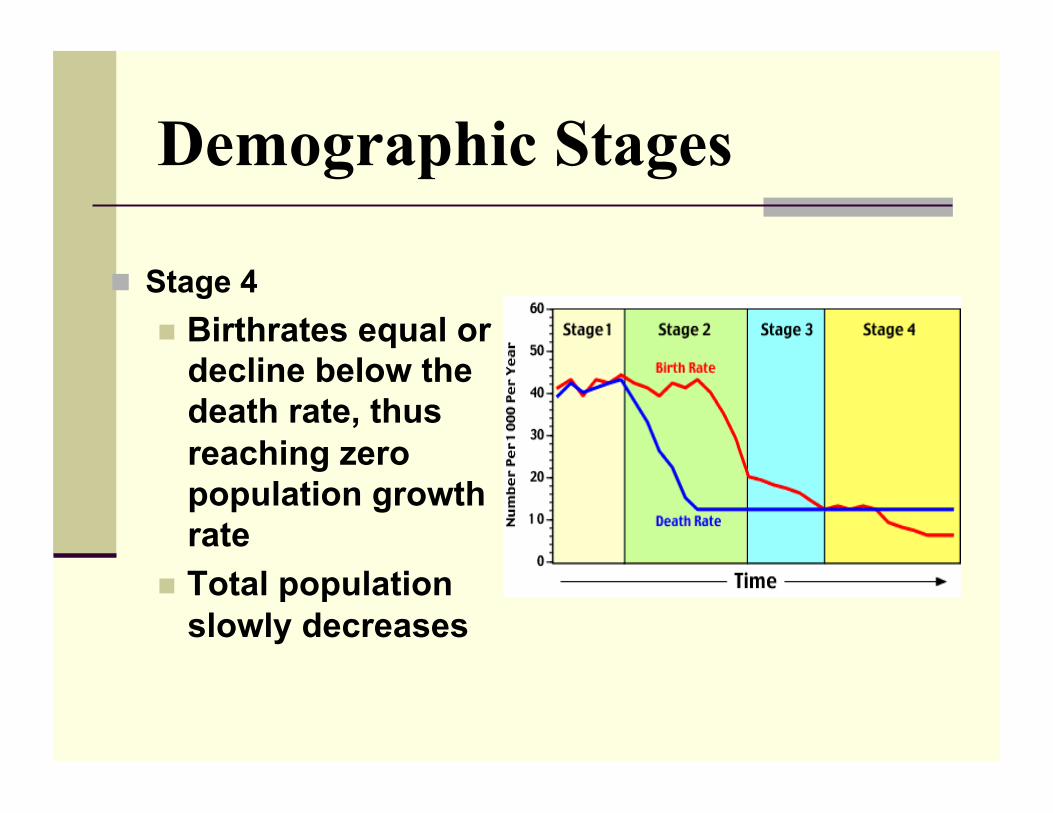
Demographic Stages
Stage 4 Birthrates equal or
decline below the death rate, thus reaching zero population growth rate
Total population slowly decreases