Embed Size (px)
Citation preview

RESEARCH Open Access
Population pharmacokinetics andpharmacodynamics of hydroxyurea in sickle cellanemia patients, a basis for optimizing thedosing regimenInes Paule1,2, Hind Sassi3, Anoosha Habibi4, Kim PD Pham3, Dora Bachir4, Frédéric Galactéros4, Pascal Girard1,2,Anne Hulin3 and Michel Tod1,2,5*
Abstract
Background: Hydroxyurea (HU) is the first approved pharmacological treatment of sickle cell anemia (SCA). Theobjectives of this study were to develop population pharmacokinetic(PK)-pharmacodynamic(PD) models for HU inorder to characterize the exposure-efficacy relationships and their variability, compare two dosing regimens bysimulations and develop some recommendations for monitoring the treatment.
Methods: The models were built using population modelling software NONMEM VII based on data from twoclinical studies of SCA adult patients receiving 500-2000 mg of HU once daily. Fetal hemoglobin percentage (HbF%) and mean corpuscular volume (MCV) were used as biomarkers for response. A sequential modelling approachwas applied. Models were evaluated using simulation-based techniques. Comparisons of two dosing regimenswere performed by simulating 10000 patients in each arm during 12 months.
Results: The PK profiles were described by a bicompartmental model. The median (and interindividual coefficientof variation (CV)) of clearance was 11.6 L/h (30%), the central volume was 45.3 L (35%). PK steady-state wasreached in about 35 days. For a given dosing regimen, HU exposure varied approximately fivefold among patients.The dynamics of HbF% and MCV were described by turnover models with inhibition of elimination of response. Inthe studied range of drug exposures, the effect of HU on HbF% was at its maximum (median Imax was 0.57, CVwas 27%); the effect on MCV was close to its maximum, with median value of 0.14 and CV of 49%. Simulationsshowed that 95% of the steady-state levels of HbF% and MCV need 26 months and 3 months to be reached,respectively. The CV of the steady-state value of HbF% was about 7 times larger than that of MCV. Simulations withtwo different dosing regimens showed that continuous dosing led to a stronger HbF% increase in some patients.
Conclusions: The high variability of response to HU was related in part to pharmacokinetics and topharmacodynamics. The steady-state value of MCV at month 3 is not predictive of the HbF% value at month 26.Hence, HbF% level may be a better biomarker for monitoring HU treatment. Continuous dosing might be moreadvantageous in terms of HbF% for patients who have a strong response to HU.
Trial Registration: The clinical studies whose data are analysed and reported in this work were not required to beregistered in France at their time. Both studies were approved by local ethics committees (of Mondor Hospital andof Kremlin-Bicetre Hospital) and written informed consent was obtained from each patient.
* Correspondence: [email protected]é de Lyon, Lyon, FranceFull list of author information is available at the end of the article
Paule et al. Orphanet Journal of Rare Diseases 2011, 6:30http://www.ojrd.com/content/6/1/30
© 2011 Paule et al; licensee BioMed Central Ltd. This is an Open Access article distributed under the terms of the Creative CommonsAttribution License (http://creativecommons.org/licenses/by/2.0), which permits unrestricted use, distribution, and reproduction inany medium, provided the original work is properly cited.

Disease nameSickle cell anemia.
DefinitionSickle cell anemia is an autosomal recessive geneticblood disorder, caused by a mutation in the hemoglobingene and characterized by rigid sickle-shaped red bloodcells. Sickling decreases the cells’ elasticity and leads tovaso-occlusion which may result in various complica-tions, such as acute painful crises, ischemia and damageof various organs, acute chest syndrome or stroke.
BackgroundThe antineoplastic agent hydroxyurea (hydroxycarba-mide) (HU) is the first approved pharmacological treat-ment of sickle cell anemia (SCA). It inhibits theproduction of the hemoglobin S that causes SCA andfavors the reactivation of fetal hemoglobin (HbF) expres-sion [1]. In fact, a variety of mechanisms are believed tobe involved in HU beneficial effects in SCA, includingincreased HbF synthesis by erythroid regeneration, NO-related increases in soluble guanylate cyclase activityand cyclic guanidine monophosphate (cGMP) that sti-mulate HBG expression [2]. Other mechanisms may bemyelosuppression with a reduction of circulating neu-trophils, increased erythrocyte water content, modifiederythrocyte endothelial cell interactions and altered vas-cular tone by increasing NO bioavailability [3]. Recently,Bartolucci et al. reported that HU could reduce abnor-mal sickle cell adhesion to the vascular wall by regulat-ing the activation state of adhesion molecules [4]. HUtreatment reduces the rate and severity of painfulattacks [5] and was shown to possibly increase survivaltime [6].The usual dosing of this oral treatment is daily doses
of 15-35 mg/kg (or less if there is renal insufficiency)[7]. The most adequate individual dose is determined bystarting with 15 mg/kg and monitoring full blood cellcounts every two weeks. If after twelve weeks no cytope-nia has developed, the dose is increased by 5 mg/kg.Once their maximal tolerable dose is determined, thepatient can continue the treatment life-long, if no ser-ious toxicities manifest or other issues arise.Despite the widespread use of HU, only a few studies
have been reported in the literature, especially concern-ing its use in the indication of SCA. Little is knownabout the relationship between drug exposure and effi-cacy, evaluated by fetal hemoglobin (HbF) and meancorpuscular volume (MCV) measurements. Although anumber of genetic polymorphisms have been found tobe associated with response to HU [8-10], the variabilityof this response remains poorly characterized. The opti-mal dosing schedule, the best strategy for monitoringand adjusting the treatment, and the impact that may
have the prior determination of candidate genotypes onHU dosing remain open to discussion. Part of thesequestions may be addressed through simulations frompharmacokinetic (PK) and pharmacodynamic (PD) mod-els of HU. Therefore, this study aimed to develop popu-lation PK-PD models for HU in order to characterizethe exposure-efficacy relationships and their variability.These models were then used (1) to compare two dos-ing regimens (one continuous daily and the other withinterruptions of 2 days after every 5 days) by simulation,and (2) to develop some recommendations for monitor-ing the treatment.
MethodsTwo datasets from two studies with different designswere used in this analysis: one from a PK-PD study withup to 9 samples taken per patient over a period of up to30 months, and the other from a PK study with 10 sam-ples per patient taken over 24 hours after drugadministration.
PKPD study design (sparse sampling)Study design and patient populationThis 30-month, open-label, noncomparative, prospec-tive, observational study was conducted in 81 adultpatients with sickle cell anemia at the Centre de référ-ence pour les syndromes drépanocytaires majeurs, AP-HP, GH H. Mondor, Université Paris Est-Créteil, Francefrom 2007 to 2010. It focused on the benefits and risksof HU, in particular the side effects in the short andmedium term, as well as the need for regular hematolo-gical monitoring. The protocol was approved by thelocal ethics committee of Mondor hospital, and writteninformed consent was obtained from each patient. Therecruited SCA patients were of 18 years or older andwith Hb genotype HbSS (homozygous sickle Hb). In allpatients, SCA diagnosis was documented by standardmethods [7]. Patients who received erythropoietin or ablood transfusion at a time that can interfere with theresults were excluded.TreatmentHU treatment was started at a dose of 20 mg/kg orallyunless there was renal insufficiency (in this case itstarted at 10 and 15 mg/kg). Since hematotoxicity is thedose-limiting toxicity, the hematologic control was per-formed every 15 days during the first month and thenevery month; if needed, doses were adjusted to maintainneutrophil counts higher than 3 × 10⁹/L. In most cases,the final dose of HU did not exceed 30 mg/kg.Pharmacokinetics protocolBlood was drawn from most patients on day 0 (D0),D15, after 1 month (M1), M2, M4 and M6, as well as atvarious later timepoints more sparsely (up to M30). Itwas collected in heparinized tubes and centrifuged at
Paule et al. Orphanet Journal of Rare Diseases 2011, 6:30http://www.ojrd.com/content/6/1/30
Page 2 of 12

2000 g for 10 minutes at room temperature to obtainplasma. The plasma was then stored at -20°C until thesamples were assayed. Plasma samples were assayedusing high performance liquid chromatography (HPLC)coupled with UV-detection at 449 nm [11]. The analyti-cal method was linear between 5 to 1000 μM, precise(coefficients of variation ranging from 1.7 to 9.9%),accurate (97.7 to 103.9%). The limit of quantification(LOQ) was 7 μM (0.532 mg/L).The following biologic variables were measured during
this study: creatinine, urea, lactate dehydrogenase(LDH), hemoglobin (Hb), fetal hemoglobin (HbF), meancorpuscular volume (MCV), mean corpuscular hemoglo-bin (MCH), ferritin, bilirubin, aspartate transaminase(AST), alanine transaminase (ALT), neutrophils (PMN)and platelets. Body weight, age and sex data were alsodocumented.
PK study design (rich sampling)These rich PK data come from a bioequivalence study ofstandard hydroxyurea capsules and a new formulation of1000 mg coated breakable tablets in adults with homo-zygous SCA or S/b-thalassemia. The complete studyprotocol is given in a publication of the noncompart-mental analysis of the PK data [12]. The assay validationparameters were the same as for the sparse PK datastudy [11].These data contain 10 blood samples per patient, from
16 patients who took hydroxyurea doses ranging from1000 mg to 2000 mg. The samples were taken at base-line and 45, 90, 120, 150, 180, 240, 360, 480 minutesafter HU administration at the study center, as well astrough samples after 24 hours.
Population PK-PD modelsPopulation analyses were performed using NONMEMsoftware (version VII) [13]. PK model parameters wereestimated using the second order conditional estimation(Laplacian) method with interaction between interindivi-dual and residual variabilities. This estimation method ismore accurate than the standard first order conditionalestimation (FOCE) method. In this PK analysis it wasneeded to correctly handle the concentrations below thelimit of quantification (BLQ) (see below). PD modelsparameters were estimated using the FOCE methodwith interaction between interindividual and residualvariabilities. Confidence intervals (CI) of parameter esti-mates were obtained by nonparametric bootstrap (n =1000) with stratification by study and dose.Population pharmacokinetic modelFirst, the structural PK model was built using bothsparse and rich datasets. One, two and three-compart-ment models with first-order absorption and eliminationwere tested, as well as with saturable (Michaelis-
Menten) elimination. The most appropriate model waschosen on the basis of the objective function value(OFV) and simulation-based diagnostics such as normal-ised predictive discrepancy errors (NPDE) [14]. TheNPDE analysis was performed with BLQ pointsexcluded.In the two-compartment model, the parameters were
the elimination clearance (CL/F), the volume of the cen-tral compartment (Vc/F), the rate constants for transferfrom central to peripheral (kcp) or peripheral to centralcompartment (kpc), the rate constant for absorption (ka).The BLQ measurements of the sparse data were
included in the data and modelled as censored observa-tions using “method 3” described in [15].The interindividual variability (IIV) for the PK para-
meters was described using exponential models:Pi = θ · eηi, where h is a random variable with normaldistribution, zero mean and variance to be estimated, θis a typical value. The IIV was added in a stepwise man-ner, firstly to clearance and central volume of distribu-tion. The interindividual random effects were kept inthe model if their inclusion significantly reduced theOFV and if their relative SE was <50%. A full interindi-vidual variance-covariance matrix was estimated toassess if there was any significant covariance in the IIVstructure.To find the most appropriate residual error model,
additive, proportional and mixed error models weretested. As data were collected from two quite differentlydesigned studies, separate residual error models for eachstudy were tested.The variables that were investigated for their ability to
explain IIV in the PK of HU were body weight,creatinine, age and sex. Scaling by body weight (forclearance and central volume of distribution) as
Vc = θV · WGT70
and CL = θCL ·(WGT70
)0.75
, as well as
CL = θCL + f (covar), f (covar) =(140− age) · bodyweight · (1− coeffsex · sex)
creatinine(with sex = 0 for men and 1 for women, coeffsex esti-mated), similar to the Cockroft-Gault formula for creati-nine clearance [16], were the tested forms ofrelationships. The conditions for the variable to beretained as a covariate were to be biologically plausible,and to decrease the OFV by at least 5 units, correspond-ing to a p-value less than 2.5%.Missing values of body weight were predicted by the
model: if the patient’s weight was known at other time-point(s), it was predicted by using an interpolated oradjacent value and an additive individual random effectwhose variance was fixed to the observed intraindividualvariance of the body weight of the dataset (1.5); if nodata of patient’s weight were available, it was predictedby using the average weight of the dataset (62 kg for
Paule et al. Orphanet Journal of Rare Diseases 2011, 6:30http://www.ojrd.com/content/6/1/30
Page 3 of 12
women, 65 kg for men) and an additive individual ran-dom effect whose variance was fixed to the observedinterindividual variances of the dataset (92 for women,40 for men).The time to reach 95% of HU concentration steady-
state was determined by simulation of a typical patientwith 1000 mg dose every day for 6 months.
Population pharmacodynamic modelsThe PD responses to be described by the model wereHbF percentage and MCV. The observed level of boththese responses depends on the ratio of a productionrate to an elimination rate. Therefore, turnover models[17] were chosen to fit the data. Models assuming eitherstimulation of the production or inhibition of the elimi-nation of response by HU were tested. The metrics ofHU exposure used as the input into the PD model wasmean drug concentration at steady state, calculatedusing the individual posthoc estimates of HU clearance.Therefore, a sequential modelling approach was used.The uncertainty in the estimate of clearance was takeninto account by using the IPPSE method [18]. Linear,Emax, sigmoid and power functions were tested for theeffect of the drug. The final model was chosen on thebasis of the OFV and diagnostic plots, stability and pre-cision of parameter estimates. IIV and residual errormodels were constructed in the same way as for the PKmodel.In addition to demographic variables, baseline mea-
surements of pharmacodynamic variables, as well astheir previous values, rate of change per day from base-
line to the previous value (�V =Vt−1 − V0
days), rate of change
per day between the two previous values
(�V =Vt−1 − Vt−2
days) were investigated as covariates. They
were included as additive or proportional to the drugeffect, production rate or elimination rate. Missingvalues were predicted by the model by using the dataaverage and an individual random effect whose variancewas fixed to the value calculated from the data. Theconditions for covariate inclusion were the same as forthe PK model.
Model evaluationThe quality of models was assessed by goodness-of-fitplots and simulation-based methods (using 1000 simula-tions): visual predictive check (VPC) and NPDE. Themean of prediction error distribution was compared tozero by a Wilcoxon signed rank test, while its variancewas compared to unity by a Fisher test. For the VPC,prediction corrections were used so that data of all doselevels could be used in one plot [19]. BLQ points in theobserved and simulated PK data sets were assignedvalues equal to LOQ/2. The VPC plots showed 80% pre-diction intervals (PI) and medians of the observed and
of the predicted data, as well as 95% confidence areasaround the percentiles. For the PK, a VPC plot in logscale was also given.
Simulation of alternative dosing regimensThe two simulated dosing regimens were: 1000 mg dailydoses 7 days a week (7/7) and 1000 mg daily doses 5consecutive days a week (5/7) for the duration of 12months; 10000 patients were simulated in each arm. Foreach covariate, the average observed value was used.The results were compared graphically by representingthe median profile and the 90% prediction interval ofthe HbF% and MCV. In order to determine the steady-state values of the HbF% and of the MCV and time toreach 95% of them, such simulations with 7/7 dosingwere extended for 48 months.
ResultsPharmacokinetic data analysisA summary of PK related patient characteristics is givenin Table 1. In the sparse data, 78% of last doses beforethe concentration measurements were 1000 mg, 15%were 1500 mg, and the rest were 500 mg, 1250 mg or2000 mg. In the rich dataset, 44% were 1000 mg, 31%were 1500 mg, and the rest were either 1250 mg or2000 mg. The median number of measurements perpatient in the sparse dataset was 4 (range: 1 - 9); in therich dataset, 10 measurements were available for eachpatient.The PK profiles were best described by a two-com-
partment model (with first-order absorption and elimi-nation). The NPDE diagnostics indicated that one-compartment model could not adequately describe thesedata. The OFV of the three-compartment model wasnot lower than that of the two-compartment model. Nosignificant nonlinearity in absorption or eliminationcould be detected in these data.Significant interindividual variability was found for Vc,
CL, ka and kcp. Correlations were significant among theindividual values of Vc, CL and kcp. The mixed residualerror model was best for both datasets. The OFVs of PKmodels with and without weight-scaling of Vc and CL(as shown in methods section) were nearly significant,but this covariate was kept in the model for the sake of
Table 1 Summary of patient characteristics
PKPD dataset Rich PK dataset
Characteristics Median (range) Median (range)
Age 30 (18 - 54) 32 (24 - 52)
Men/women 24/57 5/11
Weight (kg) 60 (45 - 163) 63 (42 - 71)
Creatinine (μM) 65 (27 - 558) 72 (47 - 129)
Urea (μM) 3.1 (0.8 - 10.5) 3.4 (2.4 - 7.7)
Paule et al. Orphanet Journal of Rare Diseases 2011, 6:30http://www.ojrd.com/content/6/1/30
Page 4 of 12
coherence with clinical practice and possible applicationof the model to children (where the effect of weightwould be much more perceptible). The allometricmodel for clearance with power 0.75 was better than themodel with power 1 (p = 0.0016).The final model estimates are given in Table 2. As the
bioavailability was not estimated here, the reported esti-mates for CL and Vc represent apparent pharmacoki-netic parameters CL/F and Vc/F. Their values in Table 2are given for a patient of 70 kg weight, which is thescaling base. To obtain values for patients of differentweight, the population value should be multiplied byweight/70 for Vc and by (weight/70)0.75 for CL. The esti-mate of the rate constant of transfer from the peripheralto the central compartment (kpc) was very small andunstable, so its value was fixed to 0.004 (h-1) (its bestestimate) and this resulted in lower estimate of IIV ofkcp and better stability of the model. With this model,the time to reach 95% of the steady-state was typicallyabout 35 days.Simulation-based diagnostics VPC (Figure 1) and
NPDE indicated that the model adequately describedthe measured data. The mean of normalized predictionerrors was significantly different from zero (mean =0.12, p = 0.016), but translated into HU concentrations,the mean difference between observed and predictedconcentrations was only 0.08 mg/L. This difference wasnot considered as relevant from a clinical point of view.The variance of normalized prediction errors was notsignificantly different from unity (0.893, p = 0.12).
Pharmacodynamic data analysisThe median number of HbF% measurements per patientwas 5 (range: 1 - 10); the total number of patients and
measurements was 77 and 391 respectively. The mediannumber of MCV measurements per patient was 6(range: 3 - 10); the total number of patients and mea-surements was 80 and 439 respectively. 43% of patientswith HbF% measurements and 49% of patients withMCV measurements were followed for 6 months (med-ian (range) for HbF%: 6 months (9 days - 30 months);for MCV: 6 months (1 - 30 months)). Summary statis-tics of the pharmacodynamic variables at the beginningand after 6 months in the study are given in Table 3.The treatment with HU induced an increase in HbF, itspercentage (Figure 2 shows its maximums) and in MCV,as well as decreases in bilirubin and LDH, which wereindicative of decrease in the rate of hemolysis. Decreasesin neutrophils (PMN) and platelets were mild, notreaching below normal levels.Population PD model of the percentage of fetal hemoglobinThe turnover model with inhibition of the eliminationrate was found to describe best the HbF% data. However,in this dataset, no relationship between HU concentra-tion and HbF% could be identified, because all patientswere estimated to have the maximum drug effect. Therate of change per day between the two last MCV obser-vations (ΔMCV) was found to be a significant covariatefor the production rate, Kin (p < 0.00001). The median(range) ΔMCV was 0.16 (-0.27 to 0.87). The final modelwas (cf. parameter estimates in Table 4):
dHbF%dt
= Kin, i − Kout, i ·(1− Imax,i
) ·HbF%
where Kin,i = Kin,TV · eηKin ,i · eθ�MCV ·�MCV, Kout,i = Kout,TV · eηKout,i,Imax,i =
eLImax,TV+ηImax,i
1 + eLImax,TV+ηImax,iand LImax is the logit-transformed
Imax.
Table 2 Parameter estimates of the population PK model
Parameters Typical values (95% CI) Standard deviations of IIV (95% CI) Interindividual CV
Vc/F (L) (for a patient of 70 kg) 45.3 (38.9 - 50.5) 0.34 (0.23 - 0.46) 35%
Cl/F (L/h) (for a patient of 70 kg) 11.6 (10.4 - 12.9) 0.29 (0.22 - 0.40) 30%
ka (h-1) 3.29
θka (h-1) (ka = θka · eηka + α) 3.02 (2.25 - 4.19) 1.34 (1.16 - 1.65) 224%
kcp (h-1) 0.027 (0.021 - 0.037) 0.57 (0.43 - 0.95) 62%
kpc (h-1) (fixed) 0.004 - -
SD of the additive component of the residual error (mg/L)
- for densely sampled data 0.319 (0.197 - 0.492)
- for sparsely sampled data 0.353 (0.257 - 0.522)
SD of the proportional component of the residual error
- for densely sampled data 0.12 (0.083 - 0.154)
- for sparsely sampled data 0.435 (0.349 - 0.506)
Correlation (hVc, hCl) 0.71
Correlation (hVc, hkcp) -0.26
Correlation (hCL, hkcp) 0.37
CI: confidence intervals, obtained by bootstrap (n = 1000), IIV: interindividual variability, CV: the apparent coefficient of variation of interindividual variability.
Paule et al. Orphanet Journal of Rare Diseases 2011, 6:30http://www.ojrd.com/content/6/1/30
Page 5 of 12

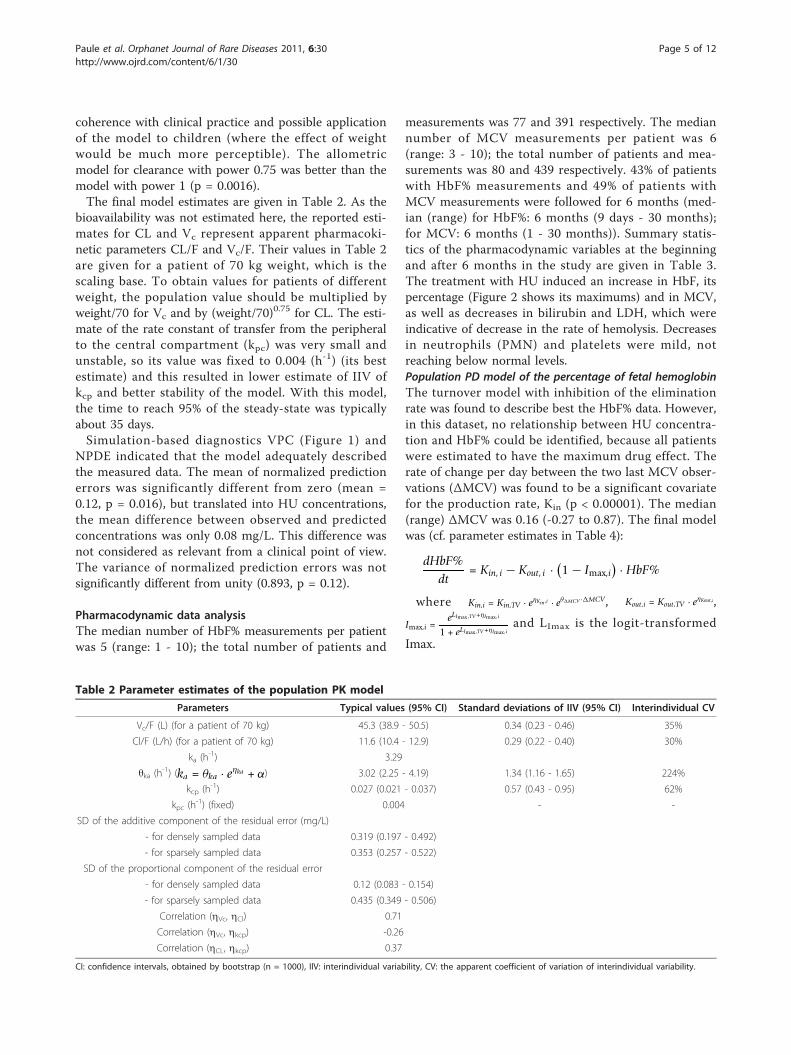
Significant interindividual variability was found for Kin,Kout and LImax, with correlation between Kout and LImax.A proportional residual error model was selected.Simulation-based diagnostics VPC (Figure 3) and
NPDE indicated that the model adequately describedthe observed HbF% data. The mean of NPDE was 0.03(p = 0.3), the variance was 0.937 (p = 0.38). Concerningthe VPC, for the first 300 days, the difference betweenthe medians of HbF% observations and of its predictionswas approximately 2%, which was not clinically signifi-cant. Only 14 patients out of 81 continued the treat-ment longer than 300 days, therefore the percentiles at
later times may be imprecise. The NPDE versus timeplots did not indicate any prediction deficiencies (datanot shown).In the simulation, median HbF% at steady-state was
about 18.6%, 95% of it was reached in about 26 months.Population PD model of the mean corpuscular volumeThe turnover model with inhibition of the eliminationrate was found to describe best the MCV data. The inhi-bition was best described by a power function of averageconcentration. The rate of change per day between thetwo last HbF% observations (ΔHbF%) was found to be asignificant covariate on the parameter b (p < 0.00001).
Figure 1 PC-VPC for HU concentrations. The lines show the 10th, 50th and 90th percentiles of observed data (thick lines) and of predictions(thin lines); the grey areas represent the 95% confidence areas around the percentiles. PC-VPC: prediction-corrected visual predictive check. Leftpanel: linear scale, right panel: log scale.
Table 3 Summary statistics of PD variables
PD variables At baselineMedian (range)
Number of patients After 6 months of treatmentMedian (range)
Number of patients
HbF% 6.3 (0.6 - 30.7) 65 15.7 (3.9 - 41.6) 46
HbF (g/dL) 0.48 (0.04 - 2.7) 63 1.59 (0.34 - 4.04) 46
Hemoglobin (g/dL) 8.8 (6.3 - 11.9) 73 9.6 (6.9 - 14.4) 55
MCV (fL) 90 (68 - 113) 74 111 (81 - 131) 55
MCH (pg) 30 (21 - 36) 73 37 (25 - 44) 55
PMN (109/L) 56 (25 - 80) 71 49 (26 - 86) 53
Platelets (109/L) 428 (122 - 995) 74 316 (109 - 528) 55
Bilirubin (μM) 43 (9 - 96) 75 30 (6 - 113) 53
LDH (UI/L) 355 (155 - 800) 73 317 (168 - 766) 52
Ferritin (μg/L) 346 (16 - 4500) 72 275 (14 - 2940) 52
AST (UI/L) 32 (17 - 79) 75 31 (12 - 81) 53
ALT (UI/L) 22 (7 - 84) 75 21 (7 - 83) 53
Creatinine (μM) 65 (38 - 142) 75 64 (35 - 137) 52
Urea (μM) 2.9 (1.2 - 13.3) 75 3.3 (1.5 - 9) 52
Paule et al. Orphanet Journal of Rare Diseases 2011, 6:30http://www.ojrd.com/content/6/1/30
Page 6 of 12

The median (range) ΔHbF% was 0.047 (-0.278 to 0.653).The final model was (cf. parameter estimates in Table 5):
dMCVdt
= Kin,i − Kout, i ·(1− βi · Concγ
) ·MCV
where Kin,i = Kin,TV · eηKin ,i, Kout,i = Kout,TV · eηKout,i,βi = βTV · eηβ,i+θ ·�HbF%
Significant interindividual variability was found for Kin,Kout and b, with correlations between all three para-meters. A proportional residual error model wasselected.Simulation-based diagnostics VPC (Figure 4) and
NPDE indicated that the model adequately describedthe observed MCV data. The mean of NPDE was -0.02
(p = 0.87), the variance was 0.9 (p = 0.15). In the VPC,the difference between the medians of MCV observa-tions and of its predictions was approximately 5 fL,which was not clinically significant. In the simulation,median MCV level at steady-state was about 104 pL,95% of it was reached in about 90 days.
Simulation of alternative dosing regimensThe simulated HbF% and MCV profiles with the twodosing regimens are shown in Figures 5 and 6 respec-tively. For MCV, the difference was very small. For HbF%, continuous dosing led to more significantly strongerresponse, especially for patients reaching the highestlevels of HbF%. It can be observed that HbF% required
0 20 40 60 80
1020
3040
Number of patients having achieved this HbF%
Max
imum
ach
ieve
d H
bF%
Figure 2 Maximum achieved HbF% and corresponding cumulative number of patients.
Table 4 Parameter estimates of the population HbF% model
Parameters Typical values (95% CI) SD of IIV (95% CI) Interindividual CV
Kin (%/day) 0.071 (0.055 - 0.094) 0.585 (0.472 - 0.681) 63%
Kout (day-1) 0.013 (0.010 - 0.019) 0.486 (0.334 - 0.602) 52%
LImax (unitless) 0.276 (-0.081 - 0.644)(Imax = 0.569 (0.48 - 0.656))
1.44 (1.07 - 1.97) 27%
θΔMCV (day-1) 1.37 (0.95 - 1.76)
SD of proportional residual error 0.142 (0.119 - 0.162)
Correlation (hKout, hImax) 0.892
CI: confidence intervals, obtained by bootstrap (n = 1000), SD: standard deviation, IIV: interindividual variability, CV: the apparent coefficient of variation ofinterindividual variability.
Paule et al. Orphanet Journal of Rare Diseases 2011, 6:30http://www.ojrd.com/content/6/1/30
Page 7 of 12
a much longer time than MCV to reach the steady-state(approximately 26 and 3 months for 95% of steady-statelevels respectively). The inter-individual variability ofsteady-state of HbF% was higher than that of MCV: theratios of the 95th to the 5th percentile were approxi-mately 10 and 1.5 respectively.
DiscussionIn this study, population PK-PD models were developedfor the first time, in order to characterize the exposure-efficacy relationships of HU and its variability.
The pharmacokinetics of HU was found to be linear.Other studies in rats and in humans using doses ran-ging between 10 to 800 mg/kg in patients with malig-nancies identified parallel linear renal and saturablenon-renal elimination [20]. The latter could not bedetected in the studies reported here, probably becausethe doses administered were not high enough to reachsaturation of non-renal elimination pathways (10 to 35mg/kg per os in SCA). Otherwise, the presented modelwas consistent with the results of previously reportedstudies.
Figure 3 PC-VPC for HbF%. The lines show the10th, 50th and 90th percentiles of observed data (thick lines) and of predictions (thin lines); thegrey areas represent the 95% confidence areas around the percentiles. PC-VPC: prediction-corrected visual predictive check.
Table 5 Parameter estimates of the population MCV model
Parameters Typical values (95% CI) SD of IIV (95% CI) Interindividual CV
Kin (%/day) 3.71 (3.13 - 4.30) 0.191 (0.083 - 0.401) 19%
Kout (day-1) 0.042 (0.035 - 0.048) 0.186 (0.044 - 0.415) 19%
b (L. mg-1)1/g 0.099 (0.064 - 0.135) 0.457 (0.336 - 0.599) 48%
g (unitless) 0.19 (0.02 - 0.46)
θΔHbF% (day-1) 1.22 (-0.07 - 2.21)
SD of proportional residual error 0.036 (0.030 - 0.040)
Correlation (hKin, hKout) 0.87
Correlation (hKin, hb) -0.98
Correlation (hKout, hb) -0.95
CI: confidence intervals, obtained by bootstrap (n = 1000), SD: standard deviation, IIV: interindividual variability, CV: the apparent coefficient of variation ofinterindividual variability.
Paule et al. Orphanet Journal of Rare Diseases 2011, 6:30http://www.ojrd.com/content/6/1/30
Page 8 of 12
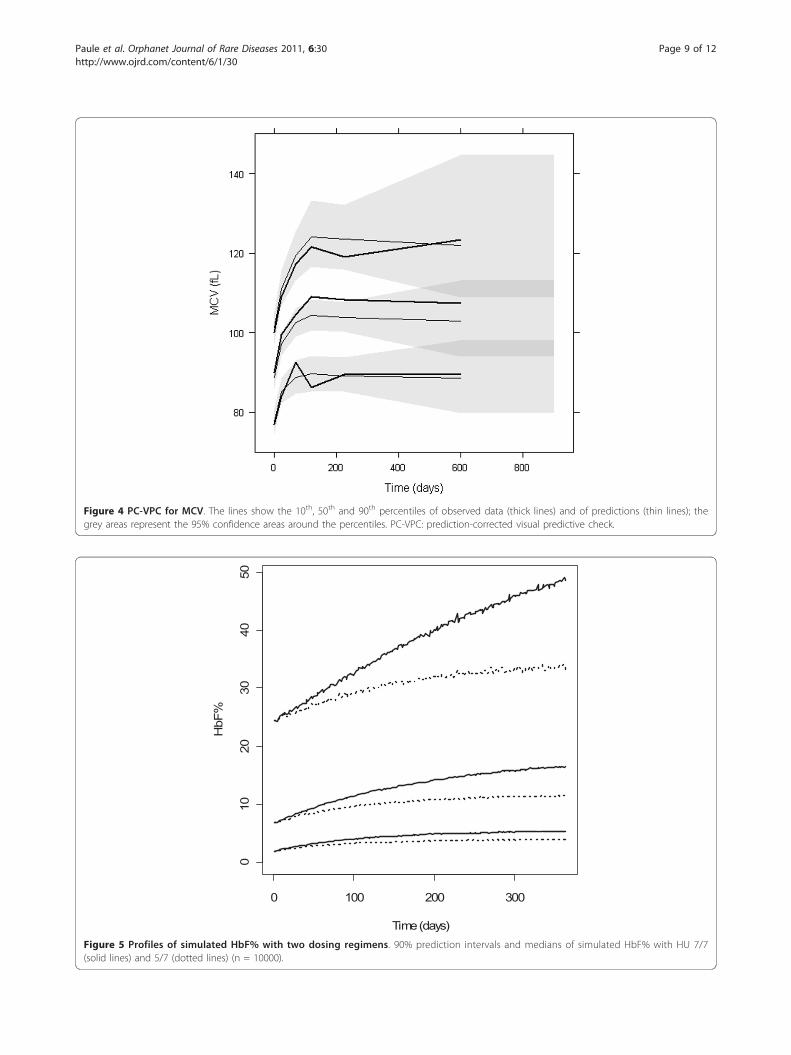
Figure 4 PC-VPC for MCV. The lines show the 10th, 50th and 90th percentiles of observed data (thick lines) and of predictions (thin lines); thegrey areas represent the 95% confidence areas around the percentiles. PC-VPC: prediction-corrected visual predictive check.
0 100 200 300
010
2030
4050
Time (days)
HbF
%
Figure 5 Profiles of simulated HbF% with two dosing regimens. 90% prediction intervals and medians of simulated HbF% with HU 7/7(solid lines) and 5/7 (dotted lines) (n = 10000).
Paule et al. Orphanet Journal of Rare Diseases 2011, 6:30http://www.ojrd.com/content/6/1/30
Page 9 of 12

For a given dosing regimen, HU exposure variedapproximately fivefold among patients. Part of the varia-bility of apparent clearance and apparent volume of thecentral compartment was related to body weight. Clear-ance was better correlated with body weight at a 0.75power, according to allometric scaling laws [21]. Becausethe maintenance dose of a drug to reach a desired aver-age concentration is determined solely by its clearance,this allometric relationship implies that the HU dosingrate should be calculated with respect to body weight tothe power of 0.75, or equivalently, to free fatty mass[22], in order to decrease the interindividual variabilityin HU exposure. Finally, the time to reach 95% of thepharmacokinetic steady-state was typically 35 days, incontrast with the delay to reach the maximal effect ofHU, as discussed below.The haematological results obtained in this study are
compatible with those previously reported [23]. Ourstudy brought further insight on the relationshipbetween exposure and efficacy.First, from a kinetic point of view, if we expressed the
estimated Kout parameters as half-lives and then multi-plied them by 5 to obtain approximate times to reachsteady-state before the drug is taken, we could see thatthey are around 265 and 83 days for HbF% and MCVrespectively. HU is assumed to reduce Kout and
therefore extend this time to steady-state. The simula-tions under a constant dosing rate at 1000 mg per dayshow that 95% of the steady-state levels of HbF% andMCV need 26 months and 3 months to be reached,respectively. If the dosing regimen is modified, the samedelay is required to reach a new steady-state. Hence, thevariation of MCV is more rapid than that of HbF%. The3 month delay for MCV is certainly related to the lifespan of RBC of 120 days and corresponds to the timeneeded to renew three quarters of RBCs.Second, the effect of HU on HbF% was estimated to
be at its maximum independently of the exposure, inthe dose range of our study (500 to 2000 mg/day). How-ever, the intensity of the effect (Imax) varied amongpatients, with a typical value of 0.57 and a coefficient ofvariation of 27%. None of the demographic and biologi-cal indices was correlated with these variations. Part ofthis variability might be explained by genetic poly-morphisms in genes regulating HU metabolism or trans-porters, HbF expression and erythroid progenitorproliferation [8-10]. These polymorphisms might modu-late the patient response to HU. In addition, the HU-inducible small guanosine triphosphate-binding protein,secretion-associated and RAS-related (SAR) protein hasbeen demonstrated to play a key role in HBG inductionand erythroid maturation by causing cell apoptosis and
0 100 200 300
6080
100
120
Time (days)
MC
V (f
L)
Figure 6 Profiles of simulated MCV with two dosing regimens. 90% prediction intervals and medians of simulated MCV with HU 7/7 (solidlines) and 5/7 (dotted lines) (n = 10000).
Paule et al. Orphanet Journal of Rare Diseases 2011, 6:30http://www.ojrd.com/content/6/1/30
Page 10 of 12

G1/S-phase arrest [24]. Some genetic polymorphismsrelated to this pathway have been described such assar1a promoter polymorphisms [10] and may also con-tribute to variability. Finally, patient compliance to treat-ment might also be a source of variability in response,but no information on compliance was available in thisstudy.Third, HU increased HbF% by reducing HbF elimina-
tion rate constant by 57% (for a typical patient). Abso-lute values of HbF per RBC (medians) at baseline andafter 6 months were 1.9 pg and 5.6 pg respectively,which confirms that HU leads to a real increase in HbFper cell. Theoretically, a full inhibitor could reduce theelimination rate further, leading to a higher increase ofHbF%. Hence, there is room for improvement, e.g. bylooking for stronger inhibitors, or combining HU withother drugs to be discovered.Fourth, a relation between HU exposure and effect on
MCV could be identified, but this relation was flat as inthe studied range of drug exposure the effect was closeto its maximum. When the average HU concentrationwas 2 or 9 mg/L (the extremes of this study), the MCVdecay rate constant (Kout) was multiplied by 0.88 or 0.84respectively, with an interindividual coefficient of varia-tion of 49%. Hence the inhibition of MCV “elimination”by HU was less potent than that of HbF, and the inter-individual variability was greater.Regarding simulations, a close inspection of Figures 5
and 6 reveals that the interindividual variability of thesteady-state values of HbF% and MCV are different, theratio of the 95th to 5th percentile being approximately10 and 1.5 respectively. Although the effects of HU onMCV and HbF% variations are correlated, the steady-state value of MCV at month 3 is not predictive of theHbF% value at month 26. Hence, HbF% level, which isalso directly related to the relief of sickle cell diseasesymptoms, may be the best biomarker for monitoringHU treatment.No dose-limiting toxicity occurred in this study, which
prevented a toxicity model from being developed.Nevertheless, cytopenia may occur during HU treat-ment, leading to dose reduction. We compared by simu-lation two dosing regimens, one continuous daily andthe other with interruptions of 2 days after every 5 days.The difference was very small regarding the MCV pro-file, but larger for the HbF% profile, particularly forsimulated patients in the last quartile of HbF% distribu-tion. For these patients, continuous dosing may induce aclinically relevant increase of HbF% compared with thediscontinuous schedule. The limits of this simulationexercise are that genetic polymorphisms were notaccounted for, and some other biomarkers (arginase,NO enzymes, activated adhesion molecules, phosphati-dylserine externalization [25,26]) were not evaluated.
ConclusionsThe mode of action of HU on two clinically relevantbiomarkers of its efficacy was established. The highvariability of response to HU was related in part topharmacokinetics (HU exposure varied approximatelyfivefold among patients), and to pharmacodynamics.The steady-state of HbF% and MCV levels need 26months and 3 months to be reached, respectively, andthe interindividual variability of the steady-state valuesof HbF% is much greater than that of MCV. As a result,the steady-state value of MCV at month 3 is not predic-tive of the HbF% value at month 26. Hence, HbF% levelmay be a better biomarker than MCV for monitoringHU treatment. Simulations showed that continuous dos-ing led to a stronger response than intermittent dosing(5 days out of 7), especially for patients reaching thehighest levels of HbF%. Hence, a continuous dosingshould be prescribed. Finally, an exciting perspectivesuggested by the model is that HbF could be furtherincreased by more potent drugs or by drug combina-tions. In future studies, the model may allow to describequantitatively the impact of relevant polymorphisms onthe variability of response to HU, in order to refine thesimulations and to yield specific recommendations foreach genotype or haplotype.
Acknowledgements and FundingWe thank Emilie Hénin for advice concerning VPC plots and ChristineFauroux for collecting the data. The PK study was funded by OTL-PharmaLaboratories which participated solely to the study design. The PKPD studywas funded by the Centre de référence pour les syndromes drépanocytairesmajeurs and the Laboratoire de Pharmacologie, AP-HP, GH H. Mondor towhich belong most authors.
Author details1Université de Lyon, Lyon, France. 2EMR3738 CTO, Faculté de MédecineLyon-Sud, Université Lyon 1, Oullins, France. 3Laboratoire de Pharmacologie,AP-HP, GH H. Mondor, Université Paris Est-Créteil, Créteil, France. 4Centre deréférence pour les syndromes drépanocytaires majeurs, AP-HP, GH H.Mondor, Université Paris Est-Créteil, Créteil, France. 5Hôpital Croix-Rousse,Hospices Civils de Lyon, Lyon, France.
Authors’ contributionsStudy design: MT, AHulin and FG; inclusion and follow-up of patients:AHabibi, DB, FG; measurement of HU, monitoring of biological data: HS,KPDP and AHulin; statistical analysis, modelling and simulations: IP, PG andMT, writing of the manuscript: IP, MT, PG, AHulin and FG. All authors readand approved the final manuscript.
Competing interestsThe authors declare that they have no competing interests.
Received: 21 December 2010 Accepted: 28 May 2011Published: 28 May 2011
References1. Rodgers GP, Dover GJ, Noguchi CT, Schechter AN, Nienhuis AW:
Hematologic responses of patients with sickle cell disease to treatmentwith hydroxyurea. N Engl J Med 1990, 322(15):1037-1045.
2. Cokic VP, Smith RD, Beleskin-Cokic BB, Njoroge JM, Miller JL, Gladwin MT,Schechter AN: Hydroxyurea induces fetal hemoglobin by the nitric oxide-
Paule et al. Orphanet Journal of Rare Diseases 2011, 6:30http://www.ojrd.com/content/6/1/30
Page 11 of 12

dependant activation of soluble fetal hemoglobin by the nitric oxide-dependant activation of soluble guanylyl cyclase. J Clin Invest 2003,111(2):231-239.
3. Okpala IE: New therapies for sickle cell disease. Hematol Oncol Clin NorthAm 2005, 19(5):975-987.
4. Bartolucci P, Chaar V, Picot J, Bachir D, Habibi A, Fauroux C, Galactéros F,Colin Y, Le Van Kim C, El Nemer W: Decreased sickle red blood celladhesion to laminin by hudroxyurea is associated with inhibition of Lu/BCAM protein phosphorylation. Blood 2010, 116(12):2152-2159.
5. Charache S, Terrin ML, Moore RD, Dover GJ, Barton FB, Eckert SV,McMahon RP, Bonds DR, the investigators of the multicenter study ofhydroxyurea in sickle cell anemia: Effect of hydroxyurea on the frequencyof painful crises in sickle cell anemia. N Engl J Med 1995, 332:1317-1322.
6. Steinberg MH, Barton F, Castro O, Pegelow CH, Ballas SK, Kutlar A,Orringer E, Bellevue R, Olivieri N, Eckman J, Varma M, Ramirez G, Adler B,Smith W, Carlos T, Ataga K, DeCastro L, Bigelow C, Saunthararajah Y,Telfer M, Vichinsky E, Claster S, Shurin S, Bridges K, Waclawiw M, Bonds D,Terrin M: Effect of hydroxyurea on mortality and morbidity in adult sicklecell anemia. JAMA 2003, 289:1645-1651.
7. Platt OS: Hydroxyurea for the treatment of sickle cell anemia. N Engl JMed 2008, 358(13):1362-1369.
8. Collins FS, Green ED, Guttmacher AE, Guyer MS: A vision for the future ofgenomics research. Nature 2003, 422(6934):835-847.
9. Ma Q, Wyszynski DF, Farrell JJ, Kutlar A, Farrer LA, Baldwin CT,Steinberg MH: Fetal hemoglobin in sickle cell anemia: geneticdeterminants of response to hydroxyurea. Pharmacogenomics J 2007,7:386-394.
10. Kumkhaek C, Kumkhaek C, Taylor JG, Zhu J, Hoppe C, Kato GJ, Rodgers GP:Fetal haemoglobin response to hydroxycarbamide treatment and sar1apromoter polymorphisms in sickle cell anaemia. Br J Haematol 2008,141:254-259.
11. Bachir D, Hulin A, Huet E, Habibi A, Nzouakou R, El Mahrab M, Astier A,Galacteros F: Plasma and urine hydroxyurea levels might be useful in themanagement of adult sickle cell disease. Hemoglobin 2007, 31(4):417-425.
12. De Montalembert M, Bachir D, Hulin A, Gimeno L, Mogenet A, Bresson JL,Macquin-Mavier I, Roudot-Thoraval F, Astier A, Galactéros F:Pharmacokinetics of hydroxyurea 1000 mg coated breakable tablets and500 mg capsules in pediatric and adult patients with sickle cell disease.Haematologica 2006, 91(12):1685-1688.
13. Beal S, Sheiner LB, Boeckmann A, Bauer RJ: NONMEM User’s Guides (1989-2009) Ellicott City, Icon Development Solutions; 2009.
14. Brendel K, Comets E, Laffont C, Laveille C, Mentré F: Metrics for externalmodel evaluation with an application to the populationpharmacokinetics of gliclazide. Pharm Res 2006, 23:2036-2049.
15. Beal SL: Ways to fit a PK model with some data below the quantificationlimit. J Pharmacokinet Pharmacodyn 2001, 28(5):481-504.
16. Cockcroft D, Gault MD: Prediction of creatinine clearance from serumcreatinine. Nephron 1976, 16(1):31-41.
17. Krzyzanski W, Jusko WJ: Mathematical formalism and characteristics offour basic models of indirect pharmacodynamic responses for druginfusions. J Pharmacokinet Biopharm 1998, 26(4):385-408.
18. Lacroix BD, Friberg LE, Karlsson MO: Evaluating the IPPSE method forPKPD analysis [abstract]. Population Approach Group in Europe: 8-11 June2010; Berlin [http://www.page-meeting.org/default.asp?abstract=1843],Abstract Nr. 1843.
19. Bergstrand M, Hooker AC, Wallin JE, Karlsson MO: Prediction-correctedvisual predictive checks for diagnosing nonlinear mixed-effects models.AAPS J , Published online 08-02-2011..
20. Gwilt PR, Tracewell WG: Pharmacokinetics and pharmacodynamics ofhydroxyurea. Clin Pharmacokinet 1998, 34(5):347-358.
21. West GB, Brown JH, Enquist BJ: A general model for the origin ofallometric scaling laws in biology. Science 1997, 276(5309):122-6.
22. Green B, Duffull SB: What is the best size descriptor to use forpharmacokinetic studies in the obese? Br J Clin Pharmacol 2004,58(2):119-33.
23. Lanzkron S, Strouse JJ, Wilson R, Beach MC, Haywood C, Park H, Witkop C,Bass EB, Segal JB: Systematic review: Hydroxyurea for the treatment ofadults with sickle cell disease. Ann Intern Med 2008, 148(12):939-955.
24. Tang DC, Zhu J, Liu W, Chin K, Sun J, Chen L, Hanover JA, Rodgers GP: Thehydroxyurea-induced small GTP-binding protein SAR modulates gamma-
globin gene expression in human erythroid cells. Blood 2005,106:3256-3263.
25. Darghouth D, Koehl B, Madalinski G, Heilier JF, Bovee P, Xu Y, Olivier MF,Bartolucci P, Benkerrou M, Pissard S, Colin Y, Galacteros F, Bosman G,Junot C, Roméo PH: Physiopathology of sickle cell disease is mirrored byred blood cells metabolome. Blood 2010, prepublished online December6.
26. Yasin Z, Witting S, Palascak MB, Joiner CH, Rucknagel DL, Franco RS:Phosphatidylserine externalization in sickle red blood cells: associationswith cell age, density, and hemoglobin F. Blood 2003, 102(1):365-370.
doi:10.1186/1750-1172-6-30Cite this article as: Paule et al.: Population pharmacokinetics andpharmacodynamics of hydroxyurea in sickle cell anemia patients, abasis for optimizing the dosing regimen. Orphanet Journal of RareDiseases 2011 6:30.
Submit your next manuscript to BioMed Centraland take full advantage of:
• Convenient online submission
• Thorough peer review
• No space constraints or color figure charges
• Immediate publication on acceptance
• Inclusion in PubMed, CAS, Scopus and Google Scholar
• Research which is freely available for redistribution
Submit your manuscript at www.biomedcentral.com/submit
Paule et al. Orphanet Journal of Rare Diseases 2011, 6:30http://www.ojrd.com/content/6/1/30
Page 12 of 12