Embed Size (px)
Citation preview

Organisation for Economic Co-operation and Development
ENV/WKP(2020)3
Unclassified English - Or. English
9 March 2020
ENVIRONMENT DIRECTORATE
POLICIES, REGULATORY FRAMEWORK AND ENFORCEMENT FOR AIR QUALITY MANAGEMENT: THE CASE OF JAPAN – ENVIRONMENT WORKING PAPER N°156
By Enrico Botta, Sho Yamasaki (1)
(1) OECD OECD Working Papers should not be reported as representing the official views of the OECD or its member countries. The opinions expressed and arguments employed are those of the authors. Authorised for publication by Rodolfo Lacy, Director, Environment Directorate Keywords: air pollution, regulatory policy, monitoring and enforcement, Japan JEL codes: Q52, Q53, Q58
JT03458614 OFDE
This document, as well as any data and map included herein, are without prejudice to the status of or sovereignty over any territory, to the
delimitation of international frontiers and boundaries and to the name of any territory, city or area.

2 ENV/WKP(2020)3
Unclassified
OECD ENVIRONMENT WORKING PAPERS
OECD Working Papers should not be reported as representing the official views of the OECD or of its
member countries. The opinions expressed and arguments employed are those of the author(s).
Working Papers describe preliminary results or research in progress by the author(s) and are published
to stimulate discussion on a broad range of issues on which the OECD works.
This series is designed to make available to a wider readership selected studies on environmental issues
prepared for use within the OECD. Authorship is usually collective, but principal author(s) are named.
The papers are generally available only in their original language –English or French- with a summary in
the other language.
Comments on Working Papers are welcomed, and may be sent to:
OECD Environment Directorate 2 rue André-Pascal, 75775 Paris Cedex 16, France
or by email: [email protected]
----------------------------------------------------------------------------------- -------
OECD Environment Working Papers are published on
www.oecd.org/environment/workingpapers.htm
------------------------------------------------------------------------------------------
This document and any map included herein are without prejudice to the status of or sovereignty over any
territory, to the delimitation of international frontiers and boundaries and to the name of any territory, city
or area.
The statistical data for Israel are supplied by and under the responsibility of the relevant Israeli authorities.
The use of such data by the OECD is without prejudice to the status of the Golan Heights, East Jerusalem
and Israeli settlements in the West Bank under the terms of international law.
© OECD (2020)
You can copy, download or print OECD content for your own use, and you can include excerpts from
OECD publications, databases and multimedia products in your own documents, presentations, blogs,
websites and teaching materials, provided that suitable acknowledgment of OECD as source and copyright
owner is given.
All requests for commercial use and translation rights should be submitted to [email protected].

ENV/WKP(2020)3 3
Unclassified
The pollution intensity of the Japanese economy, measured as emissions per dollar of GDP, is among the
lowest within OECD countries. However, air pollution remains a significant issue. Almost 80% of the
Japanese residents were exposed to an annual concentration of PM2.5 above the WHO guideline while the
attainment rate of the domestic air quality standard for photochemical oxidants is below 1%. The analysis
of the regulatory and enforcement framework for air quality management in Japan identifies best practises
and key remaining challenges, including a limited understanding of the generation mechanism of ozone
pollution and the need to strengthen cooperation among Prefectures. This paper complements two case
studies on air quality policies in China and Korea, and a third case study on international regulatory
cooperation on air quality in North America, Europe and North-East Asia.
Keywords: air pollution, regulatory policy, monitoring and enforcement, Japan
JEL codes: Q52, Q53, Q58
Abstract

4 ENV/WKP(2020)3
Unclassified
Exprimée en volume d’émissions pour 1 USD de PIB, l’intensité de la pollution est plus faible au Japon
que dans la plupart des autres pays de l’OCDE. La pollution atmosphérique n’en reste pas moins un
problème de taille. Près de 80 % des habitants de l’archipel sont exposés à une concentration annuelle
de PM2.5 supérieure au niveau préconisé par l’OMS tandis que le taux de respect du niveau national fixé
pour les oxydants photochimiques a été inférieur à 1 % en 2016. L’analyse du cadre réglementaire de la
gestion de la pollution atmosphérique au Japon et du système d’application connexe permet de recenser
les meilleures pratiques établies et les tâches essentielles qu’il reste à accomplir, telles que mieux
comprendre le mécanisme de formation de la pollution à l’ozone et resserrer la coopération entre les
préfectures. Ces travaux viennent compléter deux études de cas sur les politiques en faveur de la qualité
de l’air poursuivies en Chine et en Corée, ainsi qu’une troisième sur la coopération internationale en
matière de réglementation sur la qualité de l’air engagée en Amérique du Nord, en Europe et en Asie du
Nord-Est.
Mots clés : pollution de l’air, politique réglementaire, surveillance et application, Japon
Classification JEL : Q52, Q53, Q58
Résumé

ENV/WKP(2020)3 5
Unclassified
Acknowledgements
This paper was prepared by Enrico Botta and Sho Yamasaki of the OECD Environment Directorate, and
was developed with the support of the Ministry of Environment of Korea. The OECD Secretariat is thankful
to the delegates of the OECD Environmental Policy Committee and Regulatory Policy Committee for the
inputs and comments provided throughout the development of this paper. Colleagues from the OECD
Regulatory Policy Division and the Global Relations Secretariat also provided useful comments and
support. The paper was prepared for publication by Soojin JEONG, Jonathan Wright and Stéphanie
Simonin-Edwards.
Authors: Enrico Botta and Sho Yamasaki (OECD).

6 ENV/WKP(2020)3
Unclassified
Table of contents
Abstract 3
Résumé 4
Acknowledgements 5
Executive summary 8
1. Introduction 11
2. Historical and recent trends in air quality and emissions 12
3. The environmental policy-making framework 17
3.1. Main policy actors 17
3.2. Environmental impact assessment of projects and regulations 20
3.3. Stakeholders’ participation 25
4. Key policies and regulations for air quality management 27
4.1. The objectives: Ambient Air Quality Standards 27
4.2. Air quality monitoring 29
4.3. Policies and regulatory tools to improve air quality 30
5. Monitoring & enforcement of regulations 41
5.1. Monitoring 42
5.2. Enforcement 45
5.3. Promotion of compliance 47
References 49
Tables
Table 2.1. Timeline of key environmental policies in Japan 12 Table 3.1. Employees of Ministry of Environment at sub-national level (2017) 19 Table 3.2. NOX damage costs (per tonne, 2015 prices) 23 Table 3.3. List of projects subject to environmental impact assessment 24 Table 4.1. Air quality standards in selected countries and regions 28 Table 4.2. Summary table - standards for stationary sources 32 Table 4.3. Air pollution-related low interest loan by JFC as of 2018 34 Table 4.4. Tax reduction for Eco-friendly vehicles 38

ENV/WKP(2020)3 7
Unclassified
Table 4.5. Tax on diesel and gasoline 38 Table 4.6. Emission standards for passenger cars 40 Table 4.7. Emission standards for Commercial vehicles 40 Table 5.1. Obligation of pollutants emission measurement 43 Table 5.2. Number of facilities / factories checked by local governments in 2016 44 Table 5.3. Valid term of vehicle inspection certificate 45 Table 5.4. Penalties for Soot and Smoke facilities 47
Figures
Figure 2.1. Emissions in Japan – trends and sectoral decomposition 13 Figure 2.2. Regional distribution map of PM 2.5 14 Figure 2.3. Trends in photochemical oxidants (OX) pollution 15 Figure 3.1. Main governmental actors and key responsivities in relation to air quality 18 Figure 3.2. Examples of economic values of pollutants used in CBAs for transport 22 Figure 3.3. Indicators of Regulatory Policy and Governance – stakeholders’ engagement 25 Figure 4.1. Soramame-kun’s distribution map 29 Figure 4.2. Next generation passenger car – new registrations 39
Boxes
Box 2.1. Primary and Secondary pollutants 15 Box 3.1. The Environmental Restoration and Conservation Agency (ERCA) 19 Box 3.2. DEFRA guidelines on emission costing 23 Box 3.3. Online regulatory reform training programmes – the Example of Korea 24 Box 4.1. The Tokyo Environmental Master Plan 30 Box 4.2. Pollution Control Manager 33 Box 4.3. Voluntary approaches and VOCs 35 Box 4.4. Measuring vehicle emissions 36 Box 5.1. OECD Best Practice Principles Regulatory Enforcement and Inspections 42

8 ENV/WKP(2020)3
Unclassified
Executive summary
Key features of the environmental policy framework
In 1950-60s, Japan experienced a period of fast economic growth whose unchecked environmental
externalities led to the diffusion of several pollution-related illnesses (Minamata disease, Itai-Itai disease,
Yokkaichi asthma). Following public demands for improvement in the quality of the environment, Japan
embarked on ambitious reforms and currently features one of the least pollution-intensive GDP among
OECD countries. However, PM2.5 and photochemical oxidants pollution remain significant issues. In 2017,
almost 80% of the Japanese residents were exposed to an annual concentration of PM2.5 above the WHO
guideline while the attainment rate of the domestic Air Quality Standard for photochemical oxidants has
been below 1% in 2016.
The management of air quality, as per other key environmental domains, is still largely based on the legal
framework developed in the 1970s and in the Basic Environmental Act adopted in 1993. Its key features
are:
Emission Limit Values - jointly with the Total Emission Standards for SOx and NOx in high risk areas - are the main tool to regulate air pollution from stationary sources. Pricing instruments, such as taxes or trading scheme, are not included in the policy mix to regulate air pollution. Notably, a system based on Best Available Techniques is not employed in Japan with the exception of mercury.
A specific feature of the Japanese pollution control efforts is the large reliance on Voluntary Approaches. Pollution Control Agreements (or PCAs), which started to proliferate in the early 1960s as a response of local governments to the citizens’ demand for higher environmental quality, are nowadays common across Japan. Voluntary approaches are expected to continue to play an important role in controlling air pollution and, for instance, the recent review of Air Pollution Control Act explicitly refers to Voluntary Action Plans (or VAPs) as a tool to control emissions of Volatile Organic Compounds (VOCs).
Various incentives are in place to promote the purchase of low-emission vehicles while few target investment in pollution abatement technologies. Since 2009 the purchase of eco-friendly vehicles is incentivised through a wide range of tax breaks (e.g. on the automotive acquisition and ownership taxes). The uptake of electric vehicles is further promoted through subsidies for the installation of chargers at private facilities. The main measure to incentivise firms’ investment in environmental friendly technologies is a below-market rate loan program operated by the Japan Finance Corporation. In addition, certain local governments have introduced specific mechanisms (e.g. additional points in bids for public works) to support the adoption of Environmental Management Systems (EMSs), such as ECO Action 21.
As diesel cars are included in the group of vehicles that benefit from the eco-incentives, their sales have surged in recent years with potential negative impact on air quality. This is particularly concerning given the improved

ENV/WKP(2020)3 9
Unclassified
understanding on the link between air pollution and lung cancer that paved the way for the classification of diesel as a definite carcinogenic by the International Agency for Research on Cancer.
Most recent reforms focused on improving the procedures for the ex-ante assessment of projects (Environmental Impact Assessment - EIAs) and regulations (Regulatory Impact Assessment - RIAs). In 2012, the Environmental Impact Assessment Law was revised to improve the level of “environmental democracy” through the introduction of various mechanisms that facilitate public participation (e.g. obligations to hold public sessions or to publish project documents online). In 2017, the Ministry of Internal Affairs and Communications, who is in charge of regulatory impact assessment, released new guidelines with the aim of increasing the application of quantitative evaluation methods. Given their recent release, it is too early to evaluate whether the guidelines led to a higher uptake of quantitative appraisals of the impact of regulations on air quality.
Not all ministerial manuals for Cost Benefits Analysis (CBA) provide clear guidance on how to evaluate the effects of projects on air quality. This is particularly problematic since non-climate impacts that directly affect human health can have large importance for the outcome of a CBA.
The compliance monitoring and enforcement activities in Japan are geared towards guiding economic actors towards compliance with limited recourse to fines and penalties. This is, for instance, clearly visible in the results of inspection activities that saw the issuance – on average during the past three years – of 8,087 guidance and only 5 administrative orders out of more 35,000 annual inspections. Notably, horizontal information sharing on compliance issues is limited, thus hindering synergies across Prefectures.

10 ENV/WKP(2020)3
Unclassified
Key recommendations
Establish progressively more ambitious targets for the concentration of PM2.5 and photochemical oxidants. If these are carefully set, with the ultimate goal of meeting the national air quality standards within a realistic timeline, they can help to create momentum for further reforms. As an example, some Prefectures have already identified interim targets for the improvement of air quality (e.g., Tokyo Metropolitan Government set the goal of zero days with photochemical smog advisory alerts by FY2020).
Consider a broader application of economic instruments to control emissions. Pricing instruments, such as taxes or trading scheme, are generally considered as the most efficient tool to promote green growth. A larger leverage of these instruments may allow to lower the social costs of meeting environmental quality objectives.
Strengthen horizontal cooperation to ensure a swifter response to violations and a better sharing of best practises. A system that would allow prefectures to share data on malpractices may speed-up the identification of similar violations in other regions. Furthermore, given the autonomy granted to Prefectures in designing monitoring and enforcement procedures, a process of identification and collection of relative best-practise could promote their diffusion across regions. The seven regional coordination offices established by the Ministry of Environment may play an important role to this end.
Need to improve understanding of the generation mechanism of ozone pollution. Notwithstanding decrease in the emissions of its main precursors, the concentration of Photochemical Oxidants remain well above the domestic air quality standards. Its generation mechanisms need to be better understood in order to design appropriate policy intervention.
Monitor the impact of the recently updated guidelines for the impact assessment of regulations and update CBA manuals. The organization of “hands-on” seminars and the inclusion of more precise details on how to monetize the cost of air pollution may contribute to a faster diffusion of quantitative methodologies. Ministerial CBA manuals should also be reviewed to ensure they provide clear guidance on how the evaluate the effects of projects on air quality.

ENV/WKP(2020)3 11
Unclassified
This case study is part of a joint project of the OECD Environment Policy Committee and Regulatory Policy
Committee focused on regulatory frameworks, enforcement and co-operation to address air pollution
supported by the Ministry of Environment of Korea. The joint project comprises two pillars:
1. Country studies of policies, regulatory framework and enforcement for air quality management,
covering China, Japan and Korea; and
2. Studies of international regulatory co-operation (IRC) initiatives to address air pollution, focusing
on existing arrangements in North-East Asia, the Canada – United States Air Quality Agreement
(Air Quality Agreement) and the Convention on Long-range Transboundary Air Pollution
(CLRTAP).
This document complements two case studies that focus on policies, regulatory and enforcement
frameworks for air quality management in China (ENV/WKP(2020)4), in Korea (ENV/WKP(2020)5) and
third case study that analyses international regulatory cooperation on air quality in North America, Europe
(the Convention on Long-Range Transboundary Air Pollution) and North-East Asia
(COM/ENV/EPOC/GOV/RPC(2018)1)
These studies are carried out under Revised Output Proposal (ROP) for Intermediate Output 2.3.4.2.11.
Environmental Policy Design and Evaluation- Regulatory quality and enforcement to address air pollution,
under the 2017-2018 EPOC 2018 Programme of Work and Budget (ENV/EPOC(2017)1/ANN3). Overall,
this joint project aims to support the broader ambition of countries in the region to improve their air quality
policies by highlighting the challenges and possible solutions related to the design and enforcement of
effective regulatory frameworks for air quality and the co-operation needs that transboundary air pollution
generates.
This study builds on information collected by the Secretariat through deskwork, questionnaires, and
interviews carried out during a fact-finding mission to China, Japan and Korea undertaken in May 2018.
The case studies have also been revised based on comments received by EPOC and RPC Delegates as
well as the participants at a project workshop in Beijing on 26-27 June 2019. The case study on Japan
benefited from further comments and data provided by the Japanese Ministry of Environment and the
Japanese Ministry of Internal Affairs and Communications. This paper was drafted by Enrico Botta
(ENV/GGGR) and Sho Yamasaki (ENV/GGGR).
1. Introduction

12 ENV/WKP(2020)3
Unclassified
During the 1950s-1960s, Japan experienced a period of fast economic growth that was
accompanied by unprecedented environmental degradation. The unchecked pollution of numerous
environmental media (e.g. air, water bodies) led to several pollution-related illnesses such as the Yokkaichi
asthma, Minamata disease (mercury poisoning) – both named after the cities where they first appeared –
and cadmium poisoning, known as itai-itai or “ouch-ouch” because of the severe bone pain it caused.
In response to the increasing public demand for pollution control measures, a number of reforms
were undertaken during the 1960s-1970s. This process culminated in 1970 with an extraordinary
session of the national Diet, which – often referred as the “green Diet” – introduced (or amended) over
fourteen pollution control measures , and with the establishment of the Environmental Agency in 1971
(Imura and Schreurs, 2005[1]). After this first wave of measures, environmental policies and regulations
were constantly updated in order to respond to new concerns and emerging challenges, a process that
underlines the dynamic nature of environmental policy-making (Table 2.1).
Table 2.1. Timeline of key environmental policies in Japan
year Law or action Brief Description
1962 Establishment of the Smoke and Soot Law Introduction of control of dust and smoke emission from
factories in designated area
1967 Establishment of the Basic Environmental Pollution
Control Law
Clarification of pollutants emission responsibility and
introduction of environmental quality standards
1968 Establishment of the Air Pollution Control Act (Amendment of the Smoke and Soot Regulation Law)
1970 Revision of the Air Pollution Control Act Introduction of nationwide uniform emission control and
direct penalty
1971 Establishment of the Environmental Agency
1978 Revision of the Air Pollution Control Act Introduction of control of automobile exhaust gas
1993 Establishment of the Basic Environmental Act Introduction of concept of environmental pollution
Prevention
2001 Establishment of the Ministry of the Environment &
Establishment of the Automotive NOx/PM Law
Upgrade of the Agency &
Amendment of the Automotive NOx Law
2006 Revision of the Air Pollution Control Act Introduction of control of VOC emission
2009 Introduction of Air quality standard for PM2.5 Establishment of AQS for PM 2.5 in addition to the
standard for PM7
2018 Revision of the Air Pollution Control Act Introduction of BAT control of mercury emission
Source: Authors’ elaboration.
Nowadays, Japan enjoys relatively good levels of air quality. The country features one the least
pollution intensive GDP among the OECD members and the emission levels of major pollutants have been
decoupled from economic activity (Figure 2.1). Per capita levels are also among the lowest among OECD
Countries. For instance, Japan recorded the lowest per capita emission of carbon monoxide and volatile
2. Historical and recent trends in air
quality and emissions
ENV/WKP(2020)3 13
Unclassified
organic compounds (VOCs) while NOx per capita emissions are the third lowest among OECD countries
(OECD data, 2018[2]).
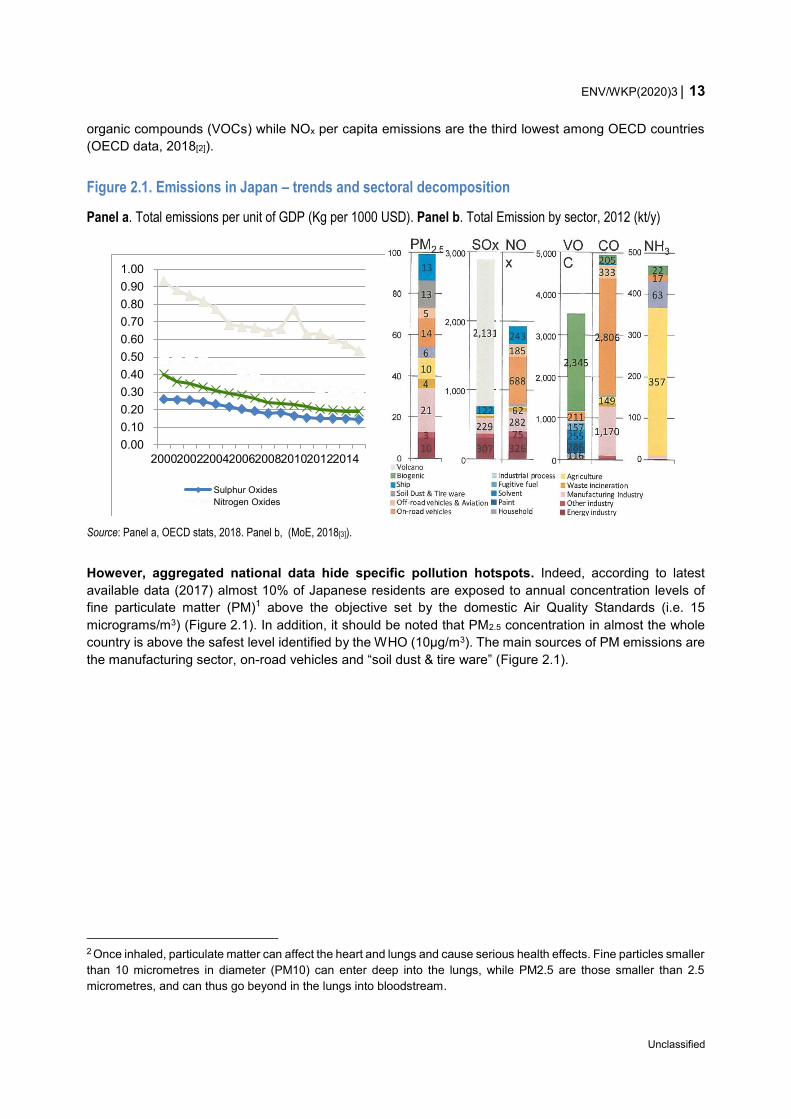
Figure 2.1. Emissions in Japan – trends and sectoral decomposition
Panel a. Total emissions per unit of GDP (Kg per 1000 USD). Panel b. Total Emission by sector, 2012 (kt/y)
Source: Panel a, OECD stats, 2018. Panel b, (MoE, 2018[3]).
However, aggregated national data hide specific pollution hotspots. Indeed, according to latest
available data (2017) almost 10% of Japanese residents are exposed to annual concentration levels of
fine particulate matter (PM)1 above the objective set by the domestic Air Quality Standards (i.e. 15
micrograms/m3) (Figure 2.1). In addition, it should be noted that PM2.5 concentration in almost the whole
country is above the safest level identified by the WHO (10µg/m3). The main sources of PM emissions are
the manufacturing sector, on-road vehicles and “soil dust & tire ware” (Figure 2.1).
2 Once inhaled, particulate matter can affect the heart and lungs and cause serious health effects. Fine particles smaller
than 10 micrometres in diameter (PM10) can enter deep into the lungs, while PM2.5 are those smaller than 2.5
micrometres, and can thus go beyond in the lungs into bloodstream.
0.00
0.10
0.20
0.30
0.40
0.50
0.60
0.70
0.80
0.90
1.00
20002002200420062008201020122014
Sulphur Oxides
Nitrogen Oxides

14 ENV/WKP(2020)3
Unclassified
Figure 2.2. Regional distribution map of PM 2.5
Panel a. Regional distribution map of PM 2.5. Panel b. Share of population exposed to more than 15 µg/m3
Note: data for left panel are the yearly average values for FY2016. Data for the right panel refers to 2017.
Source: Left panel: (MoE, 2018[3]). Right panel: OECD (2018), "Air quality and health: Exposure to PM2.5 fine particles - countries and regions",
OECD Environment Statistics (database).
Also, the concentration of photochemical oxidants2 remains particularly high. Urban
areas - specially in the region of Kanto and Kansai – are characterised by lower air quality (Figure 2.3) but,
at the same time, the air quality standard for photochemical oxidants such as ozone has not been met in
any Prefectures. Furthermore, in 2017 there have been eighty-seven days were the concentration of ozone
reached levels almost double those prescribed by WHO guidelines, thus triggering the release of warnings
to the populations. Importantly, and as opposed to PM pollution, photochemical oxidants are a secondary
pollutant and their generation mechanisms are still not well understood (see Box 2.1).
2 Photochemical oxidants pollution such as ozone has the greatest impact on the respiratory system. Symptoms
associated with exposure include cough, chest pain, and throat and eye irritation.
10%
99% 100%
70%
24% 25%
0%
10%
20%
30%
40%
50%
60%
70%
80%
90%
100%

ENV/WKP(2020)3 15
Unclassified
Box 2.1. Primary and Secondary pollutants
Pollutants can be classified according to their generation mechanisms. Primary pollutants (e.g. sulfur
dioxide (SO2), volatile organic compounds (VOCs) or nitrogen oxides (NOX) are those emitted directly as
a result of human activity or natural processes, while secondary pollutants are created from primary
pollutants through reactions with sunlight and other components in the atmosphere.
Photochemical oxidants, such as ground-level ozone, are often classified as a secondary pollutant.
In fact, ozone is not emitted directly into the air and it is mostly generated by chemical reactions between
nitrogen oxides (NOx) and volatile organic compounds (VOCs) in the presence of sunlight. Emissions from
industrial facilities and electric utilities, motor vehicle exhaust, gasoline vapours, and chemical solvents
are some of the major sources of NOx and VOCs (US EPA, n.d.[4]).
Given its secondary nature, policies aiming at controlling ozone concentration focus on its main
precursors, namely VOCs and NOx. In Japan, numerous instruments have been introduced to control
the emission of these pollutants precursors, such as emission standards for fixed sources of VOCs and
more stringent regulation for mobile-sources in specific regions. However, notwithstanding improvement
in the concentration of these precursors, concentration levels of photochemical oxidants have remained
relatively constant and further research on its generation mechanism is considered as necessary.
Source: (EEA, 2018[5]), (National Institute for Environmental Studies, 2018[6])
Figure 2.3. Trends in photochemical oxidants (OX) pollution
Panel a. Regional distribution map of Monitoring stations with OX pollution alerts. Panel b. Trends in OX concentration
levels (ppb)
Note: Panel A: Black dot stands for "monitoring stations experiencing photochemical ox alerts more than 10 days in 2016". Light green dot
stands for "monitoring stations experiencing photochemical ox alerts 1-9 days in 2016”. Condition for OX pollution alerts: 0.12ppm for hourly
average).
Source: (MoE, 2018[7]).
There is limited understanding of the role of transboundary sources, with the available evidence suggesting
Japan’s downwind location increases its susceptibility to foreign emissions of PM and dust. Modelling
16 ENV/WKP(2020)3
Unclassified
simulation led by JAMSTEC, a research centre within jurisdiction of the Ministry of Education, estimated
that emissions originating on mainland China may account up to 50-60% of PM2.5 annual
mean concentration in Western Japan and 40% in the Kanto area (Ikeda et al., 2015[8]). A joint study by
Japanese and Chinese researchers who focused on SNA (Sulphur, Nitrate, and Ammonia), which
contributes to PM formation, confirmed the importance – specially in the case of Nitrate (NO3) - of
transboundary air movements (Itahashi et al., 2017[9]). Similarly to PM2.5, the concentration of
photochemical oxidants is affected by transboundary sources as well. For instance, JAMSTEC (2007[10])
concluded that NOx sources in East Asia contributed to increase ozone concentration across Japan,
specially during warmer months. Also, modelling simulation by “Photochemical Oxidants Research and
Review Committee” within the MoE (2017[11]) shows that the increased emission of OX precursors (VOC
and NOx) in the eastern Asian continent are likely to lead to increase in daily maximum 8-hour average
concentration in a broader area of Japan, with particularly negative impact on the Kyushu area (southern-
western) than Kanto area (eastern). Cuesta et al. (2018[12]) also find evidence of ozone pollution plumes
transported from the North China Plain to Northern China, Korea and Japan.
ENV/WKP(2020)3 17
Unclassified
3.1. Main policy actors
Following the relatively centralised structure of the Japanese government, most of the
responsibilities for environmental policy making are retained at the central level. The Ministry of
Environment (MoE) has exclusive jurisdiction over several matters involving air pollution. These include
the setting of both ambient air quality standards and emission limits values, the formulation of the total
emissions reduction policies and the determination of the facilities to regulate.
The responsibilities for some air quality policies are fragmented across multiple ministries with no
formal horizontal coordination mechanism in place. This is the case, for instance, of the automotive
sectors where the MoE is in charge of the “Automobile NOx Emission Act” while the Ministry of Economy,
Trade and Industry (METI) elaborates the Basic Energy Plan that sets the targets for clean vehicles
penetration as well as for renewable energy generation (METI, 2014[13]). Given this lack of formal
structures, horizontal cooperation often builds on established practises, such as formal and informal
meetings with different stakeholders. An additional implicit mechanisms to improve coordination is provided
by the Central Environment Council (中央環境審議会 or CEC) that reviews all laws and programs that are
likely to have an environmental impact (Figure 3.1). This is an advisory body3 to MoE and other ministries
(OECD, 2002) and it is composed of non-governmental experts appointed for a period of two years by the
Prime Minister following recommendations by the MoE. The CEC is mainly tasked with providing opinions
and expert judgement on themes established in the Basic Environment Plan (Article 15 Paragraph 3) and
other important matters with regard to environmental conservation (MoE, 2018[14]). Currently, the CEC
has numerous subcommittees working on issues connected to air quality, including the Technical
Committee on Atmospheric Emission Standards, the Special Committee for Fine Particulate Matter and
Automobile Exhaust Gas Comprehensive Measures subcommittee (MoE, 2018[15]).
The annual budget of the MoE almost tripled during the last decade without – however – any large
impact on the resources dedicated to air quality issues. Financial resources increased from 356 billion
yen in 2000 to 1061 billion yen in 2017 (MoE, 2018[3]) while total staff followed a similar trajectory and
grew from 882 to 3,042 persons during the same period . However, this increase – which is mainly driven
by the environmental concerns following the Fukushima nuclear accident in 2011 and climate change – is
coupled with a constant (or slightly decreasing) pool of resources available for air quality matters (MoE,
2018[3]). Table 3.1 provides a break-down of staffing at the subnational level.
A particular institution is Environmental Restoration and Conservation Agency (ERCA) that
manages the programs for pollution prevention and compensation of the sufferers of pollution-
related illnesses. This agency inherited the pollution compensation programs established during the
3 CEC decisions are purely advisory (i.e. not binding) but there is a consolidated practise of acting upon them (MoE,
2018[3]).
3. The environmental policy-making
framework

18 ENV/WKP(2020)3
Unclassified
1970s-1980s to pay certified victims of air pollution. The agency saw its responsibilities broadening over
time to include, among other things, supporting the implementation of measures developed at the central
and local level to reduce air pollution (Box 3.1). The funding of these activities is generated by a mix of
sources, including: the pollution load levy – which is earmarked to pay health compensation benefits –,
20% of the total revenues from the automobile tonnage tax and the funds collected though the so-called
“specified” levy that is imposed on polluters in the areas where the causal relationship between certain
diseases and air pollution is well established, such as the regions of Kumamoto and Kagoshima for the
Minamata and Toyama for Itai-Itai disease (ERCA, 2014[16]).
Prefectures, the lower level of government, have limited policy-making power in relation to air
quality and are mainly in charge of monitoring and enforcement. They can establish stricter emission
standards than those set by the central government and can “formulate a plan for reducing the total quantity
of [pollution]” in areas where it “is difficult to attain the standards for environmental conditions related to
air pollution [..]” (APCA, 2006[17]). As in several other OECD countries, they are also responsible for the
monitoring and enforcement of air quality regulations and for operating the permitting system (Figure 3.1).
Within this context, they also have the responsibility to warn the public when the concentration of selected
pollutants (SOx, SPM, CO, NOx, OX) reach levels considered as dangerous for human health (see section
2.2). It should be noted that the MoE can recommend prefectures to implement stricter emission standards
(APCA, art 5) but the use of this power has been very limited. Importantly, the central government retains
monitoring responsibilities in relation to nuclear matters.
Figure 3.1. Main governmental actors and key responsivities in relation to air quality
Source: Authors’ elaboration.
To improve vertical coordination, seven Regional Environmental Offices have been established by the MoE
in 2005 but their focus is mainly on activities related to waste management and nature conservation
(OECD, 2010[18]). These offices are also responsible for cross-cutting activities, including the development
of environmental awareness and education initiatives (OECD, 2010[18]). Moreover, they take a role of
liaisons between MoE and local governments in case of national disaster by, for instance, informing the
MoE on the results on the samplings of air pollution conducted by local offices (MoE, 2018[19]).

ENV/WKP(2020)3 19
Unclassified
Table 3.1. Employees of Ministry of Environment at sub-national level (2017)
(Units: persons, %)
Total Prefectures Municipalities
Pollution 7,041 3,525 3,516
Environmental conservation 6,894 2,493 4,401
Collection and disposal of waste and sewage
45,140 152 44,988
Total of the above 3 items (a) 59,075 6,170 52,905
(a) as a percentage of (b) 2.5 0.5 4.9
General administrative department (b) 2,383,778 1,308,744 1,075,034
Note: “General administrative department” denotes the total of employees in local governments, excluding employees covered by the accounts
of publicly managed firms
Source: (Ministry of Internal Affairs and Communications, 2018[20]) .
Box 3.1. The Environmental Restoration and Conservation Agency (ERCA)
Following numerous lawsuits both against companies for polluting the environment and the State
for failing to enforce relevant regulations, several programs were established to support victims
of pollution and to promote prevention activities during the 1960s-1970s. One of the first measures
introduced has been the Japan Environment Corporation or “JEC” (1965) that offered firms discounted
loans for investment in pollution prevention activities. Later in 1974, the Law Concerning Pollution-related
Health Damage Compensation established the Pollution-related Health Damage Compensation System
(or PHDCS). Its objectives were to provide compensation benefits, such as medical insurance and
disability allowance, to the certified sufferers of air pollution-related illnesses (such as chronic bronchitis,
bronchial asthma, asthmatic bronchitis and pulmonary emphysema) and Minamata and Itai-Itai diseases.
In order to qualify for benefits, applicants had to pass a medical examination and prove to have lived or
worked in specific regions for more than a certain period of time. In 1984, there were around 100 000
certified patients suffering from air pollution-related illnesses and over 2 000 suffering from Minamata and
Itai-Itai diseases. The certification of new victims of air pollution was terminated in 1987 but payments to
certified suffers continued. Finally in 1988, the “Pollution-related Health Damage Compensation and
Promotion Association” (PHDCPA) was established to operate both the PHCDS and the newly established
“Pollution-related Health Damage Prevention Programme” (PHDPP), which focused mainly on prevention
activities in 47 heavy polluted areas.
The ERCA, established in 2004, inherited the operations of PHDCPA (i.e. PHDCS and PHDPP) as
well as selected roles of JEC. Moreover, ERCA also manages the operation of the Asbestos-related
Health Damage Relief program which was created in 2006 to cover the cost of medical care for people
exposed to asbestos under the Asbestos Health Damage Relief Act. Through these numerous programs,
the ERCA also supports measures carried out by the central, local governments and private organisations
to reduce air pollution, improve nature conservation and the management of waste disposals.
Each program is financed through specific mechanisms. The pollution load levy, (part of) the
automobile tonnage tax, and a so-called “specific levy” imposed on polluting facilities operating in certain
areas are used to cover the expenses of the PHDCS (ERCA, 2014[16]). The PHDPP is financed by the
Pollution Health Damage Prevention Fund investment, a JPY 50 billion (about USD 500 million)

20 ENV/WKP(2020)3
Unclassified
endowment fund established by polluting enterprises and the national government. Finally, the activities
connected to asbestos pollution are financed by transfers from both central and local governments as well
as contributions – computed according to the amount of asbestos used – from enterprises who meet
certain conditions.
Source: (ERCA, 2018[21]), (ERCA, 2014[16]), (Hashimoto, 1989[22])
3.2. Environmental impact assessment of projects and regulations
Environmental Impact Assessment (EIA) and Regulatory Impact Analysis (RIA) can be effective
instruments to promote policy coherence and the consideration of air quality issues in different
policy areas (Wiener and Ribeiro, 2016[23]; Jacob et al., 2011[24]). These can be broadly defined as
analytical tools available to government to evaluate the environmental impacts of individual construction
projects (EIA) and the benefits and costs - also in terms of the environment - of regulations (RIA).
There is a long-standing practise with Environmental Impact Assessments (EIA) in Japan, whose
process has been revised in 2012. Currently, the EIA Law identifies 13 types of project that are classified
as “Class-1 projects” or “Class -2” according to their size. All projects that fall within the first category have
to go through an environmental impact assessment before construction while the competent Ministers are
required to determine – considering the opinions of prefectural governors – the need for an environmental
impact assessment for smaller “Class-2 projects” (Table 3.3). All assessments need to compare the
proposed project with alternative solutions. Importantly, the Minister of the Environment can advise on
items to be included in the assessment (MoE, 2012[25]). The collection of feedbacks from lower levels of
government can be particularly important for air pollution where multiple, small-scale projects may
collectively severely affect overall air quality. Examples may include a thermoelectric power plant localised
where numerous factories are already in operation or a road passing through an area where the
concentration of nitrogen dioxide (NO2) already exceeds the ambient environmental quality standard
(MoE, 2012[25]).
The Revised EIA Law introduced two additional steps in the assessment procedures. Also before
the amendment, there was an requirement to compare the proposed project with alternative solutions.
However, the framework of the project (location, scale, etc.) was determined prior to the beginning of the
EIA process and therefore it was sometime complex to consider alternative solutions along these
dimensions. For this reason, the reform has introduced an additional step prior to the detailed IEA
assessment where all proponents of Class-1 project4 have to prepare a document on “Primary
Environmental Impact Consideration” that has to consider alternative plans on specific features of the
projects, such as location and scale. Stakeholders are invited to provide comments that should be reflected
in the subsequent steps of the EIA. The second newly introduced step is denominated “Impact Mitigation
Reporting” and it is performed once the project is under construction in order to monitor environmental
conditions during its development and operational stage (MoE, 2012[25]).
The Japanese environmental impact assessment (EIA) law and relative guidelines do not mandate
to consider transboundary impacts. Furthermore, Japan is not a signatory part of the Espoo (EIA)
Convention that establishes an obligation for States to notify and consult each other on all major projects
that are likely to have a significant adverse environmental impact across national boundaries.
4 This step is voluntary to class-2 projects.

ENV/WKP(2020)3 21
Unclassified
In addition, as of March 2012, all major cities and prefectures developed their own EIA ordinance5.
These are meant to ensure that also smaller projects, which may have a specific relevance to
environmental quality due to local circumstances, undergo an EIA process. Takao (2016[26]) reports that
these ordinances require the creation of independent review commissions (shinsakai), which provide
“expert opinions”, and often stipulate a power for the local administrative chief to call public hearings
(kochokai) whenever this is considered as necessary.
A Regulatory Impact Analysis (RIA) process was formally adopted in 2007 but has only been
partially applied. The Implementation Guidelines for Policy Evaluation of Regulations state that all new
or revised regulations should be evaluated considering their expected costs and benefits – including in
relation to the environment – in comparison with a baseline and alternative scenarios (Ministry of Internal
Affairs and Communications, 2017[27]). However, as noted by the recently concluded analysis of the Policy
Evaluation Council (2017[28]), the assessments are afflicted by two main issues. First of all, RIAs are mainly
performed at an advanced stage of the regulatory process (while it should be used to improve the
regulation during its formation process and decision making). Secondly, they mostly included only
qualitative considerations. For instance, Yashiro (2016[29]) reports that only five RIAs out of a total of 128
published in 2013 included a quantitative impact assessment. The limited application of quantitative
assessment seems to characterise both RIAs performed by the Ministry of Environment and those
performed by other Ministries (MoE, 2018[19]).
In order to streamline the procedure, the regulatory impact assessment guidelines have been
recently revised while a manual and calculation templates have been developed as well. The revised
guidelines further elaborate on the information and criteria in relation to quantifying and qualifying impacts
and costs, including the various techniques and processes that ministries can adopt under specific
circumstances (e.g. contingent valuation and hedonic pricing). Since these have been published in mid-
2017, it is too early to evaluate their impact. In this regard, the inclusion of predefined values of the social
cost of each additional tonne of emitted pollutant in RIAs manuals or the development of dedicated training
sessions – to be delivered online or offline – may facilitate an higher (and standardised) recourse to
quantitative assessments of the impacts of regulations on air quality (Box 3.3).
Furthermore6, the Ministry of Land, Infrastructure, Transport and Tourism (MLIT) publishes the
“Technical Guideline of Cost-benefit Analysis for Public Project Evaluation” (or “TG”), which
presents the general recommendations for the drafting of Manuals for the CBA of transport
projects. These TG include a wide range of environmental impacts (e.g. air quality, water quality) and
several costing methods. However, the CBA Manuals – which are developed by the various Ministries and
are not required to follow all the TG recommendations - do not always consider all environmental benefits
and costs (ITF, 2015[30]). For instance, the manual for “road CBA” does not consider air pollution impact
while these are included within the manual dedicated to “railway CBA”. This limited focus is particularly
problematic since non-climate impacts that directly affect human health and mortality can especially have
large importance for the outcome of a CBA (OECD, 2018[31]). From this standpoint, it should be considered
that the estimates of the total welfare loss associated to exposure to all air pollution, which includes ambient
PM2.5 exposure as well as ambient ozone exposure and indoor air pollution, range between 5.3% of GDP
in Japan, 4.3% in Korea and 9.92% in China (World Bank and IHME, 2016[32]). In this regard, it should be
noted that some OECD countries include economic values of the impacts of major pollutants for use in the
investment assessments (see Figure 3.2 and Box 3.2).
5 Examples of EIA ordinance by cities and prefectures; Tokyo (Tokyo Bureau of Environment, 2013[158]), Osaka
(Osaka Prefectural Government, 2013[159]), Kanagawa (Kanagawa Prefectural Government, 2014[160]), Chiba (Chiba
Prefectural Government, 2014[161]), Yokohama (City of Yokohama, 2012[162]).
6 This section benefited from the expert advice of Professor K.Hayashi (Nagoya University).

22 ENV/WKP(2020)3
Unclassified
Figure 3.2. Examples of economic values of pollutants used in CBAs for transport
Selected OECD Countries - USD per Tonne
Source: Based on the survey for (OECD, 2018[31]).
259,962
7,878
35,821
136,193
17,080 14,64021,2316,489
43,96522,759 22,641
0
50,000
100,000
150,000
200,000
250,000
300,000
PM NOx SOx
Denmark Germany Ireland Israel
ENV/WKP(2020)3 23
Unclassified
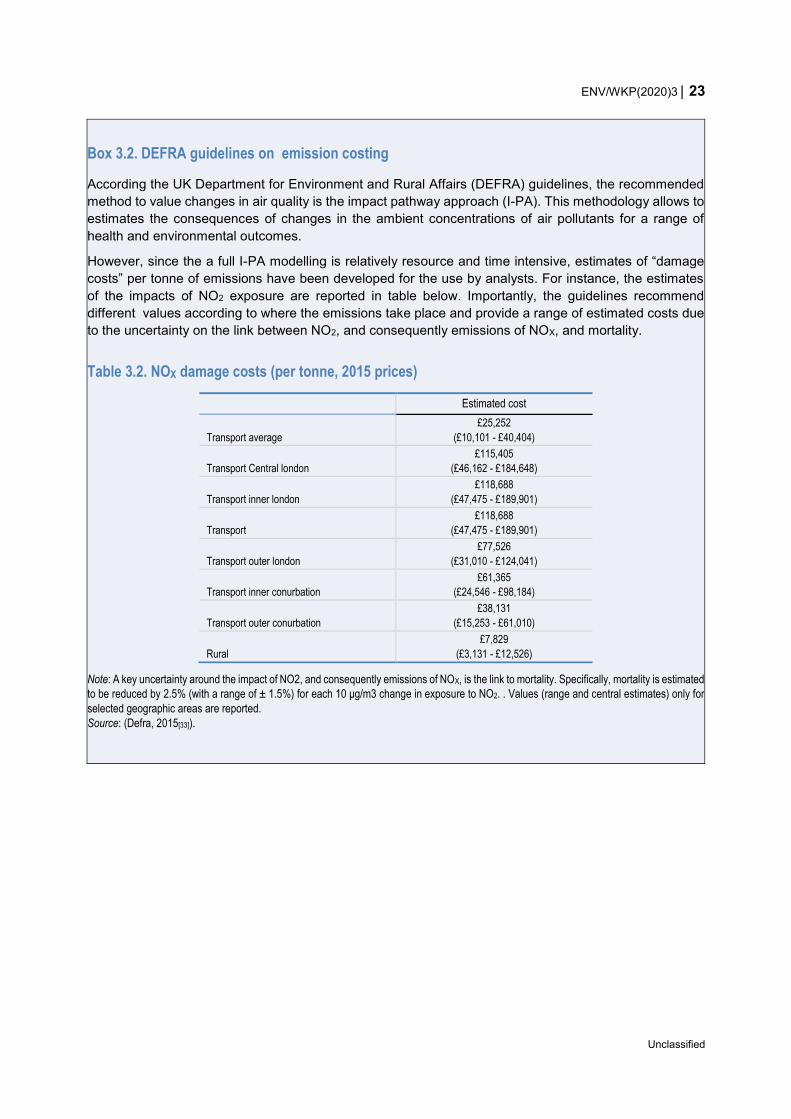
Box 3.2. DEFRA guidelines on emission costing
According the UK Department for Environment and Rural Affairs (DEFRA) guidelines, the recommended
method to value changes in air quality is the impact pathway approach (I-PA). This methodology allows to
estimates the consequences of changes in the ambient concentrations of air pollutants for a range of
health and environmental outcomes.
However, since the a full I-PA modelling is relatively resource and time intensive, estimates of “damage
costs” per tonne of emissions have been developed for the use by analysts. For instance, the estimates
of the impacts of NO2 exposure are reported in table below. Importantly, the guidelines recommend
different values according to where the emissions take place and provide a range of estimated costs due
to the uncertainty on the link between NO2, and consequently emissions of NOX, and mortality.
Table 3.2. NOX damage costs (per tonne, 2015 prices)
Estimated cost
Transport average
£25,252
(£10,101 - £40,404)
Transport Central london
£115,405
(£46,162 - £184,648)
Transport inner london
£118,688
(£47,475 - £189,901)
Transport
£118,688
(£47,475 - £189,901)
Transport outer london
£77,526
(£31,010 - £124,041)
Transport inner conurbation
£61,365
(£24,546 - £98,184)
Transport outer conurbation
£38,131
(£15,253 - £61,010)
Rural
£7,829
(£3,131 - £12,526)
Note: A key uncertainty around the impact of NO2, and consequently emissions of NOX, is the link to mortality. Specifically, mortality is estimated
to be reduced by 2.5% (with a range of ± 1.5%) for each 10 μg/m3 change in exposure to NO2. . Values (range and central estimates) only for
selected geographic areas are reported.
Source: (Defra, 2015[33]).

24 ENV/WKP(2020)3
Unclassified
Box 3.3. Online regulatory reform training programmes – the Example of Korea
A number of OECD member countries leverage online trainings when regulatory reforms are introduced.
Their advantage lies in their higher flexibility in delivery and limited cost. In addition, they allow to broaden
the target audience to a larger number of officials than what traditional approaches would permit. However,
the limited interaction that often characterises such courses has sometime been considered as reason to
carefully consider their application for advanced trainings.
A recent example of the development of online trainings is provided by the Government of Korea that
introduced an online program to train official on the recent regulatory reform that affected regulatory impact
analysis as well. This program is managed by the Central Officials Training Institute (COTI) and target
central public officials who can access the COTI website using their identification number and password.
The online tool allows officials to progress at their own speed but with an obligation to complete the
programme with the one calendar month. The course is successfully concluded if the trainee has
completed at least 90% of the course sections and scored at least 70% in an online test. Upon completion,
a certificate is recorded in the official’s performance assessment.
Source: (OECD, 2015[34]).
Table 3.3. List of projects subject to environmental impact assessment
Source: (MoE, 2012[25]).

ENV/WKP(2020)3 25
Unclassified
3.3. Stakeholders’ participation
The mechanisms to promote a working environmental democracy are – in general – not specific to
air pollution. For this reason, a brief overview of the tools in place to ensure that the public can contribute
to the environmental policy making process is provided below.
A first layer of public participation is provided by a systematic practise to consult citizens on
primary and secondary laws. The OECD Indicators of Regulatory Policy and Governance (IRPG) focus
on this aspect of the legislative process that is particularly complex to measure. Importantly, the indicators,
which are based on a survey of OECD member countries, target exclusively the processes and practices
for developing national regulations in the executive branch of government7. The results underline how the
extent of stakeholders’ engagement in relation to subordinate regulation in Japan is in line with other OECD
countries (Figure 3.3). However, the country would benefit from extending existing efforts to engage with
stakeholders in the process of developing primary laws, for example through public online consultations
on the interactive government website.
Figure 3.3. Indicators of Regulatory Policy and Governance – stakeholders’ engagement
Source: OECD Stat - Dataset: Government at a Glance - 2017 edition.
The 2012 revision of the Environmental Impact Assessment introduced numerous mechanisms to
promote public participation during the EIA process but similar provisions are lacking for RIAs .
Examples connected to the EIA process include obligations to hold a public session at the stage of the
determination of the assessment method and to publish the documents prepared by the project proponents
via internet. Instead, measures to improve environmental democracy within the RIA process are limited to
the obligation of disclosing the results on the website of the Ministry in charge of the RIA. As such, within
this latter case, the public can only scrutinize the assessments once they have been drafted but cannot
provide inputs to their preparation. Importantly, the OECD Recommendations on Regulatory Policy and
Governance underline how governments should consult stakeholders on all aspects of impact assessment
analysis.
Currently, only a limited number of NGOs that focus on air quality operate on a national scale. According
to several scholars, this is a common feature of Japanese citizens’ environmental engagement that is
mainly local (Mason, 2014[35]). A clear symptom of this lack of engagement on the national level is that no
7 In most countries the majority of their national primary laws originate from initiatives of the executive and are hence
covered by the survey. In Japan, around 26% of all national primary laws are initiated by the Parliament.
0
0.5
1
1.5
2
2.5
3
Primary laws Subordinate regulations
Japan Korea OECD - Average European Union

26 ENV/WKP(2020)3
Unclassified
NGOs have been recently invited to participate in the discussions with the various working groups of the
Central Environment Council that focus on issues related to air quality (MoE, 2018[3]).
Furthermore, limited funding – due to the small membership base – and the absence of a single national-
level co-ordinating body weakens the ability of NGOs to influence national and long-term policy objectives
and solutions (OECD, 2010[18]). This is a feature of Japanese system that is not shared in neighbouring
countries. For instance, the Korean Federation for Environmental Movement (KFEM), which is the biggest
and the most influential NGO in South Korea, counts 85,000 members. In comparison, membership of
Japanese NGOs is usually less than 10,000 (Hasegawa, 2010[36]) while “The Wild Bird Society of Japan”
- which is the largest Japanese environmental NGO - counts less than 51,000 members (as of April 2017)
(The Wild Bird Society of Japan, 2018[37]). Furthermore, while Green Peace counts 600,000 members (or
4% of the domestic population) in the Netherlands and more than 550,000 (less than 1% of population) in
Germany (Hasegawa, 2010[36]), its membership base hovers at only 7,000 members out of a 127 million
strong population in Japan (Greenpeace Japan, 2017[38]).
A specific national mechanism to provide financial assistance to non-governmental and non-profit
organizations is the Japan Fund for Global Environment (JFGE). This manages an endowment fund
established by the Japanese government whose accrued interest are leveraged to finance initiative of
NGOs and NPOs aimed at environmental conservation. The fund targets projects in nine key areas that
include, among the most relevant for air quality, the following: air, water and soil conservation; nature
protection, conservation and restoration; Forest conservation and tree/grass planting; Anti-desertification;
Prevention of global warming; Comprehensive environmental education and Comprehensive
environmental conservation activities (ERCA, 2014[16]). Examples of recent supported projects include
investigations on the health impact of chemical air pollutants and awareness-raising initiatives (ERCA,
2018[39]); international cooperation on monitoring of migratory land birds in the North-East Asia region,
including China (ERCA, 2018[40]); development of social businesses to support protected forest areas
(ERCA, 2018[41]) and creation of teaching materials on Environmental Sustainable Development for young
students (ERCA, 2018[42]).

ENV/WKP(2020)3 27
Unclassified
4.1. The objectives: Ambient Air Quality Standards
Air quality is monitored in Japan according to the Basic Environment law (art. 16) which introduced the first
standards for several air pollutants in 1973. Importantly, while suspended particulate matter (SPM,
equivalent to PM7)8 is included among the monitored substances since the promulgation of the law,
standards for fine particulate matters (PM 2.5) were established only by the end of 2009. The standards are
set by the central government and lower levels of governments do not have the authority to introduce other
(more or less stringent) air quality standards (AQSs). Furthermore, it should be noted that the law stipulates
only an obligation to endeavour to attain the environmental standards but does not require their actual
attainment (Matsuno, 2010[43]).
The concentration levels of major pollutants are in line with the domestically set standards with
the exception of photochemical oxidants and fine particulate matter (Table 4.1). Since attainment is
measured considering compliance at the level of the monitoring station, the results highlight how the air
quality is still below the nationally set objectives in several areas of the country for fine particulate matters.
Instead, virtually all regions are affected by a concentration of photochemical oxidants above the nationally
set standards. However, it should be noted that several AQSs, when comparable, are set at concentration
levels higher than those suggested by the WHO.
8 SPM is defined as a set of particular matters that are all smaller than 10 μm and it is equivalent to PM7. Japan began
using SPM as a standard in 1973 when the medical knowledge regarded particles smaller than 10 μm as dangerous
to human hurting health. (MoE, 2013[147]). Once PM10 has become the global standard, Japan has continued
monitoring SPM since it is more stringent than PM10.
4. Key policies and regulations for
air quality management

28 ENV/WKP(2020)3
Unclassified
Table 4.1. Air quality standards in selected countries and regions
Substance Air quality standards in
Japan
Air quality
standards per
WHO
guidelines
Yearly average
value in 2016
Attainment rate in
2016
JPN rules for
issuing alerts
PM2.5
Hourly n.a. n.a
11.9 µg/m3
Prefectures broadcast an alert when a level of 85 μg/m3 is recorded
early in the morning
Daily 35 μg/m3 * 25 μg/m3 88.7%
Yearly 15 μg/m3 10 μg/m3
Suspended
Particulate Matter
(Corresponds to
PM7) ***
Hourly 0.20 mg/m3 ** n.a.
0.017 mg/m3
Advisory: 2 mg/m3
lasts 2 hours
Warning: 3 mg/m3 lasts
3 hours
Daily 0.10 mg/m3 * n.a. 99.6%
Yearly n.a. n.a.
PM 10 ***
Hourly n.a. n.a.
Not measured
n.a.
n.a. Daily n.a. 50 μg/m3
Yearly n.a. 20 μg/m3
Sulphur dioxide
Hourly
0.1 ppm (=262.3 μg/m3)
** 500 μg/m3 ****
0.002 ppm
(=5.24 μg/m3) 100%
Advisory: 0.2 ppm lasts 3 hours, or 0.3 ppm lasts 2 hours, or
more than 0.5 ppm, 48 hours average
exceeds 0.15 ppm
Warning: 0.5 ppm lasts 3 hours or 0.7 ppm
lasts 2 hours
Daily 0.04 ppm
(=104.8 μg/m3) * 20 μg/m3
Yearly n.a. n.a.
Nitrogen dioxide
Hourly n.a. 200 μg/m3
0.009 ppm
(=16.9 μg/m3 )
Advisory: Hourly average exceeds 0.5
ppm
Warning: Hourly average exceeds 1.0
ppm
Daily
0.04-0.06 ppm (=75 - 113
μg/m3) *
n.a. 100%
Yearly n.a. 40 μg/m3
Carbon Monoxide
Hourly n.a. 30 mg/m3
0.3 ppm
(=0.34 mg/m3) 100%
Advisory: Hourly average exceeds 30
ppm
Warning: Hourly
average exceeds 50
ppm
8 hours
average
20 ppm (= 22.9 mg/m3)
** 10 mg/m3
Daily 10 ppm
(= 11.5 mg/m3) * n.a.
Photochemical
Oxidants
Hourly
0.06 ppm (=117.8 μg/m3)
** n.a.
0.047 ppm******
(=92.3 μg/m3) 0.1%
Advisory: Hourly average exceeds 0.12
ppm
Warning: Hourly average exceeds 0.40
ppm
(Some prefectures set
the threshold uniquely for the middle value
around 0.24 ppm)
Daily maximum 8 hours
average
n.a. 100 μg/m3*****
Yearly n.a. n.a.
Note: The conversion from μg/m3 to ppm in case of photochemical oxidants is based on the molecular weight of ozone (48 g/mol) since this is
the pollutant covered by the WHO daily quality standard. Achievement rate is computed considering monitoring stations that jointly compliance
with all the AQSs for a given pollutant (e.g. Daily and yearly concentration for PM2.5) .
“*” marks AQSs that measured as the annual 98th percentile values
“**” marks AQSs that are measured as the annual maximum value
“***” marks that Suspended Particular Matter (PM7) is employed instead of PM10 in Japan
“****” marks AQs that are measures as average of 10-minute
“*****” marks AQs for ozone
“******” marks that this value is yearly average of daytime maximum 1-hour values
Source: (MoE, 2018[44]), (APCA, 2017[45]), (WHO, 2006[46]), (WHO, 2000[47]), (MoE, 2013[48]).

ENV/WKP(2020)3 29
Unclassified
4.2. Air quality monitoring
A continuous monitoring system for 11 air pollutants9, the atmospheric Environmental Regional
Observation System or “Soramame-kun”, has been established (Figure 4.1). There are two types of
monitoring stations: those for the general atmospheric environment (1,581 stations in 2016), and those for
roadside air monitoring (451 stations in 2016). The Soramame-kun website discloses the observed
information almost in real time10 on a distribution map, where concentration values are reported using a
colour coding system. Moreover, it discloses the status of photochemical oxidants advisory and warning
alerts during the past seven days.
Figure 4.1. Soramame-kun’s distribution map
(example of PM2.5 in Kanto region, at 5 p.m. on 5th July, 2018)
When observed concentration values exceed predetermined thresholds, an advisory (注意報) or
warning (警) alert is issued (APCA, 2006[17]). In the former case, the prefectural governor informs the
population about the worsening air quality and asks for the cooperation of firms to reduce the emissions of
soot smoke and VOC as well as for the voluntary restraint of citizens in the use of automobiles. In case of
”warning alerts”, which are issued for heavier pollution levels, the prefectural governor can request
necessary measures to reduce the soot and smoke concentration as well as prohibiting the circulation of
vehicles if these are judged to be contributing to the peak in emissions. Warnings are announced to local
citizens through a number of media, including TV/Radio, local government website, pre-registered e-
mailing service, and smartphone application. (MoE, 2018[3]) (Saitama Prefecture, 2018[49]). Local
governments usually have contact points where citizens can report critical air quality events (MoE,
2018[19]). In 2017, advisory alerts for photochemical oxidant pollution were issued in eighty-seven days
while only twice for PM2.5. No other advisory or warming alert was issued.
9 Sulfur dioxide (SO2), Nitric oxide (NO), Nitrogen dioxide (NO 2), nitrogen oxides (NOx), Carbon monoxide (CO),
Photochemical oxidant (OX), Non-methane hydrocarbon (NMHC), Methane (CH4), total hydrocarbon emissions
(THC), Suspended particulate matter (SPM), Micro particulate matter (PM 2.5).
10 Data are published with a two hours delay.

30 ENV/WKP(2020)3
Unclassified
4.3. Policies and regulatory tools to improve air quality
4.3.1. Setting long-term objectives
The Basic Environmental Plan (BEP) is a multi-annual framework that sets the long-term objectives
for environmental policy. The plans, whose implementation is assessed by the Central Environmental
Council and the Ministry of Environment, are drafted in coordination with multiple ministries and provide
guidance for budget allocation (OECD, 2010[18]).
The latest BEP (2018) does not include air pollution among its main cross-disciplinary strategic
objectives, thus underlining the current lower priority of this topic. This is partially contradictory since
the final review of the previous basic plan highlighted the low attainment rate of air quality standards for
both photochemical oxidants (0% for both stationary and mobile measures) and PM2.5 (74.5% for
stationary measurement, and 58.4% for mobility measurement) (MoE, 2015[50]). However, regardless of
this lack of an explicit focus on air pollution, numerous measures of the current BEP are likely to support
better air quality (e.g. promotion of renewable energy, compact city, higher usage of public transport and
bicycle, and efficient EIA). (MoE, 2018[51]). Furthermore, the plan highlights the importance of PM2.5,
photochemical oxidants and asbestos for the “overall environmental risk management”, which is among
the six main strategic objectives identified.
Prefectures often develop multi-year environmental plans as well. These, while adapting to local
characteristics, follow a similar structure to the BEPs and provide an overview on the prioritised policy
objectives and planned measures (see Box 4.1) (Ogata, 2006[52]). However, there is no evidence that
these reviews influence the annual planning and budgeting processes (OECD, 2010[18]).
Box 4.1. The Tokyo Environmental Master Plan
While air quality in Tokyo has significantly improved during the past decade, PM2.5 and
photochemical oxidants remain key challenges. For instance, PM2.5 concentrations decreased by
approximately 55% in the past 10 years but neither the 24-hour nor the annual environmental standard
have been recently met. Similarly, while the concentration of photochemical oxidants has diminished, the
relative environmental standards have not been met at any monitoring stations (and 14 photochemical
smog advisory alerts were issued) in 2015.
In light of these challenges, the Tokyo Metropolitan Government (TMG) adopted a new master plan
with progressive milestones in 2016. The city has introduced a short-term target of zero days with
photochemical smog advisory alerts by FY2020 and a long-term target to reduce the concentration of
photochemical oxidant to 0.07 ppm or less at all monitoring stations by FY2030 (a level still higher than
the current domestic AQS). In addition, the plan aims at an achievement rate for the national PM2.5 air
quality standard equal to 100% by FY2024. Planned measures include promotion for the purchase of
certified domestic appliances and low-emission vehicles, technical support for business with facilities that
emit soot and smoke, increased cooperation with surrounding local governments and research on the
generation mechanism of photochemical oxidants.
Furthermore, the city is putting in place a number of measures to improve the sustainability of the
2020 Olympics Games. The “Tokyo 2020” Sustainability Plan, which aims at ensuring that the SDGs are
incorporated in the planning of the Games, is articulated around five main sustainability themes: Climate
Change; Resource Management; Natural Environment and Biodiversity; Consideration of Human Rights,
Labour, Fair Business Practices and Involvement, Cooperation and Communications. A number of actions
to be implemented along themes are likely to contribute to improve air quality as well. Examples include:

ENV/WKP(2020)3 31
Unclassified
development of green areas, promotion of the use of public transport and the development of eco-driving
awareness-raising campaigns.
Source: (Tokyo Metropolitan Government, 2016[53]) (Tokyo 2020, 2018[54]).
4.3.2. Industry
Emission Limit values
The SOx emission limit value regulations are relatively more complex than those enforced in other
OECD countries, partially due to historical reasons. Spurred by the severe air pollution problem during
the middle of last century, the Air Pollution Control Law (1968) introduced two main provisions to control
the emission of this pollutant: the so called “K-Value” Regulation and the Regulation on Total Emissions.
The K-Value Regulation mainly aims at decreasing the concentration of SO2 at the ground level. To
this end, the allowable emission limit for each facility is determined according to the following formula:
q = K x 10-3 x He2
where q is the permissible hourly emission volume of sulphur oxides (m3/h); He is the effective height that
is equal to the sum of the actual height of the stack and the exhaust gas ascent height; and K is a constant
whose value varies according to the region where the plant is located. As such, while being a national
regulation, the emission limit values are inherently geographically differentiated. The K values are listed
on the MOE website11.
Whereas the K-Value Regulation is applied at the facility level, the Regulation on SOx Total
Emissions is set at plant-level and targets large-scale installations. This was introduced to avoid an
expansion of the polluted area due to firms building higher stacks in order to comply with the K-value
regulation (Matsuno, 2010[43]). To this end, the regulation introduces a cap – which varies according to
plant vintages – on total facility emission in certain designated areas. The permitted amount of emissions
“Q” is calculated using a formula that takes into consideration the fuel consumption of heavy oil equivalent
(kl/h) of both existing (W) and new facilities (Wi). The other two variables included in the formula, namely
“a” and “b”, are set by local governments, given a range established by law, taking into account air quality
in the area and the target set in their emission reduction plan.
New plant Existing plant
Q = aWb+ra{(W+Wi)b -Wb} Q = aWb
Similarly, NOx emissions are also regulated though both standards, which vary according to the
technology employed, and caps on total emissions, which are enforced only in selected regions.
Instead, the approach to PM standard setting is similar to those developed in other countries. In fact, soot
and dust standards vary according to the technology employed and the geographic location of the plant
(Table 4.2).
Both emission limit and total emission values are vintage-differentiated, thus imposing more stringent
requirements on new firms than on existing firms. Vintage differentiation regulations are relatively common
across OECD countries and are often justified on political economic grounds since they reduce the impact
of new regulations on existing assets. However, at the same time, they create an uneven playing field for
new entrants since they face stricter regulations. The possibly resulting lower rate of entry of new firms
may slowdown the upgrade of the capital stock and therefore lead to slower penetration of less emissions-
intensive technology. For some Japanese regulations, the cut-off date to distinguish new and old plants is
11 https://www.env.go.jp/en/air/aq/air/air3_table.html.

32 ENV/WKP(2020)3
Unclassified
set as the year of the entry into force of the law (e.g. 1965 or 1974), therefore the pool of (“old”) facilities
subject to less stringent standards is likely to be small but potentially very polluting. However, the number
and the impact that these facilities are not well understood and should be subject of further investigation.
Best available techniques- (or BATs-) based emission standards have been recently adopted but only for
mercury emissions in selected sectors. Following the entry into force of the “Minamata Convention on
Mercury” on August 2017, Japan has modified its air pollution control act to establish the obligation to
consider best-available technologies for emission standards for new facilities emitting mercury in selected
sectors (MoE, 2016[55]). These include: coal-fired power plants; coal-fired industrial boilers; smelting and
roasting processes used in the production of non-ferrous metals; waste incineration facilities; cement
clinker production facilities.
Table 4.2. Summary table - standards for stationary sources
Pollutant Vintage differentiation
(existing / new plant)
Geographic
differentiation
Responsible for
setting Emission Limit
Value (ELVs)
Sta
nd
ard
s
PM No differentiation (see
geographic diff.)
Special limits for new
plants in specified areas
(9 areas)
Central GOVs but Prefectures can introduce
stricter standards
NOx No differentiation No differentiation
Central GOVs but Prefectures can introduce
stricter standards
SOx No differentiation (see
geographic diff.)
Lower (more stringent) K- values for new plants in
specified areas
(28 areas)
Government sets the K-
value
To
tal e
mis
sio
n
limit
s
SOx Yes
Applicable only to plants
in specified areas
(24 areas)
Prefectures based on
emission reduction plans
NOx No differentiation
Applicable only to plants
in specified areas
(3 areas)
Prefectures based on
emission reduction plans
Source: (MoE, 2012[56]) , (MoE, 2018[57]).
Permitting
New facilities regulated under the Air Pollution Control Law are required to submit a notification to
the Prefectural governor before starting operations. Information to be submitted by the permit applicant
include the location and map of the soot and smoke equipment, size and capacity of the facility, amount of
discharged air pollutant, air pollutant treatment and discharge method and fuels used (MoE, 2018[58]). If
the new facilities are located in the special areas designated for the total emission regulation for SOx or
NOx, an additional document needs to be submitted to the prefecture governor or city mayor in order to
ensure that the expected emissions do not exceed the total limits.
Business operations cannot start until 60 days have elapsed from the date when the notification to
the governor was accepted. Local governments verify whether the facility can comply with enforced
emission standards considering facilities equipment, operating procedures and disposal method of soot
and smoke (MoE, 2018[19]). Any change to the structure of the facility, its use and technology to dispose
soot and smoke needs also to be communicated to the prefectural governor (APCA, 2006[17]). There is no
other formal condition imposed on the operators as part of the permitting procedure, which is the same for
large and small factories even if emission limit values vary according to the size of the plant.

ENV/WKP(2020)3 33
Unclassified
Pollution control manager
Large companies are required to establish the positions of a “Pollution Prevention General
Manager” and of “Pollution Control Managers” (Box 4.2). These are open only to candidates that have
passed a national examination managed by the JEMAI, an independent association financed by the
companies’ membership and candidates’ examination fees. At the present, there are 13 types of pollution
control managers, whose qualifications vary according to the type of factory, its scale and relevant
pollutants (JEMAI, 2018[59]). They are responsible for the maintenance and management of pollution
prevention equipment as well as for the implementation of the necessary measures in case of an incident.
The association also plays a role in facilitating compliance and updating the skills of its members (see
section 4.3).
Box 4.2. Pollution Control Manager
The 1971 law on “improvement of pollution prevention systems” established an obligation to create several
positions in charge of pollution control for firms operating in certain sectors. These sectors include electric
power supply, gas supply, heat supply, and manufacturing.
The type and complexity of the required organisational structure varies according to the size of the
facilities. Firms with less than 20 full-time employees are mandated to hire “Pollution Control Managers”
who both oversee the operation and maintenance of the facilities and control the quality of fuel and raw
materials. An additional layer of control, namely a “Supervisor of Pollution Control” is required for firms
with more than 20 full-time employees. Finally, larger firms, which are defined as factories generating more
than 40,000m3 of soot per hour and discharging an average of more than 10,000m3 of wastewater per
day, are mandated to hire also a “Chief Manager of Pollution Control”. Importantly, this personnel perform
these functions alongside other duties within the organisation.
Source: (JEMAI, 2018[59])
Taxes
The only form of environmental taxation concerning air pollution is a levy on SOx emissions which,
however, is often considered more as an “environmental liability instrument”. The main purpose of
this levy is to secure funding to compensate the sufferers – certified by 1987 – of diseases due to air
pollution. In order to set the levy rate, the costs to cover health expenditures for certified patients is
estimated each year and then apportioned to emitters proportionally to their 1982-86 emissions (48% of
the cost) and current annual emissions (32% of the cost). The remaining 20% is financed through the
automobile tonnage tax (see Box 3.1 on ERCA). Therefore, companies that had emitting facilities
operating until the 1st April 1987 remain liable even if these plants are (or will be) closed. Instead, newly
established firms are not required to contribute to the fund unless they install a soot- and smoke-producing
equipment in an existing plant (i.e. they start emitting air pollutants from an existing facility).
This structure affects incentives to abate emission for both new and existing firms. The exclusion
of new firms – while due to the objective underpinning this policy, namely the introduction of an
environmental liability instrument rather than an emission tax – is particularly problematic from the point of
view of ensuring that polluters internalise the environmental externalities of their production choices. At the
same time, existing firms may face lower incentives to abate emission since lower pollution would lead
only to a limited decrease of the payments because these depend on the health costs of patients.

34 ENV/WKP(2020)3
Unclassified
Subsidies
Currently, few incentives are available to firms for the installation of pollution abatement
equipment. The main instrument consists in subsidised loans provided by Japan Finance Corporation
(JFC). These are offered to enterprise undertaking environmental and energy related investments, with a
specific focus on SMEs that emit precise substances that cause air pollution such as smoke, volatile
organic compounds or asbestos (Table 4.3). Examples of equipment purchasable through this scheme
include: dust collection / dust removal equipment; cleaning, neutralisation, adsorption and reduction
equipment and/or measurement and analysis equipment (JFC, 2018[60]). However, loans disbursed for
environmental and energy investments accounted only for 3.2% (50.4 billion yen) of the total loan
operations in 2016 (JFC, 2017[61]).
Table 4.3. Air pollution-related low interest loan by JFC as of 2018
Small and Medium sized
Entities
Micro businesses and
individuals
Agriculture
Loan Purpose Environment and energy related investments such as initiatives for non-fossil fuels, energy saving, asbestos, PCB-
waste, and low pollution vehicles
Investments for appropriate disposal of domesticated
animals’ excrement
Maximum amount of loan JPY 720 million JPY 72 million Lower of either 80% of actual
cost or the following;
(Individual) JPY 35 million,
(Corporation) JPY 70 million
Interest rate
(depends on condition) 0.3 % - 2.75% 0.3% - 1.45% 0.3%
Loan period 20 years 20 years 20 years
Source: (JFC, 2018[62]).
Furthermore, incentives are in place to support the installation of renewable energy technologies,
which indirectly contributes to the promotion of air quality. Feed-in tariffs are in place since 2012
(IEA, 2018[63]) while a subsidy covering half of the investment cost for local governments and one third for
private industries has been established for off-grid self-consumption renewable energy generation
(Agency for Natural Resources and Energy, 2018[64]).
Following the 2004 Law Concerning Promotion of Business Activities with Environmental Consideration,
several measures encourage the adoption of environmental management systems (EMS). These often
focus on ECO Action 21 that is an EMS developed by the Ministry of Environment and currently managed
by the Institute for Global Environmental Strategies (IGES). To favour its diffusion, some local governments
offer subsidies to cover certification-related expenses (e.g. consulting fees) while ECO-21 compliant firms
often benefit from additional qualification points in bidding procedures for public construction works. More
precisely, several prefectures have adopted qualitative criteria for bids evaluation, such as whether the
business is rooted in the local community or whether the rate of employees with disabilities is higher than
the target rate set by the promotional act. Compliance with Eco Action 21 is also included even if it provides
limited additional points compared to the other qualitative criteria considered (e.g., 4 points in a case of
Osaka) (IPSuS, 2018[65]) (Industrial Waste Management Foundation, 2013[66]). In addition, Development
Bank of Japan considers compliance with ECO Action 21 as a condition for investment and lending
activities (DBJ, 2018[67]) while several banks offer special loan programs to certified firms (IPSuS,
2011[68]).
Voluntary approaches
The wide use of Voluntary approaches is a unique feature of Japanese pollution control measures.
Two different types of voluntary approaches are common in Japan. The first is an approach where local
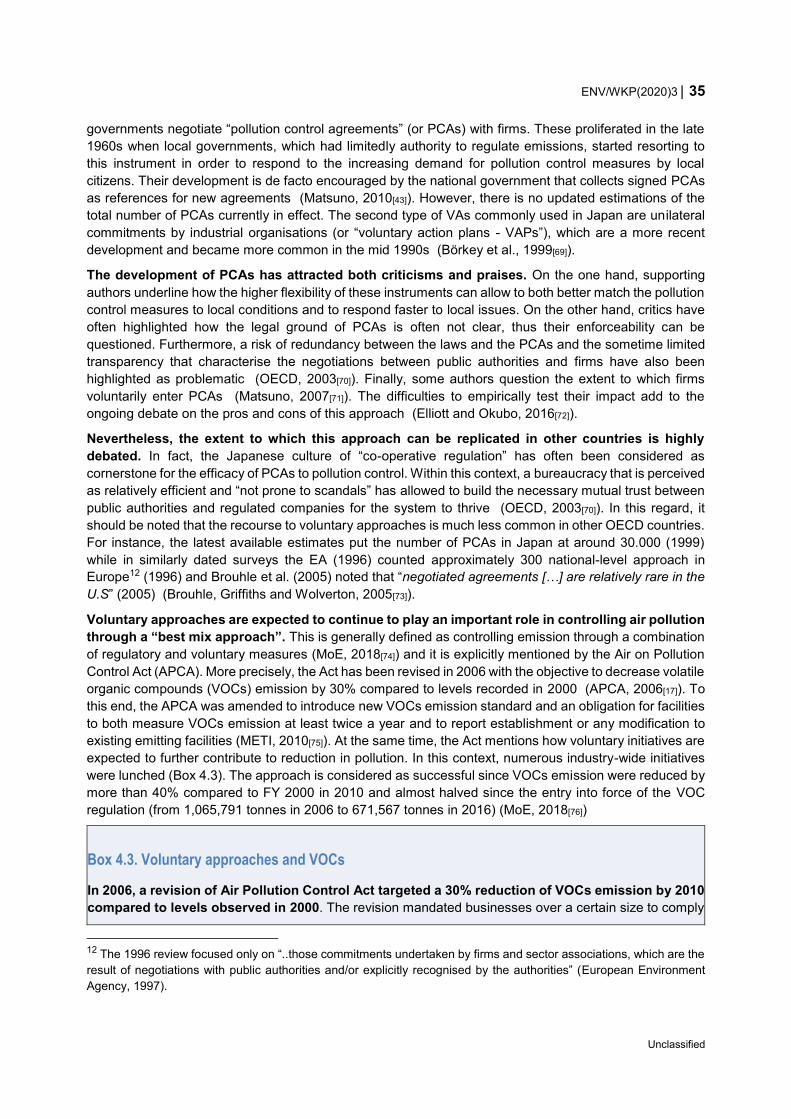
ENV/WKP(2020)3 35
Unclassified
governments negotiate “pollution control agreements” (or PCAs) with firms. These proliferated in the late
1960s when local governments, which had limitedly authority to regulate emissions, started resorting to
this instrument in order to respond to the increasing demand for pollution control measures by local
citizens. Their development is de facto encouraged by the national government that collects signed PCAs
as references for new agreements (Matsuno, 2010[43]). However, there is no updated estimations of the
total number of PCAs currently in effect. The second type of VAs commonly used in Japan are unilateral
commitments by industrial organisations (or “voluntary action plans - VAPs”), which are a more recent
development and became more common in the mid 1990s (Börkey et al., 1999[69]).
The development of PCAs has attracted both criticisms and praises. On the one hand, supporting
authors underline how the higher flexibility of these instruments can allow to both better match the pollution
control measures to local conditions and to respond faster to local issues. On the other hand, critics have
often highlighted how the legal ground of PCAs is often not clear, thus their enforceability can be
questioned. Furthermore, a risk of redundancy between the laws and the PCAs and the sometime limited
transparency that characterise the negotiations between public authorities and firms have also been
highlighted as problematic (OECD, 2003[70]). Finally, some authors question the extent to which firms
voluntarily enter PCAs (Matsuno, 2007[71]). The difficulties to empirically test their impact add to the
ongoing debate on the pros and cons of this approach (Elliott and Okubo, 2016[72]).
Nevertheless, the extent to which this approach can be replicated in other countries is highly
debated. In fact, the Japanese culture of “co-operative regulation” has often been considered as
cornerstone for the efficacy of PCAs to pollution control. Within this context, a bureaucracy that is perceived
as relatively efficient and “not prone to scandals” has allowed to build the necessary mutual trust between
public authorities and regulated companies for the system to thrive (OECD, 2003[70]). In this regard, it
should be noted that the recourse to voluntary approaches is much less common in other OECD countries.
For instance, the latest available estimates put the number of PCAs in Japan at around 30.000 (1999)
while in similarly dated surveys the EA (1996) counted approximately 300 national-level approach in
Europe12 (1996) and Brouhle et al. (2005) noted that “negotiated agreements […] are relatively rare in the
U.S” (2005) (Brouhle, Griffiths and Wolverton, 2005[73]).
Voluntary approaches are expected to continue to play an important role in controlling air pollution
through a “best mix approach”. This is generally defined as controlling emission through a combination
of regulatory and voluntary measures (MoE, 2018[74]) and it is explicitly mentioned by the Air on Pollution
Control Act (APCA). More precisely, the Act has been revised in 2006 with the objective to decrease volatile
organic compounds (VOCs) emission by 30% compared to levels recorded in 2000 (APCA, 2006[17]). To
this end, the APCA was amended to introduce new VOCs emission standard and an obligation for facilities
to both measure VOCs emission at least twice a year and to report establishment or any modification to
existing emitting facilities (METI, 2010[75]). At the same time, the Act mentions how voluntary initiatives are
expected to further contribute to reduction in pollution. In this context, numerous industry-wide initiatives
were lunched (Box 4.3). The approach is considered as successful since VOCs emission were reduced by
more than 40% compared to FY 2000 in 2010 and almost halved since the entry into force of the VOC
regulation (from 1,065,791 tonnes in 2006 to 671,567 tonnes in 2016) (MoE, 2018[76])
Box 4.3. Voluntary approaches and VOCs
In 2006, a revision of Air Pollution Control Act targeted a 30% reduction of VOCs emission by 2010
compared to levels observed in 2000. The revision mandated businesses over a certain size to comply
12 The 1996 review focused only on “..those commitments undertaken by firms and sector associations, which are the
result of negotiations with public authorities and/or explicitly recognised by the authorities” (European Environment
Agency, 1997).

36 ENV/WKP(2020)3
Unclassified
with newly set VOCs emission standards and mentioned how emission reductions should be achieved
through an appropriate combination of legal tools and voluntary initiatives by businesses (APCA, 2006[17]).
To this end, numerous industry wide initiatives (so called voluntary action plans) were lunched.
The participation to these programs is voluntary but a relative high number of firms joins due to multiple
reasons. Businesses often consider these initiatives as a useful tool to pursue their companies' own
Corporate Social Responsibility (CSR) objective. Furthermore, there is a general understanding that these
initiatives need to be successful in order to avoid that the government introduces new regulations. In
addition, there is often informal peer pressure within the industry to join. Recent data (2015) report more
than 40 industry associations with program on VOCs reduction (METI, 2017[77]).
A particularly successful example is provided by the printing sector where over 90% of the industry (base
on shipment value) joined the voluntary initiatives as of 2015 (METI, 2017[77]). Participants are required to
independently establish their own reduction targets and submit a voluntary action plan to the industry
association. Then, their progress against their own targets are reviewed yearly by the Association (METI,
2010[75]). In addition, labelling schemes, such as the Green Printing Certifications, incentivise firms’
participation (JFPI, 2018[78]).
4.3.3. Mobile sources
Japanese vehicle emission standards, as well as fuel efficiency targets, are jointly developed by a
number of Ministries (MoE, MLIT and METI) in cooperation with the Central Environment Council.
Importantly, emission standards are adopted under the authority of the “Air Pollution Control Act”, while
fuel efficiency targets are established under the “Law Concerning the Rational Use of Energy”. In addition
to emission standards (Table 4.5 and Table 4.6), also efficiency standards have been introduced and,
while targets were established with a timeframe up to 2020, they were met by industry already in 2013
(Yang and Bandivadekar, 2017[79])
The Worldwide Harmonized Light Vehicles Test Procedure (WLTP) has been recently introduced to
test vehicles emissions. The adoption of the worldwide UN standards is expected to increase the
adherence of vehicles emission on road to those observed in laboratory tests thanks to the introduction of
more realistic and a wider variety of driving conditions (urban, suburban, main road, motorway) in the
testing procedure (Box 4.4) (ACEA, 2018[80]).
Box 4.4. Measuring vehicle emissions
The Worldwide Harmonized Light Vehicles Test Procedure (WLTP) – approved by UNECE in 2014 and
adopted by several countries (Europe and Japan in 2018, China, India and South Korea in 2021) – is
expected to reduce the gap between emissions measured during the testing phase and in real-world
conditions (UNECE, 2017[81]) (Alphabet, 2018[82]). The studies analysing how measured pollutant
emissions vary when domestic testing procedures and the WLTP procedure is adopted seems to confirm
the higher stringency of this approach. For instance, as far as local pollutants are considered (NOx, CO,
PM, THCs), evidence seems to suggest that the WLTP will lead to an increase (and more realistic)
measurement of emission compared to the New European Driving Cycle (NEDC), which is the test-
procedure used in Europe until 2017 (Pavlovic et al., 2018[83]), and to the JC08, which is the test-procedure
used in Japan until October 2018 (Kühlwein, German and Bandivadekar, 2014[84]).
However, the WLTP is still a laboratory test and does not accurately represent real-world emissions. For
instance, the ICCT and Element Energy (2015[85]) estimate that real-world CO2 emission will be still 23%
higher than those observed during the testing phase. For this reason, several countries – including Japan
– are planning to complement laboratory test with emissions measurement in Real Driving Conditions

ENV/WKP(2020)3 37
Unclassified
(RDE). Within these procedures, emissions are measured by portable emission measuring systems
(PEMS) that are attached to the car while driving on the road according to random variations of parameters
such as acceleration, deceleration, ambient temperature, and payloads. RDE is expected to be introduced
in Japan for diesel vehicles in Japan in 2022 (MLIT, 2018[86]).
In order to improve air quality in congested areas, the NOx/PM Act was introduced in 2002. The Act
originally required the government to develop a national basic policy to bring NOx and SPM concentration
levels more closely in line with the relative AQSs by 2010 in the major cities of 8 prefectures (e.g., Tokyo,
Osaka, etc.). The measures introduced to this end included a ban on the registration of older and polluting
vehicles within these cities (un-registered vehicles cannot circulate) and a mandate for businesses to
submit (and annually report on) “vehicle usage plan” to reduce NOx and PM emission (e.g. shift to less
polluting vehicles, reduce vehicle usage via modal shift, etc.). After an evaluation in 2011, the target was
revised to the complete compliance with the NOx and SPM AQSs by 2020. A 2015 interim review concluded
that 1 city and 3 prefectures had the met the 2020 target of NOx and SPM by 2015. (MoE, 2017[87]).
In order to reduce information asymmetries for consumers, numerous vehicle labelling tools have been
introduced. This labelling scheme reports whether a vehicle is compliant – for instance – with the 2018
standards or whether it over-performs it by a certain percentage (e.g. emissions are 25%, 50% and 75%
lower than the 2018 standard) (JAMA, 2017[88]). In 2018, a certification system for refuelling stations
equipped with devices that reduce emissions due to fuel evaporation, which is one of the causative
substances of photochemical oxidants and PM 2.5, has been established (MOE, 2018).
With the introduction of dedicated tax incentives in 2009, the registration of eco-friendly vehicles
dramatically increased in recent years. JAMA (2017[88]) estimates that the (so-called) next-generation
vehicles – which includes hybrid, plug-in hybrid, electric, fuel cell, clean diesel, and other new-energy
vehicles – accounted for almost 35% of new passenger car registrations in 2016 . The tax breaks for these
vehicles focus on three main automotive taxes: tonnage, acquisition, and ownership (Table 4.4)
(Kuramochi, 2014[89]). In addition, since the tonnage tax is levied according to the type and the weight of
the vehicle, this provides a general but indirect effect to reduce emissions of pollutants across all engine
technologies. The uptake of electric vehicles is further promoted through subsidies for the installation of
chargers at private facilities (NGVPC, 2018[90]).
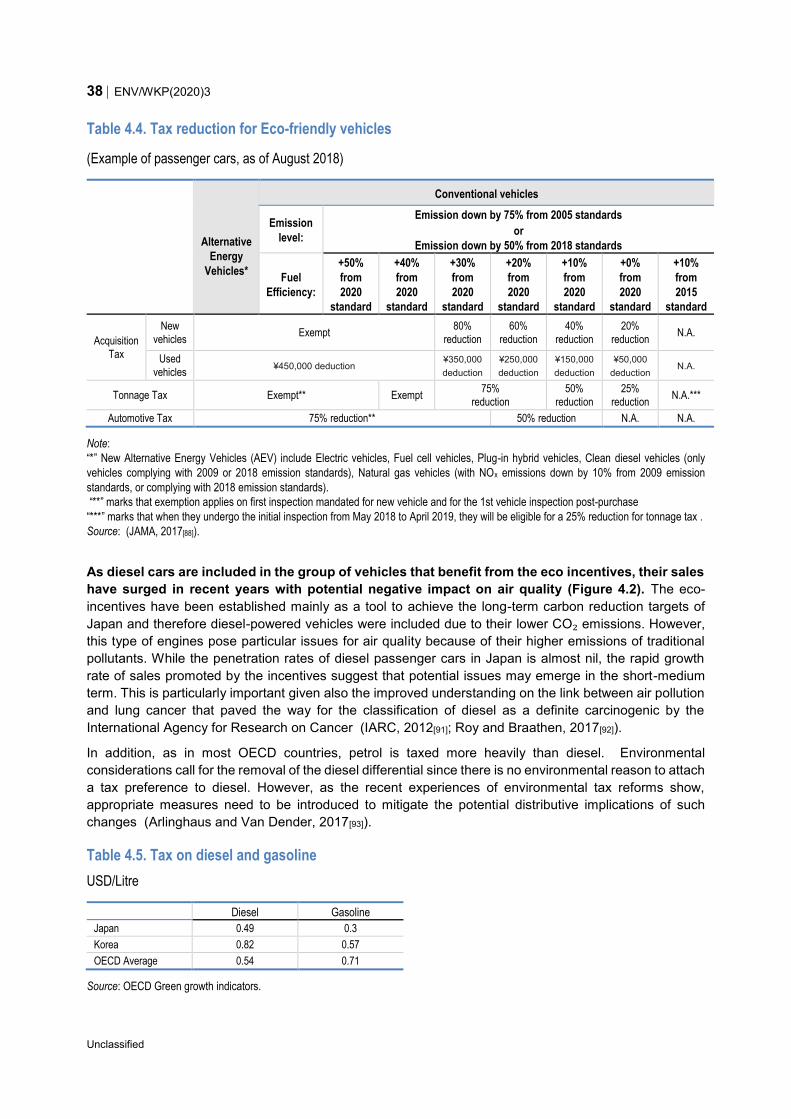
38 ENV/WKP(2020)3
Unclassified
Table 4.4. Tax reduction for Eco-friendly vehicles
(Example of passenger cars, as of August 2018)
Alternative
Energy
Vehicles*
Conventional vehicles
Emission
level:
Emission down by 75% from 2005 standards
or
Emission down by 50% from 2018 standards
Fuel
Efficiency:
+50%
from
2020
standard
+40%
from
2020
standard
+30%
from
2020
standard
+20%
from
2020
standard
+10%
from
2020
standard
+0%
from
2020
standard
+10%
from
2015
standard
Acquisition
Tax
New
vehicles Exempt
80%
reduction
60%
reduction
40%
reduction
20%
reduction N.A.
Used
vehicles ¥450,000 deduction
¥350,000
deduction
¥250,000
deduction
¥150,000
deduction
¥50,000
deduction N.A.
Tonnage Tax Exempt** Exempt 75%
reduction
50%
reduction
25%
reduction N.A.***
Automotive Tax 75% reduction** 50% reduction N.A. N.A.
Note:
“*” New Alternative Energy Vehicles (AEV) include Electric vehicles, Fuel cell vehicles, Plug-in hybrid vehicles, Clean diesel vehicles (only
vehicles complying with 2009 or 2018 emission standards), Natural gas vehicles (with NOx emissions down by 10% from 2009 emission
standards, or complying with 2018 emission standards).
“**” marks that exemption applies on first inspection mandated for new vehicle and for the 1st vehicle inspection post-purchase
“***” marks that when they undergo the initial inspection from May 2018 to April 2019, they will be eligible for a 25% reduction for tonnage tax .
Source: (JAMA, 2017[88]).
As diesel cars are included in the group of vehicles that benefit from the eco incentives, their sales
have surged in recent years with potential negative impact on air quality (Figure 4.2). The eco-
incentives have been established mainly as a tool to achieve the long-term carbon reduction targets of
Japan and therefore diesel-powered vehicles were included due to their lower CO₂ emissions. However,
this type of engines pose particular issues for air quality because of their higher emissions of traditional
pollutants. While the penetration rates of diesel passenger cars in Japan is almost nil, the rapid growth
rate of sales promoted by the incentives suggest that potential issues may emerge in the short-medium
term. This is particularly important given also the improved understanding on the link between air pollution
and lung cancer that paved the way for the classification of diesel as a definite carcinogenic by the
International Agency for Research on Cancer (IARC, 2012[91]; Roy and Braathen, 2017[92]).
In addition, as in most OECD countries, petrol is taxed more heavily than diesel. Environmental
considerations call for the removal of the diesel differential since there is no environmental reason to attach
a tax preference to diesel. However, as the recent experiences of environmental tax reforms show,
appropriate measures need to be introduced to mitigate the potential distributive implications of such
changes (Arlinghaus and Van Dender, 2017[93]).
Table 4.5. Tax on diesel and gasoline
USD/Litre
Diesel Gasoline
Japan 0.49 0.3
Korea 0.82 0.57
OECD Average 0.54 0.71
Source: OECD Green growth indicators.

ENV/WKP(2020)3 39
Unclassified
Another potential issue lies in the road pricing schemes that often encourage long-distance
driving, including over routes that are very well served by fast train. Currently there is a 30% midnight
discount on motorway tolls for all types of automobiles in order to mitigate the daytime peak traffic. If this
is combined with the long-distance use discount, which provides an additional 10% reduction on road toll
for trips over 100km and a 20% discount for trips over 200km, then total discounts is in the 30% to 50%
range. A similar situation applies to urban motorways where specific discounts (named as “environmental
road pricing”) are offered to divert large-size vehicles from congested roads within residential areas in
certain cities (e.g. it ranges between 10% to 20% discount in Kanto and around 30% on Hanshin
Expressway in Kinki) (MLIT, 2014[94]). Nevertheless, some interesting reforms are being undertaken. For
instance, the Japan Express Holding re-organised the toll rates of expressways in Tokyo in order to reflect
distance-travelled (MLIT, 2018[95]).
Figure 4.2. Next generation passenger car – new registrations
Vehicle units, 2017
Source: (JAMA, 2017[88]).

40 ENV/WKP(2020)3
Unclassified
Table 4.6. Emission standards for passenger cars
Panel A. Emission standards for Diesel cars
Vehicle weight
Type of test Year of
introduction
Unit PM NOx CO
All cars WLTP 2018 g/km 0.005 0.15 0.63
Panel B. Emission standards for Gasoline cars
All cars WLTP 2018 g/km 0.005 0.05 1.15
Source: (DieselNet, 2015[96]) (MLIT, 2018[97]).
Table 4.7. Emission standards for Commercial vehicles
Panel A. Emission standards for diesel light commercial vehicles
Vehicle weight Type of test Year of
introduction
Unit PM NOx CO
> 1700 kg WLTP 2019 g/km 0.007 0.24 0.63
≤ 1700 kg WLTP 2018 g/km 0.005 0.15 0.63
Panel B. Emission standards for gasoline light commercial vehicles
Mini JC08 2009 g/km 0.005 0.05 4.02
≤ 1700 kg JC08 2009 g/km 0.005 0.05 1.15
> 1700 kg JC08 2009 g/km 0.007 0.07 2.55
Mini WLTP 2019 g/km 0.005 0.05 4.02
≤ 1700 kg WLTP 2019 g/km 0.005 0.05 1.15
> 1700 kg WLTP 2019 g/km 0.007 0.07 2.55
Panel C. Emission standards for diesel heavy commercial vehicles
All weights WHTC 2016 g/km 0.010 0.40 2.22
Source: Panels A and B: (DieselNet, 2015[96]) (MLIT, 2018[97]). Panel C: (MLIT, 2018[98]) (MLIT, 2018[97]).

ENV/WKP(2020)3 41
Unclassified
The monitoring and enforcement activities in Japan are geared towards guiding economic actors
towards compliance with limited recourse to fines and penalties. This is, for instance, clearly visible
in the ratio between administrative guidances issued after inspection and the quasi-absence of sanctions.
Several authors point out how the success of this approach seems to be based on very specific features
of the Japanese system where regulations are devised and introduced via a co-operative process with the
various stakeholders (OECD, 2003[70]) (MoE, 2018[3]) and where the reputational consequences of non-
compliance can be large (OECD, 2009[99]). There have been no major reforms to the regulatory monitoring
and enforcement practises in the past years. As such, the following pages will only briefly summarise the
key features. Greater attention is paid to mobile sources, given the role that these play in PM emissions.
5. Monitoring & enforcement of
regulations

42 ENV/WKP(2020)3
Unclassified
5.1. Monitoring
Box 5.1. OECD Best Practice Principles Regulatory Enforcement and Inspections
The OECD “Best Practice Principles for Regulatory Enforcement and Inspection” address the design of
the policies, institutions and tools to promote effective compliance. These are based on extensive review
of practices in OECD and non-OECD countries and are intended to represent an overarching framework
to support initiatives to improve regulatory enforcement (OECD, 2014[100]). The principles are:
1. Evidence based enforcement. Regulatory enforcement and inspections should be evidence-based
and measurement-based: deciding what to inspect and how should be grounded on data and
evidence, and results should be evaluated regularly.
2. Selectivity. Promoting compliance and enforcing rules should be left to market forces, private
sector and civil society actions wherever possible: inspections and enforcement cannot be
everywhere and address everything, and there are many other ways to achieve regulations’
objectives.
3. Risk focus and proportionality. Enforcement needs to be risk-based and proportionate: the
frequency of inspections and the resources employed should be proportional to the level of risk
and enforcement actions should be aiming at reducing the actual risk posed by infractions.
4. Responsive regulation. Enforcement should be based on “responsive regulation” principles:
inspection enforcement actions should be modulated depending on the profile and behaviour of
specific businesses.
5. Long term vision. Governments should adopt policies on regulatory enforcement and inspections:
clear objectives should be set and institutional mechanisms set up with clear objectives and a long-
term road-map.
6. Co-ordination and consolidation. Inspection functions should be co-ordinated and, where needed,
consolidated: less duplication and overlaps will ensure better use of public resources, minimise
burden on regulated subjects, and maximise effectiveness.
7. Transparent governance. Governance structures and human resources policies for regulatory
enforcement should support transparency, professionalism, and results-oriented management.
Execution of regulatory enforcement should be independent from political influence, and
compliance promotion efforts should be rewarded.
8. Information integration. Information and communication technologies should be used to maximise
risk-focus, co-ordination and information-sharing – as well as optimal use of resources.
9. Clear and fair process. Governments should ensure clarity of rules and process for enforcement
and inspections: coherent legislation to organise inspections and enforcement needs to be adopted
and published, and clearly articulate rights and obligations of officials and of businesses.
10. Compliance promotion. Transparency and compliance should be promoted through the use of
appropriate instruments such as guidance, toolkits and checklists.
11. Professionalism. Inspectors should be trained and managed to ensure professionalism, integrity,
consistency and transparency: this requires substantial training focusing not only on technical but
also on generic inspection skills, and official guidelines for inspectors to help ensure consistency
and fairness.

ENV/WKP(2020)3 43
Unclassified
5.1.1. Stationary Sources
Self-monitoring and inspections
Self-monitoring requirements for firms increase in relation to their environmental impact
(Table 5.1). The regulations require measurements to be performed either directly by the regulated firm or
by third parties (i.e. accredited laboratories) following specific procedures and techniques (e.g. for NOx,
the measurement methods should follow Japanese Industrial Standard k0104). Emitters are also required
to store the results of their analysis for at least three years (The Regulations for the enforcement of Air
Pollution Control Act, as amended in 2016).
Table 5.1. Obligation of pollutants emission measurement
Note: Emission gas volume criteria applied for SOx (10Nm3 / hour) is based on SOx emission. Criteria applied for pollutants other than SOx
(40,000 m3/hour) is based on overall gas emission of facility.
Source: (APCA, 2016[101]).
While the MoE has released guidelines for the organisation and design of inspections, the ultimate
responsibility lies with local governments. The guidelines encourage to schedule inspections so that
all facilities are regularly checked but local governments have the autonomy to develop their own
prioritisation criteria (MoE, 2008[102]). These usually include the total volume of pollution emission, kinds
of hazardous pollutants released, and compliance record, thus allowing for a prioritisation of inspections
for higher-risk facilities in line with the OECD Best Practice Principles Regulatory Enforcement and
Inspections (Box 5.1) (OECD, 2009[99]) (MoE, 2018[19]). The MoE also issues guidelines on how to draft
inspection manuals but, since these are non-mandatory as well, local authorities have adopted different
approaches ranging from releasing detailed manuals to developing simple checklists. Overall, the
presence of guidelines and manuals are likely to ensure that regulated agents are not confronted with
excessive variations depending on the inspectors they are in contact with. Importantly, while this approach
based on non-mandatory guidelines is likely to provide Prefectures with the necessary autonomy to cater
inspection strategies to the local needs, the extent to which implemented procedures ensure sufficiently
uniform standards across regions is not monitored.
The result of inspection is summarised in a form of written reports. In addition, some local governments
have developed their own local database to store and manage inspection results. (MoE, 2018[19]). Most
prefectures did not introduce a system of inspectors’ rotation, thus the same staff is likely to monitor the
Emission gas volume Minimum frequency Note
Soot and Smoke
SOx >= 10Nm3 / hour Every two months 24 hours monitoring required for those subject to total emission regulations
NOx >= 40,000 m3 / hour Every two months 24 hours monitoring required for those
subject to total emission regulations < 40,000 m3 / hour Every six months
Others (e.g., Soot and Dust, other pollutants such as Cadmium, etc.)
>= 40,000 m3 / hour Every two months
< 40,000 m3 / hour < 40,000 m3 / hour Every six months
VOCs Every one year
Asbestos Every six months Concentration standard is 10 fibres per 1 L air
Mercury >= 40,000 m3 / hour Every four months
< 40,000 m3 / hour Every six months

44 ENV/WKP(2020)3
Unclassified
same facility over a long time period. This is often considered as a bad practise since it can facilitate
corruption.
During the past three years approximately 15% of factories emitting soot and smoke and 60% of
those emitting VOCs have been inspected annually (Table 5.2). The number of inspections has also
remained relatively stable during this period with the exception of those related to asbestos. In fact, these
increased by 35% between 2015 and 2016 due to an earthquake in Kumamoto that damaged numerous
old buildings that were built using asbestos, thus requiring an extensive monitoring of emissions from
buildings demolition activities (MoE, 2018[103]).
Table 5.2. Number of facilities / factories checked by local governments in 2016
Total number
(by facility)
Total number
(by factory)
Inspections
(by factory)
Administrative
Guidance
(by facility)
Administrative
Orders
(by facility)
Litigation
(by facility)
Soot and Smoke 217,673 87,727 14,427 4,422 1 0
VOCs 3,445 1,091 604 76 2 0
Asbestos 12,474 n.a. 23,703 4,971 4 0
Note: Counting for asbestos is based on number of dismantling or demolition of building using materials including asbestos. Direct emitters of
asbestos were abolished by the end of 2007.
Source: (MoE, 2018[103]).
5.1.2. Mobile sources
Self-monitoring and inspections
Under the Road Transport Vehicles Act, Japan introduced the “type designation system” (型式指
定制度) for mass-produced vehicles (RTVA, 2017[104]). Within this framework, the MLIT is responsible
to verify that vehicles to be introduced in the market comply with emission (and safety) standards. Once a
new vehicle is approved, the manufacturer is required to ensure that each produced unit meets these
standards through a so-called “completion test” (完成検査) (Task-force to ensure the appropriate
completion testing, 2018[105]).
Following the recent international scandals surrounding vehicle emission tests, the national
government is reviewing the inspection procedure on manufacturers’ vehicle “completion tests”.
These inspections are commonly announced so that companies can prepare the necessary documents
and equipment, thus shortening the overall time for the assessment. However, since in recent
investigations it emerged that unqualified personnel performed these tests, a task-force has been
established to evaluate both the current inspecting and testing procedures. After a four month-long review,
the Task-force released a number of recommendations to improve both procedures, including a shift to
unexpected inspection and a requirement for companies to record and report the content of the trainings
completed by testers (see also section 4.3) (Task-force to ensure the appropriate completion testing,
2018[105]).
Once vehicles are in-use, owners are required to perform periodic inspections. The National Agency
for Automobile and Land Transport Technology (NALTEC) operates and manages the inspection system
that comprises both periodic and roadside assessments (Table 5.3). The former, whose frequency
depends on the vehicle type, are carried out at inspection stations of the national agency or designated
maintenance garages (NALTEC, 2016[106]). The latter are instead carried out on the roads in cooperation
with the police.

ENV/WKP(2020)3 45
Unclassified
Table 5.3. Valid term of vehicle inspection certificate
Initial inspection
From the 2nd
inspection
Trucks >= 8 ton 1 year 1 year
< 8 ton 2 years 1 year
Buses / Taxis 1 year 1 year
Rental cars (Passenger cars only) 2 years 1 year
Mini-sized Trucks
Small-sized Motorcycles
Large-sized Special Motor Vehicles
2 years 2 years
Private Passenger Motor Vehicles
Mini-sized Passenger Motor Vehicles 3 years 2 years
Source: (NALTEC, 2016[107]).
Moreover, the MLIT can conduct sampling-based inspection of in-use vehicles. For instance,
following the diesel emissions scandal in 2015, MLIT and MoE jointly conducted emission inspection on 8
existing models of diesel vehicles (6 domestic and 2 imported models) (MLIT, 2015[108]) with the aim of
verifying the presence of any discrepancy in emission levels between real driving conditions and in-house
tests. Furthermore, the MLIT leverages different channels to collect information on vehicles
nonconformities that can potentially require a recall. Information from users is collected through a vehicle
malfunction information hotline and a dedicated website. From 2001 to 2015, the MLIT collected annually,
on average, 6,000 consumers’ reports and it is estimated that between 45% and 80% of these provided
complete and reasonable information. On average, emission-related cases accounted for 2% to 3% of
effective reports (ICCT, 2017[109]). These data are analysed and integrated with the information on
malfunctions reported by manufacturers, police and other relevant agencies to identify potential issues
(MLIT, 2018[110]).
5.2. Enforcement
5.2.1. Administrative enforcement
Based on the inspection results, authorities can issue either administrative guidance or
administrative orders. Administrative guidance are not legally-binding acts that recommend and provide
advice on how to improve pollution control measures. Lack of compliance with these acts does not lead to
penalties (Ministry of Justice, 2005[111]). Instead, administrative orders are legal acts that require firms to
improve or to suspend operations (Ministry of Justice, 2005[111]) These administrative acts are imposed if
a major corrective action is required or if the administrative guidance has been insufficient to ensure
corrective actions (APCA, 2006[17]), (OECD, 2009[99]).
Administrative enforcement can start on the basis of either self-disclosed reports or samplings
taken by certified inspectors. Once a firm has received a guidance or an order, it is required to submit
an “improvement plan” that has to include a timeline for ameliorating interventions. Based on this timeline,
the local governments schedule the date of next follow-up inspection (MoE, 2018[19]).
Administrative orders are very rarely issued since the intervention of the authority is already
regarded as a sanction due to potentially high reputational damages. A strong culture of compliance
results in a very low ratio between the numbers of guidances and orders issued. For instance, during the
past three years - on average - 35,555 inspections have been conducted leading to the issuance of 8,087
guidances and only 5 orders (MoE, 2018[103]). Importantly, the details of enforcement decisions (e.g.
names of businesses, reasons, etc.) are not publicly disclosed but aggregated data are available on the

46 ENV/WKP(2020)3
Unclassified
MoE website. In addition, corporations are encouraged to publish environmental reports along the
guidelines developed by the MoE. These explicitly require to describe the compliance with environmental
regulations, including “the status of the compliance with environmental regulations and of the
performance of other obligations related to the environment”. This information can be disclosed in the
section dedicated to “Environmental risk management system” (MoE, 2012[112]).
In case of incidents, the local government can also order to take the necessary measure to prevent the
worsening of the environmental consequences. While the facility is responsible for reporting any incident,
the MoE and local governments can conduct additional inspections if deemed necessary (APCA, 2006[17]).
There is limited horizontal information sharing on compliance issues. In fact, no specific mechanism
has been established to ensure that prefectures share with each other data on violation and inspections
results. These information are first reported to the National government that can then decide whether to
initiate further investigations and/or inform other prefectures. Within this context, the creation of stronger
horizontal coordination mechanisms that would allow Prefectures to directly share information on non-
compliance issues may reduce the time to identify similar violations in other regions (OECD, 2018[113]).
For mobile sources, the MLIT can recommend manufactures to recall vehicles that are found in
violation of enforced standards. If the manufacturer does not follow this recommendation, then MLIT will
publicly announce its noncompliance. If the manufacturer still refuses to act after the public announcement,
MLIT will order a recall (MLIT, 2018[110]).
Violation of vehicle emission standards also lead to civil and criminal penalties. For instance,
providing a false notification on potentially nonconforming or nonconforming vehicles/devices, failing to
take the corrective actions ordered by the MLIT or to collaborate during on-site can result in one year of
penal servitude or/ and in fines up to 3 million yen for each person, in addition to a fine up to 200 million
yen for each group for each violation (Yang, Muncrief and Bandivadekaricct, 2017[114]). Moreover,
considering the scandal of cheating on fuel economy tests in 2016, the Road Transport Vehicle Act was
amended in 2017 so that the MLIT can suspend type designation approval for vehicles if it is determined
that the manufacturer provided false information in type designation applications (MLIT, 2017[115]).
It is particularly complex to compare the extent to which countries rely on guidance and other
enforcement actions. The main reasons are the difference in the tools available to domestic agencies
(i.e. the gradation of enforcement response) and the statistical issues due to the non-randomness of
inspections. In fact, several countries deliberately target higher risk facilities and therefore the sample of
the inspected facilities is not random. As such, a higher (or lower) rate of both violations discovery and/or
of recourse to heavier enforcement actions may be the result of a higher (or lower) ability to identify
potential violators (Mazur, 2010[116]). Also for these reasons, there is a limited availability of cross-country
data on this topic. Keeping these caveats in mind, it should be noted that OECD countries exhibit a large
variation in terms of their reliance on fines to correct to violations. For instance, formal enforcement actions
(either through civil judicial and administrative enforcement) were initiated for approximately 16% of the
federal inspections and evaluations in 2017 in USA while French authorities conducted 20,000 inspections
in 2014 leading to 2,300 compliance notices (mise en demeure) and only 950 more formal actions (
« sanctions administratives » et « procès-verbaux d’infraction ») (MEDDE, 2015[117]; US EPA, 2018[118]).
5.2.2. Legal liability
The Air Pollution Control Act introduced strict liability for environmental damages. This principle
establishes that whenever any air pollutant injures human health, the entity that released such pollutant is
liable for any resulting damage. For instance, the PHDCS program operated by the ERCA (Box 3.1) has
been considered as a form of administrative damage compensation system whereby victims of pollution
can obtain compensations through non-judicial procedures. Victims who are not included in such
administrative compensation systems can sue the polluters in court.

ENV/WKP(2020)3 47
Unclassified
There have also been cases in which compensation was demanded from the government for failing
to regulate harmful substances. This obligation was first recognised in the landmark decision on the
Minamata disease lawsuit where the Japanese Supreme Court (2004) ruled that the failure of the national
and prefectural government to exercise their power to control pollution and to enforce regulations was an
unlawful act. After this decision, several courts admitted the State liability in other pollution cases. For
instance, in 2013 the Osaka High Court held that the national government was liable for failing to regulate
asbestos based on the Labour Standards Act and on the Industrial Safety and Health Act (Okubo,
2014[119]) (Osaka Asbestos defense lawyers, 2018[120]).
The penal code establishes several environment-related criminal offences. These include violation
of improvement orders or provision of false information (Table 5.4). The decision to initiate prosecution is
at the discretion of the local government. When criminal penalties are issued against a company, usually
its employees are also convicted of violation.
Table 5.4. Penalties for Soot and Smoke facilities
Type the subtitle here. If you do not need a subtitle, please delete this line.
Source: (APCA, 2006[17]).
5.3. Promotion of compliance
The main objective of compliance promotion activities is to ensure that regulated entities are aware
of their environmental responsibilities and possess the capacity to comply. To this end, countries
often leverage a variegated toolbox that includes training or guidance provided during the inspections. In
this respect, the practise of relying significantly on administrative guidance rather than sanctions can be
regarded as an effective part of the compliance promotion toolkit leveraged in Japan (see section 4.2.1).
In addition, numerous actors contribute to information dissemination activities. The MoE plays an important
role in disseminating information about new regulations, often jointly with METI, by developing information
and educational materials for the regulated industries and by holding seminars at industrial associations’
meetings. However, these initiatives are introduced ad-hoc and on-going training programs, which can be
useful to newly established firms, are not offered. Furthermore, a lack of formal evaluation of these
initiatives hinder the identification of best-practises. Other actors that promote information dissemination
includes the METI that has also developed environment management guidelines for pollution prevention
activities (METI, 2007[121]). Furthermore, the Japan Environmental Association for Industry (JEMAI) also
Penalties
Violate order to change a plan or order for improvement 1 year of penal servitude or fine up to 1 million yen
Violate restrictions on Soot and Smoke emissions
Violate order of measures on the event of an accident 6 months of penal servitude or fine up to 0.5 million yen
Failure or false notification of setting in place facilities
Failure or false notification of changes to the structured of facilities 3 months pf penal servitude or fine up to 0.3 million yen
Failure or false notification of existing facilities
Violate restrictions on implementation of facilities
False report of emissions, or refuse, obstruct or evade an inspection
Failure or false recording, failure in keeping record
Fine up to 0.2 million yen
Failure or false notification of name change, discontinue, or succession
Fine up to 0.1 million yen

48 ENV/WKP(2020)3
Unclassified
plays a role in disseminating information by organising trainings open to its associates and other interested
parties. The initiatives aims at providing pollution control managers with continuous education as well as
skilling-up those who engage in environmental work including environmental management system and
environmental audit (JEMAI, 2018[122]). JEMAI also shares the latest information regarding environmental
laws and pollution control technologies by publishing books and updating its website. Finally, local
governments also provide their own regulatory information to businesses by delivering trainings,
developing explanatory materials, and attending industrial associations’ meetings to disseminate
information as needed (OECD, 2009[99]).
Furthermore, the introduction of measures to control the qualifications of personnel in charge of
“completion tests” for mobile sources is currently under consideration. In fact, the training of employees
responsible for completion tests is currently at the discretion of the manufactures. Following the completion
test scandal in 2016, the “Taskforce for appropriate completion test” suggested to introduce a requirement
for companies to both record and report the content of trainings completed by testers and to establish
programs for continuous skills update. The document also included a recommendation to check if the
training and education are conducted in line with the submitted reports during on-site inspections
(Task-force to ensure the appropriate completion testing, 2018[105]).
Disclosing non-compliance is a useful approach to promoting adherence to environmental laws both within
firms and governments. To this end, several mechanisms contribute to ensure that the general public is
informed on the quality of the environment and has access to the results of the monitoring and enforcement
activities. For instance, the MoE surveys regional emissions of key pollutants (e.g. soot and dust, SOx and
NOx) and discloses the results on the attainment rate of the various air quality standards while
Soramamekun’s system provides almost real time information on the concentration of certain pollutants
(MoE, 2018[7]). Information on inspection and enforcement activities is also collected at the national level.
To this end, yearly report are released with aggregated data on number of total facilities/factories emitting
specific pollutants (soot and smoke, VOCs, and asbestos), the number of (i) facilities/factories inspected,
(ii) administrative guidance and administrative orders issued, and (iii) initiated litigation. The report also
has some breakdown of numbers by type of administrative guidance and administrative orders13 (MoE,
2018[103]). Importantly, the details of enforcement decisions (e.g., names of businesses, reasons, etc.) are
not publicly disclosed but the guidelines for environmental reports require corporations to describe the
status of compliance with environmental regulations. The MLIT also discloses information about
automotive recalls on its web site while, on a dedicated online database, users can search information on
recall reports, remedial actions taken, and malfunctions by vehicle type (MLIT, 2018[123]).
The Act on Promotion of Business Activities mandates certain corporations to publish annual
environmental reports. However, this duty is limited to “specified business operators”, which are defined
as corporations established under special laws or under government order (e.g. the national university
corporations or incorporated administrative agencies under the Act on General Rules for Incorporated
Administrative Agencies) (Thomson Reuters, n.d.[124]). Instead, larger corporations, defined as
corporations other than small and medium-sized enterprises, must make efforts to publish environmental
reports. As detailed by the reporting guidelines developed by the MoE, “air pollution and its environmental
impacts on the living environment” should be included among the topics assessed in these publications
(MoE, 2012[112]).
13 The main categories are: 1) failure to measure emission 2) failure to record the measurement result 3) failure to
store measurement records and 4) providing false record

ENV/WKP(2020)3 49
Unclassified
References
ACEA (2018), WLTPfacts.eu, http://wltpfacts.eu/wltp-benefits/ (accessed on July 2018). [80]
Agency for Natural Resources and Energy (2018), Supporting policies for environmental
technology installation,
http://www.enecho.meti.go.jp/category/saving_and_new/ohisama_power/sien/hojyo.html
(accessed on July 2018).
[64]
Air Quality Expert Group (2007), Air Quality and Climate Change: A UK Perspective, Department
for the Environment, Food and Rural Affairs, https://uk-
air.defra.gov.uk/assets/documents/reports/aqeg/fullreport.pdf (accessed on July 2018).
[132]
All guide for housing subsidy (2018), List of subsidies for low energy housing, http://www.sumai-
fun.com/money/53/energy-saving.html (accessed on July 2018).
[133]
Alphabet (2018), WLTP & RDE The new test procedures, https://www.alphabet.com/files/2018-
02/wltp_and_real_driving_emission_flyer-en-ww.pdf (accessed on August 2018).
[82]
APCA (2017), Order for Enforcement of the Air Pollution Control Act, as amended in 2017,
http://elaws.e-
gov.go.jp/search/elawsSearch/elaws_search/lsg0500/detail?lawId=343CO0000000329&open
erCode=1 (accessed on August 2018).
[45]
APCA (2016), Regulations for enforcement of Air Pollution Control Act, as amended in 2016,
http://elaws.e-
gov.go.jp/search/elawsSearch/elaws_search/lsg0500/detail?lawId=346M50000500001&open
erCode=1#207 (accessed on August 2018).
[101]
APCA (2006), Air Pollution Control Act, as amended in 2006,
http://www.japaneselawtranslation.go.jp/law/detail/?id=2146 (accessed on July 2018).
[17]
APIS (2016), Ozone | Air Pollution Information System,
http://www.apis.ac.uk/overview/pollutants/overview_O3.htm (accessed on August 2018).
[163]
Arlinghaus, J. and K. Van Dender (2017), Environmental Fiscal Reform - Progress, prospects
and pitfalls, OECD Report for the G7 Environment Ministers, OECD, Paris,
http://www.oecd.org/tax/tax-policy/tax-and-environment.htm. (accessed on 8 March 2019).
[93]
Börkey, P. et al. (1999), Voluntary Approaches for Environmental Policy in OEDC Countries: An
Assessment, CERNA, Centre d’économie industrielle Ecole Nationale Supérieure des Mines
de Paris, https://www.peacepalacelibrary.nl/ebooks/files/C08-0099-B%F6rkey-Voluntary.pdf
(accessed on 12 July 2019).
[69]

50 ENV/WKP(2020)3
Unclassified
Brouhle, K., C. Griffiths and A. Wolverton (2005), “The Use of Voluntary Approaches for
Environmental Policymaking in the U.S.”, in The Handbook of Environmental Voluntary
Agreements, Springer-Verlag, Berlin/Heidelberg, http://dx.doi.org/10.1007/1-4020-3356-7_6.
[73]
Canadian Council of Ministers of the Environment (2012), Canadian Ambient Air Quality
Standards (CAAQS) for Fine Particulate Matter (PM2.5) and Ozone,
https://www.ccme.ca/files/current_priorities/aqms_elements/caaqs_and_azmf.pdf (accessed
on August 2018).
[134]
Chiba Prefectural Government (2014), Ordinance of Environmental Impact Assessment, as
amende in 2014, http://www1.g-reiki.net/chiba/reiki_honbun/g002RG00000751.html
(accessed on August 2018).
[161]
Chiba prefecture (2018), “Guidance on Air Pollution Act for business owners”,
http://www.pref.chiba.lg.jp/taiki/documents/201807tebiki-all.pdf (accessed on 13 July 2018).
[126]
City of Yokohama (2012), Ordinance of Environmental Impact Assessment, as amended in
2012, http://www.city.yokohama.lg.jp/kankyo/etc/jyorei/jyorei/eikyou/jyorei/jyorei.pdf
(accessed on August 2018).
[162]
Cuesta, J. et al. (2018), “Transboundary ozone pollution across East Asia: daily evolution and
photochemical production analysed by IASI + GOME2 multispectral satellite observations and
models”, Atmospheric Chemistry and Physics, Vol. 18/13, pp. 9499-9525,
http://dx.doi.org/10.5194/acp-18-9499-2018.
[12]
DBJ (2018), Environmental management by DBJ,
https://www.dbj.jp/co/csr/responsibility/management.html (accessed on July 2018).
[67]
Defra (2015), Valuing impacts on air quality: Updates in valuing changes in emissions of Oxides
of Nitrogen (NO X ) and concentrations of Nitrogen Dioxide (NO 2 ),
http://www.gov.uk/defrawww.gov.uk/air-quality-economic-analysis (accessed on
10 October 2018).
[33]
DieselNet (2015), Emission Standards: Japan: Cars and Light Trucks,
https://www.dieselnet.com/standards/jp/ld.php (accessed on August 2018).
[96]
EEA (2018), Air Quality e-Reporting (AQ e-Reporting), Air quality annual statistics,
https://www.eea.europa.eu/data-and-maps/data/aqereporting-8 (accessed on July 2018).
[5]
Element Energy; ICCT (2015), Quantifying the impact of real-world driving on total CO2
emissions from UK cars and vans, https://www.theccc.org.uk/wp-
content/uploads/2015/09/Impact-of-real-world-driving-emissions-for-UK-cars-and-vans.pdf
(accessed on July 2018).
[85]
Elliott, R. and T. Okubo (2016), “Ecological Modernization in Japan: The Role of Interest Rate
Subsidies and Voluntary Pollution Control Agreements”, Asian Economic Papers, Vol. 15/3,
pp. 66-88, http://dx.doi.org/10.1162/ASEP_a_00452.
[72]
ERCA (2018), ERCA website, https://www.erca.go.jp/erca/english/index.html (accessed
on August 2018).
[21]
ERCA (2018), “Report of activities: Conservation of migratory land birds in Asia”,
https://www.erca.go.jp/jfge/subsidy/organization/report/h28/pdf/i_a25.pdf (accessed on
1 October 2018).
[40]

ENV/WKP(2020)3 51
Unclassified
ERCA (2018), Report of activities: Environmental conservation for small scale forest,
https://www.erca.go.jp/jfge/subsidy/organization/report/h28/pdf/ha_a34.pdf (accessed on
1 October 2018).
[41]
ERCA (2018), “Report of activities: ESD in education - The theme of air pollution”,
https://www.erca.go.jp/jfge/subsidy/organization/report/h28/pdf/ha_a78.pdf (accessed on
1 October 2018).
[42]
ERCA (2018), 空気中の化学物質から健康を 守るための環境調査と対策及び 市民への啓蒙普及活動, https://www.erca.go.jp/jfge/subsidy/organization/report/h28/pdf/ha_a11.pdf (accessed
on 1 October 2018).
[39]
ERCA (2014), Environmental Restoration and Conservation Agency of Japan,
https://www.erca.go.jp/erca/english/pdf/pamphlet_en.pdf (accessed on July 2018).
[16]
European Commission (2017), Air Quality Standards European Commission, last updated by
2017, http://ec.europa.eu/environment/air/quality/standards.htm (accessed on July 2018).
[135]
Greenpeace Japan (2017), Greenpeace Japan, http://www.greenpeace.org/japan/ja/info/japan/
(accessed on August 2018).
[38]
Hasegawa, K. (2010), “Collaborative environmentalism in Japan”, in Vinken, H. et al. (eds.), Civic
Engagement in Contemporary Japan: Established and Emerging Repertoiries.
[36]
Hashimoto, M. (1989), “Chapter 6 The Pollution-Related Health Damage Compensation Law”,
Studies in Environmental Science, Vol. 38, pp. 239-298, http://dx.doi.org/10.1016/S0166-
1116(08)70060-8.
[22]
IARC (2012), Diesel Engine Exhaust Carcinogenic – Press Release No. 213, 12 June 2012,
International Agency for Research on Cancer, Lyon,, http://dx.doi.org/10.1093/jnci/djs034.
[91]
ICCT (2017), “GLOBAL BASELINE ASSESSMENT OF COMPLIANCE AND ENFORCEMENT
PROGRAMS FOR VEHICLE EMISSIONS AND ENERGY EFFICIENCY”,
http://www.theicct.org (accessed on 23 July 2018).
[109]
IEA (2018), IEA PAM, Feed-in Tariff for renewable electricity and solar PV auction,
https://www.iea.org/policiesandmeasures/pams/japan/name-30660-
en.php?s=dHlwZT1yZSZzdGF0dXM9T2s,&return=PG5hdiBpZD0iYnJlYWRjcnVtYiI-
PGEgaHJlZj0iLyI-
SG9tZTwvYT4gJnJhcXVvOyA8YSBocmVmPSIvcG9saWNpZXNhbmRtZWFzdXJlcy8iPlBvbG
ljaWVzIGFuZCBNZWFzdXJlczwvYT4gJnJhcXVv.
[63]
Ikeda, K. et al. (2015), “Source region attribution of PM2.5 mass concentrations over Japan”,
Geochemical Journal, Vol. 49/2, pp. 185-194, http://dx.doi.org/10.2343/geochemj.2.0344.
[8]
Imura, H. and M. Schreurs (2005), Environmental policy in Japan, Edward Elgar Pub,
https://play.google.com/books/reader?id=t3_pgPtf-
QoC&printsec=frontcover&output=reader&hl=it&pg=GBS.PA28.w.1.15.0 (accessed
on June 2018).
[1]
Industrial Waste Management Foundation (2013), Certification for excellent industrial waste
processors, http://www.env.go.jp/policy/ga/brief_info/brief-mat_d.pdf (accessed
on August 2018).
[66]

52 ENV/WKP(2020)3
Unclassified
IPSuS (2018), List of points given at the local bidding qualification in public construction works,
http://ea21.jp/files/starter/jichitai_hyoka.pdf (accessed on August 2018).
[65]
IPSuS (2011), Eco Action 21, http://ea21.jp/ea21/ (accessed on July 2018). [68]
Itahashi, S. et al. (2017), “Nitrate transboundary heavy pollution over East Asia in winter”,
Atmospheric Chemistry and Physics, pp. 3823-3843, http://dx.doi.org/10.5194/acp-17-3823-
2017.
[9]
ITF (2015), Adapting Transport Policy to Climate Change: Carbon Valuation, Risk and
Uncertainty, ITF Research Reports, OECD Publishing, Paris,
http://dx.doi.org/10.1787/9789282107928-en.
[30]
Jacob, K. et al. (2011), INTEGRATING THE ENVIRONMENT IN REGULATORY IMPACT
ASSESSMENTS The OECD Regulatory Policy Committee, OECD,
https://www.oecd.org/gov/regulatory-
policy/Integrating%20RIA%20in%20Decision%20Making.pdf (accessed on July 2018).
[24]
JAF (2013), Latest emission regulation, http://qa.jaf.or.jp/mechanism/engine/10.htm (accessed
on August 2018).
[137]
JAMA (2017), The Motor Industry of Japan, http://www.jama.org/wp-
content/uploads/2017/09/mij2017.pdf (accessed on August 2018).
[88]
JEMAI (2018), Japan Environmental Management Association for Industry, http://www.e-
jemai.jp/ (accessed on July 2018).
[122]
JEMAI (2018), Pollution Control Manager, http://www.jemai.or.jp/english/pcm/outline.html
(accessed on August 2018).
[59]
JFC (2018), JFC loans related to environment and energy,
https://www.jfc.go.jp/n/finance/search/15_kankyoutaisaku.html (accessed on July 2018).
[60]
JFC (2018), Loan program list by JFC, https://www.jfc.go.jp/n/finance/search/index.html
(accessed on August 2018).
[62]
JFC (2017), Overview of Operations, https://www.jfc.go.jp/n/english/pdf/jfc2017e_3.pdf
(accessed on 1 October 2018).
[61]
JFPI (2018), Green Printing Certification, https://www.jfpi.or.jp/greenprinting/ (accessed
on August 2018).
[78]
JFPI (2016), The Greenized Practice of Japanese printing industry,
https://www.jfpi.or.jp/files/user/FAPGA%202016%20Japan%E3%80%80Final.pdf (accessed
on August 2018).
[138]
Kanagawa Prefectural Government (2014), Ordinance of Environmental Impact Assessment, as
amended in 2014, http://www3.e-reikinet.jp/cgi-bin/kanagawa-
ken/d1w_gaibu_jyoubundisp.exe?HOUCD=35590101003600000000 (accessed
on August 2018).
[160]
Keidanren (2018), Environment and Energy Policy Proposals,
http://www.keidanren.or.jp/en/policy/index07.html (accessed on August 2018).
[139]

ENV/WKP(2020)3 53
Unclassified
Kühlwein, J., J. German and A. Bandivadekar (2014), DEVELOPMENT OF TEST CYCLE
CONVERSION FACTORS AMONG WORLDWIDE LIGHT-DUTY VEHICLE CO 2 EMISSION
STANDARDS, ICCT, https://www.theicct.org/sites/default/files/publications/ICCT_LDV-test-
cycle-conversion-factors_sept2014.pdf (accessed on August 2018).
[84]
Kuramochi, T. (2014), GHG MITIGATION IN JAPAN: AN OVERVIEW OF THE CURRENT
POLICY LANDSCAPE, WRI,
http://www.wri.org/sites/default/files/wri_workingpaper_japan_final_ck_6_11_14.pdf
(accessed on July 2018).
[89]
Lutsey, N. et al. (2018), Power Play: How Governments are spurring the electric vehicle industry,
ICCT,
https://www.theicct.org/sites/default/files/publications/EV_Government_WhitePaper_2018051
4.pdf (accessed on August 2018).
[136]
Mason, R. (2014), “Japan’s evolving Civic Environmentalism”, in Leonard, L. and S. Kedzior
(eds.), Occupy the earth : global environmental movements,
https://books.google.fr/books?hl=it&lr=&id=LOG8BQAAQBAJ&oi=fnd&pg=PA37&ots=6Zjrbtu
evG&sig=3ehaBHlwZ1M5SilKY-q4WWuVyvc#v=onepage&q&f=false (accessed on
7 June 2018).
[35]
Matsuno, Y. (2010), The impacts of the SOx charge and related policy instruments on
technological innovation in Japan, OECD,
https://www.researchgate.net/publication/275531178.
[43]
Matsuno, Y. (2007), “Pollution control agreements in Japan: conditions for their success”,
Environmental Economics and Policy Studies,
https://link.springer.com/content/pdf/10.1007%2FBF03353952.pdf (accessed on July 2018).
[71]
Mazur, E. (2010), “Outcome Performance Measures of Environmental Compliance Assurance:
Current Practices, Constraints and Ways Forward”, OECD Environment Working Papers, No.
18, OECD Publishing, Paris,, https://www.oecd-ilibrary.org/environment/outcome-
performance-measures-of-environmental-compliance-assurance_5kmd9j75cf44-
en;jsessionid=goV1z_pnrTgS1naSEAeu8yc1.ip-10-240-5-48 (accessed on 26 August 2019).
[116]
MEDDE (2015), Inspection des installations classées: Bilan des actions nationales 2014,
http://www.developpement-durable.gouv.fr (accessed on 3 October 2018).
[117]
METI (2018), Process of VOC voluntary agreements,
http://www.meti.go.jp/policy/voc/flow/steps.html (accessed on 30 August 2018).
[166]
METI (2017), Voluntary initiatives on VOC emission reduction as of 2015,
http://www.meti.go.jp/committee/sankoushin/sangyougijutsu/kankyo_taisaku/pdf/005_s02_00.
pdf (accessed on August 2018).
[77]
METI (2015), Introduction of WLTP for vehicle testing,
http://www.meti.go.jp/committee/sougouenergy/shoene_shinene/sho_ene/jidosha_wg/2015/p
df/001_07_00.pdf (accessed on August 2018).
[140]
METI (2014), Strategic Energy Plan,
http://www.enecho.meti.go.jp/en/category/others/basic_plan/pdf/4th_strategic_energy_plan.p
df (accessed on July 2018).
[13]

54 ENV/WKP(2020)3
Unclassified
METI (2010), VOC emission reduction guide (3rd revision),
http://www.meti.go.jp/policy/voc/downloads/VOC-tebiki_22fy.pdf (accessed on
30 August 2018).
[75]
METI (2007), Report and guideline for environment management for pollution prevention,
http://www.meti.go.jp/policy/energy_environment/kankyokeiei/environmentguideline/download
s/kougaiboushi-houkokusho.pdf (accessed on July 2018).
[121]
Ministry of Health, Labour and Welfare (2018), Management Standard of Environmental
Sanitation for Buildings, as accessed in 2018, https://www.mhlw.go.jp/bunya/kenkou/seikatsu-
eisei10/index.html (accessed on July 2018).
[141]
Ministry of Health, Labour and Welfare (2014), Act on Maintenance of Sanitation in Buildings, as
amended in 2014, http://elaws.e-
gov.go.jp/search/elawsSearch/elaws_search/lsg0500/detail?lawId=345AC1000000020&open
erCode=1 (accessed on July 2018).
[142]
Ministry of Internal Affairs and Communications (2018), Result of Survey on the Fixed Number of
Employees in local government in 2017,
http://www.soumu.go.jp/main_content/000545654.pdf (accessed on June 2018).
[20]
Ministry of Internal Affairs and Communications (2017), Implementation Guidelines for Policy
Evaluation of Regulations, as ameded in 2017,
http://www.soumu.go.jp/main_content/000556223.pdf (accessed on June 2018).
[27]
Ministry of Justice (2005), Administrative Procedure Act, as amended in 2005,
http://www.japaneselawtranslation.go.jp/law/detail/?vm=04&re=01&id=85&lvm=02 (accessed
on July 2018).
[111]
Ministry of the environment (1975), Law concerning partial revision to Air Pollution Control Act,
https://www.env.go.jp/hourei/04/000093.html (accessed on 4 July 2018).
[125]
MLIT (2018), Automobile: Regulation of exhaust gas for new cars - Ministry of Land,
Infrastructure and Transport, http://www.mlit.go.jp/jidosha/jidosha_tk10_000002.html
(accessed on 23 August 2018).
[97]
MLIT (2018), Emission standards for diesel engines for heavy commercial vehicles,
http://www.mlit.go.jp/common/001185984.pdf (accessed on August 2018).
[98]
MLIT (2018), Implementation of on-road emission testing,
http://www.mlit.go.jp/common/001228743.pdf (accessed on July 2018).
[86]
MLIT (2018), Information on recall and malfunction of automobiles,
http://www.mlit.go.jp/jidosha/carinf/rcl/index.html (accessed on July 2018).
[123]
MLIT (2018), The Automobile Recall System, http://www.mlit.go.jp/jidosha/carinf/rcl/report.html
(accessed on July 2018).
[110]
MLIT (2018), Toll Policy, http://www.mlit.go.jp/road/road_e/p2_ryokin.html (accessed
on July 2018).
[95]
MLIT (2017), Amendment to Road Transport Vehicle Act to prevent the fraud by automobile
manufacturers, http://www.mlit.go.jp/report/press/jidosha08_hh_002555.html (accessed
on July 2018).
[115]

ENV/WKP(2020)3 55
Unclassified
MLIT (ed.) (2016), Overview of the Act on the Improvement of Energy Consumption
Performance of Buildings (Building Energy Efficiency Act),
http://www.mlit.go.jp/common/001134876.pdf (accessed on July 2018).
[143]
MLIT (2015), Asbestos measurement Q&A,
http://www.mlit.go.jp/jutakukentiku/build/Q&A/index.html#a1 (accessed on July 2018).
[144]
MLIT (2015), On-road emission gas sampling test for diesel,
http://www.mlit.go.jp/report/press/jidosha10_hh_000158.html (accessed on July 2018).
[108]
MLIT (2014), New Motorway pricing, http://www.mlit.go.jp/common/001031042.pdf (accessed
on July 2018).
[94]
MLIT (2014), Outline of Low Carbon City Development,
http://www.mlit.go.jp/common/001048781.pdf (accessed on July 2018).
[145]
MoE (2018), 2016 Report on enforcement of Air Pollution Control Act,
https://www.env.go.jp/air/air/osen/kotei/Taiboho_gaiyo_H28.pdf (accessed on July 2018).
[103]
MoE (2018), 2016 summary result of atmospheric air quality measurement,
https://www.env.go.jp/press/files/jp/108676.pdf (accessed on July 2018).
[7]
MoE (2018), Central Environment Council Information, https://www.env.go.jp/council/b_info.html
(accessed on May 2018).
[15]
MoE (2018), Communication with MoE. [19]
MoE (2018), Communication with MoE - 09/2018. [76]
MoE (2018), Eco Mark, https://www.env.go.jp/policy/hozen/green/ecolabel/a04_01.html
(accessed on July 2018).
[146]
MoE (2018), Environmental Management System, https://www.env.go.jp/policy/j-hiroba/04-1.html
(accessed on July 2018).
[149]
MoE (2018), Environmental Quality Standards in Japan, https://www.env.go.jp/en/air/aq/aq.html
(accessed on August 2018).
[44]
MoE (2018), Measures against VOCs: VOC Treatment Technologies,
https://www.env.go.jp/policy/etv/en/technologies/s04_c1.html (accessed on July 2018).
[74]
MoE (2018), “OECD Fact-finding mission”. [3]
MoE (2018), Permission for the Soot and Smoke emitting facilities, accessed in August 2018,
http://www.env.go.jp/info/one-stop/26/001.html (accessed on 7 August 2018).
[58]
MoE (2018), Regulation on NOx emission, accessed in August 2018,
http://www.env.go.jp/air/osen/law/t-kise-3.html (accessed on 6 August 2018).
[131]
MoE (2018), Regulatory Measures against Air Pollutants Emitted from Factories and Business
Sites and the Outline of Regulation - K-value Regulation for Sulfur Oxides, accessed in 2018,
https://www.env.go.jp/en/air/aq/air/air3.html (accessed on August 2018).
[57]
MoE (2018), Soot and Dust regulation, accessed in August 2018,
http://www.env.go.jp/air/osen/law/t-kise-2.html (accessed on 6 August 2018).
[130]

56 ENV/WKP(2020)3
Unclassified
MoE (2018), The Basic Environment Law_Chapter 3,
https://www.env.go.jp/en/laws/policy/basic/ch3.html#section1 (accessed on May 2018).
[14]
MoE (2018), The Fifth Basic Environmental Plan, http://www.env.go.jp/press/files/jp/108982.pdf
(accessed on July 2018).
[51]
MoE (2017), Eco Action 21 guideline, https://www.env.go.jp/press/files/jp/105700.pdf (accessed
on July 2018).
[148]
MoE (2017), Interim review on the total emission reduction policy on NOx and PM from vehicles,
https://www.env.go.jp/press/Review.pdf (accessed on August 2018).
[87]
MoE (2017), Report by photochemical oxidants research and review committee,
http://www.env.go.jp/air/osen/oxidant/report-201703.pdf (accessed on August 2018).
[11]
MoE (2016), Better indicators to measure improvement in photochemical oxidants,
https://www.env.go.jp/air/osen/pc_oxidant/attach/interim_rep.pdf (accessed on August 2018).
[164]
MoE (2016), General investigation on air pollutant emission (actual data of 2014),
https://www.env.go.jp/air/osen/kotei/h27-1.pdf (accessed on July 2018).
[156]
MoE (2016), Modification on Air Pollution Control Act; entry into force of Mercury emission
regulation, http://www.env.go.jp/air/suigin/slide_mercury.pdf (accessed on July 2018).
[55]
MoE (2015), Status of Air pollution, http://www.env.go.jp/air/osen/jokyo_h27/full_h27.pdf
(accessed on July 2018).
[50]
MoE (2013), Diameter of particular matters, http://www.env.go.jp/council/former2013/07air/y078-
02/mat03.pdf (accessed on July 2018).
[147]
MoE (2013), Q&A about PM2.5, https://www.env.go.jp/air/osen/pm/info/attach/rep_20130227-
qa.pdf (accessed on August 2018).
[48]
MoE (2012), Environmental Impact Assessment in Japan,
https://www.env.go.jp/en/focus/docs/files/20120501-04.pdf (accessed on June 2018).
[25]
MoE (2012), Environmental Reporting Guidelines (Fiscal Year 2012 Version,
https://www.env.go.jp/en/policy/economy/erg2012.pdf (accessed on 25 September 2018).
[112]
MoE (2012), Summary of Air Pollution Control Act (fixed source),
http://www.env.go.jp/air/osen/law/index.html (accessed on August 2018).
[56]
MoE (2009), Environmental standard for the air pollution by the fine particular matters,
https://www.env.go.jp/hourei/add/d010.pdf (accessed on August 2018).
[157]
MoE (2008), Guideline to create site inspection manuals based on Air Pollution Control Act,
https://www.env.go.jp/council/41air-wat/y411-01/ref05.pdf (accessed on July 2018).
[102]
MoE (n.d.), “Examples of environmental management to prevent pollution”,
https://www.env.go.jp/air/info/pp_kentou/07/ref01.pdf (accessed on 26 July 2018).
[129]
NALTEC (2016), Categories of vehicle inspection,
https://www.naltec.go.jp/business/inspection/category.html (accessed on August 2018).
[107]

ENV/WKP(2020)3 57
Unclassified
NALTEC (2016), NALTEC Service guide,
https://www.naltec.go.jp/english/serviceguide/ht50ut0000000hka-att/ht50ut0000000hlw.pdf
(accessed on July 2018).
[151]
NALTEC (2016), Process of Renewal Inspection,
https://www.naltec.go.jp/english/business/inspection/process.html (accessed on July 2018).
[106]
National Institute for Environmental Studies (2018), Environmental database,
http://www.nies.go.jp/igreen/index.html (accessed on August 2018).
[6]
NGVPC (2018), Next Generation Vehicle Promotion Center, http://www.cev-pc.or.jp/english/
(accessed on July 2018).
[90]
OECD (2018), Cost-Benefit Analysis and the Environment: Further Developments and Policy
Use, OECD Publishing, Paris, http://dx.doi.org/10.1787/9789264085169-en.
[31]
OECD (2018), OECD Regulatory Enforcement and Inspections Toolkit, https://www.oecd-
ilibrary.org/docserver/9789264303959-
en.pdf?expires=1537808911&id=id&accname=ocid84004878&checksum=4DF425625EB0F0
107C8F2688DF6775EE (accessed on 24 September 2018).
[113]
OECD (2015), Implementing Good Regulatory Practice in Malaysia, OECD Publishing, Paris,
http://dx.doi.org/10.1787/9789264230620-en.
[34]
OECD (2014), OECD Best Practice Principles for Regulatory Policy, https://www.oecd-
ilibrary.org/docserver/9789264208117-
en.pdf?expires=1537806299&id=id&accname=guest&checksum=1109468696B71E993E767
C813F23C173 (accessed on 24 September 2018).
[100]
OECD (2010), “OECD Environmental Performance Reviews: Japan 2010”, http://www.oecd-
ilibrary.org/docserver/download/9710121e.pdf?expires=1521813200&id=id&accname=ocid84
004878&checksum=B9291AEE0D29C542DB0A2C28998C605A (accessed on March 2018).
[18]
OECD (2010), “The impacts of the SOx charge and related policy instruments on technological
innovation in Japan”,
http://www.oecd.org/officialdocuments/publicdisplaydocumentpdf/?doclanguage=en&cote=co
m/env/epoc/ctpa/cfa(2009)38/final (accessed on 29 June 2018).
[127]
OECD (2009), “Ensuring Environmental Compliance: Trends and Good Practices”,
http://dx.doi.org/10.1787/9789264059597-en.
[99]
OECD (2005), “Environment and the OECD Guidelines for Multinational Enterprises:
CORPORATE TOOLS AND APPROACHES”,
http://www.sourceoecd.org/industrytrade/9264009388 (accessed on August 2018).
[152]
OECD (2003), “Working Party on National Environmental Policy: VOLUNTARY APPROACHES:
TWO JAPANESE CASES Pollution Control Agreements in Yokohama City and Kitakyushu
City”,
http://www.oecd.org/officialdocuments/publicdisplaydocumentpdf/?doclanguage=en&cote=en
v/epoc/wpnep(2002)12/final (accessed on July 2018).
[70]
OECD data (2018), Air and GHG emissions, as accessed in 2018, OECD Publishing, Paris,
https://data.oecd.org/air/air-and-ghg-emissions.htm.
[2]

58 ENV/WKP(2020)3
Unclassified
Ogata, T. (2006), Environmental Administration in Japan and the Role of Local Governments,
National Graduate Institute for Policy Studies (GRIPS),
http://www3.grips.ac.jp/~coslog/activity/01/04/file/Bunyabetsu-7_en.pdf.
[52]
Okubo, N. (2014), “Judicial review of public authorities’ omissions in Japan”,
https://www.unece.org/fileadmin/DAM/env/pp/a.to.j/TF7-
2014/2.d_A2J_NewDevelopments_Japan_Okubo.pdf (accessed on 23 July 2018).
[119]
Osaka Asbestos defense lawyers (2018), Asbestos lawsuit in Sennan, Osaka,
http://www.asbestos-osaka1.sakura.ne.jp/sennan/ (accessed on 24 August 2018).
[120]
Osaka Prefectural Government (2013), Ordinance of Environmental Impact Assessment, as
enforced in 2013,
http://www.pref.osaka.lg.jp/houbun/reiki/reiki_honbun/k201RG00000376.html (accessed
on August 2018).
[159]
Pavlovic, J. et al. (2018), “How much difference in type-approval CO 2 emissions from
passenger cars in Europe can be expected from changing to the new test procedure (NEDC
vs. WLTP)?”, Transportation Research, pp. 136-147,
http://dx.doi.org/10.1016/j.tra.2018.02.002.
[83]
Policy Evaluation Council (2017), Improvement suggestions on policy evaluation on regulation,
http://www.soumu.go.jp/main_content/000471068.pdf (accessed on August 2018).
[28]
Qin, Y. et al. (2017), “Air quality, health, and climate implications of China’s synthetic natural gas
development”, PNAS, http://dx.doi.org/10.1073/pnas.1703167114.
[150]
Rie Sugiyama (1999), “CAVA Working paper: Voluntary Approaches in Japan”,
http://www.ensmp.fr/Fr/CERNA/CERNA/Progeuropeens/CAVA/index.html (accessed on
11 July 2018).
[128]
Roy, R. and N. Braathen (2017), “The Rising Cost of Ambient Air Pollution thus far in the 21st
Century: Results from the BRIICS and the OECD Countries”, OECD Environment Working
Papers, No. 124, OECD Publishing, Paris,
http://www.oecd.org/environment/workingpapers.htm (accessed on 1 October 2018).
[92]
RTVA (2017), Road Transport Vehicles Act, as amended in 2017, http://elaws.e-
gov.go.jp/search/elawsSearch/elaws_search/lsg0500/detail?lawId=326AC0000000185&open
erCode=1 (accessed on July 2018).
[104]
Saitama Prefecture (2018), Status of photochemical smog, http://www.taiki-
kansi.pref.saitama.lg.jp/smog.html (accessed on August 2018).
[49]
Sustainalytics (2015), Development Bank of Japan, Sustainability Bond Framework Overview &
Opinion, https://www.dbj.jp/pdf/ir/credit/sri/sustainability/001_opinion.pdf (accessed
on July 2018).
[153]
Takao, Y. (2016), Japan’s environmental politics and governance : from trading nation to
econation, Routledge,
https://books.google.fr/books?id=yjolDwAAQBAJ&pg=PA146&lpg=PA146&dq=center+of+loc
al+authority+for+international+relations+environment&source=bl&ots=jhedTQ9IJs&sig=dakR
7vazjSgHDQX9cbjuICHSre4&hl=it&sa=X&ved=0ahUKEwidkqvJgMbaAhWKWRQKHRmbDb
AQ6AEIdTAK#v=onepa (accessed on April 2018).
[26]

ENV/WKP(2020)3 59
Unclassified
Tanabe, N. (2013), “Transboundary Air Pollution from China: Possibilities for Cooperation with
Japan”, Japan for Sustainability,
https://www.japanfs.org/en/news/archives/news_id034262.html (accessed on August 2018).
[154]
Task-force to ensure the appropriate completion testing (2018), Interim report,
http://www.mlit.go.jp/common/001226554.pdf (accessed on July 2018).
[105]
The Wild Bird Society of Japan (2018), The Wild Bird Society of Japan,
https://www.wbsj.org/about-us/ (accessed on August 2018).
[37]
Thomson Reuters (n.d.), Major projects: environmental risks in Japan: overview | Practical Law,
2018, https://uk.practicallaw.thomsonreuters.com/6-637-
1567?transitionType=Default&contextData=(sc.Default)&firstPage=true&comp=pluk&bhcp=1
(accessed on 25 September 2018).
[124]
Tokyo 2020 (2018), Executive Summary of the Tokyo 2020 Olympic and Paralympic Games
Sustainability Plan Version 2, https://tokyo2020.org/en/games/sustainability/sus-
plan/data/20180611-sus-plan-2-summary_EN.pdf (accessed on 28 September 2018).
[54]
Tokyo Bureau of Environment (2013), Ordinance of Environmental Impact Assessment, as
amended in 2013,
http://www.kankyo.metro.tokyo.jp/basic/guide/assessment/index.files/H25kaiseijoureikisokuge
nkou.pdf (accessed on August 2018).
[158]
Tokyo Bureau of environment (2016), New policy target for photochemical oxidants,
https://www.env.go.jp/council/07air-noise/y078-07/mat06.pdf (accessed on 29 August 2018).
[165]
Tokyo Metropolitan Government (2016), Tokyo Environmental Master Plan,
http://www.kankyo.metro.tokyo.jp/en/about_us/videos_documents/master_plan.files/5497a24
cc603f33dbb96678fcf17135c.pdf (accessed on July 2018).
[53]
UNECE (2017), European countries implement new procedure improving measurement of
vehicle fuel consumption and emissions, https://www.unece.org/info/media/presscurrent-
press-h/transport/2017/european-countries-implement-new-procedure-improving-
measurement-of-vehicle-fuel-consumption-and-emissions/doc.html (accessed
on August 2018).
[81]
US EPA (2018), Enforcement Annual Results Analysis and Trends for Fiscal Year 2017,
https://www.epa.gov/enforcement/enforcement-annual-results-analysis-and-trends-fiscal-
year-2017 (accessed on 3 October 2018).
[118]
US EPA (2018), What are the Air Quality Standards for PM?,
https://www3.epa.gov/region1/airquality/pm-aq-standards.html (accessed on August 2018).
[155]
US EPA (n.d.), “Ozone Pollution”, https://www.epa.gov/ozone-pollution (accessed on
27 August 2018).
[4]
WHO (2006), WHO Air quality guidelines for particulate matter, ozone, nitrogen dioxide and
sulfur dioxide,
http://apps.who.int/iris/bitstream/handle/10665/69477/WHO_SDE_PHE_OEH_06.02_eng.pdf;
jsessionid=DFDA9BAE204770F4BA4490E3A309C33A?sequence=1 (accessed
on August 2018).
[46]

60 ENV/WKP(2020)3
Unclassified
WHO (2000), Air Quality Guidelines for Europe Second Edition, WHO regional publications,
http://www.euro.who.int/__data/assets/pdf_file/0005/74732/E71922.pdf?ua=1 (accessed
on August 2018).
[47]
Wiener, J. and D. Ribeiro (2016), “Impact Assessment: Diffusion and Integration”, in Bignami, F.
and D. Zaring (eds.), Comparative Law and Regulation, Elgar.
[23]
Wild, O. (2007), “Atmospheric Chemistry and Physics Modelling the global tropospheric ozone
budget: exploring the variability in current models”, Atmos. Chem. Phys, Vol. 7,
http://www.atmos-chem-phys.net/7/2643/2007/ (accessed on August 2018).
[10]
World Bank and IHME (2016), The Cost of Air Pollution Strengthening the Economic Case for
Action, The World Bank, Washington, DC,
http://documents.worldbank.org/curated/en/781521473177013155/pdf/108141-REVISED-
Cost-of-PollutionWebCORRECTEDfile.pdf (accessed on 8 October 2018).
[32]
Yang, Z. and A. Bandivadekar (2017), 2017 Global update: Light-duty vehicle greenhouse gas
and fuel economy standards, ICCT, http://www.theicct.org (accessed on 22 August 2018).
[79]
Yang, Z., R. Muncrief and A. Bandivadekaricct (2017), Global baseline assessment of
compliance and enforcement programs for vehicle emissions and energy efficiency, ICCT,
https://www.theicct.org/sites/default/files/publications/PV-C%26E-global-baseline-
assessment_ICCT-report_14112017_vF.pdf (accessed on July 2018).
[114]
Yashiro, N. (2016), “Regulatory Coherence: The Case of Japan”, http://www.eria.org/ERIA-DP-
2016-16.pdf (accessed on June 2018).
[29]