Embed Size (px)
Citation preview
POINT PLEASANT BOROUGH BOARD OF EDUCATION
A
Final Energy Audit Report
October 2009

15 British American Boulevard Latham, New York 12110 tel: 518-782-4500 fax: 518-786-3810
October 13, 2009 Mr. Steven Corso, CPA School Business Administrator 2100 Panther Path Point Pleasant, NJ 08742 Subject: Final Energy Audit Report for the Point Pleasant Borough Board of Education Dear Mr. Corso: Please find enclosed two full reports and seven reports without appendices detailing the findings and recommendations of CDM’s energy audit for the Point Pleasant Borough Board of Education. An electronic copy of this report has also been provided to TRC for their records. Very truly yours,
Matthew T. Goss, P.E., C.E.M., C.E.A., LEED®AP Project Manager CDM c: Theodore C. Schlette (CDM) Colleen Kling (TRC)
Enclosure
A i C:\Documents and Settings\fisherbl\Desktop\Table of Contents.doc
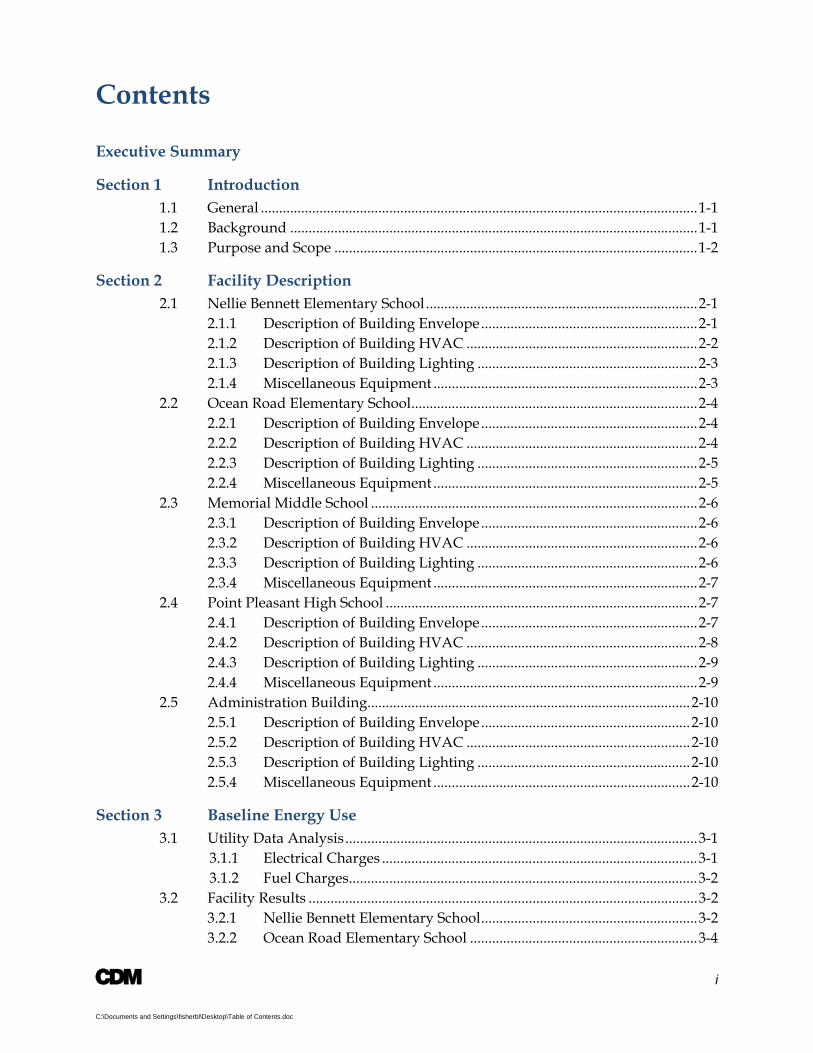
Contents
Executive Summary
Section 1 Introduction 1.1 General ....................................................................................................................... 1-1 1.2 Background ............................................................................................................... 1-1 1.3 Purpose and Scope ................................................................................................... 1-2
Section 2 Facility Description 2.1 Nellie Bennett Elementary School .......................................................................... 2-1 2.1.1 Description of Building Envelope ........................................................... 2-1 2.1.2 Description of Building HVAC ............................................................... 2-2 2.1.3 Description of Building Lighting ............................................................ 2-3 2.1.4 Miscellaneous Equipment ........................................................................ 2-3 2.2 Ocean Road Elementary School .............................................................................. 2-4 2.2.1 Description of Building Envelope ........................................................... 2-4 2.2.2 Description of Building HVAC ............................................................... 2-4 2.2.3 Description of Building Lighting ............................................................ 2-5 2.2.4 Miscellaneous Equipment ........................................................................ 2-5 2.3 Memorial Middle School ......................................................................................... 2-6 2.3.1 Description of Building Envelope ........................................................... 2-6 2.3.2 Description of Building HVAC ............................................................... 2-6 2.3.3 Description of Building Lighting ............................................................ 2-6 2.3.4 Miscellaneous Equipment ........................................................................ 2-7 2.4 Point Pleasant High School ..................................................................................... 2-7 2.4.1 Description of Building Envelope ........................................................... 2-7 2.4.2 Description of Building HVAC ............................................................... 2-8 2.4.3 Description of Building Lighting ............................................................ 2-9 2.4.4 Miscellaneous Equipment ........................................................................ 2-9 2.5 Administration Building........................................................................................ 2-10 2.5.1 Description of Building Envelope ......................................................... 2-10 2.5.2 Description of Building HVAC ............................................................. 2-10 2.5.3 Description of Building Lighting .......................................................... 2-10 2.5.4 Miscellaneous Equipment ...................................................................... 2-10
Section 3 Baseline Energy Use 3.1 Utility Data Analysis ................................................................................................ 3-1
3.1.1 Electrical Charges ...................................................................................... 3-1 3.1.2 Fuel Charges ............................................................................................... 3-2
3.2 Facility Results .......................................................................................................... 3-2 3.2.1 Nellie Bennett Elementary School ........................................................... 3-2 3.2.2 Ocean Road Elementary School .............................................................. 3-4
Table of Contents Point Pleasant Borough Board of Education
Final Energy Audit Report
A ii
3.2.3 Memorial Middle School .......................................................................... 3-7 3.2.4 Point Pleasant High School ...................................................................... 3-9 3.2.5 Administration Building ........................................................................ 3-11 3.3 Aggregate Costs ...................................................................................................... 3-13 3.4 Portfolio Manager ................................................................................................... 3-14 3.4.1 Portfolio Manager Overview ................................................................. 3-14 3.4.2 Energy Performance Rating ................................................................... 3-14 3.4.3 Portfolio Manager Account Information.............................................. 3-14
Section 4 Energy Conservation and Retrofit Measures (ECRM) 4.1 Building Lighting Systems ...................................................................................... 4-1
4.1.1 Nellie Bennett Elementary School ........................................................... 4-1 4.1.2 Ocean Road Elementary School .............................................................. 4-2 4.1.3 Memorial Middle School .......................................................................... 4-3 4.1.4 Point Pleasant High School ...................................................................... 4-5 4.1.5 Administration Building .......................................................................... 4-6
4.2 Building HVAC Systems ......................................................................................... 4-7 4.2.1 Nellie Bennett Elementary School ........................................................... 4-8 4.2.2 Ocean Road Elementary School ............................................................ 4-13 4.2.3 Memorial Middle School ........................................................................ 4-17 4.2.4 Point Pleasant High School .................................................................... 4-22 4.2.5 Administration Building ........................................................................ 4-27
4.3 Alternative Energy Sources ................................................................................... 4-30 4.3.1 Photovoltaic Solar Energy System - Overview ................................... 4-30 4.3.1.1 Nellie Bennett Elementary School ............................................. 4-31 4.3.1.2 Ocean Road Elementary School ................................................ 4-31 4.3.1.3 Memorial Middle School ............................................................ 4-32 4.3.1.4 Point Pleasant High School ........................................................ 4-32 4.3.1.5 Basis for Design and Calculations ............................................. 4-33 4.3.2 Ground Source Heat Pumps .................................................................. 4-35 4.3.3 On-Site Wind Power Generation ........................................................... 4-35
4.4 Next Steps – Additional Measures ....................................................................... 4-36
Section 5 Evaluation of Energy Purchasing and Procurement Strategies 5.1 Energy Deregulation ................................................................................................ 5-1 5.1.1 Alternate Third Party Energy Supplier .................................................. 5-2 5.2 Demand Response Program .................................................................................... 5-3
Table of Contents Point Pleasant Borough Board of Education
Final Energy Audit Report
A iii
Section 6 Ranking of Energy Conservation and Retrofit Measures (ECRMs) 6.1. ECRMs ...................................................................................................................... 6-1 6.1.1 Lighting Systems ....................................................................................... 6-1 6.1.2 HVAC Systems .......................................................................................... 6-2 6.1.3 Solar Energy ............................................................................................... 6-3 6.1.4 Miscellaneous Plug Load ......................................................................... 6-3
Section 7 Available Grants, Incentives and Funding Sources 7.1 Solar Energy Incentives and Financial Options .................................................... 7-1 7.1.1 Solar Renewable Energy Certificates ...................................................... 7-1 7.1.2 Financing Options for Solar Projects ...................................................... 7-1 7.2 New Jersey Clean Energy Program ......................................................................... 7-2 7.2.1 Introduction ............................................................................................... 7-2 7.2.2 New Jersey Smart Start Program ............................................................ 7-2 Appendix A Historical Data Analysis Appendix B Statement of Energy Performance Summary Sheets Appendix C eQuest Model Results Appendix D Lighting Spreadsheet Appendix E Solar Energy Financing Worksheet Appendix F Glacial Energy – Alternative Electrical Supplier Quote Appendix G New Jersey Smart Start Incentive Worksheets Appendix H Engineers Opinion of Probable Construction Costs Appendix I Facility Data Forms Appendix J Lifetime Savings Appendix K Maintenance Cost Savings
A ES-1
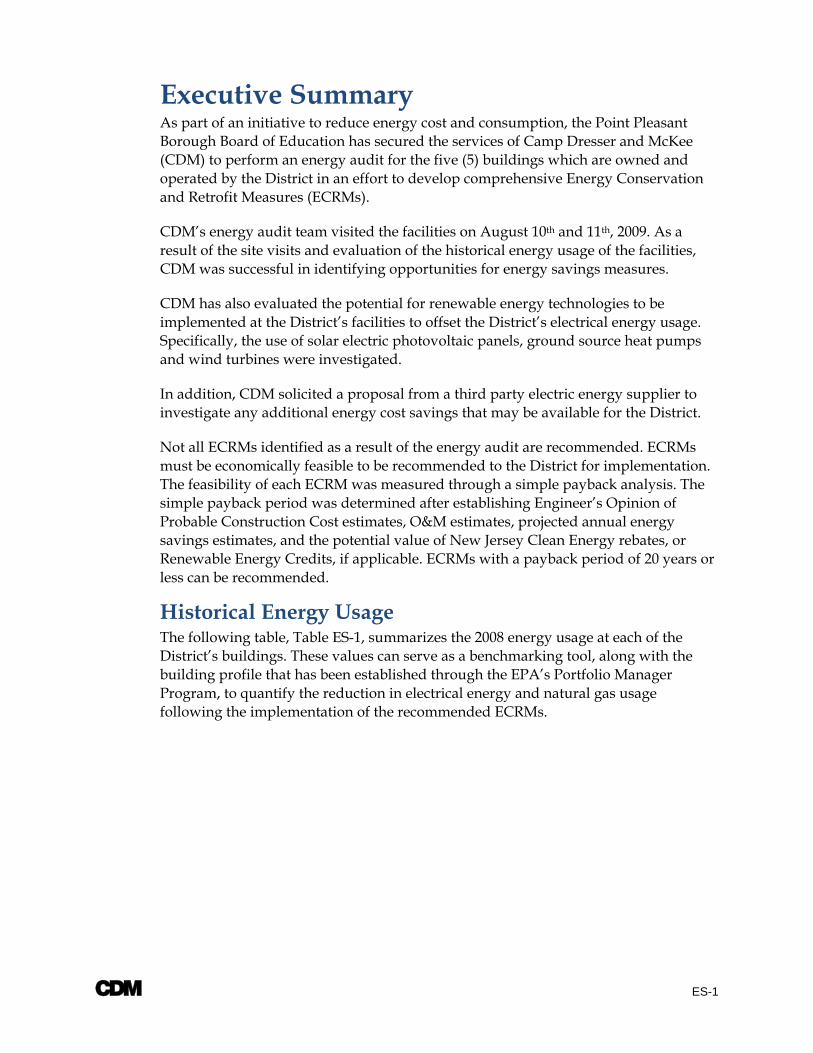
Executive Summary As part of an initiative to reduce energy cost and consumption, the Point Pleasant Borough Board of Education has secured the services of Camp Dresser and McKee (CDM) to perform an energy audit for the five (5) buildings which are owned and operated by the District in an effort to develop comprehensive Energy Conservation and Retrofit Measures (ECRMs).
CDM’s energy audit team visited the facilities on August 10th and 11th, 2009. As a result of the site visits and evaluation of the historical energy usage of the facilities, CDM was successful in identifying opportunities for energy savings measures.
CDM has also evaluated the potential for renewable energy technologies to be implemented at the District’s facilities to offset the District’s electrical energy usage. Specifically, the use of solar electric photovoltaic panels, ground source heat pumps and wind turbines were investigated.
In addition, CDM solicited a proposal from a third party electric energy supplier to investigate any additional energy cost savings that may be available for the District.
Not all ECRMs identified as a result of the energy audit are recommended. ECRMs must be economically feasible to be recommended to the District for implementation. The feasibility of each ECRM was measured through a simple payback analysis. The simple payback period was determined after establishing Engineer’s Opinion of Probable Construction Cost estimates, O&M estimates, projected annual energy savings estimates, and the potential value of New Jersey Clean Energy rebates, or Renewable Energy Credits, if applicable. ECRMs with a payback period of 20 years or less can be recommended.
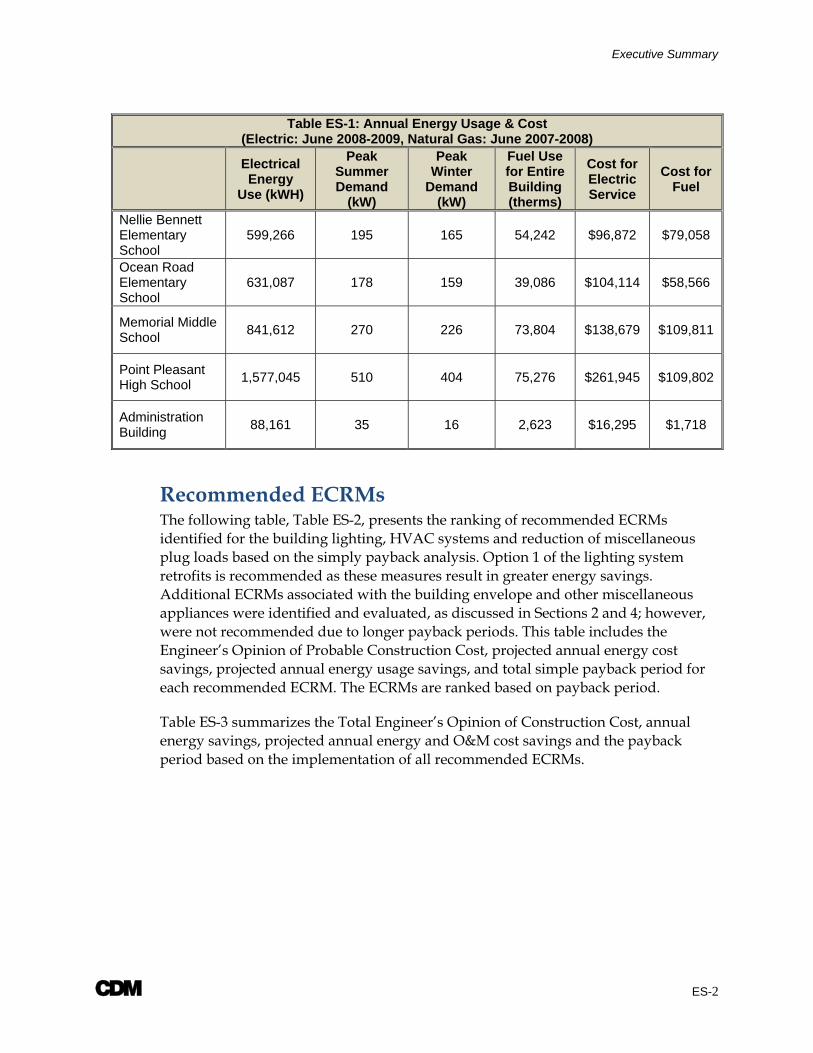
Historical Energy Usage The following table, Table ES-1, summarizes the 2008 energy usage at each of the District’s buildings. These values can serve as a benchmarking tool, along with the building profile that has been established through the EPA’s Portfolio Manager Program, to quantify the reduction in electrical energy and natural gas usage following the implementation of the recommended ECRMs.
Executive Summary
A ES-2
Table ES-1: Annual Energy Usage & Cost (Electric: June 2008-2009, Natural Gas: June 2007-2008)
Electrical Energy
Use (kWH)
Peak Summer Demand
(kW)
Peak Winter
Demand (kW)
Fuel Use for Entire Building (therms)
Cost for Electric Service
Cost for Fuel
Nellie Bennett Elementary School
599,266 195 165 54,242 $96,872 $79,058
Ocean Road Elementary School
631,087 178 159 39,086 $104,114 $58,566
Memorial Middle School 841,612 270 226 73,804 $138,679 $109,811
Point Pleasant High School 1,577,045 510 404 75,276 $261,945 $109,802
Administration Building 88,161 35 16 2,623 $16,295 $1,718
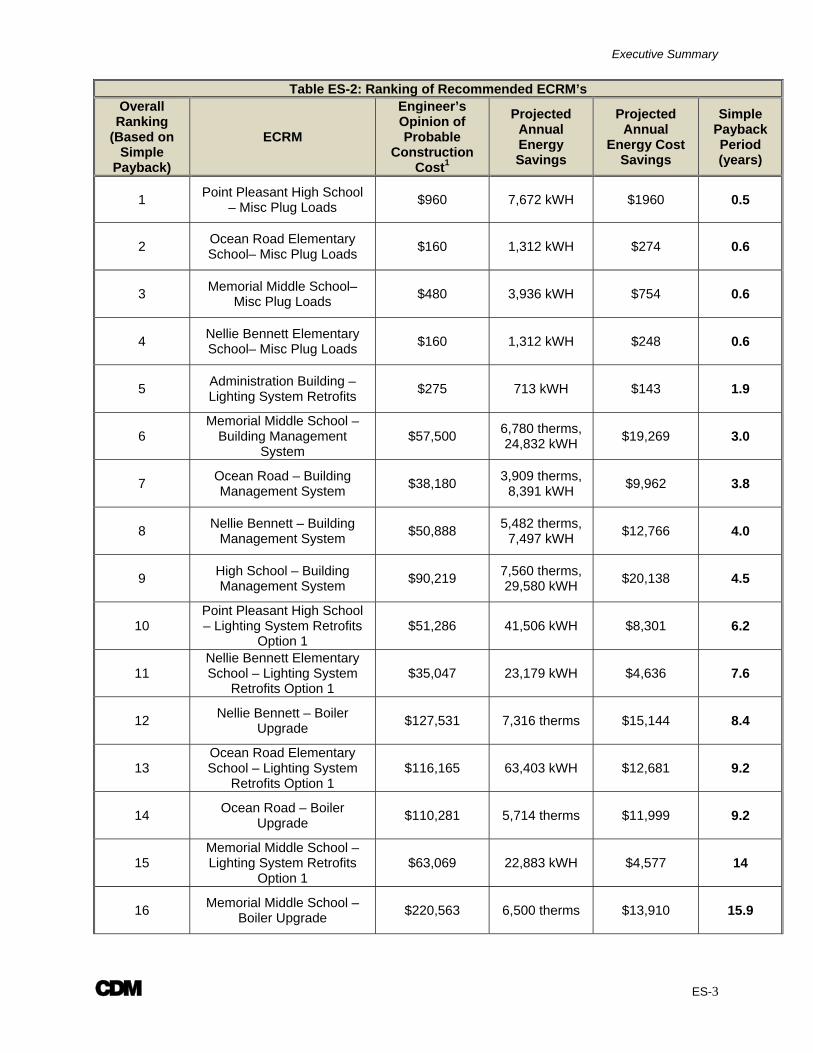
Recommended ECRMs The following table, Table ES-2, presents the ranking of recommended ECRMs identified for the building lighting, HVAC systems and reduction of miscellaneous plug loads based on the simply payback analysis. Option 1 of the lighting system retrofits is recommended as these measures result in greater energy savings. Additional ECRMs associated with the building envelope and other miscellaneous appliances were identified and evaluated, as discussed in Sections 2 and 4; however, were not recommended due to longer payback periods. This table includes the Engineer’s Opinion of Probable Construction Cost, projected annual energy cost savings, projected annual energy usage savings, and total simple payback period for each recommended ECRM. The ECRMs are ranked based on payback period.
Table ES-3 summarizes the Total Engineer’s Opinion of Construction Cost, annual energy savings, projected annual energy and O&M cost savings and the payback period based on the implementation of all recommended ECRMs.
Executive Summary
A ES-3
Table ES-2: Ranking of Recommended ECRM’s Overall
Ranking (Based on
Simple Payback)
ECRM
Engineer’s Opinion of Probable
Construction Cost1
Projected Annual Energy Savings
Projected Annual
Energy Cost Savings
Simple Payback Period (years)
1 Point Pleasant High School – Misc Plug Loads $960 7,672 kWH $1960 0.5
2 Ocean Road Elementary School– Misc Plug Loads $160 1,312 kWH $274 0.6
3 Memorial Middle School– Misc Plug Loads $480 3,936 kWH $754 0.6
4 Nellie Bennett Elementary School– Misc Plug Loads $160 1,312 kWH $248 0.6
5 Administration Building – Lighting System Retrofits $275 713 kWH $143 1.9
6 Memorial Middle School –
Building Management System
$57,500 6,780 therms, 24,832 kWH $19,269 3.0
7 Ocean Road – Building Management System $38,180 3,909 therms,
8,391 kWH $9,962 3.8
8 Nellie Bennett – Building Management System $50,888 5,482 therms,
7,497 kWH $12,766 4.0
9 High School – Building Management System $90,219 7,560 therms,
29,580 kWH $20,138 4.5
10 Point Pleasant High School – Lighting System Retrofits
Option 1 $51,286 41,506 kWH $8,301 6.2
11 Nellie Bennett Elementary School – Lighting System
Retrofits Option 1 $35,047 23,179 kWH $4,636 7.6
12 Nellie Bennett – Boiler Upgrade $127,531 7,316 therms $15,144 8.4
13 Ocean Road Elementary School – Lighting System
Retrofits Option 1 $116,165 63,403 kWH $12,681 9.2
14 Ocean Road – Boiler Upgrade $110,281 5,714 therms $11,999 9.2
15 Memorial Middle School – Lighting System Retrofits
Option 1 $63,069 22,883 kWH $4,577 14
16 Memorial Middle School – Boiler Upgrade $220,563 6,500 therms $13,910 15.9

Executive Summary
A ES-4
17 High School – Boiler Upgrade $275,704 8,400 therms $14,196 19.4
1. Engineers Probable Construction takes into account any applicable rebates.
Table ES-3: Recommended ECRM’s1
Total Engineer’s Opinion of Probable Construction Cost
Projected Annual Energy Savings (kWH or therms)
Projected Annual Energy Cost
Savings
Simple Payback Period (years)
$1,238,218 236,216 kWH and 48,291 therms $143,946 8.7
1. Does not include energy savings associated with Solar Energy System.
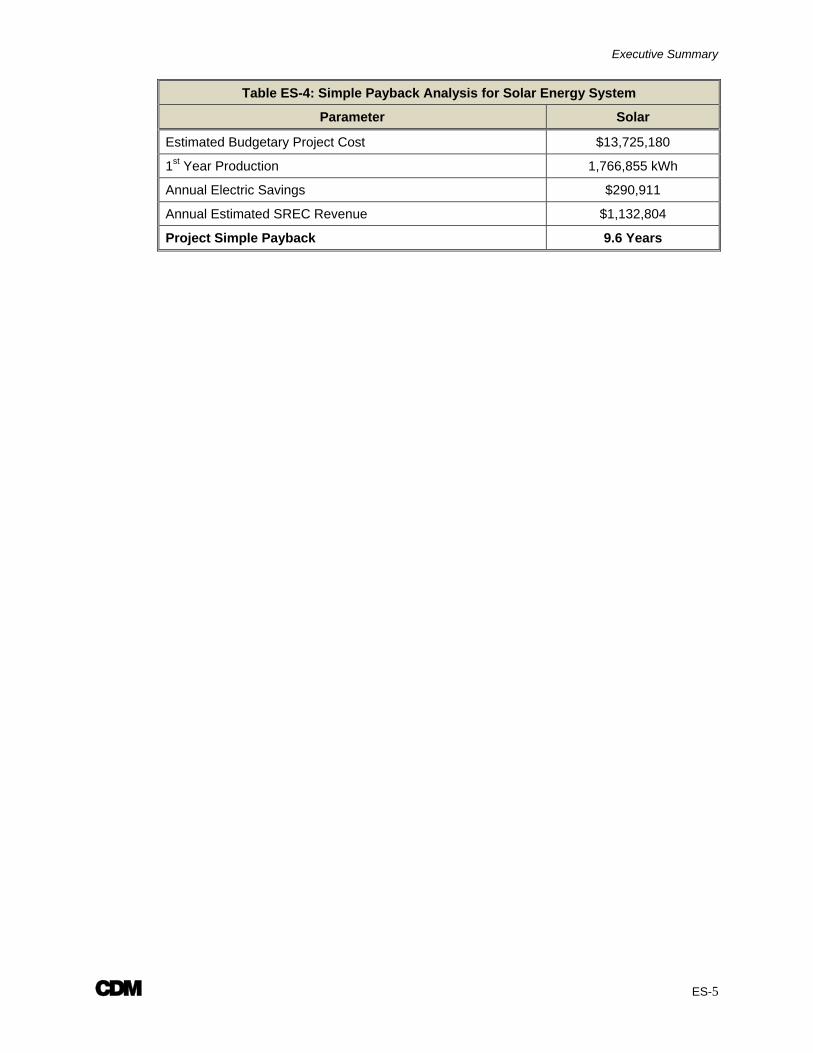
Renewable Energy Technologies Solar Energy Section 4.3 of the report provides for an economic evaluation of a solar energy system recommended to be installed at the four school buildings. The evaluation covered the economic feasibility of the District furnishing and installing a solar energy system under a typical construction contract and to assume full responsibility of the operation of such a system.
Based on the simple payback model, summarized in Table ES-4, it would benefit the District to further investigate the installation of a solar energy system. This is primarily based on the initial upfront capital investment required for a solar energy system installation and the 9.6 year payback period. This payback period justifies installing the solar energy system. Other options such as Power Purchase Agreements are potentially available as well to help finance the project. Solar technology is constantly changing and will most likely continue to lower in price.
Two major factors influencing the project financial evaluation is the variance of the prevailing energy market conditions and Solar Renewable Energy Credit (SREC) rates, with the largest impact to the payback model being the SREC credit pricing. For the payback model, conservative estimates of the SREC’s market value over a 15 year period were assumed, as discussed in Section 4.3.
Table ES-4 includes a simple payback analysis for the installation of a solar energy system the high school. Refer to Appendix E for a more detailed solar financing spreadsheet.
Executive Summary
A ES-5
Table ES-4: Simple Payback Analysis for Solar Energy System
Parameter Solar
Estimated Budgetary Project Cost $13,725,180
1st Year Production 1,766,855 kWh
Annual Electric Savings $290,911
Annual Estimated SREC Revenue $1,132,804
Project Simple Payback 9.6 Years
A 1-1
Section 1 Introduction 1.1 General As part of an initiative to reduce energy cost and consumption, the Point Pleasant Borough Board of Education has secured the services of Camp Dresser and McKee (CDM) to perform an energy audit at five (5) of the District’s buildings in an effort to develop comprehensive energy conservation initiatives.
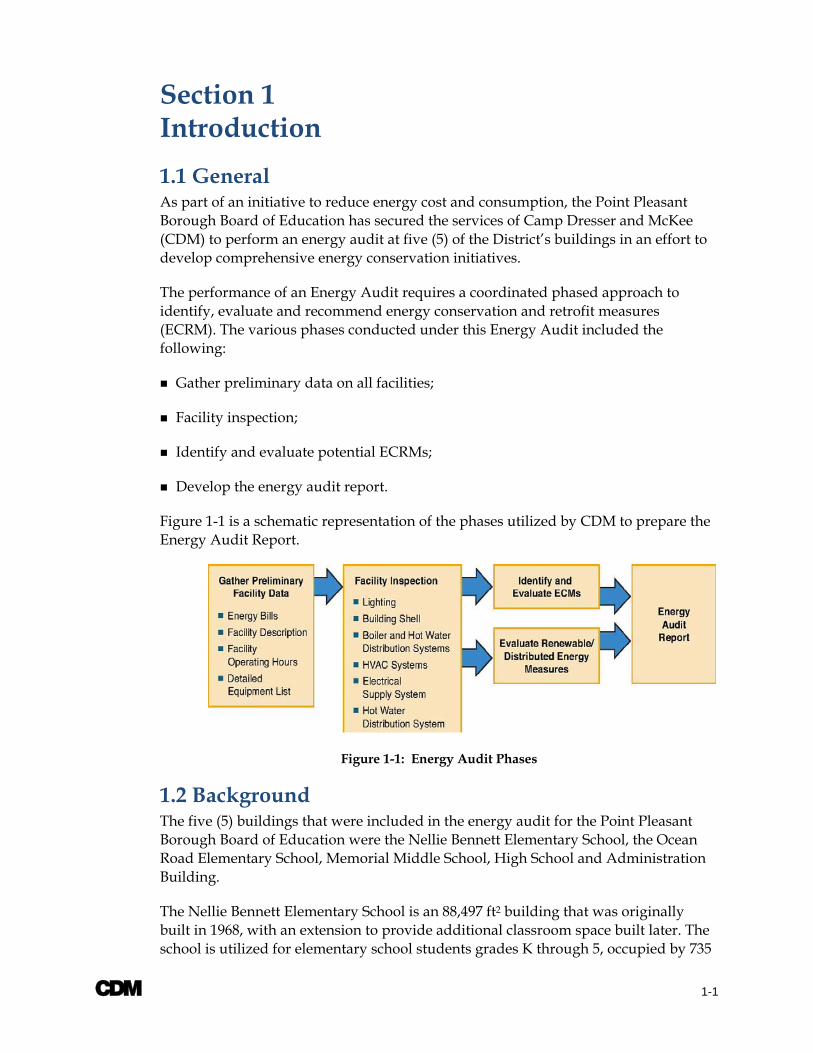
The performance of an Energy Audit requires a coordinated phased approach to identify, evaluate and recommend energy conservation and retrofit measures (ECRM). The various phases conducted under this Energy Audit included the following:
Gather preliminary data on all facilities;
Facility inspection;
Identify and evaluate potential ECRMs;
Develop the energy audit report.
Figure 1-1 is a schematic representation of the phases utilized by CDM to prepare the Energy Audit Report.
Figure 1-1: Energy Audit Phases
1.2 Background The five (5) buildings that were included in the energy audit for the Point Pleasant Borough Board of Education were the Nellie Bennett Elementary School, the Ocean Road Elementary School, Memorial Middle School, High School and Administration Building.
The Nellie Bennett Elementary School is an 88,497 ft2 building that was originally built in 1968, with an extension to provide additional classroom space built later. The school is utilized for elementary school students grades K through 5, occupied by 735
Section 1 Introduction
A 1-2
students and 70 faculty members. The school is occupied from 6:30 am to approximately 7 pm during the week, is open on the weekends and during the summer for summer school classes and camps.
The Ocean Road Elementary School is a 66,406 ft2 building that was originally built in 1991, with an extension to provide additional classroom space built in 2000. The school utilized for elementary school students grades K through 5, occupied by 562 students and 102 faculty members. The school is occupied from 6:30 am to approximately 7 pm during the week, is open on the weekends and during the summer for summer school classes and camps.
The Memorial Middle School is a 100,002 ft2 building that was originally built around 1960, with the second floor extension built in 2000. The school is utilized for middle school students’ grades 6 through 8, occupied by 734 students and 91faculty members. The school is occupied from 6:30 am to approximately 7 pm during the week, is open on the weekends and during the summer for summer school classes and camps.
The High School is a 156,902 ft2 building that was originally built around 1960, with the second floor extension built in 2000. The school is utilized for grades 9 through 12, occupied by 1016 students and 129 faculty members. The school is occupied from 6:30 am to approximately 7 pm during the week, is open on the weekends and during the summer for summer school classes and camps.
The Administration building is a 9,934 ft2 building that was originally built around 1980. The building is utilized for administration staff and is occupied from 6:30 am to approximately 7 pm during the week, is open on the weekends and during the summer.
1.3 Purpose and Scope The objective of the energy audit is to identify energy conservation and retrofit measures to reduce energy usage and to develop an economic basis to financially validate the planning and implementation of identified energy conservation and retrofit measures.
The buildings were originally designed to comfortably house students and staff with limited consideration for energy consumption. Currently, due to the rising costs of power and the desire to minimize dependence on foreign oil supplies, energy consumption is taking a higher priority across the nation. Significant energy savings may be available with retrofits to the buildings’ envelopes, heating, cooling systems and lighting systems. It should be noted that the magnitude of energy savings available is not only dependent on the type of heating, lighting or insulation systems that are in use, but also on the age and condition of the equipment and the capital available to implement major changes.
Section 1 Introduction
A 1-3
The purpose of this energy audit is to identify the various critical building comfort systems within the buildings that are major consumers of electrical energy and are clear candidates for energy savings measures. In addition, the potential for alternative energy systems to be installed at each building was evaluated and presented herein.
In addition to identifying ECRMs and the potential for on-site energy generation, an alternate third party electric supplier was contacted in an effort to identify further cost savings available for the District, by switching service providers. This is discussed further in Section 5.
A 2-1
Section 2 Facility Description
2.1 Nellie Bennett Elementary School 2.1.1 Description of Building Envelope The energy audit included an evaluation of the building’s envelope (exterior shell) to determine the components’ effective R-values to be utilized in the building model and to locate and fix any thermal weaknesses that may be present. The components of a building envelope include the exterior walls, foundation and roof. The construction and material, age and general condition of these components, including exterior windows and doors, impact the building’s energy use.
The elementary school’s walls are composite cavity walls consisting of brick facade, cavity and concrete masonry CMU back-up blocks. The existing roofing system through the majority of the building consists of insulation and asphalt roofing over flat roof decks. The portion of the roof over the All-Purpose room is EPDM membrane over flat roof deck. The asphalt roof is original to the building, long exceeding the roof lifetime of 15 to 20 years. Asphalt roofs are very common, low-tech, waterproofing system for flat roofs; however, they are known to crack. At the time of the audit, during a hot summer day, there was minimal evidence of water pooling, gaps at the flashing at the edge of the roofs or interior evidence of leakage. However, it is recommended that a qualified roofing contractor evaluate the system, including the structural capacity of the building frame and repair or replace the existing asphalt roof system with an EPDM membrane roofing system. A roof replacement may cost $20 per square foot; therefore, the system analysis including the structural integrity of the building may warrant the application of an elastomeric waterproof roof coating system to rectify any leaks and improve the level of insulation that the current roof is providing.
It is also recommended that a white thermal barrier coating be considered. This coating works to reduce the surface temperature of the roof by reflecting the UV rays, and provides insulation for the interior of the building reducing the heating and cooling loads.
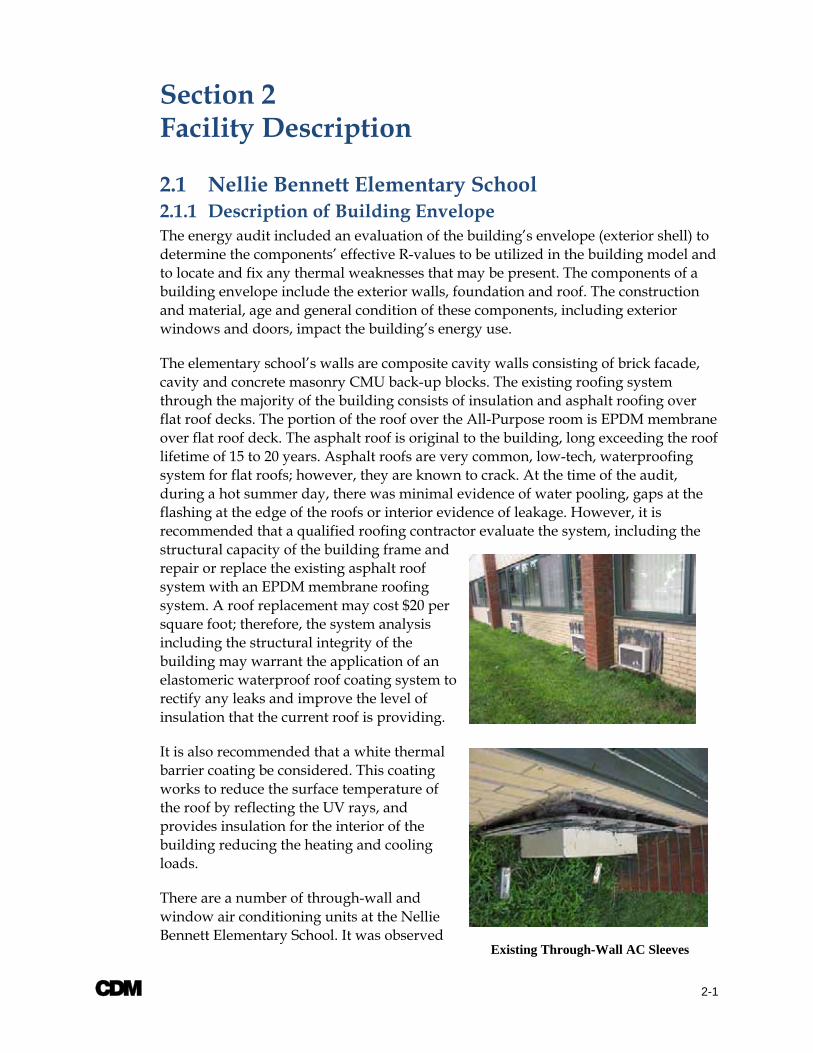
There are a number of through-wall and window air conditioning units at the Nellie Bennett Elementary School. It was observed
Existing Through-Wall AC Sleeves

Section 2 Facility Description
2-2
that the through wall AC sleeves are deteriorating, allowing for infiltration of ambient air. It is recommended that the air conditioning sleeves be replaced and if the AC units are left in place through the winter that AC covers be purchased and installed. An outdoor AC cover covers the top and sides of the unit to stop drafts. Window and through-wall AC covers are UV resistant, water repellent PVC vinyl with elasticized corners and straps for a tight fit. Outdoor or indoor AC covers can also be customized to meet the District’s needs. A standard outdoor AC cover can cost around $15. The replacement of the wooden AC sleeves will be more labor and material intensive, and the impact on the overall building heating load will be minimal. However, there will be a direct impact on the occupants comfort.
The windows throughout the building are insulating double paned windows. The exterior doors throughout the elementary school are FRP doors. FRP doors are recommended on an energy efficiency level, as the doors are made out of a high strength, light weight material with energy saving insulation and good sealing ability, as the doors will not expand or contract with changing climate. The windows and exterior doors were sealed well with no signs of infiltration.
2.1.2 Description of Building HVAC Heating in the Nellie Bennett Elementary School is mainly provided by two (2) firetube Superior Boilers (installed 1968), each capable of providing approximately 3,360 MBH of heat to the building hot water system. Additionally, there is a second level boiler room near the gym, which houses three (3) A.O. Smith boilers. Two of these boilers are estimated to have a capacity of approximately 1,000 MBH, and the third is estimated at 500 MBH. The A.O. Smith boilers were installed in 1999.
The building hot water system provides heat to unit ventilators and fin-tube radiators located within each classroom.
Cooling is provided to the All-Purpose room, child study rooms, computer room, and various administration offices. Where cooling is provided, it is done so with the use of roof top units, which incorporate DX coils. These units also utilize hot water coils, served by the aforementioned building hot water system, for heating.
Superior Boiler – Jacket
Example of an Outdoor AC Cover
Section 2 Facility Description
2-3
Domestic hot water is provided by a 120 MBH, natural gas-fired unit with 71 gallons of storage.
2.1.3 Description of Building Lighting The Nellie Bennett Elementary School’s existing lighting system consists of 2X2 (2 lamp), 1X4 (1, 2, 3, and 4 lamp), 2X4 (2, 3, and 4 lamp) linear fluorescent fixtures with electronic ballasts, along with compact fluorescent, metal halide, high pressure sodium, and incandescent fixtures. The school has already converted a majority of the building lighting to energy efficient T8 lamps, with electronic ballasts. The existing incandescent fixtures should be retrofitted with compact fluorescent bulbs, sized to match existing light output of the fixtures. The school utilizes metal halide HID lighting in its gymnasiums, and other athletic areas, and it is recommended that the metal halide HID fixtures be replaced with T8 linear fluorescent high bay fixtures for an increase in quality of light, light output, and significant decrease in energy consumption. In addition, inactive storage and maintenance areas were identified during the audit where the installation of occupancy sensors would increase overall energy savings. As an additional energy conservation measure, two options are provided for the replacement of the parking lot and exterior lighting fixtures. The first options is to replace the fixtures with energy efficient LED fixtures, the second is to not change the fixtures. Changing all the exterior lighting fixtures to LED will result in an addition annual savings of $1,095.
2.1.4 Miscellaneous Equipment On average, each classroom contains at least one (1) computer, TV and overhead projector. In addition, the school also has a computer classroom and library which contain 25 to 30 computers each. It is recommended that the District consider implementing the standardized use of Smart Strips, as the need arises. Computer peripherals, such as monitors, printers or scanners, continue to use energy even after they are shut off, which adds up over time. The Smart Strip power strips offer surge protection and the ability to monitor the current on a single ‘control’ outlet. When the computer that is plugged into that single outlet is shut down and Smart Strip shuts off all of the other peripherals on the power strip. This is discussed further in Section 4.4.
The school also has office areas and a nurse’s office that contain copiers, microwaves, refrigerators, vending machines, soda machines and coffee makers.
The Nellie Bennett Elementary School’s kitchen has a number of appliances including convection ovens, refrigerators, an ice maker, electric warming tables and cabinets. There is also a walk-in refrigerator in the courtyard. It is also recommended that the District consider implementing the standardized use of Energy Star appliances, as the need arises. Energy Star refrigerators and freezers, for example, use up to 40% less energy than models built in 2001. Energy Star appliances will not only reduce the District’s utility bills, but will also outperform standard appliances, due to the improved design and advanced technologies.
Section 2 Facility Description
2-4
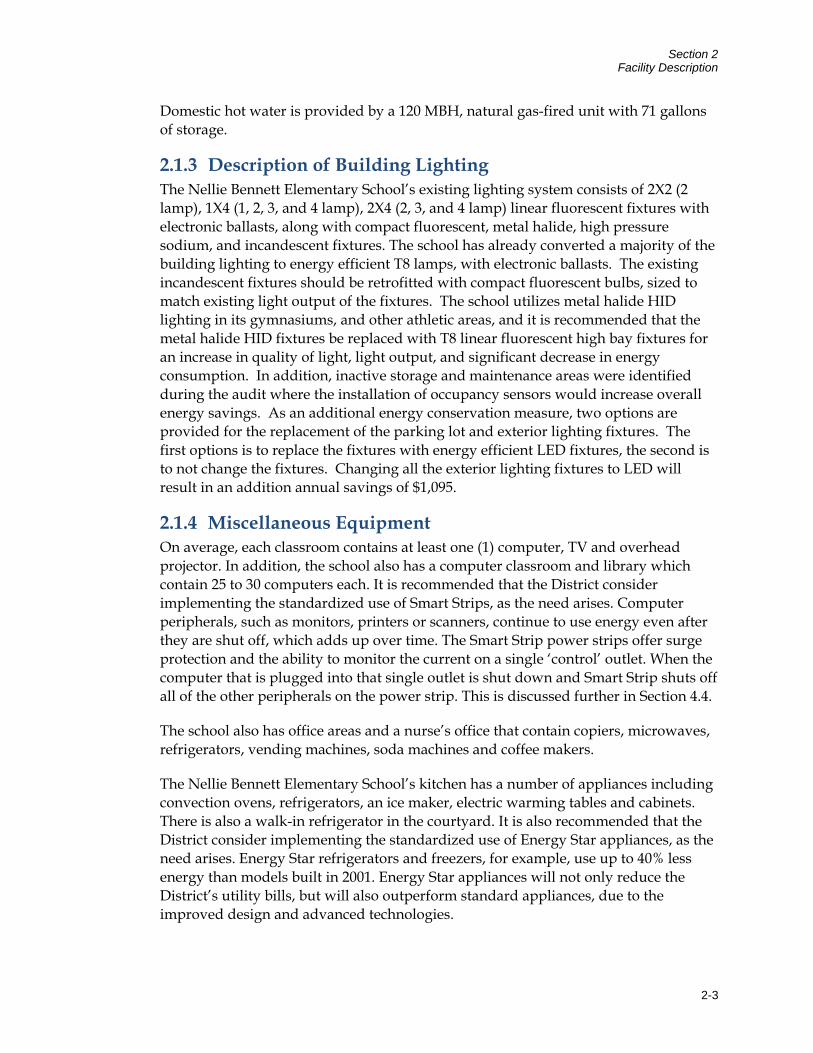
2.2 Ocean Road Elementary School 2.2.1 Description of Building Envelope The elementary school’s walls are composite cavity walls consisting of brick facade, cavity and concrete masonry CMU back-up blocks. The existing roofing system of the building consists of insulation and EPDM membrane overlaid with gravel over flat roof decks. There were no signs of interior leakage from the roof. However, it was observed that the condensate from one of the Aaon units above the Cafeteria was dripping and pooling on the roof, not draining properly.
It is recommended that the condensate drain line be extended to the roof drain next to the adjacent Aaon unit. As any water pooling on the roof could migrate to leaks that will compromise the insulating value of the roof system. The windows throughout the building are insulating double
paned windows. The exterior doors throughout the elementary school are FRP doors. The windows and exterior doors were sealed well with no signs of infiltration.
It was determined that the building envelope is in good condition and is currently providing a high level of insulation. As such, any modifications to the insulation system would not proof to be cost effective, from an energy savings stand-point.
2.2.2 Description of Building HVAC The Ocean Road Elementary School houses two Cleaver Brooks boilers, each capable of delivering 2,929 MBH of heat to the building hot water system. These boilers were installed during the original building construction in 1991. The building hot water system serves individual classroom unit ventilators and fin-tube radiators, as well as hot water coils in air handling and rooftop units.
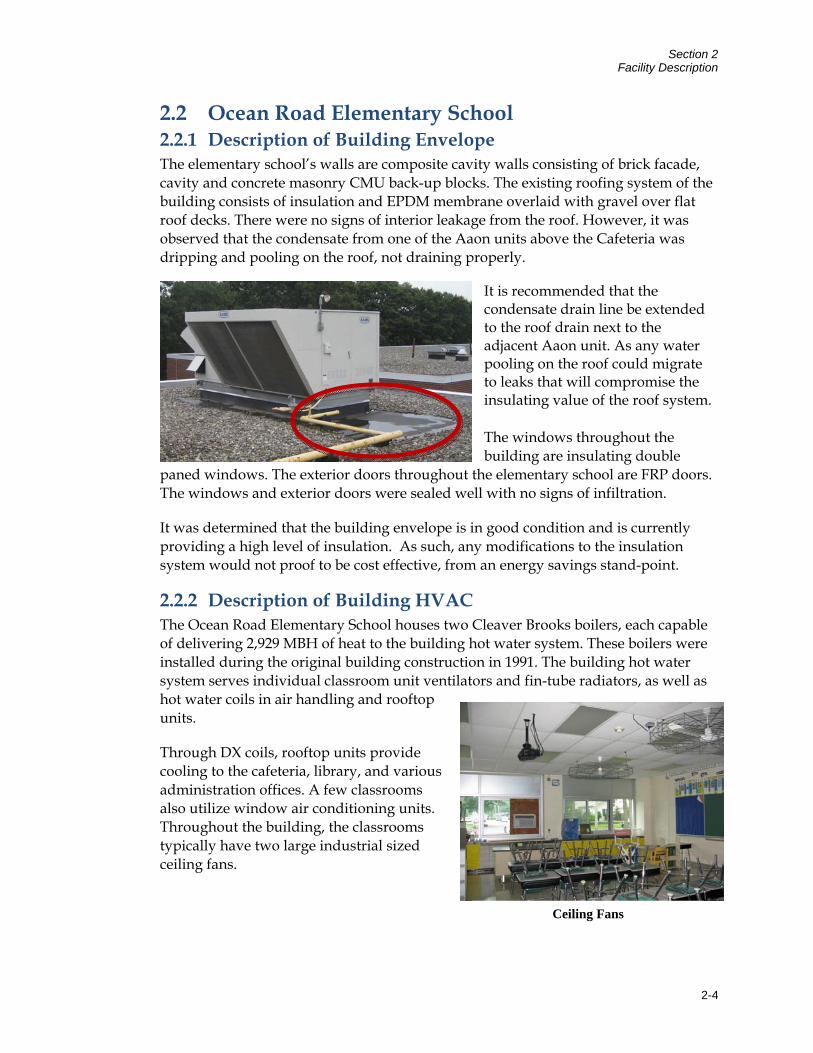
Through DX coils, rooftop units provide cooling to the cafeteria, library, and various administration offices. A few classrooms also utilize window air conditioning units. Throughout the building, the classrooms typically have two large industrial sized ceiling fans.
Ceiling Fans

Section 2 Facility Description
2-5
2.2.3 Description of Building Lighting The Ocean Road Elementary School’s existing lighting system consists of 2X2 (2 lamp), 1X4 (1, 2, 3, and 4 lamp), 2X4 (2, 3, and 4 lamp) linear fluorescent fixtures with electronic ballasts, along with compact fluorescent, metal halide, high pressure sodium, and incandescent fixtures. The school has already converted a majority of the building lighting to energy efficient T8 lamps, with electronic ballasts. The existing incandescent fixtures should be retrofitted with compact fluorescent bulbs, sized to match existing light output of the fixtures. The school utilizes metal halide HID lighting in its gymnasiums, and other athletic areas, and it is recommended that the metal halide HID fixtures be replaced with T8 linear fluorescent high bay fixtures for an increase in quality of light, light output, and significant decrease in energy consumption. In addition, inactive storage and maintenance areas were identified during the audit where the installation of occupancy sensors would increase overall energy savings. As an additional energy conservation measure, two options are provided for the replacement of the parking lot and exterior lighting fixtures. The first options is to replace the fixtures with energy efficient LED fixtures, the second is to not change the fixtures. Changing all the exterior lighting fixtures to LED will result in an addition annual savings of $3,282.
2.2.4 Miscellaneous Equipment On average, each classroom contains at least one (1) computer, TV and overhead projector. In addition, the school also has a computer classroom and library which contain 10 to 30 computers each. It is recommended that the District consider implementing the standardized use of Smart Strips, as the need arises. Computer peripherals, such as monitors, printers or scanners, continue to use energy even after they are shut off, which adds up over time. The Smart Strip power strips offer surge protection and the ability to monitor the current on a single ‘control’ outlet. When the computer that is plugged into that single outlet is shut down and Smart Strip shuts off all of the other peripherals on the power strip. This is discussed further in Section 4.4.
The school also has office areas and a nurse’s office that contain copiers, microwaves, refrigerators, vending machines, soda machines and coffee makers.
The Ocean Road Elementary School’s kitchen has a number of appliances including ovens and stovetop, refrigerators, freezers, an ice maker, and electric warming tables and cabinets. It is also recommended that the District consider implementing the standardized use of Energy Star appliances, as the need arises. Energy Star refrigerators and freezers, for example, use up to 40% less energy than models built in 2001. Energy Star appliances will not only reduce the District’s utility bills, but will also outperform standard appliances, due to the improved design and advanced technologies.
Section 2 Facility Description
2-6
2.3 Memorial Middle School 2.3.1 Description of Building Envelope The majority of the middle school’s walls are composite cavity walls consisting of brick facade, cavity and concrete masonry CMU back-up blocks. The walls in the original section of the building consisted of 12” brick, in lieu of CMU blocks. The existing roofing system of the building consists of insulation and asphalt over flat roof decks. Similarly to the Nellie Bennett School, at the time of the audit, during a hot summer day, there was minimal evidence of water pooling, gaps at the flashing at the edge of the roofs or interior evidence of leakage. However, as the roof is original to the building and well beyond the recommended lifetime of 15- 20 years, it is recommended that a qualified roofing contractor evaluate the system, including the structural capacity of the building frame and repair or replace the existing asphalt roof system with an EPDM membrane roofing system or a waterproof roof coating system, as discussed previously.
The windows throughout the building are insulating double paned windows. The exterior doors throughout the middle school are FRP doors.
In general, the building envelope is in good condition and is currently providing a high level of insulation. Repair or replacement of the asphalt roof, will improve the insulating value of the existing system; however, will not result in a 20 year or less payback period.
2.3.2 Description of Building HVAC The Memorial Middle School houses four (4) operable boilers. Two (2) Cleaver Brooks boilers, installed in 1972, are capable of delivering 3,347 MBH of heat, each, to the building hot water system. Two (2) cast iron H.B. Smith boilers, each capable of delivering 1,137 MBH of heat, are also tied into the building hot water system which then serves individual classroom unit ventilators and fin-tube radiators. Several rooftop units also utilize hot water coils served by this system.
Cooling is primarily provided by rooftop units incorporating DX coils. Cooling from rooftop units is provided to the cafeteria, kitchen, teacher’s room, music room, library, guidance, and administration offices.
Domestic hot water is provided by two hot water heaters. One heater is a natural gas-fired A.O. Smith model capable of providing 365 MBH of heat and storing 85 gallons of water. The other heater is an electric A.O. Smith model capable of providing 9 kW of heat, and storing 50 gallons of hot water.
2.3.3 Description of Building Lighting The Memorial Middle School’s existing lighting system consists of 2X2 (2 lamp), 1X4 (1, 2, 3, and 4 lamp), 2X4 (2, 3, and 4 lamp) linear fluorescent fixtures with electronic ballasts, along with compact fluorescent, metal halide, high pressure sodium, and incandescent fixtures. The school has already converted a majority of the building
Section 2 Facility Description
2-7
lighting to energy efficient T8 lamps, with electronic ballasts. The existing incandescent fixtures should be retrofitted with compact fluorescent bulbs, sized to match existing light output of the fixtures. The school utilizes metal halide HID lighting in its gymnasiums, and other athletic areas, and it is recommended that the metal halide HID fixtures be replaced with T8 linear fluorescent high bay fixtures for an increase in quality of light, light output, and significant decrease in energy consumption. In addition, inactive storage and maintenance areas were identified during the audit where the installation of occupancy sensors would increase overall energy savings. As an additional energy conservation measure, two options are provided for the replacement of the parking lot and exterior lighting fixtures. The first options is to replace the fixtures with energy efficient LED fixtures, the second is to not change the fixtures. Changing all the exterior lighting fixtures to LED will result in an addition annual savings of $1,866.
2.3.4 Miscellaneous Equipment On average, each classroom contains at least one (1) computer, TV and overhead projector. In addition, the school also has a number of computer classrooms and a library which contain 12 to 34 computers each. It is recommended that the District consider implementing the standardized use of Smart Strips, as the need arises. Computer peripherals, such as monitors, printers or scanners, continue to use energy even after they are shut off, which adds up over time. The Smart Strip power strips offer surge protection and the ability to monitor the current on a single ‘control’ outlet. When the computer that is plugged into that single outlet is shut down and Smart Strip shuts off all of the other peripherals on the power strip. This is discussed further in Section 4.4.
The school also has office areas and a nurse’s office that contain copiers, microwaves, refrigerators, vending machines, soda machines and coffee makers.
The Memorial Middle School’s kitchen has a number of appliances including ovens, refrigerators, freezers, and electric warming tables and cabinets. It is also recommended that the District consider implementing the standardized use of Energy Star appliances, as the need arises. Energy Star refrigerators and freezers, for example, use up to 40% less energy than models built in 2001. Energy Star appliances will not only reduce the District’s utility bills, but will also outperform standard appliances, due to the improved design and advanced technologies.
2.4 High School 2.4.1 Description of Building Envelope The high school’s walls are composite cavity walls consisting of brick facade, cavity and concrete masonry CMU back-up blocks. The existing roofing system of the building consists of insulation and EPDM membrane over flat roof decks. CDM was advised that the roof seals have been repaired recently. At the time of the walk through, there were no signs of interior leakage from the roof.

Section 2 Facility Description
2-8
The windows throughout the building are insulating double paned windows. The exterior doors throughout the high school are FRP doors. It was observed that the weather-stripping on a few of the exterior doors needs to be replaced, as shown in the adjacent picture. The overall impact on the buildings heating and cooling loads of ensuring that the exterior doors and windows are sealed against ambient air is minor; however, evident to the building’s occupant comfort and can be maintained by building staff.
The health classroom has a large south facing translucent window, with a necessary shade drawn at all times to minimize heating of the conditioned space. It is recommended that consideration be given to planting trees here and within the interior courtyard to provide natural shading. Not only will the trees help by blocking direct sunlight, but water evaporating from trees helps cool the surrounding air. Planting trees to shade the south and southwest sides of the building will work to cut the buildings cooling loads. It is recommended that planting trees in the courtyards of each of the District’s schools be considered. Deciduous trees, which lose leaves in autumn, may be preferable, as the leafless trees will let the sunlight in during the winter to help warm the building and provide natural shade during the summer to minimize heat gain. If a solar energy system is installed, the height of the trees will be an important factor.
It was determined that the building envelope is in good condition and is currently providing a high level of insulation. As such, any modifications to the insulation system would not proof to be cost effective, from an energy savings stand-point.
2.4.2 Description of Building HVAC The High School utilizes a building hot water system, served by several boilers. Two (2) firetube Superior boilers, installed in 1962, each provide an estimated 6,695 MBH of heating to the hot water system. Additionally, two (2) cast iron H.B. Smith boilers each provide approximately 1,154 MBH of heat to the hot water system. The hot water system serves individual unit ventilators and fin-tube radiators within every classroom, as well as hot water coils in several rooftop and air handling units.
Cooling is provided by rooftop units, which utilize DX coils. Areas cooled by rooftop units include the band, music & performing arts rooms, auditorium, library, art rooms, health room, auxiliary gym, nurse’s office, trainer’s office, guidance and administration offices, as well as several classrooms. During the audit, facility personnel noted that some of these units operate 24 hours a day to cool their respective spaces, as heat from neighboring spaces tends to infiltrate in, necessitating additional cooling.
Gap at Exterior Door
Section 2 Facility Description
2-9
Two domestic water heaters were identified during the visit. One gas-fired Laars unit, residing in the boiler room housing the Superior boilers, is capable of delivering 468 MBH to the domestic hot water system. Another electric A.O. Smith unit, residing in the H.B. Smith boiler room, is capable of delivering 9kW of heat and storing 80 gallons of hot water.
2.4.3 Description of Building Lighting The Point Pleasant High School’s existing lighting system consists of 2X2 (2 lamp), 1X4 (1, 2, 3, and 4 lamp), 2X4 (2, 3, and 4 lamp) linear fluorescent fixtures with electronic ballasts, along with compact fluorescent, metal halide, high pressure sodium, and incandescent fixtures. The school has already converted a majority of the building lighting to energy efficient T8 lamps, with electronic ballasts. The existing incandescent fixtures should be retrofitted with compact fluorescent bulbs, sized to match existing light output of the fixtures. The school utilizes metal halide HID lighting in its gymnasiums, and other athletic areas, and it is recommended that the metal halide HID fixtures be replaced with T8 linear fluorescent high bay fixtures for an increase in quality of light, light output, and significant decrease in energy consumption. In addition, inactive storage and maintenance areas were identified during the audit where the installation of occupancy sensors would increase overall energy savings. As an additional energy conservation measure, two options are provided for the replacement of the parking lot and exterior lighting fixtures. The first options is to replace the fixtures with energy efficient LED fixtures, the second is to not change the fixtures. Changing all the exterior lighting fixtures to LED will result in an addition annual savings of $938.
2.4.4 Miscellaneous Equipment On average, each classroom contains at least one (1) computer, TV and overhead projector. In addition, the school also has a number of computer classrooms and a library which contain 25 to 30 computers each. It is recommended that the District consider implementing the standardized use of Smart Strips, as the need arises. Computer peripherals, such as monitors, printers or scanners, continue to use energy even after they are shut off, which adds up over time. The Smart Strip power strips offer surge protection and the ability to monitor the current on a single ‘control’ outlet. When the computer that is plugged into that single outlet is shut down and Smart Strip shuts off all of the other peripherals on the power strip. This is discussed further in Section 4.4.
The school also has office areas, a home economics classroom, shop classroom and a nurse’s office that contain copiers, microwaves, refrigerators, vending machines, soda machines, ovens, dishwashers, washers / dryers, electric tools and coffee makers.
The High School’s kitchen has a number of appliances including ovens, refrigerators, freezers, and electric warming tables and cabinets. The High School also has a walk-in refrigerator and walk-in freezer. It was observed that the District has installed a few energy-star appliances, including an industrial Beverage Air refrigerator.
Section 2 Facility Description
2-10
2.5 Administration Building 2.5.1 Description of Building Envelope The Administration Building walls is a single story building. The walls are plywood, with steel frame construction a layer of insulation and vinyl siding. The existing roofing system of the building consists of insulation and asphalt shingles over sloped roof decks. At the time of the walk through, there were no signs of interior leakage from the roof.
The windows throughout the building are insulating double paned windows. The exterior doors throughout the Administration Building are FRP doors
It was determined that the building envelope is in good condition and is currently providing a high level of insulation. As such, any modifications to the insulation system would not proof to be cost effective, from an energy savings stand-point.
2.5.2 Description of Building HVAC The Administration Building utilizes a gas-fired furnace for heating. Cooling is provided by several outdoor GE condensers, which serve DX coils within the air handling system.
2.5.3 Description of Building Lighting The Administration Building’s existing lighting system consists of 2X2 (2 lamp), 1X4 (1, 2, 3, and 4 lamp), 2X4 (2, 3, and 4 lamp) linear fluorescent fixtures with electronic ballasts, along with compact fluorescent, and incandescent fixtures. The Administration Building has already had the building lighting converted to energy efficient T8 lamps, with electronic ballasts. The existing incandescent fixtures should be retrofitted with compact fluorescent bulbs, sized to match existing light output of the fixtures.
2.5.4 Miscellaneous Equipment The Administration Building contains standard office equipment for approximately 30 employees that occupy the space, including computers, printers, fax machines and copiers.

A 3-1
Section 3 Baseline Energy Use
3.1 Utility Data Analysis The first step in the energy audit process is the compilation and quantification of the facility’s current and historical energy usage and associated utility costs. It is important to establish the existing patterns of electric, gas and fuel oil usage in order to be able to identify areas in which energy consumption can be reduced.
For this study, a spreadsheet summarizing monthly gas usage and cost per facility and monthly electric bills were analyzed and unit costs of energy were obtained. The unit cost of energy, as determined from the information provided by the District, was utilized in determining the feasibility of switching from one energy source to another or reducing the demand on that particular source of energy to create annual cost savings for the Point Pleasant Borough Board of Education.
3.1.1 Electric Charges It was also important to understand how the utility’s charge for the service. The majority of the energy consumed is electric, as a result of both indoor and outdoor lighting and appliances, such as kitchen appliances, computers, printers and projectors. Electricity is charged by three basic components: electrical consumption (kWH), electrical demand (kW) and power factor (kVAR) (reactive power). The cost for electrical consumption is similar to the cost for fuel oil, the monthly consumption appears on the utility bill as kWH consumed per month with a cost figure associated with it. The School District’s service connections are billed on a flat rate per kWH.
Electrical demand can be as much as 50 percent or more of the electric bill. The maximum demand (kW value) during the billing period is multiplied by the demand cost factor and the result is added to the electric bill. It is often possible to decrease the electric bill by 15 – 25 percent by reducing the demand, while still using the same amount of energy.
The power factor (reactive power) is the power required to energize electric and magnetic fields that result in the production of real power. Power factor is important because transmission and distribution systems must be designed and built to manage the need for real power as well as the reactive power component (the total power). If the power factor is low, then the total power required can be greater than 50 percent or more than the real power alone. The power factor charge is a penalty for having a low power factor. This penalty charge does not impact the School District.
The other parts of the electric bill are the supply charges, delivery charges, system benefits, transmission revenue adjustments, state and municipality tariff surcharges and sales taxes, which cannot be avoided.

Section 3 Baseline Energy Use
A 3-2
3.1.2 Fuel Charges South Jersey Energy Company is the current supplier and Pepco the current distributor of natural gas for the District. The District is charged for the cost of the natural gas, a delivery charge and a customer charge, which covers Gas administration charges.
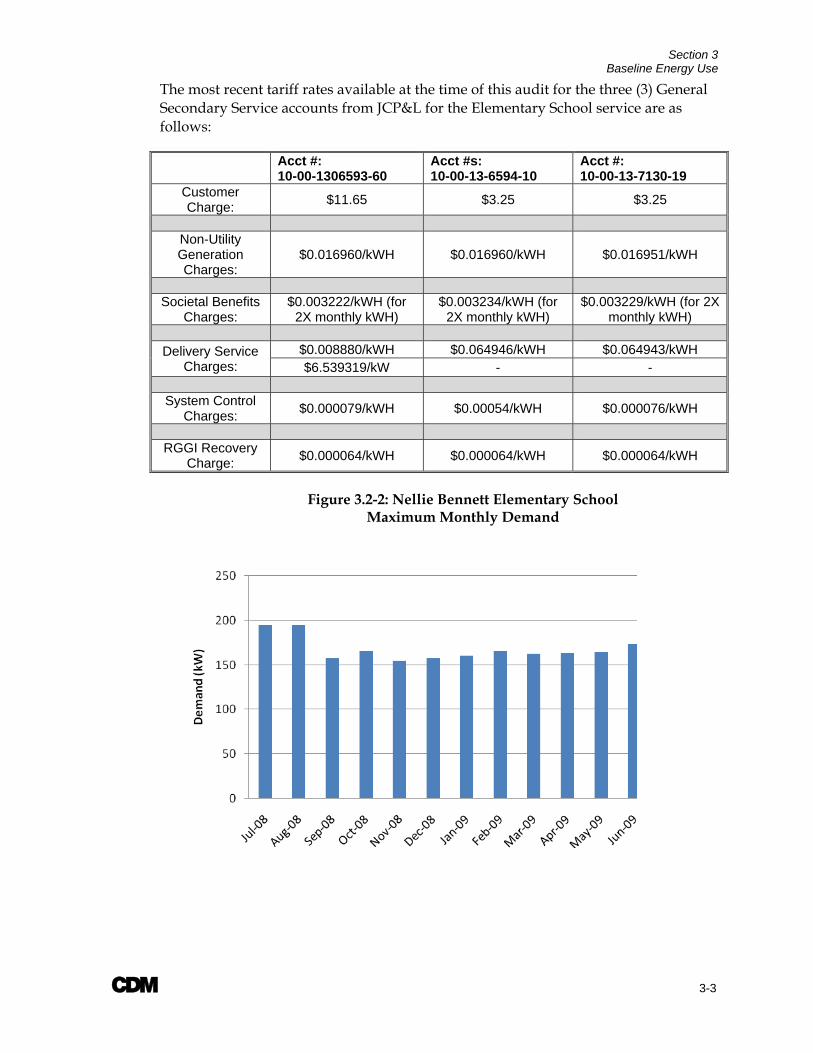
3.2 Facility Results 3.2.1 Nellie Bennett Elementary School Electric power for the Nellie Bennett Elementary School Building is fed from two General Secondary Service single phase lines and one General Secondary Service three phase lines from JCP&L. Figure 3.2-1 illustrates the average monthly total energy consumption from July 2006 through June 2009. From this graph, it can be determined that the electrical baseline consumption for the Nellie Bennett Elementary School averages around 40,000 kWH / month. This is the total baseline value from the three (3) services.
Figure 3.2-2 illustrates the monthly demand load for the Elementary School from July 2008 through June 2009.
Figure 3.2-1: Nellie Bennett Elementary School Total Building Electrical Usage
Section 3 Baseline Energy Use
A 3-3
The most recent tariff rates available at the time of this audit for the three (3) General Secondary Service accounts from JCP&L for the Elementary School service are as follows:
Acct #: 10-00-1306593-60
Acct #s: 10-00-13-6594-10
Acct #: 10-00-13-7130-19
Customer Charge: $11.65 $3.25 $3.25
Non-Utility Generation Charges:
$0.016960/kWH $0.016960/kWH $0.016951/kWH
Societal Benefits
Charges: $0.003222/kWH (for
2X monthly kWH) $0.003234/kWH (for
2X monthly kWH) $0.003229/kWH (for 2X
monthly kWH)
Delivery Service Charges:
$0.008880/kWH $0.064946/kWH $0.064943/kWH $6.539319/kW - -
System Control
Charges: $0.000079/kWH $0.00054/kWH $0.000076/kWH
RGGI Recovery
Charge: $0.000064/kWH $0.000064/kWH $0.000064/kWH
Figure 3.2-2: Nellie Bennett Elementary School
Maximum Monthly Demand
Section 3 Baseline Energy Use
A 3-4
Refer to Table 3.3-1, in Section 3.3, for average electrical aggregate cost. These tariffs are subject to change quite frequently. Refer to Appendix A for complete Historical Data Analysis.
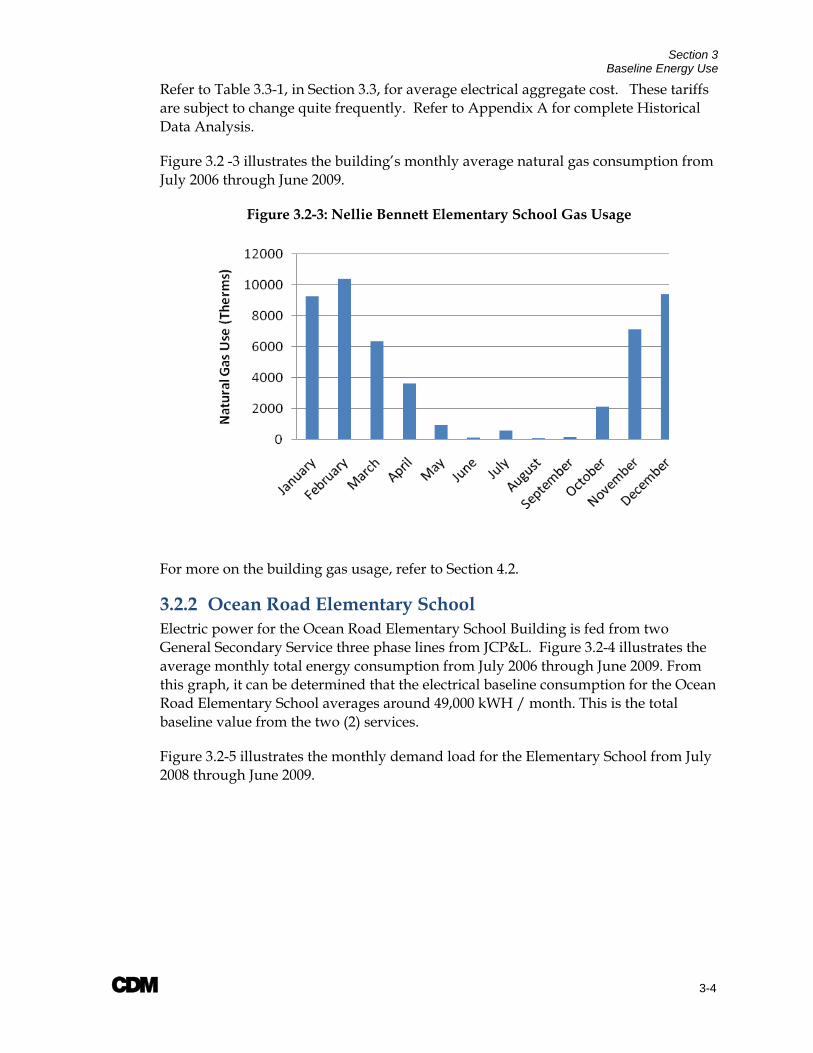
Figure 3.2 -3 illustrates the building’s monthly average natural gas consumption from July 2006 through June 2009.
Figure 3.2-3: Nellie Bennett Elementary School Gas Usage
For more on the building gas usage, refer to Section 4.2.
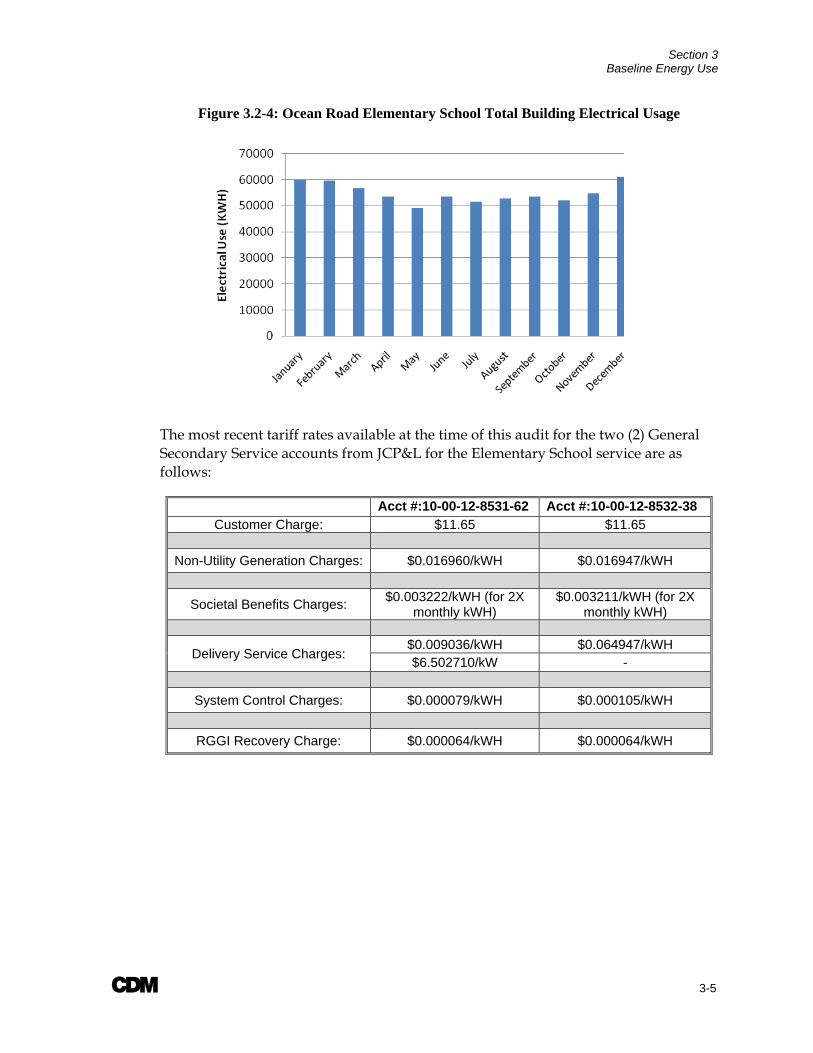
3.2.2 Ocean Road Elementary School Electric power for the Ocean Road Elementary School Building is fed from two General Secondary Service three phase lines from JCP&L. Figure 3.2-4 illustrates the average monthly total energy consumption from July 2006 through June 2009. From this graph, it can be determined that the electrical baseline consumption for the Ocean Road Elementary School averages around 49,000 kWH / month. This is the total baseline value from the two (2) services.
Figure 3.2-5 illustrates the monthly demand load for the Elementary School from July 2008 through June 2009.
Section 3 Baseline Energy Use
A 3-5
Figure 3.2-4: Ocean Road Elementary School Total Building Electrical Usage
The most recent tariff rates available at the time of this audit for the two (2) General Secondary Service accounts from JCP&L for the Elementary School service are as follows:
Acct #:10-00-12-8531-62 Acct #:10-00-12-8532-38 Customer Charge: $11.65 $11.65
Non-Utility Generation Charges: $0.016960/kWH $0.016947/kWH
Societal Benefits Charges: $0.003222/kWH (for 2X monthly kWH)
$0.003211/kWH (for 2X monthly kWH)
Delivery Service Charges: $0.009036/kWH $0.064947/kWH $6.502710/kW -
System Control Charges: $0.000079/kWH $0.000105/kWH
RGGI Recovery Charge: $0.000064/kWH $0.000064/kWH

Section 3 Baseline Energy Use
A 3-6
Figure 3.2-5: Ocean Road Elementary School Maximum Monthly Demand
Refer to Table 3.3-1, in Section 3.3, for average electrical aggregate cost. These tariffs are subject to change quite frequently. Refer to Appendix A for complete Historical Data Analysis.
Figure 3.2 -6 illustrates the building’s monthly average natural gas consumption from July 2006 through June 2009.
Figure 3.2-6: Ocean Road Elementary School Gas Usage
For more on the building gas usage, refer to Section 4.2.

Section 3 Baseline Energy Use
A 3-7
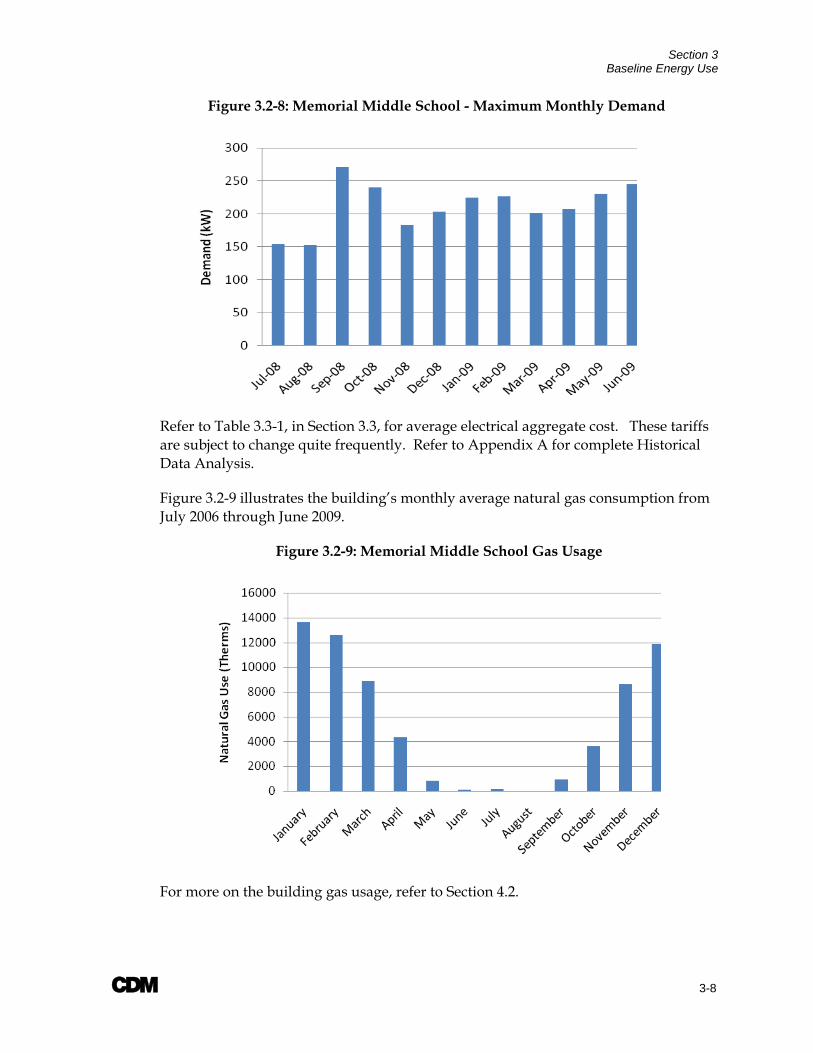
3.2.3 Memorial Middle School Electric power for the Memorial Middle School Building is fed from two General Secondary Service lines from JCP&L. Figure 3.2-7 illustrates the average monthly total energy consumption from July 2006 through June 2009. From this graph, it can be determined that the electrical baseline consumption for the Memorial Middle School averages around 43,000 kWH / month. This is the total baseline value from the two (2) services.
Figure 3.2-8 illustrates the monthly demand load for the Middle School from July 2008 through June 2009.
Figure 3.2-7: Memorial Middle School Total Building Electrical Usage
The most recent tariff rates available at the time of this audit for the two (2) General Secondary Service accounts from JCP&L for the Middle School service are as follows:
Acct #:10-00-11-8167-72 Acct #:10-00-53-4297-08 Customer Charge: $3.25 $11.65
Non-Utility Generation Charges: $0.016961/kWH $0.016960/kWH
Societal Benefits Charges: $0.003220/kWH (for 2X monthly kWH)
$0.003222/kWH (for 2X monthly kWH)
Delivery Service Charges: $0.064925/kWH $0.008716/kWH
- $6.189058/kW
System Control Charges: $0.000080/kWH $0.000079/kWH
RGGI Recovery Charge: $0.000064/kWH $0.000064/kWH
Section 3 Baseline Energy Use
A 3-8
Figure 3.2-8: Memorial Middle School - Maximum Monthly Demand
Refer to Table 3.3-1, in Section 3.3, for average electrical aggregate cost. These tariffs are subject to change quite frequently. Refer to Appendix A for complete Historical Data Analysis.
Figure 3.2-9 illustrates the building’s monthly average natural gas consumption from July 2006 through June 2009.
Figure 3.2-9: Memorial Middle School Gas Usage
For more on the building gas usage, refer to Section 4.2.
Section 3 Baseline Energy Use
A 3-9
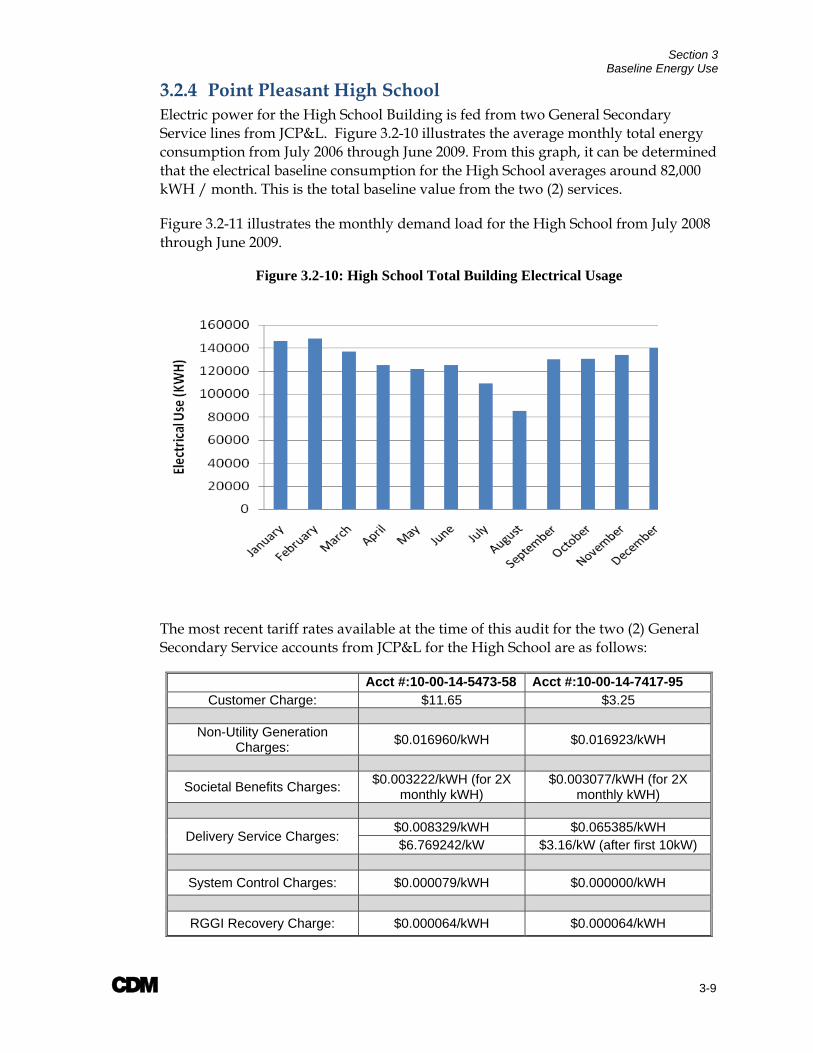
3.2.4 Point Pleasant High School Electric power for the High School Building is fed from two General Secondary Service lines from JCP&L. Figure 3.2-10 illustrates the average monthly total energy consumption from July 2006 through June 2009. From this graph, it can be determined that the electrical baseline consumption for the High School averages around 82,000 kWH / month. This is the total baseline value from the two (2) services.
Figure 3.2-11 illustrates the monthly demand load for the High School from July 2008 through June 2009.
Figure 3.2-10: High School Total Building Electrical Usage
The most recent tariff rates available at the time of this audit for the two (2) General Secondary Service accounts from JCP&L for the High School are as follows:
Acct #:10-00-14-5473-58 Acct #:10-00-14-7417-95 Customer Charge: $11.65 $3.25
Non-Utility Generation
Charges: $0.016960/kWH $0.016923/kWH
Societal Benefits Charges: $0.003222/kWH (for 2X monthly kWH)
$0.003077/kWH (for 2X monthly kWH)
Delivery Service Charges: $0.008329/kWH $0.065385/kWH $6.769242/kW $3.16/kW (after first 10kW)
System Control Charges: $0.000079/kWH $0.000000/kWH
RGGI Recovery Charge: $0.000064/kWH $0.000064/kWH
Section 3 Baseline Energy Use
A 3-10
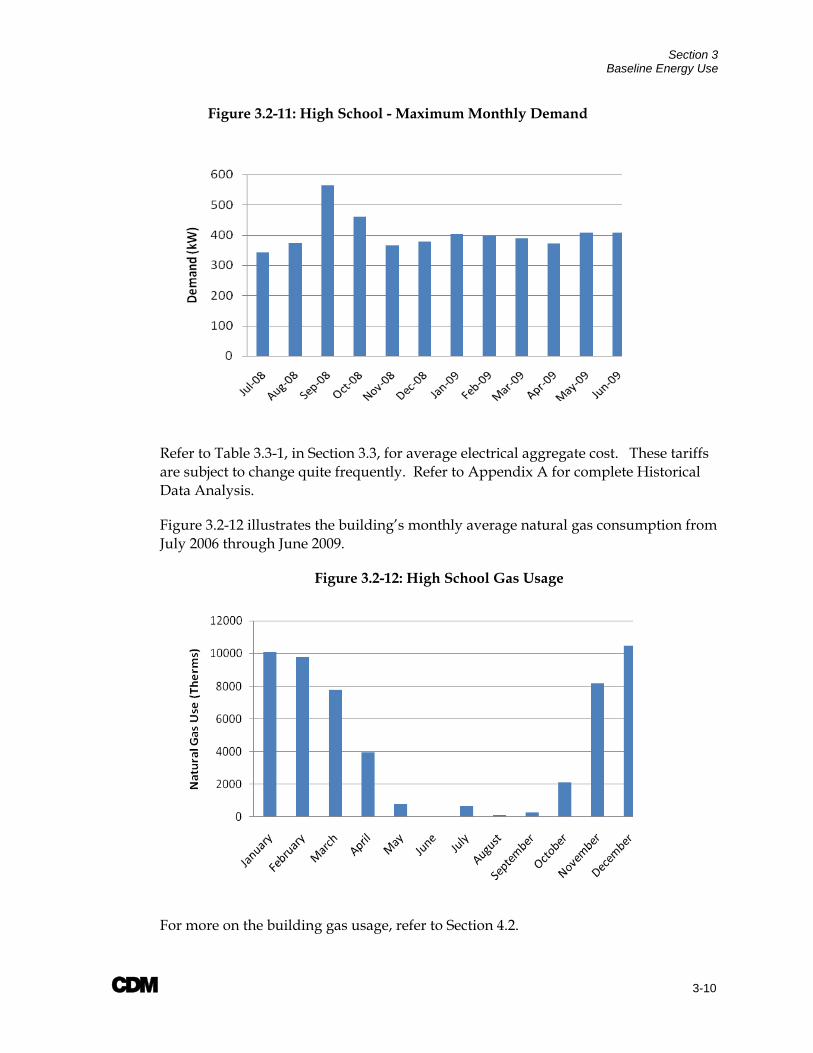
Figure 3.2-11: High School - Maximum Monthly Demand
Refer to Table 3.3-1, in Section 3.3, for average electrical aggregate cost. These tariffs are subject to change quite frequently. Refer to Appendix A for complete Historical Data Analysis.
Figure 3.2-12 illustrates the building’s monthly average natural gas consumption from July 2006 through June 2009.
Figure 3.2-12: High School Gas Usage
For more on the building gas usage, refer to Section 4.2.
Section 3 Baseline Energy Use
A 3-11
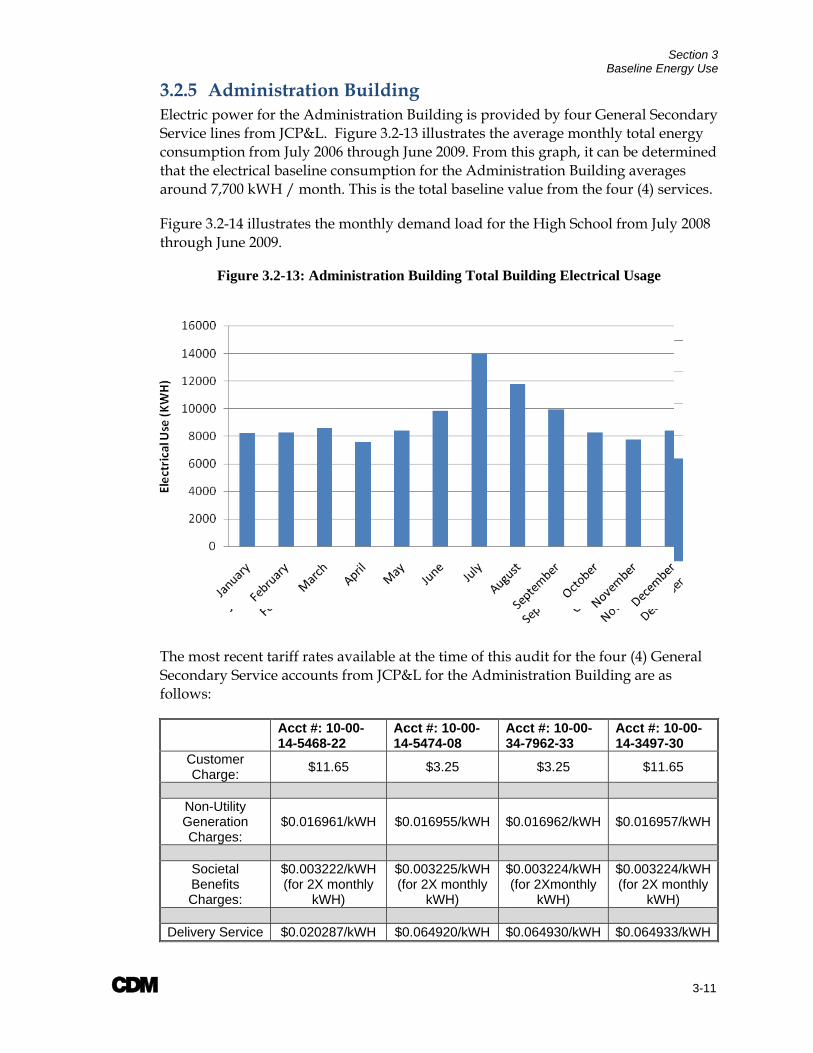
3.2.5 Administration Building Electric power for the Administration Building is provided by four General Secondary Service lines from JCP&L. Figure 3.2-13 illustrates the average monthly total energy consumption from July 2006 through June 2009. From this graph, it can be determined that the electrical baseline consumption for the Administration Building averages around 7,700 kWH / month. This is the total baseline value from the four (4) services.
Figure 3.2-14 illustrates the monthly demand load for the High School from July 2008 through June 2009.
Figure 3.2-13: Administration Building Total Building Electrical Usage
The most recent tariff rates available at the time of this audit for the four (4) General Secondary Service accounts from JCP&L for the Administration Building are as follows:
Acct #: 10-00-14-5468-22
Acct #: 10-00-14-5474-08
Acct #: 10-00-34-7962-33
Acct #: 10-00-14-3497-30
Customer Charge: $11.65 $3.25 $3.25 $11.65
Non-Utility Generation Charges:
$0.016961/kWH $0.016955/kWH $0.016962/kWH $0.016957/kWH
Societal Benefits Charges:
$0.003222/kWH (for 2X monthly
kWH)
$0.003225/kWH (for 2X monthly
kWH)
$0.003224/kWH (for 2Xmonthly
kWH)
$0.003224/kWH (for 2X monthly
kWH)
Delivery Service $0.020287/kWH $0.064920/kWH $0.064930/kWH $0.064933/kWH
Section 3 Baseline Energy Use
A 3-12
Charges: $4.397802/kW - - -
System Control Charges: $0.000078/kWH $0.000080/kWH $0.000080/kWH $0.000074/kWH
RGGI Recovery
Charge: $0.000064/kWH $0.000064/kWH $0.000064/kWH $0.000064/kWH
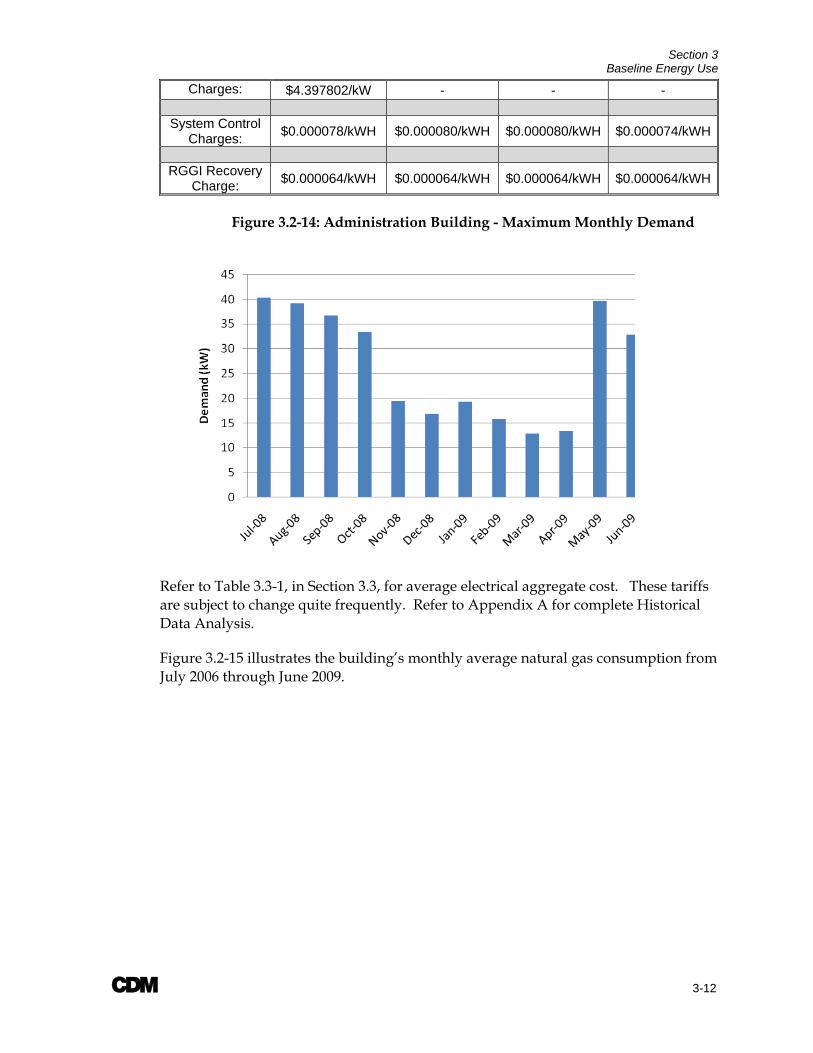
Figure 3.2-14: Administration Building - Maximum Monthly Demand
Refer to Table 3.3-1, in Section 3.3, for average electrical aggregate cost. These tariffs are subject to change quite frequently. Refer to Appendix A for complete Historical Data Analysis.
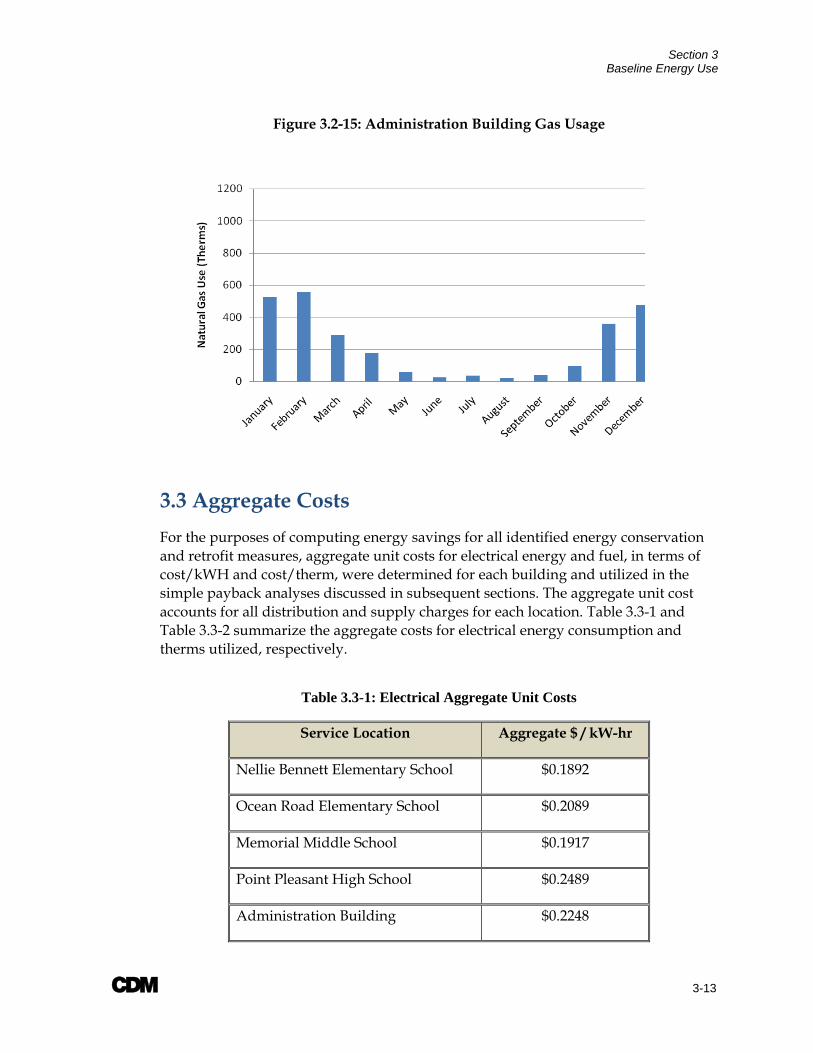
Figure 3.2-15 illustrates the building’s monthly average natural gas consumption from July 2006 through June 2009.
Section 3 Baseline Energy Use
A 3-13
Figure 3.2-15: Administration Building Gas Usage
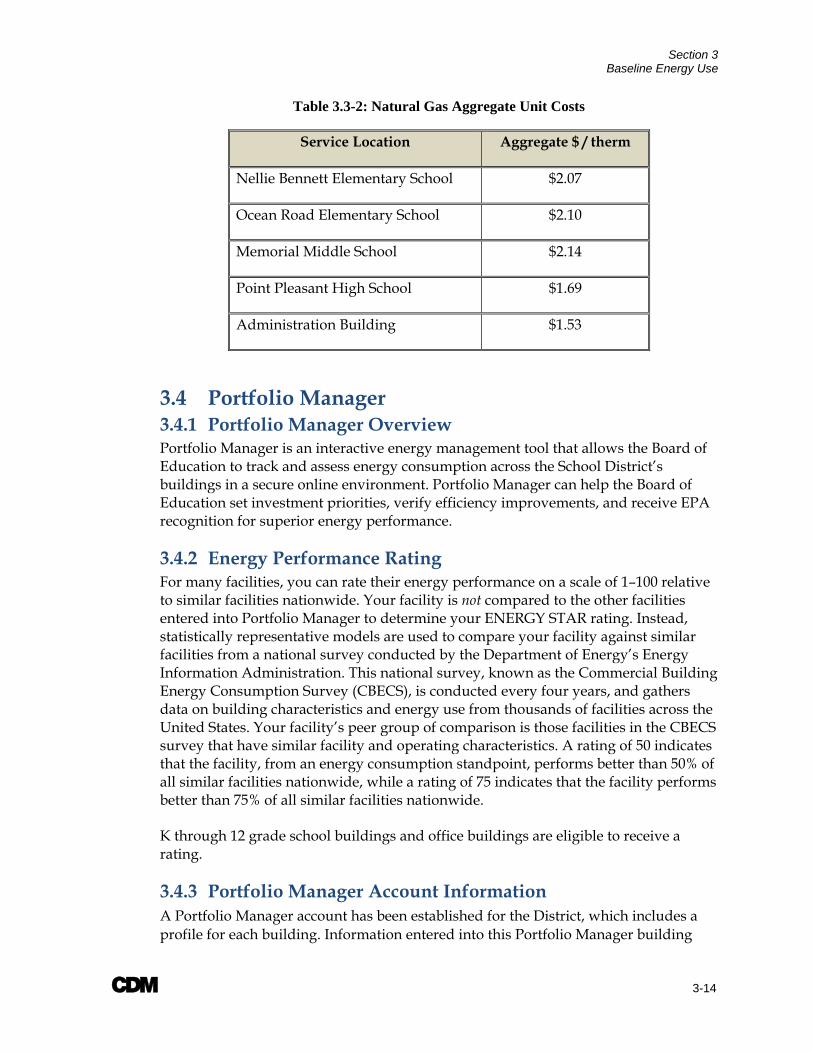
3.3 Aggregate Costs For the purposes of computing energy savings for all identified energy conservation and retrofit measures, aggregate unit costs for electrical energy and fuel, in terms of cost/kWH and cost/therm, were determined for each building and utilized in the simple payback analyses discussed in subsequent sections. The aggregate unit cost accounts for all distribution and supply charges for each location. Table 3.3-1 and Table 3.3-2 summarize the aggregate costs for electrical energy consumption and therms utilized, respectively.
Table 3.3-1: Electrical Aggregate Unit Costs
Service Location Aggregate $ / kW-hr
Nellie Bennett Elementary School $0.1892
Ocean Road Elementary School $0.2089
Memorial Middle School $0.1917
Point Pleasant High School $0.2489
Administration Building $0.2248
Section 3 Baseline Energy Use
A 3-14
Table 3.3-2: Natural Gas Aggregate Unit Costs
Service Location Aggregate $ / therm
Nellie Bennett Elementary School $2.07
Ocean Road Elementary School $2.10
Memorial Middle School $2.14
Point Pleasant High School $1.69
Administration Building $1.53
3.4 Portfolio Manager 3.4.1 Portfolio Manager Overview Portfolio Manager is an interactive energy management tool that allows the Board of Education to track and assess energy consumption across the School District’s buildings in a secure online environment. Portfolio Manager can help the Board of Education set investment priorities, verify efficiency improvements, and receive EPA recognition for superior energy performance.
3.4.2 Energy Performance Rating For many facilities, you can rate their energy performance on a scale of 1–100 relative to similar facilities nationwide. Your facility is not compared to the other facilities entered into Portfolio Manager to determine your ENERGY STAR rating. Instead, statistically representative models are used to compare your facility against similar facilities from a national survey conducted by the Department of Energy’s Energy Information Administration. This national survey, known as the Commercial Building Energy Consumption Survey (CBECS), is conducted every four years, and gathers data on building characteristics and energy use from thousands of facilities across the United States. Your facility’s peer group of comparison is those facilities in the CBECS survey that have similar facility and operating characteristics. A rating of 50 indicates that the facility, from an energy consumption standpoint, performs better than 50% of all similar facilities nationwide, while a rating of 75 indicates that the facility performs better than 75% of all similar facilities nationwide.
K through 12 grade school buildings and office buildings are eligible to receive a rating.
3.4.3 Portfolio Manager Account Information A Portfolio Manager account has been established for the District, which includes a profile for each building. Information entered into this Portfolio Manager building

Section 3 Baseline Energy Use
A 3-15
profile, including electrical energy consumption and natural gas consumption may be used to apply for an Energy Star rating with the USEPA.
At the time of this report, the buildings received the following ratings:
Nellie Bennett Elementary School – 50 Ocean Road Elementary School – 18 Memorial Middle School – 16 Point Pleasant High School – 79 Administration Building - 74 However the electric and natural gas consumption data utilized to develop these ratings was > 120 days old, as both all active utility meters entered most have 12 consecutive overlapping months of usage data for the program to be able to calculate a energy star rating. Therefore, it is highly recommended that the information be updated to determine a current rating, especially to confirm the current ratings for the High School and Administration Buildings.
A Statement of Energy Performance report for the Ocean Road Elementary School, Memorial Middle School, High School and Administration Building was generated through Portfolio Manager and included in Appendix B, along with a Portfolio Manager reference sheet.
In order to qualify for an energy star rating, utility data must be current. Therefore, as the District takes possession of this account, it is important to keep it updated with the latest utility bill data. Also, as a result of the District’s commitment to implementing energy efficiency improvements, the building ratings may improve to be 75 or more, warranting an Energy Star label.
The following website link, username and password shall be used to access the Portfolio Manager account and building profiles that has been established for the District:
https://www.energystar.gov/istar/pmpam/ USERNAME: PointPleasant PASSWORD: EnergyStar
A 4-1
Section 4 Energy Conservation and Retrofit Measures (ECRM) 4.1 Building Lighting Systems The goal of this section is to present any lighting energy conservation measures that may also be cost beneficial. It should be noted that replacing current bulbs with more energy-efficient equivalents will have a small effect on the building heating and cooling loads. The building cooling load will see a small decrease from an upgrade to more efficient bulbs and the heating load will see a small increase, as the more energy efficient bulbs give off less heat.
Please note that the probable construction costs presented herein are estimates based on historic data compiled from similar installations and engineering opinions. Additional engineering will be required for each measure identified in this report and final scope of work and budget cost estimates will need to be confirmed prior to the coordination of project financing or the issuance of a Request for Proposal.
4.1.1 Nellie Bennett Elementary School It is recommended that the existing lighting system at the Nellie Bennett Elementary School, which consists of T-8 fixtures, compact fluorescent, metal halide, high pressure sodium, and incandescent fixtures, as discussed in Section 2.1.2, be upgraded to high efficiency standards to create lighting uniformity throughout the buildings. Limited ECRM’s can be applied to the existing system, because the school has recently performed a T-8 upgrade on a majority of the lighting in the high school building. In general, the recommended lighting upgrade project, as presented in Appendix D, involves replacing existing inefficient bulbs, and installing new energy-efficient luminaires to the existing lighting systems. Two options have also been proposed in Appendix D for the exterior lighting. Option 1 includes the cost to replace all the existing exterior lighting fixtures with high efficiency LED fixtures, and Option 2 does not include this cost, and assumes that no LED related ECRM’s will be applied to the aforementioned lighting. The strategies included in this section focus on maximizing energy savings and maintaining or exceeding existing lighting levels, while also maintaining the existing look of each fixture; therefore, proposed lamp styles remain consistent with existing lamp styles. The additional recommendations to install occupancy sensors in specified areas of the facility are included in Options 1 and 2. Please refer to Appendix D: Lighting Retrofit Spreadsheets Option 1 and 2 for a line-by-line proposed detailed lighting upgrades list.
The annual energy savings for Option 1 are estimated to be 9.6kW, 23,179 kWh and $4,636. The annual energy savings for Option 2 are estimated to be 7.3kW, 17,702 kWh and $3,541. The following table, Table 4.1-1, summarizes a simple payback analysis assuming the implementation of all recommended lighting system improvements at the Nellie Bennett Elementary School. Included in this simplified

Section 4 Energy Conservation and Retrofit Measures
A 4-2
payback analysis summary table is a ‘Return on Investment’ (ROI) values. This value is a performance measure used to evaluate the efficiency of an investment and is calculated by dividing the ‘return’ or savings associated with an investment by the total investment cost. ROI values are calculated by dividing the annual energy savings by the retrofit cost after incentives. ROI ratings can be utilized to prioritize the implementation of energy savings measures.
Table 4.1-1 Nellie Bennett Elementary School Lighting System Improvements
Option 1 Option 2
New & Retrofit Cost (Material and Labor) $ 36,987 $6,264
New Jersey SmartStart Rebate -$1,940* -$1,940
Total Cost $35,047 $4,324
Annual Energy Savings $4,636 $3,541
Simple Payback 7.6 years 1.2 years
Return on Investment (ROI) 13% 82%
Lifetime Energy Savings (20 years)** $124,657 $95,135
Lifetime Maintenance Cost Savings $2,599 $2,354
* Additional incentives are available through the New Jersey SmartStart Program, see Appendix G.
**3% yearly inflation on electricity costs
It should be noted that the Lighting Annual Savings assume the annual hours per year of operation as outlined under the columns entitled “Proposed Operational Hours” and “Proposed Operational Hours with Sensors” in Appendix D.
4.1.2 Ocean Road Elementary School It is recommended that the existing lighting system at the Ocean Road Elementary School, which consists of T-8 fixtures, compact fluorescent, metal halide, high pressure sodium, and incandescent fixtures, as discussed in Section 2.1.2, be upgraded to high efficiency standards to create lighting uniformity throughout the buildings. Limited ECRM’s can be applied to the existing system, because the school has recently performed a T-8 upgrade on a majority of the lighting in the high school building. In general, the recommended lighting upgrade project, as presented in Appendix D, involves replacing existing inefficient bulbs, and installing new energy-efficient luminaires to the existing lighting systems. Two options have also been proposed in Appendix D for the exterior lighting. Option 1 includes the cost to replace all the
Section 4 Energy Conservation and Retrofit Measures
A 4-3
existing exterior lighting fixtures with high efficiency LED fixtures, and Option 2 does not include this cost, and assumes that no LED related ECRM’s will be applied to the aforementioned lighting. The strategies included in this section focus on maximizing energy savings and maintaining or exceeding existing lighting levels, while also maintaining the existing look of each fixture; therefore, proposed lamp styles remain consistent with existing lamp styles. The additional recommendations to install occupancy sensors in specified areas of the facility are included in Options 1 and 2. Please refer to Appendix D: Lighting Retrofit Spreadsheets Option 1 and 2 for a line-by-line proposed detailed lighting upgrades list.
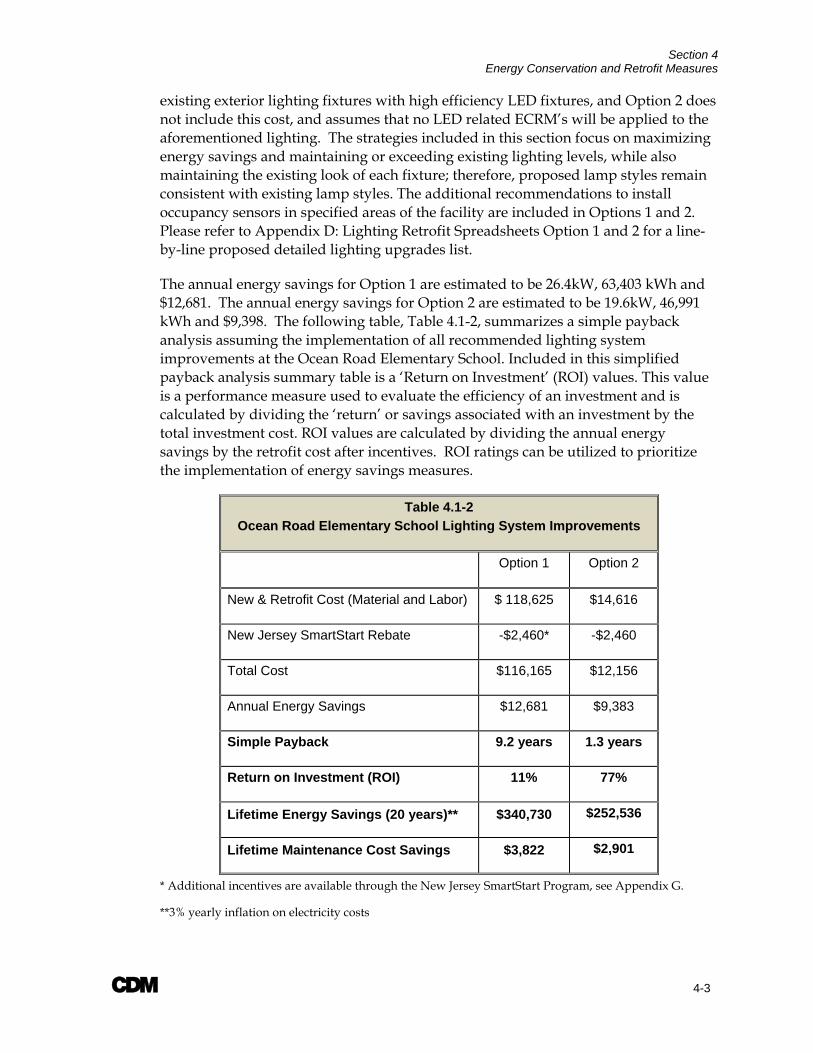
The annual energy savings for Option 1 are estimated to be 26.4kW, 63,403 kWh and $12,681. The annual energy savings for Option 2 are estimated to be 19.6kW, 46,991 kWh and $9,398. The following table, Table 4.1-2, summarizes a simple payback analysis assuming the implementation of all recommended lighting system improvements at the Ocean Road Elementary School. Included in this simplified payback analysis summary table is a ‘Return on Investment’ (ROI) values. This value is a performance measure used to evaluate the efficiency of an investment and is calculated by dividing the ‘return’ or savings associated with an investment by the total investment cost. ROI values are calculated by dividing the annual energy savings by the retrofit cost after incentives. ROI ratings can be utilized to prioritize the implementation of energy savings measures.
Table 4.1-2 Ocean Road Elementary School Lighting System Improvements
Option 1 Option 2
New & Retrofit Cost (Material and Labor) $ 118,625 $14,616
New Jersey SmartStart Rebate -$2,460* -$2,460
Total Cost $116,165 $12,156
Annual Energy Savings $12,681 $9,383
Simple Payback 9.2 years 1.3 years
Return on Investment (ROI) 11% 77%
Lifetime Energy Savings (20 years)** $340,730 $252,536
Lifetime Maintenance Cost Savings $3,822 $2,901
* Additional incentives are available through the New Jersey SmartStart Program, see Appendix G.
**3% yearly inflation on electricity costs
Section 4 Energy Conservation and Retrofit Measures
A 4-4
It should be noted that the Lighting Annual Savings assume the annual hours per year of operation as outlined under the columns entitled “Proposed Operational Hours” and “Proposed Operational Hours with Sensors” in Appendix D.
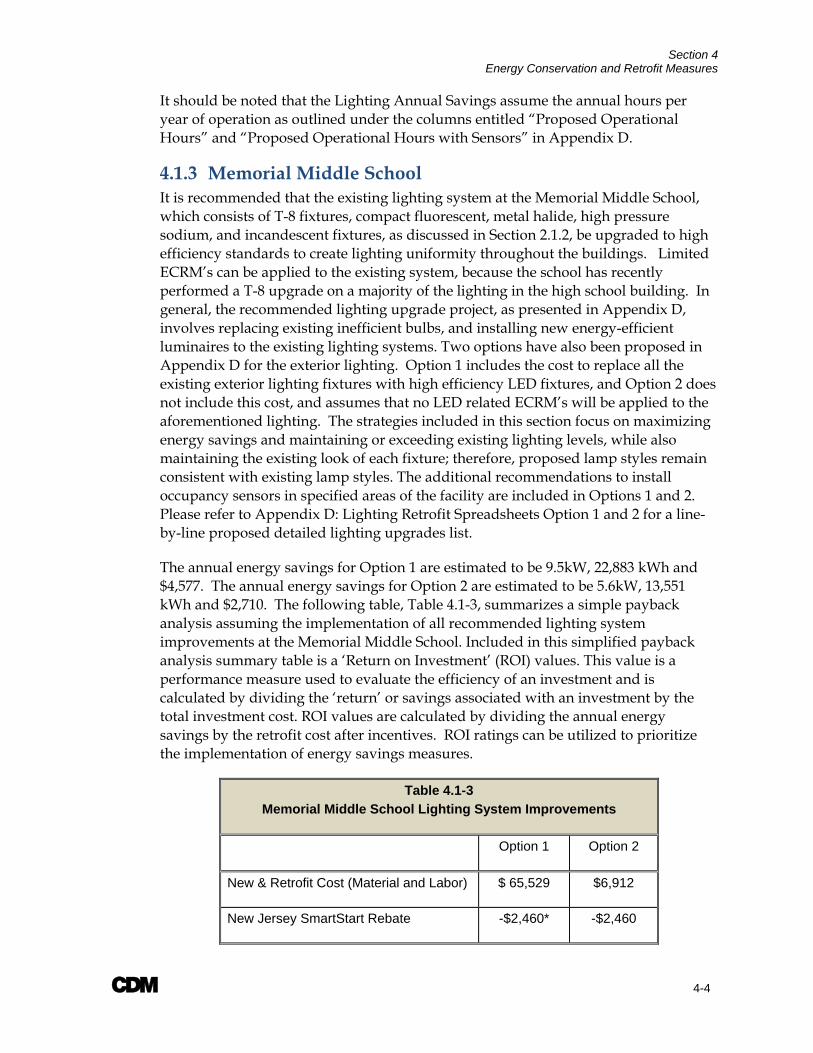
4.1.3 Memorial Middle School It is recommended that the existing lighting system at the Memorial Middle School, which consists of T-8 fixtures, compact fluorescent, metal halide, high pressure sodium, and incandescent fixtures, as discussed in Section 2.1.2, be upgraded to high efficiency standards to create lighting uniformity throughout the buildings. Limited ECRM’s can be applied to the existing system, because the school has recently performed a T-8 upgrade on a majority of the lighting in the high school building. In general, the recommended lighting upgrade project, as presented in Appendix D, involves replacing existing inefficient bulbs, and installing new energy-efficient luminaires to the existing lighting systems. Two options have also been proposed in Appendix D for the exterior lighting. Option 1 includes the cost to replace all the existing exterior lighting fixtures with high efficiency LED fixtures, and Option 2 does not include this cost, and assumes that no LED related ECRM’s will be applied to the aforementioned lighting. The strategies included in this section focus on maximizing energy savings and maintaining or exceeding existing lighting levels, while also maintaining the existing look of each fixture; therefore, proposed lamp styles remain consistent with existing lamp styles. The additional recommendations to install occupancy sensors in specified areas of the facility are included in Options 1 and 2. Please refer to Appendix D: Lighting Retrofit Spreadsheets Option 1 and 2 for a line-by-line proposed detailed lighting upgrades list.
The annual energy savings for Option 1 are estimated to be 9.5kW, 22,883 kWh and $4,577. The annual energy savings for Option 2 are estimated to be 5.6kW, 13,551 kWh and $2,710. The following table, Table 4.1-3, summarizes a simple payback analysis assuming the implementation of all recommended lighting system improvements at the Memorial Middle School. Included in this simplified payback analysis summary table is a ‘Return on Investment’ (ROI) values. This value is a performance measure used to evaluate the efficiency of an investment and is calculated by dividing the ‘return’ or savings associated with an investment by the total investment cost. ROI values are calculated by dividing the annual energy savings by the retrofit cost after incentives. ROI ratings can be utilized to prioritize the implementation of energy savings measures.
Table 4.1-3 Memorial Middle School Lighting System Improvements
Option 1 Option 2
New & Retrofit Cost (Material and Labor) $ 65,529 $6,912
New Jersey SmartStart Rebate -$2,460* -$2,460

Section 4 Energy Conservation and Retrofit Measures
A 4-5
Table 4.1-3 Memorial Middle School Lighting System Improvements
Total Cost $63,069 $4,452
Annual Energy Savings $4,577 $2,710
Simple Payback 14 years 1.6 years
Return on Investment (ROI) 7% 61%
Lifetime Energy Savings (20 years)** $122,972 $72,827
Lifetime Maintenance Cost Savings $961 $452
* Additional incentives are available through the New Jersey SmartStart Program, see Appendix G.
**3% yearly inflation on electricity costs
It should be noted that the Lighting Annual Savings assume the annual hours per year of operation as outlined under the columns entitled “Proposed Operational Hours” and “Proposed Operational Hours with Sensors” in Appendix D.
4.1.4 Point Pleasant High School It is recommended that the existing lighting system at the Point Pleasant High School, which consists of T-8 fixtures, compact fluorescent, metal halide, high pressure sodium, and incandescent fixtures, as discussed in Section 2.1.2, be upgraded to high efficiency standards to create lighting uniformity throughout the buildings. Limited ECRM’s can be applied to the existing system, because the school has recently performed a T-8 upgrade on a majority of the lighting in the high school building. In general, the recommended lighting upgrade project, as presented in Appendix D, involves replacing existing inefficient bulbs, and installing new energy-efficient luminaires to the existing lighting systems. Two options have also been proposed in Appendix D for the exterior lighting. Option 1 includes the cost to replace all the existing exterior lighting fixtures with high efficiency LED fixtures, and Option 2 does not include this cost, and assumes that no LED related ECRM’s will be applied to the aforementioned lighting. The strategies included in this section focus on maximizing energy savings and maintaining or exceeding existing lighting levels, while also maintaining the existing look of each fixture; therefore, proposed lamp styles remain consistent with existing lamp styles. The additional recommendations to install occupancy sensors in specified areas of the facility are included in Options 1 and 2. Please refer to Appendix D: Lighting Retrofit Spreadsheets Option 1 and 2 for a line-by-line proposed detailed lighting upgrades list.
The annual energy savings for Option 1 are estimated to be 17.2kW, 41,506 kWh and $8,301. The annual energy savings for Option 2 are estimated to be 15.2kW, 36,816 kWh and $7,363. The following table, Table 4.1-4, summarizes a simple payback

Section 4 Energy Conservation and Retrofit Measures
A 4-6
analysis assuming the implementation of all recommended lighting system improvements at the Point Pleasant High School. Included in this simplified payback analysis summary table is a ‘Return on Investment’ (ROI) values. This value is a performance measure used to evaluate the efficiency of an investment and is calculated by dividing the ‘return’ or savings associated with an investment by the total investment cost. ROI values are calculated by dividing the annual energy savings by the retrofit cost after incentives. ROI ratings can be utilized to prioritize the implementation of energy savings measures.
Table 4.1-4 Point Pleasant High School Lighting System Improvements
Option 1 Option 2
New & Retrofit Cost (Material and Labor) $ 56,986 $16,722
New Jersey SmartStart Rebate -$ 5,700* -$5,700
Total Cost $51,286 $11,022
Annual Energy Savings $8,301 $7,363
Simple Payback 6.2 years 1.5 years
Return on Investment (ROI) 16% 67%
Lifetime Energy Savings (20 years)** $223,056 $197,855
Lifetime Maintenance Cost Savings $3,205 $2,597
* Additional incentives are available through the New Jersey SmartStart Program, see Appendix G.
**3% yearly inflation on electricity costs
It should be noted that the Lighting Annual Savings assume the annual hours per year of operation as outlined under the columns entitled “Proposed Operational Hours” and “Proposed Operational Hours with Sensors” in Appendix D.
4.1.5 Administration Building It is recommended that the existing lighting system at the Administration Building, which consists of T-8 fixtures, compact fluorescent, high pressure sodium, and incandescent fixtures, as discussed in Section 2.1.2, be upgraded to high efficiency standards to create lighting uniformity throughout the buildings. Limited ECRM’s can be applied to the existing system, because the school has recently performed a T-8 upgrade on a majority of the lighting in the high school building. In general, the recommended lighting upgrade project, as presented in Appendix D, involves replacing existing inefficient bulbs, and installing new energy-efficient luminaires to
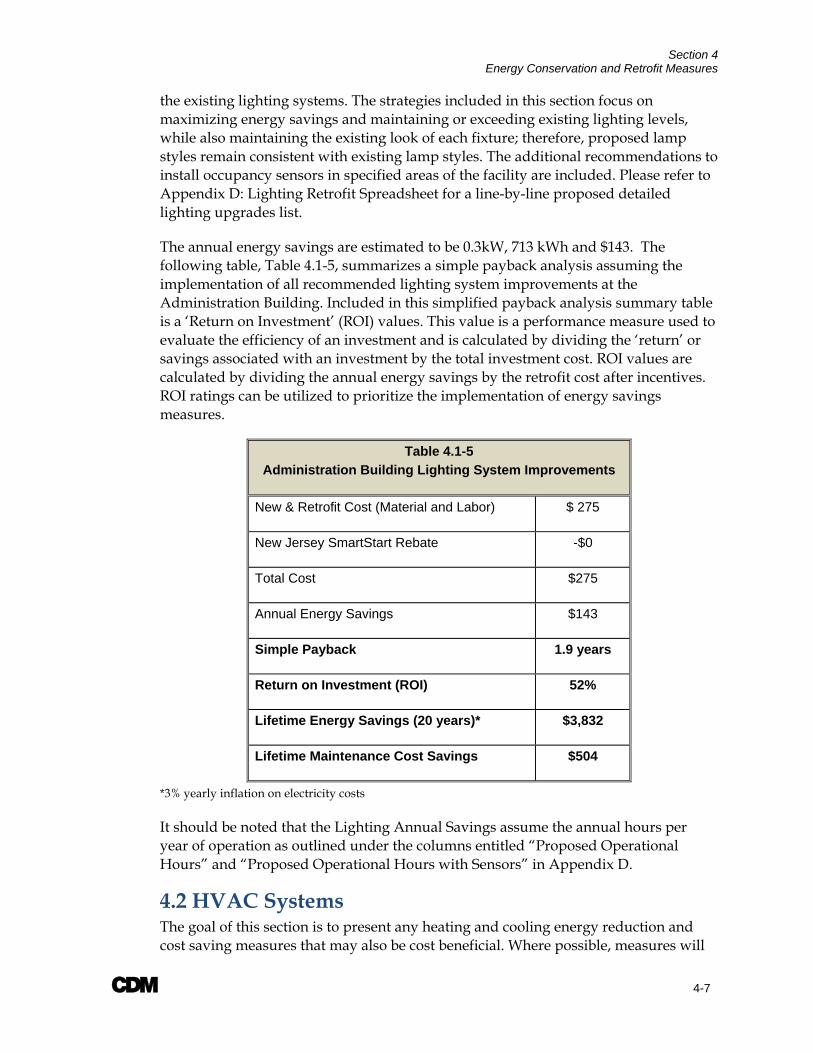
Section 4 Energy Conservation and Retrofit Measures
A 4-7
the existing lighting systems. The strategies included in this section focus on maximizing energy savings and maintaining or exceeding existing lighting levels, while also maintaining the existing look of each fixture; therefore, proposed lamp styles remain consistent with existing lamp styles. The additional recommendations to install occupancy sensors in specified areas of the facility are included. Please refer to Appendix D: Lighting Retrofit Spreadsheet for a line-by-line proposed detailed lighting upgrades list.
The annual energy savings are estimated to be 0.3kW, 713 kWh and $143. The following table, Table 4.1-5, summarizes a simple payback analysis assuming the implementation of all recommended lighting system improvements at the Administration Building. Included in this simplified payback analysis summary table is a ‘Return on Investment’ (ROI) values. This value is a performance measure used to evaluate the efficiency of an investment and is calculated by dividing the ‘return’ or savings associated with an investment by the total investment cost. ROI values are calculated by dividing the annual energy savings by the retrofit cost after incentives. ROI ratings can be utilized to prioritize the implementation of energy savings measures.
Table 4.1-5 Administration Building Lighting System Improvements
New & Retrofit Cost (Material and Labor) $ 275
New Jersey SmartStart Rebate -$0
Total Cost $275
Annual Energy Savings $143
Simple Payback 1.9 years
Return on Investment (ROI) 52%
Lifetime Energy Savings (20 years)* $3,832
Lifetime Maintenance Cost Savings $504
*3% yearly inflation on electricity costs
It should be noted that the Lighting Annual Savings assume the annual hours per year of operation as outlined under the columns entitled “Proposed Operational Hours” and “Proposed Operational Hours with Sensors” in Appendix D.
4.2 HVAC Systems The goal of this section is to present any heating and cooling energy reduction and cost saving measures that may also be cost beneficial. Where possible, measures will
Section 4 Energy Conservation and Retrofit Measures
A 4-8
be presented with a life-cycle cost analysis. This analysis displays a payback period based on weighing the capital cost of the measure against predicted annual fiscal savings. To do this, the buildings have been modeled as accurately as possible to predict energy usage for space heating and cooling, as well as domestic hot water use.
Each building is modeled using software called eQuest, a Department of Energy-sponsored energy modeling program, to establish a baseline space heating and cooling energy usage. Climate data from Freehold, NJ was used for analysis. From this, the model may be calibrated, using historical utility bills, to predict the impact of theoretical energy savings measures.
It should be noted that due to the incomplete and inconsistent natural gas usage data available, CDM had difficulty ascertaining a consistent annual natural gas usage pattern for the schools. The schools have therefore been modeled as accurately as possible using approximately one year of historical usage data, as well as information gathered and received by CDM, to provide a baseline from which to calculate savings. CDM has attempted to take a conservative approach with these schools, by anticipating lower-than-actual annual gas usages. In doing so, CDM can conservatively estimate natural gas savings from any ECRM for these respective schools. Consequently, actual natural gas savings resulting from any ECRM for the schools will likely be more significant than anticipated in this report.
Once annual energy savings from a particular measure have been predicted and the initial capital cost has been estimated, payback periods may be approximated. Equipment cost estimate calculations are provided in Appendix H.
4.2.1 Nellie Bennett Elementary School A model of the Nellie Bennett Elementary School was created in eQuest to predict heating and cooling loads for the building. To calibrate this model, CDM used electricity bills from July, 2006 through June, 2009, and natural gas bills from July, 2006 through June, 2008. For both electricity and natural gas, historical monthly usages were averaged for each month. For example, usage during the month of January was averaged for the two years, to yield an approximate average gas usage during the month of January. The same was done for all twelve months.
Figure 4.2-1 below compares actual monthly electricity usages, with those predicted by the eQuest model.
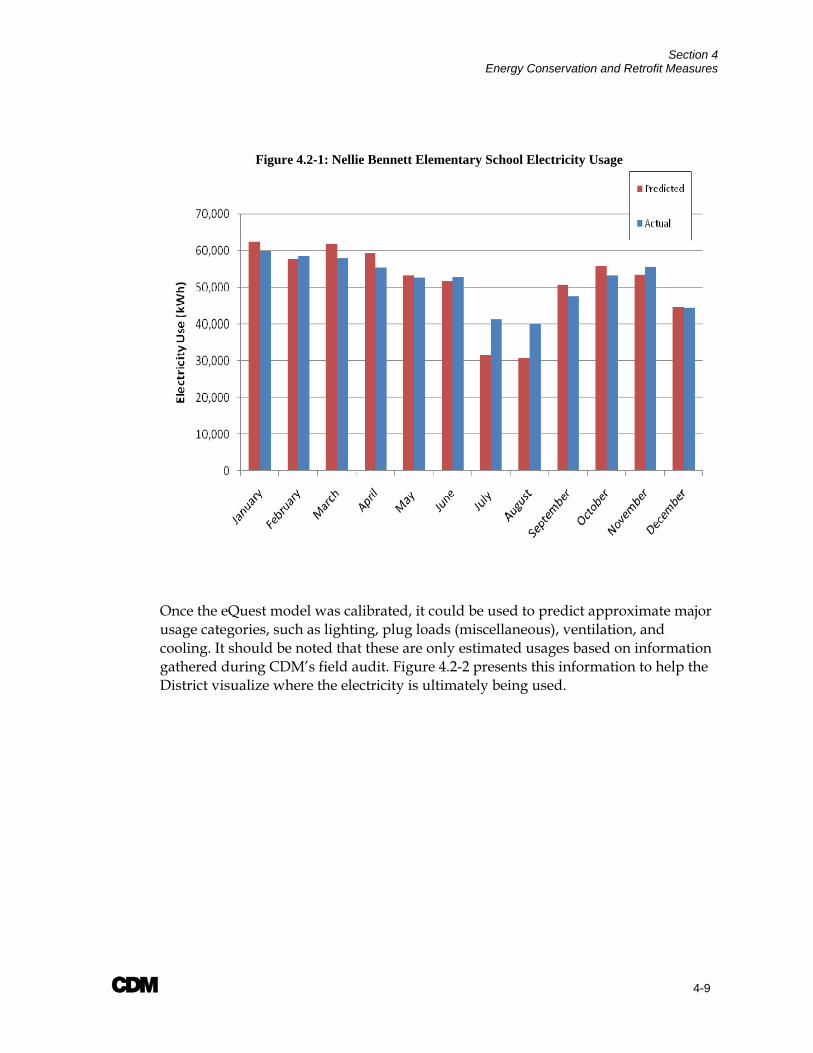
Section 4 Energy Conservation and Retrofit Measures
A 4-9
Figure 4.2-1: Nellie Bennett Elementary School Electricity Usage
Once the eQuest model was calibrated, it could be used to predict approximate major usage categories, such as lighting, plug loads (miscellaneous), ventilation, and cooling. It should be noted that these are only estimated usages based on information gathered during CDM’s field audit. Figure 4.2-2 presents this information to help the District visualize where the electricity is ultimately being used.
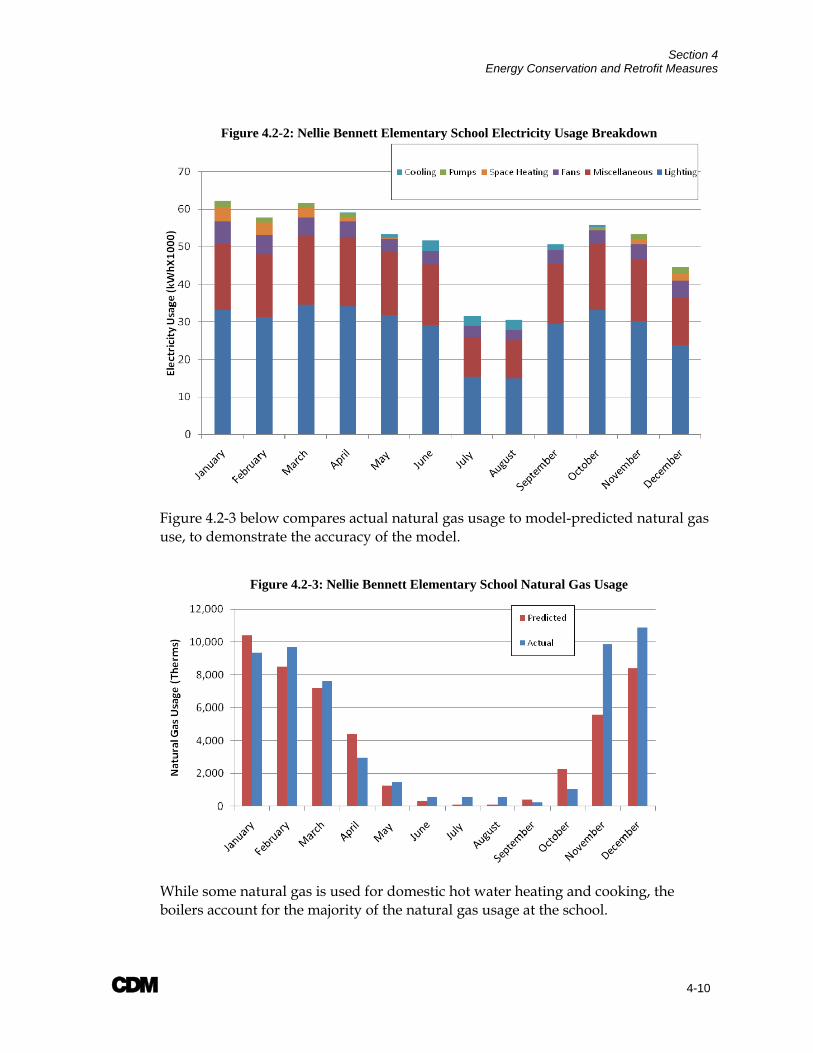
Section 4 Energy Conservation and Retrofit Measures
A 4-10
Figure 4.2-2: Nellie Bennett Elementary School Electricity Usage Breakdown
Figure 4.2-3 below compares actual natural gas usage to model-predicted natural gas use, to demonstrate the accuracy of the model.
Figure 4.2-3: Nellie Bennett Elementary School Natural Gas Usage
While some natural gas is used for domestic hot water heating and cooking, the boilers account for the majority of the natural gas usage at the school.
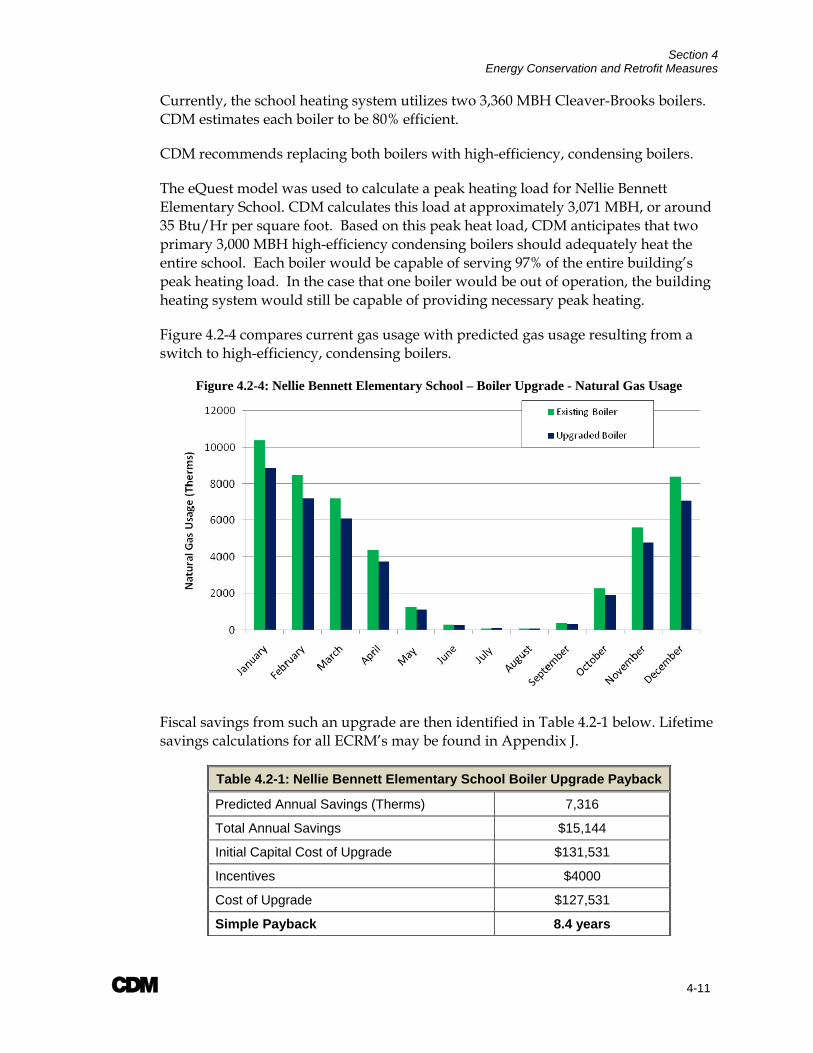
Section 4 Energy Conservation and Retrofit Measures
A 4-11
Currently, the school heating system utilizes two 3,360 MBH Cleaver-Brooks boilers. CDM estimates each boiler to be 80% efficient.
CDM recommends replacing both boilers with high-efficiency, condensing boilers.
The eQuest model was used to calculate a peak heating load for Nellie Bennett Elementary School. CDM calculates this load at approximately 3,071 MBH, or around 35 Btu/Hr per square foot. Based on this peak heat load, CDM anticipates that two primary 3,000 MBH high-efficiency condensing boilers should adequately heat the entire school. Each boiler would be capable of serving 97% of the entire building’s peak heating load. In the case that one boiler would be out of operation, the building heating system would still be capable of providing necessary peak heating.
Figure 4.2-4 compares current gas usage with predicted gas usage resulting from a switch to high-efficiency, condensing boilers.
Figure 4.2-4: Nellie Bennett Elementary School – Boiler Upgrade - Natural Gas Usage
Fiscal savings from such an upgrade are then identified in Table 4.2-1 below. Lifetime savings calculations for all ECRM’s may be found in Appendix J.
Table 4.2-1: Nellie Bennett Elementary School Boiler Upgrade Payback
Predicted Annual Savings (Therms) 7,316
Total Annual Savings $15,144
Initial Capital Cost of Upgrade $131,531
Incentives $4000
Cost of Upgrade $127,531
Simple Payback 8.4 years
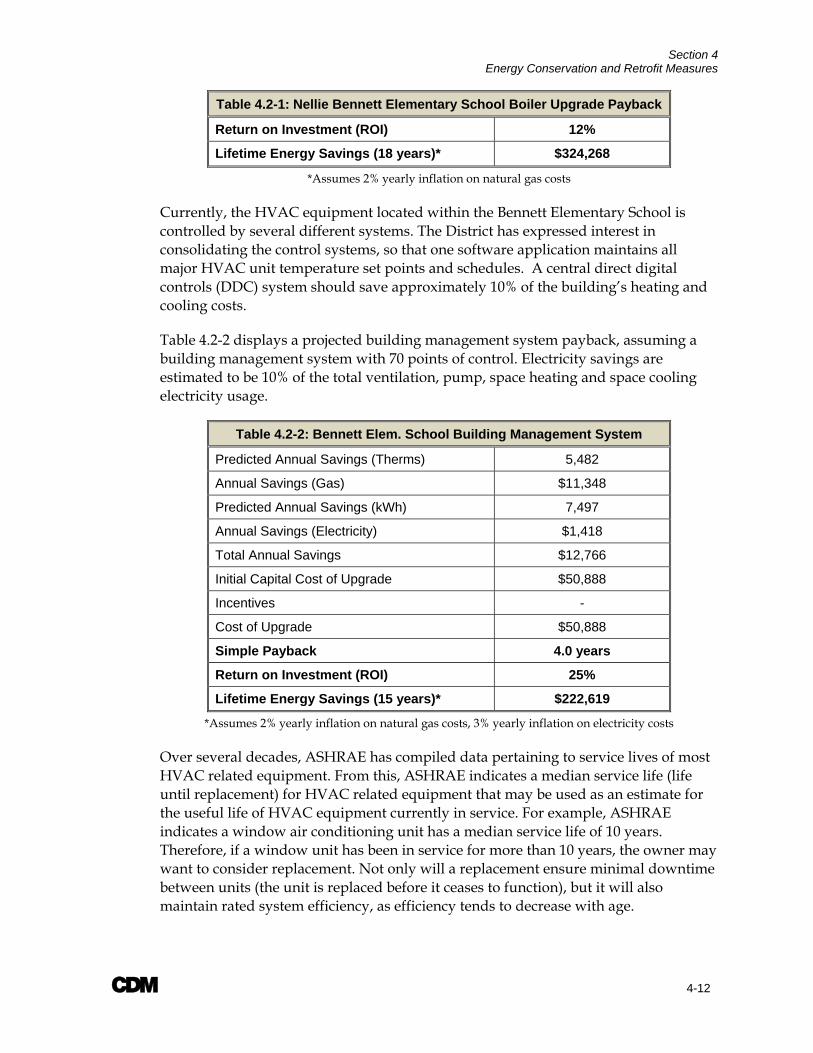
Section 4 Energy Conservation and Retrofit Measures
A 4-12
Table 4.2-1: Nellie Bennett Elementary School Boiler Upgrade Payback
Return on Investment (ROI) 12%
Lifetime Energy Savings (18 years)* $324,268
*Assumes 2% yearly inflation on natural gas costs
Currently, the HVAC equipment located within the Bennett Elementary School is controlled by several different systems. The District has expressed interest in consolidating the control systems, so that one software application maintains all major HVAC unit temperature set points and schedules. A central direct digital controls (DDC) system should save approximately 10% of the building’s heating and cooling costs.
Table 4.2-2 displays a projected building management system payback, assuming a building management system with 70 points of control. Electricity savings are estimated to be 10% of the total ventilation, pump, space heating and space cooling electricity usage.
Table 4.2-2: Bennett Elem. School Building Management System
Predicted Annual Savings (Therms) 5,482
Annual Savings (Gas) $11,348
Predicted Annual Savings (kWh) 7,497
Annual Savings (Electricity) $1,418
Total Annual Savings $12,766
Initial Capital Cost of Upgrade $50,888
Incentives -
Cost of Upgrade $50,888
Simple Payback 4.0 years
Return on Investment (ROI) 25%
Lifetime Energy Savings (15 years)* $222,619
*Assumes 2% yearly inflation on natural gas costs, 3% yearly inflation on electricity costs
Over several decades, ASHRAE has compiled data pertaining to service lives of most HVAC related equipment. From this, ASHRAE indicates a median service life (life until replacement) for HVAC related equipment that may be used as an estimate for the useful life of HVAC equipment currently in service. For example, ASHRAE indicates a window air conditioning unit has a median service life of 10 years. Therefore, if a window unit has been in service for more than 10 years, the owner may want to consider replacement. Not only will a replacement ensure minimal downtime between units (the unit is replaced before it ceases to function), but it will also maintain rated system efficiency, as efficiency tends to decrease with age.
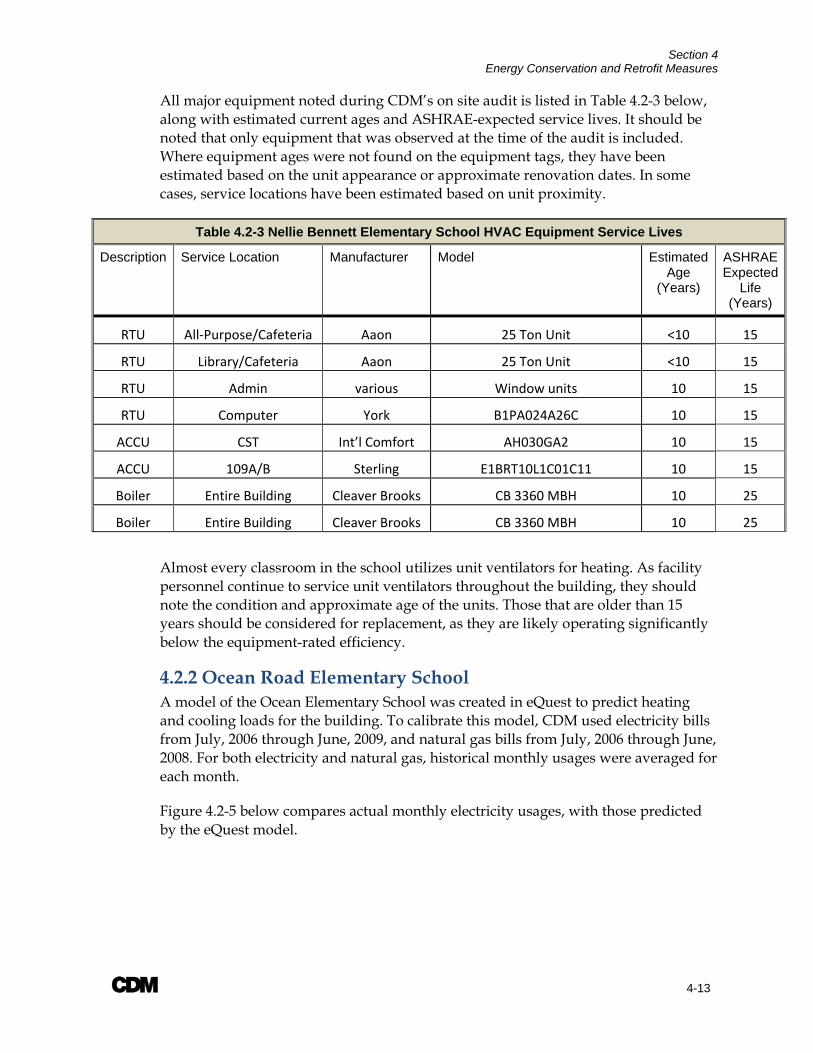
Section 4 Energy Conservation and Retrofit Measures
A 4-13
All major equipment noted during CDM’s on site audit is listed in Table 4.2-3 below, along with estimated current ages and ASHRAE-expected service lives. It should be noted that only equipment that was observed at the time of the audit is included. Where equipment ages were not found on the equipment tags, they have been estimated based on the unit appearance or approximate renovation dates. In some cases, service locations have been estimated based on unit proximity.
Table 4.2-3 Nellie Bennett Elementary School HVAC Equipment Service Lives
Description Service Location Manufacturer Model Estimated Age
(Years)
ASHRAE Expected
Life (Years)
RTU All‐Purpose/Cafeteria Aaon 25 Ton Unit <10 15
RTU Library/Cafeteria Aaon 25 Ton Unit <10 15
RTU Admin various Window units 10 15
RTU Computer York B1PA024A26C 10 15
ACCU CST Int’l Comfort AH030GA2 10 15
ACCU 109A/B Sterling E1BRT10L1C01C11 10 15
Boiler Entire Building Cleaver Brooks CB 3360 MBH 10 25
Boiler Entire Building Cleaver Brooks CB 3360 MBH 10 25
Almost every classroom in the school utilizes unit ventilators for heating. As facility personnel continue to service unit ventilators throughout the building, they should note the condition and approximate age of the units. Those that are older than 15 years should be considered for replacement, as they are likely operating significantly below the equipment-rated efficiency.
4.2.2 Ocean Road Elementary School A model of the Ocean Elementary School was created in eQuest to predict heating and cooling loads for the building. To calibrate this model, CDM used electricity bills from July, 2006 through June, 2009, and natural gas bills from July, 2006 through June, 2008. For both electricity and natural gas, historical monthly usages were averaged for each month.
Figure 4.2-5 below compares actual monthly electricity usages, with those predicted by the eQuest model.
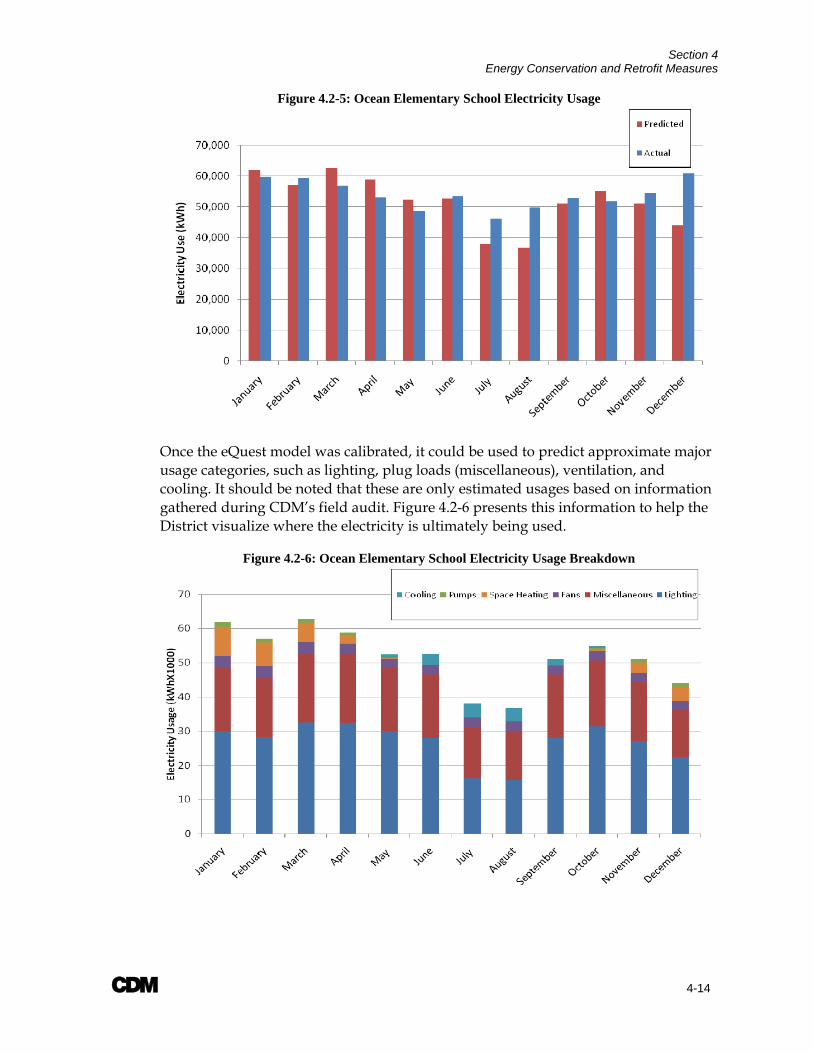
Section 4 Energy Conservation and Retrofit Measures
A 4-14
Figure 4.2-5: Ocean Elementary School Electricity Usage
Once the eQuest model was calibrated, it could be used to predict approximate major usage categories, such as lighting, plug loads (miscellaneous), ventilation, and cooling. It should be noted that these are only estimated usages based on information gathered during CDM’s field audit. Figure 4.2-6 presents this information to help the District visualize where the electricity is ultimately being used.
Figure 4.2-6: Ocean Elementary School Electricity Usage Breakdown
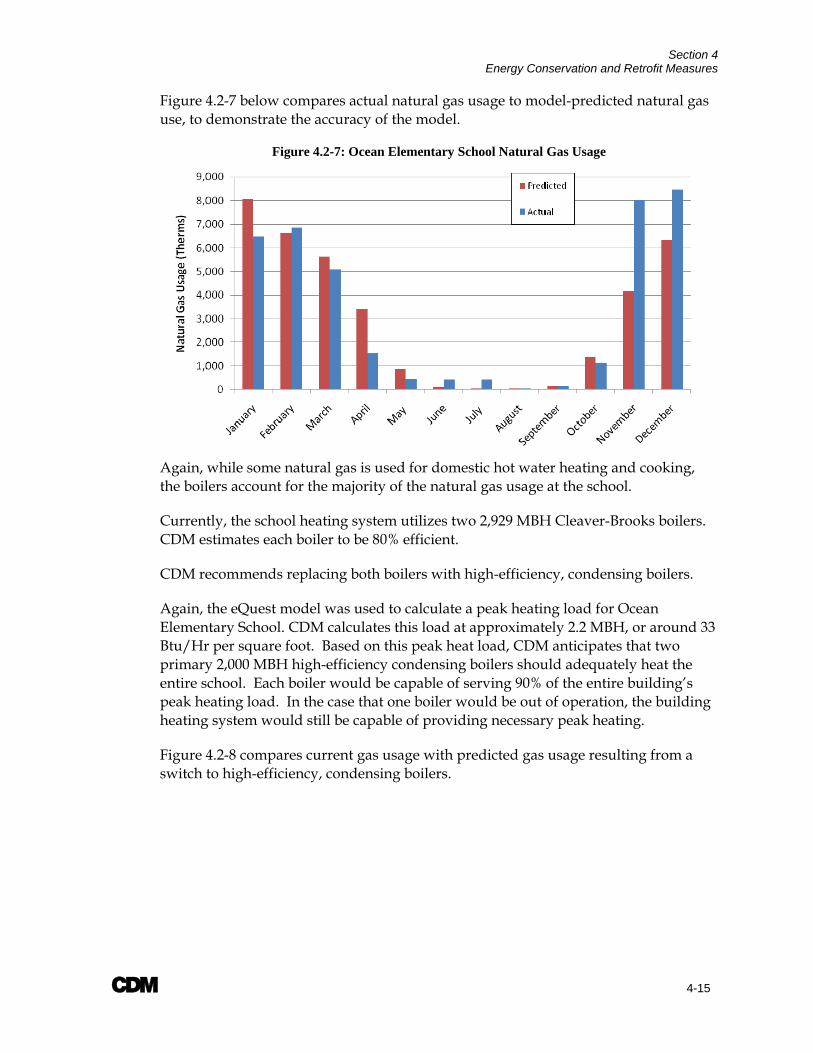
Section 4 Energy Conservation and Retrofit Measures
A 4-15
Figure 4.2-7 below compares actual natural gas usage to model-predicted natural gas use, to demonstrate the accuracy of the model.
Figure 4.2-7: Ocean Elementary School Natural Gas Usage
Again, while some natural gas is used for domestic hot water heating and cooking, the boilers account for the majority of the natural gas usage at the school.
Currently, the school heating system utilizes two 2,929 MBH Cleaver-Brooks boilers. CDM estimates each boiler to be 80% efficient.
CDM recommends replacing both boilers with high-efficiency, condensing boilers.
Again, the eQuest model was used to calculate a peak heating load for Ocean Elementary School. CDM calculates this load at approximately 2.2 MBH, or around 33 Btu/Hr per square foot. Based on this peak heat load, CDM anticipates that two primary 2,000 MBH high-efficiency condensing boilers should adequately heat the entire school. Each boiler would be capable of serving 90% of the entire building’s peak heating load. In the case that one boiler would be out of operation, the building heating system would still be capable of providing necessary peak heating.
Figure 4.2-8 compares current gas usage with predicted gas usage resulting from a switch to high-efficiency, condensing boilers.
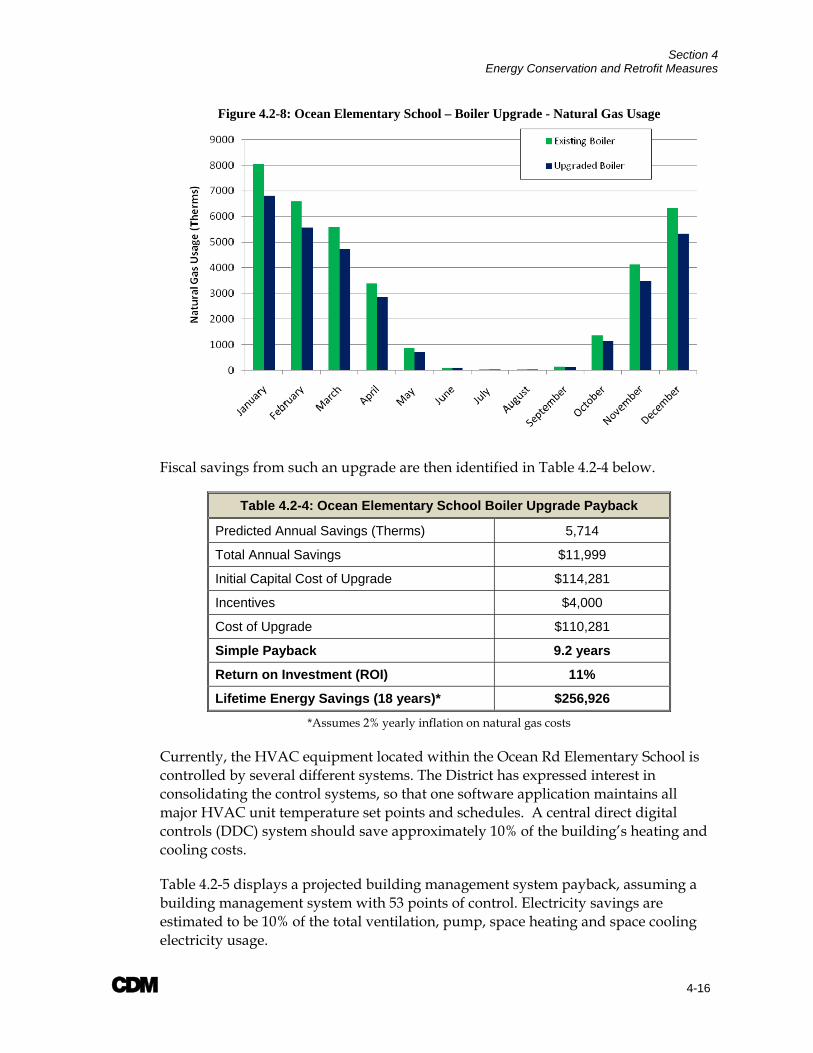
Section 4 Energy Conservation and Retrofit Measures
A 4-16
Figure 4.2-8: Ocean Elementary School – Boiler Upgrade - Natural Gas Usage
Fiscal savings from such an upgrade are then identified in Table 4.2-4 below.
Table 4.2-4: Ocean Elementary School Boiler Upgrade Payback
Predicted Annual Savings (Therms) 5,714
Total Annual Savings $11,999
Initial Capital Cost of Upgrade $114,281
Incentives $4,000
Cost of Upgrade $110,281
Simple Payback 9.2 years
Return on Investment (ROI) 11%
Lifetime Energy Savings (18 years)* $256,926
*Assumes 2% yearly inflation on natural gas costs
Currently, the HVAC equipment located within the Ocean Rd Elementary School is controlled by several different systems. The District has expressed interest in consolidating the control systems, so that one software application maintains all major HVAC unit temperature set points and schedules. A central direct digital controls (DDC) system should save approximately 10% of the building’s heating and cooling costs.
Table 4.2-5 displays a projected building management system payback, assuming a building management system with 53 points of control. Electricity savings are estimated to be 10% of the total ventilation, pump, space heating and space cooling electricity usage.
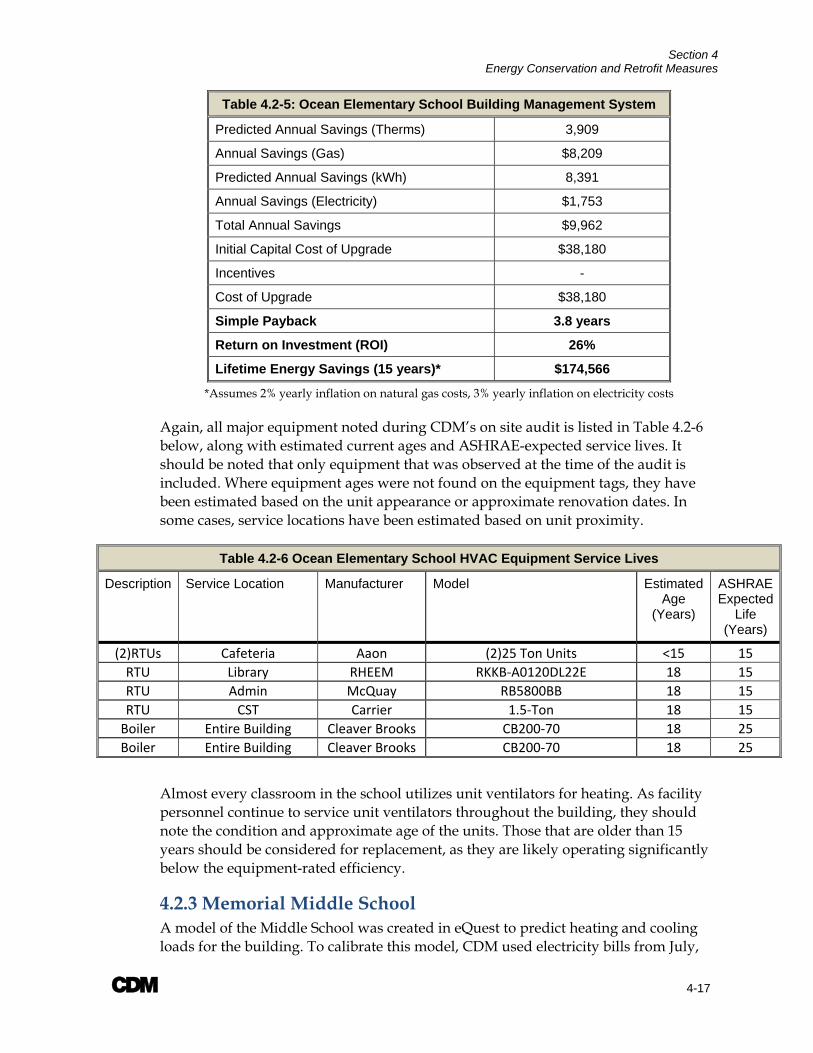
Section 4 Energy Conservation and Retrofit Measures
A 4-17
Table 4.2-5: Ocean Elementary School Building Management System
Predicted Annual Savings (Therms) 3,909
Annual Savings (Gas) $8,209
Predicted Annual Savings (kWh) 8,391
Annual Savings (Electricity) $1,753
Total Annual Savings $9,962
Initial Capital Cost of Upgrade $38,180
Incentives -
Cost of Upgrade $38,180
Simple Payback 3.8 years
Return on Investment (ROI) 26%
Lifetime Energy Savings (15 years)* $174,566
*Assumes 2% yearly inflation on natural gas costs, 3% yearly inflation on electricity costs
Again, all major equipment noted during CDM’s on site audit is listed in Table 4.2-6 below, along with estimated current ages and ASHRAE-expected service lives. It should be noted that only equipment that was observed at the time of the audit is included. Where equipment ages were not found on the equipment tags, they have been estimated based on the unit appearance or approximate renovation dates. In some cases, service locations have been estimated based on unit proximity.
Table 4.2-6 Ocean Elementary School HVAC Equipment Service Lives
Description Service Location Manufacturer Model Estimated Age
(Years)
ASHRAE Expected
Life (Years)
(2)RTUs Cafeteria Aaon (2)25 Ton Units <15 15 RTU Library RHEEM RKKB‐A0120DL22E 18 15 RTU Admin McQuay RB5800BB 18 15 RTU CST Carrier 1.5‐Ton 18 15 Boiler Entire Building Cleaver Brooks CB200‐70 18 25 Boiler Entire Building Cleaver Brooks CB200‐70 18 25
Almost every classroom in the school utilizes unit ventilators for heating. As facility personnel continue to service unit ventilators throughout the building, they should note the condition and approximate age of the units. Those that are older than 15 years should be considered for replacement, as they are likely operating significantly below the equipment-rated efficiency.
4.2.3 Memorial Middle School A model of the Middle School was created in eQuest to predict heating and cooling loads for the building. To calibrate this model, CDM used electricity bills from July,
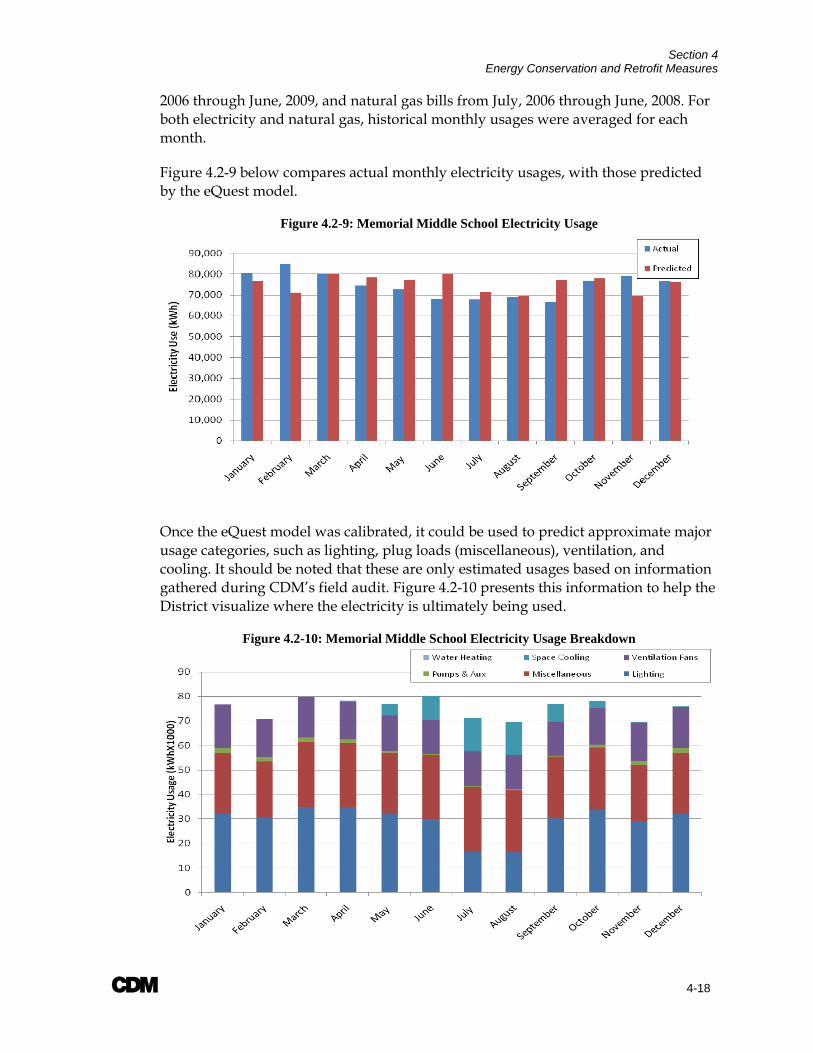
Section 4 Energy Conservation and Retrofit Measures
A 4-18
2006 through June, 2009, and natural gas bills from July, 2006 through June, 2008. For both electricity and natural gas, historical monthly usages were averaged for each month.
Figure 4.2-9 below compares actual monthly electricity usages, with those predicted by the eQuest model.
Figure 4.2-9: Memorial Middle School Electricity Usage
Once the eQuest model was calibrated, it could be used to predict approximate major usage categories, such as lighting, plug loads (miscellaneous), ventilation, and cooling. It should be noted that these are only estimated usages based on information gathered during CDM’s field audit. Figure 4.2-10 presents this information to help the District visualize where the electricity is ultimately being used.
Figure 4.2-10: Memorial Middle School Electricity Usage Breakdown
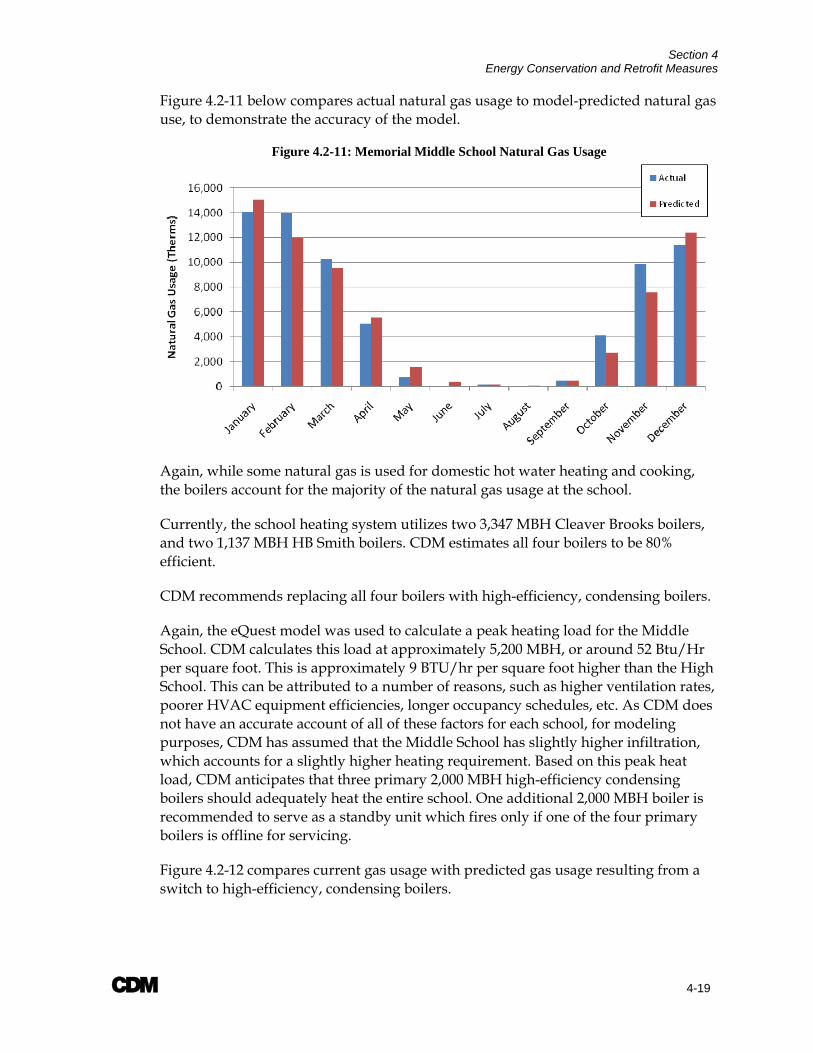
Section 4 Energy Conservation and Retrofit Measures
A 4-19
Figure 4.2-11 below compares actual natural gas usage to model-predicted natural gas use, to demonstrate the accuracy of the model.
Figure 4.2-11: Memorial Middle School Natural Gas Usage
Again, while some natural gas is used for domestic hot water heating and cooking, the boilers account for the majority of the natural gas usage at the school.
Currently, the school heating system utilizes two 3,347 MBH Cleaver Brooks boilers, and two 1,137 MBH HB Smith boilers. CDM estimates all four boilers to be 80% efficient.
CDM recommends replacing all four boilers with high-efficiency, condensing boilers.
Again, the eQuest model was used to calculate a peak heating load for the Middle School. CDM calculates this load at approximately 5,200 MBH, or around 52 Btu/Hr per square foot. This is approximately 9 BTU/hr per square foot higher than the High School. This can be attributed to a number of reasons, such as higher ventilation rates, poorer HVAC equipment efficiencies, longer occupancy schedules, etc. As CDM does not have an accurate account of all of these factors for each school, for modeling purposes, CDM has assumed that the Middle School has slightly higher infiltration, which accounts for a slightly higher heating requirement. Based on this peak heat load, CDM anticipates that three primary 2,000 MBH high-efficiency condensing boilers should adequately heat the entire school. One additional 2,000 MBH boiler is recommended to serve as a standby unit which fires only if one of the four primary boilers is offline for servicing.
Figure 4.2-12 compares current gas usage with predicted gas usage resulting from a switch to high-efficiency, condensing boilers.
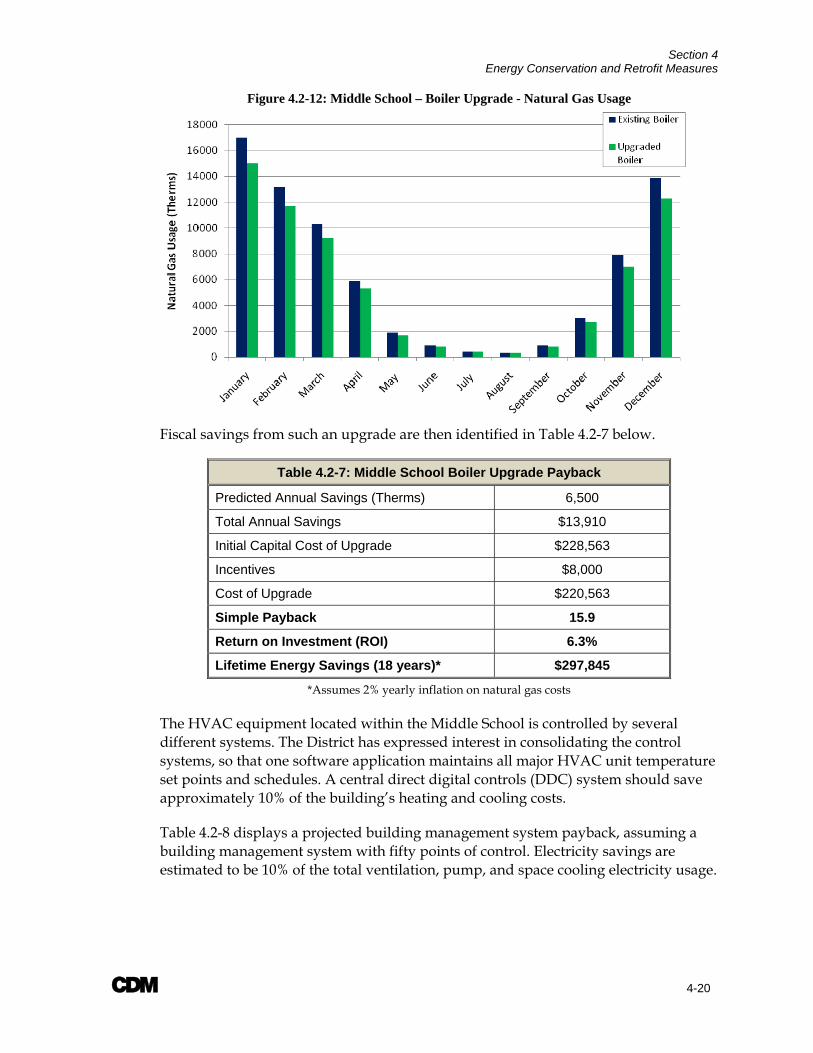
Section 4 Energy Conservation and Retrofit Measures
A 4-20
Figure 4.2-12: Middle School – Boiler Upgrade - Natural Gas Usage
Fiscal savings from such an upgrade are then identified in Table 4.2-7 below.
Table 4.2-7: Middle School Boiler Upgrade Payback
Predicted Annual Savings (Therms) 6,500
Total Annual Savings $13,910
Initial Capital Cost of Upgrade $228,563
Incentives $8,000
Cost of Upgrade $220,563
Simple Payback 15.9
Return on Investment (ROI) 6.3%
Lifetime Energy Savings (18 years)* $297,845
*Assumes 2% yearly inflation on natural gas costs
The HVAC equipment located within the Middle School is controlled by several different systems. The District has expressed interest in consolidating the control systems, so that one software application maintains all major HVAC unit temperature set points and schedules. A central direct digital controls (DDC) system should save approximately 10% of the building’s heating and cooling costs.
Table 4.2-8 displays a projected building management system payback, assuming a building management system with fifty points of control. Electricity savings are estimated to be 10% of the total ventilation, pump, and space cooling electricity usage.
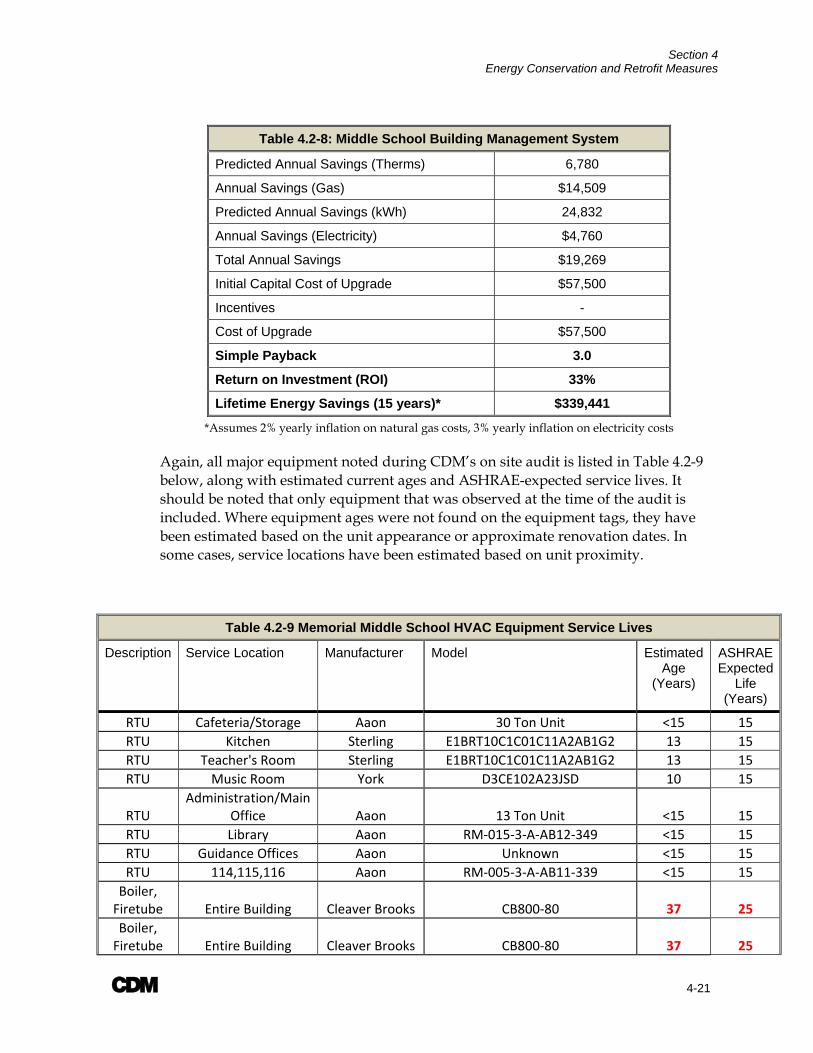
Section 4 Energy Conservation and Retrofit Measures
A 4-21
Table 4.2-8: Middle School Building Management System
Predicted Annual Savings (Therms) 6,780
Annual Savings (Gas) $14,509
Predicted Annual Savings (kWh) 24,832
Annual Savings (Electricity) $4,760
Total Annual Savings $19,269
Initial Capital Cost of Upgrade $57,500
Incentives -
Cost of Upgrade $57,500
Simple Payback 3.0
Return on Investment (ROI) 33%
Lifetime Energy Savings (15 years)* $339,441
*Assumes 2% yearly inflation on natural gas costs, 3% yearly inflation on electricity costs
Again, all major equipment noted during CDM’s on site audit is listed in Table 4.2-9 below, along with estimated current ages and ASHRAE-expected service lives. It should be noted that only equipment that was observed at the time of the audit is included. Where equipment ages were not found on the equipment tags, they have been estimated based on the unit appearance or approximate renovation dates. In some cases, service locations have been estimated based on unit proximity.
Table 4.2-9 Memorial Middle School HVAC Equipment Service Lives
Description Service Location Manufacturer Model Estimated Age
(Years)
ASHRAE Expected
Life (Years)
RTU Cafeteria/Storage Aaon 30 Ton Unit <15 15 RTU Kitchen Sterling E1BRT10C1C01C11A2AB1G2 13 15 RTU Teacher's Room Sterling E1BRT10C1C01C11A2AB1G2 13 15 RTU Music Room York D3CE102A23JSD 10 15
RTU Administration/Main
Office Aaon 13 Ton Unit <15 15 RTU Library Aaon RM‐015‐3‐A‐AB12‐349 <15 15 RTU Guidance Offices Aaon Unknown <15 15 RTU 114,115,116 Aaon RM‐005‐3‐A‐AB11‐339 <15 15 Boiler, Firetube Entire Building Cleaver Brooks CB800‐80 37 25 Boiler, Firetube Entire Building Cleaver Brooks CB800‐80 37 25

Section 4 Energy Conservation and Retrofit Measures
A 4-22
Table 4.2-9 Memorial Middle School HVAC Equipment Service Lives Boiler, Cast Iron Entire Building HB Smith 19A‐W‐07 <30 30 Boiler, Cast Iron Entire Building HB Smith 19A‐W‐07 <30 30
Almost every classroom in the school utilizes unit ventilators for heating. As facility personnel continue to service unit ventilators throughout the building, they should note the condition and approximate age of the units. Those that are older than 15 years should be considered for replacement, as they are likely operating significantly below the equipment-rated efficiency.
4.2.4 Point Pleasant High School A model of the High School was created in eQuest to predict heating and cooling loads for the building. To calibrate this model, CDM used electricity bills from July, 2007 through June, 2009, and natural gas bills from July, 2007 through June, 2008. For both electricity and natural gas, historical monthly usages were averaged for each month.
Figure 4.2-13 below compares actual monthly electricity usages, with those predicted by the eQuest model.
Figure 4.2-13: Point Pleasant High School Electricity Usage
Once the eQuest model was calibrated, it could be used to predict approximate major usage categories, such as lighting, plug loads (miscellaneous), ventilation, and cooling. It should be noted that these are only estimated usages based on information gathered during CDM’s field audit. Figure 4.2-14 presents this information to help the District visualize where the electricity is ultimately being used.
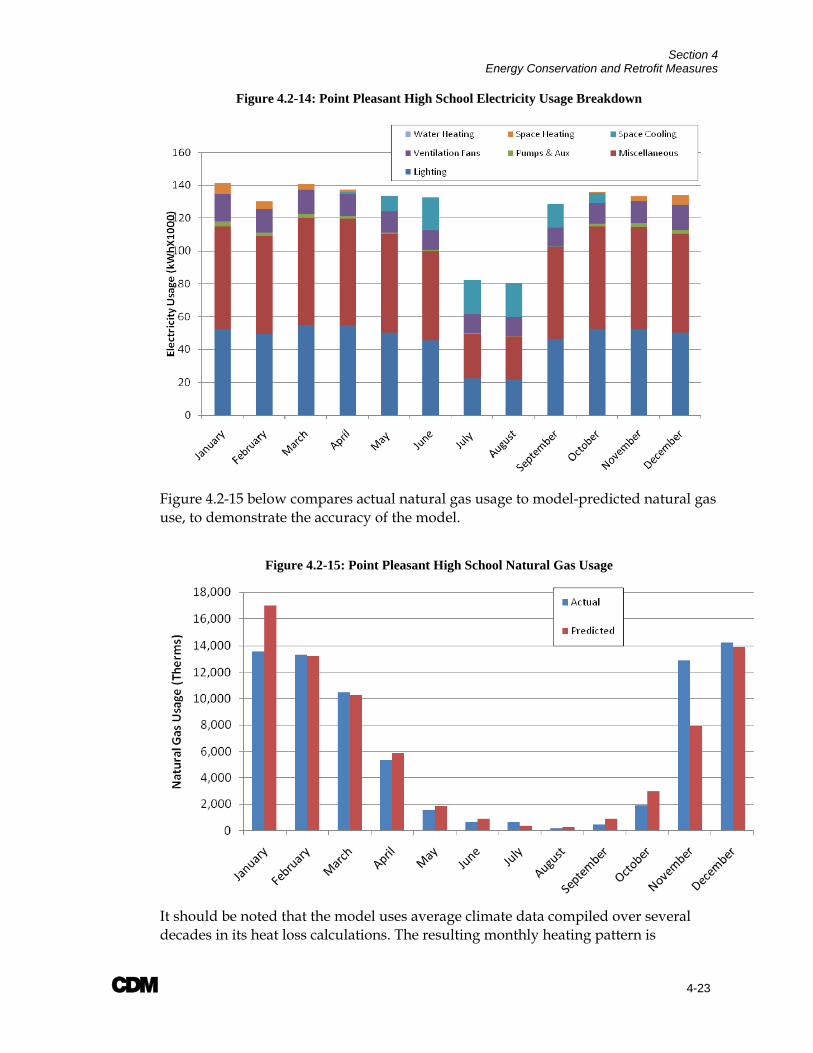
Section 4 Energy Conservation and Retrofit Measures
A 4-23
Figure 4.2-14: Point Pleasant High School Electricity Usage Breakdown
Figure 4.2-15 below compares actual natural gas usage to model-predicted natural gas use, to demonstrate the accuracy of the model.
Figure 4.2-15: Point Pleasant High School Natural Gas Usage
It should be noted that the model uses average climate data compiled over several decades in its heat loss calculations. The resulting monthly heating pattern is
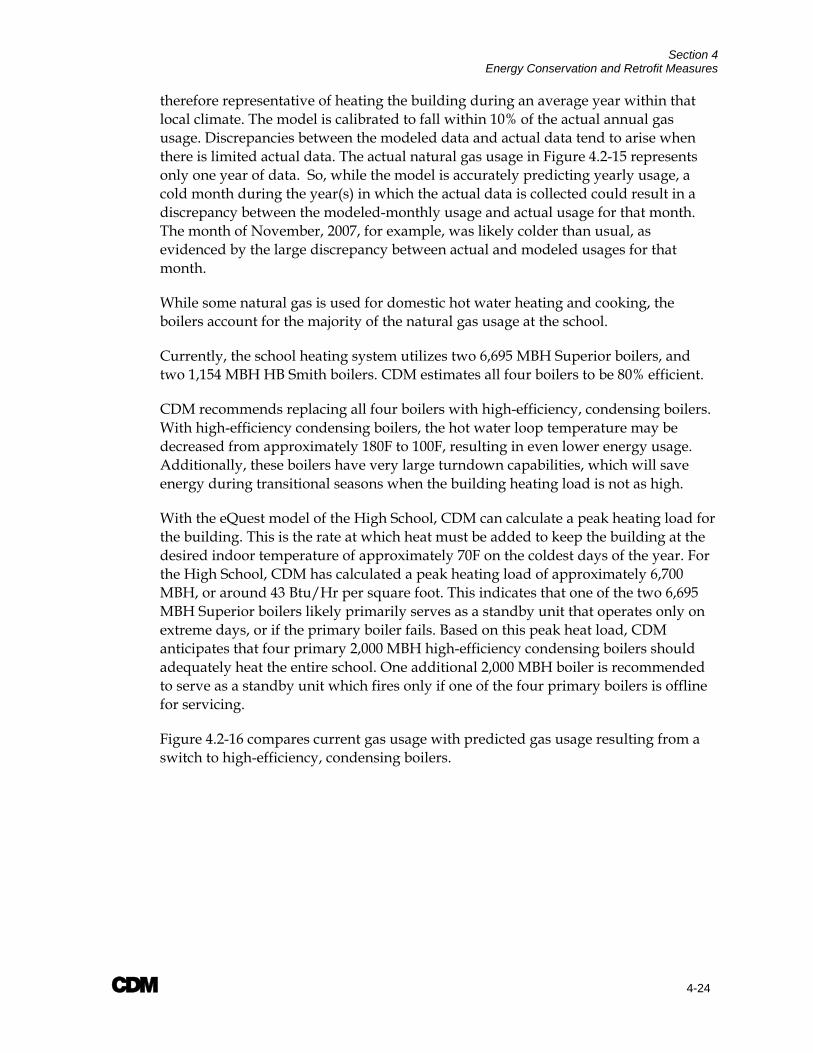
Section 4 Energy Conservation and Retrofit Measures
A 4-24
therefore representative of heating the building during an average year within that local climate. The model is calibrated to fall within 10% of the actual annual gas usage. Discrepancies between the modeled data and actual data tend to arise when there is limited actual data. The actual natural gas usage in Figure 4.2-15 represents only one year of data. So, while the model is accurately predicting yearly usage, a cold month during the year(s) in which the actual data is collected could result in a discrepancy between the modeled-monthly usage and actual usage for that month. The month of November, 2007, for example, was likely colder than usual, as evidenced by the large discrepancy between actual and modeled usages for that month.
While some natural gas is used for domestic hot water heating and cooking, the boilers account for the majority of the natural gas usage at the school.
Currently, the school heating system utilizes two 6,695 MBH Superior boilers, and two 1,154 MBH HB Smith boilers. CDM estimates all four boilers to be 80% efficient.
CDM recommends replacing all four boilers with high-efficiency, condensing boilers. With high-efficiency condensing boilers, the hot water loop temperature may be decreased from approximately 180F to 100F, resulting in even lower energy usage. Additionally, these boilers have very large turndown capabilities, which will save energy during transitional seasons when the building heating load is not as high.
With the eQuest model of the High School, CDM can calculate a peak heating load for the building. This is the rate at which heat must be added to keep the building at the desired indoor temperature of approximately 70F on the coldest days of the year. For the High School, CDM has calculated a peak heating load of approximately 6,700 MBH, or around 43 Btu/Hr per square foot. This indicates that one of the two 6,695 MBH Superior boilers likely primarily serves as a standby unit that operates only on extreme days, or if the primary boiler fails. Based on this peak heat load, CDM anticipates that four primary 2,000 MBH high-efficiency condensing boilers should adequately heat the entire school. One additional 2,000 MBH boiler is recommended to serve as a standby unit which fires only if one of the four primary boilers is offline for servicing.
Figure 4.2-16 compares current gas usage with predicted gas usage resulting from a switch to high-efficiency, condensing boilers.
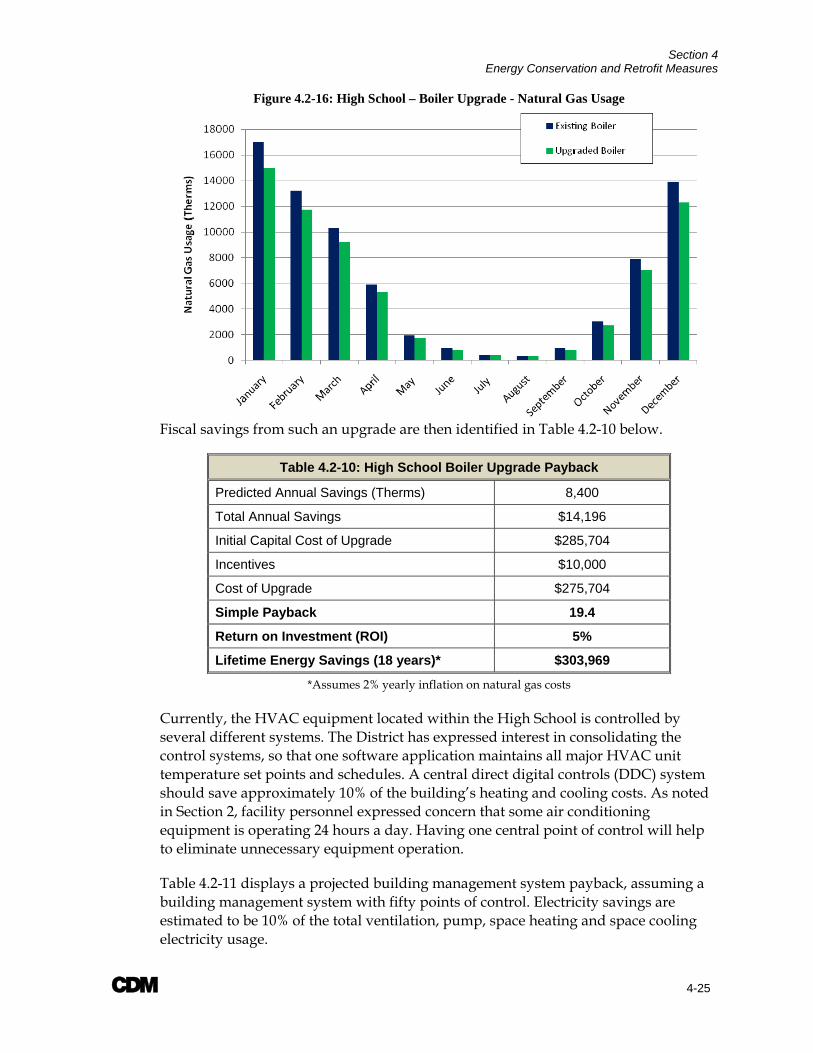
Section 4 Energy Conservation and Retrofit Measures
A 4-25
Figure 4.2-16: High School – Boiler Upgrade - Natural Gas Usage
Fiscal savings from such an upgrade are then identified in Table 4.2-10 below.
Table 4.2-10: High School Boiler Upgrade Payback
Predicted Annual Savings (Therms) 8,400
Total Annual Savings $14,196
Initial Capital Cost of Upgrade $285,704
Incentives $10,000
Cost of Upgrade $275,704
Simple Payback 19.4
Return on Investment (ROI) 5%
Lifetime Energy Savings (18 years)* $303,969
*Assumes 2% yearly inflation on natural gas costs
Currently, the HVAC equipment located within the High School is controlled by several different systems. The District has expressed interest in consolidating the control systems, so that one software application maintains all major HVAC unit temperature set points and schedules. A central direct digital controls (DDC) system should save approximately 10% of the building’s heating and cooling costs. As noted in Section 2, facility personnel expressed concern that some air conditioning equipment is operating 24 hours a day. Having one central point of control will help to eliminate unnecessary equipment operation.
Table 4.2-11 displays a projected building management system payback, assuming a building management system with fifty points of control. Electricity savings are estimated to be 10% of the total ventilation, pump, space heating and space cooling electricity usage.
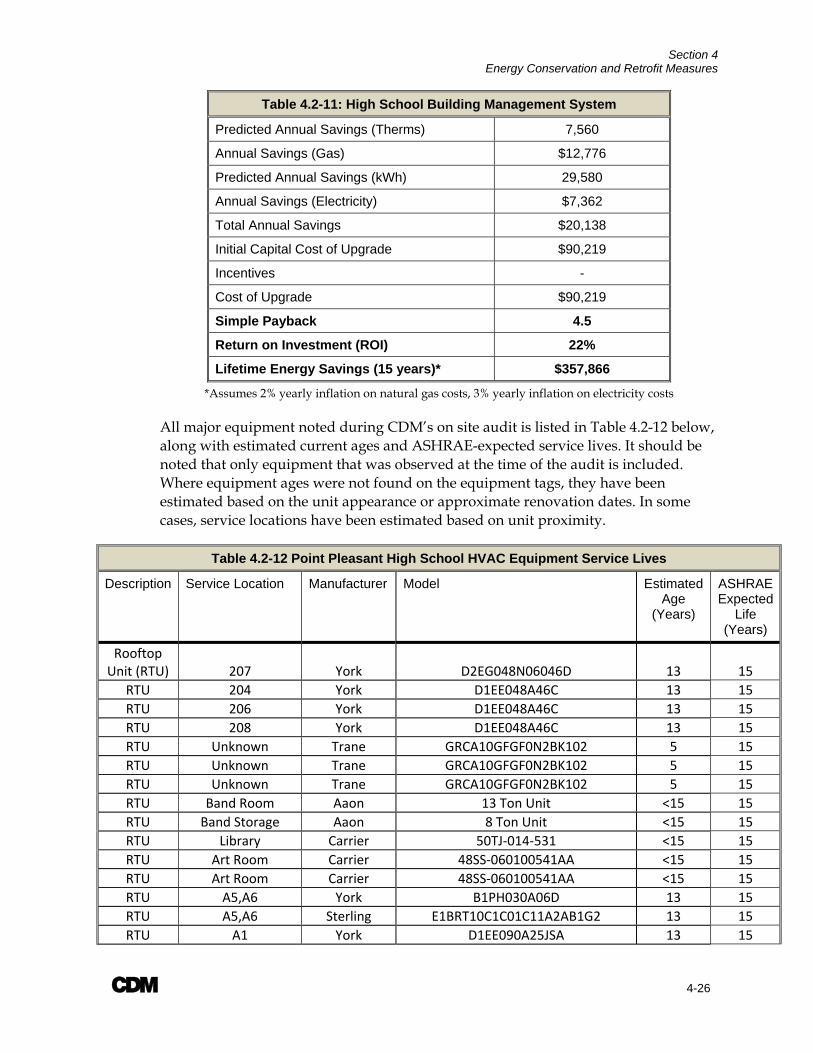
Section 4 Energy Conservation and Retrofit Measures
A 4-26
Table 4.2-11: High School Building Management System
Predicted Annual Savings (Therms) 7,560
Annual Savings (Gas) $12,776
Predicted Annual Savings (kWh) 29,580
Annual Savings (Electricity) $7,362
Total Annual Savings $20,138
Initial Capital Cost of Upgrade $90,219
Incentives -
Cost of Upgrade $90,219
Simple Payback 4.5
Return on Investment (ROI) 22%
Lifetime Energy Savings (15 years)* $357,866
*Assumes 2% yearly inflation on natural gas costs, 3% yearly inflation on electricity costs
All major equipment noted during CDM’s on site audit is listed in Table 4.2-12 below, along with estimated current ages and ASHRAE-expected service lives. It should be noted that only equipment that was observed at the time of the audit is included. Where equipment ages were not found on the equipment tags, they have been estimated based on the unit appearance or approximate renovation dates. In some cases, service locations have been estimated based on unit proximity.
Table 4.2-12 Point Pleasant High School HVAC Equipment Service Lives
Description Service Location Manufacturer Model Estimated Age
(Years)
ASHRAE Expected
Life (Years)
Rooftop Unit (RTU) 207 York D2EG048N06046D 13 15
RTU 204 York D1EE048A46C 13 15 RTU 206 York D1EE048A46C 13 15 RTU 208 York D1EE048A46C 13 15 RTU Unknown Trane GRCA10GFGF0N2BK102 5 15 RTU Unknown Trane GRCA10GFGF0N2BK102 5 15 RTU Unknown Trane GRCA10GFGF0N2BK102 5 15 RTU Band Room Aaon 13 Ton Unit <15 15 RTU Band Storage Aaon 8 Ton Unit <15 15 RTU Library Carrier 50TJ‐014‐531 <15 15 RTU Art Room Carrier 48SS‐060100541AA <15 15 RTU Art Room Carrier 48SS‐060100541AA <15 15 RTU A5,A6 York B1PH030A06D 13 15 RTU A5,A6 Sterling E1BRT10C1C01C11A2AB1G2 13 15 RTU A1 York D1EE090A25JSA 13 15

Section 4 Energy Conservation and Retrofit Measures
A 4-27
Table 4.2-12 Point Pleasant High School HVAC Equipment Service Lives RTU Health Room York D2NA060N09046C <15 15 RTU Auxiliary Gym York D2NA060N09046C <15 15 RTU Auxiliary Gym York D2NA060N09046C <15 15 RTU Nurse's Office York B1PH030A06D 13 15 RTU Trainer's Office Trane Unknown <15 15 RTU Main Office Trane 4TCC3030A1000AA 13 15 RTU Main Office York B3CH060A25C <15 15 RTU A9 Carrier 505X‐048‐511AA <15 15 RTU A10 Carrier 505X‐048‐511AA <15 15
RTU Music/Performing
Arts Rooms Nesbitt RMA100G2RS3007BB07A470000B001 <10 15
RTU Performing
Arts/Band Room Sterling E1BRT10C1C01C11A2AB1G2 <15 15 RTU Auditorium York H2CA360A46B <15 15 RTU Auditorium York H2CA360A46B <15 15 Boiler, Firetube Entire Building Superior Unknown (200 HP) 47 25 Boiler, Firetube Entire Building Superior Unknown (200 HP) 47 25 Boiler, Cast Iron Entire Building Smith 28A‐W‐04 <30 30 Boiler, Cast Iron Entire Building Smith 28A‐W‐04 <30 30
Additionally, almost every classroom in the school utilizes unit ventilators for heating. While CDM did not have the capacity to inspect each unit ventilator for age, it should be noted that a typical unit ventilator service life is approximately 15 years. Therefore, as facility personnel continue to service unit ventilators throughout the building, they should note the condition and approximate age of the units. Those that are older than 15 years should be considered for replacement, as they are likely operating significantly below the equipment-rated efficiency.
4.2.5 Administration Building A model of the Administration Building was created in eQuest to predict heating and cooling loads for the building. To calibrate this model, CDM used electricity bills from July, 2006 through June, 2009, and natural gas bills from July, 2006 through June, 2008. For both electricity and natural gas, historical monthly usages were averaged for each month.
Figure 4.2-17 below compares actual monthly electricity usages, with those predicted by the eQuest model.

Section 4 Energy Conservation and Retrofit Measures
A 4-28
Figure 4.2-17: Administration Building School Electricity Usage
Once the eQuest model was calibrated, it could be used to predict approximate major usage categories, such as lighting, plug loads (miscellaneous), ventilation, and cooling. It should be noted that these are only estimated usages based on information gathered during CDM’s field audit. Figure 4.2-18 presents this information to help the District visualize where the electricity is ultimately being used.
Figure 4.2-18: Administration Building Electricity Usage Breakdown
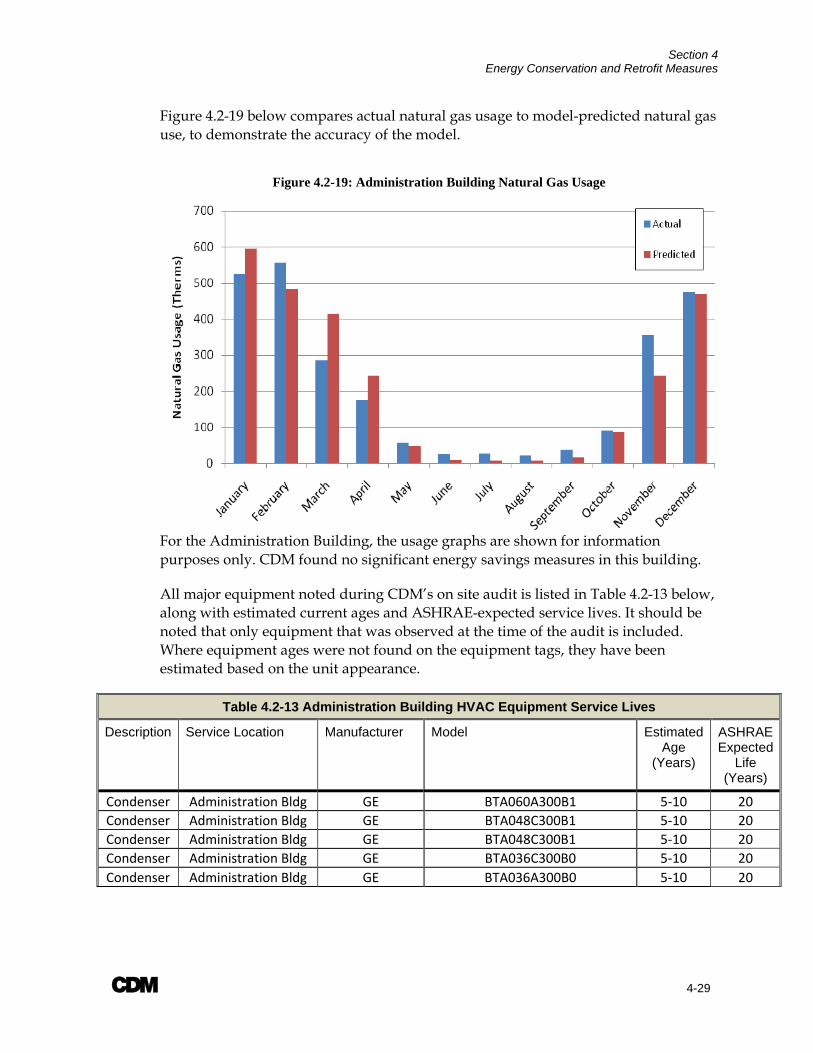
Section 4 Energy Conservation and Retrofit Measures
A 4-29
Figure 4.2-19 below compares actual natural gas usage to model-predicted natural gas use, to demonstrate the accuracy of the model.
Figure 4.2-19: Administration Building Natural Gas Usage
For the Administration Building, the usage graphs are shown for information purposes only. CDM found no significant energy savings measures in this building.
All major equipment noted during CDM’s on site audit is listed in Table 4.2-13 below, along with estimated current ages and ASHRAE-expected service lives. It should be noted that only equipment that was observed at the time of the audit is included. Where equipment ages were not found on the equipment tags, they have been estimated based on the unit appearance.
Table 4.2-13 Administration Building HVAC Equipment Service Lives
Description Service Location Manufacturer Model Estimated Age
(Years)
ASHRAE Expected
Life (Years)
Condenser Administration Bldg GE BTA060A300B1 5‐10 20 Condenser Administration Bldg GE BTA048C300B1 5‐10 20 Condenser Administration Bldg GE BTA048C300B1 5‐10 20 Condenser Administration Bldg GE BTA036C300B0 5‐10 20 Condenser Administration Bldg GE BTA036A300B0 5‐10 20
Section 4 Energy Conservation and Retrofit Measures
A 4-30
4.3 Alternative Energy Sources 4.3.1 Photovoltaic Solar Energy System Overview Photovoltaic (PV) cells convert energy in sunlight directly into electrical energy through the use of silicon semi conductors, diodes and collection grids. Several PV cells are then linked together in a single frame of module to become a solar panel. PV cells are able to convert the energy from the sun into electricity. The angle of inclination of the PV cells, the amount of sunlight available, the orientation of the panels, the amount of physical space available and the efficiency of the individual panels are all factors that affect the amount of electricity that is generated.
Based on the estimated cumulative total available roof area, calculations determine that the installation of four systems, with a total combined rating of approximately 1,525 kW (dc) will be appropriate for four school buildings.
As part of this energy audit, a preliminary engineering feasibility study of the sites outlined above to support solar generation facilities was completed consisting of the following tasks:
a. Site Visit by our engineers.
b. Satellite Image Analysis and Conceptual design and layout of the photovoltaic system
c. Design and construction cost estimates
d. Determine a preliminary design for the size and energy production of the solar system.
The total unobstructed available area of each section of the roof with southern exposure was evaluated. It is important to note the following:
1. The structural integrity of the roofs was not confirmed during our site visit. The schools may require some degree of roofing work prior to the implementation of a solar system.
2. In the case of the flat areas, the PV system sizing and kWh production was calculated assuming the installation of a crystalline module facing south direction (220 Degree Azimuth) and tilted approximately 20 degrees to allow better rain water shedding and snow melting. Please note that the kWh production as well as system size may differ significantly based on final panel tilt selected during the RFP and design phase.
3. Blended electric rates were used based on actual utility bills and were applied for each facility.
The following is a preliminary study on the feasibility of installing a PV solar system at the four school buildings to generate a portion of the each facility’s electricity

Section 4 Energy Conservation and Retrofit Measures
A 4-31
requirements. The system is designed to offset the electric purchased from the local utility and not as a backup or emergency source of power.
In order to determine the best location for the installation of the PV solar system, a satellite image analysis and site walkthrough of the school district buildings was performed on August 10th and 11th. As per the Scope of Work, only the building roofs were considered for PV installation.
Also, as part of our assessment we investigated possible locations for electrical equipment that need to be installed such as combiner boxes, disconnect switches and DC to AC inverters. Consideration was also given to locations of interconnection between the solar system and building’s electrical grid.
4.3.1.1 Nellie Bennett Elementary School The roof of the Nellie Bennett Elementary School has a flat roof with a number of obstructions such as exhaust fans, rooftop HVAC units, and electrical and gas piping. There is a minimal amount of shading on the roof from adjacent foliage that would need to be addressed during the design phase of the project. The structural integrity of the roof was not confirmed although a visual inspection revealed no leaks or major defects. The structural integrity of the roof and the existence of a warranty shall be confirmed prior to the implementation of a PV system.
The Project Team conducted both a facility walkthrough and a satellite image analysis and based on the estimated total available area we calculated the installation of a system rated at approximately 290 kW (dc).
Electrical Service The interconnection point for the PV system will require a modification or replacement of the existing service entrance equipment wherein the PV system feeder connections will have to be made after the main circuit breaker, and protective relaying will also have to be implemented. Preferably the inverter should be installed in close proximity to the service entrance equipment, but if there is no available space, the inverter shall be installed outside on a concrete pad in a weather proof enclosure. AC wiring would run from the inverters into the connection point(s) at the service entrance equipment. Any connection points would have to meet NEC and local utility requirements. Further investigation and verification of existing electrical equipment would be required prior to implementation of a PV system.
4.3.1.2 Ocean Road Elementary School The roof of the Ocean Road Elementary School has a flat roof with a number of obstructions such as exhaust fans, rooftop HVAC units, and electrical and gas piping. There is a minimal amount of shading on the roof from adjacent foliage that would need to be addressed during the design phase of the project. The structural integrity of the roof was not confirmed although a visual inspection revealed no leaks or major defects. The structural integrity of the roof and the existence of a warranty shall be confirmed prior to the implementation of a PV system.

Section 4 Energy Conservation and Retrofit Measures
A 4-32
The Project Team conducted both a facility walkthrough and a satellite image analysis and based on the estimated total available area we calculated the installation of a system rated at approximately 242 kW (dc).
Electrical Service The interconnection point for the PV system will require a modification or replacement of the existing service entrance equipment wherein the PV sysem feeder connections will have to be made after the main circuit breaker, and protective relaying will also have to be implemented. Preferably the inverter should be installed in close proximity to the service entrance equipment, but if there is no available space, the inverter shall be installed outside on a concrete pad in a weather proof enclosure. AC wiring would run from the inverters into the connection point(s) at the service entrance equipment. Any connection points would have to meet NEC and local utility requirements. Further investigation and verification of existing electrical equipment would be required prior to implementation of a PV system.
4.3.1.3 Memorial Middle School The roof the Memorial Middle School has a flat roof with a number of obstructions such as exhaust fans, rooftop HVAC units, and electrical and gas piping. There is a minimal amount of shading on the roof from adjacent foliage that would need to be addressed during the design phase of the project. The structural integrity of the roof was not confirmed although a visual inspection revealed no leaks or major defects. The structural integrity of the roof and the existence of a warranty shall be confirmed prior to the implementation of a PV system.
The Project Team conducted both a facility walkthrough and a satellite image analysis and based on the estimated total available area we calculated the installation of a system rated at approximately 324 kW (dc).
Electrical Service The interconnection point for the PV system will require a modification or replacement of the existing service entrance equipment wherein the PV sysem feeder connections will have to be made after the main circuit breaker, and protective relaying will also have to be implemented. Preferably the inverter should be installed in close proximity to the service entrance equipment, but if there is no available space, the inverter shall be installed outside on a concrete pad in a weather proof enclosure. AC wiring would run from the inverters into the connection point(s) at the service entrance equipment. Any connection points would have to meet NEC and local utility requirements. Further investigation and verification of existing electrical equipment would be required prior to implementation of a PV system.
4.3.1.4 Point Pleasant High School The roof of High School has a flat roof with a number of obstructions such as exhaust fans, rooftop HVAC units, and electrical and gas piping. There is a minimal amount of shading on the roof from adjacent foliage that would need to be addressed during the design phase of the project. The structural integrity of the roof was not confirmed

Section 4 Energy Conservation and Retrofit Measures
A 4-33
although a visual inspection revealed no leaks or major defects. The structural integrity of the roof and the existence of a warranty shall be confirmed prior to the implementation of a PV system.
The Project Team conducted both a facility walkthrough and a satellite image analysis and based on the estimated total available area we calculated the installation of a system rated at approximately 669 kW (dc).
Electrical Service The interconnection point for the PV system will require a modification or replacement of the existing service entrance equipment wherein the PV system feeder connections will have to be made after the main circuit breaker, and protective relaying will also have to be implemented. Preferably the inverter should be installed in close proximity to the service entrance equipment, but if there is no available space, the inverter shall be installed outside on a concrete pad in a weather proof enclosure. AC wiring would run from the inverters into the connection point(s) at the service entrance equipment. Any connection points would have to meet NEC and local utility requirements. Further investigation and verification of existing electrical equipment would be required prior to implementation of a PV system.
4.3.1.5 Basis for Design and Calculations The most common roof mounted system is referred to as a (“fixed tilt”) system typically mounted to a metal rack that can be fixed at a specific angle. There are also (“tracking systems”) or movable along one or two axes to follow the position of the sun during the day. For a roof-mounted PV system, tracking systems are very rarely installed and are usually used for ground-mounted systems only, as they require more complex racks and higher maintenance costs. For the “fixed” system, the tilt is determined based on the following factors: geographical location, total targeted kWh production, seasonal electricity requirements and weather conditions such as wind. Ideally, the module tilt for Central New Jersey should be 25-35 degrees with an azimuth as close as possible to 180 (south); however, our experience has shown that PV systems are typically installed at a tilt of 20 degrees or lower in order to avoid any issues with wind and to maximize total system size
Fixed Tilt System
Section 4 Energy Conservation and Retrofit Measures
A 4-34
The type of PV panels and equipment used to mount the system shall be determined based on the wind conditions and structural integrity of the roof determined during the design phase of the project. In general, penetration/tie-down systems, non-penetrating ballasted type systems, or a combination of the two should be considered.
Calculation of PV System Yield An industry accepted software package, PV Watts, was used to calculate projected annual electrical production of the crystalline silicon PV system in its first year, as summarized in Table 4.3-1. The assumptions we used in the calculations were as follows: solar array tilt angle of 10°, array azimuth of 170° and a de-rate factor of 0.8.
Table 4.3-1 System Summary
Site Est. Area (ft2)
kWh Production
kW dc
Annual Energy Savings
Est. Annual SREC
Lifetime Energy Savings
(25 Years)*Point Pleasant High
School 66,892 788,155 669 $127,602 $496,882 $4,652,286
Memorial Middle School 32,397 381,718 324 $61,800 $240,649 $2,253,186
Ocean Road Elementary School 24,210 285,254 242 $46,183 $179,835 $1,683,784
Nellie Bennett Elementary School 29,003 341,728 290 $55,326 $215,438 $2,017,109
*3% yearly inflation on electricity costs
Total Costs It should be noted that construction costs are only estimates based on historic data compiled from similar installations, and engineering opinion. Additional engineering and analysis is required to confirm the condition of the roofs, structural integrity of the roofs, the system type, sizing, costs and savings. Budget costs assume existing roofs are structurally sound, do not need to be replaced, and can accommodate a solar system. For illustration purposes, a draft financial analysis pro forma is attached outlining all project costs and revenues.
Table 4.3-2 Budget Installation Cost
Budget Installation Cost $13,725,180
As stated above the estimated installation costs are based on significant experience+ with the pricing of solar installations in New Jersey, and are intended to provide the District with a realistic budget cost. A typical solar installation can vary in cost from $7.00 - $10.00 per watt depending on size, complexity of the system, labor rates, etc. Approximately 60-70% of that number is material costs while the balance is labor, engineering, etc. Like any installation, certain conditions can affect a price upward or downward. For purposes of this analysis the estimated installation cost does not include any roofing or structural work which may be required to maintain warranties or for additional structural support. We have included a budget of $9/watt for the
Section 4 Energy Conservation and Retrofit Measures
A 4-35
solar system installation with an additional estimated budget of $100,000 for potential electric service work.
Refer to Section 7 for discussion on Solar Renewable Energy Certificates and other financing options for solar projects. The financial model in Appendix E provides an annual forecast illustration of project revenues and costs for 25 years.
4.3.2 Ground Source Heat Pumps Ground source heat pumps utilize the relatively constant temperature of underground water sources to reject or supply heat to the interior space. Water is pumped through a loop that runs from the underground source to heat pumps at the building level. Depending on the time of year and building demand, these heat pumps use the ground source loop as a heat source or a heat sink.
Typically, ground source heat pump systems are most efficient when used in spaces that have similar heating and cooling loads, as the same loop and heat pumps are used for both cooling and heating. While all the schools are entirely heated in the winter, only a fraction of the schools’ interior spaces are cooled in the summer. Additionally, because the buildings are only partially occupied during peak cooling season (June – August), the schools’ peak cooling loads are much smaller than their heating demands.
Ground source heat pump systems are often very costly to install due to the high cost of test boring and drilling wells. Due to this, and the largely unbalanced heating and cooling demands at the schools, CDM anticipates that installation of ground source heat pump systems would not prove cost-beneficial.
4.3.3 On-Site Wind Power Generation
On-site wind power generation typically utilizes a form of turbine, which is rotated with the flow of wind across it, this rotational force powers a generator, producing DC electricity. The DC electricity is then converted into AC electricity, which can be used for commercial power, or can be fed back into the power grid, reducing the overall electric demand. The size of the turbine is proportional to the amount of wind and concurrently the amount of energy it can produce. An ideal location for a wind turbine is 20 feet above any surrounding object within a 250 foot radius. In general this relates to a property size of one acre or more. In addition, an average of 9 mph wind speed is required to ‘fuel’ the wind turbine.
On-site wind power generation is not recommended for the Point Pleasant School District, as the average maintained wind speed in this area is between 2 and 4 mph. The system would require a high initial investment, including feasibility studies, material and labor costs, installation, and lifetime maintenance costs and would not generate enough energy savings to result in an attractive payback period.
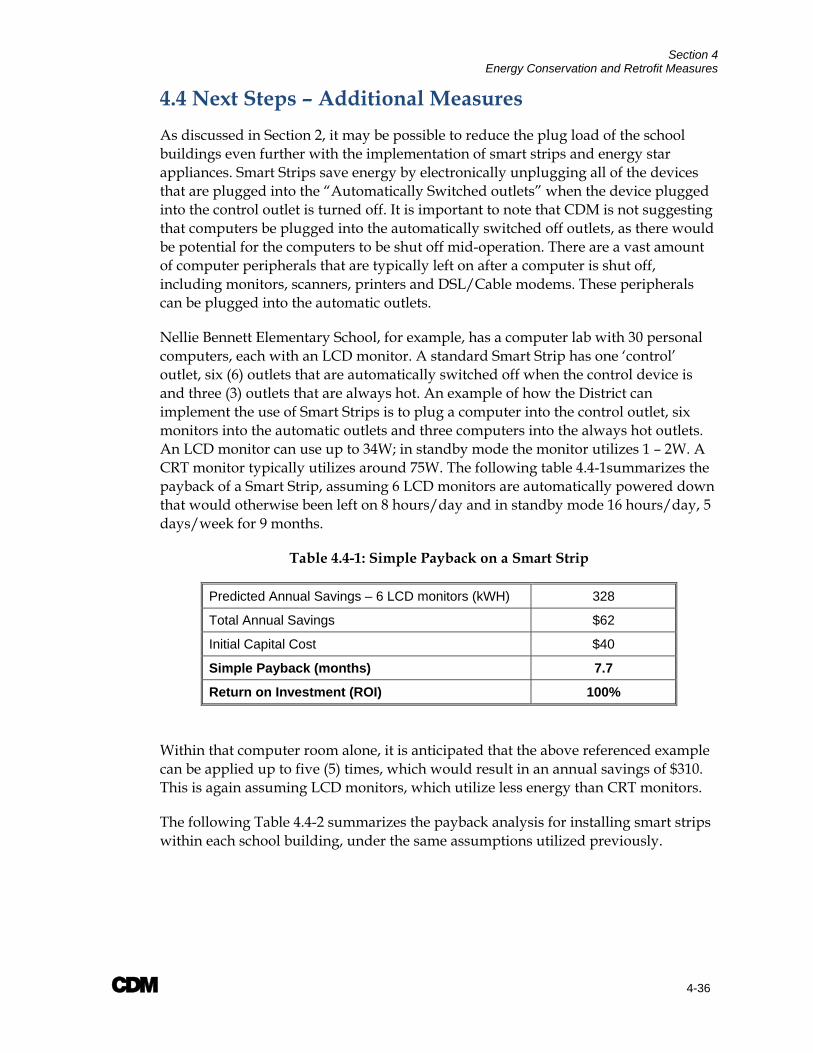
Section 4 Energy Conservation and Retrofit Measures
A 4-36
4.4 Next Steps – Additional Measures As discussed in Section 2, it may be possible to reduce the plug load of the school buildings even further with the implementation of smart strips and energy star appliances. Smart Strips save energy by electronically unplugging all of the devices that are plugged into the “Automatically Switched outlets” when the device plugged into the control outlet is turned off. It is important to note that CDM is not suggesting that computers be plugged into the automatically switched off outlets, as there would be potential for the computers to be shut off mid-operation. There are a vast amount of computer peripherals that are typically left on after a computer is shut off, including monitors, scanners, printers and DSL/Cable modems. These peripherals can be plugged into the automatic outlets.
Nellie Bennett Elementary School, for example, has a computer lab with 30 personal computers, each with an LCD monitor. A standard Smart Strip has one ‘control’ outlet, six (6) outlets that are automatically switched off when the control device is and three (3) outlets that are always hot. An example of how the District can implement the use of Smart Strips is to plug a computer into the control outlet, six monitors into the automatic outlets and three computers into the always hot outlets. An LCD monitor can use up to 34W; in standby mode the monitor utilizes 1 – 2W. A CRT monitor typically utilizes around 75W. The following table 4.4-1summarizes the payback of a Smart Strip, assuming 6 LCD monitors are automatically powered down that would otherwise been left on 8 hours/day and in standby mode 16 hours/day, 5 days/week for 9 months.
Table 4.4-1: Simple Payback on a Smart Strip
Predicted Annual Savings – 6 LCD monitors (kWH) 328
Total Annual Savings $62
Initial Capital Cost $40
Simple Payback (months) 7.7
Return on Investment (ROI) 100%
Within that computer room alone, it is anticipated that the above referenced example can be applied up to five (5) times, which would result in an annual savings of $310. This is again assuming LCD monitors, which utilize less energy than CRT monitors.
The following Table 4.4-2 summarizes the payback analysis for installing smart strips within each school building, under the same assumptions utilized previously.

Section 4 Energy Conservation and Retrofit Measures
A 4-37
Table 4.4-2: Simple Payback Smart Strip Installations per School
Nellie Bennett E.S.
Ocean Road E.S.
Memorial M.S.
Point Pleasant H.S.
Number of Computer Rooms (assumed 25 pcs/room)
1 1 3 6
Predicted Annual Savings – 6 LCD monitors/smart strip (kWH)
1312 1312 3936 7872
Total Annual Savings $248 $274 $754 $1960
Initial Capital Cost $160 $160 $480 $960
Simple Payback (months) 7.7 7.0 7.6 5.8
Return on Investment (ROI) 100% 100% 100% 100%
The following Table 4.4-3 summarizes other applications for the Smart Strip that may be applicable throughout the District:
Table 4.4-3 Applications for Smart Strips Control Outlet Switched Outlets
Computer Monitors, printers, scanners, lamps
TV VCR, DVD player, cable box
Lamp Stereo, space heater
In was also noted that the District consider the implementation of Energy Star appliances throughout the buildings, similarly to the High School, which already has an energy star industrial sized refrigerator. This is recommended on an ‘as-needed’ basis, because as it currently stands the high school’s major kitchen appliances are relatively energy efficient. For example, the Nellie Bennett utilizes convection ovens which are more energy efficient than conventional ovens, because the heated air is continuously circulated around the food being cooked, reducing the required temperature and cooking times. There are however, two (2) conventional gas ovens with conventional burners with electric ignition at the Ocean Road Elementary School. Depending on the school’s usage of the stove-tops, it may be considered that the conventional ovens be replaced with convection ovens as it makes no real difference in energy usage whether the stove-top is separate from the oven or combined.
Some of the other kitchen appliances, such as the industrial Hobart dishwasher at the Nellie Bennett Elementary School and walk-in refrigerators are necessary for the safe operation of the schools.
Section 4 Energy Conservation and Retrofit Measures
A 4-38
In addition to replacing old appliances with Energy Star appliances, the following two maintenance procedures can work to save the energy consumed by the District’s refrigerators. One is cleaning dirty condenser coils, twice a year. A refrigerator’s condenser coils and cooling fins are located either under the unit behind a grille in the front or on the back of the appliance. The coils can be cleaned with a brush or vacuum cleaner hose. The second source of wasted energy associated with a refrigerator is the door seal. Realigning the door or replacing a no longer airtight door seal will work to improve energy efficiency.
During the site visit, a number of vending machines were accounted for, both within the student areas and teacher’s offices and lounges. CDM is aware of the NJ state law that vending machines are unplugged during normal school hours. However, it may be considered that the ‘Vending Misers’ be purchased and utilized for vending machines within the teachers areas. A ‘Vending Miser’ powers down a vending machine when the surrounding area is unoccupied and automatically repowers when the area is occupied, utilizing an infrared sensor. Similarly to occupancy sensors on lighting fixtures; however, the vending miser also monitors the ambient temperature while the vending machine is powered down and uses this as sort of an internal thermostat to power up the machine and ensure that the drinks remain cold. The implementation of a ‘Vending Miser’ also reduces maintenance costs and extends the life of the machine, by reducing the number of compressor cycles. A ‘Vending Miser’ is a $180 investment, but has been found to reduce power consumption of a cold drink vending machine by an average of 46%.
A 5-1
Section 5 Evaluation of Energy Purchasing and Procurement Strategies 5.1 Energy Deregulation In 1999, New Jersey State Legislature passed the Electric Discount & Energy Competition Act (EDECA) to restructure the electric power industry in New Jersey. This law, the deregulation of the market, allowed all consumers to shop for their electric supplier. The intent was to create a competitive market for electrical energy supply. As a result, utilities were allowed to charge Cost of Service and customers were given the ability to choose a third party supplier. Energy deregulation in New Jersey increased the energy buyers’ options by separating the function of electricity distribution from that of electricity supply.
Jersey Central Power and Light (JCP&L) is currently the generator and supplier of electrical energy for the Point Pleasant School District. Energy deregulation creates the opportunity to choose your electric generation supplier. The benefit of this is the ability to choose a supplier based on what is important to you, for example, lowest rate or how the electric generation supply is produced.
To sell electric generation service in New Jersey, electric power suppliers must be licensed by the New Jersey Board of Public Utilities (NJ BPU). They must also be registered with the local public utility (JCP&L) to sell electric service in that utility’s service areas. The following suppliers are licensed with the NJ BPU and are registered to sell electric service in the JCP&L service territory:
Amerada Hess Corp BOC Energy Services Con Edison Solutions, Inc. Constellation New Energy, Inc. Direct Energy, LLC. First Energy Solutions Corp. Glacial Energy Integrys Energy Service Liberty Power Pepco Energy Services, Inc. PP&L Energy Plus, LLC. Reliant Energy Solutions East, LLC. Sempra Energy Solutions South Jersey Energy Strategic Energy LLC Suez Energy Resources NA, Inc UGI Energy Services
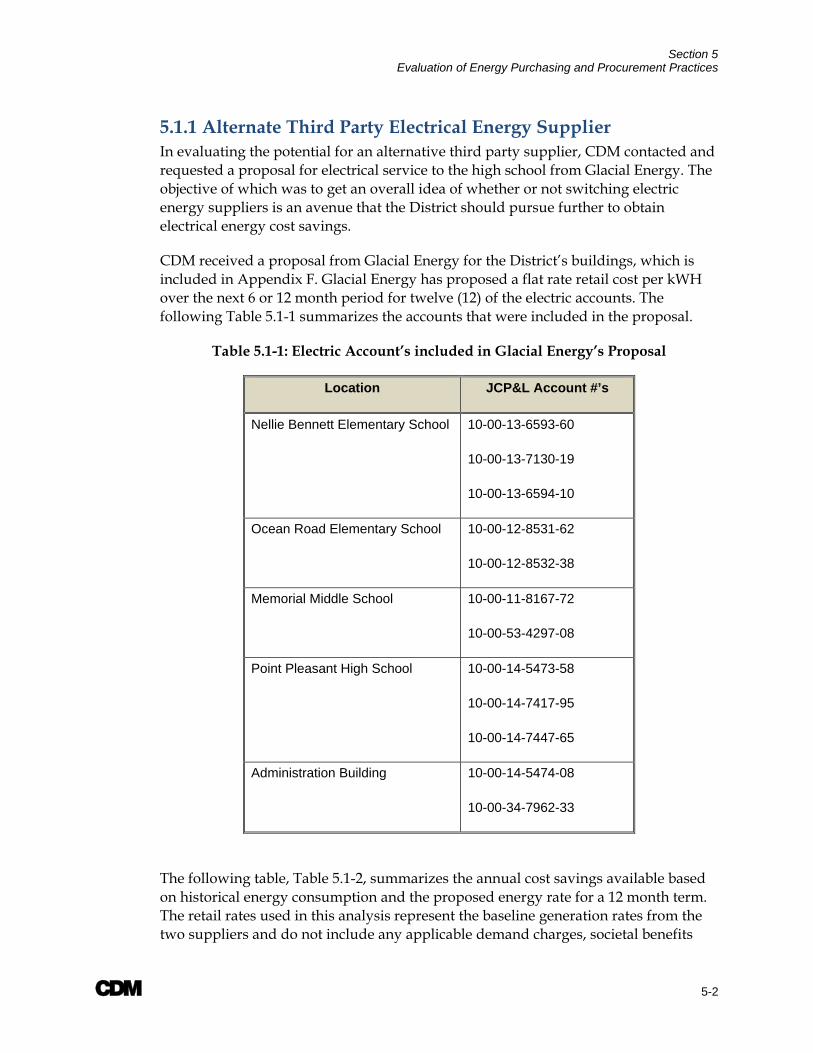
Section 5 Evaluation of Energy Purchasing and Procurement Practices
A 5-2
5.1.1 Alternate Third Party Electrical Energy Supplier In evaluating the potential for an alternative third party supplier, CDM contacted and requested a proposal for electrical service to the high school from Glacial Energy. The objective of which was to get an overall idea of whether or not switching electric energy suppliers is an avenue that the District should pursue further to obtain electrical energy cost savings.
CDM received a proposal from Glacial Energy for the District’s buildings, which is included in Appendix F. Glacial Energy has proposed a flat rate retail cost per kWH over the next 6 or 12 month period for twelve (12) of the electric accounts. The following Table 5.1-1 summarizes the accounts that were included in the proposal.
Table 5.1-1: Electric Account’s included in Glacial Energy’s Proposal
Location JCP&L Account #’s
Nellie Bennett Elementary School 10-00-13-6593-60
10-00-13-7130-19
10-00-13-6594-10
Ocean Road Elementary School 10-00-12-8531-62
10-00-12-8532-38
Memorial Middle School 10-00-11-8167-72
10-00-53-4297-08
Point Pleasant High School 10-00-14-5473-58
10-00-14-7417-95
10-00-14-7447-65
Administration Building 10-00-14-5474-08
10-00-34-7962-33
The following table, Table 5.1-2, summarizes the annual cost savings available based on historical energy consumption and the proposed energy rate for a 12 month term. The retail rates used in this analysis represent the baseline generation rates from the two suppliers and do not include any applicable demand charges, societal benefits

Section 5 Evaluation of Energy Purchasing and Procurement Practices
A 5-3
charges, transmission charges, energy charges, reconciliation charges, transitional assessment charges or system control charges that were included in the aggregate rates presented in Section 3. These baseline generation rates, are used for comparison purposes to identify any potential energy cost savings, as all other applicable charges cannot be avoided by switching suppliers.
Table 5.1-2: Potential Energy Cost Savings with an Alternate Third Party Supplier – Glacial Energy
Service Location 2008 Annual
Consumption (kWH)
Projected Annual Cost
with JCP&L(@ $0.12248/kWH)
Proposed Annual Cost with Glacial
Energy (@ $0.10393/kWH)
Potential Annual Savings ($)
Nellie Bennett Elementary School 599,266 $73,398 $62,281 $11,117
Ocean Road Elementary School 631,087 $77,295 $65,589 $11,706
Memorial Middle School 841,612 $103,080 $87,468 $15,612
Point Pleasant High School 1,581,581 $193,712 $164,374 $29,338
Administration Building 29,347 $3,594 $3,050 $544
Total Potential Annual Savings: $68,317
As energy cost savings are available by switching to a third party supplier, such as Glacial Energy, this is a recommended energy cost savings measure. The estimated annual cost savings available by switching to Glacial Energy is a 15% savings. CDM recommends that the District investigate this opportunity further and compare proposals from alternate third party suppliers to obtain the lowest electrical energy rates available.
5.2 Demand Response Program Demand Response is a program through which a business can make money on reducing their electricity use when wholesale electricity prices are high or when heavy demand causes instability on the electric grid, which can result in voltage fluctuations or grid failure. Demand Response is an energy management program that compensates the participant for reducing their energy consumption at critical times. Demand Response is a highly efficient and cost efficient means of reducing the potential for electrical grid failure and price volatility and is one of the best solutions to the Mid-Atlantic region’s current energy challenges.
Section 5 Evaluation of Energy Purchasing and Procurement Practices
A 5-4
The program provides at least 2 hours advance notice before curtailment is required. There is typically 1 event a year that lasts about 3 hours, and since this happens only in summer months, when demand for electricity is at its highest, it may better facilitate the District’s involvement. This as a result of summer occupancy requirements, although, energy curtailment in discretionary.
Participation in Demand Response is generally done through companies known as Curtailment Service Providers, or CSPs, who are members of PJM Interconnection. There is no cost to enroll in the program and participation is voluntary, for instance, you can choose when you want to participate. In most cases, there is no penalty for declining to reduce your electricity use when you’re asked to do so. The event is managed remotely by notifying your staff of the curtailment request and then enacting curtailment through your Building Management System. CSPs will share in a percentage of your savings, which may differ among various CSPs, since there may be costs associated with the hardware and /or software required for participation, so it is recommended that a number of CSPs be contacted to review their offers.

A 6-1
Section 6 Ranking of Energy Conservation and Retrofit Measures (ECRM) 6.1 ECRMs The main objective of this energy audit is to identify potential Energy Conservation and Retrofit Measures and to determine whether or not the identified ECRM’s are economically feasible to warrant the cost for planning and implementation of each measure. Economic feasibility of each identified measure was evaluated through a simple payback analysis. The simple payback analysis consists of establishing the Engineer’s Opinion of Probable Construction Cost estimates, O&M cost savings estimates, projected annual energy savings estimates and the potential value of New Jersey Clean Energy rebates or Renewable Energy Credits, if applicable. The simple payback period is then determined as the amount of time (years) until the energy savings associated with each measure amounts to the capital investment cost.
As discussed is Section 3, aggregate unit costs for electrical energy delivery and usage and natural gas delivery and usage, which accounts for all demand and tariff charges at each facility, was determined and utilized in the simple payback analyses.
In general, ECRMs having a payback period of 20 years or less have been recommended and only those recommended ECRMs within Section 4 of the report have been ranked for possible implementation. The most attractive rankings are those with the lowest simple payback period.
Ranking of ECRMs has been broken down into the following categories:
Lighting Systems
HVAC Systems
Solar Energy
Miscellaneous Plug Loads
6.1.1 Lighting Systems Table 6.1-1 includes the recommended ECRM (Options 1&2) to provide energy savings for all building lighting systems, which include the installation of energy-efficient luminaires and occupancy sensors. Option 1 also includes parking lot and exterior lighting, presenting a greater annual savings. A detailed discussion on building lighting systems is presented in Section 4.1.
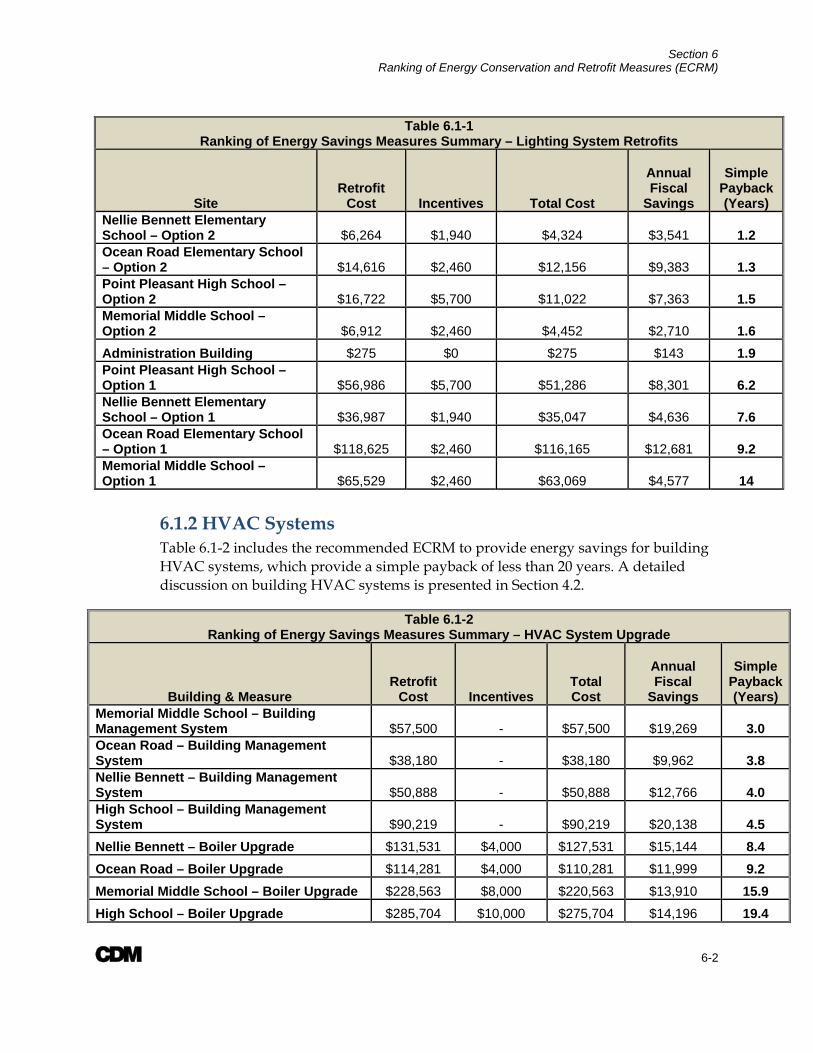
Section 6 Ranking of Energy Conservation and Retrofit Measures (ECRM)
A 6-2
Table 6.1-1 Ranking of Energy Savings Measures Summary – Lighting System Retrofits
Site Retrofit
Cost Incentives Total Cost
Annual Fiscal
Savings
Simple Payback (Years)
Nellie Bennett Elementary School – Option 2 $6,264 $1,940 $4,324 $3,541 1.2 Ocean Road Elementary School – Option 2 $14,616 $2,460 $12,156 $9,383 1.3 Point Pleasant High School – Option 2 $16,722 $5,700 $11,022 $7,363 1.5 Memorial Middle School – Option 2 $6,912 $2,460 $4,452 $2,710 1.6 Administration Building $275 $0 $275 $143 1.9 Point Pleasant High School – Option 1 $56,986 $5,700 $51,286 $8,301 6.2 Nellie Bennett Elementary School – Option 1 $36,987 $1,940 $35,047 $4,636 7.6 Ocean Road Elementary School – Option 1 $118,625 $2,460 $116,165 $12,681 9.2 Memorial Middle School – Option 1 $65,529 $2,460 $63,069 $4,577 14
6.1.2 HVAC Systems Table 6.1-2 includes the recommended ECRM to provide energy savings for building HVAC systems, which provide a simple payback of less than 20 years. A detailed discussion on building HVAC systems is presented in Section 4.2.
Table 6.1-2 Ranking of Energy Savings Measures Summary – HVAC System Upgrade
Building & Measure Retrofit
Cost Incentives Total Cost
Annual Fiscal
Savings
Simple Payback (Years)
Memorial Middle School – Building Management System $57,500 - $57,500 $19,269 3.0 Ocean Road – Building Management System $38,180 - $38,180 $9,962 3.8 Nellie Bennett – Building Management System $50,888 - $50,888 $12,766 4.0 High School – Building Management System $90,219 - $90,219 $20,138 4.5 Nellie Bennett – Boiler Upgrade $131,531 $4,000 $127,531 $15,144 8.4 Ocean Road – Boiler Upgrade $114,281 $4,000 $110,281 $11,999 9.2 Memorial Middle School – Boiler Upgrade $228,563 $8,000 $220,563 $13,910 15.9 High School – Boiler Upgrade $285,704 $10,000 $275,704 $14,196 19.4
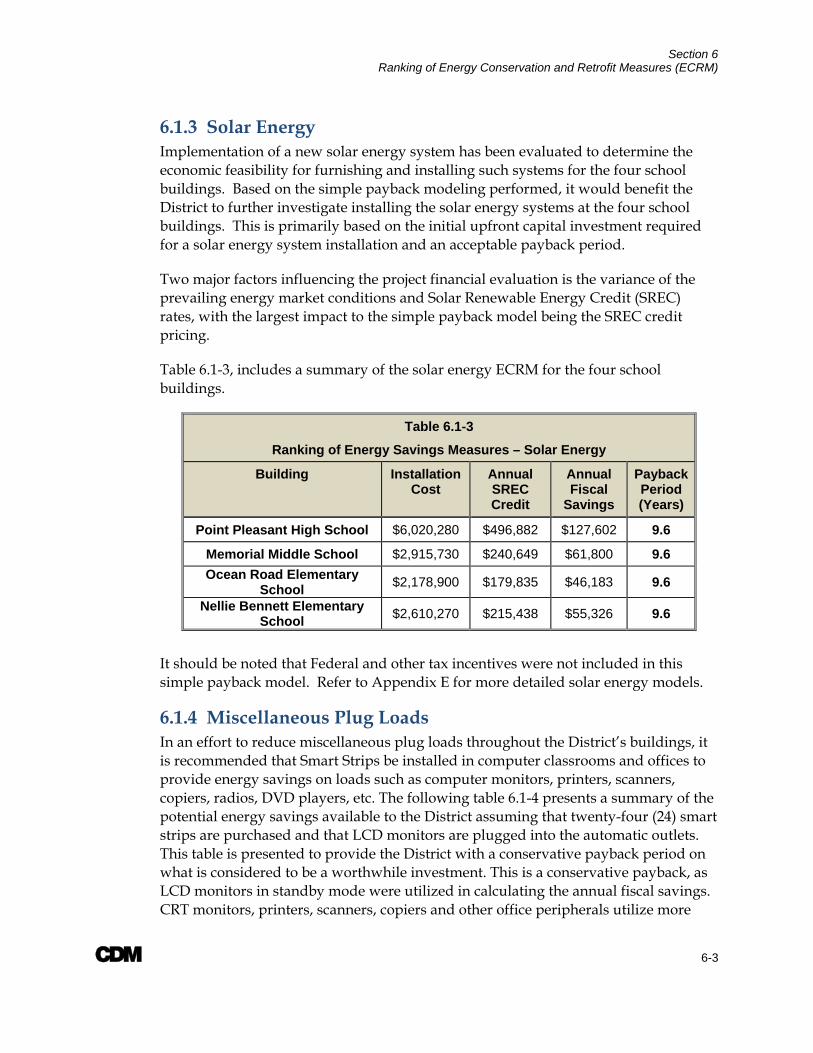
Section 6 Ranking of Energy Conservation and Retrofit Measures (ECRM)
A 6-3
6.1.3 Solar Energy Implementation of a new solar energy system has been evaluated to determine the economic feasibility for furnishing and installing such systems for the four school buildings. Based on the simple payback modeling performed, it would benefit the District to further investigate installing the solar energy systems at the four school buildings. This is primarily based on the initial upfront capital investment required for a solar energy system installation and an acceptable payback period.
Two major factors influencing the project financial evaluation is the variance of the prevailing energy market conditions and Solar Renewable Energy Credit (SREC) rates, with the largest impact to the simple payback model being the SREC credit pricing.
Table 6.1-3, includes a summary of the solar energy ECRM for the four school buildings.
Table 6.1-3
Ranking of Energy Savings Measures – Solar Energy
Building Installation Cost
Annual SREC Credit
Annual Fiscal
Savings
Payback Period (Years)
Point Pleasant High School $6,020,280 $496,882 $127,602 9.6
Memorial Middle School $2,915,730 $240,649 $61,800 9.6 Ocean Road Elementary
School $2,178,900 $179,835 $46,183 9.6
Nellie Bennett Elementary School $2,610,270 $215,438 $55,326 9.6
It should be noted that Federal and other tax incentives were not included in this simple payback model. Refer to Appendix E for more detailed solar energy models.
6.1.4 Miscellaneous Plug Loads In an effort to reduce miscellaneous plug loads throughout the District’s buildings, it is recommended that Smart Strips be installed in computer classrooms and offices to provide energy savings on loads such as computer monitors, printers, scanners, copiers, radios, DVD players, etc. The following table 6.1-4 presents a summary of the potential energy savings available to the District assuming that twenty-four (24) smart strips are purchased and that LCD monitors are plugged into the automatic outlets. This table is presented to provide the District with a conservative payback period on what is considered to be a worthwhile investment. This is a conservative payback, as LCD monitors in standby mode were utilized in calculating the annual fiscal savings. CRT monitors, printers, scanners, copiers and other office peripherals utilize more
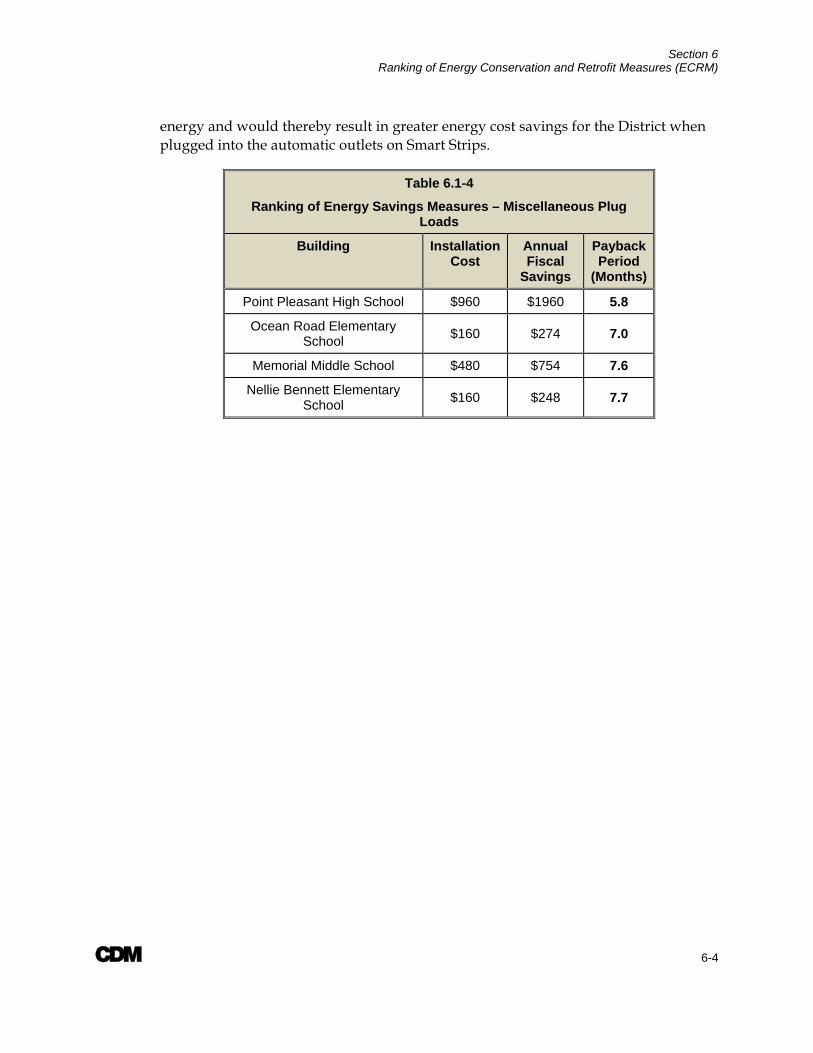
Section 6 Ranking of Energy Conservation and Retrofit Measures (ECRM)
A 6-4
energy and would thereby result in greater energy cost savings for the District when plugged into the automatic outlets on Smart Strips.
Table 6.1-4
Ranking of Energy Savings Measures – Miscellaneous Plug Loads
Building Installation Cost
Annual Fiscal
Savings
Payback Period
(Months)
Point Pleasant High School $960 $1960 5.8
Ocean Road Elementary School $160 $274 7.0
Memorial Middle School $480 $754 7.6
Nellie Bennett Elementary School $160 $248 7.7
A 7-1
Section 7 Available Grants, Incentives and Funding Sources 7.1 Solar Energy Incentives and Financial Options 7.1.1 Solar Renewable Energy Certificates As part of New Jersey’s Renewable Portfolio Standards (RPS), electric suppliers are required to have an annually-increasing percentage of their retail sales generated by solar energy. Electric suppliers fulfill this obligation by purchasing SRECs from the owners of solar generating systems. One SREC is created for every 1,000 kWh (1 MWh) of solar electricity generated. Although solar systems generate electricity and SRECs in tandem, the two are independent commodities and sold separately. The RPS, and creation of SRECs, is intended to provide additional revenue flow and financial support for solar projects in New Jersey.
We have assumed what we believe to be a conservative estimate of the market value of SRECs over a 15 year period. Over the first 5 years, we have assumed that the SREC value would be at 80% of the NJBPU market forecast. For years 6 through 9, we have assumed that the SREC value would be at 75% of the NJBPU market forecast. Finally, for the balance of the term, we have assumed that the SREC value would be at a floor of $350 per SREC. We believe these values to be conservative compared to recent market transactions. We know of recent transactions in excess of $650 for 1 year, $550 for 4 years and $375 for 12 years. Should the winning developer have contracts in place, or a view of the market that SRECs will exceed our assumptions; the economics of the project will improve.
In addition, State law now requires that the utility must interconnect and net meter your photovoltaic system provided your system passes the local electrical inspection (National Electric Code) and meets the utility safety requirements as outlined in the law. Net metering is the term given which allows your utility meter to literally “spin backward” when the solar panels are producing more electricity than the building is using. However, given the high electrical demand of the facility at most times, this scenario is unlikely to happen.
7.1.2 Financing Options for Solar Projects 1. Direct Purchase – under this model, the District would fund the project directly,
and receive all of the financial benefits of a PV system directly.
2. Power Purchase Agreement (PPA) – under this model, a private, third party would invest all of the capital necessary to build, own, operate, and maintain the PV system. The third party would claim all of the financial benefits of the project, including federal tax incentives and accelerated depreciation benefits that public sector entities are not entitled to. The District would enter into a 15 or 20 year
Section 7 Available Grants, Incentives and Funding Sources
A 7-2
agreement to purchase power from the PV system at a rate guaranteed to be less than the cost of power from the utility. It should be noted that most PPAs require a minimum system size of approximately 300 kW on one building.
Additional Potential Financial Incentives:
Debt Service Aid - Based on the Education Facilities Construction and Financing Act signed into law in 2000, New Jersey Boards of Education are eligible for 40% debt service aid for eligible improvements to school facilities. It is anticipated that the installation of solar photovoltaic panels will be considered eligible improvements. Under this scenario the District would be required to go to referendum for voter approval to gain access to debt service aid.
Clean Renewable Energy Bonds – The federal government made available $750 Million in federal income tax credit allotments in 2007-08 for local governments to support the installation of green energy generation systems including solar photovoltaic. Such allotments may provide for an interest- free loan for the issuer. The recent energy bill for 2008-09 did not include any provisions for this energy bond. However, industry experts expect some allotments will be included prior to execution of the final plan. Although there is no guarantee that the District will be awarded such allotments, we have included the calculation for illustration purposes. If the program is approved for 2008-09 an application will be submitted on behalf of the Point Pleasant Borough Board of Education.
7.2 New Jersey Clean Energy Program 7.2.1 Introduction New Jersey's Clean Energy Program (N JCEP) promotes increased energy efficiency and the use of clean, renewable sources of energy including solar, wind, geothermal, and sustainable biomass. The results for New Jersey are a stronger economy, less pollution, lower costs, and reduced demand for electricity. NJCEP offers financial incentives, programs, and services for residential, commercial, and municipal customers.
NJCEP reduces the need to generate electricity and burn natural gas which eliminates the pollution that would have been caused by such electric generation or natural gas usage. The benefits of these programs continue for the life of the measures installed, which on average is about 15 years. Thus, the public receives substantial environmental and public health benefits from programs that also lower energy bills and benefit the economy.
7.2.2 New Jersey Smart Start Program The New Jersey Smart Start Program offers rebate incentives for several qualifying equipment such as high efficient premium motors and lighting, and lighting controls.

Section 7 Available Grants, Incentives and Funding Sources
A 7-3
Incentive information and incentive calculation worksheets are provided for the various new equipment installation identified in this report and are included in Appendix G.

APPENDIX A
UTILITY BILL INFORMATION
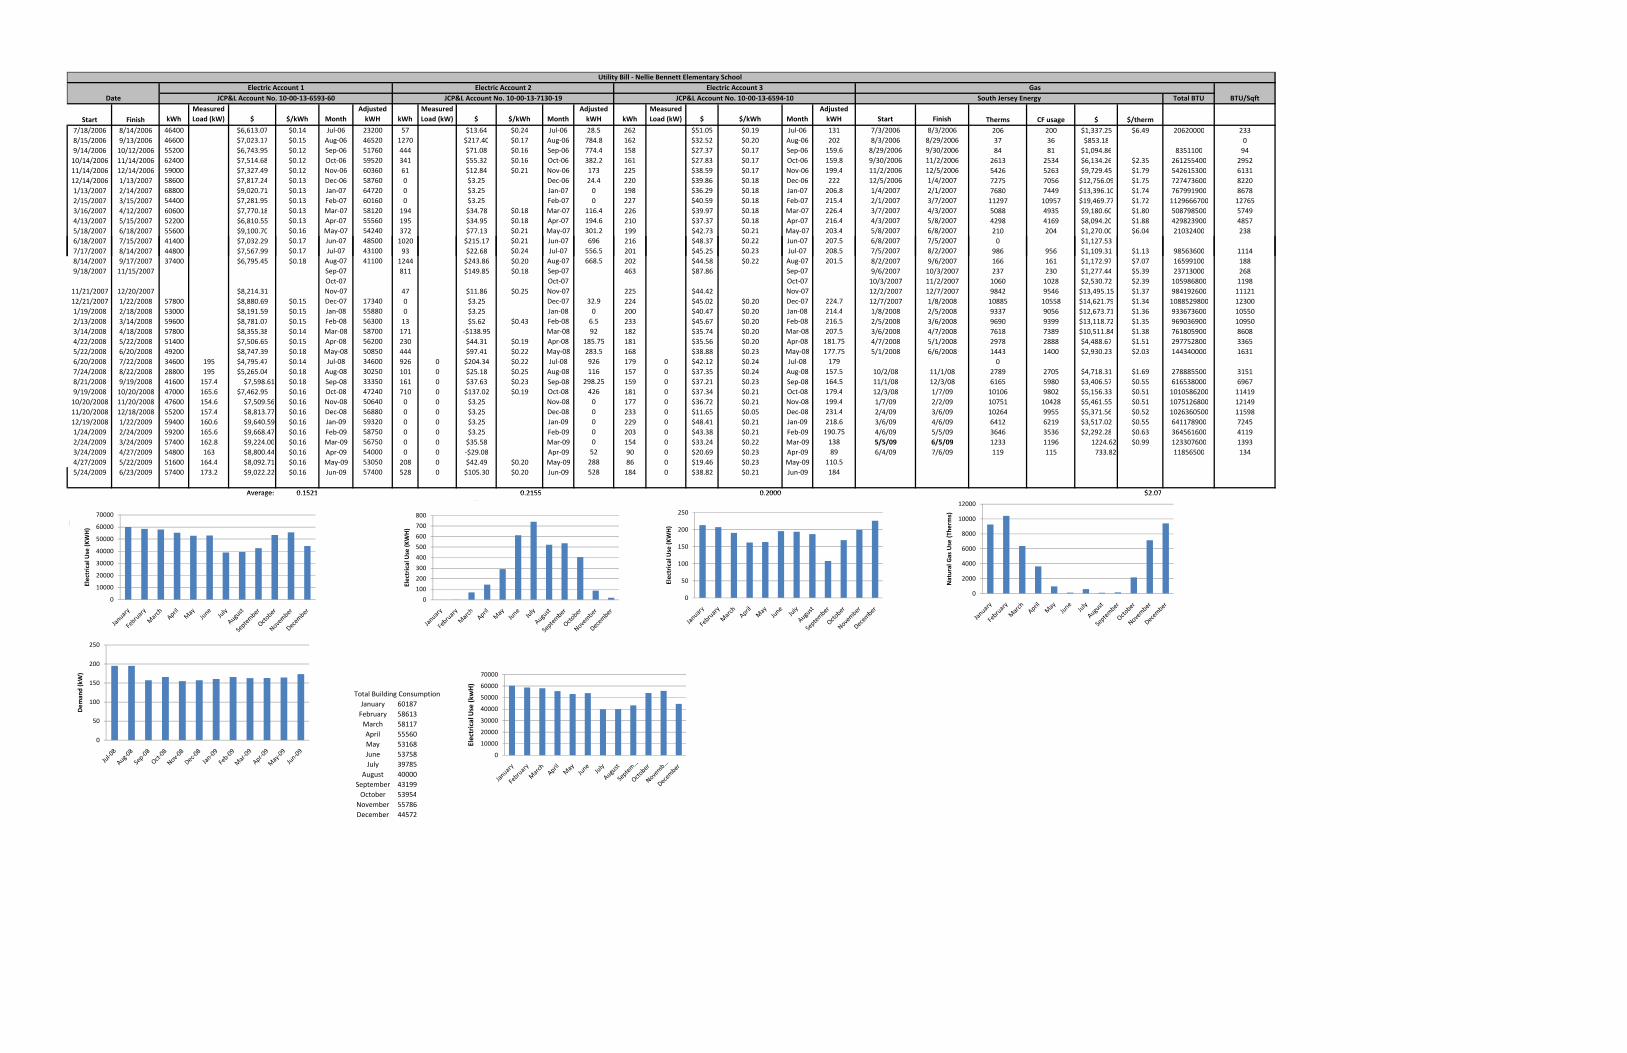
Total BTU
Start Finish kWhMeasured Load (kW) $ $/kWh Month
Adjusted kWH kWh
Measured Load (kW) $ $/kWh Month
Adjusted kWH kWh
Measured Load (kW) $ $/kWh Month
Adjusted kWH Start Finish Therms CF usage $ $/therm
7/18/2006 8/14/2006 46400 $6,613.07 $0.14 Jul‐06 23200 57 $13.64 $0.24 Jul‐06 28.5 262 $51.05 $0.19 Jul‐06 131 7/3/2006 8/3/2006 206 200 $1,337.25 $6.49 20620000 2338/15/2006 9/13/2006 46600 $7,023.17 $0.15 Aug‐06 46520 1270 $217.40 $0.17 Aug‐06 784.8 162 $32.52 $0.20 Aug‐06 202 8/3/2006 8/29/2006 37 36 $853.18 09/14/2006 10/12/2006 55200 $6,743.95 $0.12 Sep‐06 51760 444 $71.08 $0.16 Sep‐06 774.4 158 $27.37 $0.17 Sep‐06 159.6 8/29/2006 9/30/2006 84 81 $1,094.86 8351100 9410/14/2006 11/14/2006 62400 $7,514.68 $0.12 Oct‐06 59520 341 $55.32 $0.16 Oct‐06 382.2 161 $27.83 $0.17 Oct‐06 159.8 9/30/2006 11/2/2006 2613 2534 $6,134.26 $2.35 261255400 295211/14/2006 12/14/2006 59000 $7,327.49 $0.12 Nov‐06 60360 61 $12.84 $0.21 Nov‐06 173 225 $38.59 $0.17 Nov‐06 199.4 11/2/2006 12/5/2006 5426 5263 $9,729.45 $1.79 542615300 613112/14/2006 1/13/2007 58600 $7,817.24 $0.13 Dec‐06 58760 0 $3.25 Dec‐06 24.4 220 $39.86 $0.18 Dec‐06 222 12/5/2006 1/4/2007 7275 7056 $12,756.09 $1.75 727473600 82201/13/2007 2/14/2007 68800 $9,020.71 $0.13 Jan‐07 64720 0 $3.25 Jan‐07 0 198 $36.29 $0.18 Jan‐07 206.8 1/4/2007 2/1/2007 7680 7449 $13,396.10 $1.74 767991900 86782/15/2007 3/15/2007 54400 $7,281.95 $0.13 Feb‐07 60160 0 $3.25 Feb‐07 0 227 $40.59 $0.18 Feb‐07 215.4 2/1/2007 3/7/2007 11297 10957 $19,469.77 $1.72 1129666700 127653/16/2007 4/12/2007 60600 $7,770.18 $0.13 Mar‐07 58120 194 $34.78 $0.18 Mar‐07 116.4 226 $39.97 $0.18 Mar‐07 226.4 3/7/2007 4/3/2007 5088 4935 $9,180.60 $1.80 508798500 57494/13/2007 5/15/2007 52200 $6,810.55 $0.13 Apr‐07 55560 195 $34.95 $0.18 Apr‐07 194.6 210 $37.37 $0.18 Apr‐07 216.4 4/3/2007 5/8/2007 4298 4169 $8,094.20 $1.88 429823900 48575/18/2007 6/18/2007 55600 $9,100.70 $0.16 May‐07 54240 372 $77.13 $0.21 May‐07 301.2 199 $42.73 $0.21 May‐07 203.4 5/8/2007 6/8/2007 210 204 $1,270.00 $6.04 21032400 2386/18/2007 7/15/2007 41400 $7,032.29 $0.17 Jun‐07 48500 1020 $215.17 $0.21 Jun‐07 696 216 $48.37 $0.22 Jun‐07 207.5 6/8/2007 7/5/2007 0 $1,127.53
Utility Bill ‐ Nellie Bennett Elementary School
Date BTU/SqftElectric Account 1
JCP&L Account No. 10‐00‐13‐6593‐60Electric Account 2
JCP&L Account No. 10‐00‐13‐7130‐19Electric Account 3
JCP&L Account No. 10‐00‐13‐6594‐10Gas
South Jersey Energy
7/17/2007 8/14/2007 44800 $7,567.99 $0.17 Jul‐07 43100 93 $22.68 $0.24 Jul‐07 556.5 201 $45.25 $0.23 Jul‐07 208.5 7/5/2007 8/2/2007 986 956 $1,109.31 $1.13 98563600 11148/14/2007 9/17/2007 37400 $6,795.45 $0.18 Aug‐07 41100 1244 $243.86 $0.20 Aug‐07 668.5 202 $44.58 $0.22 Aug‐07 201.5 8/2/2007 9/6/2007 166 161 $1,172.97 $7.07 16599100 1889/18/2007 11/15/2007 Sep‐07 811 $149.85 $0.18 Sep‐07 463 $87.86 Sep‐07 9/6/2007 10/3/2007 237 230 $1,277.44 $5.39 23713000 268
Oct‐07 Oct‐07 Oct‐07 10/3/2007 11/2/2007 1060 1028 $2,530.72 $2.39 105986800 119811/21/2007 12/20/2007 $8,214.31 Nov‐07 47 $11.86 $0.25 Nov‐07 225 $44.42 Nov‐07 12/2/2007 12/7/2007 9842 9546 $13,495.15 $1.37 984192600 1112112/21/2007 1/22/2008 57800 $8,880.69 $0.15 Dec‐07 17340 0 $3.25 Dec‐07 32.9 224 $45.02 $0.20 Dec‐07 224.7 12/7/2007 1/8/2008 10885 10558 $14,621.79 $1.34 1088529800 123001/19/2008 2/18/2008 53000 $8,191.59 $0.15 Jan‐08 55880 0 $3.25 Jan‐08 0 200 $40.47 $0.20 Jan‐08 214.4 1/8/2008 2/5/2008 9337 9056 $12,673.71 $1.36 933673600 105502/13/2008 3/14/2008 59600 $8,781.07 $0.15 Feb‐08 56300 13 $5.62 $0.43 Feb‐08 6.5 233 $45.67 $0.20 Feb‐08 216.5 2/5/2008 3/6/2008 9690 9399 $13,118.72 $1.35 969036900 109503/14/2008 4/18/2008 57800 $8,355.38 $0.14 Mar‐08 58700 171 ‐$138.95 Mar‐08 92 182 $35.74 $0.20 Mar‐08 207.5 3/6/2008 4/7/2008 7618 7389 $10,511.84 $1.38 761805900 86084/22/2008 5/22/2008 51400 $7,506.65 $0.15 Apr‐08 56200 230 $44.31 $0.19 Apr‐08 185.75 181 $35.56 $0.20 Apr‐08 181.75 4/7/2008 5/1/2008 2978 2888 $4,488.67 $1.51 297752800 33655/22/2008 6/20/2008 49200 $8,747.39 $0.18 May‐08 50850 444 $97.41 $0.22 May‐08 283.5 168 $38.88 $0.23 May‐08 177.75 5/1/2008 6/6/2008 1443 1400 $2,930.23 $2.03 144340000 16316/20/2008 7/22/2008 34600 195 $4,795.47 $0.14 Jul‐08 34600 926 0 $204.34 $0.22 Jul‐08 926 179 0 $42.12 $0.24 Jul‐08 179 07/24/2008 8/22/2008 28800 195 $5,265.04 $0.18 Aug‐08 30250 101 0 $25.18 $0.25 Aug‐08 116 157 0 $37.35 $0.24 Aug‐08 157.5 10/2/08 11/1/08 2789 2705 $4,718.31 $1.69 278885500 31518/21/2008 9/19/2008 41600 157.4 $7,598.61 $0.18 Sep‐08 33350 161 0 $37.63 $0.23 Sep‐08 298.25 159 0 $37.21 $0.23 Sep‐08 164.5 11/1/08 12/3/08 6165 5980 $3,406.57 $0.55 616538000 69679/19/2008 10/20/2008 47000 165.6 $7,462.95 $0.16 Oct‐08 47240 710 0 $137.02 $0.19 Oct‐08 426 181 0 $37.34 $0.21 Oct‐08 179.4 12/3/08 1/7/09 10106 9802 $5,156.33 $0.51 1010586200 1141910/20/2008 11/20/2008 47600 154.6 $7,509.56 $0.16 Nov‐08 50640 0 0 $3.25 Nov‐08 0 177 0 $36.72 $0.21 Nov‐08 199.4 1/7/09 2/2/09 10751 10428 $5,461.55 $0.51 1075126800 1214911/20/2008 12/18/2008 55200 157.4 $8,813.77 $0.16 Dec‐08 56880 0 0 $3.25 Dec‐08 0 233 0 $11.65 $0.05 Dec‐08 231.4 2/4/09 3/6/09 10264 9955 $5,371.56 $0.52 1026360500 1159812/19/2008 1/22/2009 59400 160.6 $9,640.59 $0.16 Jan‐09 59320 0 0 $3.25 Jan‐09 0 229 0 $48.41 $0.21 Jan‐09 218.6 3/6/09 4/6/09 6412 6219 $3,517.02 $0.55 641178900 72451/24/2009 2/24/2009 59200 165.6 $9,668.47 $0.16 Feb‐09 58750 0 0 $3.25 Feb‐09 0 203 0 $43.38 $0.21 Feb‐09 190.75 4/6/09 5/5/09 3646 3536 $2,292.28 $0.63 364561600 41192/24/2009 3/24/2009 57400 162.8 $9,224.00 $0.16 Mar‐09 56750 0 0 $35.58 Mar‐09 0 154 0 $33.24 $0.22 Mar‐09 138 5/5/09 6/5/09 1233 1196 1224.62 $0.99 123307600 13933/24/2009 4/27/2009 54800 163 $8,800.44 $0.16 Apr‐09 54000 0 0 ‐$29.08 Apr‐09 52 90 0 $20.69 $0.23 Apr‐09 89 6/4/09 7/6/09 119 115 733.82 11856500 1344/27/2009 5/22/2009 51600 164.4 $8,092.71 $0.16 May‐09 53050 208 0 $42.49 $0.20 May‐09 288 86 0 $19.46 $0.23 May‐09 110.55/24/2009 6/23/2009 57400 173.2 $9,022.22 $0.16 Jun‐09 57400 528 0 $105.30 $0.20 Jun‐09 528 184 0 $38.82 $0.21 Jun‐09 184
Average: 0 1521 0 2155 0 2000 $2 07Average: 0.1521 0.2155 0.2000 $2.070.1892 January 0 January 213.267 January 9256
February 2.1666667 February 207.55 February 10417Nellie Bennett Elementary School's Square Footage 88,497 March 69.466667 March 190.633 March 6373
April 144.11667 April 162.383 April 3640January 59973.33333 May 290.9 May 163.883 May 962February 58403.33333 June 612 June 195.75 June 119March 57856.66667 July 741.25 July 193.75 July 596April 55253.33333 August 523.1 August 187 August 101.55May 52713.33333 September 536.325 September 108.033 September 160.3205June 52950 October 404.1 October 169.6 October 2154July 38850 November 86.5 November 199.4 November 7144
August 39290 December 19.1 December 226.033 December 9422September 42555October 53380November 55500December 44326.66667
January 60187February 58613March 58117April 55560
Total Building Consumption
0
10000
20000
30000
40000
50000
60000
70000
Electrical Use (K
WH)
0
50
100
150
200
250
Dem
and (kW)
0
2000
4000
6000
8000
10000
12000
Natural Gas Use (T
herm
s)
0
100
200
300
400
500
600
700
800
Electrical Use (K
WH)
0
50
100
150
200
250
Electrical Use (K
WH)
20000
30000
40000
50000
60000
70000
ectrical Use (k
wH)
pMay 53168June 53758July 39785
August 40000September 43199October 53954November 55786December 44572
0
0
10000Ele
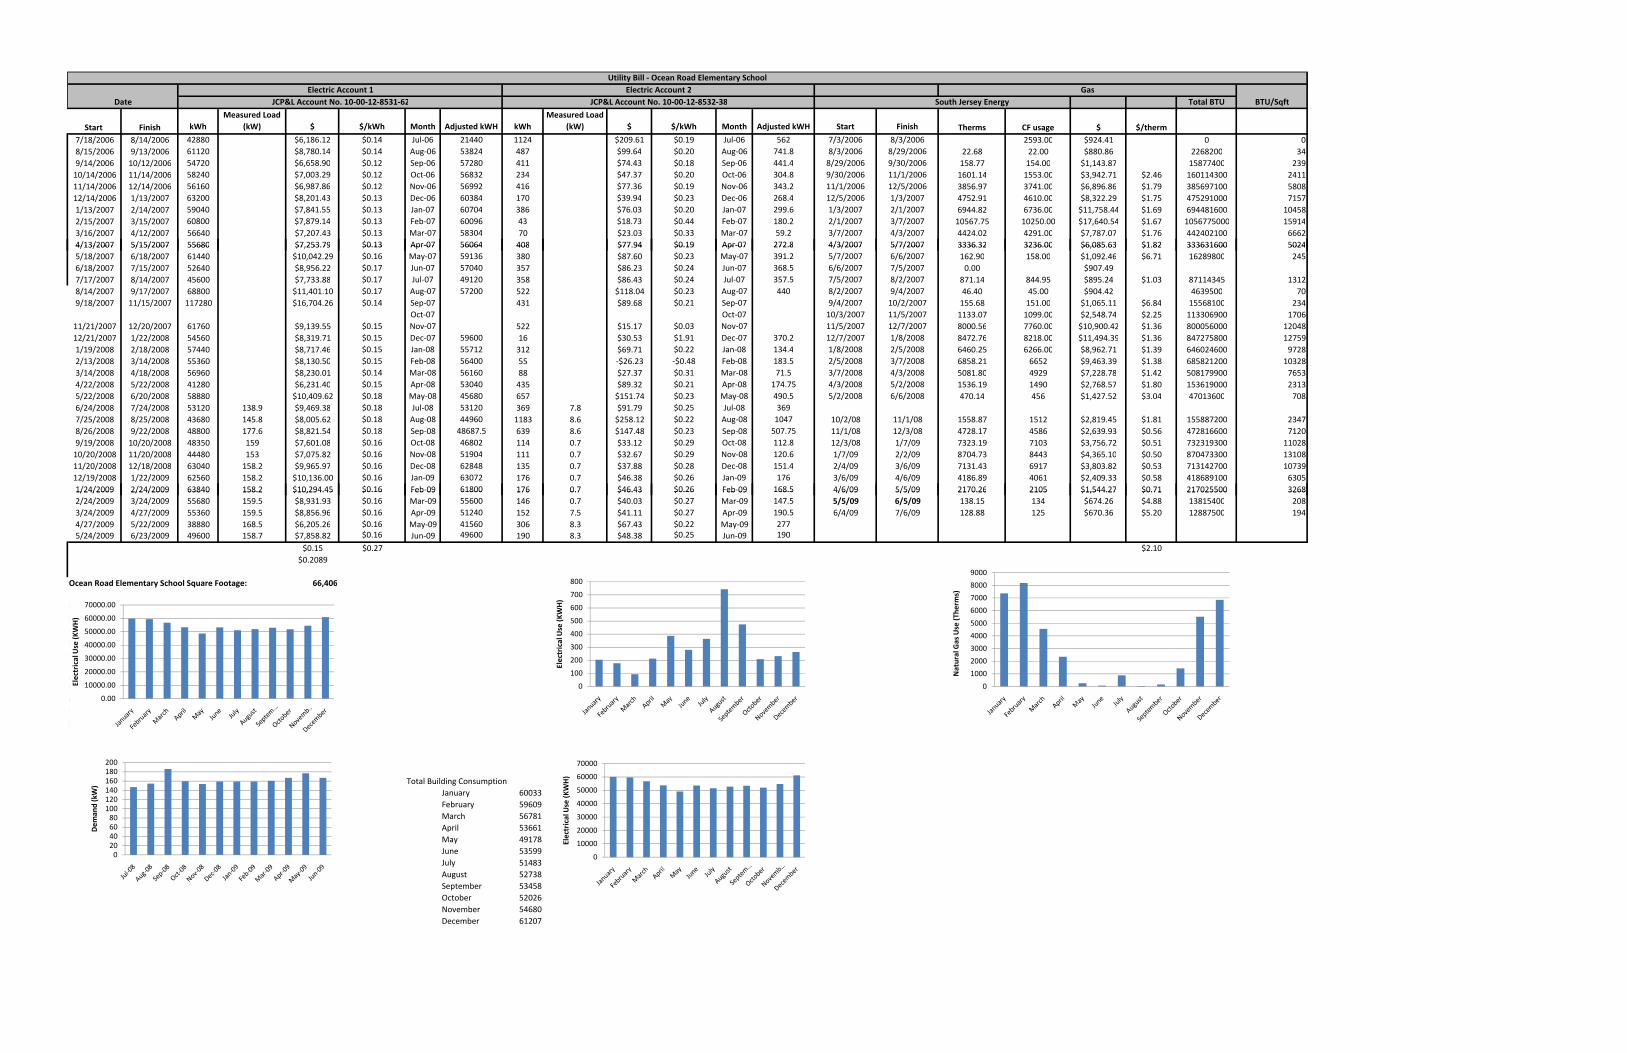
South Jersey Energy Total BTU
Start Finish kWhMeasured Load
(kW) $ $/kWh Month Adjusted kWH kWhMeasured Load
(kW) $ $/kWh Month Adjusted kWH Start Finish Therms CF usage $ $/therm7/18/2006 8/14/2006 42880 $6,186.12 $0.14 Jul‐06 21440 1124 $209.61 $0.19 Jul‐06 562 7/3/2006 8/3/2006 2593.00 $924.41 0 08/15/2006 9/13/2006 61120 $8,780.14 $0.14 Aug‐06 53824 487 $99.64 $0.20 Aug‐06 741.8 8/3/2006 8/29/2006 22.68 22.00 $880.86 2268200 349/14/2006 10/12/2006 54720 $6,658.90 $0.12 Sep‐06 57280 411 $74.43 $0.18 Sep‐06 441.4 8/29/2006 9/30/2006 158.77 154.00 $1,143.87 15877400 23910/14/2006 11/14/2006 58240 $7,003.29 $0.12 Oct‐06 56832 234 $47.37 $0.20 Oct‐06 304.8 9/30/2006 11/1/2006 1601.14 1553.00 $3,942.71 $2.46 160114300 241111/14/2006 12/14/2006 56160 $6,987.86 $0.12 Nov‐06 56992 416 $77.36 $0.19 Nov‐06 343.2 11/1/2006 12/5/2006 3856.97 3741.00 $6,896.86 $1.79 385697100 580812/14/2006 1/13/2007 63200 $8,201.43 $0.13 Dec‐06 60384 170 $39.94 $0.23 Dec‐06 268.4 12/5/2006 1/3/2007 4752.91 4610.00 $8,322.29 $1.75 475291000 71571/13/2007 2/14/2007 59040 $7,841.55 $0.13 Jan‐07 60704 386 $76.03 $0.20 Jan‐07 299.6 1/3/2007 2/1/2007 6944.82 6736.00 $11,758.44 $1.69 694481600 104582/15/2007 3/15/2007 60800 $7,879.14 $0.13 Feb‐07 60096 43 $18.73 $0.44 Feb‐07 180.2 2/1/2007 3/7/2007 10567.75 10250.00 $17,640.54 $1.67 1056775000 159143/16/2007 4/12/2007 56640 $7,207.43 $0.13 Mar‐07 58304 70 $23.03 $0.33 Mar‐07 59.2 3/7/2007 4/3/2007 4424.02 4291.00 $7,787.07 $1.76 442402100 66624/13/2007 5/15/2007 55680 $7,253.79 $0.13 Apr‐07 56064 408 $77.94 $0.19 Apr‐07 272.8 4/3/2007 5/7/2007 3336.32 3236.00 $6,085.63 $1.82 333631600 5024
Utility Bill ‐ Ocean Road Elementary School
DateGas
BTU/SqftElectric Account 1
JCP&L Account No. 10‐00‐12‐8531‐62Electric Account 2
JCP&L Account No. 10‐00‐12‐8532‐38
4/13/2007 5/15/2007 55680 $7,253.79 $0.13 Apr‐07 56064 408 $77.94 $0.19 Apr‐07 272.8 4/3/2007 5/7/2007 3336.32 3236.00 $6,085.63 $1.82 333631600 50245/18/2007 6/18/2007 61440 $10,042.29 $0.16 May‐07 59136 380 $87.60 $0.23 May‐07 391.2 5/7/2007 6/6/2007 162.90 158.00 $1,092.46 $6.71 16289800 2456/18/2007 7/15/2007 52640 $8,956.22 $0.17 Jun‐07 57040 357 $86.23 $0.24 Jun‐07 368.5 6/6/2007 7/5/2007 0.00 $907.497/17/2007 8/14/2007 45600 $7,733.88 $0.17 Jul‐07 49120 358 $86.43 $0.24 Jul‐07 357.5 7/5/2007 8/2/2007 871.14 844.95 $895.24 $1.03 87114345 13128/14/2007 9/17/2007 68800 $11,401.10 $0.17 Aug‐07 57200 522 $118.04 $0.23 Aug‐07 440 8/2/2007 9/4/2007 46.40 45.00 $904.42 4639500 709/18/2007 11/15/2007 117280 $16,704.26 $0.14 Sep‐07 431 $89.68 $0.21 Sep‐07 9/4/2007 10/2/2007 155.68 151.00 $1,065.11 $6.84 15568100 234
Oct‐07 Oct‐07 10/3/2007 11/5/2007 1133.07 1099.00 $2,548.74 $2.25 113306900 170611/21/2007 12/20/2007 61760 $9,139.55 $0.15 Nov‐07 522 $15.17 $0.03 Nov‐07 11/5/2007 12/7/2007 8000.56 7760.00 $10,900.42 $1.36 800056000 1204812/21/2007 1/22/2008 54560 $8,319.71 $0.15 Dec‐07 59600 16 $30.53 $1.91 Dec‐07 370.2 12/7/2007 1/8/2008 8472.76 8218.00 $11,494.39 $1.36 847275800 127591/19/2008 2/18/2008 57440 $8,717.46 $0.15 Jan‐08 55712 312 $69.71 $0.22 Jan‐08 134.4 1/8/2008 2/5/2008 6460.25 6266.00 $8,962.71 $1.39 646024600 97282/13/2008 3/14/2008 55360 $8,130.50 $0.15 Feb‐08 56400 55 ‐$26.23 ‐$0.48 Feb‐08 183.5 2/5/2008 3/7/2008 6858.21 6652 $9,463.39 $1.38 685821200 103283/14/2008 4/18/2008 56960 $8,230.01 $0.14 Mar‐08 56160 88 $27.37 $0.31 Mar‐08 71.5 3/7/2008 4/3/2008 5081.80 4929 $7,228.78 $1.42 508179900 76534/22/2008 5/22/2008 41280 $6,231.40 $0.15 Apr‐08 53040 435 $89.32 $0.21 Apr‐08 174.75 4/3/2008 5/2/2008 1536.19 1490 $2,768.57 $1.80 153619000 23135/22/2008 6/20/2008 58880 $10,409.62 $0.18 May‐08 45680 657 $151.74 $0.23 May‐08 490.5 5/2/2008 6/6/2008 470.14 456 $1,427.52 $3.04 47013600 7086/24/2008 7/24/2008 53120 138.9 $9,469.38 $0.18 Jul‐08 53120 369 7.8 $91.79 $0.25 Jul‐08 3697/25/2008 8/25/2008 43680 145.8 $8,005.62 $0.18 Aug‐08 44960 1183 8.6 $258.12 $0.22 Aug‐08 1047 10/2/08 11/1/08 1558.87 1512 $2,819.45 $1.81 155887200 23478/26/2008 9/22/2008 48800 177.6 $8,821.54 $0.18 Sep‐08 48687.5 639 8.6 $147.48 $0.23 Sep‐08 507.75 11/1/08 12/3/08 4728.17 4586 $2,639.93 $0.56 472816600 71209/19/2008 10/20/2008 48350 159 $7,601.08 $0.16 Oct‐08 46802 114 0.7 $33.12 $0.29 Oct‐08 112.8 12/3/08 1/7/09 7323.19 7103 $3,756.72 $0.51 732319300 1102810/20/2008 11/20/2008 44480 153 $7,075.82 $0.16 Nov‐08 51904 111 0.7 $32.67 $0.29 Nov‐08 120.6 1/7/09 2/2/09 8704.73 8443 $4,365.10 $0.50 870473300 1310811/20/2008 12/18/2008 63040 158.2 $9,965.97 $0.16 Dec‐08 62848 135 0.7 $37.88 $0.28 Dec‐08 151.4 2/4/09 3/6/09 7131.43 6917 $3,803.82 $0.53 713142700 1073912/19/2008 1/22/2009 62560 158.2 $10,136.00 $0.16 Jan‐09 63072 176 0.7 $46.38 $0.26 Jan‐09 176 3/6/09 4/6/09 4186.89 4061 $2,409.33 $0.58 418689100 63051/24/2009 2/24/2009 63840 158.2 $10,294.45 $0.16 Feb‐09 61800 176 0.7 $46.43 $0.26 Feb‐09 168.5 4/6/09 5/5/09 2170.26 2105 $1,544.27 $0.71 217025500 32681/24/2009 2/24/2009 63840 158.2 $10,294.45 $0.16 Feb 09 61800 176 0.7 $46.43 $0.26 Feb 09 168.5 4/6/09 5/5/09 2170.26 2105 $1,544.27 $0.71 217025500 32682/24/2009 3/24/2009 55680 159.5 $8,931.93 $0.16 Mar‐09 55600 146 0.7 $40.03 $0.27 Mar‐09 147.5 5/5/09 6/5/09 138.15 134 $674.26 $4.88 13815400 2083/24/2009 4/27/2009 55360 159.5 $8,856.96 $0.16 Apr‐09 51240 152 7.5 $41.11 $0.27 Apr‐09 190.5 6/4/09 7/6/09 128.88 125 $670.36 $5.20 12887500 1944/27/2009 5/22/2009 38880 168.5 $6,205.26 $0.16 May‐09 41560 306 8.3 $67.43 $0.22 May‐09 2775/24/2009 6/23/2009 49600 158.7 $7,858.82 $0.16 Jun‐09 49600 190 8.3 $48.38 $0.25 Jun‐09 190
$0.15 $0.27 $2.10$0.2089 January 7369.93
January 203.33333 February 8185.80Ocean Road Elementary School Square Footage: 66,406 February 177.4 March 4564.24January 59829.33 March 92.733333 April 2347.59February 59432.00 April 212.68333 May 257.06March 56688.00 May 386.23333 June 64.44April 53448.00 June 279.25 July 871.14May 48792.00 July 363.25 August 34.54June 53320.00 August 742.93333 September 157.23July 51120.00 September 474.575 October 1431.03August 51994.67 October 208.8 November 5528.57September 52983.75 November 231.9 December 6849.62October 51817.00 December 263.33333November 54448.00December 60944.00
0.00
10000.00
20000.00
30000.00
40000.00
50000.00
60000.00
70000.00
Electrical Use (K
WH)
0
100
200
300
400
500
600
700
800
Electrical Use (K
WH)
0
1000
2000
3000
4000
5000
6000
7000
8000
9000
Natural Gas Use (T
herm
s)
January 60033February 59609March 56781April 53661May 49178June 53599July 51483August 52738September 53458October 52026November 54680December 61207
Total Building Consumption
020406080
100120140160180200
Dem
and (kW)
0
10000
20000
30000
40000
50000
60000
70000
Electrical Use (K
WH)
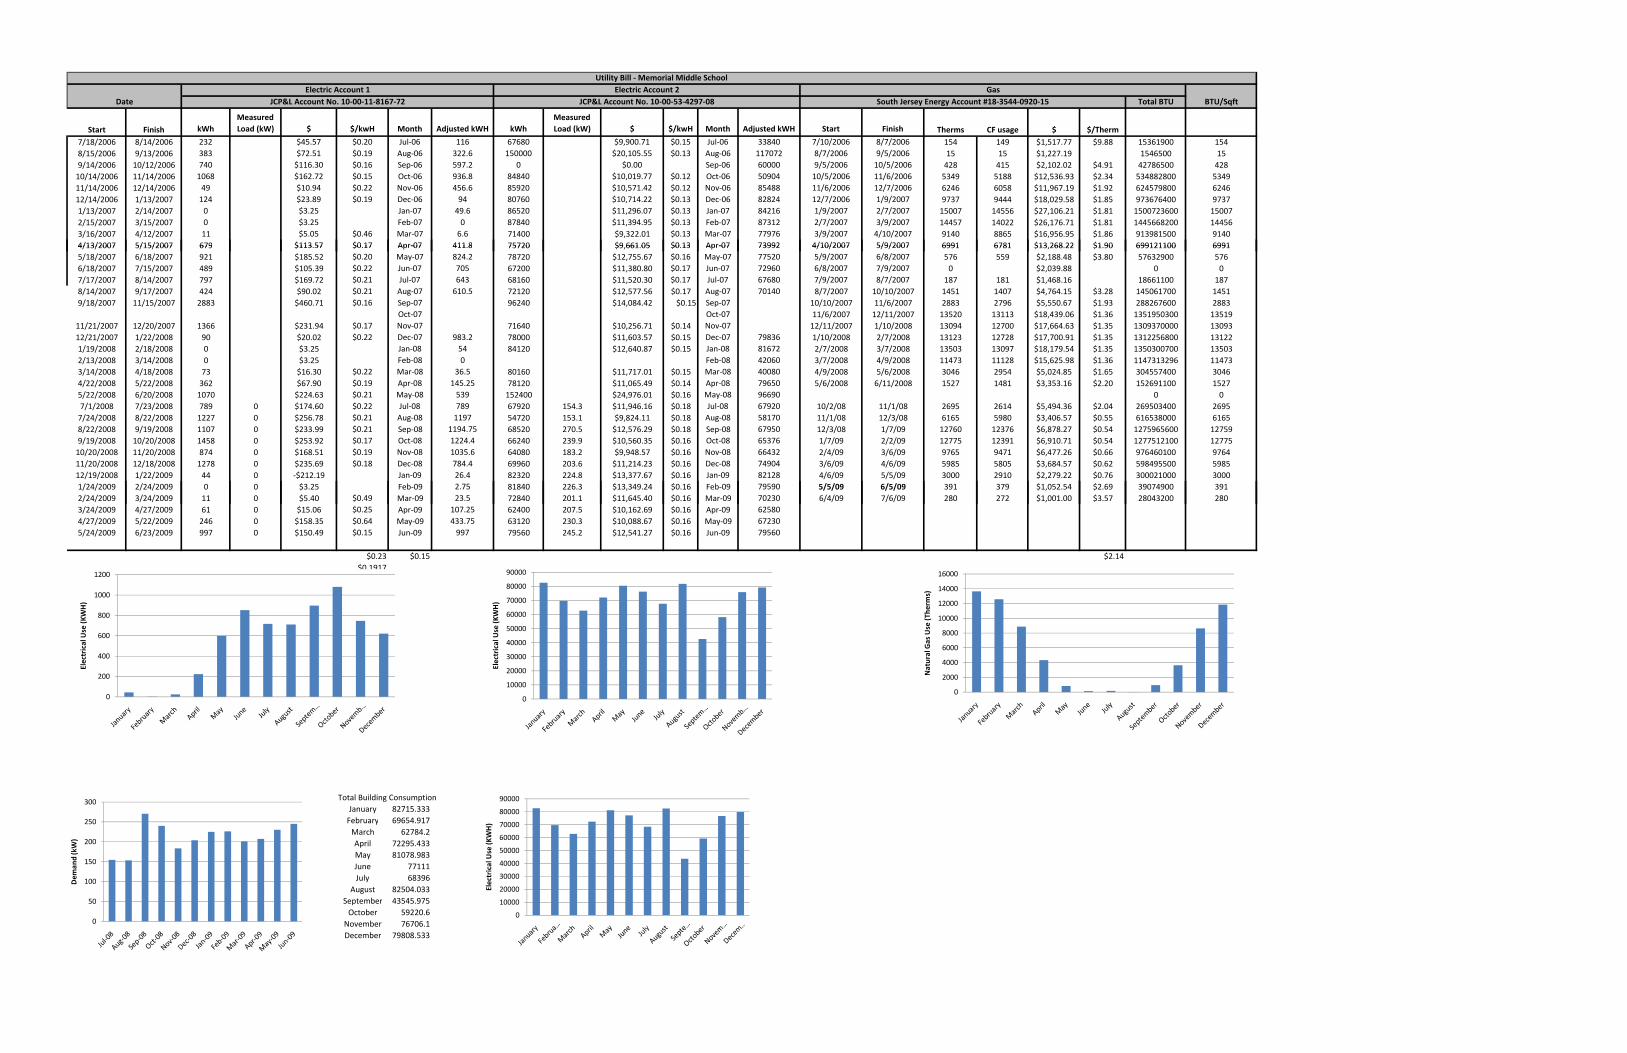
Total BTU
Start Finish kWhMeasured Load (kW) $ $/kwH Month Adjusted kWH kWh
Measured Load (kW) $ $/kwH Month Adjusted kWH Start Finish Therms CF usage $ $/Therm
7/18/2006 8/14/2006 232 $45.57 $0.20 Jul‐06 116 67680 $9,900.71 $0.15 Jul‐06 33840 7/10/2006 8/7/2006 154 149 $1,517.77 $9.88 15361900 1548/15/2006 9/13/2006 383 $72.51 $0.19 Aug‐06 322.6 150000 $20,105.55 $0.13 Aug‐06 117072 8/7/2006 9/5/2006 15 15 $1,227.19 1546500 159/14/2006 10/12/2006 740 $116.30 $0.16 Sep‐06 597.2 0 $0.00 Sep‐06 60000 9/5/2006 10/5/2006 428 415 $2,102.02 $4.91 42786500 42810/14/2006 11/14/2006 1068 $162.72 $0.15 Oct‐06 936.8 84840 $10,019.77 $0.12 Oct‐06 50904 10/5/2006 11/6/2006 5349 5188 $12,536.93 $2.34 534882800 534911/14/2006 12/14/2006 49 $10.94 $0.22 Nov‐06 456.6 85920 $10,571.42 $0.12 Nov‐06 85488 11/6/2006 12/7/2006 6246 6058 $11,967.19 $1.92 624579800 624612/14/2006 1/13/2007 124 $23.89 $0.19 Dec‐06 94 80760 $10,714.22 $0.13 Dec‐06 82824 12/7/2006 1/9/2007 9737 9444 $18,029.58 $1.85 973676400 97371/13/2007 2/14/2007 0 $3.25 Jan‐07 49.6 86520 $11,296.07 $0.13 Jan‐07 84216 1/9/2007 2/7/2007 15007 14556 $27,106.21 $1.81 1500723600 150072/15/2007 3/15/2007 0 $3.25 Feb‐07 0 87840 $11,394.95 $0.13 Feb‐07 87312 2/7/2007 3/9/2007 14457 14022 $26,176.71 $1.81 1445668200 144563/16/2007 4/12/2007 11 $5.05 $0.46 Mar‐07 6.6 71400 $9,322.01 $0.13 Mar‐07 77976 3/9/2007 4/10/2007 9140 8865 $16,956.95 $1.86 913981500 91404/13/2007 5/15/2007 679 $113 57 $0 17 Apr‐07 411 8 75720 $9 661 05 $0 13 Apr‐07 73992 4/10/2007 5/9/2007 6991 6781 $13 268 22 $1 90 699121100 6991
Utility Bill ‐ Memorial Middle School
Date BTU/SqftElectric Account 1
JCP&L Account No. 10‐00‐11‐8167‐72Electric Account 2
JCP&L Account No. 10‐00‐53‐4297‐08Gas
South Jersey Energy Account #18‐3544‐0920‐15
4/13/2007 5/15/2007 679 $113.57 $0.17 Apr‐07 411.8 75720 $9,661.05 $0.13 Apr‐07 73992 4/10/2007 5/9/2007 6991 6781 $13,268.22 $1.90 699121100 69915/18/2007 6/18/2007 921 $185.52 $0.20 May‐07 824.2 78720 $12,755.67 $0.16 May‐07 77520 5/9/2007 6/8/2007 576 559 $2,188.48 $3.80 57632900 5766/18/2007 7/15/2007 489 $105.39 $0.22 Jun‐07 705 67200 $11,380.80 $0.17 Jun‐07 72960 6/8/2007 7/9/2007 0 $2,039.88 0 07/17/2007 8/14/2007 797 $169.72 $0.21 Jul‐07 643 68160 $11,520.30 $0.17 Jul‐07 67680 7/9/2007 8/7/2007 187 181 $1,468.16 18661100 1878/14/2007 9/17/2007 424 $90.02 $0.21 Aug‐07 610.5 72120 $12,577.56 $0.17 Aug‐07 70140 8/7/2007 10/10/2007 1451 1407 $4,764.15 $3.28 145061700 14519/18/2007 11/15/2007 2883 $460.71 $0.16 Sep‐07 96240 $14,084.42 $0.15 Sep‐07 10/10/2007 11/6/2007 2883 2796 $5,550.67 $1.93 288267600 2883
Oct‐07 Oct‐07 11/6/2007 12/11/2007 13520 13113 $18,439.06 $1.36 1351950300 1351911/21/2007 12/20/2007 1366 $231.94 $0.17 Nov‐07 71640 $10,256.71 $0.14 Nov‐07 12/11/2007 1/10/2008 13094 12700 $17,664.63 $1.35 1309370000 1309312/21/2007 1/22/2008 90 $20.02 $0.22 Dec‐07 983.2 78000 $11,603.57 $0.15 Dec‐07 79836 1/10/2008 2/7/2008 13123 12728 $17,700.91 $1.35 1312256800 131221/19/2008 2/18/2008 0 $3.25 Jan‐08 54 84120 $12,640.87 $0.15 Jan‐08 81672 2/7/2008 3/7/2008 13503 13097 $18,179.54 $1.35 1350300700 135032/13/2008 3/14/2008 0 $3.25 Feb‐08 0 Feb‐08 42060 3/7/2008 4/9/2008 11473 11128 $15,625.98 $1.36 1147313296 114733/14/2008 4/18/2008 73 $16.30 $0.22 Mar‐08 36.5 80160 $11,717.01 $0.15 Mar‐08 40080 4/9/2008 5/6/2008 3046 2954 $5,024.85 $1.65 304557400 30464/22/2008 5/22/2008 362 $67.90 $0.19 Apr‐08 145.25 78120 $11,065.49 $0.14 Apr‐08 79650 5/6/2008 6/11/2008 1527 1481 $3,353.16 $2.20 152691100 15275/22/2008 6/20/2008 1070 $224.63 $0.21 May‐08 539 152400 $24,976.01 $0.16 May‐08 96690 0 07/1/2008 7/23/2008 789 0 $174.60 $0.22 Jul‐08 789 67920 154.3 $11,946.16 $0.18 Jul‐08 67920 10/2/08 11/1/08 2695 2614 $5,494.36 $2.04 269503400 26957/24/2008 8/22/2008 1227 0 $256.78 $0.21 Aug‐08 1197 54720 153.1 $9,824.11 $0.18 Aug‐08 58170 11/1/08 12/3/08 6165 5980 $3,406.57 $0.55 616538000 61658/22/2008 9/19/2008 1107 0 $233.99 $0.21 Sep‐08 1194.75 68520 270.5 $12,576.29 $0.18 Sep‐08 67950 12/3/08 1/7/09 12760 12376 $6,878.27 $0.54 1275965600 127599/19/2008 10/20/2008 1458 0 $253.92 $0.17 Oct‐08 1224.4 66240 239.9 $10,560.35 $0.16 Oct‐08 65376 1/7/09 2/2/09 12775 12391 $6,910.71 $0.54 1277512100 1277510/20/2008 11/20/2008 874 0 $168.51 $0.19 Nov‐08 1035.6 64080 183.2 $9,948.57 $0.16 Nov‐08 66432 2/4/09 3/6/09 9765 9471 $6,477.26 $0.66 976460100 976411/20/2008 12/18/2008 1278 0 $235.69 $0.18 Dec‐08 784.4 69960 203.6 $11,214.23 $0.16 Dec‐08 74904 3/6/09 4/6/09 5985 5805 $3,684.57 $0.62 598495500 598512/19/2008 1/22/2009 44 0 ‐$212.19 Jan‐09 26.4 82320 224.8 $13,377.67 $0.16 Jan‐09 82128 4/6/09 5/5/09 3000 2910 $2,279.22 $0.76 300021000 30001/24/2009 2/24/2009 0 0 $3.25 Feb‐09 2.75 81840 226.3 $13,349.24 $0.16 Feb‐09 79590 5/5/09 6/5/09 391 379 $1,052.54 $2.69 39074900 3912/24/2009 3/24/2009 11 0 $5.40 $0.49 Mar‐09 23.5 72840 201.1 $11,645.40 $0.16 Mar‐09 70230 6/4/09 7/6/09 280 272 $1,001.00 $3.57 28043200 2803/24/2009 4/27/2009 61 0 $15.06 $0.25 Apr‐09 107.25 62400 207.5 $10,162.69 $0.16 Apr‐09 625804/27/2009 5/22/2009 246 0 $158.35 $0.64 May‐09 433.75 63120 230.3 $10,088.67 $0.16 May‐09 672305/24/2009 6/23/2009 997 0 $150.49 $0.15 Jun‐09 997 79560 245.2 $12,541.27 $0.16 Jun‐09 79560
$0.23 $0.15 $2.14$0.1917
January 43.3333333 January 82672 January 13635February 0.91666667 February 69654 February 12575March 22.2 March 62762 March 8866April 221.433333 April 72074 April 4346May 598.983333 May 80480 May 831.33June 851 June 76260 June 140July 716 July 67680 July 170.12
August 710.033333 August 81794 August 15September 895.975 September 42650 September 939October 1080.6 October 58140 October 3642November 746.1 November 75960 November 8644December 620.533333 December 79188 December 11863
0
2000
4000
6000
8000
10000
12000
14000
16000
Natural Gas Use (T
herm
s)
0
200
400
600
800
1000
1200
Electrical Use (K
WH)
0
10000
20000
30000
40000
50000
60000
70000
80000
90000
Electrical Use (K
WH)
Total Building ConsumptionJanuary 82715.333February 69654.917March 62784.2April 72295.433May 81078.983June 77111July 68396
August 82504.033September 43545.975October 59220.6November 76706.1December 79808.533
0
10000
20000
30000
40000
50000
60000
70000
80000
90000
Electrical Use (K
WH)
0
50
100
150
200
250
300
Dem
and (kW)
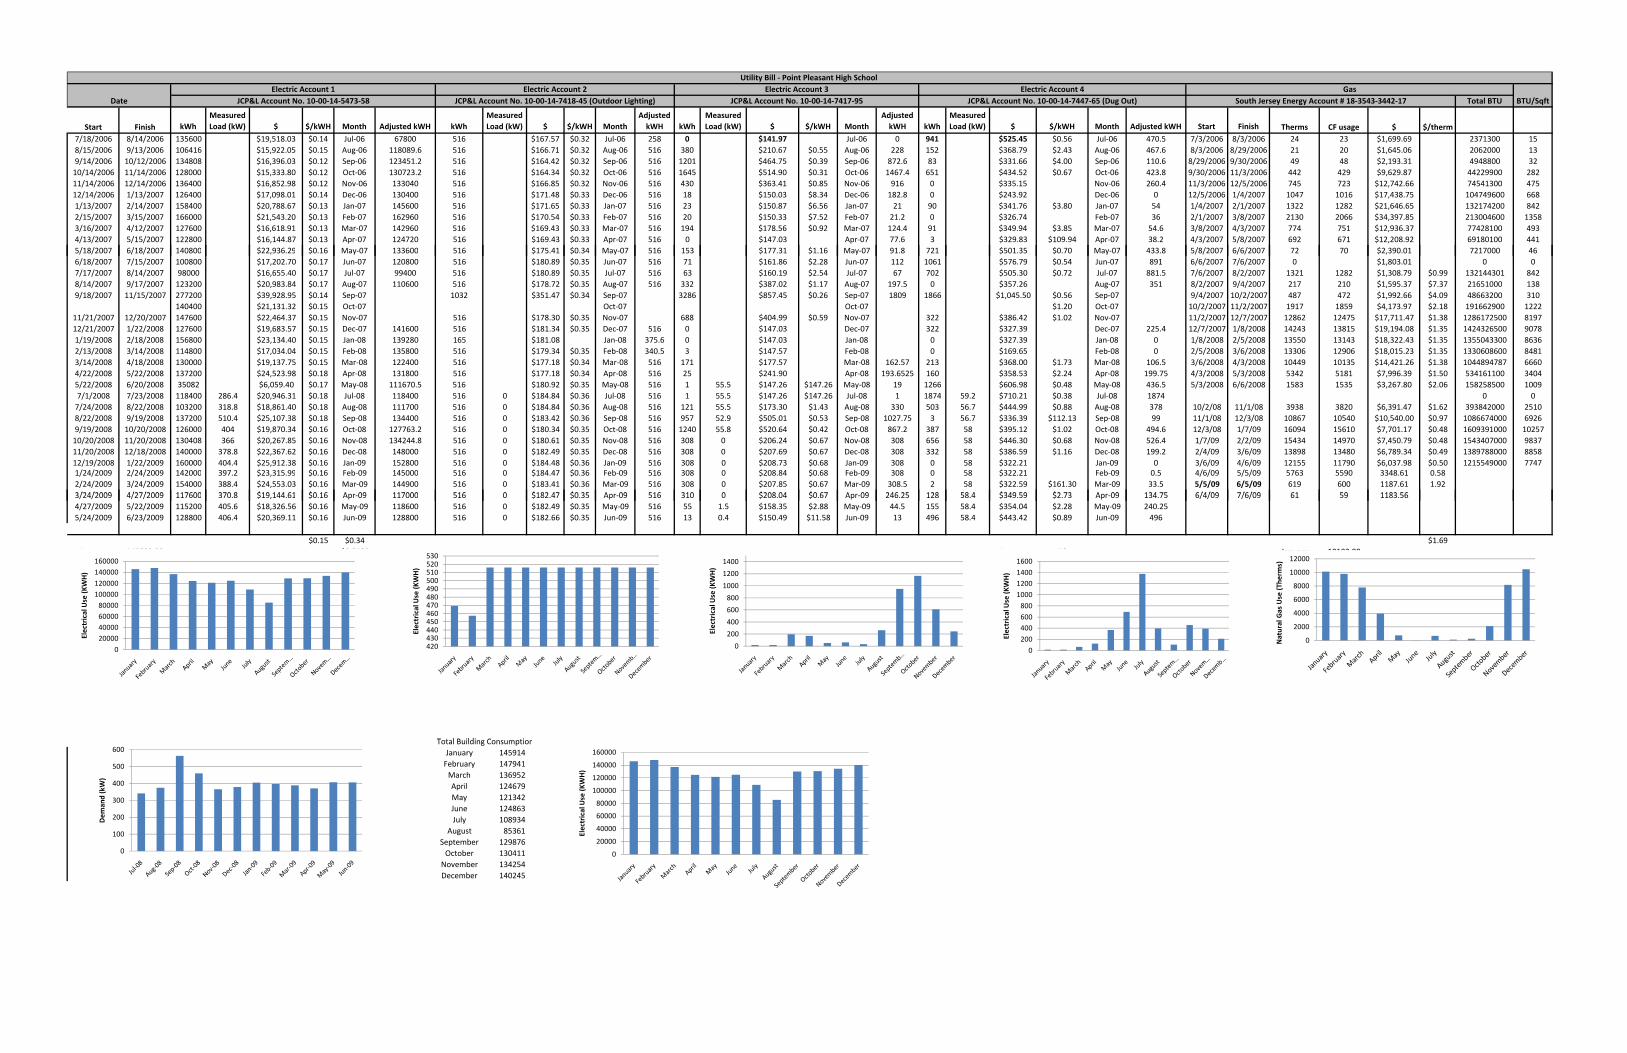
Total BTU
Start Finish kWhMeasured Load (kW) $ $/kWH Month Adjusted kWH kWh
Measured Load (kW) $ $/kWH Month
Adjusted kWH kWh
Measured Load (kW) $ $/kWH Month
Adjusted kWH kWh
Measured Load (kW) $ $/kWH Month Adjusted kWH Start Finish Therms CF usage $ $/therm
7/18/2006 8/14/2006 135600 $19,518.03 $0.14 Jul‐06 67800 516 $167.57 $0.32 Jul‐06 258 0 $141.97 Jul‐06 0 941 $525.45 $0.56 Jul‐06 470.5 7/3/2006 8/3/2006 24 23 $1,699.69 2371300 158/15/2006 9/13/2006 106416 $15,922.05 $0.15 Aug‐06 118089.6 516 $166.71 $0.32 Aug‐06 516 380 $210.67 $0.55 Aug‐06 228 152 $368.79 $2.43 Aug‐06 467.6 8/3/2006 8/29/2006 21 20 $1,645.06 2062000 139/14/2006 10/12/2006 134808 $16,396.03 $0.12 Sep‐06 123451.2 516 $164.42 $0.32 Sep‐06 516 1201 $464.75 $0.39 Sep‐06 872.6 83 $331.66 $4.00 Sep‐06 110.6 8/29/2006 9/30/2006 49 48 $2,193.31 4948800 3210/14/2006 11/14/2006 128000 $15,333.80 $0.12 Oct‐06 130723.2 516 $164.34 $0.32 Oct‐06 516 1645 $514.90 $0.31 Oct‐06 1467.4 651 $434.52 $0.67 Oct‐06 423.8 9/30/2006 11/3/2006 442 429 $9,629.87 44229900 28211/14/2006 12/14/2006 136400 $16,852.98 $0.12 Nov‐06 133040 516 $166.85 $0.32 Nov‐06 516 430 $363.41 $0.85 Nov‐06 916 0 $335.15 Nov‐06 260.4 11/3/2006 12/5/2006 745 723 $12,742.66 74541300 47512/14/2006 1/13/2007 126400 $17,098.01 $0.14 Dec‐06 130400 516 $171.48 $0.33 Dec‐06 516 18 $150.03 $8.34 Dec‐06 182.8 0 $243.92 Dec‐06 0 12/5/2006 1/4/2007 1047 1016 $17,438.75 104749600 6681/13/2007 2/14/2007 158400 $20,788.67 $0.13 Jan‐07 145600 516 $171.65 $0.33 Jan‐07 516 23 $150.87 $6.56 Jan‐07 21 90 $341.76 $3.80 Jan‐07 54 1/4/2007 2/1/2007 1322 1282 $21,646.65 132174200 8422/15/2007 3/15/2007 166000 $21,543.20 $0.13 Feb‐07 162960 516 $170.54 $0.33 Feb‐07 516 20 $150.33 $7.52 Feb‐07 21.2 0 $326.74 Feb‐07 36 2/1/2007 3/8/2007 2130 2066 $34,397.85 213004600 13583/16/2007 4/12/2007 127600 $16,618.91 $0.13 Mar‐07 142960 516 $169.43 $0.33 Mar‐07 516 194 $178.56 $0.92 Mar‐07 124.4 91 $349.94 $3.85 Mar‐07 54.6 3/8/2007 4/3/2007 774 751 $12,936.37 77428100 4934/13/2007 5/15/2007 122800 $16,144.87 $0.13 Apr‐07 124720 516 $169.43 $0.33 Apr‐07 516 0 $147.03 Apr‐07 77.6 3 $329.83 $109.94 Apr‐07 38.2 4/3/2007 5/8/2007 692 671 $12,208.92 69180100 441
Utility Bill ‐ Point Pleasant High School
Date BTU/SqftElectric Account 1
JCP&L Account No. 10‐00‐14‐5473‐58Electric Account 2
JCP&L Account No. 10‐00‐14‐7418‐45 (Outdoor Lighting)Electric Account 3
JCP&L Account No. 10‐00‐14‐7417‐95Electric Account 4
JCP&L Account No. 10‐00‐14‐7447‐65 (Dug Out)Gas
South Jersey Energy Account # 18‐3543‐3442‐17
5/18/2007 6/18/2007 140800 $22,936.29 $0.16 May‐07 133600 516 $175.41 $0.34 May‐07 516 153 $177.31 $1.16 May‐07 91.8 721 $501.35 $0.70 May‐07 433.8 5/8/2007 6/6/2007 72 70 $2,390.01 7217000 466/18/2007 7/15/2007 100800 $17,202.70 $0.17 Jun‐07 120800 516 $180.89 $0.35 Jun‐07 516 71 $161.86 $2.28 Jun‐07 112 1061 $576.79 $0.54 Jun‐07 891 6/6/2007 7/6/2007 0 $1,803.01 0 07/17/2007 8/14/2007 98000 $16,655.40 $0.17 Jul‐07 99400 516 $180.89 $0.35 Jul‐07 516 63 $160.19 $2.54 Jul‐07 67 702 $505.30 $0.72 Jul‐07 881.5 7/6/2007 8/2/2007 1321 1282 $1,308.79 $0.99 132144301 8428/14/2007 9/17/2007 123200 $20,983.84 $0.17 Aug‐07 110600 516 $178.72 $0.35 Aug‐07 516 332 $387.02 $1.17 Aug‐07 197.5 0 $357.26 Aug‐07 351 8/2/2007 9/4/2007 217 210 $1,595.37 $7.37 21651000 1389/18/2007 11/15/2007 277200 $39,928.95 $0.14 Sep‐07 1032 $351.47 $0.34 Sep‐07 3286 $857.45 $0.26 Sep‐07 1809 1866 $1,045.50 $0.56 Sep‐07 9/4/2007 10/2/2007 487 472 $1,992.66 $4.09 48663200 310
140400 $21,131.32 $0.15 Oct‐07 Oct‐07 Oct‐07 $1.20 Oct‐07 10/2/2007 11/2/2007 1917 1859 $4,173.97 $2.18 191662900 122211/21/2007 12/20/2007 147600 $22,464.37 $0.15 Nov‐07 516 $178.30 $0.35 Nov‐07 688 $404.99 $0.59 Nov‐07 322 $386.42 $1.02 Nov‐07 11/2/2007 12/7/2007 12862 12475 $17,711.47 $1.38 1286172500 819712/21/2007 1/22/2008 127600 $19,683.57 $0.15 Dec‐07 141600 516 $181.34 $0.35 Dec‐07 516 0 $147.03 Dec‐07 322 $327.39 Dec‐07 225.4 12/7/2007 1/8/2008 14243 13815 $19,194.08 $1.35 1424326500 90781/19/2008 2/18/2008 156800 $23,134.40 $0.15 Jan‐08 139280 165 $181.08 Jan‐08 375.6 0 $147.03 Jan‐08 0 $327.39 Jan‐08 0 1/8/2008 2/5/2008 13550 13143 $18,322.43 $1.35 1355043300 86362/13/2008 3/14/2008 114800 $17,034.04 $0.15 Feb‐08 135800 516 $179.34 $0.35 Feb‐08 340.5 3 $147.57 Feb‐08 0 $169.65 Feb‐08 0 2/5/2008 3/6/2008 13306 12906 $18,015.23 $1.35 1330608600 84813/14/2008 4/18/2008 130000 $19,137.75 $0.15 Mar‐08 122400 516 $177.18 $0.34 Mar‐08 516 171 $177.57 Mar‐08 162.57 213 $368.00 $1.73 Mar‐08 106.5 3/6/2008 4/3/2008 10449 10135 $14,421.26 $1.38 1044894787 66604/22/2008 5/22/2008 137200 $24,523.98 $0.18 Apr‐08 131800 516 $177.18 $0.34 Apr‐08 516 25 $241.90 Apr‐08 193.6525 160 $358.53 $2.24 Apr‐08 199.75 4/3/2008 5/3/2008 5342 5181 $7,996.39 $1.50 534161100 34045/22/2008 6/20/2008 35082 $6,059.40 $0.17 May‐08 111670.5 516 $180.92 $0.35 May‐08 516 1 55.5 $147.26 $147.26 May‐08 19 1266 $606.98 $0.48 May‐08 436.5 5/3/2008 6/6/2008 1583 1535 $3,267.80 $2.06 158258500 10097/1/2008 7/23/2008 118400 286.4 $20,946.31 $0.18 Jul‐08 118400 516 0 $184.84 $0.36 Jul‐08 516 1 55.5 $147.26 $147.26 Jul‐08 1 1874 59.2 $710.21 $0.38 Jul‐08 1874 0 07/24/2008 8/22/2008 103200 318.8 $18,861.40 $0.18 Aug‐08 111700 516 0 $184.84 $0.36 Aug‐08 516 121 55.5 $173.30 $1.43 Aug‐08 330 503 56.7 $444.99 $0.88 Aug‐08 378 10/2/08 11/1/08 3938 3820 $6,391.47 $1.62 393842000 25108/22/2008 9/19/2008 137200 510.4 $25,107.38 $0.18 Sep‐08 134400 516 0 $183.42 $0.36 Sep‐08 516 957 52.9 $505.01 $0.53 Sep‐08 1027.75 3 56.7 $336.39 $112.13 Sep‐08 99 11/1/08 12/3/08 10867 10540 $10,540.00 $0.97 1086674000 69269/19/2008 10/20/2008 126000 404 $19,870.34 $0.16 Oct‐08 127763.2 516 0 $180.34 $0.35 Oct‐08 516 1240 55.8 $520.64 $0.42 Oct‐08 867.2 387 58 $395.12 $1.02 Oct‐08 494.6 12/3/08 1/7/09 16094 15610 $7,701.17 $0.48 1609391000 1025710/20/2008 11/20/2008 130408 366 $20,267.85 $0.16 Nov‐08 134244.8 516 0 $180.61 $0.35 Nov‐08 516 308 0 $206.24 $0.67 Nov‐08 308 656 58 $446.30 $0.68 Nov‐08 526.4 1/7/09 2/2/09 15434 14970 $7,450.79 $0.48 1543407000 983711/20/2008 12/18/2008 140000 378.8 $22,367.62 $0.16 Dec‐08 148000 516 0 $182.49 $0.35 Dec‐08 516 308 0 $207.69 $0.67 Dec‐08 308 332 58 $386.59 $1.16 Dec‐08 199.2 2/4/09 3/6/09 13898 13480 $6,789.34 $0.49 1389788000 885812/19/2008 1/22/2009 160000 404.4 $25,912.38 $0.16 Jan‐09 152800 516 0 $184.48 $0.36 Jan‐09 516 308 0 $208.73 $0.68 Jan‐09 308 0 58 $322.21 Jan‐09 0 3/6/09 4/6/09 12155 11790 $6,037.98 $0.50 1215549000 77471/24/2009 2/24/2009 142000 397.2 $23,315.99 $0.16 Feb‐09 145000 516 0 $184.47 $0.36 Feb‐09 516 308 0 $208.84 $0.68 Feb‐09 308 0 58 $322.21 Feb‐09 0.5 4/6/09 5/5/09 5763 5590 3348.61 0.582/24/2009 3/24/2009 154000 388.4 $24,553.03 $0.16 Mar‐09 144900 516 0 $183.41 $0.36 Mar‐09 516 308 0 $207.85 $0.67 Mar‐09 308.5 2 58 $322.59 $161.30 Mar‐09 33.5 5/5/09 6/5/09 619 600 1187.61 1.923/24/2009 4/27/2009 117600 370 8 $19 144 61 $0 16 A 09 117000 516 0 $182 47 $0 35 A 09 516 310 0 $208 04 $0 67 A 09 246 25 128 58 4 $349 59 $2 73 A 09 134 75 6/4/09 7/6/09 61 59 1183 563/24/2009 4/27/2009 117600 370.8 $19,144.61 $0.16 Apr‐09 117000 516 0 $182.47 $0.35 Apr‐09 516 310 0 $208.04 $0.67 Apr‐09 246.25 128 58.4 $349.59 $2.73 Apr‐09 134.75 6/4/09 7/6/09 61 59 1183.564/27/2009 5/22/2009 115200 405.6 $18,326.56 $0.16 May‐09 118600 516 0 $182.49 $0.35 May‐09 516 55 1.5 $158.35 $2.88 May‐09 44.5 155 58.4 $354.04 $2.28 May‐09 240.255/24/2009 6/23/2009 128800 406.4 $20,369.11 $0.16 Jun‐09 128800 516 0 $182.66 $0.35 Jun‐09 516 13 0.4 $150.49 $11.58 Jun‐09 13 496 58.4 $443.42 $0.89 Jun‐09 496
$0.15 $0.34 $1.69
January 145893.33 $0.2483 January 469.2 January 21 January 18 January 10102.08February 147920.00 156,902 February 457.5 February 21.2 February 18.25 February 9778March 136753.33 March 516 March 198.49 March 64.86666667 March 7793April 124506.67 April 516 April 172.5008333 April 124.2333333 April 3932May 121290.17 May 516 May 51.76666667 May 370.1833333 May 758June 124800.00 June 516 June 62.5 June 693.5 June 30.41July 108900.00 July 516 July 34 July 1377.75 July 673
August 85097.40 August 516 August 263.75 August 398.8666667 August 119September 128925.60 September 516 September 950.175 September 104.8 September 268October 129243.20 October 516 October 1167.3 October 459.2 October 2099November 133642.40 November 516 November 612 November 393.4 November 8158December 140000.00 December 516 December 245.4 December 212.3 December 10462
T l B ildi C i
020000400006000080000
100000120000140000160000
Electrical Use (K
WH)
0
2000
4000
6000
8000
10000
12000
Natural Gas Use (T
herm
s)
420430440450460470480490500510520530
Electrical Use (K
WH)
0
200
400
600
800
1000
1200
1400
Electrical Use (K
WH)
0200400600800
1000120014001600
Electrical Use (K
WH)
Total Building ConsumptionJul‐08 341.9 January 145914Aug‐08 374.3 February 147941Sep‐08 563.3 March 136952Oct‐08 459.8 April 124679Nov‐08 366 May 121342Dec‐08 378.8 June 124863Jan‐09 404.4 July 108934Feb‐09 397.2 August 85361Mar‐09 388.4 September 129876Apr‐09 370.8 October 130411May‐09 407.1 November 134254Jun‐09 406.8 December 140245
0
100
200
300
400
500
600
Dem
and (kW)
0
20000
40000
60000
80000
100000
120000
140000
160000
Electrical Use (K
WH)
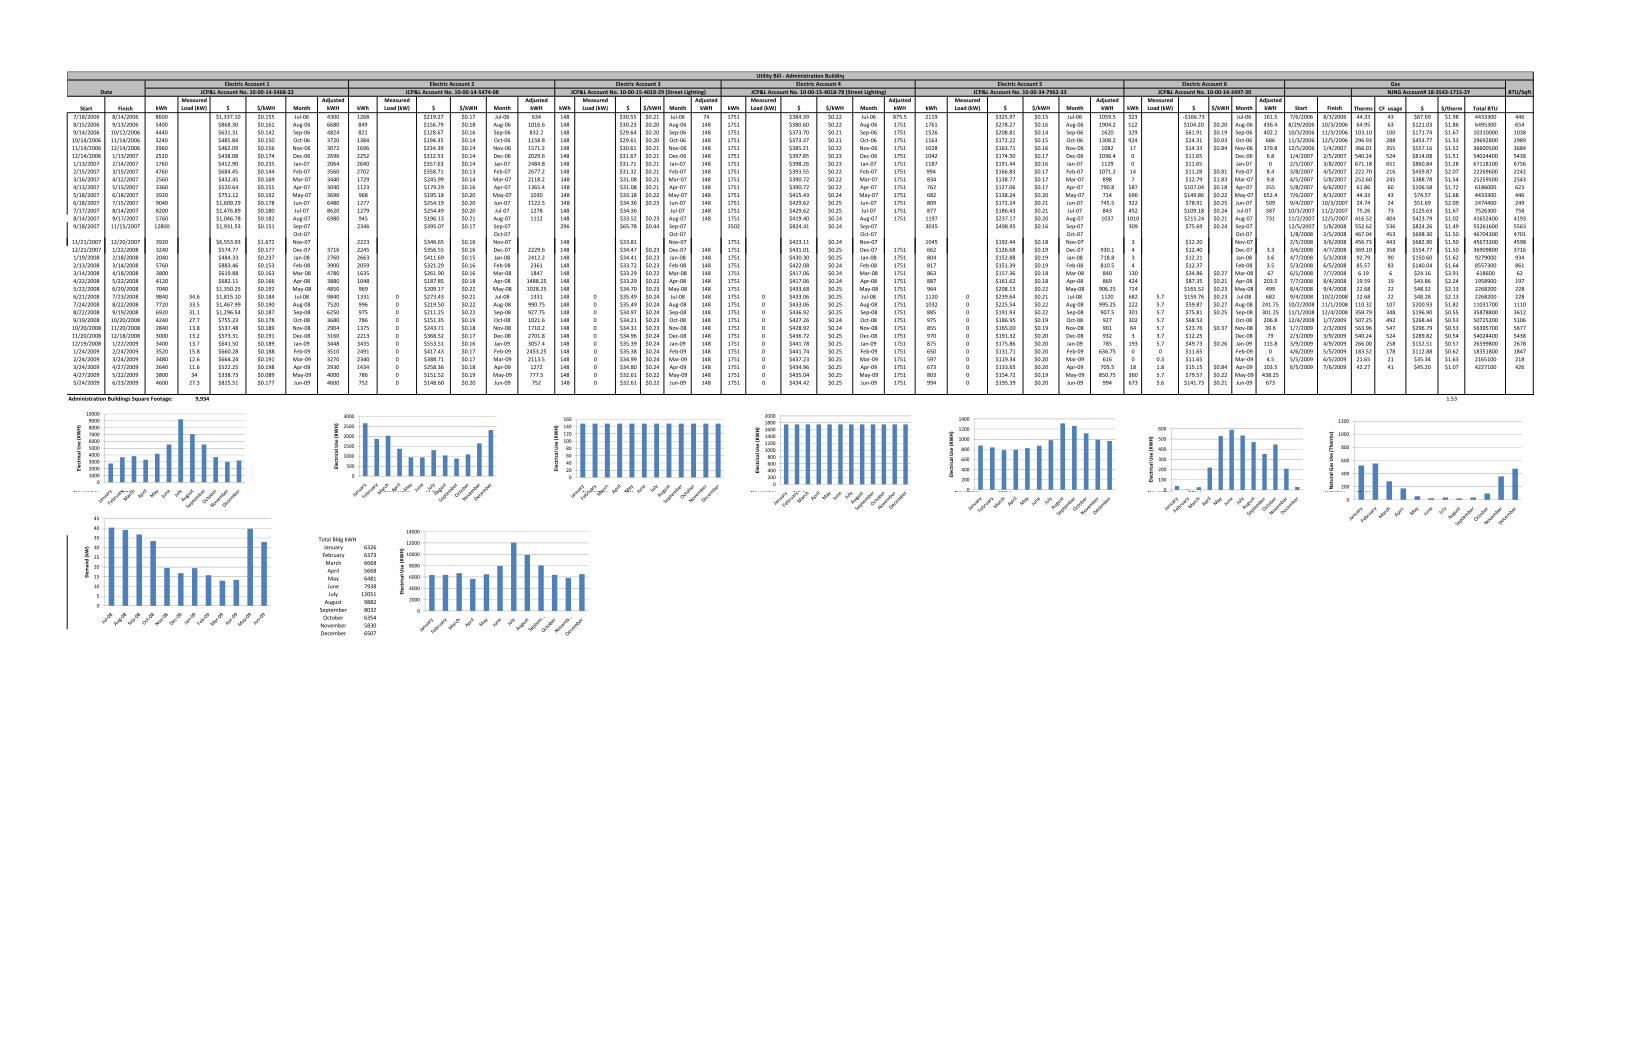
Start Finish kWhMeasured Load (kW) $ $/kWH Month
Adjusted kWH kWh
Measured Load (kW) $ $/kWH Month
Adjusted kWH kWh
Measured Load (kW) $ $/kWH Month
Adjusted kWH kWh
Measured Load (kW) $ $/kWH Month
Adjusted kWH kWh
Measured Load (kW) $ $/kWH Month
Adjusted kWH kWh
Measured Load (kW) $ $/kWH Month
Adjusted kWH Start Finish Therms CF usage $ $/therm Total BTU
7/18/2006 8/14/2006 8600 $1,337.10 $0.155 Jul‐06 4300 1268 $219.27 $0.17 Jul‐06 634 148 $30.55 $0.21 Jul‐06 74 1751 $384.39 $0.22 Jul‐06 875.5 2119 $325.97 $0.15 Jul‐06 1059.5 323 ‐$166.73 Jul‐06 161.5 7/6/2006 8/3/2006 44.33 43 $87.69 $1.98 4433300 4468/15/2006 9/13/2006 5400 $868.30 $0.161 Aug‐06 6680 849 $156.79 $0.18 Aug‐06 1016.6 148 $30.23 $0.20 Aug‐06 148 1751 $380.60 $0.22 Aug‐06 1751 1761 $278.27 $0.16 Aug‐06 1904.2 512 $104.20 $0.20 Aug‐06 436.4 8/29/2006 10/3/2006 64.95 63 $121.03 $1.86 6495300 6549/14/2006 10/12/2006 4440 $631.31 $0.142 Sep‐06 4824 821 $128.67 $0.16 Sep‐06 832.2 148 $29.64 $0.20 Sep‐06 148 1751 $373.70 $0.21 Sep‐06 1751 1526 $208.81 $0.14 Sep‐06 1620 329 $61.91 $0.19 Sep‐06 402.2 10/3/2006 11/3/2006 103.10 100 $171.74 $1.67 10310000 103810/14/2006 11/14/2006 3240 $485.84 $0.150 Oct‐06 3720 1384 $194.35 $0.14 Oct‐06 1158.8 148 $29.61 $0.20 Oct‐06 148 1751 $373.37 $0.21 Oct‐06 1751 1163 $172.22 $0.15 Oct‐06 1308.2 924 $24.31 $0.03 Oct‐06 686 11/3/2006 12/5/2006 296.93 288 $453.77 $1.53 29692800 298911/14/2006 12/14/2006 2960 $462.09 $0.156 Nov‐06 3072 1696 $234.39 $0.14 Nov‐06 1571.2 148 $30.61 $0.21 Nov‐06 148 1751 $385.21 $0.22 Nov‐06 1751 1028 $163.71 $0.16 Nov‐06 1082 17 $14.33 $0.84 Nov‐06 379.8 12/5/2006 1/4/2007 366.01 355 $557.16 $1.52 36600500 368412/14/2006 1/13/2007 2520 $438.08 $0.174 Dec‐06 2696 2252 $312.53 $0.14 Dec‐06 2029.6 148 $31.67 $0.21 Dec‐06 148 1751 $397.85 $0.23 Dec‐06 1751 1042 $174.50 $0.17 Dec‐06 1036.4 0 $11.65 Dec‐06 6.8 1/4/2007 2/5/2007 540.24 524 $814.08 $1.51 54024400 54381/13/2007 2/14/2007 1760 $412.90 $0.235 Jan‐07 2064 2640 $357.63 $0.14 Jan‐07 2484.8 148 $31.71 $0.21 Jan‐07 148 1751 $398.26 $0.23 Jan‐07 1751 1187 $191.44 $0.16 Jan‐07 1129 0 $11.65 Jan‐07 0 2/5/2007 3/8/2007 671.18 651 $860.84 $1.28 67118100 67562/15/2007 3/15/2007 4760 $684.45 $0.144 Feb‐07 3560 2702 $358.71 $0.13 Feb‐07 2677.2 148 $31.32 $0.21 Feb‐07 148 1751 $393.55 $0.22 Feb‐07 1751 994 $166.83 $0.17 Feb‐07 1071.2 14 $11.28 $0.81 Feb‐07 8.4 3/8/2007 4/5/2007 222.70 216 $459.87 $2.07 22269600 22423/16/2007 4/12/2007 2560 $432.45 $0.169 Mar‐07 3440 1729 $245.99 $0.14 Mar‐07 2118.2 148 $31.08 $0.21 Mar‐07 148 1751 $390.72 $0.22 Mar‐07 1751 834 $138.77 $0.17 Mar‐07 898 7 $12.79 $1.83 Mar‐07 9.8 4/5/2007 5/8/2007 252.60 245 $388.78 $1.54 25259500 25434/13/2007 5/15/2007 3360 $520.64 $0.155 Apr‐07 3040 1123 $179.29 $0.16 Apr‐07 1365.4 148 $31.08 $0.21 Apr‐07 148 1751 $390.72 $0.22 Apr‐07 1751 762 $127.06 $0.17 Apr‐07 790.8 587 $107.04 $0.18 Apr‐07 355 5/8/2007 6/6/2007 61.86 60 $106.58 $1.72 6186000 6235/18/2007 6/18/2007 3920 $751.12 $0.192 May‐07 3696 968 $195.18 $0.20 May‐07 1030 148 $33.18 $0.22 May‐07 148 1751 $415.43 $0.24 May‐07 1751 682 $138.24 $0.20 May‐07 714 696 $149.86 $0.22 May‐07 652.4 7/6/2007 8/3/2007 44.33 43 $74.57 $1.68 4433300 4466/18/2007 7/15/2007 9040 $1,609.29 $0.178 Jun‐07 6480 1277 $254.19 $0.20 Jun‐07 1122.5 148 $34.36 $0.23 Jun‐07 148 1751 $429.62 $0.25 Jun‐07 1751 809 $172.24 $0.21 Jun‐07 745.5 322 $78.91 $0.25 Jun‐07 509 9/4/2007 10/3/2007 24.74 24 $51.69 $2.09 2474400 2497/17/2007 8/14/2007 8200 $1,476.89 $0.180 Jul‐07 8620 1279 $254.49 $0.20 Jul‐07 1278 148 $34.36 Jul‐07 148 1751 $429.62 $0.25 Jul‐07 1751 877 $186.43 $0.21 Jul‐07 843 452 $109.18 $0.24 Jul‐07 387 10/3/2007 11/2/2007 75.26 73 $125.63 $1.67 7526300 7588/14/2007 9/17/2007 5760 $1,046.78 $0.182 Aug‐07 6980 945 $196.13 $0.21 Aug‐07 1112 148 $33.52 $0.23 Aug‐07 148 1751 $419.40 $0.24 Aug‐07 1751 1197 $237.17 $0.20 Aug‐07 1037 1010 $215.24 $0.21 Aug‐07 731 11/2/2007 12/5/2007 416.52 404 $423.79 $1.02 41652400 41939/18/2007 11/15/2007 12800 $1,931.53 $0.151 Sep‐07 2346 $395.07 $0.17 Sep‐07 296 $65.78 $0.44 Sep‐07 3502 $824.41 $0.24 Sep‐07 3035 $498.95 $0.16 Sep‐07 309 $75.69 $0.24 Sep‐07 12/5/2007 1/8/2008 552.62 536 $824.26 $1.49 55261600 5563
Oct‐07 Oct‐07 Oct‐07 Oct‐07 Oct‐07 Oct‐07 1/8/2008 2/5/2008 467.04 453 $698.30 $1.50 46704300 470111/21/2007 12/20/2007 3920 $6,553.93 $1.672 Nov‐07 2223 $346.65 $0.16 Nov‐07 148 $33.81 Nov‐07 1751 $423.11 $0.24 Nov‐07 1045 $192.44 $0.18 Nov‐07 3 $12.20 Nov‐07 2/5/2008 3/6/2008 456.73 443 $682.90 $1.50 45673300 4598
NJNG Account# 18‐3543‐1715‐2Y
Utility Bill ‐ Administration Building
Date BTU/SqftJCP&L Account No. 10‐00‐14‐5468‐22Electric Account 1 Electric Account 2
JCP&L Account No. 10‐00‐14‐5474‐08Electric Account 3
JCP&L Account No. 10‐00‐15‐4018‐29 (Street Lighting)Electric Account 4
JCP&L Account No. 10‐00‐15‐4018‐78 (Street Lighting)Electric Account 5
JCP&L Account No. 10‐00‐34‐7962‐33Electric Account 6
JCP&L Account No. 10‐00‐14‐3497‐30Gas
12/21/2007 1/22/2008 3240 $574.77 $0.177 Dec‐07 3716 2245 $356.55 $0.16 Dec‐07 2229.6 148 $34.47 $0.23 Dec‐07 148 1751 $431.01 $0.25 Dec‐07 1751 662 $126.68 $0.19 Dec‐07 930.1 4 $12.40 Dec‐07 3.3 3/6/2008 4/7/2008 369.10 358 $554.77 $1.50 36909800 37161/19/2008 2/18/2008 2040 $484.33 $0.237 Jan‐08 2760 2663 $411.69 $0.15 Jan‐08 2412.2 148 $34.41 $0.23 Jan‐08 148 1751 $430.30 $0.25 Jan‐08 1751 804 $152.88 $0.19 Jan‐08 718.8 3 $12.21 Jan‐08 3.6 4/7/2008 5/3/2008 92.79 90 $150.60 $1.62 9279000 9342/13/2008 3/14/2008 5760 $883.46 $0.153 Feb‐08 3900 2059 $321.29 $0.16 Feb‐08 2361 148 $33.72 $0.23 Feb‐08 148 1751 $422.08 $0.24 Feb‐08 1751 817 $151.39 $0.19 Feb‐08 810.5 4 $12.37 Feb‐08 3.5 5/3/2008 6/5/2008 85.57 83 $140.04 $1.64 8557300 8613/14/2008 4/18/2008 3800 $619.88 $0.163 Mar‐08 4780 1635 $261.90 $0.16 Mar‐08 1847 148 $33.29 $0.22 Mar‐08 148 1751 $417.06 $0.24 Mar‐08 1751 863 $157.36 $0.18 Mar‐08 840 130 $34.86 $0.27 Mar‐08 67 6/5/2008 7/7/2008 6.19 6 $24.16 $3.91 618600 624/22/2008 5/22/2008 4120 $682.11 $0.166 Apr‐08 3880 1048 $187.85 $0.18 Apr‐08 1488.25 148 $33.29 $0.22 Apr‐08 148 1751 $417.06 $0.24 Apr‐08 1751 887 $161.62 $0.18 Apr‐08 869 424 $87.35 $0.21 Apr‐08 203.5 7/7/2008 8/4/2008 19.59 19 $43.86 $2.24 1958900 1975/22/2008 6/20/2008 7040 $1,350.25 $0.192 May‐08 4850 969 $209.17 $0.22 May‐08 1028.25 148 $34.70 $0.23 May‐08 148 1751 $433.68 $0.25 May‐08 1751 964 $208.13 $0.22 May‐08 906.25 724 $165.52 $0.23 May‐08 499 8/4/2008 9/4/2008 22.68 22 $48.32 $2.13 2268200 2286/21/2008 7/23/2008 9840 34.6 $1,815.10 $0.184 Jul‐08 9840 1331 0 $273.43 $0.21 Jul‐08 1331 148 0 $35.49 $0.24 Jul‐08 148 1751 0 $433.06 $0.25 Jul‐08 1751 1120 0 $239.64 $0.21 Jul‐08 1120 682 5.7 $159.76 $0.23 Jul‐08 682 9/4/2008 10/2/2008 22.68 22 $48.28 $2.13 2268200 2287/24/2008 8/22/2008 7720 33.5 $1,467.99 $0.190 Aug‐08 7520 996 0 $219.50 $0.22 Aug‐08 990.75 148 0 $35.49 $0.24 Aug‐08 148 1751 0 $433.06 $0.25 Aug‐08 1751 1032 0 $225.54 $0.22 Aug‐08 995.25 222 5.7 $59.87 $0.27 Aug‐08 241.75 10/2/2008 11/1/2008 110.32 107 $200.93 $1.82 11031700 11108/22/2008 9/19/2008 6920 31.1 $1,296.54 $0.187 Sep‐08 6250 975 0 $211.25 $0.22 Sep‐08 927.75 148 0 $34.97 $0.24 Sep‐08 148 1751 0 $436.92 $0.25 Sep‐08 1751 885 0 $191.93 $0.22 Sep‐08 907.5 301 5.7 $75.81 $0.25 Sep‐08 301.25 11/1/2008 12/4/2008 358.79 348 $196.90 $0.55 35878800 36129/19/2008 10/20/2008 4240 27.7 $755.23 $0.178 Oct‐08 3680 786 0 $151.35 $0.19 Oct‐08 1021.6 148 0 $34.21 $0.23 Oct‐08 148 1751 0 $427.26 $0.24 Oct‐08 1751 975 0 $186.95 $0.19 Oct‐08 927 302 5.7 $68.53 Oct‐08 206.8 12/4/2008 1/7/2009 507.25 492 $268.44 $0.53 50725200 510610/20/2008 11/20/2008 2840 13.8 $537.48 $0.189 Nov‐08 2904 1375 0 $243.71 $0.18 Nov‐08 1710.2 148 0 $34.31 $0.23 Nov‐08 148 1751 0 $428.92 $0.24 Nov‐08 1751 855 0 $165.00 $0.19 Nov‐08 901 64 5.7 $23.76 $0.37 Nov‐08 39.6 1/7/2009 2/3/2009 563.96 547 $296.79 $0.53 56395700 567711/20/2008 12/18/2008 3000 13.2 $573.31 $0.191 Dec‐08 3160 2213 0 $368.52 $0.17 Dec‐08 2701.8 148 0 $34.96 $0.24 Dec‐08 148 1751 0 $436.72 $0.25 Dec‐08 1751 970 0 $191.32 $0.20 Dec‐08 932 3 3.7 $12.25 Dec‐08 79 2/3/2009 3/9/2009 540.24 524 $289.82 $0.54 54024400 543812/19/2008 1/22/2009 3400 13.7 $641.50 $0.189 Jan‐09 3448 3435 0 $553.51 $0.16 Jan‐09 3057.4 148 0 $35.39 $0.24 Jan‐09 148 1751 0 $441.78 $0.25 Jan‐09 1751 875 0 $175.86 $0.20 Jan‐09 785 193 5.7 $49.73 $0.26 Jan‐09 115.8 3/9/2009 4/9/2009 266.00 258 $152.51 $0.57 26599800 26781/24/2009 2/24/2009 3520 15.8 $660.28 $0.188 Feb‐09 3510 2491 0 $417.43 $0.17 Feb‐09 2453.25 148 0 $35.38 $0.24 Feb‐09 148 1751 0 $441.74 $0.25 Feb‐09 1751 650 0 $131.71 $0.20 Feb‐09 636.75 0 0 $11.65 Feb‐09 0 4/6/2009 5/5/2009 183.52 178 $112.88 $0.62 18351800 18472/24/2009 3/24/2009 3480 12.6 $664.24 $0.191 Mar‐09 3270 2340 0 $388.71 $0.17 Mar‐09 2113.5 148 0 $34.99 $0.24 Mar‐09 148 1751 0 $437.23 $0.25 Mar‐09 1751 597 0 $119.34 $0.20 Mar‐09 616 0 0.3 $11.65 Mar‐09 4.5 5/5/2009 6/5/2009 21.65 21 $35.34 $1.63 2165100 2183/24/2009 4/27/2009 2640 11.6 $522.25 $0.198 Apr‐09 2930 1434 0 $258.36 $0.18 Apr‐09 1272 148 0 $34.80 $0.24 Apr‐09 148 1751 0 $434.96 $0.25 Apr‐09 1751 673 0 $133.65 $0.20 Apr‐09 705.5 18 1.8 $15.15 $0.84 Apr‐09 103.5 6/5/2009 7/6/2009 42.27 41 $45.20 $1.07 4227100 4264/27/2009 5/22/2009 3800 34 $338.73 $0.089 May‐09 4000 786 0 $151.52 $0.19 May‐09 777.5 148 0 $32.61 $0.22 May‐09 148 1751 0 $435.04 $0.25 May‐09 1751 803 0 $154.72 $0.19 May‐09 850.75 360 5.7 $79.57 $0.22 May‐09 438.255/24/2009 6/23/2009 4600 27.3 $815.51 $0.177 Jun‐09 4600 752 0 $148.60 $0.20 Jun‐09 752 148 0 $32.61 $0.22 Jun‐09 148 1751 0 $434.42 $0.25 Jun‐09 1751 994 0 $195.39 $0.20 Jun‐09 994 673 5.6 $141.73 $0.21 Jun‐09 673
Administration Buildings Square Footage: 9,934 1.53
January 2757.333333 January 2651.46667 January 148 January 1751 January 877.6 January 39.8February 3656.666667 February 1872.8625 February 148 February 1751 February 839.4833333 February 3.9666667 January 523.75March 3830 March 2026.23333 March 148 March 1751 March 784.6666667 March 27.1 February 556.05April 3283.333333 April 1375.21667 April 148 April 1751 April 788.4333333 April 220.66667 March 285.93May 4182 May 945.25 May 148 May 1751 May 823.6666667 May 529.88333 April 176.30June 5540 June 937.25 June 148 June 1751 June 869.75 June 591 May 56.36July 9230 July 1304.5 July 148 July 1751 July 981.5 July 534.5 June 24.23
August 7060 August 1039.78333 August 148 August 1751 August 1312.15 August 469.71667 July 36.09September 5537 September 879.975 September 148 September 1751 September 1263.75 September 351.725 August 22.68October 3700 October 1090.2 October 148 October 1751 October 1117.6 October 446.4 September 37.46November 2988 November 1640 7 November 148 November 1751 November 991 5 November 209 7 October 96 23
010002000300040005000600070008000900010000
Electrical Use (K
WH)
200
400
600
800
1000
1200
Natural Gas Use (T
herm
s)
0
500
1000
1500
2000
2500
3000
Electrical Use (K
WH)
020406080100120140160
Electrical Use (K
WH)
0200400600800
100012001400160018002000
Electrical Use (K
WH)
0
200
400
600
800
1000
1200
1400
Electrical Use (K
WH)
0
100
200
300
400
500
600
Electrical Use (K
WH)
November 2988 November 1640.7 November 148 November 1751 November 991.5 November 209.7 October 96.23December 3190.666667 December 2320.33333 December 148 December 1751 December 966.1666667 December 29.7 November 357.41
December 475.29
Jul‐08 40.3 Total Bldg kWHAug‐08 39.2 January 6326Sep‐08 36.8 February 6373Oct‐08 33.4 March 6668Nov‐08 19.5 April 5668Dec‐08 16.9 May 6481Jan‐09 19.4 June 7938Feb‐09 15.8 July 12051Mar‐09 12.9 August 9882Apr‐09 13.4 September 8032May‐09 39.7 October 6354Jun‐09 32.9 November 5830
December 6507
0
0
2000
4000
6000
8000
10000
12000
14000
Electrical Use (K
WH)
0
5
10
15
20
25
30
35
40
45
Dem
and (kW)

APPENDIX B
STATEMENT OF ENERGY PERFORMANCE SUMMARY SHEETS
PORTFOLIO MANAGER REFERENCE GUIDE

OMB No. 2060-0347
STATEMENT OF ENERGY PERFORMANCEOcean Road Elementary School
Building ID: 1832718 For 12-month Period Ending: June 30, 20071
Date SEP becomes ineligible: N/A Date SEP Generated: September 11, 2009
FacilityOcean Road Elementary SchoolBenedict StreetPoint Pleasant, NJ 08742
Facility OwnerPoint Pleasant Borough Board ofEducation2100 Panther Path Point Pleasant, NJ 08742
Primary Contact for this FacilitySteve Corso2100 Panther Path Point Pleasant, NJ 08742
Year Built: 1991Gross Floor Area (ft2): 66,406
Energy Performance Rating2 (1-100) 18
Site Energy Use Summary3
Electricity - Grid Purchase(kBtu) 2,351,243 Natural Gas (kBtu)4 3,754,975 Total Energy (kBtu) 6,106,218
Energy Intensity5 Site (kBtu/ft2/yr) 92 Source (kBtu/ft2/yr) 177 Emissions (based on site energy use) Greenhouse Gas Emissions (MtCO2e/year) 558 Electric Distribution Utility Jersey Central Power & Lt Co National Average Comparison National Average Site EUI 68 National Average Source EUI 131 % Difference from National Average Source EUI 35% Building Type K-12
School
Stamp of Certifying Professional
Based on the conditions observed at thetime of my visit to this building, I certify that
the information contained within thisstatement is accurate.
Meets Industry Standards6 for Indoor EnvironmentalConditions:Ventilation for Acceptable Indoor Air Quality N/A Acceptable Thermal Environmental Conditions N/A Adequate Illumination N/A
Certifying ProfessionalMatthew Goss15 British American Blvd Latham, NY 12110
Notes: 1. Application for the ENERGY STAR must be submitted to EPA within 4 months of the Period Ending date. Award of the ENERGY STAR is not final until approval is received from EPA.2. The EPA Energy Performance Rating is based on total source energy. A rating of 75 is the minimum to be eligible for the ENERGY STAR.3. Values represent energy consumption, annualized to a 12-month period.4. Natural Gas values in units of volume (e.g. cubic feet) are converted to kBtu with adjustments made for elevation based on Facility zip code.5. Values represent energy intensity, annualized to a 12-month period.6. Based on Meeting ASHRAE Standard 62 for ventilation for acceptable indoor air quality, ASHRAE Standard 55 for thermal comfort, and IESNA Lighting Handbook for lighting quality.
The government estimates the average time needed to fill out this form is 6 hours (includes the time for entering energy data, PE facility inspection, and notarizing the SEP) and welcomessuggestions for reducing this level of effort. Send comments (referencing OMB control number) to the Director, Collection Strategies Division, U.S., EPA (2822T), 1200 Pennsylvania Ave., NW,Washington, D.C. 20460.
EPA Form 5900-16
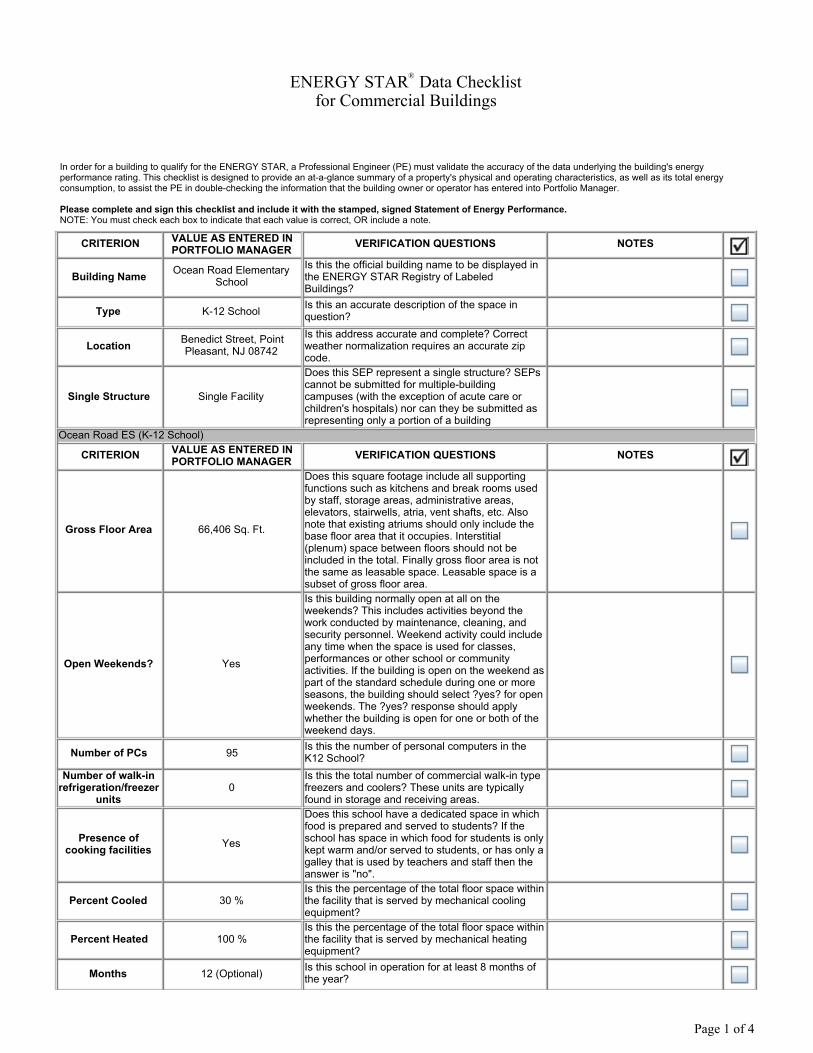
ENERGY STAR®
Data Checklistfor Commercial Buildings
In order for a building to qualify for the ENERGY STAR, a Professional Engineer (PE) must validate the accuracy of the data underlying the building's energyperformance rating. This checklist is designed to provide an at-a-glance summary of a property's physical and operating characteristics, as well as its total energyconsumption, to assist the PE in double-checking the information that the building owner or operator has entered into Portfolio Manager.
Please complete and sign this checklist and include it with the stamped, signed Statement of Energy Performance.NOTE: You must check each box to indicate that each value is correct, OR include a note.
CRITERION VALUE AS ENTERED INPORTFOLIO MANAGER VERIFICATION QUESTIONS NOTES
Building Name Ocean Road Elementary
School Is this the official building name to be displayed inthe ENERGY STAR Registry of LabeledBuildings?
Type K-12 School Is this an accurate description of the space inquestion?
Location Benedict Street, PointPleasant, NJ 08742
Is this address accurate and complete? Correctweather normalization requires an accurate zipcode.
Single Structure Single Facility
Does this SEP represent a single structure? SEPscannot be submitted for multiple-buildingcampuses (with the exception of acute care orchildren's hospitals) nor can they be submitted asrepresenting only a portion of a building
Ocean Road ES (K-12 School)
CRITERION VALUE AS ENTERED INPORTFOLIO MANAGER VERIFICATION QUESTIONS NOTES
Gross Floor Area 66,406 Sq. Ft.
Does this square footage include all supportingfunctions such as kitchens and break rooms usedby staff, storage areas, administrative areas,elevators, stairwells, atria, vent shafts, etc. Alsonote that existing atriums should only include thebase floor area that it occupies. Interstitial(plenum) space between floors should not beincluded in the total. Finally gross floor area is notthe same as leasable space. Leasable space is asubset of gross floor area.
Open Weekends? Yes
Is this building normally open at all on theweekends? This includes activities beyond thework conducted by maintenance, cleaning, andsecurity personnel. Weekend activity could includeany time when the space is used for classes,performances or other school or communityactivities. If the building is open on the weekend aspart of the standard schedule during one or moreseasons, the building should select ?yes? for openweekends. The ?yes? response should applywhether the building is open for one or both of theweekend days.
Number of PCs 95 Is this the number of personal computers in theK12 School?
Number of walk-inrefrigeration/freezer
units 0
Is this the total number of commercial walk-in typefreezers and coolers? These units are typicallyfound in storage and receiving areas.
Presence ofcooking facilities Yes
Does this school have a dedicated space in whichfood is prepared and served to students? If theschool has space in which food for students is onlykept warm and/or served to students, or has only agalley that is used by teachers and staff then theanswer is "no".
Percent Cooled 30 % Is this the percentage of the total floor space withinthe facility that is served by mechanical coolingequipment?
Percent Heated 100 % Is this the percentage of the total floor space withinthe facility that is served by mechanical heatingequipment?
Months 12 (Optional) Is this school in operation for at least 8 months ofthe year?
Page 1 of 4
High School? No
Is this building a high school (teaching grades 10,11, and/or 12)? If the building teaches to highschool students at all, the user should check 'yes'to 'high school'. For example, if the school teachesto grades K-12 (elementary/middle and highschool), the user should check 'yes' to 'highschool'.
Page 2 of 4
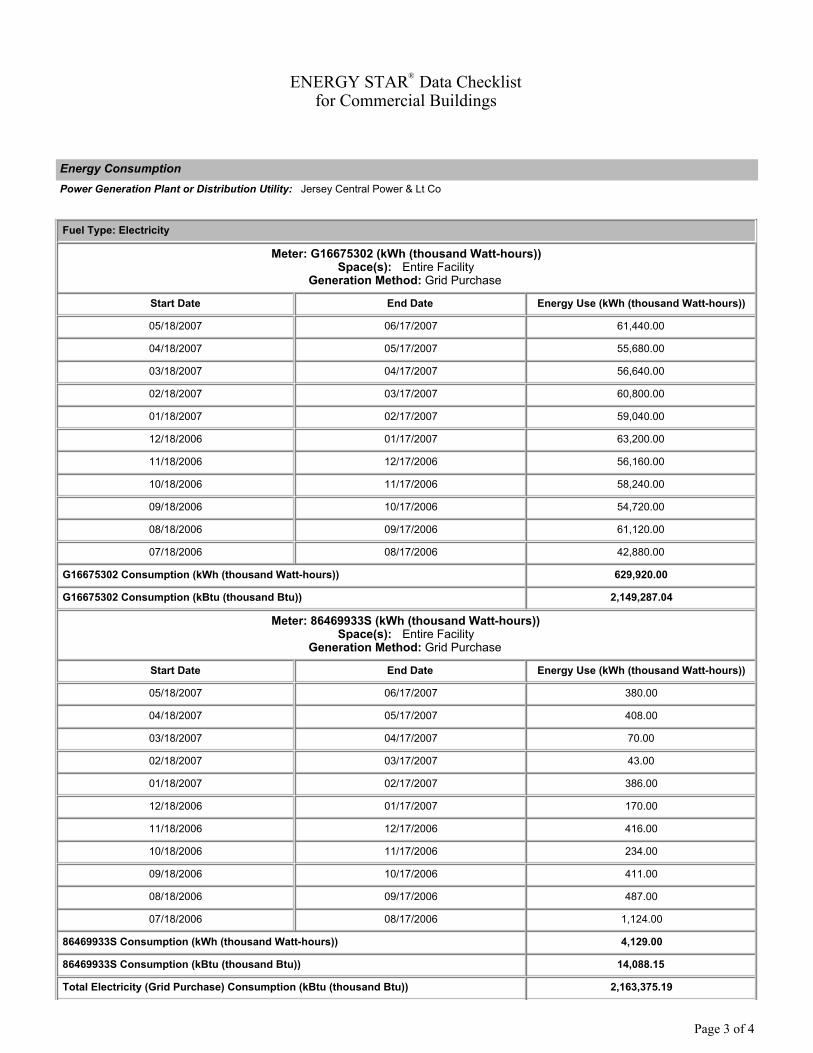
ENERGY STAR®
Data Checklistfor Commercial Buildings
Energy ConsumptionPower Generation Plant or Distribution Utility: Jersey Central Power & Lt Co
Fuel Type: Electricity
Meter: G16675302 (kWh (thousand Watt-hours))Space(s): Entire Facility
Generation Method: Grid Purchase
Start Date End Date Energy Use (kWh (thousand Watt-hours))
05/18/2007 06/17/2007 61,440.00
04/18/2007 05/17/2007 55,680.00
03/18/2007 04/17/2007 56,640.00
02/18/2007 03/17/2007 60,800.00
01/18/2007 02/17/2007 59,040.00
12/18/2006 01/17/2007 63,200.00
11/18/2006 12/17/2006 56,160.00
10/18/2006 11/17/2006 58,240.00
09/18/2006 10/17/2006 54,720.00
08/18/2006 09/17/2006 61,120.00
07/18/2006 08/17/2006 42,880.00
G16675302 Consumption (kWh (thousand Watt-hours)) 629,920.00
G16675302 Consumption (kBtu (thousand Btu)) 2,149,287.04
Meter: 86469933S (kWh (thousand Watt-hours))Space(s): Entire Facility
Generation Method: Grid Purchase
Start Date End Date Energy Use (kWh (thousand Watt-hours))
05/18/2007 06/17/2007 380.00
04/18/2007 05/17/2007 408.00
03/18/2007 04/17/2007 70.00
02/18/2007 03/17/2007 43.00
01/18/2007 02/17/2007 386.00
12/18/2006 01/17/2007 170.00
11/18/2006 12/17/2006 416.00
10/18/2006 11/17/2006 234.00
09/18/2006 10/17/2006 411.00
08/18/2006 09/17/2006 487.00
07/18/2006 08/17/2006 1,124.00
86469933S Consumption (kWh (thousand Watt-hours)) 4,129.00
86469933S Consumption (kBtu (thousand Btu)) 14,088.15
Total Electricity (Grid Purchase) Consumption (kBtu (thousand Btu)) 2,163,375.19
Page 3 of 4
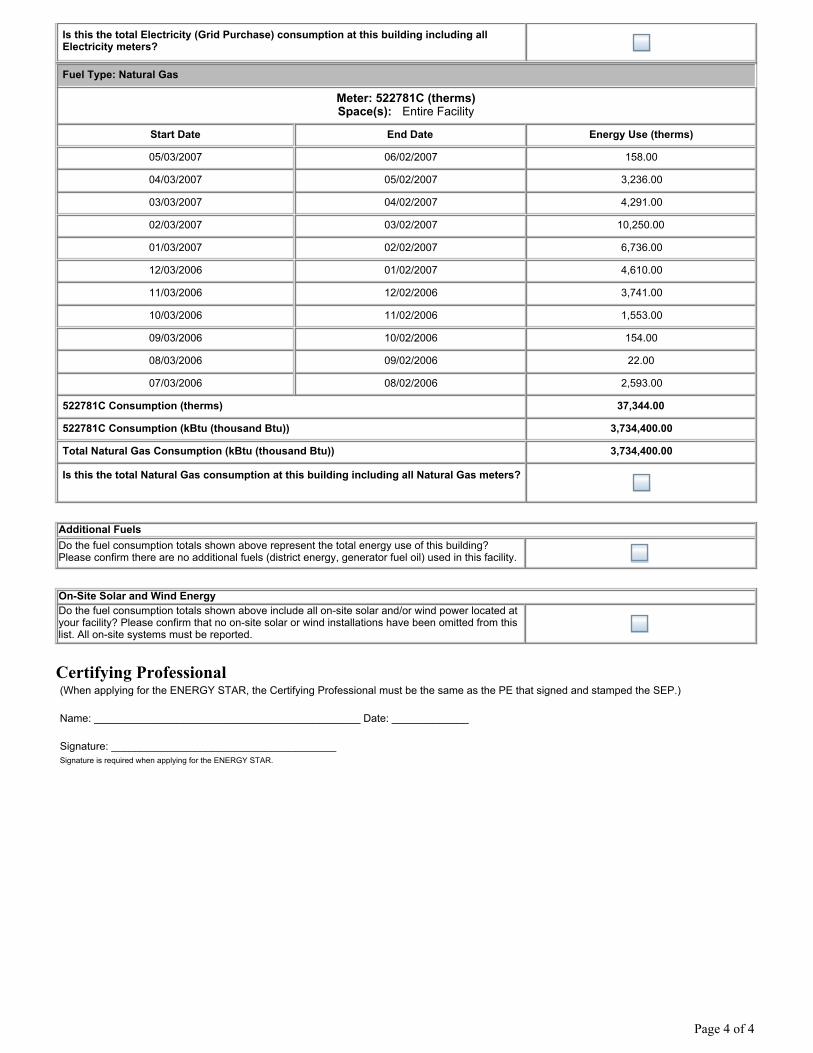
Is this the total Electricity (Grid Purchase) consumption at this building including allElectricity meters?
Fuel Type: Natural Gas
Meter: 522781C (therms)Space(s): Entire Facility
Start Date End Date Energy Use (therms)
05/03/2007 06/02/2007 158.00
04/03/2007 05/02/2007 3,236.00
03/03/2007 04/02/2007 4,291.00
02/03/2007 03/02/2007 10,250.00
01/03/2007 02/02/2007 6,736.00
12/03/2006 01/02/2007 4,610.00
11/03/2006 12/02/2006 3,741.00
10/03/2006 11/02/2006 1,553.00
09/03/2006 10/02/2006 154.00
08/03/2006 09/02/2006 22.00
07/03/2006 08/02/2006 2,593.00
522781C Consumption (therms) 37,344.00
522781C Consumption (kBtu (thousand Btu)) 3,734,400.00
Total Natural Gas Consumption (kBtu (thousand Btu)) 3,734,400.00
Is this the total Natural Gas consumption at this building including all Natural Gas meters?
Additional FuelsDo the fuel consumption totals shown above represent the total energy use of this building?Please confirm there are no additional fuels (district energy, generator fuel oil) used in this facility.
On-Site Solar and Wind EnergyDo the fuel consumption totals shown above include all on-site solar and/or wind power located atyour facility? Please confirm that no on-site solar or wind installations have been omitted from thislist. All on-site systems must be reported.
Certifying Professional (When applying for the ENERGY STAR, the Certifying Professional must be the same as the PE that signed and stamped the SEP.)
Name: _____________________________________________ Date: _____________
Signature: ______________________________________ Signature is required when applying for the ENERGY STAR.
Page 4 of 4
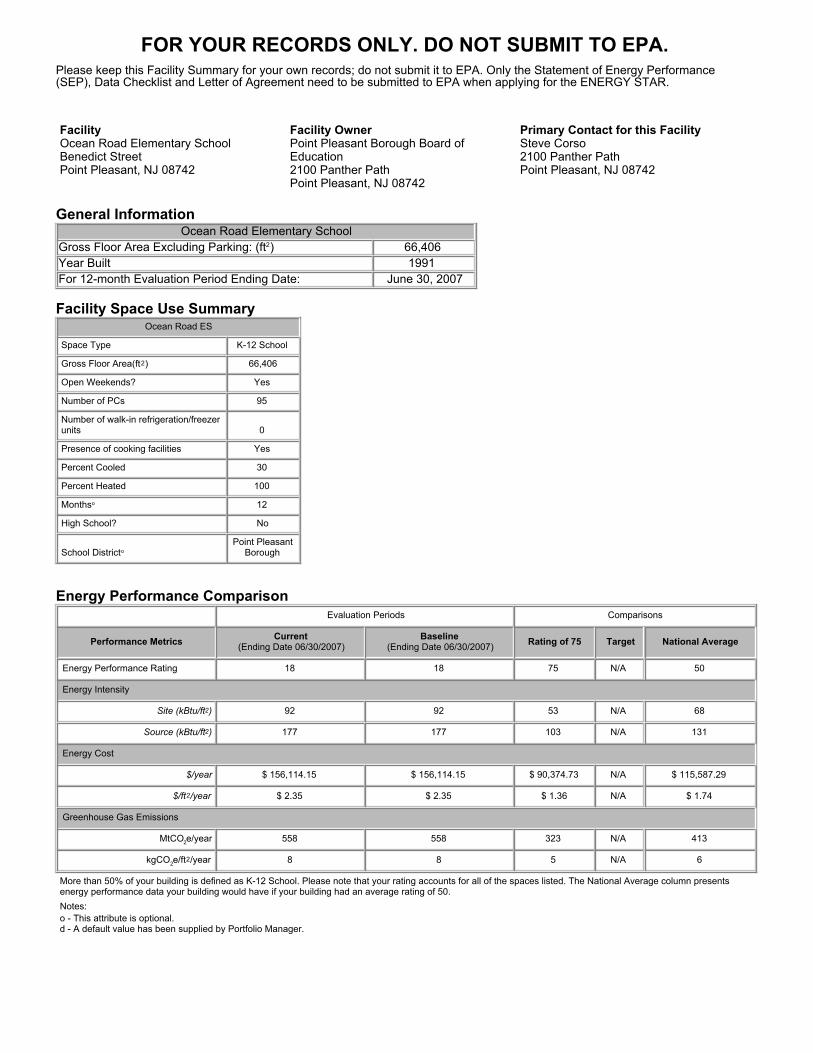
FOR YOUR RECORDS ONLY. DO NOT SUBMIT TO EPA.
Please keep this Facility Summary for your own records; do not submit it to EPA. Only the Statement of Energy Performance(SEP), Data Checklist and Letter of Agreement need to be submitted to EPA when applying for the ENERGY STAR.
FacilityOcean Road Elementary SchoolBenedict StreetPoint Pleasant, NJ 08742
Facility OwnerPoint Pleasant Borough Board ofEducation2100 Panther Path Point Pleasant, NJ 08742
Primary Contact for this FacilitySteve Corso2100 Panther Path Point Pleasant, NJ 08742
General InformationOcean Road Elementary School
Gross Floor Area Excluding Parking: (ft2) 66,406 Year Built 1991 For 12-month Evaluation Period Ending Date: June 30, 2007
Facility Space Use SummaryOcean Road ES
Space Type K-12 School
Gross Floor Area(ft2) 66,406
Open Weekends? Yes
Number of PCs 95
Number of walk-in refrigeration/freezerunits 0
Presence of cooking facilities Yes
Percent Cooled 30
Percent Heated 100
Monthso 12
High School? No
School Districto Point Pleasant
Borough
Energy Performance ComparisonEvaluation Periods Comparisons
Performance Metrics Current(Ending Date 06/30/2007)
Baseline(Ending Date 06/30/2007) Rating of 75 Target National Average
Energy Performance Rating 18 18 75 N/A 50
Energy Intensity
Site (kBtu/ft2) 92 92 53 N/A 68
Source (kBtu/ft2) 177 177 103 N/A 131
Energy Cost
$/year $ 156,114.15 $ 156,114.15 $ 90,374.73 N/A $ 115,587.29
$/ft2/year $ 2.35 $ 2.35 $ 1.36 N/A $ 1.74
Greenhouse Gas Emissions
MtCO2e/year 558 558 323 N/A 413
kgCO2e/ft2/year 8 8 5 N/A 6
More than 50% of your building is defined as K-12 School. Please note that your rating accounts for all of the spaces listed. The National Average column presentsenergy performance data your building would have if your building had an average rating of 50. Notes:o - This attribute is optional.d - A default value has been supplied by Portfolio Manager.

2007Ocean Road Elementary SchoolBenedict StreetPoint Pleasant, NJ 08742
Portfolio Manager Building ID: 1832718
The energy use of this building has been measured and compared to other similar buildings using theEnvironmental Protection Agency’s (EPA’s) Energy Performance Scale of 1–100, with 1 being the least energyefficient and 100 the most energy efficient. For more information, visit energystar.gov/benchmark.
This building’sscore
18
100
Most Efficient
This building uses 177 kBtu per square foot per year.*
*Based on source energy intensity for the 12 month period ending June 2007
Date of certification
Date Generated: 09/11/2009
Statement ofEnergy Performance
1
Least Efficient
50
Average
Buildings with a score of75 or higher may qualifyfor EPA’s ENERGY STAR.
I certify that the information contained within this statement is accurate and in accordance with U.S.Environmental Protection Agency’s measurement standards, found at energystar.gov

OMB No. 2060-0347
STATEMENT OF ENERGY PERFORMANCEMemorial Middle School
Building ID: 1832704 For 12-month Period Ending: June 30, 20071
Date SEP becomes ineligible: N/A Date SEP Generated: September 11, 2009
FacilityMemorial Middle School800 Laura Herbert DrivePoint Pleasant, NJ 08742
Facility OwnerPoint Pleasant Borough Board ofEducation2100 Panther Path Point Pleasant, NJ 08742
Primary Contact for this FacilitySteve Corso2100 Panther Path Point Pleasant, NJ 08742
Year Built: 1960Gross Floor Area (ft2): 100,002
Energy Performance Rating2 (1-100) 16
Site Energy Use Summary3
Electricity - Grid Purchase(kBtu) 3,231,328 Natural Gas (kBtu)4 6,980,348 Total Energy (kBtu) 10,211,676
Energy Intensity5 Site (kBtu/ft2/yr) 102 Source (kBtu/ft2/yr) 181 Emissions (based on site energy use) Greenhouse Gas Emissions (MtCO2e/year) 863 Electric Distribution Utility Jersey Central Power & Lt Co National Average Comparison National Average Site EUI 73 National Average Source EUI 130 % Difference from National Average Source EUI 39% Building Type K-12
School
Stamp of Certifying Professional
Based on the conditions observed at thetime of my visit to this building, I certify that
the information contained within thisstatement is accurate.
Meets Industry Standards6 for Indoor EnvironmentalConditions:Ventilation for Acceptable Indoor Air Quality N/A Acceptable Thermal Environmental Conditions N/A Adequate Illumination N/A
Certifying ProfessionalMatthew Goss15 British American Blvd Latham, NY 12110
Notes: 1. Application for the ENERGY STAR must be submitted to EPA within 4 months of the Period Ending date. Award of the ENERGY STAR is not final until approval is received from EPA.2. The EPA Energy Performance Rating is based on total source energy. A rating of 75 is the minimum to be eligible for the ENERGY STAR.3. Values represent energy consumption, annualized to a 12-month period.4. Natural Gas values in units of volume (e.g. cubic feet) are converted to kBtu with adjustments made for elevation based on Facility zip code.5. Values represent energy intensity, annualized to a 12-month period.6. Based on Meeting ASHRAE Standard 62 for ventilation for acceptable indoor air quality, ASHRAE Standard 55 for thermal comfort, and IESNA Lighting Handbook for lighting quality.
The government estimates the average time needed to fill out this form is 6 hours (includes the time for entering energy data, PE facility inspection, and notarizing the SEP) and welcomessuggestions for reducing this level of effort. Send comments (referencing OMB control number) to the Director, Collection Strategies Division, U.S., EPA (2822T), 1200 Pennsylvania Ave., NW,Washington, D.C. 20460.
EPA Form 5900-16

ENERGY STAR®
Data Checklistfor Commercial Buildings
In order for a building to qualify for the ENERGY STAR, a Professional Engineer (PE) must validate the accuracy of the data underlying the building's energyperformance rating. This checklist is designed to provide an at-a-glance summary of a property's physical and operating characteristics, as well as its total energyconsumption, to assist the PE in double-checking the information that the building owner or operator has entered into Portfolio Manager.
Please complete and sign this checklist and include it with the stamped, signed Statement of Energy Performance.NOTE: You must check each box to indicate that each value is correct, OR include a note.
CRITERION VALUE AS ENTERED INPORTFOLIO MANAGER VERIFICATION QUESTIONS NOTES
Building Name Memorial Middle School Is this the official building name to be displayed inthe ENERGY STAR Registry of LabeledBuildings?
Type K-12 School Is this an accurate description of the space inquestion?
Location 800 Laura Herbert Drive,Point Pleasant, NJ 08742
Is this address accurate and complete? Correctweather normalization requires an accurate zipcode.
Single Structure Single Facility
Does this SEP represent a single structure? SEPscannot be submitted for multiple-buildingcampuses (with the exception of acute care orchildren's hospitals) nor can they be submitted asrepresenting only a portion of a building
Middle School (K-12 School)
CRITERION VALUE AS ENTERED INPORTFOLIO MANAGER VERIFICATION QUESTIONS NOTES
Gross Floor Area 100,002 Sq. Ft.
Does this square footage include all supportingfunctions such as kitchens and break rooms usedby staff, storage areas, administrative areas,elevators, stairwells, atria, vent shafts, etc. Alsonote that existing atriums should only include thebase floor area that it occupies. Interstitial(plenum) space between floors should not beincluded in the total. Finally gross floor area is notthe same as leasable space. Leasable space is asubset of gross floor area.
Open Weekends? Yes
Is this building normally open at all on theweekends? This includes activities beyond thework conducted by maintenance, cleaning, andsecurity personnel. Weekend activity could includeany time when the space is used for classes,performances or other school or communityactivities. If the building is open on the weekend aspart of the standard schedule during one or moreseasons, the building should select ?yes? for openweekends. The ?yes? response should applywhether the building is open for one or both of theweekend days.
Number of PCs 165 Is this the number of personal computers in theK12 School?
Number of walk-inrefrigeration/freezer
units 0
Is this the total number of commercial walk-in typefreezers and coolers? These units are typicallyfound in storage and receiving areas.
Presence ofcooking facilities Yes
Does this school have a dedicated space in whichfood is prepared and served to students? If theschool has space in which food for students is onlykept warm and/or served to students, or has only agalley that is used by teachers and staff then theanswer is "no".
Percent Cooled 40 % Is this the percentage of the total floor space withinthe facility that is served by mechanical coolingequipment?
Percent Heated 100 % Is this the percentage of the total floor space withinthe facility that is served by mechanical heatingequipment?
Months 12 (Optional) Is this school in operation for at least 8 months ofthe year?
Page 1 of 4

High School? No
Is this building a high school (teaching grades 10,11, and/or 12)? If the building teaches to highschool students at all, the user should check 'yes'to 'high school'. For example, if the school teachesto grades K-12 (elementary/middle and highschool), the user should check 'yes' to 'highschool'.
Page 2 of 4
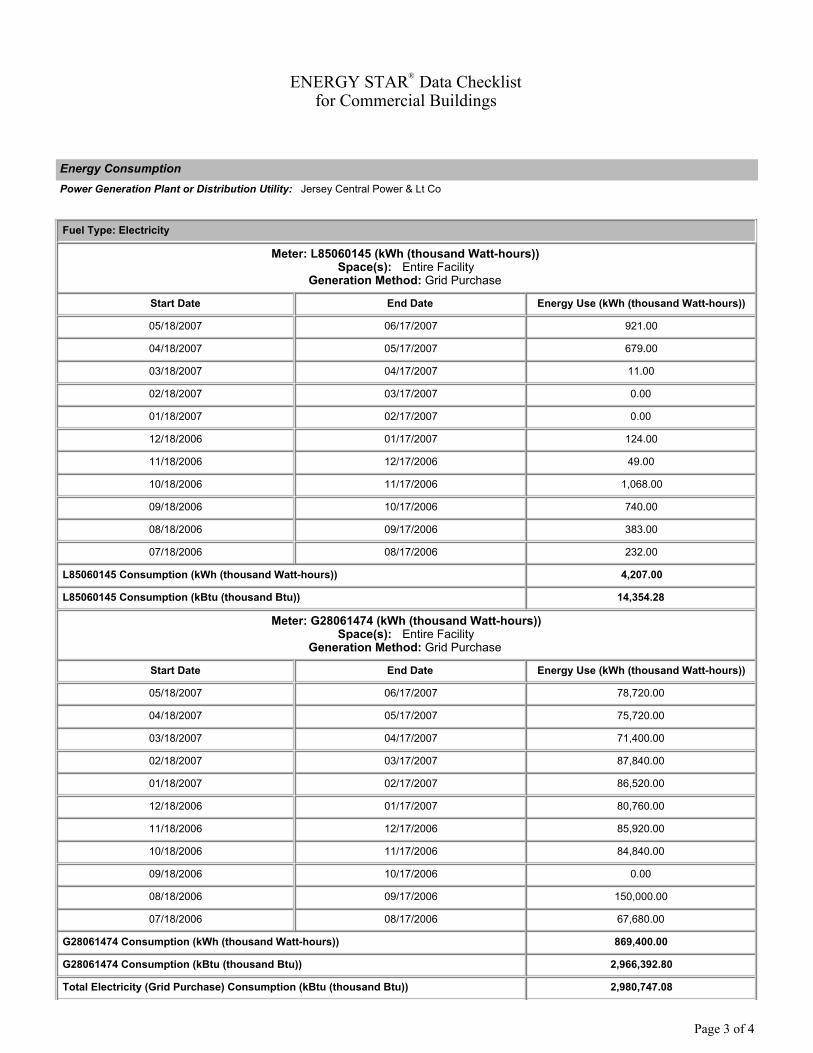
ENERGY STAR®
Data Checklistfor Commercial Buildings
Energy ConsumptionPower Generation Plant or Distribution Utility: Jersey Central Power & Lt Co
Fuel Type: Electricity
Meter: L85060145 (kWh (thousand Watt-hours))Space(s): Entire Facility
Generation Method: Grid Purchase
Start Date End Date Energy Use (kWh (thousand Watt-hours))
05/18/2007 06/17/2007 921.00
04/18/2007 05/17/2007 679.00
03/18/2007 04/17/2007 11.00
02/18/2007 03/17/2007 0.00
01/18/2007 02/17/2007 0.00
12/18/2006 01/17/2007 124.00
11/18/2006 12/17/2006 49.00
10/18/2006 11/17/2006 1,068.00
09/18/2006 10/17/2006 740.00
08/18/2006 09/17/2006 383.00
07/18/2006 08/17/2006 232.00
L85060145 Consumption (kWh (thousand Watt-hours)) 4,207.00
L85060145 Consumption (kBtu (thousand Btu)) 14,354.28
Meter: G28061474 (kWh (thousand Watt-hours))Space(s): Entire Facility
Generation Method: Grid Purchase
Start Date End Date Energy Use (kWh (thousand Watt-hours))
05/18/2007 06/17/2007 78,720.00
04/18/2007 05/17/2007 75,720.00
03/18/2007 04/17/2007 71,400.00
02/18/2007 03/17/2007 87,840.00
01/18/2007 02/17/2007 86,520.00
12/18/2006 01/17/2007 80,760.00
11/18/2006 12/17/2006 85,920.00
10/18/2006 11/17/2006 84,840.00
09/18/2006 10/17/2006 0.00
08/18/2006 09/17/2006 150,000.00
07/18/2006 08/17/2006 67,680.00
G28061474 Consumption (kWh (thousand Watt-hours)) 869,400.00
G28061474 Consumption (kBtu (thousand Btu)) 2,966,392.80
Total Electricity (Grid Purchase) Consumption (kBtu (thousand Btu)) 2,980,747.08
Page 3 of 4
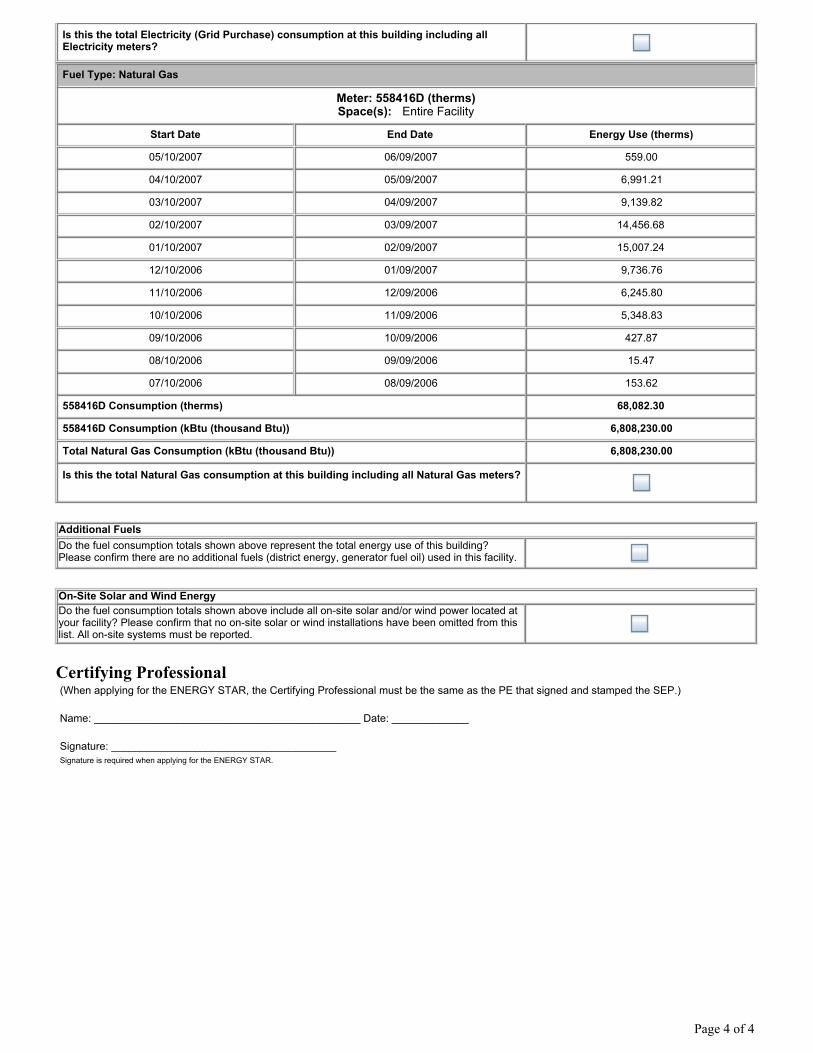
Is this the total Electricity (Grid Purchase) consumption at this building including allElectricity meters?
Fuel Type: Natural Gas
Meter: 558416D (therms)Space(s): Entire Facility
Start Date End Date Energy Use (therms)
05/10/2007 06/09/2007 559.00
04/10/2007 05/09/2007 6,991.21
03/10/2007 04/09/2007 9,139.82
02/10/2007 03/09/2007 14,456.68
01/10/2007 02/09/2007 15,007.24
12/10/2006 01/09/2007 9,736.76
11/10/2006 12/09/2006 6,245.80
10/10/2006 11/09/2006 5,348.83
09/10/2006 10/09/2006 427.87
08/10/2006 09/09/2006 15.47
07/10/2006 08/09/2006 153.62
558416D Consumption (therms) 68,082.30
558416D Consumption (kBtu (thousand Btu)) 6,808,230.00
Total Natural Gas Consumption (kBtu (thousand Btu)) 6,808,230.00
Is this the total Natural Gas consumption at this building including all Natural Gas meters?
Additional FuelsDo the fuel consumption totals shown above represent the total energy use of this building?Please confirm there are no additional fuels (district energy, generator fuel oil) used in this facility.
On-Site Solar and Wind EnergyDo the fuel consumption totals shown above include all on-site solar and/or wind power located atyour facility? Please confirm that no on-site solar or wind installations have been omitted from thislist. All on-site systems must be reported.
Certifying Professional (When applying for the ENERGY STAR, the Certifying Professional must be the same as the PE that signed and stamped the SEP.)
Name: _____________________________________________ Date: _____________
Signature: ______________________________________ Signature is required when applying for the ENERGY STAR.
Page 4 of 4
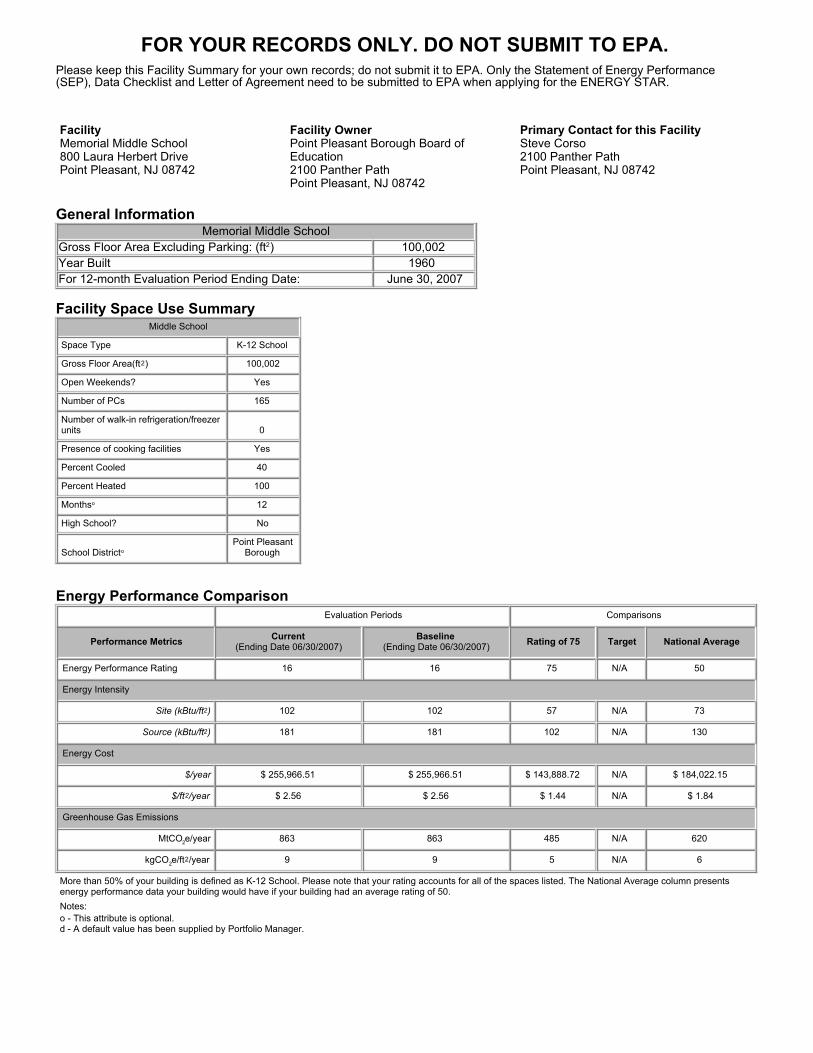
FOR YOUR RECORDS ONLY. DO NOT SUBMIT TO EPA.
Please keep this Facility Summary for your own records; do not submit it to EPA. Only the Statement of Energy Performance(SEP), Data Checklist and Letter of Agreement need to be submitted to EPA when applying for the ENERGY STAR.
FacilityMemorial Middle School800 Laura Herbert DrivePoint Pleasant, NJ 08742
Facility OwnerPoint Pleasant Borough Board ofEducation2100 Panther Path Point Pleasant, NJ 08742
Primary Contact for this FacilitySteve Corso2100 Panther Path Point Pleasant, NJ 08742
General InformationMemorial Middle School
Gross Floor Area Excluding Parking: (ft2) 100,002 Year Built 1960 For 12-month Evaluation Period Ending Date: June 30, 2007
Facility Space Use SummaryMiddle School
Space Type K-12 School
Gross Floor Area(ft2) 100,002
Open Weekends? Yes
Number of PCs 165
Number of walk-in refrigeration/freezerunits 0
Presence of cooking facilities Yes
Percent Cooled 40
Percent Heated 100
Monthso 12
High School? No
School Districto Point Pleasant
Borough
Energy Performance ComparisonEvaluation Periods Comparisons
Performance Metrics Current(Ending Date 06/30/2007)
Baseline(Ending Date 06/30/2007) Rating of 75 Target National Average
Energy Performance Rating 16 16 75 N/A 50
Energy Intensity
Site (kBtu/ft2) 102 102 57 N/A 73
Source (kBtu/ft2) 181 181 102 N/A 130
Energy Cost
$/year $ 255,966.51 $ 255,966.51 $ 143,888.72 N/A $ 184,022.15
$/ft2/year $ 2.56 $ 2.56 $ 1.44 N/A $ 1.84
Greenhouse Gas Emissions
MtCO2e/year 863 863 485 N/A 620
kgCO2e/ft2/year 9 9 5 N/A 6
More than 50% of your building is defined as K-12 School. Please note that your rating accounts for all of the spaces listed. The National Average column presentsenergy performance data your building would have if your building had an average rating of 50. Notes:o - This attribute is optional.d - A default value has been supplied by Portfolio Manager.

2007Memorial Middle School800 Laura Herbert DrivePoint Pleasant, NJ 08742
Portfolio Manager Building ID: 1832704
The energy use of this building has been measured and compared to other similar buildings using theEnvironmental Protection Agency’s (EPA’s) Energy Performance Scale of 1–100, with 1 being the least energyefficient and 100 the most energy efficient. For more information, visit energystar.gov/benchmark.
This building’sscore
16
100
Most Efficient
This building uses 181 kBtu per square foot per year.*
*Based on source energy intensity for the 12 month period ending June 2007
Date of certification
Date Generated: 09/11/2009
Statement ofEnergy Performance
1
Least Efficient
50
Average
Buildings with a score of75 or higher may qualifyfor EPA’s ENERGY STAR.
I certify that the information contained within this statement is accurate and in accordance with U.S.Environmental Protection Agency’s measurement standards, found at energystar.gov

OMB No. 2060-0347
STATEMENT OF ENERGY PERFORMANCEPoint Pleasant High School
Building ID: 1832698 For 12-month Period Ending: June 30, 20071
Date SEP becomes ineligible: N/A Date SEP Generated: September 11, 2009
FacilityPoint Pleasant High School808 Laura Herbert DrivePoint Pleasant, NJ 08742
Facility OwnerPoint Pleasant Borough Board ofEducation2100 Panther Path Point Pleasant, NJ 08742
Primary Contact for this FacilitySteve Corso2100 Panther Path Point Pleasant, NJ 08742
Year Built: 1960Gross Floor Area (ft2): 156,902
Energy Performance Rating2 (1-100) 79
Site Energy Use Summary3
Electricity - Grid Purchase(kBtu) 5,136,204 Natural Gas (kBtu)4 735,940 Total Energy (kBtu) 5,872,144
Energy Intensity5 Site (kBtu/ft2/yr) 37 Source (kBtu/ft2/yr) 114 Emissions (based on site energy use) Greenhouse Gas Emissions (MtCO2e/year) 821 Electric Distribution Utility Jersey Central Power & Lt Co National Average Comparison National Average Site EUI 50 National Average Source EUI 154 % Difference from National Average Source EUI -26% Building Type K-12
School
Stamp of Certifying Professional
Based on the conditions observed at thetime of my visit to this building, I certify that
the information contained within thisstatement is accurate.
Meets Industry Standards6 for Indoor EnvironmentalConditions:Ventilation for Acceptable Indoor Air Quality N/A Acceptable Thermal Environmental Conditions N/A Adequate Illumination N/A
Certifying ProfessionalMatthew Goss15 British American Blvd Latham, NY 12110
Notes: 1. Application for the ENERGY STAR must be submitted to EPA within 4 months of the Period Ending date. Award of the ENERGY STAR is not final until approval is received from EPA.2. The EPA Energy Performance Rating is based on total source energy. A rating of 75 is the minimum to be eligible for the ENERGY STAR.3. Values represent energy consumption, annualized to a 12-month period.4. Natural Gas values in units of volume (e.g. cubic feet) are converted to kBtu with adjustments made for elevation based on Facility zip code.5. Values represent energy intensity, annualized to a 12-month period.6. Based on Meeting ASHRAE Standard 62 for ventilation for acceptable indoor air quality, ASHRAE Standard 55 for thermal comfort, and IESNA Lighting Handbook for lighting quality.
The government estimates the average time needed to fill out this form is 6 hours (includes the time for entering energy data, PE facility inspection, and notarizing the SEP) and welcomessuggestions for reducing this level of effort. Send comments (referencing OMB control number) to the Director, Collection Strategies Division, U.S., EPA (2822T), 1200 Pennsylvania Ave., NW,Washington, D.C. 20460.
EPA Form 5900-16
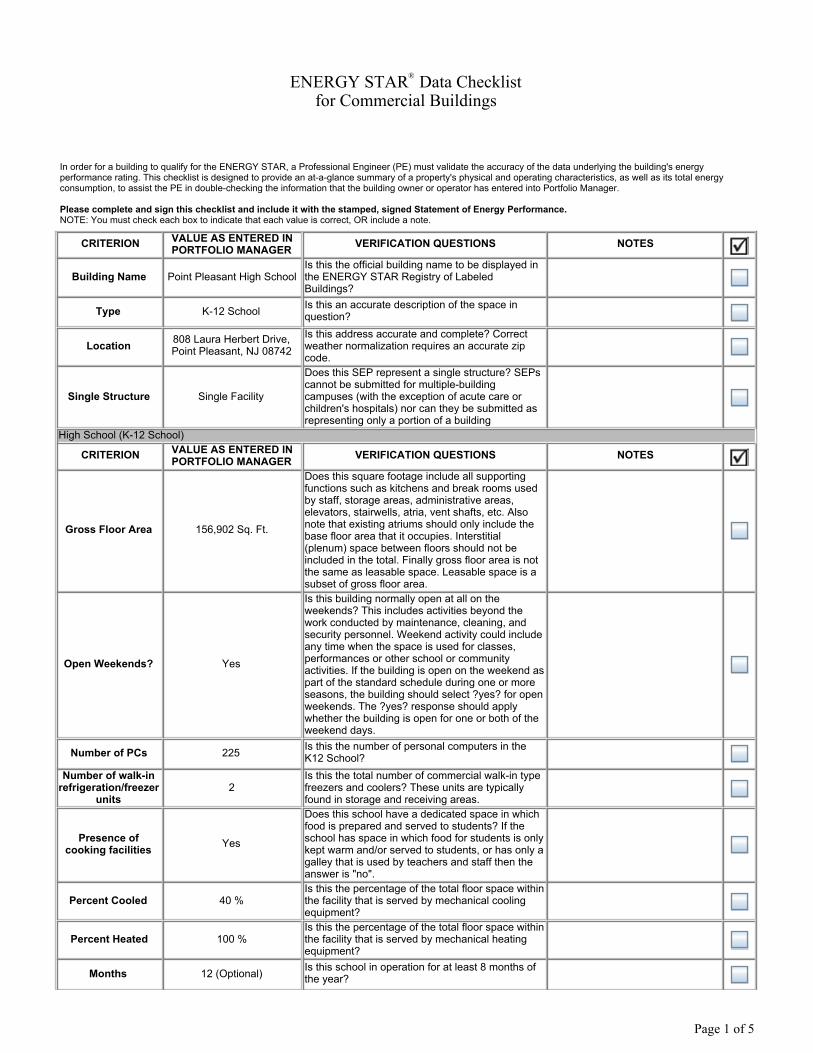
ENERGY STAR®
Data Checklistfor Commercial Buildings
In order for a building to qualify for the ENERGY STAR, a Professional Engineer (PE) must validate the accuracy of the data underlying the building's energyperformance rating. This checklist is designed to provide an at-a-glance summary of a property's physical and operating characteristics, as well as its total energyconsumption, to assist the PE in double-checking the information that the building owner or operator has entered into Portfolio Manager.
Please complete and sign this checklist and include it with the stamped, signed Statement of Energy Performance.NOTE: You must check each box to indicate that each value is correct, OR include a note.
CRITERION VALUE AS ENTERED INPORTFOLIO MANAGER VERIFICATION QUESTIONS NOTES
Building Name Point Pleasant High School Is this the official building name to be displayed inthe ENERGY STAR Registry of LabeledBuildings?
Type K-12 School Is this an accurate description of the space inquestion?
Location 808 Laura Herbert Drive,Point Pleasant, NJ 08742
Is this address accurate and complete? Correctweather normalization requires an accurate zipcode.
Single Structure Single Facility
Does this SEP represent a single structure? SEPscannot be submitted for multiple-buildingcampuses (with the exception of acute care orchildren's hospitals) nor can they be submitted asrepresenting only a portion of a building
High School (K-12 School)
CRITERION VALUE AS ENTERED INPORTFOLIO MANAGER VERIFICATION QUESTIONS NOTES
Gross Floor Area 156,902 Sq. Ft.
Does this square footage include all supportingfunctions such as kitchens and break rooms usedby staff, storage areas, administrative areas,elevators, stairwells, atria, vent shafts, etc. Alsonote that existing atriums should only include thebase floor area that it occupies. Interstitial(plenum) space between floors should not beincluded in the total. Finally gross floor area is notthe same as leasable space. Leasable space is asubset of gross floor area.
Open Weekends? Yes
Is this building normally open at all on theweekends? This includes activities beyond thework conducted by maintenance, cleaning, andsecurity personnel. Weekend activity could includeany time when the space is used for classes,performances or other school or communityactivities. If the building is open on the weekend aspart of the standard schedule during one or moreseasons, the building should select ?yes? for openweekends. The ?yes? response should applywhether the building is open for one or both of theweekend days.
Number of PCs 225 Is this the number of personal computers in theK12 School?
Number of walk-inrefrigeration/freezer
units 2
Is this the total number of commercial walk-in typefreezers and coolers? These units are typicallyfound in storage and receiving areas.
Presence ofcooking facilities Yes
Does this school have a dedicated space in whichfood is prepared and served to students? If theschool has space in which food for students is onlykept warm and/or served to students, or has only agalley that is used by teachers and staff then theanswer is "no".
Percent Cooled 40 % Is this the percentage of the total floor space withinthe facility that is served by mechanical coolingequipment?
Percent Heated 100 % Is this the percentage of the total floor space withinthe facility that is served by mechanical heatingequipment?
Months 12 (Optional) Is this school in operation for at least 8 months ofthe year?
Page 1 of 5

High School? Yes
Is this building a high school (teaching grades 10,11, and/or 12)? If the building teaches to highschool students at all, the user should check 'yes'to 'high school'. For example, if the school teachesto grades K-12 (elementary/middle and highschool), the user should check 'yes' to 'highschool'.
Page 2 of 5

ENERGY STAR®
Data Checklistfor Commercial Buildings
Energy ConsumptionPower Generation Plant or Distribution Utility: Jersey Central Power & Lt Co
Fuel Type: Electricity
Meter: G17814990 (kWh (thousand Watt-hours))Space(s): Entire Facility
Generation Method: Grid Purchase
Start Date End Date Energy Use (kWh (thousand Watt-hours))
05/18/2007 06/17/2007 140,800.00
04/18/2007 05/17/2007 122,800.00
03/18/2007 04/17/2007 127,600.00
02/18/2007 03/17/2007 166,000.00
01/18/2007 02/17/2007 158,400.00
12/18/2006 01/17/2007 126,400.00
11/18/2006 12/17/2006 136,400.00
10/18/2006 11/17/2006 128,000.00
09/18/2006 10/17/2006 134,808.00
08/18/2006 09/17/2006 10,641.00
07/18/2006 08/17/2006 135,600.00
G17814990 Consumption (kWh (thousand Watt-hours)) 1,387,449.00
G17814990 Consumption (kBtu (thousand Btu)) 4,733,975.99
Meter: Outdoor Light (kWh (thousand Watt-hours))Space(s): High School
Generation Method: Grid Purchase
Start Date End Date Energy Use (kWh (thousand Watt-hours))
05/18/2007 06/17/2007 516.00
04/18/2007 05/17/2007 516.00
03/18/2007 04/17/2007 516.00
02/18/2007 03/17/2007 516.00
01/18/2007 02/17/2007 516.00
12/18/2006 01/17/2007 516.00
11/18/2006 12/17/2006 516.00
10/18/2006 11/17/2006 516.00
09/18/2006 10/17/2006 516.00
08/18/2006 09/17/2006 516.00
07/18/2006 08/17/2006 516.00
Outdoor Light Consumption (kWh (thousand Watt-hours)) 5,676.00
Outdoor Light Consumption (kBtu (thousand Btu)) 19,366.51
Page 3 of 5
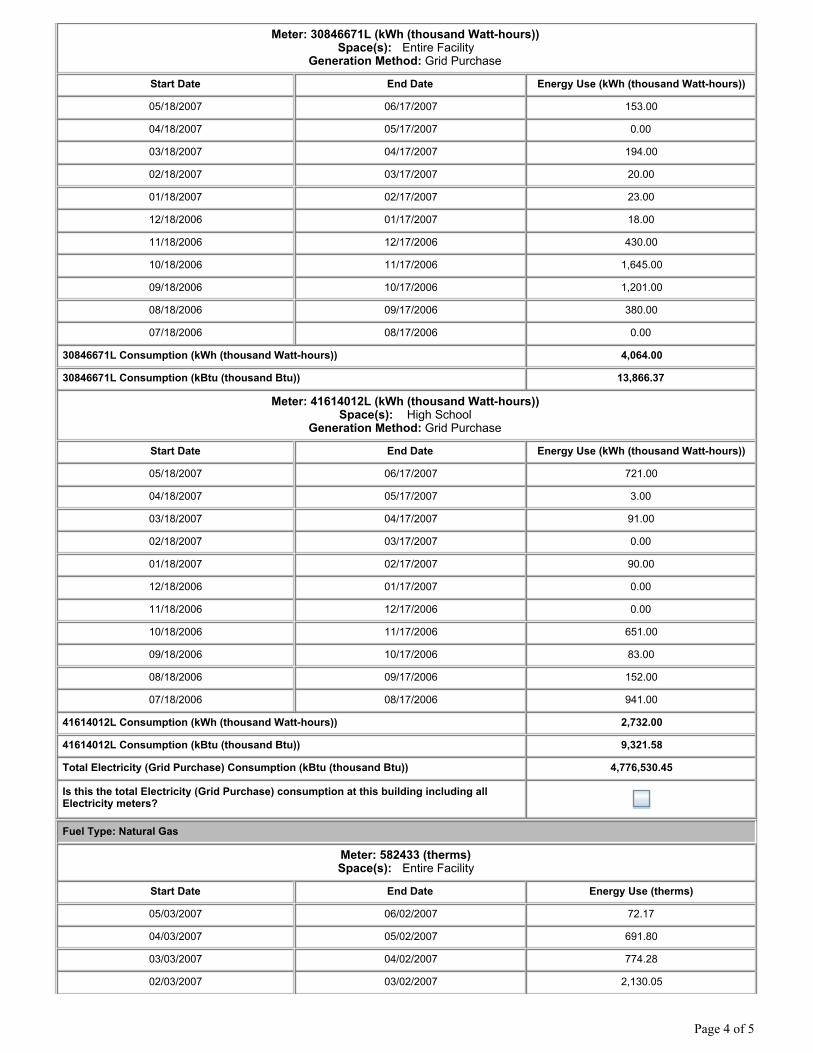
Meter: 30846671L (kWh (thousand Watt-hours))Space(s): Entire Facility
Generation Method: Grid Purchase
Start Date End Date Energy Use (kWh (thousand Watt-hours))
05/18/2007 06/17/2007 153.00
04/18/2007 05/17/2007 0.00
03/18/2007 04/17/2007 194.00
02/18/2007 03/17/2007 20.00
01/18/2007 02/17/2007 23.00
12/18/2006 01/17/2007 18.00
11/18/2006 12/17/2006 430.00
10/18/2006 11/17/2006 1,645.00
09/18/2006 10/17/2006 1,201.00
08/18/2006 09/17/2006 380.00
07/18/2006 08/17/2006 0.00
30846671L Consumption (kWh (thousand Watt-hours)) 4,064.00
30846671L Consumption (kBtu (thousand Btu)) 13,866.37
Meter: 41614012L (kWh (thousand Watt-hours))Space(s): High School
Generation Method: Grid Purchase
Start Date End Date Energy Use (kWh (thousand Watt-hours))
05/18/2007 06/17/2007 721.00
04/18/2007 05/17/2007 3.00
03/18/2007 04/17/2007 91.00
02/18/2007 03/17/2007 0.00
01/18/2007 02/17/2007 90.00
12/18/2006 01/17/2007 0.00
11/18/2006 12/17/2006 0.00
10/18/2006 11/17/2006 651.00
09/18/2006 10/17/2006 83.00
08/18/2006 09/17/2006 152.00
07/18/2006 08/17/2006 941.00
41614012L Consumption (kWh (thousand Watt-hours)) 2,732.00
41614012L Consumption (kBtu (thousand Btu)) 9,321.58
Total Electricity (Grid Purchase) Consumption (kBtu (thousand Btu)) 4,776,530.45
Is this the total Electricity (Grid Purchase) consumption at this building including allElectricity meters?
Fuel Type: Natural Gas
Meter: 582433 (therms)Space(s): Entire Facility
Start Date End Date Energy Use (therms)
05/03/2007 06/02/2007 72.17
04/03/2007 05/02/2007 691.80
03/03/2007 04/02/2007 774.28
02/03/2007 03/02/2007 2,130.05
Page 4 of 5
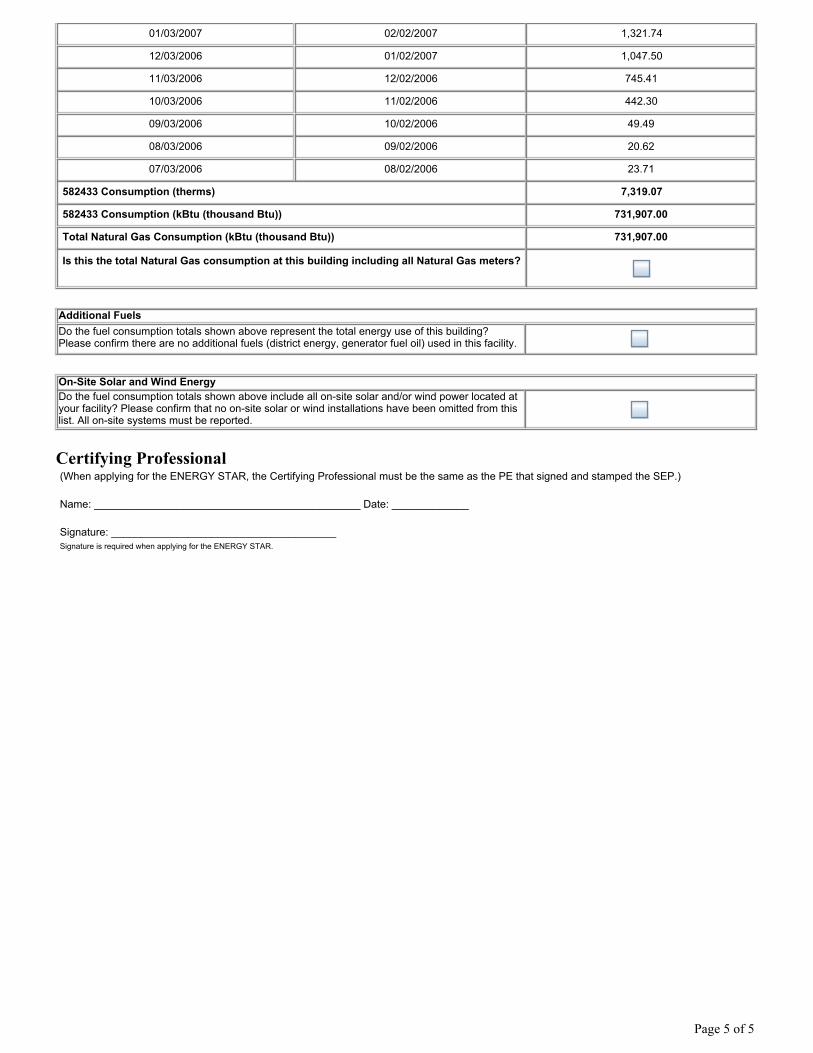
01/03/2007 02/02/2007 1,321.74
12/03/2006 01/02/2007 1,047.50
11/03/2006 12/02/2006 745.41
10/03/2006 11/02/2006 442.30
09/03/2006 10/02/2006 49.49
08/03/2006 09/02/2006 20.62
07/03/2006 08/02/2006 23.71
582433 Consumption (therms) 7,319.07
582433 Consumption (kBtu (thousand Btu)) 731,907.00
Total Natural Gas Consumption (kBtu (thousand Btu)) 731,907.00
Is this the total Natural Gas consumption at this building including all Natural Gas meters?
Additional FuelsDo the fuel consumption totals shown above represent the total energy use of this building?Please confirm there are no additional fuels (district energy, generator fuel oil) used in this facility.
On-Site Solar and Wind EnergyDo the fuel consumption totals shown above include all on-site solar and/or wind power located atyour facility? Please confirm that no on-site solar or wind installations have been omitted from thislist. All on-site systems must be reported.
Certifying Professional (When applying for the ENERGY STAR, the Certifying Professional must be the same as the PE that signed and stamped the SEP.)
Name: _____________________________________________ Date: _____________
Signature: ______________________________________ Signature is required when applying for the ENERGY STAR.
Page 5 of 5

FOR YOUR RECORDS ONLY. DO NOT SUBMIT TO EPA.
Please keep this Facility Summary for your own records; do not submit it to EPA. Only the Statement of Energy Performance(SEP), Data Checklist and Letter of Agreement need to be submitted to EPA when applying for the ENERGY STAR.
FacilityPoint Pleasant High School808 Laura Herbert DrivePoint Pleasant, NJ 08742
Facility OwnerPoint Pleasant Borough Board ofEducation2100 Panther Path Point Pleasant, NJ 08742
Primary Contact for this FacilitySteve Corso2100 Panther Path Point Pleasant, NJ 08742
General InformationPoint Pleasant High School
Gross Floor Area Excluding Parking: (ft2) 156,902 Year Built 1960 For 12-month Evaluation Period Ending Date: June 30, 2007
Facility Space Use SummaryHigh School
Space Type K-12 School
Gross Floor Area(ft2) 156,902
Open Weekends? Yes
Number of PCs 225
Number of walk-in refrigeration/freezerunits 2
Presence of cooking facilities Yes
Percent Cooled 40
Percent Heated 100
Monthso 12
High School? Yes
School Districto Point Pleasant
Borough
Energy Performance ComparisonEvaluation Periods Comparisons
Performance Metrics Current(Ending Date 06/30/2007)
Baseline(Ending Date 06/30/2007) Rating of 75 Target National Average
Energy Performance Rating 79 79 75 N/A 50
Energy Intensity
Site (kBtu/ft2) 37 37 39 N/A 50
Source (kBtu/ft2) 114 114 120 N/A 154
Energy Cost
$/year $ 339,939.26 $ 339,939.26 $ 358,194.08 N/A $ 458,005.26
$/ft2/year $ 2.17 $ 2.17 $ 2.29 N/A $ 2.92
Greenhouse Gas Emissions
MtCO2e/year 821 821 865 N/A 1,106
kgCO2e/ft2/year 5 5 5 N/A 7
More than 50% of your building is defined as K-12 School. Please note that your rating accounts for all of the spaces listed. The National Average column presentsenergy performance data your building would have if your building had an average rating of 50. Notes:o - This attribute is optional.d - A default value has been supplied by Portfolio Manager.
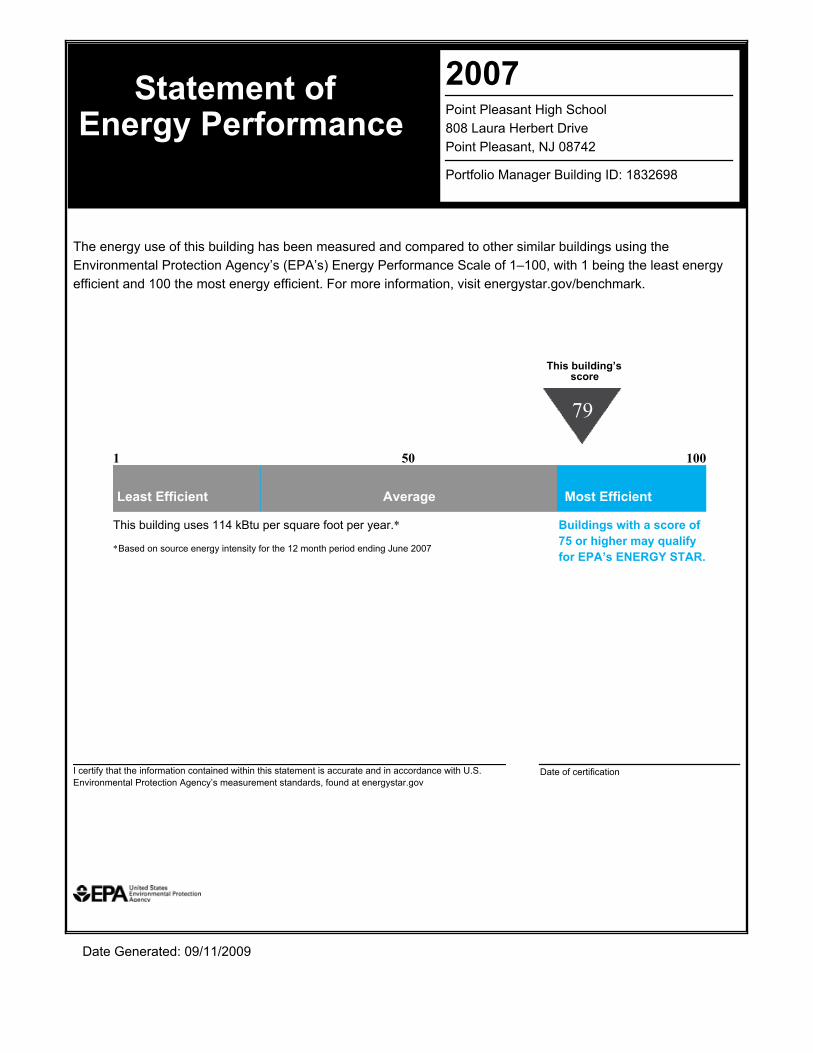
2007Point Pleasant High School808 Laura Herbert DrivePoint Pleasant, NJ 08742
Portfolio Manager Building ID: 1832698
The energy use of this building has been measured and compared to other similar buildings using theEnvironmental Protection Agency’s (EPA’s) Energy Performance Scale of 1–100, with 1 being the least energyefficient and 100 the most energy efficient. For more information, visit energystar.gov/benchmark.
This building’sscore
79
100
Most Efficient
This building uses 114 kBtu per square foot per year.*
*Based on source energy intensity for the 12 month period ending June 2007
Date of certification
Date Generated: 09/11/2009
Statement ofEnergy Performance
1
Least Efficient
50
Average
Buildings with a score of75 or higher may qualifyfor EPA’s ENERGY STAR.
I certify that the information contained within this statement is accurate and in accordance with U.S.Environmental Protection Agency’s measurement standards, found at energystar.gov
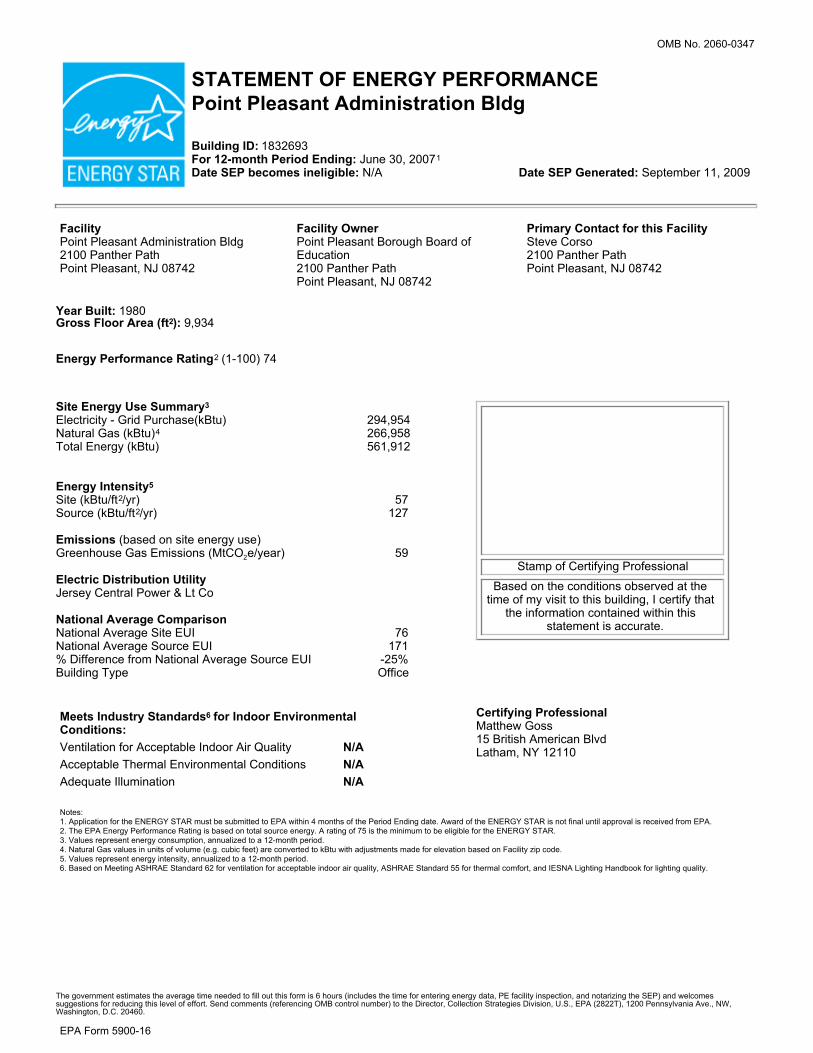
OMB No. 2060-0347
STATEMENT OF ENERGY PERFORMANCEPoint Pleasant Administration Bldg
Building ID: 1832693 For 12-month Period Ending: June 30, 20071
Date SEP becomes ineligible: N/A Date SEP Generated: September 11, 2009
FacilityPoint Pleasant Administration Bldg2100 Panther PathPoint Pleasant, NJ 08742
Facility OwnerPoint Pleasant Borough Board ofEducation2100 Panther Path Point Pleasant, NJ 08742
Primary Contact for this FacilitySteve Corso2100 Panther Path Point Pleasant, NJ 08742
Year Built: 1980Gross Floor Area (ft2): 9,934
Energy Performance Rating2 (1-100) 74
Site Energy Use Summary3
Electricity - Grid Purchase(kBtu) 294,954 Natural Gas (kBtu)4 266,958 Total Energy (kBtu) 561,912
Energy Intensity5 Site (kBtu/ft2/yr) 57 Source (kBtu/ft2/yr) 127 Emissions (based on site energy use) Greenhouse Gas Emissions (MtCO2e/year) 59 Electric Distribution Utility Jersey Central Power & Lt Co National Average Comparison National Average Site EUI 76 National Average Source EUI 171 % Difference from National Average Source EUI -25% Building Type Office
Stamp of Certifying Professional
Based on the conditions observed at thetime of my visit to this building, I certify that
the information contained within thisstatement is accurate.
Meets Industry Standards6 for Indoor EnvironmentalConditions:Ventilation for Acceptable Indoor Air Quality N/A Acceptable Thermal Environmental Conditions N/A Adequate Illumination N/A
Certifying ProfessionalMatthew Goss15 British American Blvd Latham, NY 12110
Notes: 1. Application for the ENERGY STAR must be submitted to EPA within 4 months of the Period Ending date. Award of the ENERGY STAR is not final until approval is received from EPA.2. The EPA Energy Performance Rating is based on total source energy. A rating of 75 is the minimum to be eligible for the ENERGY STAR.3. Values represent energy consumption, annualized to a 12-month period.4. Natural Gas values in units of volume (e.g. cubic feet) are converted to kBtu with adjustments made for elevation based on Facility zip code.5. Values represent energy intensity, annualized to a 12-month period.6. Based on Meeting ASHRAE Standard 62 for ventilation for acceptable indoor air quality, ASHRAE Standard 55 for thermal comfort, and IESNA Lighting Handbook for lighting quality.
The government estimates the average time needed to fill out this form is 6 hours (includes the time for entering energy data, PE facility inspection, and notarizing the SEP) and welcomessuggestions for reducing this level of effort. Send comments (referencing OMB control number) to the Director, Collection Strategies Division, U.S., EPA (2822T), 1200 Pennsylvania Ave., NW,Washington, D.C. 20460.
EPA Form 5900-16
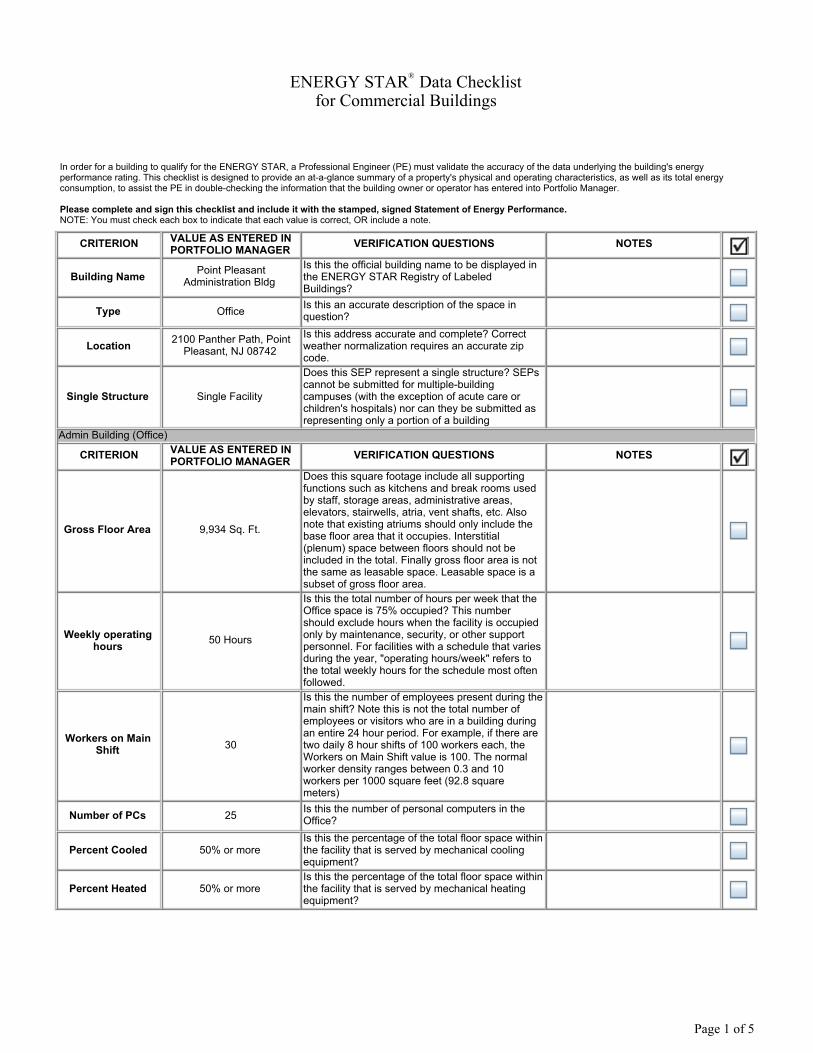
ENERGY STAR®
Data Checklistfor Commercial Buildings
In order for a building to qualify for the ENERGY STAR, a Professional Engineer (PE) must validate the accuracy of the data underlying the building's energyperformance rating. This checklist is designed to provide an at-a-glance summary of a property's physical and operating characteristics, as well as its total energyconsumption, to assist the PE in double-checking the information that the building owner or operator has entered into Portfolio Manager.
Please complete and sign this checklist and include it with the stamped, signed Statement of Energy Performance.NOTE: You must check each box to indicate that each value is correct, OR include a note.
CRITERION VALUE AS ENTERED INPORTFOLIO MANAGER VERIFICATION QUESTIONS NOTES
Building Name Point Pleasant
Administration Bldg Is this the official building name to be displayed inthe ENERGY STAR Registry of LabeledBuildings?
Type Office Is this an accurate description of the space inquestion?
Location 2100 Panther Path, Point
Pleasant, NJ 08742 Is this address accurate and complete? Correctweather normalization requires an accurate zipcode.
Single Structure Single Facility
Does this SEP represent a single structure? SEPscannot be submitted for multiple-buildingcampuses (with the exception of acute care orchildren's hospitals) nor can they be submitted asrepresenting only a portion of a building
Admin Building (Office)
CRITERION VALUE AS ENTERED INPORTFOLIO MANAGER VERIFICATION QUESTIONS NOTES
Gross Floor Area 9,934 Sq. Ft.
Does this square footage include all supportingfunctions such as kitchens and break rooms usedby staff, storage areas, administrative areas,elevators, stairwells, atria, vent shafts, etc. Alsonote that existing atriums should only include thebase floor area that it occupies. Interstitial(plenum) space between floors should not beincluded in the total. Finally gross floor area is notthe same as leasable space. Leasable space is asubset of gross floor area.
Weekly operatinghours 50 Hours
Is this the total number of hours per week that theOffice space is 75% occupied? This numbershould exclude hours when the facility is occupiedonly by maintenance, security, or other supportpersonnel. For facilities with a schedule that variesduring the year, "operating hours/week" refers tothe total weekly hours for the schedule most oftenfollowed.
Workers on MainShift 30
Is this the number of employees present during themain shift? Note this is not the total number ofemployees or visitors who are in a building duringan entire 24 hour period. For example, if there aretwo daily 8 hour shifts of 100 workers each, theWorkers on Main Shift value is 100. The normalworker density ranges between 0.3 and 10workers per 1000 square feet (92.8 squaremeters)
Number of PCs 25 Is this the number of personal computers in theOffice?
Percent Cooled 50% or more Is this the percentage of the total floor space withinthe facility that is served by mechanical coolingequipment?
Percent Heated 50% or more Is this the percentage of the total floor space withinthe facility that is served by mechanical heatingequipment?
Page 1 of 5
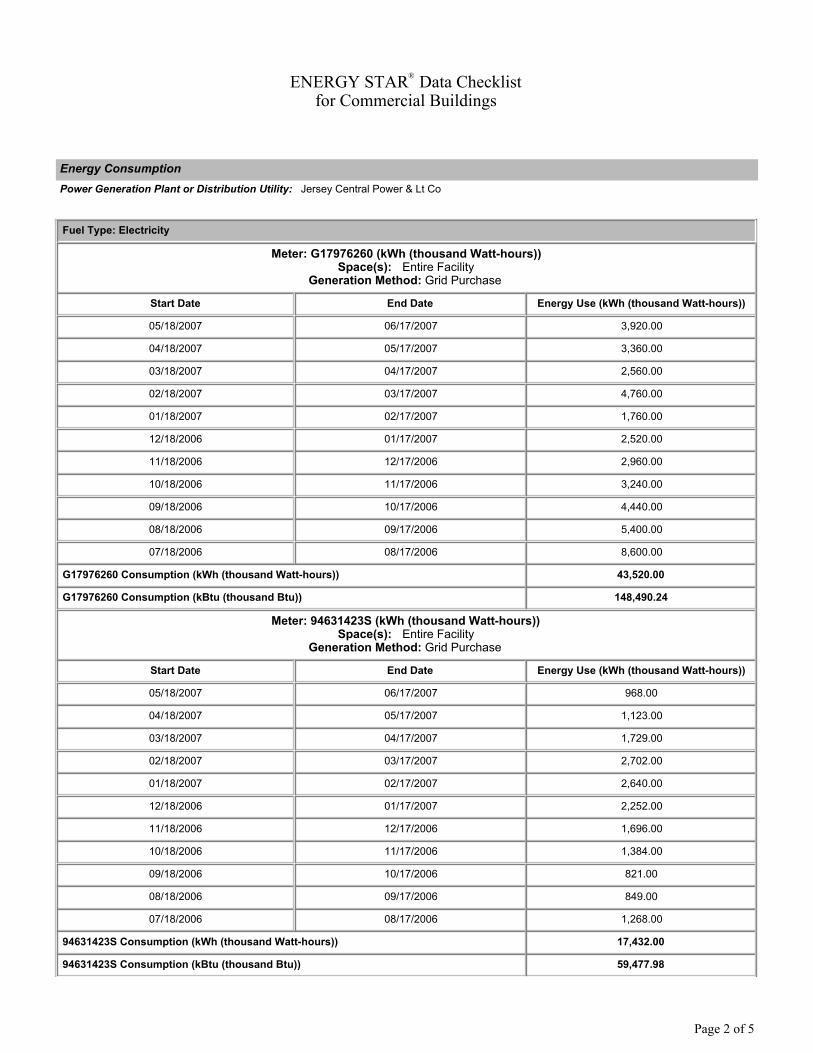
ENERGY STAR®
Data Checklistfor Commercial Buildings
Energy ConsumptionPower Generation Plant or Distribution Utility: Jersey Central Power & Lt Co
Fuel Type: Electricity
Meter: G17976260 (kWh (thousand Watt-hours))Space(s): Entire Facility
Generation Method: Grid Purchase
Start Date End Date Energy Use (kWh (thousand Watt-hours))
05/18/2007 06/17/2007 3,920.00
04/18/2007 05/17/2007 3,360.00
03/18/2007 04/17/2007 2,560.00
02/18/2007 03/17/2007 4,760.00
01/18/2007 02/17/2007 1,760.00
12/18/2006 01/17/2007 2,520.00
11/18/2006 12/17/2006 2,960.00
10/18/2006 11/17/2006 3,240.00
09/18/2006 10/17/2006 4,440.00
08/18/2006 09/17/2006 5,400.00
07/18/2006 08/17/2006 8,600.00
G17976260 Consumption (kWh (thousand Watt-hours)) 43,520.00
G17976260 Consumption (kBtu (thousand Btu)) 148,490.24
Meter: 94631423S (kWh (thousand Watt-hours))Space(s): Entire Facility
Generation Method: Grid Purchase
Start Date End Date Energy Use (kWh (thousand Watt-hours))
05/18/2007 06/17/2007 968.00
04/18/2007 05/17/2007 1,123.00
03/18/2007 04/17/2007 1,729.00
02/18/2007 03/17/2007 2,702.00
01/18/2007 02/17/2007 2,640.00
12/18/2006 01/17/2007 2,252.00
11/18/2006 12/17/2006 1,696.00
10/18/2006 11/17/2006 1,384.00
09/18/2006 10/17/2006 821.00
08/18/2006 09/17/2006 849.00
07/18/2006 08/17/2006 1,268.00
94631423S Consumption (kWh (thousand Watt-hours)) 17,432.00
94631423S Consumption (kBtu (thousand Btu)) 59,477.98
Page 2 of 5
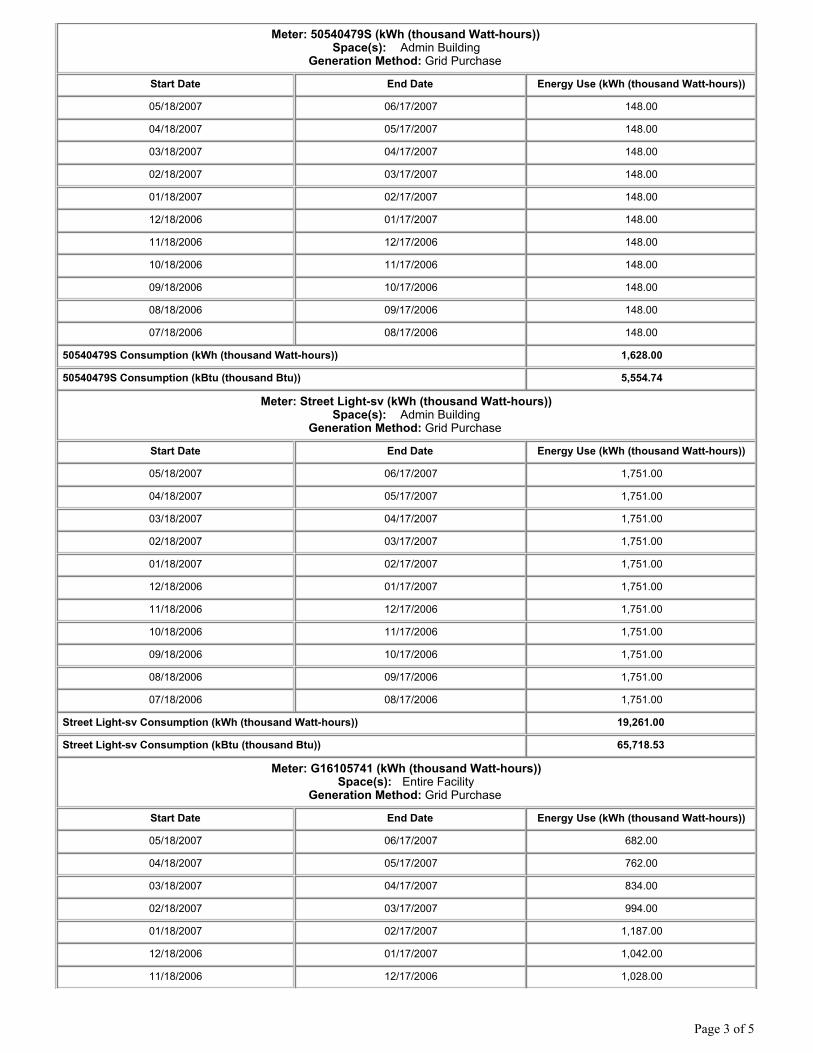
Meter: 50540479S (kWh (thousand Watt-hours))Space(s): Admin Building
Generation Method: Grid Purchase
Start Date End Date Energy Use (kWh (thousand Watt-hours))
05/18/2007 06/17/2007 148.00
04/18/2007 05/17/2007 148.00
03/18/2007 04/17/2007 148.00
02/18/2007 03/17/2007 148.00
01/18/2007 02/17/2007 148.00
12/18/2006 01/17/2007 148.00
11/18/2006 12/17/2006 148.00
10/18/2006 11/17/2006 148.00
09/18/2006 10/17/2006 148.00
08/18/2006 09/17/2006 148.00
07/18/2006 08/17/2006 148.00
50540479S Consumption (kWh (thousand Watt-hours)) 1,628.00
50540479S Consumption (kBtu (thousand Btu)) 5,554.74
Meter: Street Light-sv (kWh (thousand Watt-hours))Space(s): Admin Building
Generation Method: Grid Purchase
Start Date End Date Energy Use (kWh (thousand Watt-hours))
05/18/2007 06/17/2007 1,751.00
04/18/2007 05/17/2007 1,751.00
03/18/2007 04/17/2007 1,751.00
02/18/2007 03/17/2007 1,751.00
01/18/2007 02/17/2007 1,751.00
12/18/2006 01/17/2007 1,751.00
11/18/2006 12/17/2006 1,751.00
10/18/2006 11/17/2006 1,751.00
09/18/2006 10/17/2006 1,751.00
08/18/2006 09/17/2006 1,751.00
07/18/2006 08/17/2006 1,751.00
Street Light-sv Consumption (kWh (thousand Watt-hours)) 19,261.00
Street Light-sv Consumption (kBtu (thousand Btu)) 65,718.53
Meter: G16105741 (kWh (thousand Watt-hours))Space(s): Entire Facility
Generation Method: Grid Purchase
Start Date End Date Energy Use (kWh (thousand Watt-hours))
05/18/2007 06/17/2007 682.00
04/18/2007 05/17/2007 762.00
03/18/2007 04/17/2007 834.00
02/18/2007 03/17/2007 994.00
01/18/2007 02/17/2007 1,187.00
12/18/2006 01/17/2007 1,042.00
11/18/2006 12/17/2006 1,028.00
Page 3 of 5

10/18/2006 11/17/2006 1,163.00
09/18/2006 10/17/2006 1,526.00
08/18/2006 09/17/2006 1,761.00
07/18/2006 08/17/2006 2,119.00
G16105741 Consumption (kWh (thousand Watt-hours)) 13,098.00
G16105741 Consumption (kBtu (thousand Btu)) 44,690.38
Meter: Snack Bar (kWh (thousand Watt-hours))Space(s): Entire Facility
Generation Method: Grid Purchase
Start Date End Date Energy Use (kWh (thousand Watt-hours))
05/18/2007 06/17/2007 696.00
04/18/2007 05/17/2007 587.00
03/18/2007 04/17/2007 7.00
02/18/2007 03/17/2007 14.00
01/18/2007 02/17/2007 0.00
12/18/2006 01/17/2007 0.00
11/18/2006 12/17/2006 17.00
10/18/2006 11/17/2006 924.00
09/18/2006 10/17/2006 329.00
08/18/2006 09/17/2006 512.00
07/18/2006 08/17/2006 323.00
Snack Bar Consumption (kWh (thousand Watt-hours)) 3,409.00
Snack Bar Consumption (kBtu (thousand Btu)) 11,631.51
Total Electricity (Grid Purchase) Consumption (kBtu (thousand Btu)) 335,563.38
Is this the total Electricity (Grid Purchase) consumption at this building including allElectricity meters?
Fuel Type: Natural Gas
Meter: 601411A (therms)Space(s): Entire Facility
Start Date End Date Energy Use (therms)
05/06/2007 06/05/2007 61.86
04/06/2007 05/05/2007 252.60
03/06/2007 04/05/2007 222.70
02/06/2007 03/05/2007 671.18
01/06/2007 02/05/2007 540.24
12/06/2006 01/05/2007 366.01
11/06/2006 12/05/2006 296.93
10/06/2006 11/05/2006 103.10
09/06/2006 10/05/2006 64.95
08/06/2006 09/05/2006 0.00
07/06/2006 08/05/2006 16.50
601411A Consumption (therms) 2,596.07
601411A Consumption (kBtu (thousand Btu)) 259,607.00
Total Natural Gas Consumption (kBtu (thousand Btu)) 259,607.00
Page 4 of 5

Is this the total Natural Gas consumption at this building including all Natural Gas meters?
Additional FuelsDo the fuel consumption totals shown above represent the total energy use of this building?Please confirm there are no additional fuels (district energy, generator fuel oil) used in this facility.
On-Site Solar and Wind EnergyDo the fuel consumption totals shown above include all on-site solar and/or wind power located atyour facility? Please confirm that no on-site solar or wind installations have been omitted from thislist. All on-site systems must be reported.
Certifying Professional (When applying for the ENERGY STAR, the Certifying Professional must be the same as the PE that signed and stamped the SEP.)
Name: _____________________________________________ Date: _____________
Signature: ______________________________________ Signature is required when applying for the ENERGY STAR.
Page 5 of 5
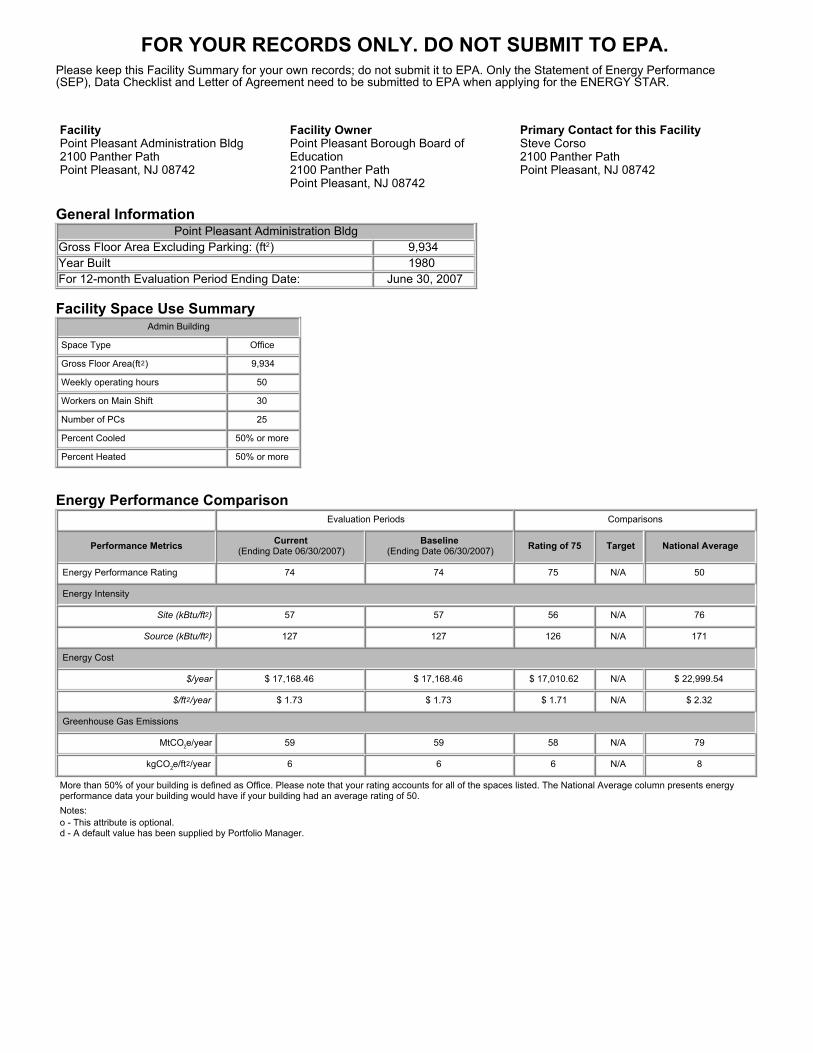
FOR YOUR RECORDS ONLY. DO NOT SUBMIT TO EPA.
Please keep this Facility Summary for your own records; do not submit it to EPA. Only the Statement of Energy Performance(SEP), Data Checklist and Letter of Agreement need to be submitted to EPA when applying for the ENERGY STAR.
FacilityPoint Pleasant Administration Bldg2100 Panther PathPoint Pleasant, NJ 08742
Facility OwnerPoint Pleasant Borough Board ofEducation2100 Panther Path Point Pleasant, NJ 08742
Primary Contact for this FacilitySteve Corso2100 Panther Path Point Pleasant, NJ 08742
General InformationPoint Pleasant Administration Bldg
Gross Floor Area Excluding Parking: (ft2) 9,934 Year Built 1980 For 12-month Evaluation Period Ending Date: June 30, 2007
Facility Space Use SummaryAdmin Building
Space Type Office
Gross Floor Area(ft2) 9,934
Weekly operating hours 50
Workers on Main Shift 30
Number of PCs 25
Percent Cooled 50% or more
Percent Heated 50% or more
Energy Performance ComparisonEvaluation Periods Comparisons
Performance Metrics Current(Ending Date 06/30/2007)
Baseline(Ending Date 06/30/2007) Rating of 75 Target National Average
Energy Performance Rating 74 74 75 N/A 50
Energy Intensity
Site (kBtu/ft2) 57 57 56 N/A 76
Source (kBtu/ft2) 127 127 126 N/A 171
Energy Cost
$/year $ 17,168.46 $ 17,168.46 $ 17,010.62 N/A $ 22,999.54
$/ft2/year $ 1.73 $ 1.73 $ 1.71 N/A $ 2.32
Greenhouse Gas Emissions
MtCO2e/year 59 59 58 N/A 79
kgCO2e/ft2/year 6 6 6 N/A 8
More than 50% of your building is defined as Office. Please note that your rating accounts for all of the spaces listed. The National Average column presents energyperformance data your building would have if your building had an average rating of 50. Notes:o - This attribute is optional.d - A default value has been supplied by Portfolio Manager.
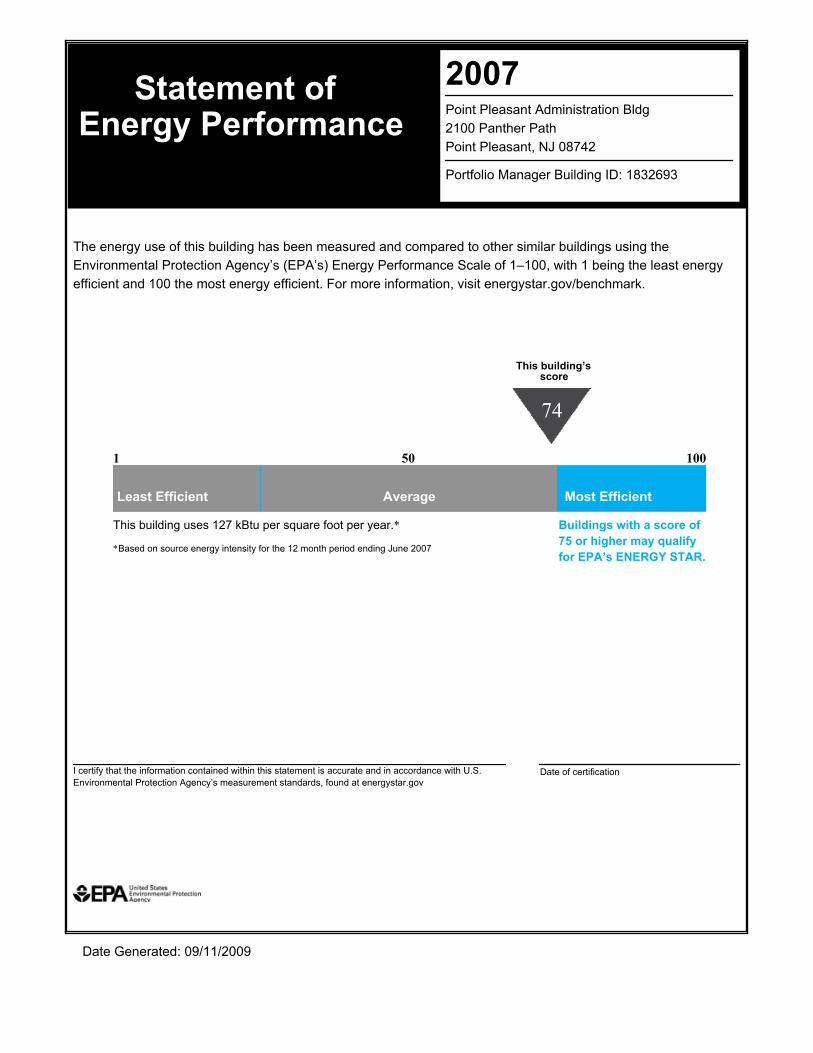
2007Point Pleasant Administration Bldg2100 Panther PathPoint Pleasant, NJ 08742
Portfolio Manager Building ID: 1832693
The energy use of this building has been measured and compared to other similar buildings using theEnvironmental Protection Agency’s (EPA’s) Energy Performance Scale of 1–100, with 1 being the least energyefficient and 100 the most energy efficient. For more information, visit energystar.gov/benchmark.
This building’sscore
74
100
Most Efficient
This building uses 127 kBtu per square foot per year.*
*Based on source energy intensity for the 12 month period ending June 2007
Date of certification
Date Generated: 09/11/2009
Statement ofEnergy Performance
1
Least Efficient
50
Average
Buildings with a score of75 or higher may qualifyfor EPA’s ENERGY STAR.
I certify that the information contained within this statement is accurate and in accordance with U.S.Environmental Protection Agency’s measurement standards, found at energystar.gov
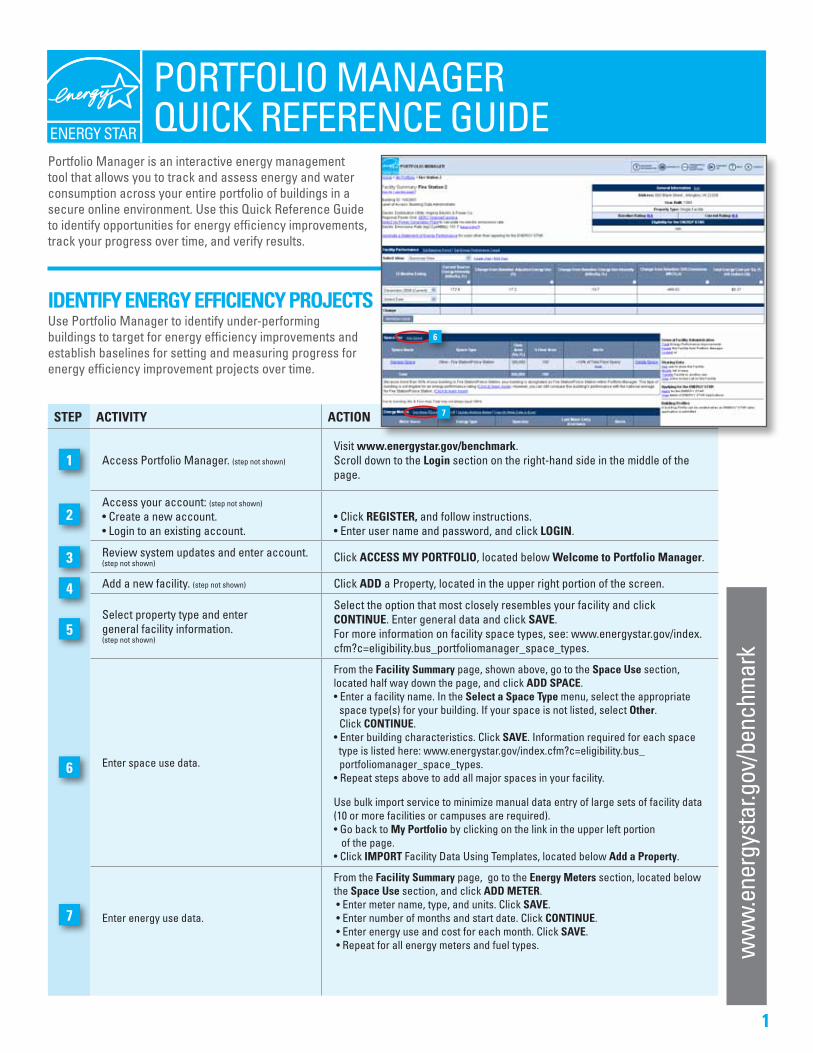
1
Portfolio Manager is an interactive energy management tool that allows you to track and assess energy and water consumption across your entire portfolio of buildings in a secure online environment. Use this Quick Reference Guide to identify opportunities for energy efficiency improvements, track your progress over time, and verify results.
PoRtfolio ManaGeR QUick RefeRence GUide
IdentIfy energy effIcIency projectsUse Portfolio Manager to identify under-performing buildings to target for energy efficiency improvements and establish baselines for setting and measuring progress for energy efficiency improvement projects over time.
step ActIvIty ActIon
access Portfolio Manager. (step not shown)
Visit www.energystar.gov/benchmark.Scroll down to the Login section on the right-hand side in the middle of the page.
access your account: (step not shown)
• Create a new account.• Login to an existing account.
• Click regIster, and follow instructions.• Enter user name and password, and click LogIn.
Review system updates and enter account.(step not shown) click Access My portfoLIo, located below Welcome to portfolio Manager.
add a new facility. (step not shown) click Add a Property, located in the upper right portion of the screen.
Select property type and entergeneral facility information.(step not shown)
Select the option that most closely resembles your facility and click contInUe. enter general data and click sAve. for more information on facility space types, see: www.energystar.gov/index.cfm?c=eligibility.bus_portfoliomanager_space_types.
enter space use data.
from the facility summary page, shown above, go to the space Use section, located half way down the page, and click Add spAce.• Enter a facility name. In the select a space type menu, select the appropriate space type(s) for your building. if your space is not listed, select other. click contInUe.• Enter building characteristics. Click sAve. information required for each space type is listed here: www.energystar.gov/index.cfm?c=eligibility.bus_ portfoliomanager_space_types.• Repeat steps above to add all major spaces in your facility.
Use bulk import service to minimize manual data entry of large sets of facility data (10 or more facilities or campuses are required). • Go back to My portfolio by clicking on the link in the upper left portion of the page.• Click IMport facility data Using templates, located below Add a property.
enter energy use data.
from the facility summary page, go to the energy Meters section, located below the space Use section, and click Add Meter. • Enter meter name, type, and units. Click sAve. • Enter number of months and start date. Click contInUe. • Enter energy use and cost for each month. Click sAve. • Repeat for all energy meters and fuel types.
1
2
3
4
5
ww
w.e
nerg
ysta
r.gov
/ben
chm
ark
6
7
7
6
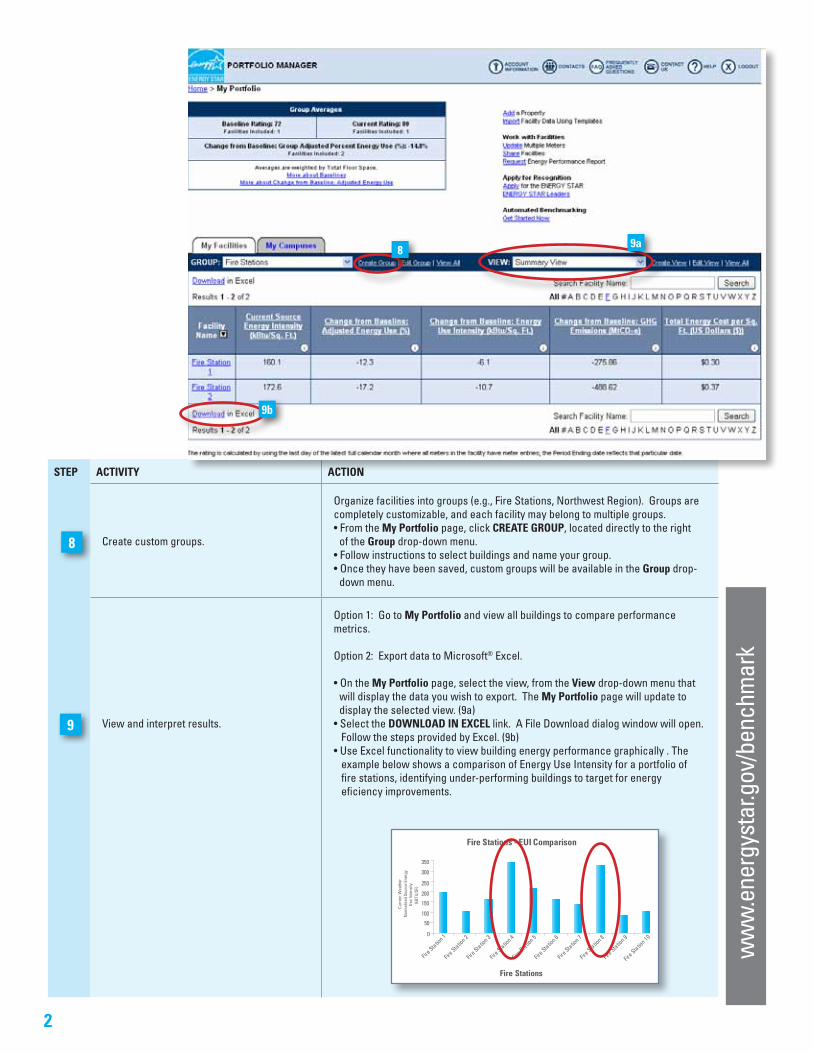
2
step ActIvIty ActIon
create custom groups.
organize facilities into groups (e.g., fire Stations, northwest Region). Groups are completely customizable, and each facility may belong to multiple groups.• From the My portfolio page, click creAte groUp, located directly to the right of the group drop-down menu.• Follow instructions to select buildings and name your group. • Once they have been saved, custom groups will be available in the group drop- down menu.
View and interpret results.
option 1: Go to My portfolio and view all buildings to compare performance metrics.
Option 2: Export data to Microsoft® Excel.
• On the My portfolio page, select the view, from the view drop-down menu that will display the data you wish to export. The My portfolio page will update to display the selected view. (9a)• Select the doWnLoAd In exceL link. a file download dialog window will open. Follow the steps provided by Excel. (9b)• Use Excel functionality to view building energy performance graphically . The example below shows a comparison of Energy Use Intensity for a portfolio of fire stations, identifying under-performing buildings to target for energy eficiency improvements.
9
Fire Stations - EUI Comparison
0
50
100
150
200
250
300
350
Fire Statio
n 1
Fire Statio
n 2
Fire Statio
n 3
Fire Statio
n 4
Fire Statio
n 5
Fire Statio
n 6
Fire Statio
n 7
Fire Statio
n 8
Fire Statio
n 9
Fire Statio
n 10
Fire Stations
Curr
ent W
eath
er
Nor
mal
ized
Sou
rce
Ener
gy
Use
Inte
nsity
(k
BTU
/SF)
8
8
ww
w.e
nerg
ysta
r.gov
/ben
chm
ark
9b
9a
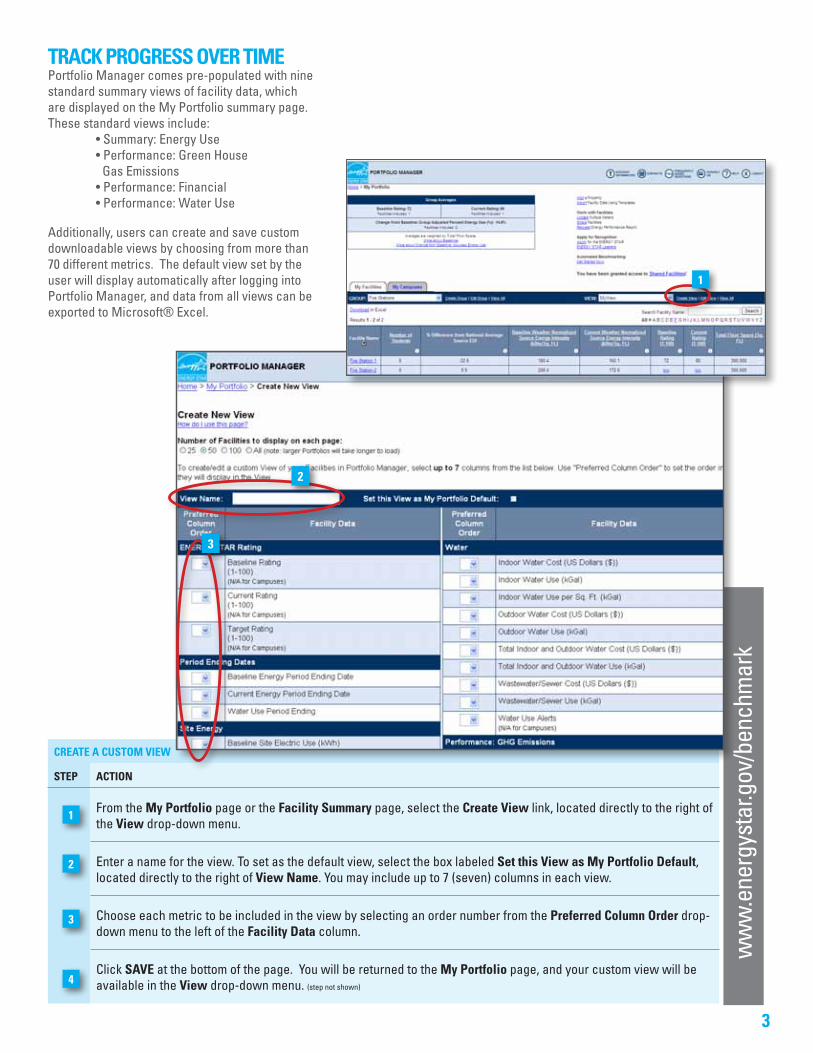
3
trAck progress over tIMe Portfolio Manager comes pre-populated with nine standard summary views of facility data, which are displayed on the My Portfolio summary page. these standard views include: • Summary: Energy Use • Performance: Green House Gas emissions • Performance: Financial • Performance: Water Use
additionally, users can create and save custom downloadable views by choosing from more than 70 different metrics. the default view set by the user will display automatically after logging into Portfolio Manager, and data from all views can be exported to Microsoft® Excel.
ww
w.e
nerg
ysta
r.gov
/ben
chm
ark
creAte A cUstoM vIeW
step ActIon
from the My portfolio page or the facility summary page, select the create view link, located directly to the right of the view drop-down menu.
Enter a name for the view. To set as the default view, select the box labeled set this view as My portfolio default, located directly to the right of view name. You may include up to 7 (seven) columns in each view.
choose each metric to be included in the view by selecting an order number from the preferred column order drop-down menu to the left of the facility data column.
click sAve at the bottom of the page. You will be returned to the My portfolio page, and your custom view will be available in the view drop-down menu. (step not shown)
4
3
1
2
2
3
1
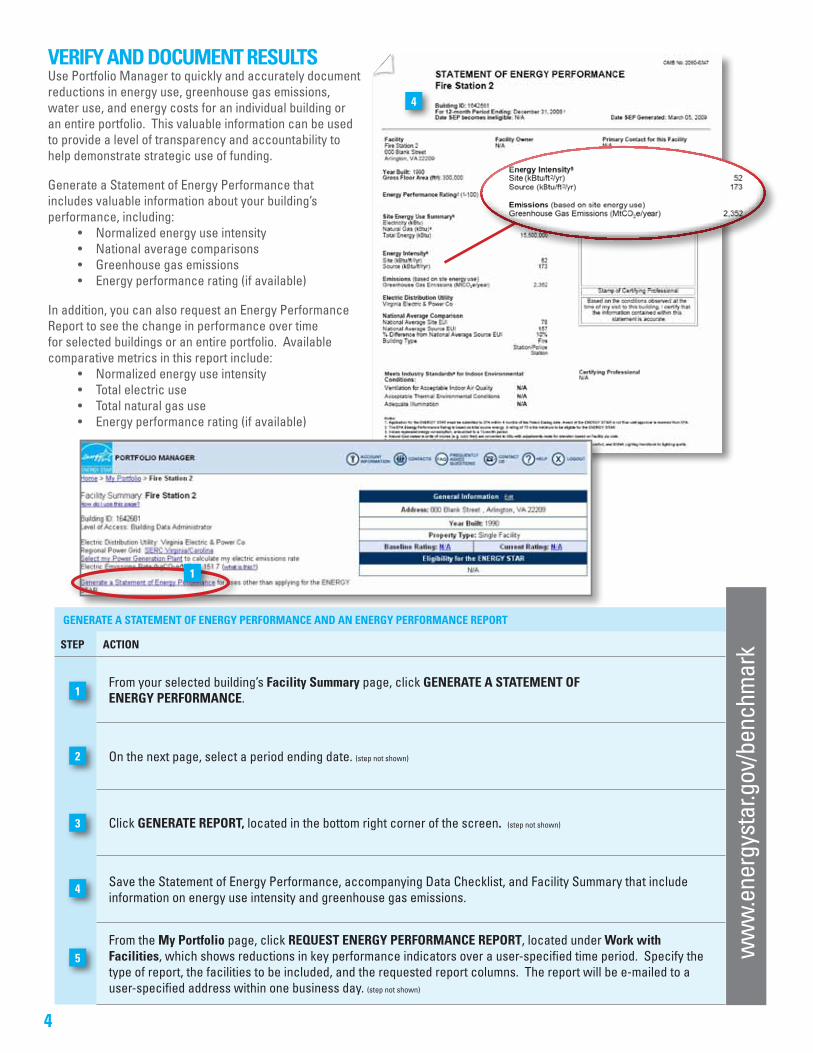
4
verIfy And docUMent resULtsUse Portfolio Manager to quickly and accurately document reductions in energy use, greenhouse gas emissions, water use, and energy costs for an individual building or an entire portfolio. this valuable information can be used to provide a level of transparency and accountability to help demonstrate strategic use of funding.
Generate a Statement of energy Performance that includes valuable information about your building’s performance, including:
• Normalized energy use intensity • National average comparisons • Greenhouse gas emissions • Energy performance rating (if available)
in addition, you can also request an energy Performance Report to see the change in performance over time for selected buildings or an entire portfolio. available comparative metrics in this report include:
• Normalized energy use intensity • Total electric use • Total natural gas use • Energy performance rating (if available)
ww
w.e
nerg
ysta
r.gov
/ben
chm
ark
generAte A stAteMent of energy perforMAnce And An energy perforMAnce report
step ActIon
from your selected building’s facility summary page, click generAte A stAteMent of energy perforMAnce.
On the next page, select a period ending date. (step not shown)
click generAte report, located in the bottom right corner of the screen. (step not shown)
Save the Statement of energy Performance, accompanying data checklist, and facility Summary that include information on energy use intensity and greenhouse gas emissions.
from the My portfolio page, click reQUest energy perforMAnce report, located under Work with facilities, which shows reductions in key performance indicators over a user-specified time period. Specify the type of report, the facilities to be included, and the requested report columns. the report will be e-mailed to a user-specified address within one business day. (step not shown)
4
5
3
1
2
1
4

APPENDIX C
eQUEST MODEL RUN SUMMARIES
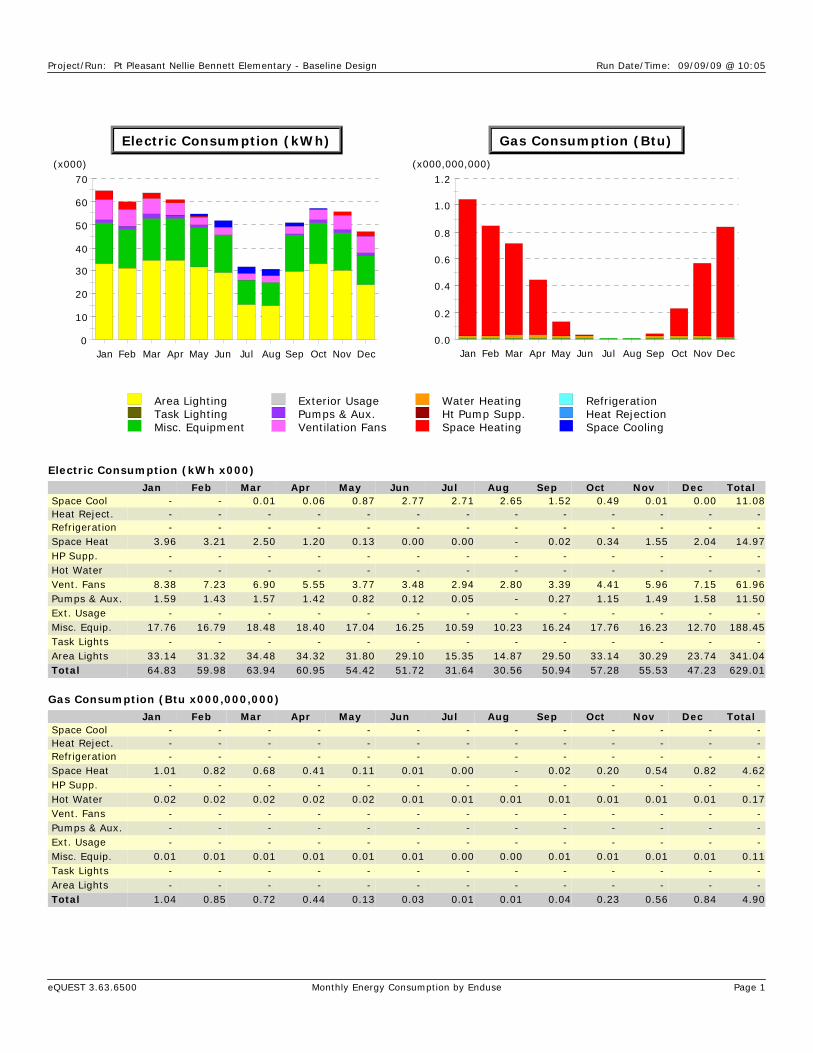
Project/Run: Pt Pleasant Nellie Bennett Elementary - Baseline Design Run Date/Time: 09/09/09 @ 10:05
eQUEST 3.63.6500 Monthly Energy Consumption by Enduse Page 1
0
10
20
30
40
50
60
70
Jan Feb Mar Apr May Jun Jul Aug Sep Oct Nov Dec
Electric Consumption (kWh)
(x000)
0.0
0.2
0.4
0.6
0.8
1.0
1.2
Jan Feb Mar Apr May Jun Jul Aug Sep Oct Nov Dec
Gas Consumption (Btu)
(x000,000,000)
Area LightingTask LightingMisc. Equipment
Exterior UsagePumps & Aux.Ventilation Fans
Water HeatingHt Pump Supp.Space Heating
RefrigerationHeat RejectionSpace Cooling
Electric Consumption (kWh x000)
Jan Feb Mar Apr May Jun Jul Aug Sep Oct Nov Dec Total Space Cool - - 0.01 0.06 0.87 2.77 2.71 2.65 1.52 0.49 0.01 0.00 11.08 Heat Reject. - - - - - - - - - - - - - Refrigeration - - - - - - - - - - - - - Space Heat 3.96 3.21 2.50 1.20 0.13 0.00 0.00 - 0.02 0.34 1.55 2.04 14.97 HP Supp. - - - - - - - - - - - - - Hot Water - - - - - - - - - - - - - Vent. Fans 8.38 7.23 6.90 5.55 3.77 3.48 2.94 2.80 3.39 4.41 5.96 7.15 61.96 Pumps & Aux. 1.59 1.43 1.57 1.42 0.82 0.12 0.05 - 0.27 1.15 1.49 1.58 11.50 Ext. Usage - - - - - - - - - - - - - Misc. Equip. 17.76 16.79 18.48 18.40 17.04 16.25 10.59 10.23 16.24 17.76 16.23 12.70 188.45 Task Lights - - - - - - - - - - - - - Area Lights 33.14 31.32 34.48 34.32 31.80 29.10 15.35 14.87 29.50 33.14 30.29 23.74 341.04 Total 64.83 59.98 63.94 60.95 54.42 51.72 31.64 30.56 50.94 57.28 55.53 47.23 629.01
Gas Consumption (Btu x000,000,000)
Jan Feb Mar Apr May Jun Jul Aug Sep Oct Nov Dec Total Space Cool - - - - - - - - - - - - - Heat Reject. - - - - - - - - - - - - - Refrigeration - - - - - - - - - - - - - Space Heat 1.01 0.82 0.68 0.41 0.11 0.01 0.00 - 0.02 0.20 0.54 0.82 4.62 HP Supp. - - - - - - - - - - - - - Hot Water 0.02 0.02 0.02 0.02 0.02 0.01 0.01 0.01 0.01 0.01 0.01 0.01 0.17 Vent. Fans - - - - - - - - - - - - - Pumps & Aux. - - - - - - - - - - - - - Ext. Usage - - - - - - - - - - - - - Misc. Equip. 0.01 0.01 0.01 0.01 0.01 0.01 0.00 0.00 0.01 0.01 0.01 0.01 0.11 Task Lights - - - - - - - - - - - - - Area Lights - - - - - - - - - - - - - Total 1.04 0.85 0.72 0.44 0.13 0.03 0.01 0.01 0.04 0.23 0.56 0.84 4.90
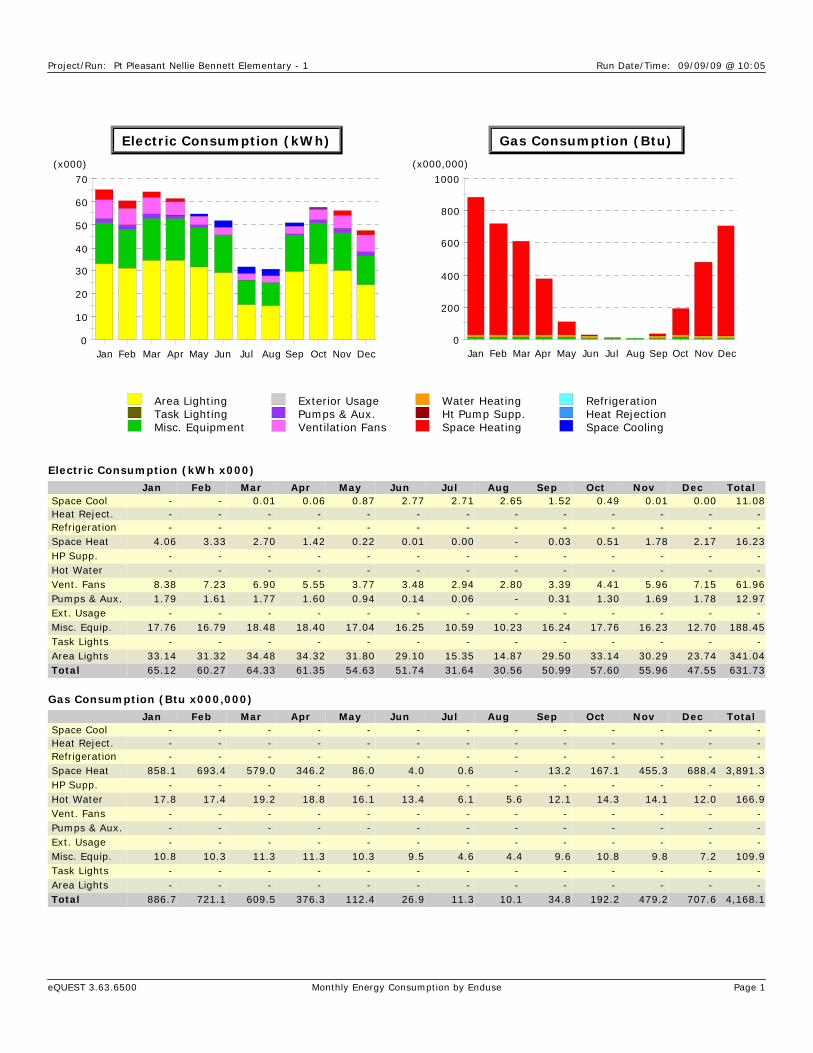
Project/Run: Pt Pleasant Nellie Bennett Elementary - 1 Run Date/Time: 09/09/09 @ 10:05
eQUEST 3.63.6500 Monthly Energy Consumption by Enduse Page 1
0
10
20
30
40
50
60
70
Jan Feb Mar Apr May Jun Jul Aug Sep Oct Nov Dec
Electric Consumption (kWh)
(x000)
0
200
400
600
800
1000
Jan Feb Mar Apr May Jun Jul Aug Sep Oct Nov Dec
Gas Consumption (Btu)
(x000,000)
Area LightingTask LightingMisc. Equipment
Exterior UsagePumps & Aux.Ventilation Fans
Water HeatingHt Pump Supp.Space Heating
RefrigerationHeat RejectionSpace Cooling
Electric Consumption (kWh x000)
Jan Feb Mar Apr May Jun Jul Aug Sep Oct Nov Dec Total Space Cool - - 0.01 0.06 0.87 2.77 2.71 2.65 1.52 0.49 0.01 0.00 11.08 Heat Reject. - - - - - - - - - - - - - Refrigeration - - - - - - - - - - - - - Space Heat 4.06 3.33 2.70 1.42 0.22 0.01 0.00 - 0.03 0.51 1.78 2.17 16.23 HP Supp. - - - - - - - - - - - - - Hot Water - - - - - - - - - - - - - Vent. Fans 8.38 7.23 6.90 5.55 3.77 3.48 2.94 2.80 3.39 4.41 5.96 7.15 61.96 Pumps & Aux. 1.79 1.61 1.77 1.60 0.94 0.14 0.06 - 0.31 1.30 1.69 1.78 12.97 Ext. Usage - - - - - - - - - - - - - Misc. Equip. 17.76 16.79 18.48 18.40 17.04 16.25 10.59 10.23 16.24 17.76 16.23 12.70 188.45 Task Lights - - - - - - - - - - - - - Area Lights 33.14 31.32 34.48 34.32 31.80 29.10 15.35 14.87 29.50 33.14 30.29 23.74 341.04 Total 65.12 60.27 64.33 61.35 54.63 51.74 31.64 30.56 50.99 57.60 55.96 47.55 631.73
Gas Consumption (Btu x000,000)
Jan Feb Mar Apr May Jun Jul Aug Sep Oct Nov Dec Total Space Cool - - - - - - - - - - - - - Heat Reject. - - - - - - - - - - - - - Refrigeration - - - - - - - - - - - - - Space Heat 858.1 693.4 579.0 346.2 86.0 4.0 0.6 - 13.2 167.1 455.3 688.4 3,891.3 HP Supp. - - - - - - - - - - - - - Hot Water 17.8 17.4 19.2 18.8 16.1 13.4 6.1 5.6 12.1 14.3 14.1 12.0 166.9 Vent. Fans - - - - - - - - - - - - - Pumps & Aux. - - - - - - - - - - - - - Ext. Usage - - - - - - - - - - - - - Misc. Equip. 10.8 10.3 11.3 11.3 10.3 9.5 4.6 4.4 9.6 10.8 9.8 7.2 109.9 Task Lights - - - - - - - - - - - - - Area Lights - - - - - - - - - - - - - Total 886.7 721.1 609.5 376.3 112.4 26.9 11.3 10.1 34.8 192.2 479.2 707.6 4,168.1
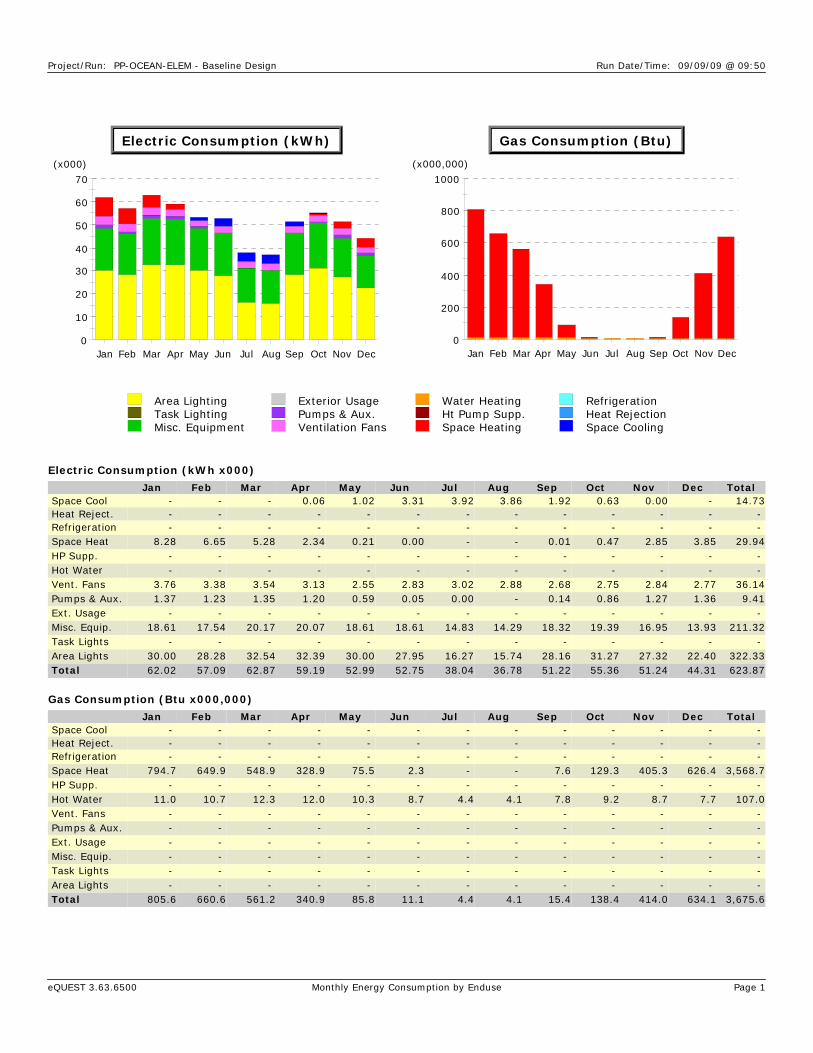
Project/Run: PP-OCEAN-ELEM - Baseline Design Run Date/Time: 09/09/09 @ 09:50
eQUEST 3.63.6500 Monthly Energy Consumption by Enduse Page 1
0
10
20
30
40
50
60
70
Jan Feb Mar Apr May Jun Jul Aug Sep Oct Nov Dec
Electric Consumption (kWh)
(x000)
0
200
400
600
800
1000
Jan Feb Mar Apr May Jun Jul Aug Sep Oct Nov Dec
Gas Consumption (Btu)
(x000,000)
Area LightingTask LightingMisc. Equipment
Exterior UsagePumps & Aux.Ventilation Fans
Water HeatingHt Pump Supp.Space Heating
RefrigerationHeat RejectionSpace Cooling
Electric Consumption (kWh x000)
Jan Feb Mar Apr May Jun Jul Aug Sep Oct Nov Dec Total Space Cool - - - 0.06 1.02 3.31 3.92 3.86 1.92 0.63 0.00 - 14.73 Heat Reject. - - - - - - - - - - - - - Refrigeration - - - - - - - - - - - - - Space Heat 8.28 6.65 5.28 2.34 0.21 0.00 - - 0.01 0.47 2.85 3.85 29.94 HP Supp. - - - - - - - - - - - - - Hot Water - - - - - - - - - - - - - Vent. Fans 3.76 3.38 3.54 3.13 2.55 2.83 3.02 2.88 2.68 2.75 2.84 2.77 36.14 Pumps & Aux. 1.37 1.23 1.35 1.20 0.59 0.05 0.00 - 0.14 0.86 1.27 1.36 9.41 Ext. Usage - - - - - - - - - - - - - Misc. Equip. 18.61 17.54 20.17 20.07 18.61 18.61 14.83 14.29 18.32 19.39 16.95 13.93 211.32 Task Lights - - - - - - - - - - - - - Area Lights 30.00 28.28 32.54 32.39 30.00 27.95 16.27 15.74 28.16 31.27 27.32 22.40 322.33 Total 62.02 57.09 62.87 59.19 52.99 52.75 38.04 36.78 51.22 55.36 51.24 44.31 623.87
Gas Consumption (Btu x000,000)
Jan Feb Mar Apr May Jun Jul Aug Sep Oct Nov Dec Total Space Cool - - - - - - - - - - - - - Heat Reject. - - - - - - - - - - - - - Refrigeration - - - - - - - - - - - - - Space Heat 794.7 649.9 548.9 328.9 75.5 2.3 - - 7.6 129.3 405.3 626.4 3,568.7 HP Supp. - - - - - - - - - - - - - Hot Water 11.0 10.7 12.3 12.0 10.3 8.7 4.4 4.1 7.8 9.2 8.7 7.7 107.0 Vent. Fans - - - - - - - - - - - - - Pumps & Aux. - - - - - - - - - - - - - Ext. Usage - - - - - - - - - - - - - Misc. Equip. - - - - - - - - - - - - - Task Lights - - - - - - - - - - - - - Area Lights - - - - - - - - - - - - - Total 805.6 660.6 561.2 340.9 85.8 11.1 4.4 4.1 15.4 138.4 414.0 634.1 3,675.6

Project/Run: PP-OCEAN-ELEM - 1 Run Date/Time: 09/09/09 @ 09:50
eQUEST 3.63.6500 Monthly Energy Consumption by Enduse Page 1
0
10
20
30
40
50
60
70
Jan Feb Mar Apr May Jun Jul Aug Sep Oct Nov Dec
Electric Consumption (kWh)
(x000)
0
100
200
300
400
500
600
700
Jan Feb Mar Apr May Jun Jul Aug Sep Oct Nov Dec
Gas Consumption (Btu)
(x000,000)
Area LightingTask LightingMisc. Equipment
Exterior UsagePumps & Aux.Ventilation Fans
Water HeatingHt Pump Supp.Space Heating
RefrigerationHeat RejectionSpace Cooling
Electric Consumption (kWh x000)
Jan Feb Mar Apr May Jun Jul Aug Sep Oct Nov Dec Total Space Cool - - - 0.06 1.02 3.31 3.92 3.86 1.92 0.63 0.00 - 14.73 Heat Reject. - - - - - - - - - - - - - Refrigeration - - - - - - - - - - - - - Space Heat 8.39 6.77 5.46 2.53 0.28 0.00 - - 0.01 0.58 3.07 4.00 31.09 HP Supp. - - - - - - - - - - - - - Hot Water - - - - - - - - - - - - - Vent. Fans 3.76 3.38 3.54 3.13 2.55 2.83 3.02 2.88 2.68 2.75 2.84 2.77 36.14 Pumps & Aux. 1.50 1.35 1.48 1.32 0.65 0.05 0.00 - 0.15 0.95 1.40 1.49 10.33 Ext. Usage - - - - - - - - - - - - - Misc. Equip. 18.61 17.54 20.17 20.07 18.61 18.61 14.83 14.29 18.32 19.39 16.95 13.93 211.32 Task Lights - - - - - - - - - - - - - Area Lights 30.00 28.28 32.54 32.39 30.00 27.95 16.27 15.74 28.16 31.27 27.32 22.40 322.33 Total 62.26 57.33 63.18 59.50 53.12 52.76 38.04 36.78 51.24 55.56 51.57 44.59 625.93
Gas Consumption (Btu x000,000)
Jan Feb Mar Apr May Jun Jul Aug Sep Oct Nov Dec Total Space Cool - - - - - - - - - - - - - Heat Reject. - - - - - - - - - - - - - Refrigeration - - - - - - - - - - - - - Space Heat 670.9 548.5 462.5 275.6 61.1 1.5 - - 4.7 105.8 340.1 526.6 2,997.3 HP Supp. - - - - - - - - - - - - - Hot Water 11.0 10.7 12.3 12.0 10.3 8.7 4.4 4.1 7.8 9.2 8.7 7.7 107.0 Vent. Fans - - - - - - - - - - - - - Pumps & Aux. - - - - - - - - - - - - - Ext. Usage - - - - - - - - - - - - - Misc. Equip. - - - - - - - - - - - - - Task Lights - - - - - - - - - - - - - Area Lights - - - - - - - - - - - - - Total 681.9 559.2 474.8 287.7 71.4 10.2 4.4 4.1 12.5 115.0 348.7 534.3 3,104.3
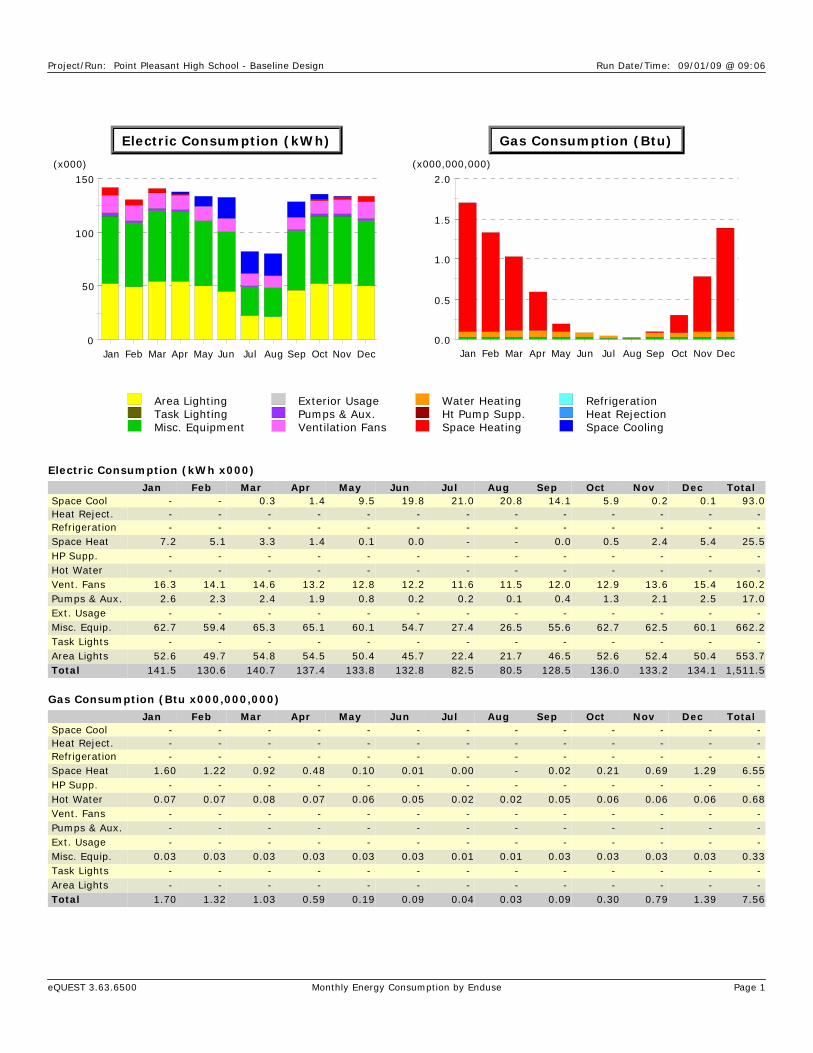
Project/Run: Point Pleasant High School - Baseline Design Run Date/Time: 09/01/09 @ 09:06
eQUEST 3.63.6500 Monthly Energy Consumption by Enduse Page 1
0
50
100
150
Jan Feb Mar Apr May Jun Jul Aug Sep Oct Nov Dec
Electric Consumption (kWh)
(x000)
0.0
0.5
1.0
1.5
2.0
Jan Feb Mar Apr May Jun Jul Aug Sep Oct Nov Dec
Gas Consumption (Btu)
(x000,000,000)
Area LightingTask LightingMisc. Equipment
Exterior UsagePumps & Aux.Ventilation Fans
Water HeatingHt Pump Supp.Space Heating
RefrigerationHeat RejectionSpace Cooling
Electric Consumption (kWh x000)
Jan Feb Mar Apr May Jun Jul Aug Sep Oct Nov Dec Total Space Cool - - 0.3 1.4 9.5 19.8 21.0 20.8 14.1 5.9 0.2 0.1 93.0 Heat Reject. - - - - - - - - - - - - - Refrigeration - - - - - - - - - - - - - Space Heat 7.2 5.1 3.3 1.4 0.1 0.0 - - 0.0 0.5 2.4 5.4 25.5 HP Supp. - - - - - - - - - - - - - Hot Water - - - - - - - - - - - - - Vent. Fans 16.3 14.1 14.6 13.2 12.8 12.2 11.6 11.5 12.0 12.9 13.6 15.4 160.2 Pumps & Aux. 2.6 2.3 2.4 1.9 0.8 0.2 0.2 0.1 0.4 1.3 2.1 2.5 17.0 Ext. Usage - - - - - - - - - - - - - Misc. Equip. 62.7 59.4 65.3 65.1 60.1 54.7 27.4 26.5 55.6 62.7 62.5 60.1 662.2 Task Lights - - - - - - - - - - - - - Area Lights 52.6 49.7 54.8 54.5 50.4 45.7 22.4 21.7 46.5 52.6 52.4 50.4 553.7 Total 141.5 130.6 140.7 137.4 133.8 132.8 82.5 80.5 128.5 136.0 133.2 134.1 1,511.5
Gas Consumption (Btu x000,000,000)
Jan Feb Mar Apr May Jun Jul Aug Sep Oct Nov Dec Total Space Cool - - - - - - - - - - - - - Heat Reject. - - - - - - - - - - - - - Refrigeration - - - - - - - - - - - - - Space Heat 1.60 1.22 0.92 0.48 0.10 0.01 0.00 - 0.02 0.21 0.69 1.29 6.55 HP Supp. - - - - - - - - - - - - - Hot Water 0.07 0.07 0.08 0.07 0.06 0.05 0.02 0.02 0.05 0.06 0.06 0.06 0.68 Vent. Fans - - - - - - - - - - - - - Pumps & Aux. - - - - - - - - - - - - - Ext. Usage - - - - - - - - - - - - - Misc. Equip. 0.03 0.03 0.03 0.03 0.03 0.03 0.01 0.01 0.03 0.03 0.03 0.03 0.33 Task Lights - - - - - - - - - - - - - Area Lights - - - - - - - - - - - - - Total 1.70 1.32 1.03 0.59 0.19 0.09 0.04 0.03 0.09 0.30 0.79 1.39 7.56
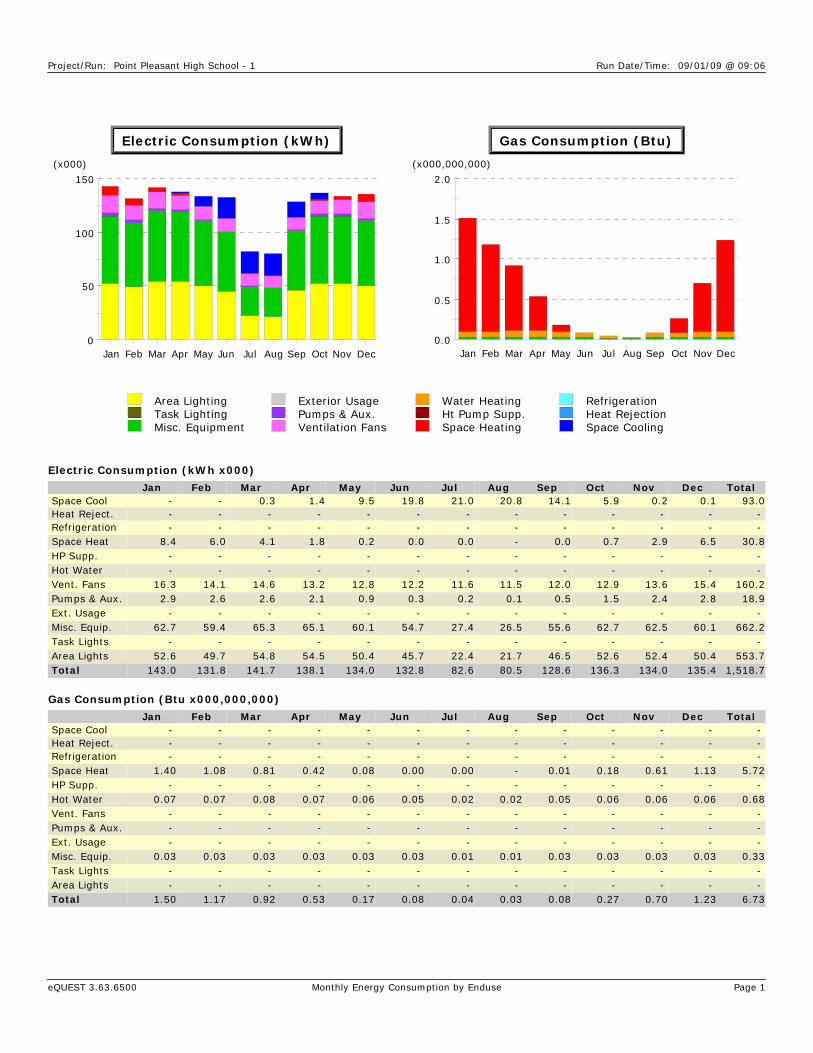
Project/Run: Point Pleasant High School - 1 Run Date/Time: 09/01/09 @ 09:06
eQUEST 3.63.6500 Monthly Energy Consumption by Enduse Page 1
0
50
100
150
Jan Feb Mar Apr May Jun Jul Aug Sep Oct Nov Dec
Electric Consumption (kWh)
(x000)
0.0
0.5
1.0
1.5
2.0
Jan Feb Mar Apr May Jun Jul Aug Sep Oct Nov Dec
Gas Consumption (Btu)
(x000,000,000)
Area LightingTask LightingMisc. Equipment
Exterior UsagePumps & Aux.Ventilation Fans
Water HeatingHt Pump Supp.Space Heating
RefrigerationHeat RejectionSpace Cooling
Electric Consumption (kWh x000)
Jan Feb Mar Apr May Jun Jul Aug Sep Oct Nov Dec Total Space Cool - - 0.3 1.4 9.5 19.8 21.0 20.8 14.1 5.9 0.2 0.1 93.0 Heat Reject. - - - - - - - - - - - - - Refrigeration - - - - - - - - - - - - - Space Heat 8.4 6.0 4.1 1.8 0.2 0.0 0.0 - 0.0 0.7 2.9 6.5 30.8 HP Supp. - - - - - - - - - - - - - Hot Water - - - - - - - - - - - - - Vent. Fans 16.3 14.1 14.6 13.2 12.8 12.2 11.6 11.5 12.0 12.9 13.6 15.4 160.2 Pumps & Aux. 2.9 2.6 2.6 2.1 0.9 0.3 0.2 0.1 0.5 1.5 2.4 2.8 18.9 Ext. Usage - - - - - - - - - - - - - Misc. Equip. 62.7 59.4 65.3 65.1 60.1 54.7 27.4 26.5 55.6 62.7 62.5 60.1 662.2 Task Lights - - - - - - - - - - - - - Area Lights 52.6 49.7 54.8 54.5 50.4 45.7 22.4 21.7 46.5 52.6 52.4 50.4 553.7 Total 143.0 131.8 141.7 138.1 134.0 132.8 82.6 80.5 128.6 136.3 134.0 135.4 1,518.7
Gas Consumption (Btu x000,000,000)
Jan Feb Mar Apr May Jun Jul Aug Sep Oct Nov Dec Total Space Cool - - - - - - - - - - - - - Heat Reject. - - - - - - - - - - - - - Refrigeration - - - - - - - - - - - - - Space Heat 1.40 1.08 0.81 0.42 0.08 0.00 0.00 - 0.01 0.18 0.61 1.13 5.72 HP Supp. - - - - - - - - - - - - - Hot Water 0.07 0.07 0.08 0.07 0.06 0.05 0.02 0.02 0.05 0.06 0.06 0.06 0.68 Vent. Fans - - - - - - - - - - - - - Pumps & Aux. - - - - - - - - - - - - - Ext. Usage - - - - - - - - - - - - - Misc. Equip. 0.03 0.03 0.03 0.03 0.03 0.03 0.01 0.01 0.03 0.03 0.03 0.03 0.33 Task Lights - - - - - - - - - - - - - Area Lights - - - - - - - - - - - - - Total 1.50 1.17 0.92 0.53 0.17 0.08 0.04 0.03 0.08 0.27 0.70 1.23 6.73

Project/Run: Point Pleasant Middle School - Baseline Design Run Date/Time: 09/01/09 @ 10:47
eQUEST 3.63.6500 Monthly Energy Consumption by Enduse Page 1
0
20
40
60
80
100
Jan Feb Mar Apr May Jun Jul Aug Sep Oct Nov Dec
Electric Consumption (kWh)
(x000)
0.0
0.5
1.0
1.5
2.0
Jan Feb Mar Apr May Jun Jul Aug Sep Oct Nov Dec
Gas Consumption (Btu)
(x000,000,000)
Area LightingTask LightingMisc. Equipment
Exterior UsagePumps & Aux.Ventilation Fans
Water HeatingHt Pump Supp.Space Heating
RefrigerationHeat RejectionSpace Cooling
Electric Consumption (kWh x000)
Jan Feb Mar Apr May Jun Jul Aug Sep Oct Nov Dec Total Space Cool - - 0.19 0.74 4.64 9.95 13.44 13.24 7.19 2.93 0.16 0.07 52.54 Heat Reject. - - - - - - - - - - - - - Refrigeration - - - - - - - - - - - - - Space Heat - - - - - - - - - - - - - HP Supp. - - - - - - - - - - - - - Hot Water - - - - - - - - - - - - - Vent. Fans 17.60 15.51 16.30 14.96 14.46 13.74 14.20 14.19 13.73 14.70 15.38 16.96 181.73 Pumps & Aux. 1.99 1.78 1.87 1.53 0.81 0.32 0.25 0.26 0.45 1.11 1.71 1.96 14.03 Ext. Usage - - - - - - - - - - - - - Misc. Equip. 24.78 23.21 26.55 26.32 24.78 26.26 26.31 25.44 25.39 25.66 22.78 24.78 302.27 Task Lights - - - - - - - - - - - - - Area Lights 32.20 30.36 34.93 34.78 32.20 29.86 16.92 16.37 30.13 33.57 29.31 32.20 352.84 Total 76.57 70.86 79.84 78.34 76.90 80.13 71.11 69.49 76.90 77.97 69.34 75.97 903.41
Gas Consumption (Btu x000,000,000)
Jan Feb Mar Apr May Jun Jul Aug Sep Oct Nov Dec Total Space Cool - - - - - - - - - - - - - Heat Reject. - - - - - - - - - - - - - Refrigeration - - - - - - - - - - - - - Space Heat 1.49 1.17 0.93 0.54 0.13 0.02 0.01 0.00 0.03 0.25 0.74 1.22 6.52 HP Supp. - - - - - - - - - - - - - Hot Water 0.02 0.02 0.03 0.03 0.02 0.02 0.01 0.01 0.02 0.02 0.02 0.02 0.24 Vent. Fans - - - - - - - - - - - - - Pumps & Aux. - - - - - - - - - - - - - Ext. Usage - - - - - - - - - - - - - Misc. Equip. 0.00 0.00 0.00 0.00 0.00 0.00 0.00 0.00 0.00 0.00 0.00 0.00 0.03 Task Lights - - - - - - - - - - - - - Area Lights - - - - - - - - - - - - - Total 1.51 1.20 0.96 0.56 0.16 0.04 0.02 0.01 0.05 0.27 0.76 1.24 6.78

Project/Run: Point Pleasant Middle School - 1 Run Date/Time: 09/01/09 @ 10:47
eQUEST 3.63.6500 Monthly Energy Consumption by Enduse Page 1
0
20
40
60
80
100
Jan Feb Mar Apr May Jun Jul Aug Sep Oct Nov Dec
Electric Consumption (kWh)
(x000)
0.0
0.2
0.4
0.6
0.8
1.0
1.2
1.4
Jan Feb Mar Apr May Jun Jul Aug Sep Oct Nov Dec
Gas Consumption (Btu)
(x000,000,000)
Area LightingTask LightingMisc. Equipment
Exterior UsagePumps & Aux.Ventilation Fans
Water HeatingHt Pump Supp.Space Heating
RefrigerationHeat RejectionSpace Cooling
Electric Consumption (kWh x000)
Jan Feb Mar Apr May Jun Jul Aug Sep Oct Nov Dec Total Space Cool - - 0.19 0.74 4.64 9.95 13.44 13.24 7.19 2.93 0.16 0.07 52.54 Heat Reject. - - - - - - - - - - - - - Refrigeration - - - - - - - - - - - - - Space Heat 1.08 0.86 0.69 0.42 0.13 0.02 0.01 0.00 0.04 0.22 0.57 0.89 4.96 HP Supp. - - - - - - - - - - - - - Hot Water - - - - - - - - - - - - - Vent. Fans 17.60 15.51 16.30 14.96 14.46 13.74 14.20 14.19 13.73 14.70 15.38 16.96 181.73 Pumps & Aux. 2.20 1.96 2.07 1.70 0.91 0.36 0.28 0.29 0.50 1.24 1.89 2.16 15.56 Ext. Usage - - - - - - - - - - - - - Misc. Equip. 24.78 23.21 26.55 26.32 24.78 26.26 26.31 25.44 25.39 25.66 22.78 24.78 302.27 Task Lights - - - - - - - - - - - - - Area Lights 32.20 30.36 34.93 34.78 32.20 29.86 16.92 16.37 30.13 33.57 29.31 32.20 352.84 Total 77.86 71.91 80.73 78.93 77.12 80.20 71.15 69.53 76.99 78.32 70.09 77.07 909.89
Gas Consumption (Btu x000,000,000)
Jan Feb Mar Apr May Jun Jul Aug Sep Oct Nov Dec Total Space Cool - - - - - - - - - - - - - Heat Reject. - - - - - - - - - - - - - Refrigeration - - - - - - - - - - - - - Space Heat 1.37 1.07 0.84 0.47 0.11 0.01 0.00 0.00 0.02 0.21 0.66 1.11 5.89 HP Supp. - - - - - - - - - - - - - Hot Water 0.02 0.02 0.03 0.03 0.02 0.02 0.01 0.01 0.02 0.02 0.02 0.02 0.24 Vent. Fans - - - - - - - - - - - - - Pumps & Aux. - - - - - - - - - - - - - Ext. Usage - - - - - - - - - - - - - Misc. Equip. 0.00 0.00 0.00 0.00 0.00 0.00 0.00 0.00 0.00 0.00 0.00 0.00 0.03 Task Lights - - - - - - - - - - - - - Area Lights - - - - - - - - - - - - - Total 1.39 1.10 0.87 0.50 0.13 0.03 0.01 0.01 0.04 0.23 0.68 1.14 6.15
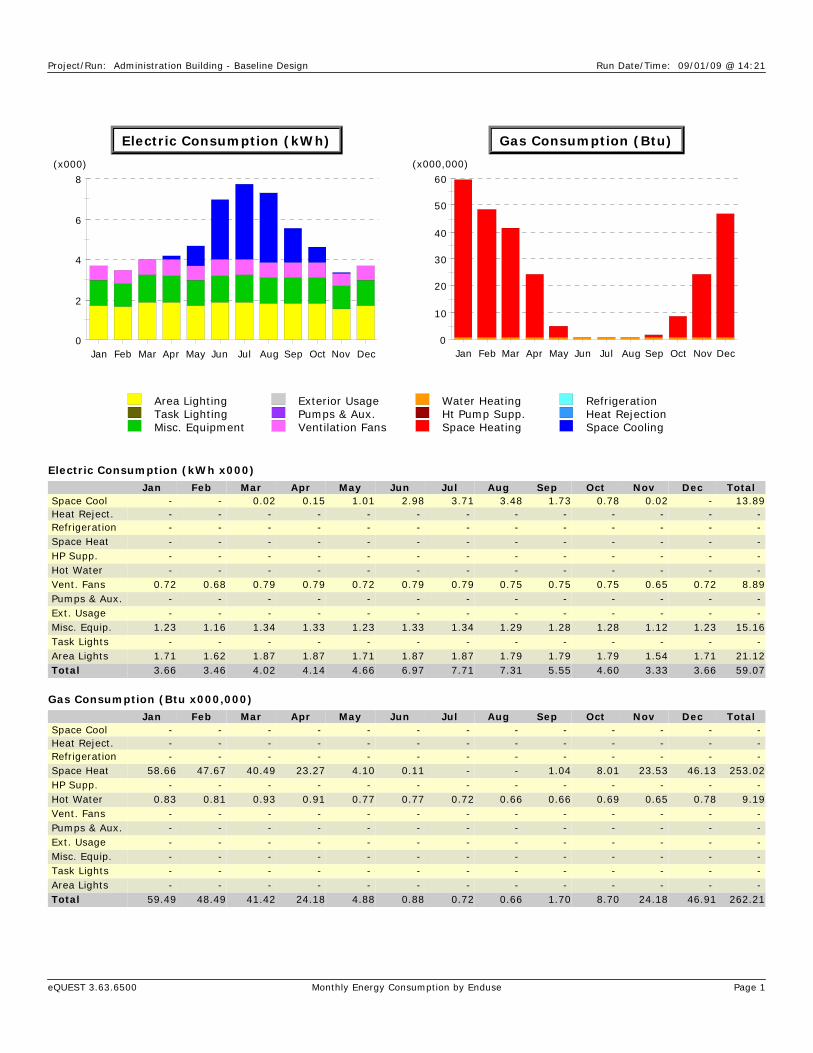
Project/Run: Administration Building - Baseline Design Run Date/Time: 09/01/09 @ 14:21
eQUEST 3.63.6500 Monthly Energy Consumption by Enduse Page 1
0
2
4
6
8
Jan Feb Mar Apr May Jun Jul Aug Sep Oct Nov Dec
Electric Consumption (kWh)
(x000)
0
10
20
30
40
50
60
Jan Feb Mar Apr May Jun Jul Aug Sep Oct Nov Dec
Gas Consumption (Btu)
(x000,000)
Area LightingTask LightingMisc. Equipment
Exterior UsagePumps & Aux.Ventilation Fans
Water HeatingHt Pump Supp.Space Heating
RefrigerationHeat RejectionSpace Cooling
Electric Consumption (kWh x000)
Jan Feb Mar Apr May Jun Jul Aug Sep Oct Nov Dec Total Space Cool - - 0.02 0.15 1.01 2.98 3.71 3.48 1.73 0.78 0.02 - 13.89 Heat Reject. - - - - - - - - - - - - - Refrigeration - - - - - - - - - - - - - Space Heat - - - - - - - - - - - - - HP Supp. - - - - - - - - - - - - - Hot Water - - - - - - - - - - - - - Vent. Fans 0.72 0.68 0.79 0.79 0.72 0.79 0.79 0.75 0.75 0.75 0.65 0.72 8.89 Pumps & Aux. - - - - - - - - - - - - - Ext. Usage - - - - - - - - - - - - - Misc. Equip. 1.23 1.16 1.34 1.33 1.23 1.33 1.34 1.29 1.28 1.28 1.12 1.23 15.16 Task Lights - - - - - - - - - - - - - Area Lights 1.71 1.62 1.87 1.87 1.71 1.87 1.87 1.79 1.79 1.79 1.54 1.71 21.12 Total 3.66 3.46 4.02 4.14 4.66 6.97 7.71 7.31 5.55 4.60 3.33 3.66 59.07
Gas Consumption (Btu x000,000)
Jan Feb Mar Apr May Jun Jul Aug Sep Oct Nov Dec Total Space Cool - - - - - - - - - - - - - Heat Reject. - - - - - - - - - - - - - Refrigeration - - - - - - - - - - - - - Space Heat 58.66 47.67 40.49 23.27 4.10 0.11 - - 1.04 8.01 23.53 46.13 253.02 HP Supp. - - - - - - - - - - - - - Hot Water 0.83 0.81 0.93 0.91 0.77 0.77 0.72 0.66 0.66 0.69 0.65 0.78 9.19 Vent. Fans - - - - - - - - - - - - - Pumps & Aux. - - - - - - - - - - - - - Ext. Usage - - - - - - - - - - - - - Misc. Equip. - - - - - - - - - - - - - Task Lights - - - - - - - - - - - - - Area Lights - - - - - - - - - - - - - Total 59.49 48.49 41.42 24.18 4.88 0.88 0.72 0.66 1.70 8.70 24.18 46.91 262.21

APPENDIX D
OPTION 1 - LED
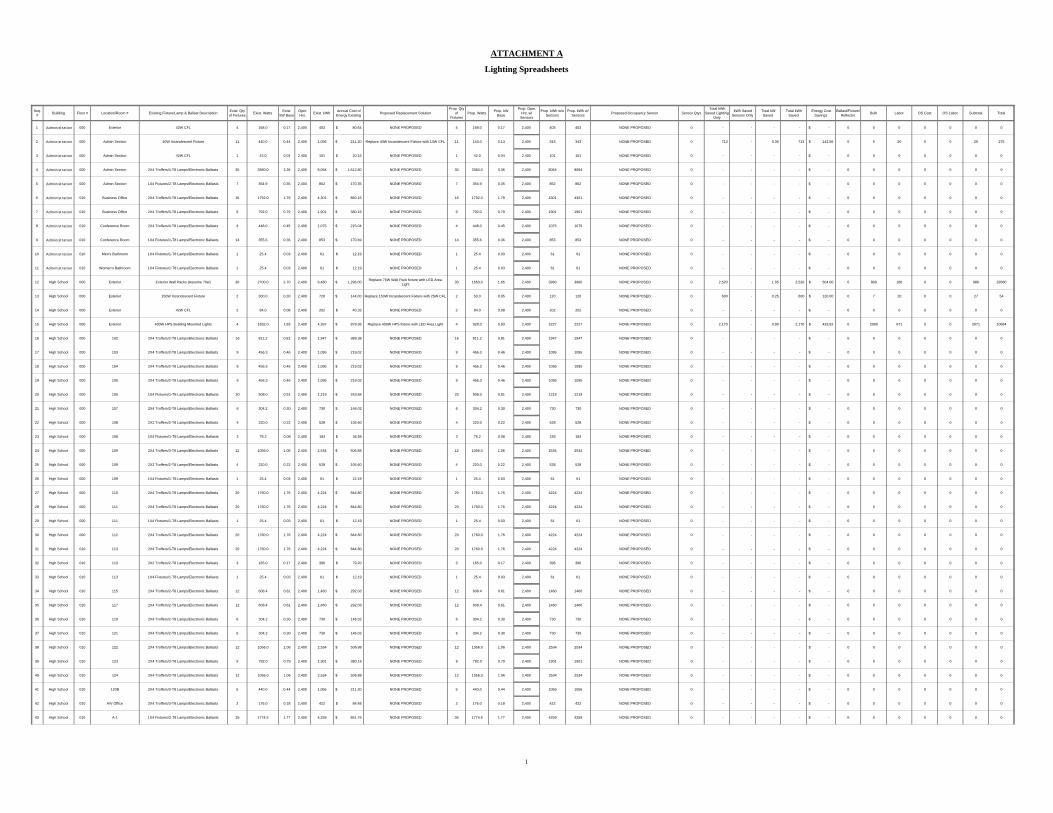
ATTACHMENT A
Lighting Spreadsheets
Seq. # Building Floor # Location/Room # Existing Fixture/Lamp & Ballast Description Exist. Qty
of Fixtures Exist. Watts Exist. kW Base
Oper. Hrs. Exist. kWh Annual Cost of
Energy Existing Proposed Replacement SolutionProp. Qty
of Fixtures
Prop. Watts Prop. kW Base
Prop. Oper. Hrs. w/ Sensors
Prop. kWh w/o Sensors
Prop. kWh w/ Sensors Proposed Occupancy Sensor Sensor Qtys
Total kWh Saved Lighting
Only
kWh Saved Sensors Only
Total kW Saved
Total kWh Saved
Energy Cost Savings
Ballast/Fixture/Reflector Bulb Labor OS Cost OS Labor Subtotal Total
1 Administration 000 Exterior 42W CFL 4 168.0 0.17 2,400 403 80.64$ NONE PROPOSED 4 168.0 0.17 2,400 403 403 NONE PROPOSED 0 - - - - -$ 0 0 0 0 0 0 0
2 Administration 000 Admin Section 40W Incandescent Fixture 11 440.0 0.44 2,400 1,056 211.20$ Replace 40W Incandescent Fixture with 13W CFL 11 143.0 0.14 2,400 343 343 NONE PROPOSED 0 713 - 0.30 713 142.56$ 0 5 20 0 0 25 275
3 Administration 000 Admin Section 42W CFL 1 42.0 0.04 2,400 101 20.16$ NONE PROPOSED 1 42.0 0.04 2,400 101 101 NONE PROPOSED 0 - - - - -$ 0 0 0 0 0 0 0
4 Administration 000 Admin Section 2X4 Troffers/4-T8 Lamps/Electronic Ballasts 30 3360.0 3.36 2,400 8,064 1,612.80$ NONE PROPOSED 30 3360.0 3.36 2,400 8064 8064 NONE PROPOSED 0 - - - - -$ 0 0 0 0 0 0 0
5 Administration 000 Admin Section 1X4 Fixtures/2-T8 Lamps/Electronic Ballasts 7 354.9 0.35 2,400 852 170.35$ NONE PROPOSED 7 354.9 0.35 2,400 852 852 NONE PROPOSED 0 - - - - -$ 0 0 0 0 0 0 0
6 Administration 010 Business Office 2X4 Troffers/4-T8 Lamps/Electronic Ballasts 16 1792.0 1.79 2,400 4,301 860.16$ NONE PROPOSED 16 1792.0 1.79 2,400 4301 4301 NONE PROPOSED 0 - - - - -$ 0 0 0 0 0 0 0
7 Administration 010 Business Office 2X4 Troffers/3-T8 Lamps/Electronic Ballasts 9 792.0 0.79 2,400 1,901 380.16$ NONE PROPOSED 9 792.0 0.79 2,400 1901 1901 NONE PROPOSED 0 - - - - -$ 0 0 0 0 0 0 0
8 Administration 010 Conference Room 2X4 Troffers/4-T8 Lamps/Electronic Ballasts 4 448.0 0.45 2,400 1,075 215.04$ NONE PROPOSED 4 448.0 0.45 2,400 1075 1075 NONE PROPOSED 0 - - - - -$ 0 0 0 0 0 0 0
9 Administration 010 Conference Room 1X4 Fixtures/1-T8 Lamps/Electronic Ballasts 14 355.6 0.36 2,400 853 170.69$ NONE PROPOSED 14 355.6 0.36 2,400 853 853 NONE PROPOSED 0 - - - - -$ 0 0 0 0 0 0 0
10 Administration 010 Men's Bathroom 1X4 Fixtures/1-T8 Lamps/Electronic Ballasts 1 25.4 0.03 2,400 61 12.19$ NONE PROPOSED 1 25.4 0.03 2,400 61 61 NONE PROPOSED 0 - - - - -$ 0 0 0 0 0 0 0
11 Administration 010 Women's Bathroom 1X4 Fixtures/1-T8 Lamps/Electronic Ballasts 1 25.4 0.03 2,400 61 12.19$ NONE PROPOSED 1 25.4 0.03 2,400 61 61 NONE PROPOSED 0 - - - - -$ 0 0 0 0 0 0 0
12 High School 000 Exterior Exterior Wall Packs (Assume 70w) 30 2700.0 2.70 2,400 6,480 1,296.00$ Replace 70W Wall Pack fixture with LED Area Light 30 1650.0 1.65 2,400 3960 3960 NONE PROPOSED 0 2,520 - 1.05 2,520 504.00$ 0 800 186 0 0 986 29580
13 High School 000 Exterior 150W Incandescent Fixture 2 300.0 0.30 2,400 720 144.00$ Replace 150W Incandescent Fixture with 25W CFL 2 50.0 0.05 2,400 120 120 NONE PROPOSED 0 600 - 0.25 600 120.00$ 0 7 20 0 0 27 54
14 High School 000 Exterior 42W CFL 2 84.0 0.08 2,400 202 40.32$ NONE PROPOSED 2 84.0 0.08 2,400 202 202 NONE PROPOSED 0 - - - - -$ 0 0 0 0 0 0 0
15 High School 000 Exterior 400W HPS Building Mounted Lights 4 1832.0 1.83 2,400 4,397 879.36$ Replace 400W HPS fixture with LED Area Light 4 928.0 0.93 2,400 2227 2227 NONE PROPOSED 0 2,170 - 0.90 2,170 433.92$ 0 2000 671 0 0 2671 10684
16 High School 000 102 2X4 Troffers/2-T8 Lamps/Electronic Ballasts 16 811.2 0.81 2,400 1,947 389.38$ NONE PROPOSED 16 811.2 0.81 2,400 1947 1947 NONE PROPOSED 0 - - - - -$ 0 0 0 0 0 0 0
17 High School 000 103 2X4 Troffers/2-T8 Lamps/Electronic Ballasts 9 456.3 0.46 2,400 1,095 219.02$ NONE PROPOSED 9 456.3 0.46 2,400 1095 1095 NONE PROPOSED 0 - - - - -$ 0 0 0 0 0 0 0
18 High School 000 104 2X4 Troffers/2-T8 Lamps/Electronic Ballasts 9 456.3 0.46 2,400 1,095 219.02$ NONE PROPOSED 9 456.3 0.46 2,400 1095 1095 NONE PROPOSED 0 - - - - -$ 0 0 0 0 0 0 0
19 High School 000 105 2X4 Troffers/2-T8 Lamps/Electronic Ballasts 9 456.3 0.46 2,400 1,095 219.02$ NONE PROPOSED 9 456.3 0.46 2,400 1095 1095 NONE PROPOSED 0 - - - - -$ 0 0 0 0 0 0 0
20 High School 000 106 1X4 Fixtures/1-T8 Lamps/Electronic Ballasts 20 508.0 0.51 2,400 1,219 243.84$ NONE PROPOSED 20 508.0 0.51 2,400 1219 1219 NONE PROPOSED 0 - - - - -$ 0 0 0 0 0 0 0
21 High School 000 107 2X4 Troffers/2-T8 Lamps/Electronic Ballasts 6 304.2 0.30 2,400 730 146.02$ NONE PROPOSED 6 304.2 0.30 2,400 730 730 NONE PROPOSED 0 - - - - -$ 0 0 0 0 0 0 0
22 High School 000 108 2X2 Troffers/2-T8 Lamps/Electronic Ballasts 4 220.0 0.22 2,400 528 105.60$ NONE PROPOSED 4 220.0 0.22 2,400 528 528 NONE PROPOSED 0 - - - - -$ 0 0 0 0 0 0 0
23 High School 000 108 1X4 Fixtures/1-T8 Lamps/Electronic Ballasts 3 76.2 0.08 2,400 183 36.58$ NONE PROPOSED 3 76.2 0.08 2,400 183 183 NONE PROPOSED 0 - - - - -$ 0 0 0 0 0 0 0
24 High School 000 109 2X4 Troffers/3-T8 Lamps/Electronic Ballasts 12 1056.0 1.06 2,400 2,534 506.88$ NONE PROPOSED 12 1056.0 1.06 2,400 2534 2534 NONE PROPOSED 0 - - - - -$ 0 0 0 0 0 0 0
25 High School 000 109 2X2 Troffers/2-T8 Lamps/Electronic Ballasts 4 220.0 0.22 2,400 528 105.60$ NONE PROPOSED 4 220.0 0.22 2,400 528 528 NONE PROPOSED 0 - - - - -$ 0 0 0 0 0 0 0
26 High School 000 109 1X4 Fixtures/1-T8 Lamps/Electronic Ballasts 1 25.4 0.03 2,400 61 12.19$ NONE PROPOSED 1 25.4 0.03 2,400 61 61 NONE PROPOSED 0 - - - - -$ 0 0 0 0 0 0 0
27 High School 000 110 2X4 Troffers/3-T8 Lamps/Electronic Ballasts 20 1760.0 1.76 2,400 4,224 844.80$ NONE PROPOSED 20 1760.0 1.76 2,400 4224 4224 NONE PROPOSED 0 - - - - -$ 0 0 0 0 0 0 0
28 High School 000 111 2X4 Troffers/3-T8 Lamps/Electronic Ballasts 20 1760.0 1.76 2,400 4,224 844.80$ NONE PROPOSED 20 1760.0 1.76 2,400 4224 4224 NONE PROPOSED 0 - - - - -$ 0 0 0 0 0 0 0
29 High School 000 111 1X4 Fixtures/1-T8 Lamps/Electronic Ballasts 1 25.4 0.03 2,400 61 12.19$ NONE PROPOSED 1 25.4 0.03 2,400 61 61 NONE PROPOSED 0 - - - - -$ 0 0 0 0 0 0 0
30 High School 000 112 2X4 Troffers/3-T8 Lamps/Electronic Ballasts 20 1760.0 1.76 2,400 4,224 844.80$ NONE PROPOSED 20 1760.0 1.76 2,400 4224 4224 NONE PROPOSED 0 - - - - -$ 0 0 0 0 0 0 0
31 High School 010 113 2X4 Troffers/3-T8 Lamps/Electronic Ballasts 20 1760.0 1.76 2,400 4,224 844.80$ NONE PROPOSED 20 1760.0 1.76 2,400 4224 4224 NONE PROPOSED 0 - - - - -$ 0 0 0 0 0 0 0
32 High School 010 113 2X2 Troffers/2-T8 Lamps/Electronic Ballasts 3 165.0 0.17 2,400 396 79.20$ NONE PROPOSED 3 165.0 0.17 2,400 396 396 NONE PROPOSED 0 - - - - -$ 0 0 0 0 0 0 0
33 High School 010 113 1X4 Fixtures/1-T8 Lamps/Electronic Ballasts 1 25.4 0.03 2,400 61 12.19$ NONE PROPOSED 1 25.4 0.03 2,400 61 61 NONE PROPOSED 0 - - - - -$ 0 0 0 0 0 0 0
34 High School 010 115 2X4 Troffers/2-T8 Lamps/Electronic Ballasts 12 608.4 0.61 2,400 1,460 292.03$ NONE PROPOSED 12 608.4 0.61 2,400 1460 1460 NONE PROPOSED 0 - - - - -$ 0 0 0 0 0 0 0
35 High School 010 117 2X4 Troffers/2-T8 Lamps/Electronic Ballasts 12 608.4 0.61 2,400 1,460 292.03$ NONE PROPOSED 12 608.4 0.61 2,400 1460 1460 NONE PROPOSED 0 - - - - -$ 0 0 0 0 0 0 0
36 High School 010 119 2X4 Troffers/2-T8 Lamps/Electronic Ballasts 6 304.2 0.30 2,400 730 146.02$ NONE PROPOSED 6 304.2 0.30 2,400 730 730 NONE PROPOSED 0 - - - - -$ 0 0 0 0 0 0 0
37 High School 010 121 2X4 Troffers/2-T8 Lamps/Electronic Ballasts 6 304.2 0.30 2,400 730 146.02$ NONE PROPOSED 6 304.2 0.30 2,400 730 730 NONE PROPOSED 0 - - - - -$ 0 0 0 0 0 0 0
38 High School 010 122 2X4 Troffers/3-T8 Lamps/Electronic Ballasts 12 1056.0 1.06 2,400 2,534 506.88$ NONE PROPOSED 12 1056.0 1.06 2,400 2534 2534 NONE PROPOSED 0 - - - - -$ 0 0 0 0 0 0 0
39 High School 010 123 2X4 Troffers/3-T8 Lamps/Electronic Ballasts 9 792.0 0.79 2,400 1,901 380.16$ NONE PROPOSED 9 792.0 0.79 2,400 1901 1901 NONE PROPOSED 0 - - - - -$ 0 0 0 0 0 0 0
40 High School 010 124 2X4 Troffers/3-T8 Lamps/Electronic Ballasts 12 1056.0 1.06 2,400 2,534 506.88$ NONE PROPOSED 12 1056.0 1.06 2,400 2534 2534 NONE PROPOSED 0 - - - - -$ 0 0 0 0 0 0 0
41 High School 010 120B 2X4 Troffers/3-T8 Lamps/Electronic Ballasts 5 440.0 0.44 2,400 1,056 211.20$ NONE PROPOSED 5 440.0 0.44 2,400 1056 1056 NONE PROPOSED 0 - - - - -$ 0 0 0 0 0 0 0
42 High School 010 A/V Office 2X4 Troffers/3-T8 Lamps/Electronic Ballasts 2 176.0 0.18 2,400 422 84.48$ NONE PROPOSED 2 176.0 0.18 2,400 422 422 NONE PROPOSED 0 - - - - -$ 0 0 0 0 0 0 0
43 High School 010 A-1 1X4 Fixtures/2-T8 Lamps/Electronic Ballasts 35 1774.5 1.77 2,400 4,259 851.76$ NONE PROPOSED 35 1774.5 1.77 2,400 4259 4259 NONE PROPOSED 0 - - - - -$ 0 0 0 0 0 0 0
1

ATTACHMENT A
Lighting Spreadsheets
Seq. # Building Floor # Location/Room # Existing Fixture/Lamp & Ballast Description Exist. Qty
of Fixtures Exist. Watts Exist. kW Base
Oper. Hrs. Exist. kWh Annual Cost of
Energy Existing Proposed Replacement SolutionProp. Qty
of Fixtures
Prop. Watts Prop. kW Base
Prop. Oper. Hrs. w/ Sensors
Prop. kWh w/o Sensors
Prop. kWh w/ Sensors Proposed Occupancy Sensor Sensor Qtys
Total kWh Saved Lighting
Only
kWh Saved Sensors Only
Total kW Saved
Total kWh Saved
Energy Cost Savings
Ballast/Fixture/Reflector Bulb Labor OS Cost OS Labor Subtotal Total
44 High School 010 A-1 150W Incandescent Fixture 1 150.0 0.15 2,400 360 72.00$ Replace 150W Incandescent Fixture with 25W CFL 1 25.0 0.03 2,400 60 60 NONE PROPOSED 0 300 - 0.13 300 60.00$ 0 7 20 0 0 27 27
45 High School 010 A11 2X4 Troffers/3-T8 Lamps/Electronic Ballasts 15 1320.0 1.32 2,400 3,168 633.60$ NONE PROPOSED 15 1320.0 1.32 2,400 3168 3168 NONE PROPOSED 0 - - - - -$ 0 0 0 0 0 0 0
46 High School 010 A11 2X4 Troffers/2-T8 Lamps/Electronic Ballasts 3 152.1 0.15 2,400 365 73.01$ NONE PROPOSED 3 152.1 0.15 2,400 365 365 NONE PROPOSED 0 - - - - -$ 0 0 0 0 0 0 0
47 High School 010 A11 2X2 Troffers/2-T8 Lamps/Electronic Ballasts 1 55.0 0.06 2,400 132 26.40$ NONE PROPOSED 1 55.0 0.06 2,400 132 132 NONE PROPOSED 0 - - - - -$ 0 0 0 0 0 0 0
48 High School 010 A12 2X4 Troffers/3-T8 Lamps/Electronic Ballasts 15 1320.0 1.32 2,400 3,168 633.60$ NONE PROPOSED 15 1320.0 1.32 2,400 3168 3168 NONE PROPOSED 0 - - - - -$ 0 0 0 0 0 0 0
49 High School 010 A13 2X4 Troffers/3-T8 Lamps/Electronic Ballasts 23 2024.0 2.02 2,400 4,858 971.52$ NONE PROPOSED 23 2024.0 2.02 2,400 4858 4858 NONE PROPOSED 0 - - - - -$ 0 0 0 0 0 0 0
50 High School 010 A3 2X4 Troffers/2-T8 Lamps/Electronic Ballasts 28 1419.6 1.42 2,400 3,407 681.41$ NONE PROPOSED 28 1419.6 1.42 2,400 3407 3407 NONE PROPOSED 0 - - - - -$ 0 0 0 0 0 0 0
51 High School 010 A5 2X4 Troffers/3-T8 Lamps/Electronic Ballasts 6 528.0 0.53 2,400 1,267 253.44$ NONE PROPOSED 6 528.0 0.53 2,400 1267 1267 NONE PROPOSED 0 - - - - -$ 0 0 0 0 0 0 0
52 High School 010 A6 2X4 Troffers/3-T8 Lamps/Electronic Ballasts 6 528.0 0.53 2,400 1,267 253.44$ NONE PROPOSED 6 528.0 0.53 2,400 1267 1267 NONE PROPOSED 0 - - - - -$ 0 0 0 0 0 0 0
53 High School 010 A7 2X4 Troffers/4-T8 Lamps/Electronic Ballasts 24 2688.0 2.69 2,400 6,451 1,290.24$ NONE PROPOSED 24 2688.0 2.69 2,400 6451 6451 NONE PROPOSED 0 - - - - -$ 0 0 0 0 0 0 0
54 High School 010 A8 2X4 Troffers/2-T8 Lamps/Electronic Ballasts 18 912.6 0.91 2,400 2,190 438.05$ NONE PROPOSED 18 912.6 0.91 2,400 2190 2190 NONE PROPOSED 0 - - - - -$ 0 0 0 0 0 0 0
55 High School 010 A9 2X4 Troffers/2-T8 Lamps/Electronic Ballasts 11 557.7 0.56 2,400 1,338 267.70$ NONE PROPOSED 11 557.7 0.56 2,400 1338 1338 NONE PROPOSED 0 - - - - -$ 0 0 0 0 0 0 0
56 High School 010 A9 2X4 Troffers/3-T8 Lamps/Electronic Ballasts 5 440.0 0.44 2,400 1,056 211.20$ NONE PROPOSED 5 440.0 0.44 2,400 1056 1056 NONE PROPOSED 0 - - - - -$ 0 0 0 0 0 0 0
57 High School 010 A9 40W Incandescent Fixture 2 80.0 0.08 2,400 192 38.40$ Replace 40W Incandescent Fixture with 13W CFL 2 26.0 0.03 2,400 62 62 NONE PROPOSED 0 130 - 0.05 130 25.92$ 0 5 20 0 0 25 50
58 High School 010 Auditorium 500W Quartz Halogen Recessed Downlights 4 2000.0 2.00 2,400 4,800 960.00$ NONE PROPOSED 4 2000.0 2.00 2,400 4800 4800 NONE PROPOSED 0 - - - - -$ 0 0 0 0 0 0 0
59 High School 010 Auditorium 42W CFL 24 1008.0 1.01 2,400 2,419 483.84$ NONE PROPOSED 24 1008.0 1.01 2,400 2419 2419 NONE PROPOSED 0 - - - - -$ 0 0 0 0 0 0 0
60 High School 010 Auditorium 150W Incandescent Fixture 2 300.0 0.30 2,400 720 144.00$ Replace 150W Incandescent Fixture with 25W CFL 2 50.0 0.05 2,400 120 120 NONE PROPOSED 0 600 - 0.25 600 120.00$ 0 7 20 0 0 27 54
61 High School 010 Auditorium (Backstage) 400W Metal Halide Fixtures 15 6870.0 6.87 2,400 16,488 3,297.60$ Replace Metal Halide Fixtures with 6-Lamp Fluorescent Highbay Fixtures 15 3390.0 3.39 2,400 8136 8136 NONE PROPOSED 0 8,352 - 3.48 8,352 1,670.40$ 168 105 15 0 0 288 4320
62 High School 010 Aux Gym 400W Metal Halide Fixtures 12 5496.0 5.50 2,400 13,190 2,638.08$ Replace Metal Halide Fixtures with 6-Lamp Fluorescent Highbay Fixtures 12 2712.0 2.71 2,400 6509 6509 NONE PROPOSED 0 6,682 - 2.78 6,682 1,336.32$ 168 105 15 0 0 288 3456
63 High School 010 AYO 2X4 Troffers/2-T8 Lamps/Electronic Ballasts 17 861.9 0.86 2,400 2,069 413.71$ NONE PROPOSED 17 861.9 0.86 2,400 2069 2069 NONE PROPOSED 0 - - - - -$ 0 0 0 0 0 0 0
64 High School 010 Boiler Room 1X4 Fixtures/2-T8 Lamps/Electronic Ballasts 14 709.8 0.71 2,400 1,704 340.70$ NONE PROPOSED 14 709.8 0.71 2,400 1704 1704 NONE PROPOSED 0 - - - - -$ 0 0 0 0 0 0 0
65 High School 010 Boiler Room 2X4 Troffers/2-T8 Lamps/Electronic Ballasts 5 253.5 0.25 2,400 608 121.68$ NONE PROPOSED 5 253.5 0.25 2,400 608 608 NONE PROPOSED 0 - - - - -$ 0 0 0 0 0 0 0
66 High School 010 Btwn 106/108 2X2 Troffers/2-T8 Lamps/Electronic Ballasts 2 110.0 0.11 2,400 264 52.80$ NONE PROPOSED 2 110.0 0.11 2,400 264 264 NONE PROPOSED 0 - - - - -$ 0 0 0 0 0 0 0
67 High School 010 Café 1X4 Fixtures/2-T8 Lamps/Electronic Ballasts 150 7605.0 7.61 2,400 18,252 3,650.40$ NONE PROPOSED 150 7605.0 7.61 2,400 18252 18252 NONE PROPOSED 0 - - - - -$ 0 0 0 0 0 0 0
68 High School 010 Café 150W Incandescent Fixture 4 600.0 0.60 2,400 1,440 288.00$ Replace 150W Incandescent Fixture with 25W CFL 4 100.0 0.10 2,400 240 240 NONE PROPOSED 0 1,200 - 0.50 1,200 240.00$ 0 7 20 0 0 27 108
69 High School 010 Child Study 2X2 Troffers/2-T8 Lamps/Electronic Ballasts 36 1980.0 1.98 2,400 4,752 950.40$ NONE PROPOSED 36 1980.0 1.98 2,400 4752 4752 NONE PROPOSED 0 - - - - -$ 0 0 0 0 0 0 0
70 High School 010 Drama 2X4 Troffers/2-T8 Lamps/Electronic Ballasts 24 1216.8 1.22 2,400 2,920 584.06$ NONE PROPOSED 24 1216.8 1.22 2,400 2920 2920 NONE PROPOSED 0 - - - - -$ 0 0 0 0 0 0 0
71 High School 010 Electric Room 1X4 Fixtures/2-T8 Lamps/Electronic Ballasts 1 50.7 0.05 2,400 122 24.34$ NONE PROPOSED 1 50.7 0.05 2,400 122 122 NONE PROPOSED 0 - - - - -$ 0 0 0 0 0 0 0
72 High School 010 Facilities Work Room 2X2 Troffers/2-T8 Lamps/Electronic Ballasts 4 220.0 0.22 2,400 528 105.60$ NONE PROPOSED 4 220.0 0.22 2,400 528 528 NONE PROPOSED 0 - - - - -$ 0 0 0 0 0 0 0
73 High School 010 Facilities Work Room 40W Incandescent Fixture 2 80.0 0.08 2,400 192 38.40$ Replace 40W Incandescent Fixture with 13W CFL 2 26.0 0.03 2,400 62 62 NONE PROPOSED 0 130 - 0.05 130 25.92$ 0 5 20 0 0 25 50
74 High School 010 First Floor Hallway 2X2 Troffers/2-T8 Lamps/Electronic Ballasts 192 10560.0 10.56 2,400 25,344 5,068.80$ NONE PROPOSED 192 10560.0 10.56 2,400 25344 25344 NONE PROPOSED 0 - - - - -$ 0 0 0 0 0 0 0
75 High School 010 First Floor Hallway 1X4 Fixtures/2-T8 Lamps/Electronic Ballasts 4 202.8 0.20 2,400 487 97.34$ NONE PROPOSED 4 202.8 0.20 2,400 487 487 NONE PROPOSED 0 - - - - -$ 0 0 0 0 0 0 0
76 High School 010 First Floor Hallway 1X4 Fixtures/2-T8 Lamps/Electronic Ballasts 18 912.6 0.91 2,400 2,190 438.05$ NONE PROPOSED 18 912.6 0.91 2,400 2190 2190 NONE PROPOSED 0 - - - - -$ 0 0 0 0 0 0 0
77 High School 010 First Floor Hallway 2X4 Troffers/2-T8 Lamps/Electronic Ballasts 12 608.4 0.61 2,400 1,460 292.03$ NONE PROPOSED 12 608.4 0.61 2,400 1460 1460 NONE PROPOSED 0 - - - - -$ 0 0 0 0 0 0 0
78 High School 010 First Floor Hallway 42W CFL 80 3360.0 3.36 2,400 8,064 1,612.80$ NONE PROPOSED 80 3360.0 3.36 2,400 8064 8064 NONE PROPOSED 0 - - - - -$ 0 0 0 0 0 0 0
79 High School 010 Guidance 2X4 Troffers/3-T8 Lamps/Electronic Ballasts 31 2728.0 2.73 2,400 6,547 1,309.44$ NONE PROPOSED 31 2728.0 2.73 2,400 6547 6547 NONE PROPOSED 0 - - - - -$ 0 0 0 0 0 0 0
80 High School 010 Gym 400W Metal Halide Fixtures 28 12824.0 12.82 2,400 30,778 6,155.52$ Replace Metal Halide Fixtures with 6-Lamp Fluorescent Highbay Fixtures 28 6328.0 6.33 2,400 15187 15187 NONE PROPOSED 0 15,590 - 6.50 15,590 3,118.08$ 168 105 15 0 0 288 8064
81 High School 010 Health Room 2X4 Troffers/4-T8 Lamps/Electronic Ballasts 16 1792.0 1.79 2,400 4,301 860.16$ NONE PROPOSED 16 1792.0 1.79 2,400 4301 4301 NONE PROPOSED 0 - - - - -$ 0 0 0 0 0 0 0
82 High School 010 Janitor's Closet 42W CFL 1 42.0 0.04 500 21 4.20$ NONE PROPOSED 1 42.0 0.04 325 21 14 Automatic Wall Switch Occupancy Sensor 1 - 7.35 - 7 1.47$ 0 0 0 103 73.5 0 0
83 High School 010 Janitor's Closet 40W Incandescent Fixture 1 40.0 0.04 500 20 4.00$ Replace 40W Incandescent Fixture with 13W CFL 1 13.0 0.01 325 7 4 Automatic Wall Switch Occupancy Sensor 1 14 2.28 0.03 16 3.16$ 0 5 20 103 73.5 25 25
84 High School 010 Janitor's Closet 2X4 Troffers/2-T8 Lamps/Electronic Ballasts 1 50.7 0.05 500 25 5.07$ NONE PROPOSED 1 50.7 0.05 325 25 16 Automatic Wall Switch Occupancy Sensor 1 - 8.87 - 9 1.77$ 0 0 0 103 73.5 0 0
85 High School 010 Kitchen 2X4 Troffers/2-T8 Lamps/Electronic Ballasts 31 1571.7 1.57 2,400 3,772 754.42$ NONE PROPOSED 31 1571.7 1.57 2,400 3772 3772 NONE PROPOSED 0 - - - - -$ 0 0 0 0 0 0 0
86 High School 010 Kitchen 2X4 Troffers/2-T8 Lamps/Electronic Ballasts 3 152.1 0.15 2,400 365 73.01$ NONE PROPOSED 3 152.1 0.15 2,400 365 365 NONE PROPOSED 0 - - - - -$ 0 0 0 0 0 0 0
2

ATTACHMENT A
Lighting Spreadsheets
Seq. # Building Floor # Location/Room # Existing Fixture/Lamp & Ballast Description Exist. Qty
of Fixtures Exist. Watts Exist. kW Base
Oper. Hrs. Exist. kWh Annual Cost of
Energy Existing Proposed Replacement SolutionProp. Qty
of Fixtures
Prop. Watts Prop. kW Base
Prop. Oper. Hrs. w/ Sensors
Prop. kWh w/o Sensors
Prop. kWh w/ Sensors Proposed Occupancy Sensor Sensor Qtys
Total kWh Saved Lighting
Only
kWh Saved Sensors Only
Total kW Saved
Total kWh Saved
Energy Cost Savings
Ballast/Fixture/Reflector Bulb Labor OS Cost OS Labor Subtotal Total
87 High School 010 Kitchen 2X2 Troffers/2-T8 Lamps/Electronic Ballasts 2 110.0 0.11 2,400 264 52.80$ NONE PROPOSED 2 110.0 0.11 2,400 264 264 NONE PROPOSED 0 - - - - -$ 0 0 0 0 0 0 0
88 High School 010 Library 1X4 Suspended Fixtures/2-T8 Lamps/Electronic Ballasts 57 2889.9 2.89 2,400 6,936 1,387.15$ NONE PROPOSED 57 2889.9 2.89 2,400 6936 6936 NONE PROPOSED 0 - - - - -$ 0 0 0 0 0 0 0
89 High School 010 Library 2X4 Troffers/3-T8 Lamps/Electronic Ballasts 2 176.0 0.18 2,400 422 84.48$ NONE PROPOSED 2 176.0 0.18 2,400 422 422 NONE PROPOSED 0 - - - - -$ 0 0 0 0 0 0 0
90 High School 010 Library 2X2 Troffers/2-T8 Lamps/Electronic Ballasts 1 55.0 0.06 2,400 132 26.40$ NONE PROPOSED 1 55.0 0.06 2,400 132 132 NONE PROPOSED 0 - - - - -$ 0 0 0 0 0 0 0
91 High School 010 Library 2X4 Troffers/2-T8 Lamps/Electronic Ballasts 2 101.4 0.10 2,400 243 48.67$ NONE PROPOSED 2 101.4 0.10 2,400 243 243 NONE PROPOSED 0 - - - - -$ 0 0 0 0 0 0 0
92 High School 010 Library 150W Incandescent Fixture 4 600.0 0.60 2,400 1,440 288.00$ Replace 150W Incandescent Fixture with 25W CFL 4 100.0 0.10 2,400 240 240 NONE PROPOSED 0 1,200 - 0.50 1,200 240.00$ 0 7 20 0 0 27 108
93 High School 010 Main Office 2X4 Troffers/3-T8 Lamps/Electronic Ballasts 41 3608.0 3.61 2,400 8,659 1,731.84$ NONE PROPOSED 41 3608.0 3.61 2,400 8659 8659 NONE PROPOSED 0 - - - - -$ 0 0 0 0 0 0 0
94 High School 010 Main Office 1X4 Fixtures/2-T8 Lamps/Electronic Ballasts 12 608.4 0.61 2,400 1,460 292.03$ NONE PROPOSED 12 608.4 0.61 2,400 1460 1460 NONE PROPOSED 0 - - - - -$ 0 0 0 0 0 0 0
95 High School 010 Main Office 40W Incandescent Fixture 3 120.0 0.12 2,400 288 57.60$ Replace 40W Incandescent Fixture with 13W CFL 3 39.0 0.04 2,400 94 94 NONE PROPOSED 0 194 - 0.08 194 38.88$ 0 5 20 0 0 25 75
96 High School 010 Main Office 2X2 Troffers/2-T8 Lamps/Electronic Ballasts 1 55.0 0.06 2,400 132 26.40$ NONE PROPOSED 1 55.0 0.06 2,400 132 132 NONE PROPOSED 0 - - - - -$ 0 0 0 0 0 0 0
97 High School 010 Men's Bathroom 2X2 Troffers/2-T8 Lamps/Electronic Ballasts 3 165.0 0.17 2,400 396 79.20$ NONE PROPOSED 3 165.0 0.17 2,400 396 396 NONE PROPOSED 0 - - - - -$ 0 0 0 0 0 0 0
98 High School 010 Men's Bathroom 2X4 Troffers/4-T8 Lamps/Electronic Ballasts 1 112.0 0.11 2,400 269 53.76$ NONE PROPOSED 1 112.0 0.11 2,400 269 269 NONE PROPOSED 0 - - - - -$ 0 0 0 0 0 0 0
99 High School 010 Men's Bathroom 2X2 Troffers/2-T8 Lamps/Electronic Ballasts 1 55.0 0.06 2,400 132 26.40$ NONE PROPOSED 1 55.0 0.06 2,400 132 132 NONE PROPOSED 0 - - - - -$ 0 0 0 0 0 0 0
100 High School 010 Men's Bathroom 2X2 Troffers/2-T8 Lamps/Electronic Ballasts 7 385.0 0.39 2,400 924 184.80$ NONE PROPOSED 7 385.0 0.39 2,400 924 924 NONE PROPOSED 0 - - - - -$ 0 0 0 0 0 0 0
101 High School 010 Men's Bathroom 2X4 Troffers/3-T8 Lamps/Electronic Ballasts 2 176.0 0.18 2,400 422 84.48$ NONE PROPOSED 2 176.0 0.18 2,400 422 422 NONE PROPOSED 0 - - - - -$ 0 0 0 0 0 0 0
102 High School 010 Men's Facility Bathroom 2X4 Troffers/2-T8 Lamps/Electronic Ballasts 1 50.7 0.05 2,400 122 24.34$ NONE PROPOSED 1 50.7 0.05 2,400 122 122 NONE PROPOSED 0 - - - - -$ 0 0 0 0 0 0 0
103 High School 010 Men's Facility Bathroom 2X2 Troffers/2-T8 Lamps/Electronic Ballasts 1 55.0 0.06 2,400 132 26.40$ NONE PROPOSED 1 55.0 0.06 2,400 132 132 NONE PROPOSED 0 - - - - -$ 0 0 0 0 0 0 0
104 High School 010 Men's Locker Room 1X4 Fixtures/2-T8 Lamps/Electronic Ballasts 19 963.3 0.96 2,400 2,312 462.38$ NONE PROPOSED 19 963.3 0.96 2,400 2312 2312 NONE PROPOSED 0 - - - - -$ 0 0 0 0 0 0 0
105 High School 010 Men's Locker Room 42W CFL 1 42.0 0.04 2,400 101 20.16$ NONE PROPOSED 1 42.0 0.04 2,400 101 101 NONE PROPOSED 0 - - - - -$ 0 0 0 0 0 0 0
106 High School 010 Men's Locker Room 40W Incandescent Fixture 3 120.0 0.12 2,400 288 57.60$ Replace 40W Incandescent Fixture with 13W CFL 3 39.0 0.04 2,400 94 94 NONE PROPOSED 0 194 - 0.08 194 38.88$ 0 5 20 0 0 25 75
107 High School 010 Men's Locker Room 2X2 Troffers/2-T8 Lamps/Electronic Ballasts 1 55.0 0.06 2,400 132 26.40$ NONE PROPOSED 1 55.0 0.06 2,400 132 132 NONE PROPOSED 0 - - - - -$ 0 0 0 0 0 0 0
108 High School 010 Men's Locker Room Office 2X2 Troffers/2-T8 Lamps/Electronic Ballasts 3 165.0 0.17 2,400 396 79.20$ NONE PROPOSED 3 165.0 0.17 2,400 396 396 NONE PROPOSED 0 - - - - -$ 0 0 0 0 0 0 0
109 High School 010 Men's Locker Room Office 40W Incandescent Fixture 1 40.0 0.04 2,400 96 19.20$ Replace 40W Incandescent Fixture with 13W CFL 1 13.0 0.01 2,400 31 31 NONE PROPOSED 0 65 - 0.03 65 12.96$ 0 5 20 0 0 25 25
110 High School 010 Music 2X4 Troffers/3-T8 Lamps/Electronic Ballasts 8 704.0 0.70 2,400 1,690 337.92$ NONE PROPOSED 8 704.0 0.70 2,400 1690 1690 NONE PROPOSED 0 - - - - -$ 0 0 0 0 0 0 0
111 High School 010 Music 2X4 Troffers/2-T8 Lamps/Electronic Ballasts 43 2180.1 2.18 2,400 5,232 1,046.45$ NONE PROPOSED 43 2180.1 2.18 2,400 5232 5232 NONE PROPOSED 0 - - - - -$ 0 0 0 0 0 0 0
112 High School 010 Music 1X4 Fixtures/2-T8 Lamps/Electronic Ballasts 42 2129.4 2.13 2,400 5,111 1,022.11$ NONE PROPOSED 42 2129.4 2.13 2,400 5111 5111 NONE PROPOSED 0 - - - - -$ 0 0 0 0 0 0 0
113 High School 010 Music Room 2X4 Troffers/3-T8 Lamps/Electronic Ballasts 37 3256.0 3.26 2,400 7,814 1,562.88$ NONE PROPOSED 37 3256.0 3.26 2,400 7814 7814 NONE PROPOSED 0 - - - - -$ 0 0 0 0 0 0 0
114 High School 010 Music Room 2X4 Troffers/2-T8 Lamps/Electronic Ballasts 6 304.2 0.30 2,400 730 146.02$ NONE PROPOSED 6 304.2 0.30 2,400 730 730 NONE PROPOSED 0 - - - - -$ 0 0 0 0 0 0 0
115 High School 010 Music Room 1X4 Fixtures/2-T8 Lamps/Electronic Ballasts 14 709.8 0.71 2,400 1,704 340.70$ NONE PROPOSED 14 709.8 0.71 2,400 1704 1704 NONE PROPOSED 0 - - - - -$ 0 0 0 0 0 0 0
116 High School 010 Nurse 2X4 Troffers/2-T8 Lamps/Electronic Ballasts 11 557.7 0.56 2,400 1,338 267.70$ NONE PROPOSED 11 557.7 0.56 2,400 1338 1338 NONE PROPOSED 0 - - - - -$ 0 0 0 0 0 0 0
117 High School 010 Nurse 40W Incandescent Fixture 1 40.0 0.04 2,400 96 19.20$ Replace 40W Incandescent Fixture with 13W CFL 1 13.0 0.01 2,400 31 31 NONE PROPOSED 0 65 - 0.03 65 12.96$ 0 5 20 0 0 25 25
118 High School 010 Physical Education 2X4 Troffers/2-T8 Lamps/Electronic Ballasts 2 101.4 0.10 2,400 243 48.67$ NONE PROPOSED 2 101.4 0.10 2,400 243 243 NONE PROPOSED 0 - - - - -$ 0 0 0 0 0 0 0
119 High School 010 Shop 150W Incandescent Fixture 3 450.0 0.45 2,400 1,080 216.00$ Replace 150W Incandescent Fixture with 25W CFL 3 75.0 0.08 2,400 180 180 NONE PROPOSED 0 900 - 0.38 900 180.00$ 0 7 20 0 0 27 81
120 High School 010 Shop 1X4 Fixtures/2-T8 Lamps/Electronic Ballasts 34 1723.8 1.72 2,400 4,137 827.42$ NONE PROPOSED 34 1723.8 1.72 2,400 4137 4137 NONE PROPOSED 0 - - - - -$ 0 0 0 0 0 0 0
121 High School 010 Shop 40W Incandescent Fixture 1 40.0 0.04 2,400 96 19.20$ Replace 40W Incandescent Fixture with 13W CFL 1 13.0 0.01 2,400 31 31 NONE PROPOSED 0 65 - 0.03 65 12.96$ 0 5 20 0 0 25 25
122 High School 010 Shop 2X4 Troffers/2-T8 Lamps/Electronic Ballasts 4 202.8 0.20 2,400 487 97.34$ NONE PROPOSED 4 202.8 0.20 2,400 487 487 NONE PROPOSED 0 - - - - -$ 0 0 0 0 0 0 0
123 High School 010 Shop 42W CFL 1 42.0 0.04 2,400 101 20.16$ NONE PROPOSED 1 42.0 0.04 2,400 101 101 NONE PROPOSED 0 - - - - -$ 0 0 0 0 0 0 0
124 High School 010 Storage 2X4 Troffers/4-T8 Lamps/Electronic Ballasts 2 224.0 0.22 500 112 22.40$ NONE PROPOSED 2 224.0 0.22 325 112 73 Automatic Wall Switch Occupancy Sensor 1 - 39.20 - 39 7.84$ 0 0 0 103 73.5 0 0
125 High School 010 Storage 1X4 Fixtures/2-T8 Lamps/Electronic Ballasts 6 304.2 0.30 500 152 30.42$ NONE PROPOSED 6 304.2 0.30 325 152 99 Automatic Wall Switch Occupancy Sensor 1 - 53.24 - 53 10.65$ 0 0 0 103 73.5 0 0
126 High School 010 Storage 1X4 Fixtures/1-T8 Lamps/Electronic Ballasts 1 25.4 0.03 500 13 2.54$ NONE PROPOSED 1 25.4 0.03 325 13 8 Automatic Wall Switch Occupancy Sensor 1 - 4.45 - 4 0.89$ 0 0 0 103 73.5 0 0
127 High School 010 Storage 42W CFL 1 42.0 0.04 500 21 4.20$ NONE PROPOSED 1 42.0 0.04 325 21 14 Automatic Wall Switch Occupancy Sensor 1 - 7.35 - 7 1.47$ 0 0 0 103 73.5 0 0
128 High School 010 Storage 1X4 Suspended Fixtures/2-T8 Lamps/Electronic Ballasts 6 304.2 0.30 500 152 30.42$ NONE PROPOSED 6 304.2 0.30 325 152 99 Automatic Wall Switch Occupancy Sensor 1 - 53.24 - 53 10.65$ 0 0 0 103 73.5 0 0
129 High School 010 Storage 2X4 Troffers/3-T8 Lamps/Electronic Ballasts 6 528.0 0.53 500 264 52.80$ NONE PROPOSED 6 528.0 0.53 325 264 172 Automatic Wall Switch Occupancy Sensor 1 - 92.40 - 92 18.48$ 0 0 0 103 73.5 0 0
3
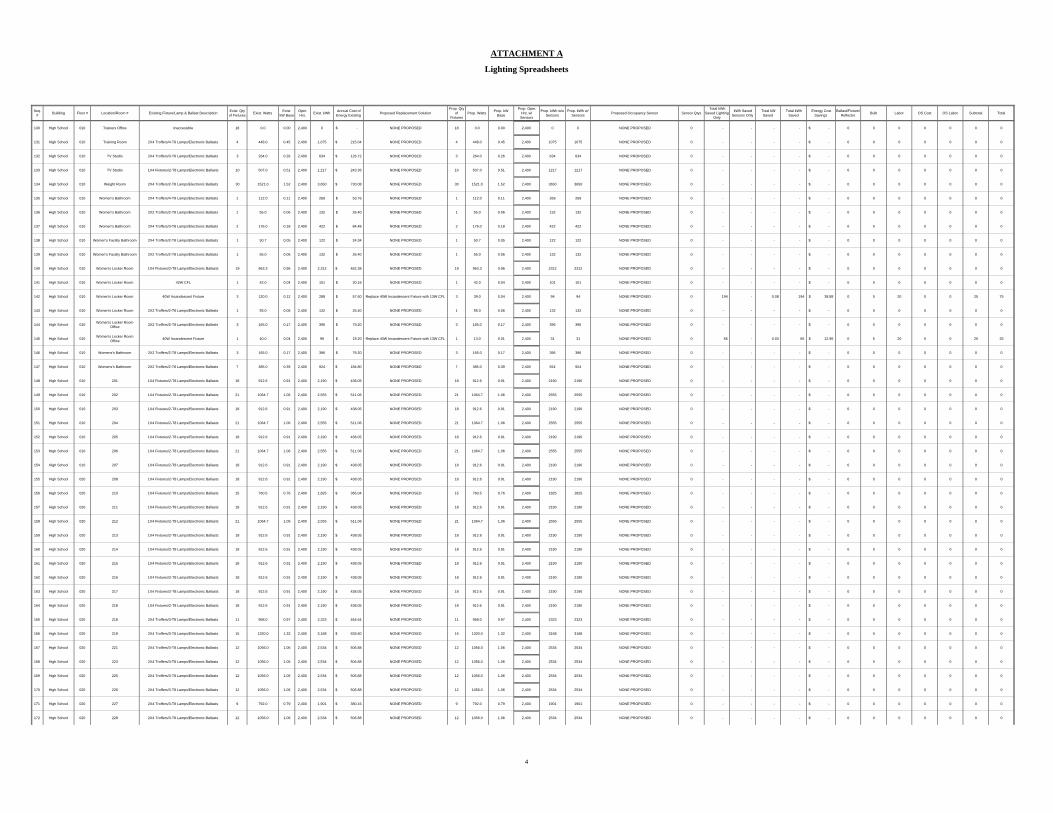
ATTACHMENT A
Lighting Spreadsheets
Seq. # Building Floor # Location/Room # Existing Fixture/Lamp & Ballast Description Exist. Qty
of Fixtures Exist. Watts Exist. kW Base
Oper. Hrs. Exist. kWh Annual Cost of
Energy Existing Proposed Replacement SolutionProp. Qty
of Fixtures
Prop. Watts Prop. kW Base
Prop. Oper. Hrs. w/ Sensors
Prop. kWh w/o Sensors
Prop. kWh w/ Sensors Proposed Occupancy Sensor Sensor Qtys
Total kWh Saved Lighting
Only
kWh Saved Sensors Only
Total kW Saved
Total kWh Saved
Energy Cost Savings
Ballast/Fixture/Reflector Bulb Labor OS Cost OS Labor Subtotal Total
130 High School 010 Trainers Office Inaccessible 18 0.0 0.00 2,400 0 -$ NONE PROPOSED 18 0.0 0.00 2,400 0 0 NONE PROPOSED 0 - - - - -$ 0 0 0 0 0 0 0
131 High School 010 Training Room 2X4 Troffers/4-T8 Lamps/Electronic Ballasts 4 448.0 0.45 2,400 1,075 215.04$ NONE PROPOSED 4 448.0 0.45 2,400 1075 1075 NONE PROPOSED 0 - - - - -$ 0 0 0 0 0 0 0
132 High School 010 TV Studio 2X4 Troffers/3-T8 Lamps/Electronic Ballasts 3 264.0 0.26 2,400 634 126.72$ NONE PROPOSED 3 264.0 0.26 2,400 634 634 NONE PROPOSED 0 - - - - -$ 0 0 0 0 0 0 0
133 High School 010 TV Studio 1X4 Fixtures/2-T8 Lamps/Electronic Ballasts 10 507.0 0.51 2,400 1,217 243.36$ NONE PROPOSED 10 507.0 0.51 2,400 1217 1217 NONE PROPOSED 0 - - - - -$ 0 0 0 0 0 0 0
134 High School 010 Weight Room 2X4 Troffers/2-T8 Lamps/Electronic Ballasts 30 1521.0 1.52 2,400 3,650 730.08$ NONE PROPOSED 30 1521.0 1.52 2,400 3650 3650 NONE PROPOSED 0 - - - - -$ 0 0 0 0 0 0 0
135 High School 010 Women's Bathroom 2X4 Troffers/4-T8 Lamps/Electronic Ballasts 1 112.0 0.11 2,400 269 53.76$ NONE PROPOSED 1 112.0 0.11 2,400 269 269 NONE PROPOSED 0 - - - - -$ 0 0 0 0 0 0 0
136 High School 010 Women's Bathroom 2X2 Troffers/2-T8 Lamps/Electronic Ballasts 1 55.0 0.06 2,400 132 26.40$ NONE PROPOSED 1 55.0 0.06 2,400 132 132 NONE PROPOSED 0 - - - - -$ 0 0 0 0 0 0 0
137 High School 010 Women's Bathroom 2X4 Troffers/3-T8 Lamps/Electronic Ballasts 2 176.0 0.18 2,400 422 84.48$ NONE PROPOSED 2 176.0 0.18 2,400 422 422 NONE PROPOSED 0 - - - - -$ 0 0 0 0 0 0 0
138 High School 010 Women's Facility Bathroom 2X4 Troffers/2-T8 Lamps/Electronic Ballasts 1 50.7 0.05 2,400 122 24.34$ NONE PROPOSED 1 50.7 0.05 2,400 122 122 NONE PROPOSED 0 - - - - -$ 0 0 0 0 0 0 0
139 High School 010 Women's Facility Bathroom 2X2 Troffers/2-T8 Lamps/Electronic Ballasts 1 55.0 0.06 2,400 132 26.40$ NONE PROPOSED 1 55.0 0.06 2,400 132 132 NONE PROPOSED 0 - - - - -$ 0 0 0 0 0 0 0
140 High School 010 Women's Locker Room 1X4 Fixtures/2-T8 Lamps/Electronic Ballasts 19 963.3 0.96 2,400 2,312 462.38$ NONE PROPOSED 19 963.3 0.96 2,400 2312 2312 NONE PROPOSED 0 - - - - -$ 0 0 0 0 0 0 0
141 High School 010 Women's Locker Room 42W CFL 1 42.0 0.04 2,400 101 20.16$ NONE PROPOSED 1 42.0 0.04 2,400 101 101 NONE PROPOSED 0 - - - - -$ 0 0 0 0 0 0 0
142 High School 010 Women's Locker Room 40W Incandescent Fixture 3 120.0 0.12 2,400 288 57.60$ Replace 40W Incandescent Fixture with 13W CFL 3 39.0 0.04 2,400 94 94 NONE PROPOSED 0 194 - 0.08 194 38.88$ 0 5 20 0 0 25 75
143 High School 010 Women's Locker Room 2X2 Troffers/2-T8 Lamps/Electronic Ballasts 1 55.0 0.06 2,400 132 26.40$ NONE PROPOSED 1 55.0 0.06 2,400 132 132 NONE PROPOSED 0 - - - - -$ 0 0 0 0 0 0 0
144 High School 010 Women's Locker Room Office 2X2 Troffers/2-T8 Lamps/Electronic Ballasts 3 165.0 0.17 2,400 396 79.20$ NONE PROPOSED 3 165.0 0.17 2,400 396 396 NONE PROPOSED 0 - - - - -$ 0 0 0 0 0 0 0
145 High School 010 Women's Locker Room Office 40W Incandescent Fixture 1 40.0 0.04 2,400 96 19.20$ Replace 40W Incandescent Fixture with 13W CFL 1 13.0 0.01 2,400 31 31 NONE PROPOSED 0 65 - 0.03 65 12.96$ 0 5 20 0 0 25 25
146 High School 010 Womens's Bathroom 2X2 Troffers/2-T8 Lamps/Electronic Ballasts 3 165.0 0.17 2,400 396 79.20$ NONE PROPOSED 3 165.0 0.17 2,400 396 396 NONE PROPOSED 0 - - - - -$ 0 0 0 0 0 0 0
147 High School 010 Womens's Bathroom 2X2 Troffers/2-T8 Lamps/Electronic Ballasts 7 385.0 0.39 2,400 924 184.80$ NONE PROPOSED 7 385.0 0.39 2,400 924 924 NONE PROPOSED 0 - - - - -$ 0 0 0 0 0 0 0
148 High School 010 201 1X4 Fixtures/2-T8 Lamps/Electronic Ballasts 18 912.6 0.91 2,400 2,190 438.05$ NONE PROPOSED 18 912.6 0.91 2,400 2190 2190 NONE PROPOSED 0 - - - - -$ 0 0 0 0 0 0 0
149 High School 010 202 1X4 Fixtures/2-T8 Lamps/Electronic Ballasts 21 1064.7 1.06 2,400 2,555 511.06$ NONE PROPOSED 21 1064.7 1.06 2,400 2555 2555 NONE PROPOSED 0 - - - - -$ 0 0 0 0 0 0 0
150 High School 010 203 1X4 Fixtures/2-T8 Lamps/Electronic Ballasts 18 912.6 0.91 2,400 2,190 438.05$ NONE PROPOSED 18 912.6 0.91 2,400 2190 2190 NONE PROPOSED 0 - - - - -$ 0 0 0 0 0 0 0
151 High School 010 204 1X4 Fixtures/2-T8 Lamps/Electronic Ballasts 21 1064.7 1.06 2,400 2,555 511.06$ NONE PROPOSED 21 1064.7 1.06 2,400 2555 2555 NONE PROPOSED 0 - - - - -$ 0 0 0 0 0 0 0
152 High School 010 205 1X4 Fixtures/2-T8 Lamps/Electronic Ballasts 18 912.6 0.91 2,400 2,190 438.05$ NONE PROPOSED 18 912.6 0.91 2,400 2190 2190 NONE PROPOSED 0 - - - - -$ 0 0 0 0 0 0 0
153 High School 010 206 1X4 Fixtures/2-T8 Lamps/Electronic Ballasts 21 1064.7 1.06 2,400 2,555 511.06$ NONE PROPOSED 21 1064.7 1.06 2,400 2555 2555 NONE PROPOSED 0 - - - - -$ 0 0 0 0 0 0 0
154 High School 010 207 1X4 Fixtures/2-T8 Lamps/Electronic Ballasts 18 912.6 0.91 2,400 2,190 438.05$ NONE PROPOSED 18 912.6 0.91 2,400 2190 2190 NONE PROPOSED 0 - - - - -$ 0 0 0 0 0 0 0
155 High School 020 208 1X4 Fixtures/2-T8 Lamps/Electronic Ballasts 18 912.6 0.91 2,400 2,190 438.05$ NONE PROPOSED 18 912.6 0.91 2,400 2190 2190 NONE PROPOSED 0 - - - - -$ 0 0 0 0 0 0 0
156 High School 020 210 1X4 Fixtures/2-T8 Lamps/Electronic Ballasts 15 760.5 0.76 2,400 1,825 365.04$ NONE PROPOSED 15 760.5 0.76 2,400 1825 1825 NONE PROPOSED 0 - - - - -$ 0 0 0 0 0 0 0
157 High School 020 211 1X4 Fixtures/2-T8 Lamps/Electronic Ballasts 18 912.6 0.91 2,400 2,190 438.05$ NONE PROPOSED 18 912.6 0.91 2,400 2190 2190 NONE PROPOSED 0 - - - - -$ 0 0 0 0 0 0 0
158 High School 020 212 1X4 Fixtures/2-T8 Lamps/Electronic Ballasts 21 1064.7 1.06 2,400 2,555 511.06$ NONE PROPOSED 21 1064.7 1.06 2,400 2555 2555 NONE PROPOSED 0 - - - - -$ 0 0 0 0 0 0 0
159 High School 020 213 1X4 Fixtures/2-T8 Lamps/Electronic Ballasts 18 912.6 0.91 2,400 2,190 438.05$ NONE PROPOSED 18 912.6 0.91 2,400 2190 2190 NONE PROPOSED 0 - - - - -$ 0 0 0 0 0 0 0
160 High School 020 214 1X4 Fixtures/2-T8 Lamps/Electronic Ballasts 18 912.6 0.91 2,400 2,190 438.05$ NONE PROPOSED 18 912.6 0.91 2,400 2190 2190 NONE PROPOSED 0 - - - - -$ 0 0 0 0 0 0 0
161 High School 020 215 1X4 Fixtures/2-T8 Lamps/Electronic Ballasts 18 912.6 0.91 2,400 2,190 438.05$ NONE PROPOSED 18 912.6 0.91 2,400 2190 2190 NONE PROPOSED 0 - - - - -$ 0 0 0 0 0 0 0
162 High School 020 216 1X4 Fixtures/2-T8 Lamps/Electronic Ballasts 18 912.6 0.91 2,400 2,190 438.05$ NONE PROPOSED 18 912.6 0.91 2,400 2190 2190 NONE PROPOSED 0 - - - - -$ 0 0 0 0 0 0 0
163 High School 020 217 1X4 Fixtures/2-T8 Lamps/Electronic Ballasts 18 912.6 0.91 2,400 2,190 438.05$ NONE PROPOSED 18 912.6 0.91 2,400 2190 2190 NONE PROPOSED 0 - - - - -$ 0 0 0 0 0 0 0
164 High School 020 218 1X4 Fixtures/2-T8 Lamps/Electronic Ballasts 18 912.6 0.91 2,400 2,190 438.05$ NONE PROPOSED 18 912.6 0.91 2,400 2190 2190 NONE PROPOSED 0 - - - - -$ 0 0 0 0 0 0 0
165 High School 020 218 2X4 Troffers/3-T8 Lamps/Electronic Ballasts 11 968.0 0.97 2,400 2,323 464.64$ NONE PROPOSED 11 968.0 0.97 2,400 2323 2323 NONE PROPOSED 0 - - - - -$ 0 0 0 0 0 0 0
166 High School 020 219 2X4 Troffers/3-T8 Lamps/Electronic Ballasts 15 1320.0 1.32 2,400 3,168 633.60$ NONE PROPOSED 15 1320.0 1.32 2,400 3168 3168 NONE PROPOSED 0 - - - - -$ 0 0 0 0 0 0 0
167 High School 020 221 2X4 Troffers/3-T8 Lamps/Electronic Ballasts 12 1056.0 1.06 2,400 2,534 506.88$ NONE PROPOSED 12 1056.0 1.06 2,400 2534 2534 NONE PROPOSED 0 - - - - -$ 0 0 0 0 0 0 0
168 High School 020 223 2X4 Troffers/3-T8 Lamps/Electronic Ballasts 12 1056.0 1.06 2,400 2,534 506.88$ NONE PROPOSED 12 1056.0 1.06 2,400 2534 2534 NONE PROPOSED 0 - - - - -$ 0 0 0 0 0 0 0
169 High School 020 225 2X4 Troffers/3-T8 Lamps/Electronic Ballasts 12 1056.0 1.06 2,400 2,534 506.88$ NONE PROPOSED 12 1056.0 1.06 2,400 2534 2534 NONE PROPOSED 0 - - - - -$ 0 0 0 0 0 0 0
170 High School 020 226 2X4 Troffers/3-T8 Lamps/Electronic Ballasts 12 1056.0 1.06 2,400 2,534 506.88$ NONE PROPOSED 12 1056.0 1.06 2,400 2534 2534 NONE PROPOSED 0 - - - - -$ 0 0 0 0 0 0 0
171 High School 020 227 2X4 Troffers/3-T8 Lamps/Electronic Ballasts 9 792.0 0.79 2,400 1,901 380.16$ NONE PROPOSED 9 792.0 0.79 2,400 1901 1901 NONE PROPOSED 0 - - - - -$ 0 0 0 0 0 0 0
172 High School 020 228 2X4 Troffers/3-T8 Lamps/Electronic Ballasts 12 1056.0 1.06 2,400 2,534 506.88$ NONE PROPOSED 12 1056.0 1.06 2,400 2534 2534 NONE PROPOSED 0 - - - - -$ 0 0 0 0 0 0 0
4
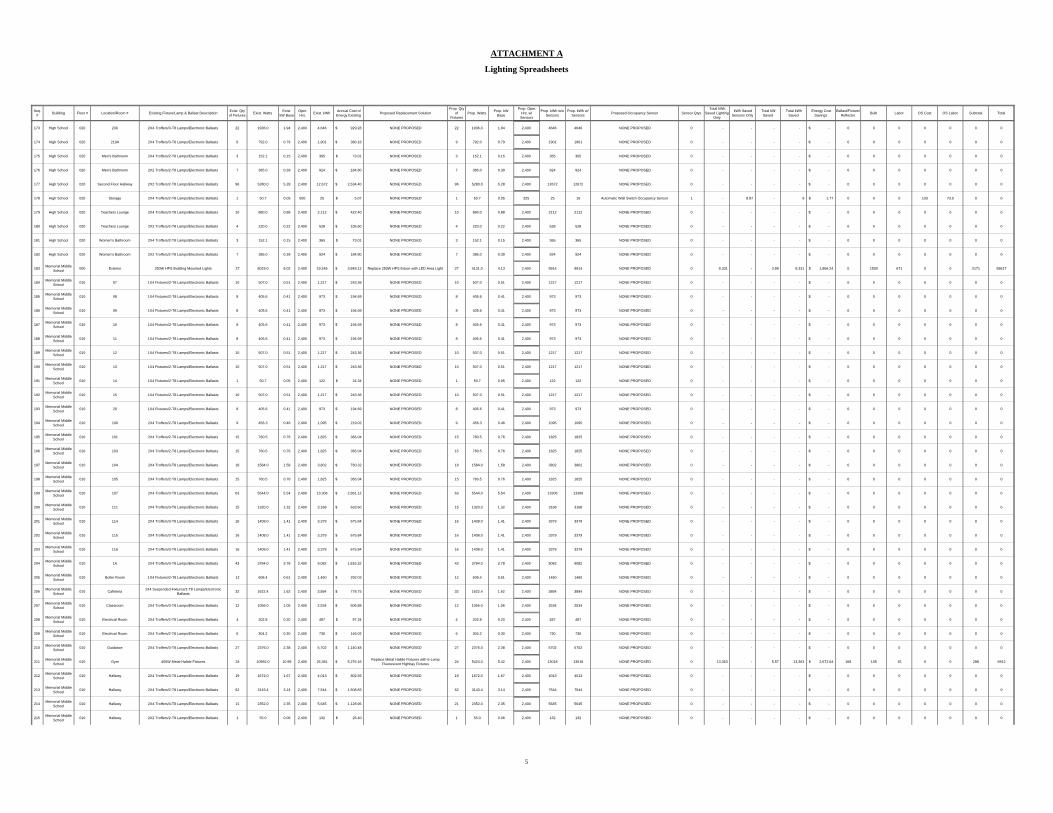
ATTACHMENT A
Lighting Spreadsheets
Seq. # Building Floor # Location/Room # Existing Fixture/Lamp & Ballast Description Exist. Qty
of Fixtures Exist. Watts Exist. kW Base
Oper. Hrs. Exist. kWh Annual Cost of
Energy Existing Proposed Replacement SolutionProp. Qty
of Fixtures
Prop. Watts Prop. kW Base
Prop. Oper. Hrs. w/ Sensors
Prop. kWh w/o Sensors
Prop. kWh w/ Sensors Proposed Occupancy Sensor Sensor Qtys
Total kWh Saved Lighting
Only
kWh Saved Sensors Only
Total kW Saved
Total kWh Saved
Energy Cost Savings
Ballast/Fixture/Reflector Bulb Labor OS Cost OS Labor Subtotal Total
173 High School 020 230 2X4 Troffers/3-T8 Lamps/Electronic Ballasts 22 1936.0 1.94 2,400 4,646 929.28$ NONE PROPOSED 22 1936.0 1.94 2,400 4646 4646 NONE PROPOSED 0 - - - - -$ 0 0 0 0 0 0 0
174 High School 020 219A 2X4 Troffers/3-T8 Lamps/Electronic Ballasts 9 792.0 0.79 2,400 1,901 380.16$ NONE PROPOSED 9 792.0 0.79 2,400 1901 1901 NONE PROPOSED 0 - - - - -$ 0 0 0 0 0 0 0
175 High School 020 Men's Bathroom 2X4 Troffers/2-T8 Lamps/Electronic Ballasts 3 152.1 0.15 2,400 365 73.01$ NONE PROPOSED 3 152.1 0.15 2,400 365 365 NONE PROPOSED 0 - - - - -$ 0 0 0 0 0 0 0
176 High School 020 Men's Bathroom 2X2 Troffers/2-T8 Lamps/Electronic Ballasts 7 385.0 0.39 2,400 924 184.80$ NONE PROPOSED 7 385.0 0.39 2,400 924 924 NONE PROPOSED 0 - - - - -$ 0 0 0 0 0 0 0
177 High School 020 Second Floor Hallway 2X2 Troffers/2-T8 Lamps/Electronic Ballasts 96 5280.0 5.28 2,400 12,672 2,534.40$ NONE PROPOSED 96 5280.0 5.28 2,400 12672 12672 NONE PROPOSED 0 - - - - -$ 0 0 0 0 0 0 0
178 High School 020 Storage 2X4 Troffers/2-T8 Lamps/Electronic Ballasts 1 50.7 0.05 500 25 5.07$ NONE PROPOSED 1 50.7 0.05 325 25 16 Automatic Wall Switch Occupancy Sensor 1 - 8.87 - 9 1.77$ 0 0 0 103 73.5 0 0
179 High School 020 Teachers Lounge 2X4 Troffers/3-T8 Lamps/Electronic Ballasts 10 880.0 0.88 2,400 2,112 422.40$ NONE PROPOSED 10 880.0 0.88 2,400 2112 2112 NONE PROPOSED 0 - - - - -$ 0 0 0 0 0 0 0
180 High School 020 Teachers Lounge 2X2 Troffers/2-T8 Lamps/Electronic Ballasts 4 220.0 0.22 2,400 528 105.60$ NONE PROPOSED 4 220.0 0.22 2,400 528 528 NONE PROPOSED 0 - - - - -$ 0 0 0 0 0 0 0
181 High School 020 Women's Bathroom 2X4 Troffers/2-T8 Lamps/Electronic Ballasts 3 152.1 0.15 2,400 365 73.01$ NONE PROPOSED 3 152.1 0.15 2,400 365 365 NONE PROPOSED 0 - - - - -$ 0 0 0 0 0 0 0
182 High School 020 Women's Bathroom 2X2 Troffers/2-T8 Lamps/Electronic Ballasts 7 385.0 0.39 2,400 924 184.80$ NONE PROPOSED 7 385.0 0.39 2,400 924 924 NONE PROPOSED 0 - - - - -$ 0 0 0 0 0 0 0
183 Memorial Middle School 000 Exterior 250W HPS Building Mounted Lights 27 8019.0 8.02 2,400 19,246 3,849.12$ Replace 250W HPS fixture with LED Area Light 27 4131.0 4.13 2,400 9914 9914 NONE PROPOSED 0 9,331 - 3.89 9,331 1,866.24$ 0 1500 671 0 0 2171 58617
184 Memorial Middle School 010 07 1X4 Fixtures/2-T8 Lamps/Electronic Ballasts 10 507.0 0.51 2,400 1,217 243.36$ NONE PROPOSED 10 507.0 0.51 2,400 1217 1217 NONE PROPOSED 0 - - - - -$ 0 0 0 0 0 0 0
185 Memorial Middle School 010 08 1X4 Fixtures/2-T8 Lamps/Electronic Ballasts 8 405.6 0.41 2,400 973 194.69$ NONE PROPOSED 8 405.6 0.41 2,400 973 973 NONE PROPOSED 0 - - - - -$ 0 0 0 0 0 0 0
186 Memorial Middle School 010 09 1X4 Fixtures/2-T8 Lamps/Electronic Ballasts 8 405.6 0.41 2,400 973 194.69$ NONE PROPOSED 8 405.6 0.41 2,400 973 973 NONE PROPOSED 0 - - - - -$ 0 0 0 0 0 0 0
187 Memorial Middle School 010 10 1X4 Fixtures/2-T8 Lamps/Electronic Ballasts 8 405.6 0.41 2,400 973 194.69$ NONE PROPOSED 8 405.6 0.41 2,400 973 973 NONE PROPOSED 0 - - - - -$ 0 0 0 0 0 0 0
188 Memorial Middle School 010 11 1X4 Fixtures/2-T8 Lamps/Electronic Ballasts 8 405.6 0.41 2,400 973 194.69$ NONE PROPOSED 8 405.6 0.41 2,400 973 973 NONE PROPOSED 0 - - - - -$ 0 0 0 0 0 0 0
189 Memorial Middle School 010 12 1X4 Fixtures/2-T8 Lamps/Electronic Ballasts 10 507.0 0.51 2,400 1,217 243.36$ NONE PROPOSED 10 507.0 0.51 2,400 1217 1217 NONE PROPOSED 0 - - - - -$ 0 0 0 0 0 0 0
190 Memorial Middle School 010 13 1X4 Fixtures/2-T8 Lamps/Electronic Ballasts 10 507.0 0.51 2,400 1,217 243.36$ NONE PROPOSED 10 507.0 0.51 2,400 1217 1217 NONE PROPOSED 0 - - - - -$ 0 0 0 0 0 0 0
191 Memorial Middle School 010 14 1X4 Fixtures/2-T8 Lamps/Electronic Ballasts 1 50.7 0.05 2,400 122 24.34$ NONE PROPOSED 1 50.7 0.05 2,400 122 122 NONE PROPOSED 0 - - - - -$ 0 0 0 0 0 0 0
192 Memorial Middle School 010 15 1X4 Fixtures/2-T8 Lamps/Electronic Ballasts 10 507.0 0.51 2,400 1,217 243.36$ NONE PROPOSED 10 507.0 0.51 2,400 1217 1217 NONE PROPOSED 0 - - - - -$ 0 0 0 0 0 0 0
193 Memorial Middle School 010 20 1X4 Fixtures/2-T8 Lamps/Electronic Ballasts 8 405.6 0.41 2,400 973 194.69$ NONE PROPOSED 8 405.6 0.41 2,400 973 973 NONE PROPOSED 0 - - - - -$ 0 0 0 0 0 0 0
194 Memorial Middle School 010 100 2X4 Troffers/2-T8 Lamps/Electronic Ballasts 9 456.3 0.46 2,400 1,095 219.02$ NONE PROPOSED 9 456.3 0.46 2,400 1095 1095 NONE PROPOSED 0 - - - - -$ 0 0 0 0 0 0 0
195 Memorial Middle School 010 101 2X4 Troffers/2-T8 Lamps/Electronic Ballasts 15 760.5 0.76 2,400 1,825 365.04$ NONE PROPOSED 15 760.5 0.76 2,400 1825 1825 NONE PROPOSED 0 - - - - -$ 0 0 0 0 0 0 0
196 Memorial Middle School 010 103 2X4 Troffers/2-T8 Lamps/Electronic Ballasts 15 760.5 0.76 2,400 1,825 365.04$ NONE PROPOSED 15 760.5 0.76 2,400 1825 1825 NONE PROPOSED 0 - - - - -$ 0 0 0 0 0 0 0
197 Memorial Middle School 010 104 2X4 Troffers/3-T8 Lamps/Electronic Ballasts 18 1584.0 1.58 2,400 3,802 760.32$ NONE PROPOSED 18 1584.0 1.58 2,400 3802 3802 NONE PROPOSED 0 - - - - -$ 0 0 0 0 0 0 0
198 Memorial Middle School 010 105 2X4 Troffers/2-T8 Lamps/Electronic Ballasts 15 760.5 0.76 2,400 1,825 365.04$ NONE PROPOSED 15 760.5 0.76 2,400 1825 1825 NONE PROPOSED 0 - - - - -$ 0 0 0 0 0 0 0
199 Memorial Middle School 010 107 2X4 Troffers/3-T8 Lamps/Electronic Ballasts 63 5544.0 5.54 2,400 13,306 2,661.12$ NONE PROPOSED 63 5544.0 5.54 2,400 13306 13306 NONE PROPOSED 0 - - - - -$ 0 0 0 0 0 0 0
200 Memorial Middle School 010 111 2X4 Troffers/3-T8 Lamps/Electronic Ballasts 15 1320.0 1.32 2,400 3,168 633.60$ NONE PROPOSED 15 1320.0 1.32 2,400 3168 3168 NONE PROPOSED 0 - - - - -$ 0 0 0 0 0 0 0
201 Memorial Middle School 010 114 2X4 Troffers/3-T8 Lamps/Electronic Ballasts 16 1408.0 1.41 2,400 3,379 675.84$ NONE PROPOSED 16 1408.0 1.41 2,400 3379 3379 NONE PROPOSED 0 - - - - -$ 0 0 0 0 0 0 0
202 Memorial Middle School 010 115 2X4 Troffers/3-T8 Lamps/Electronic Ballasts 16 1408.0 1.41 2,400 3,379 675.84$ NONE PROPOSED 16 1408.0 1.41 2,400 3379 3379 NONE PROPOSED 0 - - - - -$ 0 0 0 0 0 0 0
203 Memorial Middle School 010 116 2X4 Troffers/3-T8 Lamps/Electronic Ballasts 16 1408.0 1.41 2,400 3,379 675.84$ NONE PROPOSED 16 1408.0 1.41 2,400 3379 3379 NONE PROPOSED 0 - - - - -$ 0 0 0 0 0 0 0
204 Memorial Middle School 010 1A 2X4 Troffers/3-T8 Lamps/Electronic Ballasts 43 3784.0 3.78 2,400 9,082 1,816.32$ NONE PROPOSED 43 3784.0 3.78 2,400 9082 9082 NONE PROPOSED 0 - - - - -$ 0 0 0 0 0 0 0
205 Memorial Middle School 010 Boiler Room 1X4 Fixtures/2-T8 Lamps/Electronic Ballasts 12 608.4 0.61 2,400 1,460 292.03$ NONE PROPOSED 12 608.4 0.61 2,400 1460 1460 NONE PROPOSED 0 - - - - -$ 0 0 0 0 0 0 0
206 Memorial Middle School 010 Cafeteria 1X4 Suspended Fixtures/2-T8 Lamps/Electronic
Ballasts 32 1622.4 1.62 2,400 3,894 778.75$ NONE PROPOSED 32 1622.4 1.62 2,400 3894 3894 NONE PROPOSED 0 - - - - -$ 0 0 0 0 0 0 0
207 Memorial Middle School 010 Classroom 2X4 Troffers/3-T8 Lamps/Electronic Ballasts 12 1056.0 1.06 2,400 2,534 506.88$ NONE PROPOSED 12 1056.0 1.06 2,400 2534 2534 NONE PROPOSED 0 - - - - -$ 0 0 0 0 0 0 0
208 Memorial Middle School 010 Electrical Room 2X4 Troffers/2-T8 Lamps/Electronic Ballasts 4 202.8 0.20 2,400 487 97.34$ NONE PROPOSED 4 202.8 0.20 2,400 487 487 NONE PROPOSED 0 - - - - -$ 0 0 0 0 0 0 0
209 Memorial Middle School 010 Electrical Room 2X4 Troffers/2-T8 Lamps/Electronic Ballasts 6 304.2 0.30 2,400 730 146.02$ NONE PROPOSED 6 304.2 0.30 2,400 730 730 NONE PROPOSED 0 - - - - -$ 0 0 0 0 0 0 0
210 Memorial Middle School 010 Guidance 2X4 Troffers/3-T8 Lamps/Electronic Ballasts 27 2376.0 2.38 2,400 5,702 1,140.48$ NONE PROPOSED 27 2376.0 2.38 2,400 5702 5702 NONE PROPOSED 0 - - - - -$ 0 0 0 0 0 0 0
211 Memorial Middle School 010 Gym 400W Metal Halide Fixtures 24 10992.0 10.99 2,400 26,381 5,276.16$ Replace Metal Halide Fixtures with 6-Lamp
Fluorescent Highbay Fixtures 24 5424.0 5.42 2,400 13018 13018 NONE PROPOSED 0 13,363 - 5.57 13,363 2,672.64$ 168 105 15 0 0 288 6912
212 Memorial Middle School 010 Hallway 2X4 Troffers/3-T8 Lamps/Electronic Ballasts 19 1672.0 1.67 2,400 4,013 802.56$ NONE PROPOSED 19 1672.0 1.67 2,400 4013 4013 NONE PROPOSED 0 - - - - -$ 0 0 0 0 0 0 0
213 Memorial Middle School 010 Hallway 2X4 Troffers/2-T8 Lamps/Electronic Ballasts 62 3143.4 3.14 2,400 7,544 1,508.83$ NONE PROPOSED 62 3143.4 3.14 2,400 7544 7544 NONE PROPOSED 0 - - - - -$ 0 0 0 0 0 0 0
214 Memorial Middle School 010 Hallway 2X4 Troffers/4-T8 Lamps/Electronic Ballasts 21 2352.0 2.35 2,400 5,645 1,128.96$ NONE PROPOSED 21 2352.0 2.35 2,400 5645 5645 NONE PROPOSED 0 - - - - -$ 0 0 0 0 0 0 0
215 Memorial Middle School 010 Hallway 2X2 Troffers/2-T8 Lamps/Electronic Ballasts 1 55.0 0.06 2,400 132 26.40$ NONE PROPOSED 1 55.0 0.06 2,400 132 132 NONE PROPOSED 0 - - - - -$ 0 0 0 0 0 0 0
5

ATTACHMENT A
Lighting Spreadsheets
Seq. # Building Floor # Location/Room # Existing Fixture/Lamp & Ballast Description Exist. Qty
of Fixtures Exist. Watts Exist. kW Base
Oper. Hrs. Exist. kWh Annual Cost of
Energy Existing Proposed Replacement SolutionProp. Qty
of Fixtures
Prop. Watts Prop. kW Base
Prop. Oper. Hrs. w/ Sensors
Prop. kWh w/o Sensors
Prop. kWh w/ Sensors Proposed Occupancy Sensor Sensor Qtys
Total kWh Saved Lighting
Only
kWh Saved Sensors Only
Total kW Saved
Total kWh Saved
Energy Cost Savings
Ballast/Fixture/Reflector Bulb Labor OS Cost OS Labor Subtotal Total
216 Memorial Middle School 010 Library 1X4 Fixtures/2-T8 Lamps/Electronic Ballasts 61 3092.7 3.09 2,400 7,422 1,484.50$ NONE PROPOSED 61 3092.7 3.09 2,400 7422 7422 NONE PROPOSED 0 - - - - -$ 0 0 0 0 0 0 0
217 Memorial Middle School 010 Library 2X4 Troffers/3-T8 Lamps/Electronic Ballasts 11 968.0 0.97 2,400 2,323 464.64$ NONE PROPOSED 11 968.0 0.97 2,400 2323 2323 NONE PROPOSED 0 - - - - -$ 0 0 0 0 0 0 0
218 Memorial Middle School 010 Main Office 2X4 Troffers/4-T8 Lamps/Electronic Ballasts 21 2352.0 2.35 2,400 5,645 1,128.96$ NONE PROPOSED 21 2352.0 2.35 2,400 5645 5645 NONE PROPOSED 0 - - - - -$ 0 0 0 0 0 0 0
219 Memorial Middle School 010 Men's Bathroom 1X4 Fixtures/1-T8 Lamps/Electronic Ballasts 2 50.8 0.05 2,400 122 24.38$ NONE PROPOSED 2 50.8 0.05 2,400 122 122 NONE PROPOSED 0 - - - - -$ 0 0 0 0 0 0 0
220 Memorial Middle School 010 Men's Bathroom 2X4 Troffers/3-T8 Lamps/Electronic Ballasts 1 88.0 0.09 2,400 211 42.24$ NONE PROPOSED 1 88.0 0.09 2,400 211 211 NONE PROPOSED 0 - - - - -$ 0 0 0 0 0 0 0
221 Memorial Middle School 010 Men's Bathroom 2' 17W Fluorescent Fixture 1 15.0 0.02 2,400 36 7.20$ NONE PROPOSED 1 15.0 0.02 2,400 36 36 NONE PROPOSED 0 - - - - -$ 0 0 0 0 0 0 0
222 Memorial Middle School 010 Men's Bathroom 2X4 Troffers/3-T8 Lamps/Electronic Ballasts 5 440.0 0.44 2,400 1,056 211.20$ NONE PROPOSED 5 440.0 0.44 2,400 1056 1056 NONE PROPOSED 0 - - - - -$ 0 0 0 0 0 0 0
223 Memorial Middle School 010 Men's Locker Room 1X4 Fixtures/2-T8 Lamps/Electronic Ballasts 18 912.6 0.91 2,400 2,190 438.05$ NONE PROPOSED 18 912.6 0.91 2,400 2190 2190 NONE PROPOSED 0 - - - - -$ 0 0 0 0 0 0 0
224 Memorial Middle School 010 Men's Locker Room 2X4 Troffers/3-T8 Lamps/Electronic Ballasts 2 176.0 0.18 2,400 422 84.48$ NONE PROPOSED 2 176.0 0.18 2,400 422 422 NONE PROPOSED 0 - - - - -$ 0 0 0 0 0 0 0
225 Memorial Middle School 010 Men's Locker Room Unidentifiable 3 0.0 0.00 2,400 0 -$ NONE PROPOSED 3 0.0 0.00 2,400 0 0 NONE PROPOSED 0 - - - - -$ 0 0 0 0 0 0 0
226 Memorial Middle School 010 Music 2X4 Troffers/4-T8 Lamps/Electronic Ballasts 24 2688.0 2.69 2,400 6,451 1,290.24$ NONE PROPOSED 24 2688.0 2.69 2,400 6451 6451 NONE PROPOSED 0 - - - - -$ 0 0 0 0 0 0 0
227 Memorial Middle School 010 Nurse 2X4 Troffers/4-T8 Lamps/Electronic Ballasts 8 896.0 0.90 2,400 2,150 430.08$ NONE PROPOSED 8 896.0 0.90 2,400 2150 2150 NONE PROPOSED 0 - - - - -$ 0 0 0 0 0 0 0
228 Memorial Middle School 010 Nurse 2X4 Troffers/2-T8 Lamps/Electronic Ballasts 1 50.7 0.05 2,400 122 24.34$ NONE PROPOSED 1 50.7 0.05 2,400 122 122 NONE PROPOSED 0 - - - - -$ 0 0 0 0 0 0 0
229 Memorial Middle School 010 Resource Office 2X4 Troffers/4-T8 Lamps/Electronic Ballasts 1 112.0 0.11 2,400 269 53.76$ NONE PROPOSED 1 112.0 0.11 2,400 269 269 NONE PROPOSED 0 - - - - -$ 0 0 0 0 0 0 0
230 Memorial Middle School 010 Restroom 2X4 Troffers/4-T8 Lamps/Electronic Ballasts 1 112.0 0.11 2,400 269 53.76$ NONE PROPOSED 1 112.0 0.11 2,400 269 269 NONE PROPOSED 0 - - - - -$ 0 0 0 0 0 0 0
231 Memorial Middle School 010 Science Lab 3 2X4 Troffers/3-T8 Lamps/Electronic Ballasts 18 1584.0 1.58 2,400 3,802 760.32$ NONE PROPOSED 18 1584.0 1.58 2,400 3802 3802 NONE PROPOSED 0 - - - - -$ 0 0 0 0 0 0 0
232 Memorial Middle School 010 Science Lab 5 2X4 Troffers/3-T8 Lamps/Electronic Ballasts 18 1584.0 1.58 2,400 3,802 760.32$ NONE PROPOSED 18 1584.0 1.58 2,400 3802 3802 NONE PROPOSED 0 - - - - -$ 0 0 0 0 0 0 0
233 Memorial Middle School 010 Science Lab 6 2X4 Troffers/3-T8 Lamps/Electronic Ballasts 12 1056.0 1.06 2,400 2,534 506.88$ NONE PROPOSED 12 1056.0 1.06 2,400 2534 2534 NONE PROPOSED 0 - - - - -$ 0 0 0 0 0 0 0
234 Memorial Middle School 010 Storage 2X4 Troffers/2-T8 Lamps/Electronic Ballasts 4 202.8 0.20 500 101 20.28$ NONE PROPOSED 4 202.8 0.20 325 101 66 Automatic Wall Switch Occupancy Sensor 1 - 35.49 - 35 7.10$ 0 0 0 103 73.5 0 0
235 Memorial Middle School 010 Storage 2X4 Troffers/3-T8 Lamps/Electronic Ballasts 3 264.0 0.26 500 132 26.40$ NONE PROPOSED 3 264.0 0.26 325 132 86 Automatic Wall Switch Occupancy Sensor 1 - 46.20 - 46 9.24$ 0 0 0 103 73.5 0 0
236 Memorial Middle School 010 Storage 2X4 Troffers/2-T8 Lamps/Electronic Ballasts 12 608.4 0.61 500 304 60.84$ NONE PROPOSED 12 608.4 0.61 325 304 198 Automatic Wall Switch Occupancy Sensor 1 - 106.47 - 106 21.29$ 0 0 0 103 73.5 0 0
237 Memorial Middle School 010 Student Assistance Program 2X4 Troffers/3-T8 Lamps/Electronic Ballasts 2 176.0 0.18 2,400 422 84.48$ NONE PROPOSED 2 176.0 0.18 2,400 422 422 NONE PROPOSED 0 - - - - -$ 0 0 0 0 0 0 0
238 Memorial Middle School 010 Unlabeled Room 2X4 Troffers/3-T8 Lamps/Electronic Ballasts 6 528.0 0.53 2,400 1,267 253.44$ NONE PROPOSED 6 528.0 0.53 2,400 1267 1267 NONE PROPOSED 0 - - - - -$ 0 0 0 0 0 0 0
239 Memorial Middle School 010 Women's Bathroom 1X4 Fixtures/1-T8 Lamps/Electronic Ballasts 3 76.2 0.08 2,400 183 36.58$ NONE PROPOSED 3 76.2 0.08 2,400 183 183 NONE PROPOSED 0 - - - - -$ 0 0 0 0 0 0 0
240 Memorial Middle School 010 Women's Bathroom 2' 17W Fluorescent Fixture 1 15.0 0.02 2,400 36 7.20$ NONE PROPOSED 1 15.0 0.02 2,400 36 36 NONE PROPOSED 0 - - - - -$ 0 0 0 0 0 0 0
241 Memorial Middle School 010 Women's Bathroom 2X4 Troffers/3-T8 Lamps/Electronic Ballasts 5 440.0 0.44 2,400 1,056 211.20$ NONE PROPOSED 5 440.0 0.44 2,400 1056 1056 NONE PROPOSED 0 - - - - -$ 0 0 0 0 0 0 0
242 Memorial Middle School 010 Women's Locker Room 1X4 Fixtures/2-T8 Lamps/Electronic Ballasts 18 912.6 0.91 2,400 2,190 438.05$ NONE PROPOSED 18 912.6 0.91 2,400 2190 2190 NONE PROPOSED 0 - - - - -$ 0 0 0 0 0 0 0
243 Memorial Middle School 010 Women's Locker Room 2X4 Troffers/3-T8 Lamps/Electronic Ballasts 2 176.0 0.18 2,400 422 84.48$ NONE PROPOSED 2 176.0 0.18 2,400 422 422 NONE PROPOSED 0 - - - - -$ 0 0 0 0 0 0 0
244 Memorial Middle School 010 Women's Locker Room Unidentifiable 3 0.0 0.00 2,400 0 -$ NONE PROPOSED 3 0.0 0.00 2,400 0 0 NONE PROPOSED 0 - - - - -$ 0 0 0 0 0 0 0
245 Memorial Middle School 010 Womens's Bathroom 2X4 Troffers/3-T8 Lamps/Electronic Ballasts 1 88.0 0.09 2,400 211 42.24$ NONE PROPOSED 1 88.0 0.09 2,400 211 211 NONE PROPOSED 0 - - - - -$ 0 0 0 0 0 0 0
246 Memorial Middle School 010 201 2X4 Troffers/3-T8 Lamps/Electronic Ballasts 15 1320.0 1.32 2,400 3,168 633.60$ NONE PROPOSED 15 1320.0 1.32 2,400 3168 3168 NONE PROPOSED 0 - - - - -$ 0 0 0 0 0 0 0
247 Memorial Middle School 010 202 2X4 Troffers/3-T8 Lamps/Electronic Ballasts 15 1320.0 1.32 2,400 3,168 633.60$ NONE PROPOSED 15 1320.0 1.32 2,400 3168 3168 NONE PROPOSED 0 - - - - -$ 0 0 0 0 0 0 0
248 Memorial Middle School 010 203 2X4 Troffers/3-T8 Lamps/Electronic Ballasts 15 1320.0 1.32 2,400 3,168 633.60$ NONE PROPOSED 15 1320.0 1.32 2,400 3168 3168 NONE PROPOSED 0 - - - - -$ 0 0 0 0 0 0 0
249 Memorial Middle School 010 204 2X4 Troffers/3-T8 Lamps/Electronic Ballasts 15 1320.0 1.32 2,400 3,168 633.60$ NONE PROPOSED 15 1320.0 1.32 2,400 3168 3168 NONE PROPOSED 0 - - - - -$ 0 0 0 0 0 0 0
250 Memorial Middle School 010 206 2X4 Troffers/3-T8 Lamps/Electronic Ballasts 15 1320.0 1.32 2,400 3,168 633.60$ NONE PROPOSED 15 1320.0 1.32 2,400 3168 3168 NONE PROPOSED 0 - - - - -$ 0 0 0 0 0 0 0
251 Memorial Middle School 010 207 2X4 Troffers/3-T8 Lamps/Electronic Ballasts 15 1320.0 1.32 2,400 3,168 633.60$ NONE PROPOSED 15 1320.0 1.32 2,400 3168 3168 NONE PROPOSED 0 - - - - -$ 0 0 0 0 0 0 0
252 Memorial Middle School 010 210 2X4 Troffers/3-T8 Lamps/Electronic Ballasts 20 1760.0 1.76 2,400 4,224 844.80$ NONE PROPOSED 20 1760.0 1.76 2,400 4224 4224 NONE PROPOSED 0 - - - - -$ 0 0 0 0 0 0 0
253 Memorial Middle School 010 211 2X4 Troffers/3-T8 Lamps/Electronic Ballasts 15 1320.0 1.32 2,400 3,168 633.60$ NONE PROPOSED 15 1320.0 1.32 2,400 3168 3168 NONE PROPOSED 0 - - - - -$ 0 0 0 0 0 0 0
254 Memorial Middle School 010 212 2X4 Troffers/3-T8 Lamps/Electronic Ballasts 20 1760.0 1.76 2,400 4,224 844.80$ NONE PROPOSED 20 1760.0 1.76 2,400 4224 4224 NONE PROPOSED 0 - - - - -$ 0 0 0 0 0 0 0
255 Memorial Middle School 010 214 2X4 Troffers/3-T8 Lamps/Electronic Ballasts 16 1408.0 1.41 2,400 3,379 675.84$ NONE PROPOSED 16 1408.0 1.41 2,400 3379 3379 NONE PROPOSED 0 - - - - -$ 0 0 0 0 0 0 0
256 Memorial Middle School 010 215 2X4 Troffers/3-T8 Lamps/Electronic Ballasts 16 1408.0 1.41 2,400 3,379 675.84$ NONE PROPOSED 16 1408.0 1.41 2,400 3379 3379 NONE PROPOSED 0 - - - - -$ 0 0 0 0 0 0 0
257 Memorial Middle School 010 216 2X4 Troffers/3-T8 Lamps/Electronic Ballasts 20 1760.0 1.76 2,400 4,224 844.80$ NONE PROPOSED 20 1760.0 1.76 2,400 4224 4224 NONE PROPOSED 0 - - - - -$ 0 0 0 0 0 0 0
258 Memorial Middle School 010 201A 2X4 Troffers/3-T8 Lamps/Electronic Ballasts 9 792.0 0.79 2,400 1,901 380.16$ NONE PROPOSED 9 792.0 0.79 2,400 1901 1901 NONE PROPOSED 0 - - - - -$ 0 0 0 0 0 0 0
6

ATTACHMENT A
Lighting Spreadsheets
Seq. # Building Floor # Location/Room # Existing Fixture/Lamp & Ballast Description Exist. Qty
of Fixtures Exist. Watts Exist. kW Base
Oper. Hrs. Exist. kWh Annual Cost of
Energy Existing Proposed Replacement SolutionProp. Qty
of Fixtures
Prop. Watts Prop. kW Base
Prop. Oper. Hrs. w/ Sensors
Prop. kWh w/o Sensors
Prop. kWh w/ Sensors Proposed Occupancy Sensor Sensor Qtys
Total kWh Saved Lighting
Only
kWh Saved Sensors Only
Total kW Saved
Total kWh Saved
Energy Cost Savings
Ballast/Fixture/Reflector Bulb Labor OS Cost OS Labor Subtotal Total
259 Memorial Middle School 010 205A 2X4 Troffers/3-T8 Lamps/Electronic Ballasts 15 1320.0 1.32 2,400 3,168 633.60$ NONE PROPOSED 15 1320.0 1.32 2,400 3168 3168 NONE PROPOSED 0 - - - - -$ 0 0 0 0 0 0 0
260 Memorial Middle School 020 Hallway 2X4 Troffers/3-T8 Lamps/Electronic Ballasts 22 1936.0 1.94 2,400 4,646 929.28$ NONE PROPOSED 22 1936.0 1.94 2,400 4646 4646 NONE PROPOSED 0 - - - - -$ 0 0 0 0 0 0 0
261 Memorial Middle School 020 Hallway 2X4 Troffers/2-T8 Lamps/Electronic Ballasts 15 760.5 0.76 2,400 1,825 365.04$ NONE PROPOSED 15 760.5 0.76 2,400 1825 1825 NONE PROPOSED 0 - - - - -$ 0 0 0 0 0 0 0
262 Memorial Middle School 020 Men's Bathroom 2X4 Troffers/3-T8 Lamps/Electronic Ballasts 5 440.0 0.44 2,400 1,056 211.20$ NONE PROPOSED 5 440.0 0.44 2,400 1056 1056 NONE PROPOSED 0 - - - - -$ 0 0 0 0 0 0 0
263 Memorial Middle School 020 Men's Bathroom 1X4 Fixtures/2-T8 Lamps/Electronic Ballasts 5 253.5 0.25 2,400 608 121.68$ NONE PROPOSED 5 253.5 0.25 2,400 608 608 NONE PROPOSED 0 - - - - -$ 0 0 0 0 0 0 0
264 Memorial Middle School 020 Men's Facility Bathroom 2' 17W Fluorescent Fixture 1 15.0 0.02 2,400 36 7.20$ NONE PROPOSED 1 15.0 0.02 2,400 36 36 NONE PROPOSED 0 - - - - -$ 0 0 0 0 0 0 0
265 Memorial Middle School 020 Women's Bathroom 2X4 Troffers/3-T8 Lamps/Electronic Ballasts 5 440.0 0.44 2,400 1,056 211.20$ NONE PROPOSED 5 440.0 0.44 2,400 1056 1056 NONE PROPOSED 0 - - - - -$ 0 0 0 0 0 0 0
266 Memorial Middle School 020 Women's Bathroom 1X4 Fixtures/2-T8 Lamps/Electronic Ballasts 5 253.5 0.25 2,400 608 121.68$ NONE PROPOSED 5 253.5 0.25 2,400 608 608 NONE PROPOSED 0 - - - - -$ 0 0 0 0 0 0 0
267Nellie Bennet Elementary
School000 Exterior 400W HPS Building Mounted Lights 5 2290.0 2.29 2,400 5,496 1,099.20$ Replace 400W HPS fixture with LED Area Light 5 1160.0 1.16 2,400 2784 2784 NONE PROPOSED 0 2,712 - 1.13 2,712 542.40$ 0 2000 671 0 0 2671 13355
268Nellie Bennet Elementary
School000 Exterior 250W HPS Building Mounted Lights 8 2376.0 2.38 2,400 5,702 1,140.48$ Replace 250W HPS fixture with LED Area Light 8 1224.0 1.22 2,400 2938 2938 NONE PROPOSED 0 2,765 - 1.15 2,765 552.96$ 0 1500 671 0 0 2171 17368
269Nellie Bennet Elementary
School000 Exterior 1X4 Fixtures/2-T8 Lamps/Electronic Ballasts 18 912.6 0.91 2,400 2,190 438.05$ NONE PROPOSED 18 912.6 0.91 2,400 2190 2190 NONE PROPOSED 0 - - - - -$ 0 0 0 0 0 0 0
270Nellie Bennet Elementary
School000 Exterior 150W Incandescent Fixture 2 300.0 0.30 2,400 720 144.00$ Replace 150W Incandescent Fixture with 25W CFL 2 50.0 0.05 2,400 120 120 NONE PROPOSED 0 600 - 0.25 600 120.00$ 0 7 20 0 0 27 54
271Nellie Bennet Elementary
School000 101 1X4 Suspended Fixtures/2-T8 Lamps/Electronic
Ballasts 18 912.6 0.91 2,400 2,190 438.05$ NONE PROPOSED 18 912.6 0.91 2,400 2190 2190 NONE PROPOSED 0 - - - - -$ 0 0 0 0 0 0 0
272Nellie Bennet Elementary
School000 102 1X4 Suspended Fixtures/2-T8 Lamps/Electronic
Ballasts 18 912.6 0.91 2,400 2,190 438.05$ NONE PROPOSED 18 912.6 0.91 2,400 2190 2190 NONE PROPOSED 0 - - - - -$ 0 0 0 0 0 0 0
273Nellie Bennet Elementary
School000 102 1X4 Fixtures/2-T8 Lamps/Electronic Ballasts 2 101.4 0.10 2,400 243 48.67$ NONE PROPOSED 2 101.4 0.10 2,400 243 243 NONE PROPOSED 0 - - - - -$ 0 0 0 0 0 0 0
274Nellie Bennet Elementary
School000 103 1X4 Fixtures/2-T8 Lamps/Electronic Ballasts 18 912.6 0.91 2,400 2,190 438.05$ NONE PROPOSED 18 912.6 0.91 2,400 2190 2190 NONE PROPOSED 0 - - - - -$ 0 0 0 0 0 0 0
275Nellie Bennet Elementary
School000 104 1X4 Suspended Fixtures/2-T8 Lamps/Electronic
Ballasts 18 912.6 0.91 2,400 2,190 438.05$ NONE PROPOSED 18 912.6 0.91 2,400 2190 2190 NONE PROPOSED 0 - - - - -$ 0 0 0 0 0 0 0
276Nellie Bennet Elementary
School000 105 1X4 Suspended Fixtures/2-T8 Lamps/Electronic
Ballasts 18 912.6 0.91 2,400 2,190 438.05$ NONE PROPOSED 18 912.6 0.91 2,400 2190 2190 NONE PROPOSED 0 - - - - -$ 0 0 0 0 0 0 0
277Nellie Bennet Elementary
School000 106 1X4 Suspended Fixtures/2-T8 Lamps/Electronic
Ballasts 18 912.6 0.91 2,400 2,190 438.05$ NONE PROPOSED 18 912.6 0.91 2,400 2190 2190 NONE PROPOSED 0 - - - - -$ 0 0 0 0 0 0 0
278Nellie Bennet Elementary
School000 106 1X4 Fixtures/2-T8 Lamps/Electronic Ballasts 2 101.4 0.10 2,400 243 48.67$ NONE PROPOSED 2 101.4 0.10 2,400 243 243 NONE PROPOSED 0 - - - - -$ 0 0 0 0 0 0 0
279Nellie Bennet Elementary
School000 106 2X4 Troffers/4-T8 Lamps/Electronic Ballasts 4 448.0 0.45 2,400 1,075 215.04$ NONE PROPOSED 4 448.0 0.45 2,400 1075 1075 NONE PROPOSED 0 - - - - -$ 0 0 0 0 0 0 0
280Nellie Bennet Elementary
School000 107 1X4 Suspended Fixtures/2-T8 Lamps/Electronic
Ballasts 18 912.6 0.91 2,400 2,190 438.05$ NONE PROPOSED 18 912.6 0.91 2,400 2190 2190 NONE PROPOSED 0 - - - - -$ 0 0 0 0 0 0 0
281Nellie Bennet Elementary
School000 108 1X4 Fixtures/2-T8 Lamps/Electronic Ballasts 18 912.6 0.91 2,400 2,190 438.05$ NONE PROPOSED 18 912.6 0.91 2,400 2190 2190 NONE PROPOSED 0 - - - - -$ 0 0 0 0 0 0 0
282Nellie Bennet Elementary
School000 109 1X4 Fixtures/2-T8 Lamps/Electronic Ballasts 18 912.6 0.91 2,400 2,190 438.05$ NONE PROPOSED 18 912.6 0.91 2,400 2190 2190 NONE PROPOSED 0 - - - - -$ 0 0 0 0 0 0 0
283Nellie Bennet Elementary
School000 110 1X4 Fixtures/2-T8 Lamps/Electronic Ballasts 18 912.6 0.91 2,400 2,190 438.05$ NONE PROPOSED 18 912.6 0.91 2,400 2190 2190 NONE PROPOSED 0 - - - - -$ 0 0 0 0 0 0 0
284Nellie Bennet Elementary
School000 111 1X4 Fixtures/2-T8 Lamps/Electronic Ballasts 18 912.6 0.91 2,400 2,190 438.05$ NONE PROPOSED 18 912.6 0.91 2,400 2190 2190 NONE PROPOSED 0 - - - - -$ 0 0 0 0 0 0 0
285Nellie Bennet Elementary
School000 112 1X4 Fixtures/2-T8 Lamps/Electronic Ballasts 18 912.6 0.91 2,400 2,190 438.05$ NONE PROPOSED 18 912.6 0.91 2,400 2190 2190 NONE PROPOSED 0 - - - - -$ 0 0 0 0 0 0 0
286Nellie Bennet Elementary
School000 113 1X4 Fixtures/2-T8 Lamps/Electronic Ballasts 18 912.6 0.91 2,400 2,190 438.05$ NONE PROPOSED 18 912.6 0.91 2,400 2190 2190 NONE PROPOSED 0 - - - - -$ 0 0 0 0 0 0 0
287Nellie Bennet Elementary
School000 114 1X4 Fixtures/2-T8 Lamps/Electronic Ballasts 18 912.6 0.91 2,400 2,190 438.05$ NONE PROPOSED 18 912.6 0.91 2,400 2190 2190 NONE PROPOSED 0 - - - - -$ 0 0 0 0 0 0 0
288Nellie Bennet Elementary
School000 115 1X4 Fixtures/2-T8 Lamps/Electronic Ballasts 18 912.6 0.91 2,400 2,190 438.05$ NONE PROPOSED 18 912.6 0.91 2,400 2190 2190 NONE PROPOSED 0 - - - - -$ 0 0 0 0 0 0 0
289Nellie Bennet Elementary
School000 116 1X4 Fixtures/2-T8 Lamps/Electronic Ballasts 18 912.6 0.91 2,400 2,190 438.05$ NONE PROPOSED 18 912.6 0.91 2,400 2190 2190 NONE PROPOSED 0 - - - - -$ 0 0 0 0 0 0 0
290Nellie Bennet Elementary
School000 117 1X4 Fixtures/2-T8 Lamps/Electronic Ballasts 18 912.6 0.91 2,400 2,190 438.05$ NONE PROPOSED 18 912.6 0.91 2,400 2190 2190 NONE PROPOSED 0 - - - - -$ 0 0 0 0 0 0 0
291Nellie Bennet Elementary
School000 118 1X4 Fixtures/2-T8 Lamps/Electronic Ballasts 18 912.6 0.91 2,400 2,190 438.05$ NONE PROPOSED 18 912.6 0.91 2,400 2190 2190 NONE PROPOSED 0 - - - - -$ 0 0 0 0 0 0 0
292Nellie Bennet Elementary
School000 119 1X4 Fixtures/2-T8 Lamps/Electronic Ballasts 18 912.6 0.91 2,400 2,190 438.05$ NONE PROPOSED 18 912.6 0.91 2,400 2190 2190 NONE PROPOSED 0 - - - - -$ 0 0 0 0 0 0 0
293Nellie Bennet Elementary
School000 120 1X4 Fixtures/2-T8 Lamps/Electronic Ballasts 18 912.6 0.91 2,400 2,190 438.05$ NONE PROPOSED 18 912.6 0.91 2,400 2190 2190 NONE PROPOSED 0 - - - - -$ 0 0 0 0 0 0 0
294Nellie Bennet Elementary
School000 304 2X4 Troffers/4-T8 Lamps/Electronic Ballasts 15 1680.0 1.68 2,400 4,032 806.40$ NONE PROPOSED 15 1680.0 1.68 2,400 4032 4032 NONE PROPOSED 0 - - - - -$ 0 0 0 0 0 0 0
295Nellie Bennet Elementary
School000 304 2X2 Troffers/2-T8 Lamps/Electronic Ballasts 8 440.0 0.44 2,400 1,056 211.20$ NONE PROPOSED 8 440.0 0.44 2,400 1056 1056 NONE PROPOSED 0 - - - - -$ 0 0 0 0 0 0 0
296Nellie Bennet Elementary
School000 304 2X4 Troffers/2-T8 Lamps/Electronic Ballasts 13 659.1 0.66 2,400 1,582 316.37$ NONE PROPOSED 13 659.1 0.66 2,400 1582 1582 NONE PROPOSED 0 - - - - -$ 0 0 0 0 0 0 0
297Nellie Bennet Elementary
School000 304 1X4 Fixtures/2-T8 Lamps/Electronic Ballasts 2 101.4 0.10 2,400 243 48.67$ NONE PROPOSED 2 101.4 0.10 2,400 243 243 NONE PROPOSED 0 - - - - -$ 0 0 0 0 0 0 0
298Nellie Bennet Elementary
School000 305 2X4 Troffers/4-T8 Lamps/Electronic Ballasts 18 2016.0 2.02 2,400 4,838 967.68$ NONE PROPOSED 18 2016.0 2.02 2,400 4838 4838 NONE PROPOSED 0 - - - - -$ 0 0 0 0 0 0 0
299Nellie Bennet Elementary
School000 306 2X4 Troffers/4-T8 Lamps/Electronic Ballasts 9 1008.0 1.01 2,400 2,419 483.84$ NONE PROPOSED 9 1008.0 1.01 2,400 2419 2419 NONE PROPOSED 0 - - - - -$ 0 0 0 0 0 0 0
300Nellie Bennet Elementary
School000 306 2X4 Troffers/2-T8 Lamps/Electronic Ballasts 2 101.4 0.10 2,400 243 48.67$ NONE PROPOSED 2 101.4 0.10 2,400 243 243 NONE PROPOSED 0 - - - - -$ 0 0 0 0 0 0 0
301Nellie Bennet Elementary
School000 307 2X4 Troffers/4-T8 Lamps/Electronic Ballasts 18 2016.0 2.02 2,400 4,838 967.68$ NONE PROPOSED 18 2016.0 2.02 2,400 4838 4838 NONE PROPOSED 0 - - - - -$ 0 0 0 0 0 0 0
7
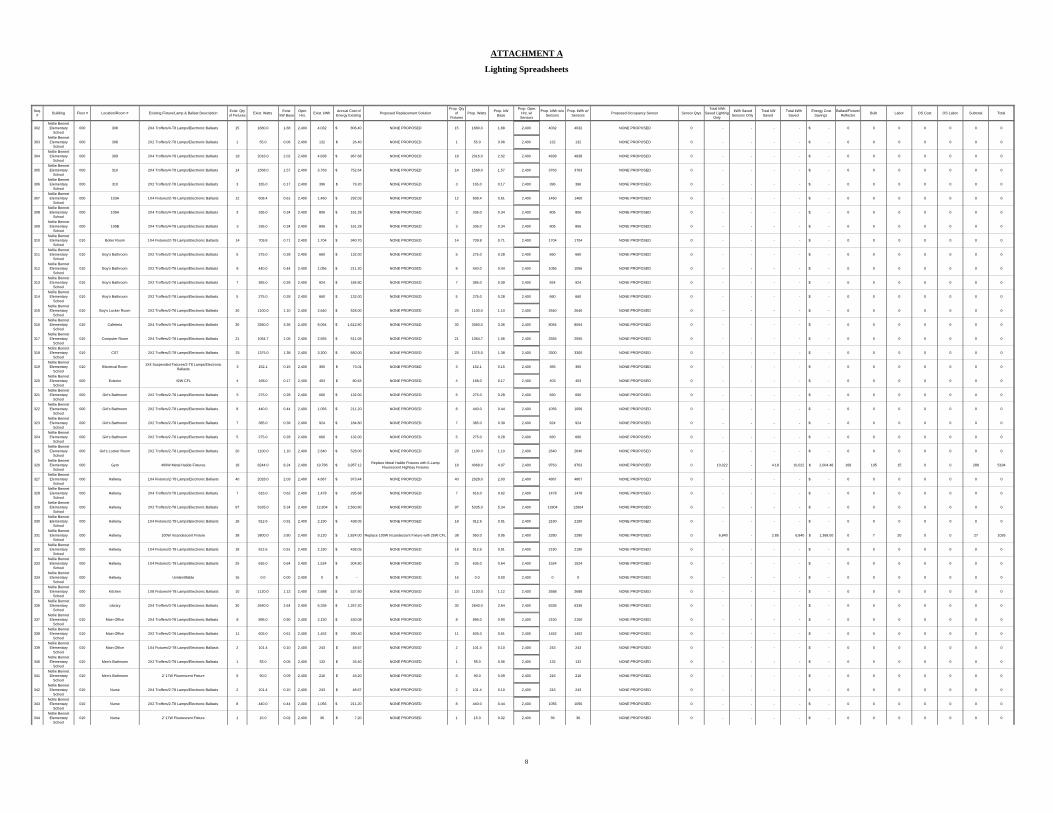
ATTACHMENT A
Lighting Spreadsheets
Seq. # Building Floor # Location/Room # Existing Fixture/Lamp & Ballast Description Exist. Qty
of Fixtures Exist. Watts Exist. kW Base
Oper. Hrs. Exist. kWh Annual Cost of
Energy Existing Proposed Replacement SolutionProp. Qty
of Fixtures
Prop. Watts Prop. kW Base
Prop. Oper. Hrs. w/ Sensors
Prop. kWh w/o Sensors
Prop. kWh w/ Sensors Proposed Occupancy Sensor Sensor Qtys
Total kWh Saved Lighting
Only
kWh Saved Sensors Only
Total kW Saved
Total kWh Saved
Energy Cost Savings
Ballast/Fixture/Reflector Bulb Labor OS Cost OS Labor Subtotal Total
302Nellie Bennet Elementary
School000 308 2X4 Troffers/4-T8 Lamps/Electronic Ballasts 15 1680.0 1.68 2,400 4,032 806.40$ NONE PROPOSED 15 1680.0 1.68 2,400 4032 4032 NONE PROPOSED 0 - - - - -$ 0 0 0 0 0 0 0
303Nellie Bennet Elementary
School000 308 2X2 Troffers/2-T8 Lamps/Electronic Ballasts 1 55.0 0.06 2,400 132 26.40$ NONE PROPOSED 1 55.0 0.06 2,400 132 132 NONE PROPOSED 0 - - - - -$ 0 0 0 0 0 0 0
304Nellie Bennet Elementary
School000 309 2X4 Troffers/4-T8 Lamps/Electronic Ballasts 18 2016.0 2.02 2,400 4,838 967.68$ NONE PROPOSED 18 2016.0 2.02 2,400 4838 4838 NONE PROPOSED 0 - - - - -$ 0 0 0 0 0 0 0
305Nellie Bennet Elementary
School000 310 2X4 Troffers/4-T8 Lamps/Electronic Ballasts 14 1568.0 1.57 2,400 3,763 752.64$ NONE PROPOSED 14 1568.0 1.57 2,400 3763 3763 NONE PROPOSED 0 - - - - -$ 0 0 0 0 0 0 0
306Nellie Bennet Elementary
School000 310 2X2 Troffers/2-T8 Lamps/Electronic Ballasts 3 165.0 0.17 2,400 396 79.20$ NONE PROPOSED 3 165.0 0.17 2,400 396 396 NONE PROPOSED 0 - - - - -$ 0 0 0 0 0 0 0
307Nellie Bennet Elementary
School000 103A 1X4 Fixtures/2-T8 Lamps/Electronic Ballasts 12 608.4 0.61 2,400 1,460 292.03$ NONE PROPOSED 12 608.4 0.61 2,400 1460 1460 NONE PROPOSED 0 - - - - -$ 0 0 0 0 0 0 0
308Nellie Bennet Elementary
School000 109A 2X4 Troffers/4-T8 Lamps/Electronic Ballasts 3 336.0 0.34 2,400 806 161.28$ NONE PROPOSED 3 336.0 0.34 2,400 806 806 NONE PROPOSED 0 - - - - -$ 0 0 0 0 0 0 0
309Nellie Bennet Elementary
School000 109B 2X4 Troffers/4-T8 Lamps/Electronic Ballasts 3 336.0 0.34 2,400 806 161.28$ NONE PROPOSED 3 336.0 0.34 2,400 806 806 NONE PROPOSED 0 - - - - -$ 0 0 0 0 0 0 0
310Nellie Bennet Elementary
School010 Boiler Room 1X4 Fixtures/2-T8 Lamps/Electronic Ballasts 14 709.8 0.71 2,400 1,704 340.70$ NONE PROPOSED 14 709.8 0.71 2,400 1704 1704 NONE PROPOSED 0 - - - - -$ 0 0 0 0 0 0 0
311Nellie Bennet Elementary
School010 Boy's Bathroom 2X2 Troffers/2-T8 Lamps/Electronic Ballasts 5 275.0 0.28 2,400 660 132.00$ NONE PROPOSED 5 275.0 0.28 2,400 660 660 NONE PROPOSED 0 - - - - -$ 0 0 0 0 0 0 0
312Nellie Bennet Elementary
School010 Boy's Bathroom 2X2 Troffers/2-T8 Lamps/Electronic Ballasts 8 440.0 0.44 2,400 1,056 211.20$ NONE PROPOSED 8 440.0 0.44 2,400 1056 1056 NONE PROPOSED 0 - - - - -$ 0 0 0 0 0 0 0
313Nellie Bennet Elementary
School010 Boy's Bathroom 2X2 Troffers/2-T8 Lamps/Electronic Ballasts 7 385.0 0.39 2,400 924 184.80$ NONE PROPOSED 7 385.0 0.39 2,400 924 924 NONE PROPOSED 0 - - - - -$ 0 0 0 0 0 0 0
314Nellie Bennet Elementary
School010 Boy's Bathroom 2X2 Troffers/2-T8 Lamps/Electronic Ballasts 5 275.0 0.28 2,400 660 132.00$ NONE PROPOSED 5 275.0 0.28 2,400 660 660 NONE PROPOSED 0 - - - - -$ 0 0 0 0 0 0 0
315Nellie Bennet Elementary
School010 Boy's Locker Room 2X2 Troffers/2-T8 Lamps/Electronic Ballasts 20 1100.0 1.10 2,400 2,640 528.00$ NONE PROPOSED 20 1100.0 1.10 2,400 2640 2640 NONE PROPOSED 0 - - - - -$ 0 0 0 0 0 0 0
316Nellie Bennet Elementary
School010 Cafeteria 2X4 Troffers/4-T8 Lamps/Electronic Ballasts 30 3360.0 3.36 2,400 8,064 1,612.80$ NONE PROPOSED 30 3360.0 3.36 2,400 8064 8064 NONE PROPOSED 0 - - - - -$ 0 0 0 0 0 0 0
317Nellie Bennet Elementary
School010 Computer Room 2X4 Troffers/2-T8 Lamps/Electronic Ballasts 21 1064.7 1.06 2,400 2,555 511.06$ NONE PROPOSED 21 1064.7 1.06 2,400 2555 2555 NONE PROPOSED 0 - - - - -$ 0 0 0 0 0 0 0
318Nellie Bennet Elementary
School010 CST 2X2 Troffers/2-T8 Lamps/Electronic Ballasts 25 1375.0 1.38 2,400 3,300 660.00$ NONE PROPOSED 25 1375.0 1.38 2,400 3300 3300 NONE PROPOSED 0 - - - - -$ 0 0 0 0 0 0 0
319Nellie Bennet Elementary
School010 Electrical Room 1X4 Suspended Fixtures/2-T8 Lamps/Electronic
Ballasts 3 152.1 0.15 2,400 365 73.01$ NONE PROPOSED 3 152.1 0.15 2,400 365 365 NONE PROPOSED 0 - - - - -$ 0 0 0 0 0 0 0
320Nellie Bennet Elementary
School000 Exterior 42W CFL 4 168.0 0.17 2,400 403 80.64$ NONE PROPOSED 4 168.0 0.17 2,400 403 403 NONE PROPOSED 0 - - - - -$ 0 0 0 0 0 0 0
321Nellie Bennet Elementary
School000 Girl's Bathroom 2X2 Troffers/2-T8 Lamps/Electronic Ballasts 5 275.0 0.28 2,400 660 132.00$ NONE PROPOSED 5 275.0 0.28 2,400 660 660 NONE PROPOSED 0 - - - - -$ 0 0 0 0 0 0 0
322Nellie Bennet Elementary
School000 Girl's Bathroom 2X2 Troffers/2-T8 Lamps/Electronic Ballasts 8 440.0 0.44 2,400 1,056 211.20$ NONE PROPOSED 8 440.0 0.44 2,400 1056 1056 NONE PROPOSED 0 - - - - -$ 0 0 0 0 0 0 0
323Nellie Bennet Elementary
School000 Girl's Bathroom 2X2 Troffers/2-T8 Lamps/Electronic Ballasts 7 385.0 0.39 2,400 924 184.80$ NONE PROPOSED 7 385.0 0.39 2,400 924 924 NONE PROPOSED 0 - - - - -$ 0 0 0 0 0 0 0
324Nellie Bennet Elementary
School000 Girl's Bathroom 2X2 Troffers/2-T8 Lamps/Electronic Ballasts 5 275.0 0.28 2,400 660 132.00$ NONE PROPOSED 5 275.0 0.28 2,400 660 660 NONE PROPOSED 0 - - - - -$ 0 0 0 0 0 0 0
325Nellie Bennet Elementary
School000 Girl's Locker Room 2X2 Troffers/2-T8 Lamps/Electronic Ballasts 20 1100.0 1.10 2,400 2,640 528.00$ NONE PROPOSED 20 1100.0 1.10 2,400 2640 2640 NONE PROPOSED 0 - - - - -$ 0 0 0 0 0 0 0
326Nellie Bennet Elementary
School000 Gym 400W Metal Halide Fixtures 18 8244.0 8.24 2,400 19,786 3,957.12$ Replace Metal Halide Fixtures with 6-Lamp
Fluorescent Highbay Fixtures 18 4068.0 4.07 2,400 9763 9763 NONE PROPOSED 0 10,022 - 4.18 10,022 2,004.48$ 168 105 15 0 0 288 5184
327Nellie Bennet Elementary
School000 Hallway 1X4 Fixtures/2-T8 Lamps/Electronic Ballasts 40 2028.0 2.03 2,400 4,867 973.44$ NONE PROPOSED 40 2028.0 2.03 2,400 4867 4867 NONE PROPOSED 0 - - - - -$ 0 0 0 0 0 0 0
328Nellie Bennet Elementary
School000 Hallway 2X4 Troffers/3-T8 Lamps/Electronic Ballasts 7 616.0 0.62 2,400 1,478 295.68$ NONE PROPOSED 7 616.0 0.62 2,400 1478 1478 NONE PROPOSED 0 - - - - -$ 0 0 0 0 0 0 0
329Nellie Bennet Elementary
School000 Hallway 2X2 Troffers/2-T8 Lamps/Electronic Ballasts 97 5335.0 5.34 2,400 12,804 2,560.80$ NONE PROPOSED 97 5335.0 5.34 2,400 12804 12804 NONE PROPOSED 0 - - - - -$ 0 0 0 0 0 0 0
330Nellie Bennet Elementary
School000 Hallway 1X4 Fixtures/2-T8 Lamps/Electronic Ballasts 18 912.6 0.91 2,400 2,190 438.05$ NONE PROPOSED 18 912.6 0.91 2,400 2190 2190 NONE PROPOSED 0 - - - - -$ 0 0 0 0 0 0 0
331Nellie Bennet Elementary
School000 Hallway 100W Incandescent Fixture 38 3800.0 3.80 2,400 9,120 1,824.00$ Replace 100W Incandescent Fixture with 25W CFL 38 950.0 0.95 2,400 2280 2280 NONE PROPOSED 0 6,840 - 2.85 6,840 1,368.00$ 0 7 20 0 0 27 1026
332Nellie Bennet Elementary
School000 Hallway 1X4 Fixtures/2-T8 Lamps/Electronic Ballasts 18 912.6 0.91 2,400 2,190 438.05$ NONE PROPOSED 18 912.6 0.91 2,400 2190 2190 NONE PROPOSED 0 - - - - -$ 0 0 0 0 0 0 0
333Nellie Bennet Elementary
School000 Hallway 1X4 Fixtures/1-T8 Lamps/Electronic Ballasts 25 635.0 0.64 2,400 1,524 304.80$ NONE PROPOSED 25 635.0 0.64 2,400 1524 1524 NONE PROPOSED 0 - - - - -$ 0 0 0 0 0 0 0
334Nellie Bennet Elementary
School000 Hallway Unidentifiable 16 0.0 0.00 2,400 0 -$ NONE PROPOSED 16 0.0 0.00 2,400 0 0 NONE PROPOSED 0 - - - - -$ 0 0 0 0 0 0 0
335Nellie Bennet Elementary
School000 Kitchen 1X8 Fixtures/4-T8 Lamps/Electronic Ballasts 10 1120.0 1.12 2,400 2,688 537.60$ NONE PROPOSED 10 1120.0 1.12 2,400 2688 2688 NONE PROPOSED 0 - - - - -$ 0 0 0 0 0 0 0
336Nellie Bennet Elementary
School000 Library 2X4 Troffers/3-T8 Lamps/Electronic Ballasts 30 2640.0 2.64 2,400 6,336 1,267.20$ NONE PROPOSED 30 2640.0 2.64 2,400 6336 6336 NONE PROPOSED 0 - - - - -$ 0 0 0 0 0 0 0
337Nellie Bennet Elementary
School010 Main Office 2X4 Troffers/4-T8 Lamps/Electronic Ballasts 8 896.0 0.90 2,400 2,150 430.08$ NONE PROPOSED 8 896.0 0.90 2,400 2150 2150 NONE PROPOSED 0 - - - - -$ 0 0 0 0 0 0 0
338Nellie Bennet Elementary
School010 Main Office 2X2 Troffers/2-T8 Lamps/Electronic Ballasts 11 605.0 0.61 2,400 1,452 290.40$ NONE PROPOSED 11 605.0 0.61 2,400 1452 1452 NONE PROPOSED 0 - - - - -$ 0 0 0 0 0 0 0
339Nellie Bennet Elementary
School010 Main Office 1X4 Fixtures/2-T8 Lamps/Electronic Ballasts 2 101.4 0.10 2,400 243 48.67$ NONE PROPOSED 2 101.4 0.10 2,400 243 243 NONE PROPOSED 0 - - - - -$ 0 0 0 0 0 0 0
340Nellie Bennet Elementary
School010 Men's Bathroom 2X2 Troffers/2-T8 Lamps/Electronic Ballasts 1 55.0 0.06 2,400 132 26.40$ NONE PROPOSED 1 55.0 0.06 2,400 132 132 NONE PROPOSED 0 - - - - -$ 0 0 0 0 0 0 0
341Nellie Bennet Elementary
School010 Men's Bathroom 2' 17W Fluorescent Fixture 6 90.0 0.09 2,400 216 43.20$ NONE PROPOSED 6 90.0 0.09 2,400 216 216 NONE PROPOSED 0 - - - - -$ 0 0 0 0 0 0 0
342Nellie Bennet Elementary
School010 Nurse 2X4 Troffers/2-T8 Lamps/Electronic Ballasts 2 101.4 0.10 2,400 243 48.67$ NONE PROPOSED 2 101.4 0.10 2,400 243 243 NONE PROPOSED 0 - - - - -$ 0 0 0 0 0 0 0
343Nellie Bennet Elementary
School010 Nurse 2X2 Troffers/2-T8 Lamps/Electronic Ballasts 8 440.0 0.44 2,400 1,056 211.20$ NONE PROPOSED 8 440.0 0.44 2,400 1056 1056 NONE PROPOSED 0 - - - - -$ 0 0 0 0 0 0 0
344Nellie Bennet Elementary
School010 Nurse 2' 17W Fluorescent Fixture 1 15.0 0.02 2,400 36 7.20$ NONE PROPOSED 1 15.0 0.02 2,400 36 36 NONE PROPOSED 0 - - - - -$ 0 0 0 0 0 0 0
8
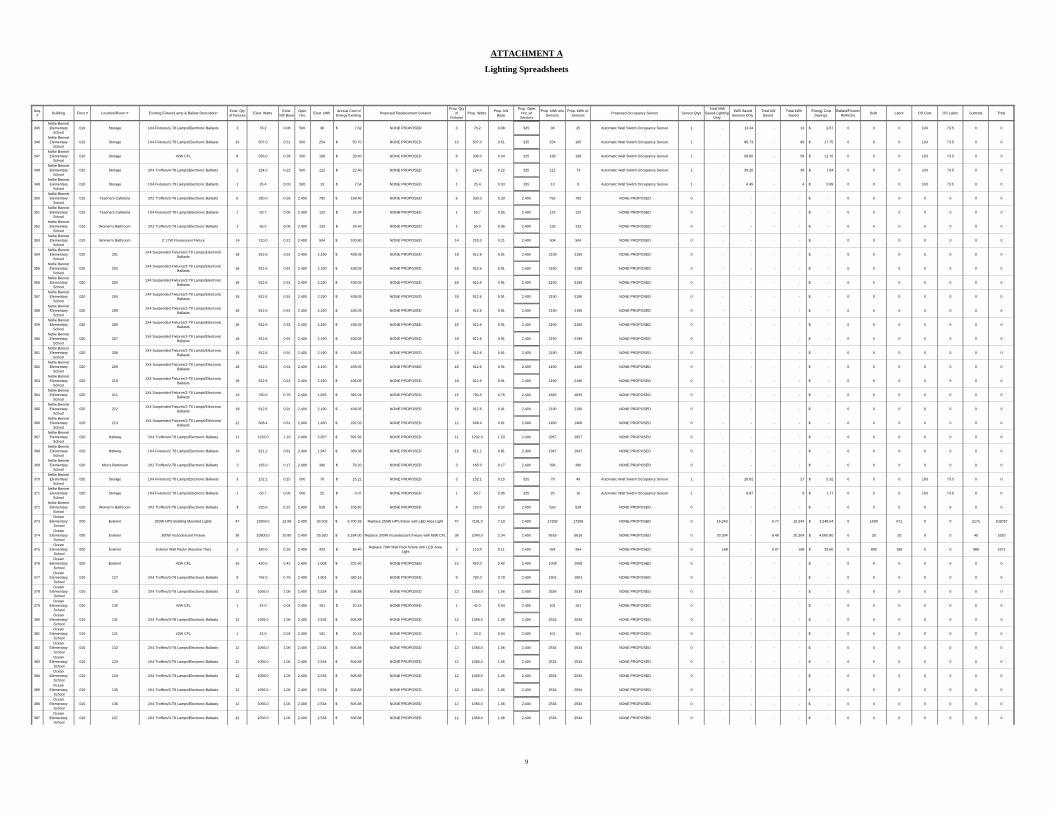
ATTACHMENT A
Lighting Spreadsheets
Seq. # Building Floor # Location/Room # Existing Fixture/Lamp & Ballast Description Exist. Qty
of Fixtures Exist. Watts Exist. kW Base
Oper. Hrs. Exist. kWh Annual Cost of
Energy Existing Proposed Replacement SolutionProp. Qty
of Fixtures
Prop. Watts Prop. kW Base
Prop. Oper. Hrs. w/ Sensors
Prop. kWh w/o Sensors
Prop. kWh w/ Sensors Proposed Occupancy Sensor Sensor Qtys
Total kWh Saved Lighting
Only
kWh Saved Sensors Only
Total kW Saved
Total kWh Saved
Energy Cost Savings
Ballast/Fixture/Reflector Bulb Labor OS Cost OS Labor Subtotal Total
345Nellie Bennet Elementary
School010 Storage 1X4 Fixtures/1-T8 Lamps/Electronic Ballasts 3 76.2 0.08 500 38 7.62$ NONE PROPOSED 3 76.2 0.08 325 38 25 Automatic Wall Switch Occupancy Sensor 1 - 13.34 - 13 2.67$ 0 0 0 103 73.5 0 0
346Nellie Bennet Elementary
School010 Storage 1X4 Fixtures/2-T8 Lamps/Electronic Ballasts 10 507.0 0.51 500 254 50.70$ NONE PROPOSED 10 507.0 0.51 325 254 165 Automatic Wall Switch Occupancy Sensor 1 - 88.73 - 89 17.75$ 0 0 0 103 73.5 0 0
347Nellie Bennet Elementary
School010 Storage 42W CFL 8 336.0 0.34 500 168 33.60$ NONE PROPOSED 8 336.0 0.34 325 168 109 Automatic Wall Switch Occupancy Sensor 1 - 58.80 - 59 11.76$ 0 0 0 103 73.5 0 0
348Nellie Bennet Elementary
School010 Storage 2X4 Troffers/4-T8 Lamps/Electronic Ballasts 2 224.0 0.22 500 112 22.40$ NONE PROPOSED 2 224.0 0.22 325 112 73 Automatic Wall Switch Occupancy Sensor 1 - 39.20 - 39 7.84$ 0 0 0 103 73.5 0 0
349Nellie Bennet Elementary
School010 Storage 1X4 Fixtures/1-T8 Lamps/Electronic Ballasts 1 25.4 0.03 500 13 2.54$ NONE PROPOSED 1 25.4 0.03 325 13 8 Automatic Wall Switch Occupancy Sensor 1 - 4.45 - 4 0.89$ 0 0 0 103 73.5 0 0
350Nellie Bennet Elementary
School010 Teachers Cafeteria 2X2 Troffers/2-T8 Lamps/Electronic Ballasts 6 330.0 0.33 2,400 792 158.40$ NONE PROPOSED 6 330.0 0.33 2,400 792 792 NONE PROPOSED 0 - - - - -$ 0 0 0 0 0 0 0
351Nellie Bennet Elementary
School010 Teachers Cafeteria 1X4 Fixtures/2-T8 Lamps/Electronic Ballasts 1 50.7 0.05 2,400 122 24.34$ NONE PROPOSED 1 50.7 0.05 2,400 122 122 NONE PROPOSED 0 - - - - -$ 0 0 0 0 0 0 0
352Nellie Bennet Elementary
School010 Women's Bathroom 2X2 Troffers/2-T8 Lamps/Electronic Ballasts 1 55.0 0.06 2,400 132 26.40$ NONE PROPOSED 1 55.0 0.06 2,400 132 132 NONE PROPOSED 0 - - - - -$ 0 0 0 0 0 0 0
353Nellie Bennet Elementary
School010 Women's Bathroom 2' 17W Fluorescent Fixture 14 210.0 0.21 2,400 504 100.80$ NONE PROPOSED 14 210.0 0.21 2,400 504 504 NONE PROPOSED 0 - - - - -$ 0 0 0 0 0 0 0
354Nellie Bennet Elementary
School020 201 1X4 Suspended Fixtures/2-T8 Lamps/Electronic
Ballasts 18 912.6 0.91 2,400 2,190 438.05$ NONE PROPOSED 18 912.6 0.91 2,400 2190 2190 NONE PROPOSED 0 - - - - -$ 0 0 0 0 0 0 0
355Nellie Bennet Elementary
School020 202 1X4 Suspended Fixtures/2-T8 Lamps/Electronic
Ballasts 18 912.6 0.91 2,400 2,190 438.05$ NONE PROPOSED 18 912.6 0.91 2,400 2190 2190 NONE PROPOSED 0 - - - - -$ 0 0 0 0 0 0 0
356Nellie Bennet Elementary
School020 203 1X4 Suspended Fixtures/2-T8 Lamps/Electronic
Ballasts 18 912.6 0.91 2,400 2,190 438.05$ NONE PROPOSED 18 912.6 0.91 2,400 2190 2190 NONE PROPOSED 0 - - - - -$ 0 0 0 0 0 0 0
357Nellie Bennet Elementary
School020 204 1X4 Suspended Fixtures/2-T8 Lamps/Electronic
Ballasts 18 912.6 0.91 2,400 2,190 438.05$ NONE PROPOSED 18 912.6 0.91 2,400 2190 2190 NONE PROPOSED 0 - - - - -$ 0 0 0 0 0 0 0
358Nellie Bennet Elementary
School020 205 1X4 Suspended Fixtures/2-T8 Lamps/Electronic
Ballasts 18 912.6 0.91 2,400 2,190 438.05$ NONE PROPOSED 18 912.6 0.91 2,400 2190 2190 NONE PROPOSED 0 - - - - -$ 0 0 0 0 0 0 0
359Nellie Bennet Elementary
School020 206 1X4 Suspended Fixtures/2-T8 Lamps/Electronic
Ballasts 18 912.6 0.91 2,400 2,190 438.05$ NONE PROPOSED 18 912.6 0.91 2,400 2190 2190 NONE PROPOSED 0 - - - - -$ 0 0 0 0 0 0 0
360Nellie Bennet Elementary
School020 207 1X4 Suspended Fixtures/2-T8 Lamps/Electronic
Ballasts 18 912.6 0.91 2,400 2,190 438.05$ NONE PROPOSED 18 912.6 0.91 2,400 2190 2190 NONE PROPOSED 0 - - - - -$ 0 0 0 0 0 0 0
361Nellie Bennet Elementary
School020 208 1X4 Suspended Fixtures/2-T8 Lamps/Electronic
Ballasts 18 912.6 0.91 2,400 2,190 438.05$ NONE PROPOSED 18 912.6 0.91 2,400 2190 2190 NONE PROPOSED 0 - - - - -$ 0 0 0 0 0 0 0
362Nellie Bennet Elementary
School020 209 1X4 Suspended Fixtures/2-T8 Lamps/Electronic
Ballasts 18 912.6 0.91 2,400 2,190 438.05$ NONE PROPOSED 18 912.6 0.91 2,400 2190 2190 NONE PROPOSED 0 - - - - -$ 0 0 0 0 0 0 0
363Nellie Bennet Elementary
School020 210 1X4 Suspended Fixtures/2-T8 Lamps/Electronic
Ballasts 18 912.6 0.91 2,400 2,190 438.05$ NONE PROPOSED 18 912.6 0.91 2,400 2190 2190 NONE PROPOSED 0 - - - - -$ 0 0 0 0 0 0 0
364Nellie Bennet Elementary
School020 211 1X4 Suspended Fixtures/2-T8 Lamps/Electronic
Ballasts 15 760.5 0.76 2,400 1,825 365.04$ NONE PROPOSED 15 760.5 0.76 2,400 1825 1825 NONE PROPOSED 0 - - - - -$ 0 0 0 0 0 0 0
365Nellie Bennet Elementary
School020 212 1X4 Suspended Fixtures/2-T8 Lamps/Electronic
Ballasts 18 912.6 0.91 2,400 2,190 438.05$ NONE PROPOSED 18 912.6 0.91 2,400 2190 2190 NONE PROPOSED 0 - - - - -$ 0 0 0 0 0 0 0
366Nellie Bennet Elementary
School020 213 1X4 Suspended Fixtures/2-T8 Lamps/Electronic
Ballasts 12 608.4 0.61 2,400 1,460 292.03$ NONE PROPOSED 12 608.4 0.61 2,400 1460 1460 NONE PROPOSED 0 - - - - -$ 0 0 0 0 0 0 0
367Nellie Bennet Elementary
School020 Hallway 2X4 Troffers/4-T8 Lamps/Electronic Ballasts 11 1232.0 1.23 2,400 2,957 591.36$ NONE PROPOSED 11 1232.0 1.23 2,400 2957 2957 NONE PROPOSED 0 - - - - -$ 0 0 0 0 0 0 0
368Nellie Bennet Elementary
School020 Hallway 1X4 Fixtures/2-T8 Lamps/Electronic Ballasts 16 811.2 0.81 2,400 1,947 389.38$ NONE PROPOSED 16 811.2 0.81 2,400 1947 1947 NONE PROPOSED 0 - - - - -$ 0 0 0 0 0 0 0
369Nellie Bennet Elementary
School020 Men's Bathroom 2X2 Troffers/2-T8 Lamps/Electronic Ballasts 3 165.0 0.17 2,400 396 79.20$ NONE PROPOSED 3 165.0 0.17 2,400 396 396 NONE PROPOSED 0 - - - - -$ 0 0 0 0 0 0 0
370Nellie Bennet Elementary
School020 Storage 1X4 Fixtures/2-T8 Lamps/Electronic Ballasts 3 152.1 0.15 500 76 15.21$ NONE PROPOSED 3 152.1 0.15 325 76 49 Automatic Wall Switch Occupancy Sensor 1 - 26.62 - 27 5.32$ 0 0 0 103 73.5 0 0
371Nellie Bennet Elementary
School020 Storage 1X4 Fixtures/2-T8 Lamps/Electronic Ballasts 1 50.7 0.05 500 25 5.07$ NONE PROPOSED 1 50.7 0.05 325 25 16 Automatic Wall Switch Occupancy Sensor 1 - 8.87 - 9 1.77$ 0 0 0 103 73.5 0 0
372Nellie Bennet Elementary
School020 Women's Bathroom 2X2 Troffers/2-T8 Lamps/Electronic Ballasts 4 220.0 0.22 2,400 528 105.60$ NONE PROPOSED 4 220.0 0.22 2,400 528 528 NONE PROPOSED 0 - - - - -$ 0 0 0 0 0 0 0
373Ocean
Elementary School
000 Exterior 250W HPS Building Mounted Lights 47 13959.0 13.96 2,400 33,502 6,700.32$ Replace 250W HPS fixture with LED Area Light 47 7191.0 7.19 2,400 17258 17258 NONE PROPOSED 0 16,243 - 6.77 16,243 3,248.64$ 0 1500 671 0 0 2171 102037
374Ocean
Elementary School
000 Exterior 300W Incandescent Fixture 36 10800.0 10.80 2,400 25,920 5,184.00$ Replace 300W Incandescent Fixture with 65W CFL 36 2340.0 2.34 2,400 5616 5616 NONE PROPOSED 0 20,304 - 8.46 20,304 4,060.80$ 0 25 20 0 0 45 1620
375Ocean
Elementary School
000 Exterior Exterior Wall Packs (Assume 70w) 2 180.0 0.18 2,400 432 86.40$ Replace 70W Wall Pack fixture with LED Area Light 2 110.0 0.11 2,400 264 264 NONE PROPOSED 0 168 - 0.07 168 33.60$ 0 800 186 0 0 986 1972
376Ocean
Elementary School
000 Exterior 42W CFL 10 420.0 0.42 2,400 1,008 201.60$ NONE PROPOSED 10 420.0 0.42 2,400 1008 1008 NONE PROPOSED 0 - - - - -$ 0 0 0 0 0 0 0
377Ocean
Elementary School
010 127 2X4 Troffers/3-T8 Lamps/Electronic Ballasts 9 792.0 0.79 2,400 1,901 380.16$ NONE PROPOSED 9 792.0 0.79 2,400 1901 1901 NONE PROPOSED 0 - - - - -$ 0 0 0 0 0 0 0
378Ocean
Elementary School
010 130 2X4 Troffers/3-T8 Lamps/Electronic Ballasts 12 1056.0 1.06 2,400 2,534 506.88$ NONE PROPOSED 12 1056.0 1.06 2,400 2534 2534 NONE PROPOSED 0 - - - - -$ 0 0 0 0 0 0 0
379Ocean
Elementary School
010 130 42W CFL 1 42.0 0.04 2,400 101 20.16$ NONE PROPOSED 1 42.0 0.04 2,400 101 101 NONE PROPOSED 0 - - - - -$ 0 0 0 0 0 0 0
380Ocean
Elementary School
010 131 2X4 Troffers/3-T8 Lamps/Electronic Ballasts 12 1056.0 1.06 2,400 2,534 506.88$ NONE PROPOSED 12 1056.0 1.06 2,400 2534 2534 NONE PROPOSED 0 - - - - -$ 0 0 0 0 0 0 0
381Ocean
Elementary School
010 131 42W CFL 1 42.0 0.04 2,400 101 20.16$ NONE PROPOSED 1 42.0 0.04 2,400 101 101 NONE PROPOSED 0 - - - - -$ 0 0 0 0 0 0 0
382Ocean
Elementary School
010 132 2X4 Troffers/3-T8 Lamps/Electronic Ballasts 12 1056.0 1.06 2,400 2,534 506.88$ NONE PROPOSED 12 1056.0 1.06 2,400 2534 2534 NONE PROPOSED 0 - - - - -$ 0 0 0 0 0 0 0
383Ocean
Elementary School
010 133 2X4 Troffers/3-T8 Lamps/Electronic Ballasts 12 1056.0 1.06 2,400 2,534 506.88$ NONE PROPOSED 12 1056.0 1.06 2,400 2534 2534 NONE PROPOSED 0 - - - - -$ 0 0 0 0 0 0 0
384Ocean
Elementary School
010 134 2X4 Troffers/3-T8 Lamps/Electronic Ballasts 12 1056.0 1.06 2,400 2,534 506.88$ NONE PROPOSED 12 1056.0 1.06 2,400 2534 2534 NONE PROPOSED 0 - - - - -$ 0 0 0 0 0 0 0
385Ocean
Elementary School
010 135 2X4 Troffers/3-T8 Lamps/Electronic Ballasts 12 1056.0 1.06 2,400 2,534 506.88$ NONE PROPOSED 12 1056.0 1.06 2,400 2534 2534 NONE PROPOSED 0 - - - - -$ 0 0 0 0 0 0 0
386Ocean
Elementary School
010 136 2X4 Troffers/3-T8 Lamps/Electronic Ballasts 12 1056.0 1.06 2,400 2,534 506.88$ NONE PROPOSED 12 1056.0 1.06 2,400 2534 2534 NONE PROPOSED 0 - - - - -$ 0 0 0 0 0 0 0
387Ocean
Elementary School
010 137 2X4 Troffers/3-T8 Lamps/Electronic Ballasts 12 1056.0 1.06 2,400 2,534 506.88$ NONE PROPOSED 12 1056.0 1.06 2,400 2534 2534 NONE PROPOSED 0 - - - - -$ 0 0 0 0 0 0 0
9
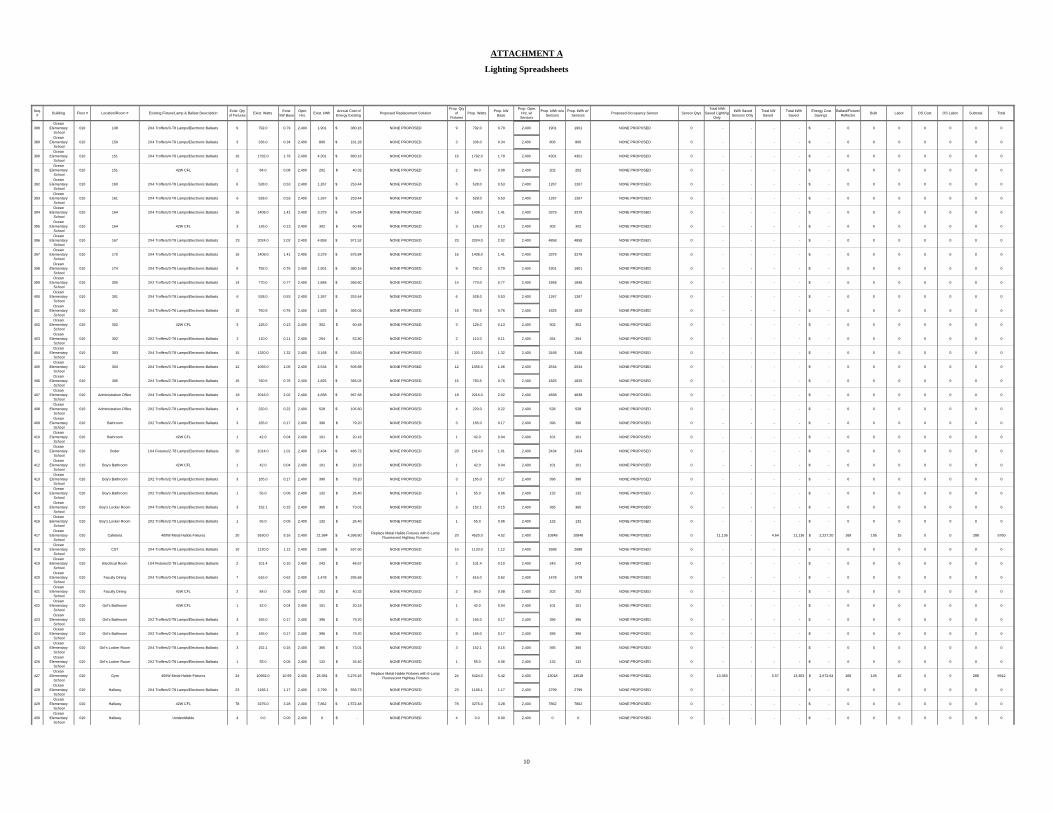
ATTACHMENT A
Lighting Spreadsheets
Seq. # Building Floor # Location/Room # Existing Fixture/Lamp & Ballast Description Exist. Qty
of Fixtures Exist. Watts Exist. kW Base
Oper. Hrs. Exist. kWh Annual Cost of
Energy Existing Proposed Replacement SolutionProp. Qty
of Fixtures
Prop. Watts Prop. kW Base
Prop. Oper. Hrs. w/ Sensors
Prop. kWh w/o Sensors
Prop. kWh w/ Sensors Proposed Occupancy Sensor Sensor Qtys
Total kWh Saved Lighting
Only
kWh Saved Sensors Only
Total kW Saved
Total kWh Saved
Energy Cost Savings
Ballast/Fixture/Reflector Bulb Labor OS Cost OS Labor Subtotal Total
388Ocean
Elementary School
010 138 2X4 Troffers/3-T8 Lamps/Electronic Ballasts 9 792.0 0.79 2,400 1,901 380.16$ NONE PROPOSED 9 792.0 0.79 2,400 1901 1901 NONE PROPOSED 0 - - - - -$ 0 0 0 0 0 0 0
389Ocean
Elementary School
010 150 2X4 Troffers/4-T8 Lamps/Electronic Ballasts 3 336.0 0.34 2,400 806 161.28$ NONE PROPOSED 3 336.0 0.34 2,400 806 806 NONE PROPOSED 0 - - - - -$ 0 0 0 0 0 0 0
390Ocean
Elementary School
010 151 2X4 Troffers/4-T8 Lamps/Electronic Ballasts 16 1792.0 1.79 2,400 4,301 860.16$ NONE PROPOSED 16 1792.0 1.79 2,400 4301 4301 NONE PROPOSED 0 - - - - -$ 0 0 0 0 0 0 0
391Ocean
Elementary School
010 151 42W CFL 2 84.0 0.08 2,400 202 40.32$ NONE PROPOSED 2 84.0 0.08 2,400 202 202 NONE PROPOSED 0 - - - - -$ 0 0 0 0 0 0 0
392Ocean
Elementary School
010 160 2X4 Troffers/3-T8 Lamps/Electronic Ballasts 6 528.0 0.53 2,400 1,267 253.44$ NONE PROPOSED 6 528.0 0.53 2,400 1267 1267 NONE PROPOSED 0 - - - - -$ 0 0 0 0 0 0 0
393Ocean
Elementary School
010 161 2X4 Troffers/3-T8 Lamps/Electronic Ballasts 6 528.0 0.53 2,400 1,267 253.44$ NONE PROPOSED 6 528.0 0.53 2,400 1267 1267 NONE PROPOSED 0 - - - - -$ 0 0 0 0 0 0 0
394Ocean
Elementary School
010 164 2X4 Troffers/3-T8 Lamps/Electronic Ballasts 16 1408.0 1.41 2,400 3,379 675.84$ NONE PROPOSED 16 1408.0 1.41 2,400 3379 3379 NONE PROPOSED 0 - - - - -$ 0 0 0 0 0 0 0
395Ocean
Elementary School
010 164 42W CFL 3 126.0 0.13 2,400 302 60.48$ NONE PROPOSED 3 126.0 0.13 2,400 302 302 NONE PROPOSED 0 - - - - -$ 0 0 0 0 0 0 0
396Ocean
Elementary School
010 167 2X4 Troffers/3-T8 Lamps/Electronic Ballasts 23 2024.0 2.02 2,400 4,858 971.52$ NONE PROPOSED 23 2024.0 2.02 2,400 4858 4858 NONE PROPOSED 0 - - - - -$ 0 0 0 0 0 0 0
397Ocean
Elementary School
010 170 2X4 Troffers/3-T8 Lamps/Electronic Ballasts 16 1408.0 1.41 2,400 3,379 675.84$ NONE PROPOSED 16 1408.0 1.41 2,400 3379 3379 NONE PROPOSED 0 - - - - -$ 0 0 0 0 0 0 0
398Ocean
Elementary School
010 174 2X4 Troffers/3-T8 Lamps/Electronic Ballasts 9 792.0 0.79 2,400 1,901 380.16$ NONE PROPOSED 9 792.0 0.79 2,400 1901 1901 NONE PROPOSED 0 - - - - -$ 0 0 0 0 0 0 0
399Ocean
Elementary School
010 300 2X2 Troffers/2-T8 Lamps/Electronic Ballasts 14 770.0 0.77 2,400 1,848 369.60$ NONE PROPOSED 14 770.0 0.77 2,400 1848 1848 NONE PROPOSED 0 - - - - -$ 0 0 0 0 0 0 0
400Ocean
Elementary School
010 301 2X4 Troffers/3-T8 Lamps/Electronic Ballasts 6 528.0 0.53 2,400 1,267 253.44$ NONE PROPOSED 6 528.0 0.53 2,400 1267 1267 NONE PROPOSED 0 - - - - -$ 0 0 0 0 0 0 0
401Ocean
Elementary School
010 302 2X4 Troffers/2-T8 Lamps/Electronic Ballasts 15 760.5 0.76 2,400 1,825 365.04$ NONE PROPOSED 15 760.5 0.76 2,400 1825 1825 NONE PROPOSED 0 - - - - -$ 0 0 0 0 0 0 0
402Ocean
Elementary School
010 302 42W CFL 3 126.0 0.13 2,400 302 60.48$ NONE PROPOSED 3 126.0 0.13 2,400 302 302 NONE PROPOSED 0 - - - - -$ 0 0 0 0 0 0 0
403Ocean
Elementary School
010 302 2X2 Troffers/2-T8 Lamps/Electronic Ballasts 2 110.0 0.11 2,400 264 52.80$ NONE PROPOSED 2 110.0 0.11 2,400 264 264 NONE PROPOSED 0 - - - - -$ 0 0 0 0 0 0 0
404Ocean
Elementary School
010 303 2X4 Troffers/3-T8 Lamps/Electronic Ballasts 15 1320.0 1.32 2,400 3,168 633.60$ NONE PROPOSED 15 1320.0 1.32 2,400 3168 3168 NONE PROPOSED 0 - - - - -$ 0 0 0 0 0 0 0
405Ocean
Elementary School
010 304 2X4 Troffers/3-T8 Lamps/Electronic Ballasts 12 1056.0 1.06 2,400 2,534 506.88$ NONE PROPOSED 12 1056.0 1.06 2,400 2534 2534 NONE PROPOSED 0 - - - - -$ 0 0 0 0 0 0 0
406Ocean
Elementary School
010 305 2X4 Troffers/2-T8 Lamps/Electronic Ballasts 15 760.5 0.76 2,400 1,825 365.04$ NONE PROPOSED 15 760.5 0.76 2,400 1825 1825 NONE PROPOSED 0 - - - - -$ 0 0 0 0 0 0 0
407Ocean
Elementary School
010 Administration Office 2X4 Troffers/4-T8 Lamps/Electronic Ballasts 18 2016.0 2.02 2,400 4,838 967.68$ NONE PROPOSED 18 2016.0 2.02 2,400 4838 4838 NONE PROPOSED 0 - - - - -$ 0 0 0 0 0 0 0
408Ocean
Elementary School
010 Administration Office 2X2 Troffers/2-T8 Lamps/Electronic Ballasts 4 220.0 0.22 2,400 528 105.60$ NONE PROPOSED 4 220.0 0.22 2,400 528 528 NONE PROPOSED 0 - - - - -$ 0 0 0 0 0 0 0
409Ocean
Elementary School
010 Bathroom 2X2 Troffers/2-T8 Lamps/Electronic Ballasts 3 165.0 0.17 2,400 396 79.20$ NONE PROPOSED 3 165.0 0.17 2,400 396 396 NONE PROPOSED 0 - - - - -$ 0 0 0 0 0 0 0
410Ocean
Elementary School
010 Bathroom 42W CFL 1 42.0 0.04 2,400 101 20.16$ NONE PROPOSED 1 42.0 0.04 2,400 101 101 NONE PROPOSED 0 - - - - -$ 0 0 0 0 0 0 0
411Ocean
Elementary School
010 Boiler 1X4 Fixtures/2-T8 Lamps/Electronic Ballasts 20 1014.0 1.01 2,400 2,434 486.72$ NONE PROPOSED 20 1014.0 1.01 2,400 2434 2434 NONE PROPOSED 0 - - - - -$ 0 0 0 0 0 0 0
412Ocean
Elementary School
010 Boy's Bathroom 42W CFL 1 42.0 0.04 2,400 101 20.16$ NONE PROPOSED 1 42.0 0.04 2,400 101 101 NONE PROPOSED 0 - - - - -$ 0 0 0 0 0 0 0
413Ocean
Elementary School
010 Boy's Bathroom 2X2 Troffers/2-T8 Lamps/Electronic Ballasts 3 165.0 0.17 2,400 396 79.20$ NONE PROPOSED 3 165.0 0.17 2,400 396 396 NONE PROPOSED 0 - - - - -$ 0 0 0 0 0 0 0
414Ocean
Elementary School
010 Boy's Bathroom 2X2 Troffers/2-T8 Lamps/Electronic Ballasts 1 55.0 0.06 2,400 132 26.40$ NONE PROPOSED 1 55.0 0.06 2,400 132 132 NONE PROPOSED 0 - - - - -$ 0 0 0 0 0 0 0
415Ocean
Elementary School
010 Boy's Locker Room 2X4 Troffers/2-T8 Lamps/Electronic Ballasts 3 152.1 0.15 2,400 365 73.01$ NONE PROPOSED 3 152.1 0.15 2,400 365 365 NONE PROPOSED 0 - - - - -$ 0 0 0 0 0 0 0
416Ocean
Elementary School
010 Boy's Locker Room 2X2 Troffers/2-T8 Lamps/Electronic Ballasts 1 55.0 0.06 2,400 132 26.40$ NONE PROPOSED 1 55.0 0.06 2,400 132 132 NONE PROPOSED 0 - - - - -$ 0 0 0 0 0 0 0
417Ocean
Elementary School
010 Cafeteria 400W Metal Halide Fixtures 20 9160.0 9.16 2,400 21,984 4,396.80$ Replace Metal Halide Fixtures with 6-Lamp Fluorescent Highbay Fixtures 20 4520.0 4.52 2,400 10848 10848 NONE PROPOSED 0 11,136 - 4.64 11,136 2,227.20$ 168 105 15 0 0 288 5760
418Ocean
Elementary School
010 CST 2X4 Troffers/4-T8 Lamps/Electronic Ballasts 10 1120.0 1.12 2,400 2,688 537.60$ NONE PROPOSED 10 1120.0 1.12 2,400 2688 2688 NONE PROPOSED 0 - - - - -$ 0 0 0 0 0 0 0
419Ocean
Elementary School
010 Electrical Room 1X4 Fixtures/2-T8 Lamps/Electronic Ballasts 2 101.4 0.10 2,400 243 48.67$ NONE PROPOSED 2 101.4 0.10 2,400 243 243 NONE PROPOSED 0 - - - - -$ 0 0 0 0 0 0 0
420Ocean
Elementary School
010 Faculty Dining 2X4 Troffers/3-T8 Lamps/Electronic Ballasts 7 616.0 0.62 2,400 1,478 295.68$ NONE PROPOSED 7 616.0 0.62 2,400 1478 1478 NONE PROPOSED 0 - - - - -$ 0 0 0 0 0 0 0
421Ocean
Elementary School
010 Faculty Dining 42W CFL 2 84.0 0.08 2,400 202 40.32$ NONE PROPOSED 2 84.0 0.08 2,400 202 202 NONE PROPOSED 0 - - - - -$ 0 0 0 0 0 0 0
422Ocean
Elementary School
010 Girl's Bathroom 42W CFL 1 42.0 0.04 2,400 101 20.16$ NONE PROPOSED 1 42.0 0.04 2,400 101 101 NONE PROPOSED 0 - - - - -$ 0 0 0 0 0 0 0
423Ocean
Elementary School
010 Girl's Bathroom 2X2 Troffers/2-T8 Lamps/Electronic Ballasts 3 165.0 0.17 2,400 396 79.20$ NONE PROPOSED 3 165.0 0.17 2,400 396 396 NONE PROPOSED 0 - - - - -$ 0 0 0 0 0 0 0
424Ocean
Elementary School
010 Girl's Bathroom 2X2 Troffers/2-T8 Lamps/Electronic Ballasts 3 165.0 0.17 2,400 396 79.20$ NONE PROPOSED 3 165.0 0.17 2,400 396 396 NONE PROPOSED 0 - - - - -$ 0 0 0 0 0 0 0
425Ocean
Elementary School
010 Girl's Locker Room 2X4 Troffers/2-T8 Lamps/Electronic Ballasts 3 152.1 0.15 2,400 365 73.01$ NONE PROPOSED 3 152.1 0.15 2,400 365 365 NONE PROPOSED 0 - - - - -$ 0 0 0 0 0 0 0
426Ocean
Elementary School
010 Girl's Locker Room 2X2 Troffers/2-T8 Lamps/Electronic Ballasts 1 55.0 0.06 2,400 132 26.40$ NONE PROPOSED 1 55.0 0.06 2,400 132 132 NONE PROPOSED 0 - - - - -$ 0 0 0 0 0 0 0
427Ocean
Elementary School
010 Gym 400W Metal Halide Fixtures 24 10992.0 10.99 2,400 26,381 5,276.16$ Replace Metal Halide Fixtures with 6-Lamp Fluorescent Highbay Fixtures 24 5424.0 5.42 2,400 13018 13018 NONE PROPOSED 0 13,363 - 5.57 13,363 2,672.64$ 168 105 15 0 0 288 6912
428Ocean
Elementary School
010 Hallway 2X4 Troffers/2-T8 Lamps/Electronic Ballasts 23 1166.1 1.17 2,400 2,799 559.73$ NONE PROPOSED 23 1166.1 1.17 2,400 2799 2799 NONE PROPOSED 0 - - - - -$ 0 0 0 0 0 0 0
429Ocean
Elementary School
010 Hallway 42W CFL 78 3276.0 3.28 2,400 7,862 1,572.48$ NONE PROPOSED 78 3276.0 3.28 2,400 7862 7862 NONE PROPOSED 0 - - - - -$ 0 0 0 0 0 0 0
430Ocean
Elementary School
010 Hallway Unidentifiable 4 0.0 0.00 2,400 0 -$ NONE PROPOSED 4 0.0 0.00 2,400 0 0 NONE PROPOSED 0 - - - - -$ 0 0 0 0 0 0 0
10
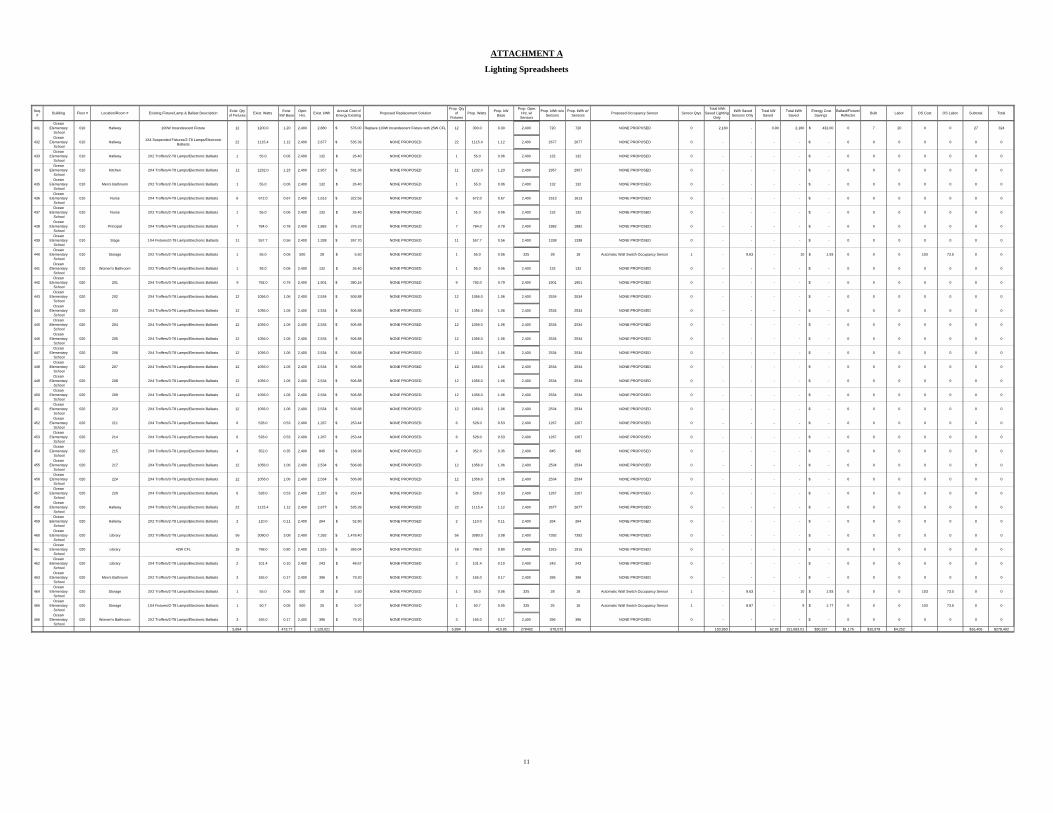
ATTACHMENT A
Lighting Spreadsheets
Seq. # Building Floor # Location/Room # Existing Fixture/Lamp & Ballast Description Exist. Qty
of Fixtures Exist. Watts Exist. kW Base
Oper. Hrs. Exist. kWh Annual Cost of
Energy Existing Proposed Replacement SolutionProp. Qty
of Fixtures
Prop. Watts Prop. kW Base
Prop. Oper. Hrs. w/ Sensors
Prop. kWh w/o Sensors
Prop. kWh w/ Sensors Proposed Occupancy Sensor Sensor Qtys
Total kWh Saved Lighting
Only
kWh Saved Sensors Only
Total kW Saved
Total kWh Saved
Energy Cost Savings
Ballast/Fixture/Reflector Bulb Labor OS Cost OS Labor Subtotal Total
431Ocean
Elementary School
010 Hallway 100W Incandescent Fixture 12 1200.0 1.20 2,400 2,880 576.00$ Replace 100W Incandescent Fixture with 25W CFL 12 300.0 0.30 2,400 720 720 NONE PROPOSED 0 2,160 - 0.90 2,160 432.00$ 0 7 20 0 0 27 324
432Ocean
Elementary School
010 Hallway 1X4 Suspended Fixtures/2-T8 Lamps/Electronic Ballasts 22 1115.4 1.12 2,400 2,677 535.39$ NONE PROPOSED 22 1115.4 1.12 2,400 2677 2677 NONE PROPOSED 0 - - - - -$ 0 0 0 0 0 0 0
433Ocean
Elementary School
010 Hallway 2X2 Troffers/2-T8 Lamps/Electronic Ballasts 1 55.0 0.06 2,400 132 26.40$ NONE PROPOSED 1 55.0 0.06 2,400 132 132 NONE PROPOSED 0 - - - - -$ 0 0 0 0 0 0 0
434Ocean
Elementary School
010 Kitchen 2X4 Troffers/4-T8 Lamps/Electronic Ballasts 11 1232.0 1.23 2,400 2,957 591.36$ NONE PROPOSED 11 1232.0 1.23 2,400 2957 2957 NONE PROPOSED 0 - - - - -$ 0 0 0 0 0 0 0
435Ocean
Elementary School
010 Men's Bathroom 2X2 Troffers/2-T8 Lamps/Electronic Ballasts 1 55.0 0.06 2,400 132 26.40$ NONE PROPOSED 1 55.0 0.06 2,400 132 132 NONE PROPOSED 0 - - - - -$ 0 0 0 0 0 0 0
436Ocean
Elementary School
010 Nurse 2X4 Troffers/4-T8 Lamps/Electronic Ballasts 6 672.0 0.67 2,400 1,613 322.56$ NONE PROPOSED 6 672.0 0.67 2,400 1613 1613 NONE PROPOSED 0 - - - - -$ 0 0 0 0 0 0 0
437Ocean
Elementary School
010 Nurse 2X2 Troffers/2-T8 Lamps/Electronic Ballasts 1 55.0 0.06 2,400 132 26.40$ NONE PROPOSED 1 55.0 0.06 2,400 132 132 NONE PROPOSED 0 - - - - -$ 0 0 0 0 0 0 0
438Ocean
Elementary School
010 Principal 2X4 Troffers/4-T8 Lamps/Electronic Ballasts 7 784.0 0.78 2,400 1,882 376.32$ NONE PROPOSED 7 784.0 0.78 2,400 1882 1882 NONE PROPOSED 0 - - - - -$ 0 0 0 0 0 0 0
439Ocean
Elementary School
010 Stage 1X4 Fixtures/2-T8 Lamps/Electronic Ballasts 11 557.7 0.56 2,400 1,338 267.70$ NONE PROPOSED 11 557.7 0.56 2,400 1338 1338 NONE PROPOSED 0 - - - - -$ 0 0 0 0 0 0 0
440Ocean
Elementary School
010 Storage 2X2 Troffers/2-T8 Lamps/Electronic Ballasts 1 55.0 0.06 500 28 5.50$ NONE PROPOSED 1 55.0 0.06 325 28 18 Automatic Wall Switch Occupancy Sensor 1 - 9.63 - 10 1.93$ 0 0 0 103 73.5 0 0
441Ocean
Elementary School
010 Women's Bathroom 2X2 Troffers/2-T8 Lamps/Electronic Ballasts 1 55.0 0.06 2,400 132 26.40$ NONE PROPOSED 1 55.0 0.06 2,400 132 132 NONE PROPOSED 0 - - - - -$ 0 0 0 0 0 0 0
442Ocean
Elementary School
020 201 2X4 Troffers/3-T8 Lamps/Electronic Ballasts 9 792.0 0.79 2,400 1,901 380.16$ NONE PROPOSED 9 792.0 0.79 2,400 1901 1901 NONE PROPOSED 0 - - - - -$ 0 0 0 0 0 0 0
443Ocean
Elementary School
020 202 2X4 Troffers/3-T8 Lamps/Electronic Ballasts 12 1056.0 1.06 2,400 2,534 506.88$ NONE PROPOSED 12 1056.0 1.06 2,400 2534 2534 NONE PROPOSED 0 - - - - -$ 0 0 0 0 0 0 0
444Ocean
Elementary School
020 203 2X4 Troffers/3-T8 Lamps/Electronic Ballasts 12 1056.0 1.06 2,400 2,534 506.88$ NONE PROPOSED 12 1056.0 1.06 2,400 2534 2534 NONE PROPOSED 0 - - - - -$ 0 0 0 0 0 0 0
445Ocean
Elementary School
020 204 2X4 Troffers/3-T8 Lamps/Electronic Ballasts 12 1056.0 1.06 2,400 2,534 506.88$ NONE PROPOSED 12 1056.0 1.06 2,400 2534 2534 NONE PROPOSED 0 - - - - -$ 0 0 0 0 0 0 0
446Ocean
Elementary School
020 205 2X4 Troffers/3-T8 Lamps/Electronic Ballasts 12 1056.0 1.06 2,400 2,534 506.88$ NONE PROPOSED 12 1056.0 1.06 2,400 2534 2534 NONE PROPOSED 0 - - - - -$ 0 0 0 0 0 0 0
447Ocean
Elementary School
020 206 2X4 Troffers/3-T8 Lamps/Electronic Ballasts 12 1056.0 1.06 2,400 2,534 506.88$ NONE PROPOSED 12 1056.0 1.06 2,400 2534 2534 NONE PROPOSED 0 - - - - -$ 0 0 0 0 0 0 0
448Ocean
Elementary School
020 207 2X4 Troffers/3-T8 Lamps/Electronic Ballasts 12 1056.0 1.06 2,400 2,534 506.88$ NONE PROPOSED 12 1056.0 1.06 2,400 2534 2534 NONE PROPOSED 0 - - - - -$ 0 0 0 0 0 0 0
449Ocean
Elementary School
020 208 2X4 Troffers/3-T8 Lamps/Electronic Ballasts 12 1056.0 1.06 2,400 2,534 506.88$ NONE PROPOSED 12 1056.0 1.06 2,400 2534 2534 NONE PROPOSED 0 - - - - -$ 0 0 0 0 0 0 0
450Ocean
Elementary School
020 209 2X4 Troffers/3-T8 Lamps/Electronic Ballasts 12 1056.0 1.06 2,400 2,534 506.88$ NONE PROPOSED 12 1056.0 1.06 2,400 2534 2534 NONE PROPOSED 0 - - - - -$ 0 0 0 0 0 0 0
451Ocean
Elementary School
020 210 2X4 Troffers/3-T8 Lamps/Electronic Ballasts 12 1056.0 1.06 2,400 2,534 506.88$ NONE PROPOSED 12 1056.0 1.06 2,400 2534 2534 NONE PROPOSED 0 - - - - -$ 0 0 0 0 0 0 0
452Ocean
Elementary School
020 211 2X4 Troffers/3-T8 Lamps/Electronic Ballasts 6 528.0 0.53 2,400 1,267 253.44$ NONE PROPOSED 6 528.0 0.53 2,400 1267 1267 NONE PROPOSED 0 - - - - -$ 0 0 0 0 0 0 0
453Ocean
Elementary School
020 214 2X4 Troffers/3-T8 Lamps/Electronic Ballasts 6 528.0 0.53 2,400 1,267 253.44$ NONE PROPOSED 6 528.0 0.53 2,400 1267 1267 NONE PROPOSED 0 - - - - -$ 0 0 0 0 0 0 0
454Ocean
Elementary School
020 215 2X4 Troffers/3-T8 Lamps/Electronic Ballasts 4 352.0 0.35 2,400 845 168.96$ NONE PROPOSED 4 352.0 0.35 2,400 845 845 NONE PROPOSED 0 - - - - -$ 0 0 0 0 0 0 0
455Ocean
Elementary School
020 217 2X4 Troffers/3-T8 Lamps/Electronic Ballasts 12 1056.0 1.06 2,400 2,534 506.88$ NONE PROPOSED 12 1056.0 1.06 2,400 2534 2534 NONE PROPOSED 0 - - - - -$ 0 0 0 0 0 0 0
456Ocean
Elementary School
020 224 2X4 Troffers/3-T8 Lamps/Electronic Ballasts 12 1056.0 1.06 2,400 2,534 506.88$ NONE PROPOSED 12 1056.0 1.06 2,400 2534 2534 NONE PROPOSED 0 - - - - -$ 0 0 0 0 0 0 0
457Ocean
Elementary School
020 229 2X4 Troffers/3-T8 Lamps/Electronic Ballasts 6 528.0 0.53 2,400 1,267 253.44$ NONE PROPOSED 6 528.0 0.53 2,400 1267 1267 NONE PROPOSED 0 - - - - -$ 0 0 0 0 0 0 0
458Ocean
Elementary School
020 Hallway 2X4 Troffers/2-T8 Lamps/Electronic Ballasts 22 1115.4 1.12 2,400 2,677 535.39$ NONE PROPOSED 22 1115.4 1.12 2,400 2677 2677 NONE PROPOSED 0 - - - - -$ 0 0 0 0 0 0 0
459Ocean
Elementary School
020 Hallway 2X2 Troffers/2-T8 Lamps/Electronic Ballasts 2 110.0 0.11 2,400 264 52.80$ NONE PROPOSED 2 110.0 0.11 2,400 264 264 NONE PROPOSED 0 - - - - -$ 0 0 0 0 0 0 0
460Ocean
Elementary School
020 Library 2X2 Troffers/2-T8 Lamps/Electronic Ballasts 56 3080.0 3.08 2,400 7,392 1,478.40$ NONE PROPOSED 56 3080.0 3.08 2,400 7392 7392 NONE PROPOSED 0 - - - - -$ 0 0 0 0 0 0 0
461Ocean
Elementary School
020 Library 42W CFL 19 798.0 0.80 2,400 1,915 383.04$ NONE PROPOSED 19 798.0 0.80 2,400 1915 1915 NONE PROPOSED 0 - - - - -$ 0 0 0 0 0 0 0
462Ocean
Elementary School
020 Library 2X4 Troffers/2-T8 Lamps/Electronic Ballasts 2 101.4 0.10 2,400 243 48.67$ NONE PROPOSED 2 101.4 0.10 2,400 243 243 NONE PROPOSED 0 - - - - -$ 0 0 0 0 0 0 0
463Ocean
Elementary School
020 Men's Bathroom 2X2 Troffers/2-T8 Lamps/Electronic Ballasts 3 165.0 0.17 2,400 396 79.20$ NONE PROPOSED 3 165.0 0.17 2,400 396 396 NONE PROPOSED 0 - - - - -$ 0 0 0 0 0 0 0
464Ocean
Elementary School
020 Storage 2X2 Troffers/2-T8 Lamps/Electronic Ballasts 1 55.0 0.06 500 28 5.50$ NONE PROPOSED 1 55.0 0.06 325 28 18 Automatic Wall Switch Occupancy Sensor 1 - 9.63 - 10 1.93$ 0 0 0 103 73.5 0 0
465Ocean
Elementary School
020 Storage 1X4 Fixtures/2-T8 Lamps/Electronic Ballasts 1 50.7 0.05 500 25 5.07$ NONE PROPOSED 1 50.7 0.05 325 25 16 Automatic Wall Switch Occupancy Sensor 1 - 8.87 - 9 1.77$ 0 0 0 103 73.5 0 0
466Ocean
Elementary School
020 Women's Bathroom 2X2 Troffers/2-T8 Lamps/Electronic Ballasts 3 165.0 0.17 2,400 396 79.20$ NONE PROPOSED 3 165.0 0.17 2,400 396 396 NONE PROPOSED 0 - - - - -$ 0 0 0 0 0 0 0
5,894 473.77 1,129,021 5,894 410.85 278402 978,072 150,950 62.92 151,683.01 $30,337 $1,176 $10,978 $4,252 $16,406 $278,402
11

APPENDIX D
OPTION 2 – NO LED
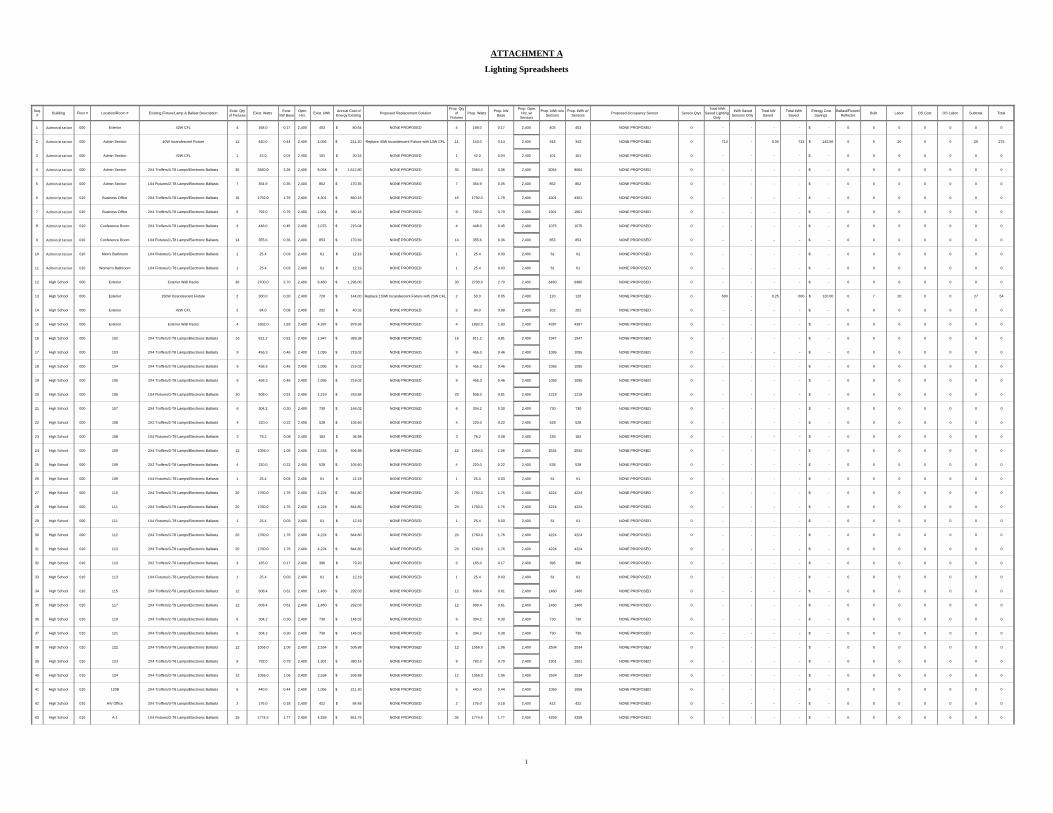
ATTACHMENT A
Lighting Spreadsheets
Seq. # Building Floor # Location/Room # Existing Fixture/Lamp & Ballast Description Exist. Qty
of Fixtures Exist. Watts Exist. kW Base
Oper. Hrs. Exist. kWh Annual Cost of
Energy Existing Proposed Replacement SolutionProp. Qty
of Fixtures
Prop. Watts Prop. kW Base
Prop. Oper. Hrs. w/ Sensors
Prop. kWh w/o Sensors
Prop. kWh w/ Sensors Proposed Occupancy Sensor Sensor Qtys
Total kWh Saved Lighting
Only
kWh Saved Sensors Only
Total kW Saved
Total kWh Saved
Energy Cost Savings
Ballast/Fixture/Reflector Bulb Labor OS Cost OS Labor Subtotal Total
1 Administration 000 Exterior 42W CFL 4 168.0 0.17 2,400 403 80.64$ NONE PROPOSED 4 168.0 0.17 2,400 403 403 NONE PROPOSED 0 - - - - -$ 0 0 0 0 0 0 0
2 Administration 000 Admin Section 40W Incandescent Fixture 11 440.0 0.44 2,400 1,056 211.20$ Replace 40W Incandescent Fixture with 13W CFL 11 143.0 0.14 2,400 343 343 NONE PROPOSED 0 713 - 0.30 713 142.56$ 0 5 20 0 0 25 275
3 Administration 000 Admin Section 42W CFL 1 42.0 0.04 2,400 101 20.16$ NONE PROPOSED 1 42.0 0.04 2,400 101 101 NONE PROPOSED 0 - - - - -$ 0 0 0 0 0 0 0
4 Administration 000 Admin Section 2X4 Troffers/4-T8 Lamps/Electronic Ballasts 30 3360.0 3.36 2,400 8,064 1,612.80$ NONE PROPOSED 30 3360.0 3.36 2,400 8064 8064 NONE PROPOSED 0 - - - - -$ 0 0 0 0 0 0 0
5 Administration 000 Admin Section 1X4 Fixtures/2-T8 Lamps/Electronic Ballasts 7 354.9 0.35 2,400 852 170.35$ NONE PROPOSED 7 354.9 0.35 2,400 852 852 NONE PROPOSED 0 - - - - -$ 0 0 0 0 0 0 0
6 Administration 010 Business Office 2X4 Troffers/4-T8 Lamps/Electronic Ballasts 16 1792.0 1.79 2,400 4,301 860.16$ NONE PROPOSED 16 1792.0 1.79 2,400 4301 4301 NONE PROPOSED 0 - - - - -$ 0 0 0 0 0 0 0
7 Administration 010 Business Office 2X4 Troffers/3-T8 Lamps/Electronic Ballasts 9 792.0 0.79 2,400 1,901 380.16$ NONE PROPOSED 9 792.0 0.79 2,400 1901 1901 NONE PROPOSED 0 - - - - -$ 0 0 0 0 0 0 0
8 Administration 010 Conference Room 2X4 Troffers/4-T8 Lamps/Electronic Ballasts 4 448.0 0.45 2,400 1,075 215.04$ NONE PROPOSED 4 448.0 0.45 2,400 1075 1075 NONE PROPOSED 0 - - - - -$ 0 0 0 0 0 0 0
9 Administration 010 Conference Room 1X4 Fixtures/1-T8 Lamps/Electronic Ballasts 14 355.6 0.36 2,400 853 170.69$ NONE PROPOSED 14 355.6 0.36 2,400 853 853 NONE PROPOSED 0 - - - - -$ 0 0 0 0 0 0 0
10 Administration 010 Men's Bathroom 1X4 Fixtures/1-T8 Lamps/Electronic Ballasts 1 25.4 0.03 2,400 61 12.19$ NONE PROPOSED 1 25.4 0.03 2,400 61 61 NONE PROPOSED 0 - - - - -$ 0 0 0 0 0 0 0
11 Administration 010 Women's Bathroom 1X4 Fixtures/1-T8 Lamps/Electronic Ballasts 1 25.4 0.03 2,400 61 12.19$ NONE PROPOSED 1 25.4 0.03 2,400 61 61 NONE PROPOSED 0 - - - - -$ 0 0 0 0 0 0 0
12 High School 000 Exterior Exterior Wall Packs 30 2700.0 2.70 2,400 6,480 1,296.00$ NONE PROPOSED 30 2700.0 2.70 2,400 6480 6480 NONE PROPOSED 0 - - - - -$ 0 0 0 0 0 0 0
13 High School 000 Exterior 150W Incandescent Fixture 2 300.0 0.30 2,400 720 144.00$ Replace 150W Incandescent Fixture with 25W CFL 2 50.0 0.05 2,400 120 120 NONE PROPOSED 0 600 - 0.25 600 120.00$ 0 7 20 0 0 27 54
14 High School 000 Exterior 42W CFL 2 84.0 0.08 2,400 202 40.32$ NONE PROPOSED 2 84.0 0.08 2,400 202 202 NONE PROPOSED 0 - - - - -$ 0 0 0 0 0 0 0
15 High School 000 Exterior Exterior Wall Packs 4 1832.0 1.83 2,400 4,397 879.36$ NONE PROPOSED 4 1832.0 1.83 2,400 4397 4397 NONE PROPOSED 0 - - - - -$ 0 0 0 0 0 0 0
16 High School 000 102 2X4 Troffers/2-T8 Lamps/Electronic Ballasts 16 811.2 0.81 2,400 1,947 389.38$ NONE PROPOSED 16 811.2 0.81 2,400 1947 1947 NONE PROPOSED 0 - - - - -$ 0 0 0 0 0 0 0
17 High School 000 103 2X4 Troffers/2-T8 Lamps/Electronic Ballasts 9 456.3 0.46 2,400 1,095 219.02$ NONE PROPOSED 9 456.3 0.46 2,400 1095 1095 NONE PROPOSED 0 - - - - -$ 0 0 0 0 0 0 0
18 High School 000 104 2X4 Troffers/2-T8 Lamps/Electronic Ballasts 9 456.3 0.46 2,400 1,095 219.02$ NONE PROPOSED 9 456.3 0.46 2,400 1095 1095 NONE PROPOSED 0 - - - - -$ 0 0 0 0 0 0 0
19 High School 000 105 2X4 Troffers/2-T8 Lamps/Electronic Ballasts 9 456.3 0.46 2,400 1,095 219.02$ NONE PROPOSED 9 456.3 0.46 2,400 1095 1095 NONE PROPOSED 0 - - - - -$ 0 0 0 0 0 0 0
20 High School 000 106 1X4 Fixtures/1-T8 Lamps/Electronic Ballasts 20 508.0 0.51 2,400 1,219 243.84$ NONE PROPOSED 20 508.0 0.51 2,400 1219 1219 NONE PROPOSED 0 - - - - -$ 0 0 0 0 0 0 0
21 High School 000 107 2X4 Troffers/2-T8 Lamps/Electronic Ballasts 6 304.2 0.30 2,400 730 146.02$ NONE PROPOSED 6 304.2 0.30 2,400 730 730 NONE PROPOSED 0 - - - - -$ 0 0 0 0 0 0 0
22 High School 000 108 2X2 Troffers/2-T8 Lamps/Electronic Ballasts 4 220.0 0.22 2,400 528 105.60$ NONE PROPOSED 4 220.0 0.22 2,400 528 528 NONE PROPOSED 0 - - - - -$ 0 0 0 0 0 0 0
23 High School 000 108 1X4 Fixtures/1-T8 Lamps/Electronic Ballasts 3 76.2 0.08 2,400 183 36.58$ NONE PROPOSED 3 76.2 0.08 2,400 183 183 NONE PROPOSED 0 - - - - -$ 0 0 0 0 0 0 0
24 High School 000 109 2X4 Troffers/3-T8 Lamps/Electronic Ballasts 12 1056.0 1.06 2,400 2,534 506.88$ NONE PROPOSED 12 1056.0 1.06 2,400 2534 2534 NONE PROPOSED 0 - - - - -$ 0 0 0 0 0 0 0
25 High School 000 109 2X2 Troffers/2-T8 Lamps/Electronic Ballasts 4 220.0 0.22 2,400 528 105.60$ NONE PROPOSED 4 220.0 0.22 2,400 528 528 NONE PROPOSED 0 - - - - -$ 0 0 0 0 0 0 0
26 High School 000 109 1X4 Fixtures/1-T8 Lamps/Electronic Ballasts 1 25.4 0.03 2,400 61 12.19$ NONE PROPOSED 1 25.4 0.03 2,400 61 61 NONE PROPOSED 0 - - - - -$ 0 0 0 0 0 0 0
27 High School 000 110 2X4 Troffers/3-T8 Lamps/Electronic Ballasts 20 1760.0 1.76 2,400 4,224 844.80$ NONE PROPOSED 20 1760.0 1.76 2,400 4224 4224 NONE PROPOSED 0 - - - - -$ 0 0 0 0 0 0 0
28 High School 000 111 2X4 Troffers/3-T8 Lamps/Electronic Ballasts 20 1760.0 1.76 2,400 4,224 844.80$ NONE PROPOSED 20 1760.0 1.76 2,400 4224 4224 NONE PROPOSED 0 - - - - -$ 0 0 0 0 0 0 0
29 High School 000 111 1X4 Fixtures/1-T8 Lamps/Electronic Ballasts 1 25.4 0.03 2,400 61 12.19$ NONE PROPOSED 1 25.4 0.03 2,400 61 61 NONE PROPOSED 0 - - - - -$ 0 0 0 0 0 0 0
30 High School 000 112 2X4 Troffers/3-T8 Lamps/Electronic Ballasts 20 1760.0 1.76 2,400 4,224 844.80$ NONE PROPOSED 20 1760.0 1.76 2,400 4224 4224 NONE PROPOSED 0 - - - - -$ 0 0 0 0 0 0 0
31 High School 010 113 2X4 Troffers/3-T8 Lamps/Electronic Ballasts 20 1760.0 1.76 2,400 4,224 844.80$ NONE PROPOSED 20 1760.0 1.76 2,400 4224 4224 NONE PROPOSED 0 - - - - -$ 0 0 0 0 0 0 0
32 High School 010 113 2X2 Troffers/2-T8 Lamps/Electronic Ballasts 3 165.0 0.17 2,400 396 79.20$ NONE PROPOSED 3 165.0 0.17 2,400 396 396 NONE PROPOSED 0 - - - - -$ 0 0 0 0 0 0 0
33 High School 010 113 1X4 Fixtures/1-T8 Lamps/Electronic Ballasts 1 25.4 0.03 2,400 61 12.19$ NONE PROPOSED 1 25.4 0.03 2,400 61 61 NONE PROPOSED 0 - - - - -$ 0 0 0 0 0 0 0
34 High School 010 115 2X4 Troffers/2-T8 Lamps/Electronic Ballasts 12 608.4 0.61 2,400 1,460 292.03$ NONE PROPOSED 12 608.4 0.61 2,400 1460 1460 NONE PROPOSED 0 - - - - -$ 0 0 0 0 0 0 0
35 High School 010 117 2X4 Troffers/2-T8 Lamps/Electronic Ballasts 12 608.4 0.61 2,400 1,460 292.03$ NONE PROPOSED 12 608.4 0.61 2,400 1460 1460 NONE PROPOSED 0 - - - - -$ 0 0 0 0 0 0 0
36 High School 010 119 2X4 Troffers/2-T8 Lamps/Electronic Ballasts 6 304.2 0.30 2,400 730 146.02$ NONE PROPOSED 6 304.2 0.30 2,400 730 730 NONE PROPOSED 0 - - - - -$ 0 0 0 0 0 0 0
37 High School 010 121 2X4 Troffers/2-T8 Lamps/Electronic Ballasts 6 304.2 0.30 2,400 730 146.02$ NONE PROPOSED 6 304.2 0.30 2,400 730 730 NONE PROPOSED 0 - - - - -$ 0 0 0 0 0 0 0
38 High School 010 122 2X4 Troffers/3-T8 Lamps/Electronic Ballasts 12 1056.0 1.06 2,400 2,534 506.88$ NONE PROPOSED 12 1056.0 1.06 2,400 2534 2534 NONE PROPOSED 0 - - - - -$ 0 0 0 0 0 0 0
39 High School 010 123 2X4 Troffers/3-T8 Lamps/Electronic Ballasts 9 792.0 0.79 2,400 1,901 380.16$ NONE PROPOSED 9 792.0 0.79 2,400 1901 1901 NONE PROPOSED 0 - - - - -$ 0 0 0 0 0 0 0
40 High School 010 124 2X4 Troffers/3-T8 Lamps/Electronic Ballasts 12 1056.0 1.06 2,400 2,534 506.88$ NONE PROPOSED 12 1056.0 1.06 2,400 2534 2534 NONE PROPOSED 0 - - - - -$ 0 0 0 0 0 0 0
41 High School 010 120B 2X4 Troffers/3-T8 Lamps/Electronic Ballasts 5 440.0 0.44 2,400 1,056 211.20$ NONE PROPOSED 5 440.0 0.44 2,400 1056 1056 NONE PROPOSED 0 - - - - -$ 0 0 0 0 0 0 0
42 High School 010 A/V Office 2X4 Troffers/3-T8 Lamps/Electronic Ballasts 2 176.0 0.18 2,400 422 84.48$ NONE PROPOSED 2 176.0 0.18 2,400 422 422 NONE PROPOSED 0 - - - - -$ 0 0 0 0 0 0 0
43 High School 010 A-1 1X4 Fixtures/2-T8 Lamps/Electronic Ballasts 35 1774.5 1.77 2,400 4,259 851.76$ NONE PROPOSED 35 1774.5 1.77 2,400 4259 4259 NONE PROPOSED 0 - - - - -$ 0 0 0 0 0 0 0
1
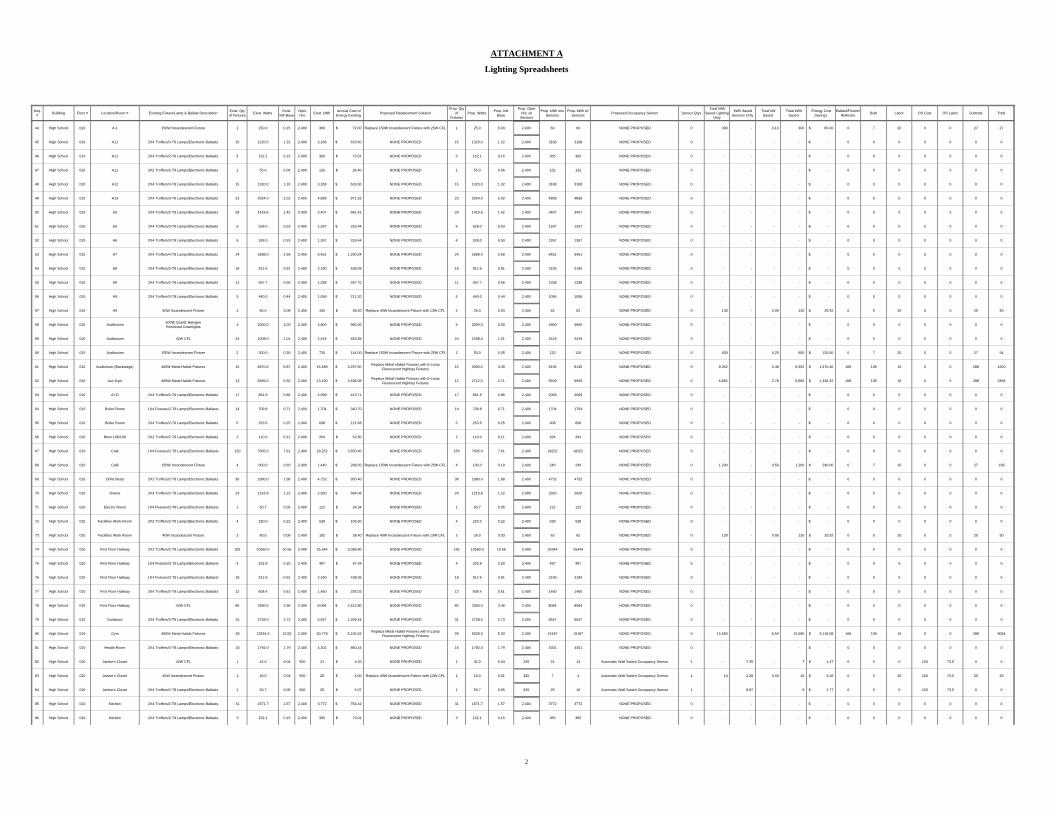
ATTACHMENT A
Lighting Spreadsheets
Seq. # Building Floor # Location/Room # Existing Fixture/Lamp & Ballast Description Exist. Qty
of Fixtures Exist. Watts Exist. kW Base
Oper. Hrs. Exist. kWh Annual Cost of
Energy Existing Proposed Replacement SolutionProp. Qty
of Fixtures
Prop. Watts Prop. kW Base
Prop. Oper. Hrs. w/ Sensors
Prop. kWh w/o Sensors
Prop. kWh w/ Sensors Proposed Occupancy Sensor Sensor Qtys
Total kWh Saved Lighting
Only
kWh Saved Sensors Only
Total kW Saved
Total kWh Saved
Energy Cost Savings
Ballast/Fixture/Reflector Bulb Labor OS Cost OS Labor Subtotal Total
44 High School 010 A-1 150W Incandescent Fixture 1 150.0 0.15 2,400 360 72.00$ Replace 150W Incandescent Fixture with 25W CFL 1 25.0 0.03 2,400 60 60 NONE PROPOSED 0 300 - 0.13 300 60.00$ 0 7 20 0 0 27 27
45 High School 010 A11 2X4 Troffers/3-T8 Lamps/Electronic Ballasts 15 1320.0 1.32 2,400 3,168 633.60$ NONE PROPOSED 15 1320.0 1.32 2,400 3168 3168 NONE PROPOSED 0 - - - - -$ 0 0 0 0 0 0 0
46 High School 010 A11 2X4 Troffers/2-T8 Lamps/Electronic Ballasts 3 152.1 0.15 2,400 365 73.01$ NONE PROPOSED 3 152.1 0.15 2,400 365 365 NONE PROPOSED 0 - - - - -$ 0 0 0 0 0 0 0
47 High School 010 A11 2X2 Troffers/2-T8 Lamps/Electronic Ballasts 1 55.0 0.06 2,400 132 26.40$ NONE PROPOSED 1 55.0 0.06 2,400 132 132 NONE PROPOSED 0 - - - - -$ 0 0 0 0 0 0 0
48 High School 010 A12 2X4 Troffers/3-T8 Lamps/Electronic Ballasts 15 1320.0 1.32 2,400 3,168 633.60$ NONE PROPOSED 15 1320.0 1.32 2,400 3168 3168 NONE PROPOSED 0 - - - - -$ 0 0 0 0 0 0 0
49 High School 010 A13 2X4 Troffers/3-T8 Lamps/Electronic Ballasts 23 2024.0 2.02 2,400 4,858 971.52$ NONE PROPOSED 23 2024.0 2.02 2,400 4858 4858 NONE PROPOSED 0 - - - - -$ 0 0 0 0 0 0 0
50 High School 010 A3 2X4 Troffers/2-T8 Lamps/Electronic Ballasts 28 1419.6 1.42 2,400 3,407 681.41$ NONE PROPOSED 28 1419.6 1.42 2,400 3407 3407 NONE PROPOSED 0 - - - - -$ 0 0 0 0 0 0 0
51 High School 010 A5 2X4 Troffers/3-T8 Lamps/Electronic Ballasts 6 528.0 0.53 2,400 1,267 253.44$ NONE PROPOSED 6 528.0 0.53 2,400 1267 1267 NONE PROPOSED 0 - - - - -$ 0 0 0 0 0 0 0
52 High School 010 A6 2X4 Troffers/3-T8 Lamps/Electronic Ballasts 6 528.0 0.53 2,400 1,267 253.44$ NONE PROPOSED 6 528.0 0.53 2,400 1267 1267 NONE PROPOSED 0 - - - - -$ 0 0 0 0 0 0 0
53 High School 010 A7 2X4 Troffers/4-T8 Lamps/Electronic Ballasts 24 2688.0 2.69 2,400 6,451 1,290.24$ NONE PROPOSED 24 2688.0 2.69 2,400 6451 6451 NONE PROPOSED 0 - - - - -$ 0 0 0 0 0 0 0
54 High School 010 A8 2X4 Troffers/2-T8 Lamps/Electronic Ballasts 18 912.6 0.91 2,400 2,190 438.05$ NONE PROPOSED 18 912.6 0.91 2,400 2190 2190 NONE PROPOSED 0 - - - - -$ 0 0 0 0 0 0 0
55 High School 010 A9 2X4 Troffers/2-T8 Lamps/Electronic Ballasts 11 557.7 0.56 2,400 1,338 267.70$ NONE PROPOSED 11 557.7 0.56 2,400 1338 1338 NONE PROPOSED 0 - - - - -$ 0 0 0 0 0 0 0
56 High School 010 A9 2X4 Troffers/3-T8 Lamps/Electronic Ballasts 5 440.0 0.44 2,400 1,056 211.20$ NONE PROPOSED 5 440.0 0.44 2,400 1056 1056 NONE PROPOSED 0 - - - - -$ 0 0 0 0 0 0 0
57 High School 010 A9 40W Incandescent Fixture 2 80.0 0.08 2,400 192 38.40$ Replace 40W Incandescent Fixture with 13W CFL 2 26.0 0.03 2,400 62 62 NONE PROPOSED 0 130 - 0.05 130 25.92$ 0 5 20 0 0 25 50
58 High School 010 Auditorium 500W Quartz Halogen Recessed Downlights 4 2000.0 2.00 2,400 4,800 960.00$ NONE PROPOSED 4 2000.0 2.00 2,400 4800 4800 NONE PROPOSED 0 - - - - -$ 0 0 0 0 0 0 0
59 High School 010 Auditorium 42W CFL 24 1008.0 1.01 2,400 2,419 483.84$ NONE PROPOSED 24 1008.0 1.01 2,400 2419 2419 NONE PROPOSED 0 - - - - -$ 0 0 0 0 0 0 0
60 High School 010 Auditorium 150W Incandescent Fixture 2 300.0 0.30 2,400 720 144.00$ Replace 150W Incandescent Fixture with 25W CFL 2 50.0 0.05 2,400 120 120 NONE PROPOSED 0 600 - 0.25 600 120.00$ 0 7 20 0 0 27 54
61 High School 010 Auditorium (Backstage) 400W Metal Halide Fixtures 15 6870.0 6.87 2,400 16,488 3,297.60$ Replace Metal Halide Fixtures with 6-Lamp Fluorescent Highbay Fixtures 15 3390.0 3.39 2,400 8136 8136 NONE PROPOSED 0 8,352 - 3.48 8,352 1,670.40$ 168 105 15 0 0 288 4320
62 High School 010 Aux Gym 400W Metal Halide Fixtures 12 5496.0 5.50 2,400 13,190 2,638.08$ Replace Metal Halide Fixtures with 6-Lamp Fluorescent Highbay Fixtures 12 2712.0 2.71 2,400 6509 6509 NONE PROPOSED 0 6,682 - 2.78 6,682 1,336.32$ 168 105 15 0 0 288 3456
63 High School 010 AYO 2X4 Troffers/2-T8 Lamps/Electronic Ballasts 17 861.9 0.86 2,400 2,069 413.71$ NONE PROPOSED 17 861.9 0.86 2,400 2069 2069 NONE PROPOSED 0 - - - - -$ 0 0 0 0 0 0 0
64 High School 010 Boiler Room 1X4 Fixtures/2-T8 Lamps/Electronic Ballasts 14 709.8 0.71 2,400 1,704 340.70$ NONE PROPOSED 14 709.8 0.71 2,400 1704 1704 NONE PROPOSED 0 - - - - -$ 0 0 0 0 0 0 0
65 High School 010 Boiler Room 2X4 Troffers/2-T8 Lamps/Electronic Ballasts 5 253.5 0.25 2,400 608 121.68$ NONE PROPOSED 5 253.5 0.25 2,400 608 608 NONE PROPOSED 0 - - - - -$ 0 0 0 0 0 0 0
66 High School 010 Btwn 106/108 2X2 Troffers/2-T8 Lamps/Electronic Ballasts 2 110.0 0.11 2,400 264 52.80$ NONE PROPOSED 2 110.0 0.11 2,400 264 264 NONE PROPOSED 0 - - - - -$ 0 0 0 0 0 0 0
67 High School 010 Café 1X4 Fixtures/2-T8 Lamps/Electronic Ballasts 150 7605.0 7.61 2,400 18,252 3,650.40$ NONE PROPOSED 150 7605.0 7.61 2,400 18252 18252 NONE PROPOSED 0 - - - - -$ 0 0 0 0 0 0 0
68 High School 010 Café 150W Incandescent Fixture 4 600.0 0.60 2,400 1,440 288.00$ Replace 150W Incandescent Fixture with 25W CFL 4 100.0 0.10 2,400 240 240 NONE PROPOSED 0 1,200 - 0.50 1,200 240.00$ 0 7 20 0 0 27 108
69 High School 010 Child Study 2X2 Troffers/2-T8 Lamps/Electronic Ballasts 36 1980.0 1.98 2,400 4,752 950.40$ NONE PROPOSED 36 1980.0 1.98 2,400 4752 4752 NONE PROPOSED 0 - - - - -$ 0 0 0 0 0 0 0
70 High School 010 Drama 2X4 Troffers/2-T8 Lamps/Electronic Ballasts 24 1216.8 1.22 2,400 2,920 584.06$ NONE PROPOSED 24 1216.8 1.22 2,400 2920 2920 NONE PROPOSED 0 - - - - -$ 0 0 0 0 0 0 0
71 High School 010 Electric Room 1X4 Fixtures/2-T8 Lamps/Electronic Ballasts 1 50.7 0.05 2,400 122 24.34$ NONE PROPOSED 1 50.7 0.05 2,400 122 122 NONE PROPOSED 0 - - - - -$ 0 0 0 0 0 0 0
72 High School 010 Facilities Work Room 2X2 Troffers/2-T8 Lamps/Electronic Ballasts 4 220.0 0.22 2,400 528 105.60$ NONE PROPOSED 4 220.0 0.22 2,400 528 528 NONE PROPOSED 0 - - - - -$ 0 0 0 0 0 0 0
73 High School 010 Facilities Work Room 40W Incandescent Fixture 2 80.0 0.08 2,400 192 38.40$ Replace 40W Incandescent Fixture with 13W CFL 2 26.0 0.03 2,400 62 62 NONE PROPOSED 0 130 - 0.05 130 25.92$ 0 5 20 0 0 25 50
74 High School 010 First Floor Hallway 2X2 Troffers/2-T8 Lamps/Electronic Ballasts 192 10560.0 10.56 2,400 25,344 5,068.80$ NONE PROPOSED 192 10560.0 10.56 2,400 25344 25344 NONE PROPOSED 0 - - - - -$ 0 0 0 0 0 0 0
75 High School 010 First Floor Hallway 1X4 Fixtures/2-T8 Lamps/Electronic Ballasts 4 202.8 0.20 2,400 487 97.34$ NONE PROPOSED 4 202.8 0.20 2,400 487 487 NONE PROPOSED 0 - - - - -$ 0 0 0 0 0 0 0
76 High School 010 First Floor Hallway 1X4 Fixtures/2-T8 Lamps/Electronic Ballasts 18 912.6 0.91 2,400 2,190 438.05$ NONE PROPOSED 18 912.6 0.91 2,400 2190 2190 NONE PROPOSED 0 - - - - -$ 0 0 0 0 0 0 0
77 High School 010 First Floor Hallway 2X4 Troffers/2-T8 Lamps/Electronic Ballasts 12 608.4 0.61 2,400 1,460 292.03$ NONE PROPOSED 12 608.4 0.61 2,400 1460 1460 NONE PROPOSED 0 - - - - -$ 0 0 0 0 0 0 0
78 High School 010 First Floor Hallway 42W CFL 80 3360.0 3.36 2,400 8,064 1,612.80$ NONE PROPOSED 80 3360.0 3.36 2,400 8064 8064 NONE PROPOSED 0 - - - - -$ 0 0 0 0 0 0 0
79 High School 010 Guidance 2X4 Troffers/3-T8 Lamps/Electronic Ballasts 31 2728.0 2.73 2,400 6,547 1,309.44$ NONE PROPOSED 31 2728.0 2.73 2,400 6547 6547 NONE PROPOSED 0 - - - - -$ 0 0 0 0 0 0 0
80 High School 010 Gym 400W Metal Halide Fixtures 28 12824.0 12.82 2,400 30,778 6,155.52$ Replace Metal Halide Fixtures with 6-Lamp Fluorescent Highbay Fixtures 28 6328.0 6.33 2,400 15187 15187 NONE PROPOSED 0 15,590 - 6.50 15,590 3,118.08$ 168 105 15 0 0 288 8064
81 High School 010 Health Room 2X4 Troffers/4-T8 Lamps/Electronic Ballasts 16 1792.0 1.79 2,400 4,301 860.16$ NONE PROPOSED 16 1792.0 1.79 2,400 4301 4301 NONE PROPOSED 0 - - - - -$ 0 0 0 0 0 0 0
82 High School 010 Janitor's Closet 42W CFL 1 42.0 0.04 500 21 4.20$ NONE PROPOSED 1 42.0 0.04 325 21 14 Automatic Wall Switch Occupancy Sensor 1 - 7.35 - 7 1.47$ 0 0 0 103 73.5 0 0
83 High School 010 Janitor's Closet 40W Incandescent Fixture 1 40.0 0.04 500 20 4.00$ Replace 40W Incandescent Fixture with 13W CFL 1 13.0 0.01 325 7 4 Automatic Wall Switch Occupancy Sensor 1 14 2.28 0.03 16 3.16$ 0 5 20 103 73.5 25 25
84 High School 010 Janitor's Closet 2X4 Troffers/2-T8 Lamps/Electronic Ballasts 1 50.7 0.05 500 25 5.07$ NONE PROPOSED 1 50.7 0.05 325 25 16 Automatic Wall Switch Occupancy Sensor 1 - 8.87 - 9 1.77$ 0 0 0 103 73.5 0 0
85 High School 010 Kitchen 2X4 Troffers/2-T8 Lamps/Electronic Ballasts 31 1571.7 1.57 2,400 3,772 754.42$ NONE PROPOSED 31 1571.7 1.57 2,400 3772 3772 NONE PROPOSED 0 - - - - -$ 0 0 0 0 0 0 0
86 High School 010 Kitchen 2X4 Troffers/2-T8 Lamps/Electronic Ballasts 3 152.1 0.15 2,400 365 73.01$ NONE PROPOSED 3 152.1 0.15 2,400 365 365 NONE PROPOSED 0 - - - - -$ 0 0 0 0 0 0 0
2
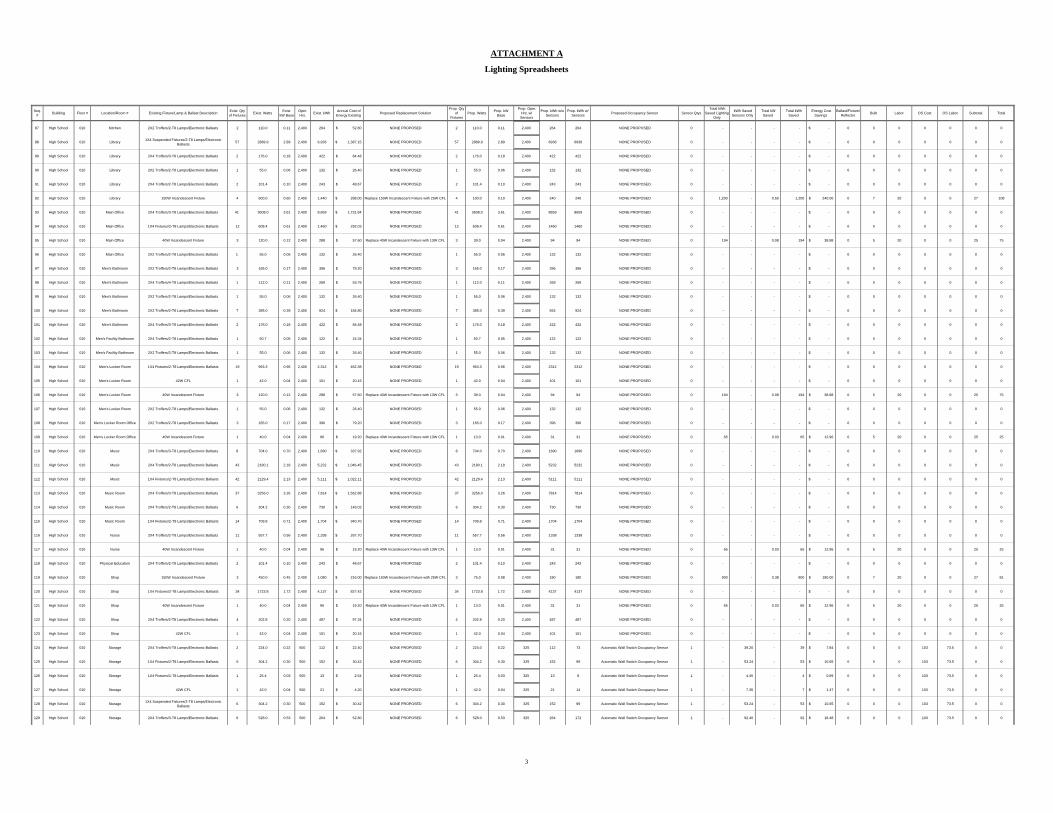
ATTACHMENT A
Lighting Spreadsheets
Seq. # Building Floor # Location/Room # Existing Fixture/Lamp & Ballast Description Exist. Qty
of Fixtures Exist. Watts Exist. kW Base
Oper. Hrs. Exist. kWh Annual Cost of
Energy Existing Proposed Replacement SolutionProp. Qty
of Fixtures
Prop. Watts Prop. kW Base
Prop. Oper. Hrs. w/ Sensors
Prop. kWh w/o Sensors
Prop. kWh w/ Sensors Proposed Occupancy Sensor Sensor Qtys
Total kWh Saved Lighting
Only
kWh Saved Sensors Only
Total kW Saved
Total kWh Saved
Energy Cost Savings
Ballast/Fixture/Reflector Bulb Labor OS Cost OS Labor Subtotal Total
87 High School 010 Kitchen 2X2 Troffers/2-T8 Lamps/Electronic Ballasts 2 110.0 0.11 2,400 264 52.80$ NONE PROPOSED 2 110.0 0.11 2,400 264 264 NONE PROPOSED 0 - - - - -$ 0 0 0 0 0 0 0
88 High School 010 Library 1X4 Suspended Fixtures/2-T8 Lamps/Electronic Ballasts 57 2889.9 2.89 2,400 6,936 1,387.15$ NONE PROPOSED 57 2889.9 2.89 2,400 6936 6936 NONE PROPOSED 0 - - - - -$ 0 0 0 0 0 0 0
89 High School 010 Library 2X4 Troffers/3-T8 Lamps/Electronic Ballasts 2 176.0 0.18 2,400 422 84.48$ NONE PROPOSED 2 176.0 0.18 2,400 422 422 NONE PROPOSED 0 - - - - -$ 0 0 0 0 0 0 0
90 High School 010 Library 2X2 Troffers/2-T8 Lamps/Electronic Ballasts 1 55.0 0.06 2,400 132 26.40$ NONE PROPOSED 1 55.0 0.06 2,400 132 132 NONE PROPOSED 0 - - - - -$ 0 0 0 0 0 0 0
91 High School 010 Library 2X4 Troffers/2-T8 Lamps/Electronic Ballasts 2 101.4 0.10 2,400 243 48.67$ NONE PROPOSED 2 101.4 0.10 2,400 243 243 NONE PROPOSED 0 - - - - -$ 0 0 0 0 0 0 0
92 High School 010 Library 150W Incandescent Fixture 4 600.0 0.60 2,400 1,440 288.00$ Replace 150W Incandescent Fixture with 25W CFL 4 100.0 0.10 2,400 240 240 NONE PROPOSED 0 1,200 - 0.50 1,200 240.00$ 0 7 20 0 0 27 108
93 High School 010 Main Office 2X4 Troffers/3-T8 Lamps/Electronic Ballasts 41 3608.0 3.61 2,400 8,659 1,731.84$ NONE PROPOSED 41 3608.0 3.61 2,400 8659 8659 NONE PROPOSED 0 - - - - -$ 0 0 0 0 0 0 0
94 High School 010 Main Office 1X4 Fixtures/2-T8 Lamps/Electronic Ballasts 12 608.4 0.61 2,400 1,460 292.03$ NONE PROPOSED 12 608.4 0.61 2,400 1460 1460 NONE PROPOSED 0 - - - - -$ 0 0 0 0 0 0 0
95 High School 010 Main Office 40W Incandescent Fixture 3 120.0 0.12 2,400 288 57.60$ Replace 40W Incandescent Fixture with 13W CFL 3 39.0 0.04 2,400 94 94 NONE PROPOSED 0 194 - 0.08 194 38.88$ 0 5 20 0 0 25 75
96 High School 010 Main Office 2X2 Troffers/2-T8 Lamps/Electronic Ballasts 1 55.0 0.06 2,400 132 26.40$ NONE PROPOSED 1 55.0 0.06 2,400 132 132 NONE PROPOSED 0 - - - - -$ 0 0 0 0 0 0 0
97 High School 010 Men's Bathroom 2X2 Troffers/2-T8 Lamps/Electronic Ballasts 3 165.0 0.17 2,400 396 79.20$ NONE PROPOSED 3 165.0 0.17 2,400 396 396 NONE PROPOSED 0 - - - - -$ 0 0 0 0 0 0 0
98 High School 010 Men's Bathroom 2X4 Troffers/4-T8 Lamps/Electronic Ballasts 1 112.0 0.11 2,400 269 53.76$ NONE PROPOSED 1 112.0 0.11 2,400 269 269 NONE PROPOSED 0 - - - - -$ 0 0 0 0 0 0 0
99 High School 010 Men's Bathroom 2X2 Troffers/2-T8 Lamps/Electronic Ballasts 1 55.0 0.06 2,400 132 26.40$ NONE PROPOSED 1 55.0 0.06 2,400 132 132 NONE PROPOSED 0 - - - - -$ 0 0 0 0 0 0 0
100 High School 010 Men's Bathroom 2X2 Troffers/2-T8 Lamps/Electronic Ballasts 7 385.0 0.39 2,400 924 184.80$ NONE PROPOSED 7 385.0 0.39 2,400 924 924 NONE PROPOSED 0 - - - - -$ 0 0 0 0 0 0 0
101 High School 010 Men's Bathroom 2X4 Troffers/3-T8 Lamps/Electronic Ballasts 2 176.0 0.18 2,400 422 84.48$ NONE PROPOSED 2 176.0 0.18 2,400 422 422 NONE PROPOSED 0 - - - - -$ 0 0 0 0 0 0 0
102 High School 010 Men's Facility Bathroom 2X4 Troffers/2-T8 Lamps/Electronic Ballasts 1 50.7 0.05 2,400 122 24.34$ NONE PROPOSED 1 50.7 0.05 2,400 122 122 NONE PROPOSED 0 - - - - -$ 0 0 0 0 0 0 0
103 High School 010 Men's Facility Bathroom 2X2 Troffers/2-T8 Lamps/Electronic Ballasts 1 55.0 0.06 2,400 132 26.40$ NONE PROPOSED 1 55.0 0.06 2,400 132 132 NONE PROPOSED 0 - - - - -$ 0 0 0 0 0 0 0
104 High School 010 Men's Locker Room 1X4 Fixtures/2-T8 Lamps/Electronic Ballasts 19 963.3 0.96 2,400 2,312 462.38$ NONE PROPOSED 19 963.3 0.96 2,400 2312 2312 NONE PROPOSED 0 - - - - -$ 0 0 0 0 0 0 0
105 High School 010 Men's Locker Room 42W CFL 1 42.0 0.04 2,400 101 20.16$ NONE PROPOSED 1 42.0 0.04 2,400 101 101 NONE PROPOSED 0 - - - - -$ 0 0 0 0 0 0 0
106 High School 010 Men's Locker Room 40W Incandescent Fixture 3 120.0 0.12 2,400 288 57.60$ Replace 40W Incandescent Fixture with 13W CFL 3 39.0 0.04 2,400 94 94 NONE PROPOSED 0 194 - 0.08 194 38.88$ 0 5 20 0 0 25 75
107 High School 010 Men's Locker Room 2X2 Troffers/2-T8 Lamps/Electronic Ballasts 1 55.0 0.06 2,400 132 26.40$ NONE PROPOSED 1 55.0 0.06 2,400 132 132 NONE PROPOSED 0 - - - - -$ 0 0 0 0 0 0 0
108 High School 010 Men's Locker Room Office 2X2 Troffers/2-T8 Lamps/Electronic Ballasts 3 165.0 0.17 2,400 396 79.20$ NONE PROPOSED 3 165.0 0.17 2,400 396 396 NONE PROPOSED 0 - - - - -$ 0 0 0 0 0 0 0
109 High School 010 Men's Locker Room Office 40W Incandescent Fixture 1 40.0 0.04 2,400 96 19.20$ Replace 40W Incandescent Fixture with 13W CFL 1 13.0 0.01 2,400 31 31 NONE PROPOSED 0 65 - 0.03 65 12.96$ 0 5 20 0 0 25 25
110 High School 010 Music 2X4 Troffers/3-T8 Lamps/Electronic Ballasts 8 704.0 0.70 2,400 1,690 337.92$ NONE PROPOSED 8 704.0 0.70 2,400 1690 1690 NONE PROPOSED 0 - - - - -$ 0 0 0 0 0 0 0
111 High School 010 Music 2X4 Troffers/2-T8 Lamps/Electronic Ballasts 43 2180.1 2.18 2,400 5,232 1,046.45$ NONE PROPOSED 43 2180.1 2.18 2,400 5232 5232 NONE PROPOSED 0 - - - - -$ 0 0 0 0 0 0 0
112 High School 010 Music 1X4 Fixtures/2-T8 Lamps/Electronic Ballasts 42 2129.4 2.13 2,400 5,111 1,022.11$ NONE PROPOSED 42 2129.4 2.13 2,400 5111 5111 NONE PROPOSED 0 - - - - -$ 0 0 0 0 0 0 0
113 High School 010 Music Room 2X4 Troffers/3-T8 Lamps/Electronic Ballasts 37 3256.0 3.26 2,400 7,814 1,562.88$ NONE PROPOSED 37 3256.0 3.26 2,400 7814 7814 NONE PROPOSED 0 - - - - -$ 0 0 0 0 0 0 0
114 High School 010 Music Room 2X4 Troffers/2-T8 Lamps/Electronic Ballasts 6 304.2 0.30 2,400 730 146.02$ NONE PROPOSED 6 304.2 0.30 2,400 730 730 NONE PROPOSED 0 - - - - -$ 0 0 0 0 0 0 0
115 High School 010 Music Room 1X4 Fixtures/2-T8 Lamps/Electronic Ballasts 14 709.8 0.71 2,400 1,704 340.70$ NONE PROPOSED 14 709.8 0.71 2,400 1704 1704 NONE PROPOSED 0 - - - - -$ 0 0 0 0 0 0 0
116 High School 010 Nurse 2X4 Troffers/2-T8 Lamps/Electronic Ballasts 11 557.7 0.56 2,400 1,338 267.70$ NONE PROPOSED 11 557.7 0.56 2,400 1338 1338 NONE PROPOSED 0 - - - - -$ 0 0 0 0 0 0 0
117 High School 010 Nurse 40W Incandescent Fixture 1 40.0 0.04 2,400 96 19.20$ Replace 40W Incandescent Fixture with 13W CFL 1 13.0 0.01 2,400 31 31 NONE PROPOSED 0 65 - 0.03 65 12.96$ 0 5 20 0 0 25 25
118 High School 010 Physical Education 2X4 Troffers/2-T8 Lamps/Electronic Ballasts 2 101.4 0.10 2,400 243 48.67$ NONE PROPOSED 2 101.4 0.10 2,400 243 243 NONE PROPOSED 0 - - - - -$ 0 0 0 0 0 0 0
119 High School 010 Shop 150W Incandescent Fixture 3 450.0 0.45 2,400 1,080 216.00$ Replace 150W Incandescent Fixture with 25W CFL 3 75.0 0.08 2,400 180 180 NONE PROPOSED 0 900 - 0.38 900 180.00$ 0 7 20 0 0 27 81
120 High School 010 Shop 1X4 Fixtures/2-T8 Lamps/Electronic Ballasts 34 1723.8 1.72 2,400 4,137 827.42$ NONE PROPOSED 34 1723.8 1.72 2,400 4137 4137 NONE PROPOSED 0 - - - - -$ 0 0 0 0 0 0 0
121 High School 010 Shop 40W Incandescent Fixture 1 40.0 0.04 2,400 96 19.20$ Replace 40W Incandescent Fixture with 13W CFL 1 13.0 0.01 2,400 31 31 NONE PROPOSED 0 65 - 0.03 65 12.96$ 0 5 20 0 0 25 25
122 High School 010 Shop 2X4 Troffers/2-T8 Lamps/Electronic Ballasts 4 202.8 0.20 2,400 487 97.34$ NONE PROPOSED 4 202.8 0.20 2,400 487 487 NONE PROPOSED 0 - - - - -$ 0 0 0 0 0 0 0
123 High School 010 Shop 42W CFL 1 42.0 0.04 2,400 101 20.16$ NONE PROPOSED 1 42.0 0.04 2,400 101 101 NONE PROPOSED 0 - - - - -$ 0 0 0 0 0 0 0
124 High School 010 Storage 2X4 Troffers/4-T8 Lamps/Electronic Ballasts 2 224.0 0.22 500 112 22.40$ NONE PROPOSED 2 224.0 0.22 325 112 73 Automatic Wall Switch Occupancy Sensor 1 - 39.20 - 39 7.84$ 0 0 0 103 73.5 0 0
125 High School 010 Storage 1X4 Fixtures/2-T8 Lamps/Electronic Ballasts 6 304.2 0.30 500 152 30.42$ NONE PROPOSED 6 304.2 0.30 325 152 99 Automatic Wall Switch Occupancy Sensor 1 - 53.24 - 53 10.65$ 0 0 0 103 73.5 0 0
126 High School 010 Storage 1X4 Fixtures/1-T8 Lamps/Electronic Ballasts 1 25.4 0.03 500 13 2.54$ NONE PROPOSED 1 25.4 0.03 325 13 8 Automatic Wall Switch Occupancy Sensor 1 - 4.45 - 4 0.89$ 0 0 0 103 73.5 0 0
127 High School 010 Storage 42W CFL 1 42.0 0.04 500 21 4.20$ NONE PROPOSED 1 42.0 0.04 325 21 14 Automatic Wall Switch Occupancy Sensor 1 - 7.35 - 7 1.47$ 0 0 0 103 73.5 0 0
128 High School 010 Storage 1X4 Suspended Fixtures/2-T8 Lamps/Electronic Ballasts 6 304.2 0.30 500 152 30.42$ NONE PROPOSED 6 304.2 0.30 325 152 99 Automatic Wall Switch Occupancy Sensor 1 - 53.24 - 53 10.65$ 0 0 0 103 73.5 0 0
129 High School 010 Storage 2X4 Troffers/3-T8 Lamps/Electronic Ballasts 6 528.0 0.53 500 264 52.80$ NONE PROPOSED 6 528.0 0.53 325 264 172 Automatic Wall Switch Occupancy Sensor 1 - 92.40 - 92 18.48$ 0 0 0 103 73.5 0 0
3

ATTACHMENT A
Lighting Spreadsheets
Seq. # Building Floor # Location/Room # Existing Fixture/Lamp & Ballast Description Exist. Qty
of Fixtures Exist. Watts Exist. kW Base
Oper. Hrs. Exist. kWh Annual Cost of
Energy Existing Proposed Replacement SolutionProp. Qty
of Fixtures
Prop. Watts Prop. kW Base
Prop. Oper. Hrs. w/ Sensors
Prop. kWh w/o Sensors
Prop. kWh w/ Sensors Proposed Occupancy Sensor Sensor Qtys
Total kWh Saved Lighting
Only
kWh Saved Sensors Only
Total kW Saved
Total kWh Saved
Energy Cost Savings
Ballast/Fixture/Reflector Bulb Labor OS Cost OS Labor Subtotal Total
130 High School 010 Trainers Office Inaccessible 18 0.0 0.00 2,400 0 -$ NONE PROPOSED 18 0.0 0.00 2,400 0 0 NONE PROPOSED 0 - - - - -$ 0 0 0 0 0 0 0
131 High School 010 Training Room 2X4 Troffers/4-T8 Lamps/Electronic Ballasts 4 448.0 0.45 2,400 1,075 215.04$ NONE PROPOSED 4 448.0 0.45 2,400 1075 1075 NONE PROPOSED 0 - - - - -$ 0 0 0 0 0 0 0
132 High School 010 TV Studio 2X4 Troffers/3-T8 Lamps/Electronic Ballasts 3 264.0 0.26 2,400 634 126.72$ NONE PROPOSED 3 264.0 0.26 2,400 634 634 NONE PROPOSED 0 - - - - -$ 0 0 0 0 0 0 0
133 High School 010 TV Studio 1X4 Fixtures/2-T8 Lamps/Electronic Ballasts 10 507.0 0.51 2,400 1,217 243.36$ NONE PROPOSED 10 507.0 0.51 2,400 1217 1217 NONE PROPOSED 0 - - - - -$ 0 0 0 0 0 0 0
134 High School 010 Weight Room 2X4 Troffers/2-T8 Lamps/Electronic Ballasts 30 1521.0 1.52 2,400 3,650 730.08$ NONE PROPOSED 30 1521.0 1.52 2,400 3650 3650 NONE PROPOSED 0 - - - - -$ 0 0 0 0 0 0 0
135 High School 010 Women's Bathroom 2X4 Troffers/4-T8 Lamps/Electronic Ballasts 1 112.0 0.11 2,400 269 53.76$ NONE PROPOSED 1 112.0 0.11 2,400 269 269 NONE PROPOSED 0 - - - - -$ 0 0 0 0 0 0 0
136 High School 010 Women's Bathroom 2X2 Troffers/2-T8 Lamps/Electronic Ballasts 1 55.0 0.06 2,400 132 26.40$ NONE PROPOSED 1 55.0 0.06 2,400 132 132 NONE PROPOSED 0 - - - - -$ 0 0 0 0 0 0 0
137 High School 010 Women's Bathroom 2X4 Troffers/3-T8 Lamps/Electronic Ballasts 2 176.0 0.18 2,400 422 84.48$ NONE PROPOSED 2 176.0 0.18 2,400 422 422 NONE PROPOSED 0 - - - - -$ 0 0 0 0 0 0 0
138 High School 010 Women's Facility Bathroom 2X4 Troffers/2-T8 Lamps/Electronic Ballasts 1 50.7 0.05 2,400 122 24.34$ NONE PROPOSED 1 50.7 0.05 2,400 122 122 NONE PROPOSED 0 - - - - -$ 0 0 0 0 0 0 0
139 High School 010 Women's Facility Bathroom 2X2 Troffers/2-T8 Lamps/Electronic Ballasts 1 55.0 0.06 2,400 132 26.40$ NONE PROPOSED 1 55.0 0.06 2,400 132 132 NONE PROPOSED 0 - - - - -$ 0 0 0 0 0 0 0
140 High School 010 Women's Locker Room 1X4 Fixtures/2-T8 Lamps/Electronic Ballasts 19 963.3 0.96 2,400 2,312 462.38$ NONE PROPOSED 19 963.3 0.96 2,400 2312 2312 NONE PROPOSED 0 - - - - -$ 0 0 0 0 0 0 0
141 High School 010 Women's Locker Room 42W CFL 1 42.0 0.04 2,400 101 20.16$ NONE PROPOSED 1 42.0 0.04 2,400 101 101 NONE PROPOSED 0 - - - - -$ 0 0 0 0 0 0 0
142 High School 010 Women's Locker Room 40W Incandescent Fixture 3 120.0 0.12 2,400 288 57.60$ Replace 40W Incandescent Fixture with 13W CFL 3 39.0 0.04 2,400 94 94 NONE PROPOSED 0 194 - 0.08 194 38.88$ 0 5 20 0 0 25 75
143 High School 010 Women's Locker Room 2X2 Troffers/2-T8 Lamps/Electronic Ballasts 1 55.0 0.06 2,400 132 26.40$ NONE PROPOSED 1 55.0 0.06 2,400 132 132 NONE PROPOSED 0 - - - - -$ 0 0 0 0 0 0 0
144 High School 010 Women's Locker Room Office 2X2 Troffers/2-T8 Lamps/Electronic Ballasts 3 165.0 0.17 2,400 396 79.20$ NONE PROPOSED 3 165.0 0.17 2,400 396 396 NONE PROPOSED 0 - - - - -$ 0 0 0 0 0 0 0
145 High School 010 Women's Locker Room Office 40W Incandescent Fixture 1 40.0 0.04 2,400 96 19.20$ Replace 40W Incandescent Fixture with 13W CFL 1 13.0 0.01 2,400 31 31 NONE PROPOSED 0 65 - 0.03 65 12.96$ 0 5 20 0 0 25 25
146 High School 010 Womens's Bathroom 2X2 Troffers/2-T8 Lamps/Electronic Ballasts 3 165.0 0.17 2,400 396 79.20$ NONE PROPOSED 3 165.0 0.17 2,400 396 396 NONE PROPOSED 0 - - - - -$ 0 0 0 0 0 0 0
147 High School 010 Womens's Bathroom 2X2 Troffers/2-T8 Lamps/Electronic Ballasts 7 385.0 0.39 2,400 924 184.80$ NONE PROPOSED 7 385.0 0.39 2,400 924 924 NONE PROPOSED 0 - - - - -$ 0 0 0 0 0 0 0
148 High School 010 201 1X4 Fixtures/2-T8 Lamps/Electronic Ballasts 18 912.6 0.91 2,400 2,190 438.05$ NONE PROPOSED 18 912.6 0.91 2,400 2190 2190 NONE PROPOSED 0 - - - - -$ 0 0 0 0 0 0 0
149 High School 010 202 1X4 Fixtures/2-T8 Lamps/Electronic Ballasts 21 1064.7 1.06 2,400 2,555 511.06$ NONE PROPOSED 21 1064.7 1.06 2,400 2555 2555 NONE PROPOSED 0 - - - - -$ 0 0 0 0 0 0 0
150 High School 010 203 1X4 Fixtures/2-T8 Lamps/Electronic Ballasts 18 912.6 0.91 2,400 2,190 438.05$ NONE PROPOSED 18 912.6 0.91 2,400 2190 2190 NONE PROPOSED 0 - - - - -$ 0 0 0 0 0 0 0
151 High School 010 204 1X4 Fixtures/2-T8 Lamps/Electronic Ballasts 21 1064.7 1.06 2,400 2,555 511.06$ NONE PROPOSED 21 1064.7 1.06 2,400 2555 2555 NONE PROPOSED 0 - - - - -$ 0 0 0 0 0 0 0
152 High School 010 205 1X4 Fixtures/2-T8 Lamps/Electronic Ballasts 18 912.6 0.91 2,400 2,190 438.05$ NONE PROPOSED 18 912.6 0.91 2,400 2190 2190 NONE PROPOSED 0 - - - - -$ 0 0 0 0 0 0 0
153 High School 010 206 1X4 Fixtures/2-T8 Lamps/Electronic Ballasts 21 1064.7 1.06 2,400 2,555 511.06$ NONE PROPOSED 21 1064.7 1.06 2,400 2555 2555 NONE PROPOSED 0 - - - - -$ 0 0 0 0 0 0 0
154 High School 010 207 1X4 Fixtures/2-T8 Lamps/Electronic Ballasts 18 912.6 0.91 2,400 2,190 438.05$ NONE PROPOSED 18 912.6 0.91 2,400 2190 2190 NONE PROPOSED 0 - - - - -$ 0 0 0 0 0 0 0
155 High School 020 208 1X4 Fixtures/2-T8 Lamps/Electronic Ballasts 18 912.6 0.91 2,400 2,190 438.05$ NONE PROPOSED 18 912.6 0.91 2,400 2190 2190 NONE PROPOSED 0 - - - - -$ 0 0 0 0 0 0 0
156 High School 020 210 1X4 Fixtures/2-T8 Lamps/Electronic Ballasts 15 760.5 0.76 2,400 1,825 365.04$ NONE PROPOSED 15 760.5 0.76 2,400 1825 1825 NONE PROPOSED 0 - - - - -$ 0 0 0 0 0 0 0
157 High School 020 211 1X4 Fixtures/2-T8 Lamps/Electronic Ballasts 18 912.6 0.91 2,400 2,190 438.05$ NONE PROPOSED 18 912.6 0.91 2,400 2190 2190 NONE PROPOSED 0 - - - - -$ 0 0 0 0 0 0 0
158 High School 020 212 1X4 Fixtures/2-T8 Lamps/Electronic Ballasts 21 1064.7 1.06 2,400 2,555 511.06$ NONE PROPOSED 21 1064.7 1.06 2,400 2555 2555 NONE PROPOSED 0 - - - - -$ 0 0 0 0 0 0 0
159 High School 020 213 1X4 Fixtures/2-T8 Lamps/Electronic Ballasts 18 912.6 0.91 2,400 2,190 438.05$ NONE PROPOSED 18 912.6 0.91 2,400 2190 2190 NONE PROPOSED 0 - - - - -$ 0 0 0 0 0 0 0
160 High School 020 214 1X4 Fixtures/2-T8 Lamps/Electronic Ballasts 18 912.6 0.91 2,400 2,190 438.05$ NONE PROPOSED 18 912.6 0.91 2,400 2190 2190 NONE PROPOSED 0 - - - - -$ 0 0 0 0 0 0 0
161 High School 020 215 1X4 Fixtures/2-T8 Lamps/Electronic Ballasts 18 912.6 0.91 2,400 2,190 438.05$ NONE PROPOSED 18 912.6 0.91 2,400 2190 2190 NONE PROPOSED 0 - - - - -$ 0 0 0 0 0 0 0
162 High School 020 216 1X4 Fixtures/2-T8 Lamps/Electronic Ballasts 18 912.6 0.91 2,400 2,190 438.05$ NONE PROPOSED 18 912.6 0.91 2,400 2190 2190 NONE PROPOSED 0 - - - - -$ 0 0 0 0 0 0 0
163 High School 020 217 1X4 Fixtures/2-T8 Lamps/Electronic Ballasts 18 912.6 0.91 2,400 2,190 438.05$ NONE PROPOSED 18 912.6 0.91 2,400 2190 2190 NONE PROPOSED 0 - - - - -$ 0 0 0 0 0 0 0
164 High School 020 218 1X4 Fixtures/2-T8 Lamps/Electronic Ballasts 18 912.6 0.91 2,400 2,190 438.05$ NONE PROPOSED 18 912.6 0.91 2,400 2190 2190 NONE PROPOSED 0 - - - - -$ 0 0 0 0 0 0 0
165 High School 020 218 2X4 Troffers/3-T8 Lamps/Electronic Ballasts 11 968.0 0.97 2,400 2,323 464.64$ NONE PROPOSED 11 968.0 0.97 2,400 2323 2323 NONE PROPOSED 0 - - - - -$ 0 0 0 0 0 0 0
166 High School 020 219 2X4 Troffers/3-T8 Lamps/Electronic Ballasts 15 1320.0 1.32 2,400 3,168 633.60$ NONE PROPOSED 15 1320.0 1.32 2,400 3168 3168 NONE PROPOSED 0 - - - - -$ 0 0 0 0 0 0 0
167 High School 020 221 2X4 Troffers/3-T8 Lamps/Electronic Ballasts 12 1056.0 1.06 2,400 2,534 506.88$ NONE PROPOSED 12 1056.0 1.06 2,400 2534 2534 NONE PROPOSED 0 - - - - -$ 0 0 0 0 0 0 0
168 High School 020 223 2X4 Troffers/3-T8 Lamps/Electronic Ballasts 12 1056.0 1.06 2,400 2,534 506.88$ NONE PROPOSED 12 1056.0 1.06 2,400 2534 2534 NONE PROPOSED 0 - - - - -$ 0 0 0 0 0 0 0
169 High School 020 225 2X4 Troffers/3-T8 Lamps/Electronic Ballasts 12 1056.0 1.06 2,400 2,534 506.88$ NONE PROPOSED 12 1056.0 1.06 2,400 2534 2534 NONE PROPOSED 0 - - - - -$ 0 0 0 0 0 0 0
170 High School 020 226 2X4 Troffers/3-T8 Lamps/Electronic Ballasts 12 1056.0 1.06 2,400 2,534 506.88$ NONE PROPOSED 12 1056.0 1.06 2,400 2534 2534 NONE PROPOSED 0 - - - - -$ 0 0 0 0 0 0 0
171 High School 020 227 2X4 Troffers/3-T8 Lamps/Electronic Ballasts 9 792.0 0.79 2,400 1,901 380.16$ NONE PROPOSED 9 792.0 0.79 2,400 1901 1901 NONE PROPOSED 0 - - - - -$ 0 0 0 0 0 0 0
172 High School 020 228 2X4 Troffers/3-T8 Lamps/Electronic Ballasts 12 1056.0 1.06 2,400 2,534 506.88$ NONE PROPOSED 12 1056.0 1.06 2,400 2534 2534 NONE PROPOSED 0 - - - - -$ 0 0 0 0 0 0 0
4
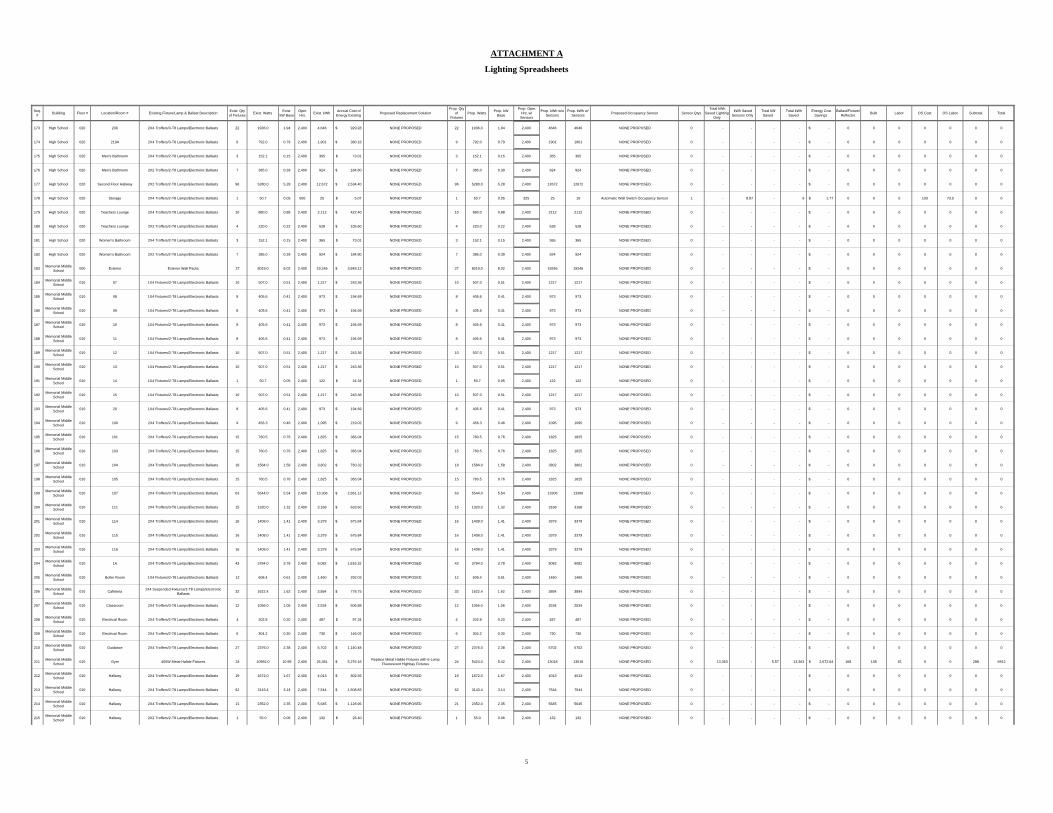
ATTACHMENT A
Lighting Spreadsheets
Seq. # Building Floor # Location/Room # Existing Fixture/Lamp & Ballast Description Exist. Qty
of Fixtures Exist. Watts Exist. kW Base
Oper. Hrs. Exist. kWh Annual Cost of
Energy Existing Proposed Replacement SolutionProp. Qty
of Fixtures
Prop. Watts Prop. kW Base
Prop. Oper. Hrs. w/ Sensors
Prop. kWh w/o Sensors
Prop. kWh w/ Sensors Proposed Occupancy Sensor Sensor Qtys
Total kWh Saved Lighting
Only
kWh Saved Sensors Only
Total kW Saved
Total kWh Saved
Energy Cost Savings
Ballast/Fixture/Reflector Bulb Labor OS Cost OS Labor Subtotal Total
173 High School 020 230 2X4 Troffers/3-T8 Lamps/Electronic Ballasts 22 1936.0 1.94 2,400 4,646 929.28$ NONE PROPOSED 22 1936.0 1.94 2,400 4646 4646 NONE PROPOSED 0 - - - - -$ 0 0 0 0 0 0 0
174 High School 020 219A 2X4 Troffers/3-T8 Lamps/Electronic Ballasts 9 792.0 0.79 2,400 1,901 380.16$ NONE PROPOSED 9 792.0 0.79 2,400 1901 1901 NONE PROPOSED 0 - - - - -$ 0 0 0 0 0 0 0
175 High School 020 Men's Bathroom 2X4 Troffers/2-T8 Lamps/Electronic Ballasts 3 152.1 0.15 2,400 365 73.01$ NONE PROPOSED 3 152.1 0.15 2,400 365 365 NONE PROPOSED 0 - - - - -$ 0 0 0 0 0 0 0
176 High School 020 Men's Bathroom 2X2 Troffers/2-T8 Lamps/Electronic Ballasts 7 385.0 0.39 2,400 924 184.80$ NONE PROPOSED 7 385.0 0.39 2,400 924 924 NONE PROPOSED 0 - - - - -$ 0 0 0 0 0 0 0
177 High School 020 Second Floor Hallway 2X2 Troffers/2-T8 Lamps/Electronic Ballasts 96 5280.0 5.28 2,400 12,672 2,534.40$ NONE PROPOSED 96 5280.0 5.28 2,400 12672 12672 NONE PROPOSED 0 - - - - -$ 0 0 0 0 0 0 0
178 High School 020 Storage 2X4 Troffers/2-T8 Lamps/Electronic Ballasts 1 50.7 0.05 500 25 5.07$ NONE PROPOSED 1 50.7 0.05 325 25 16 Automatic Wall Switch Occupancy Sensor 1 - 8.87 - 9 1.77$ 0 0 0 103 73.5 0 0
179 High School 020 Teachers Lounge 2X4 Troffers/3-T8 Lamps/Electronic Ballasts 10 880.0 0.88 2,400 2,112 422.40$ NONE PROPOSED 10 880.0 0.88 2,400 2112 2112 NONE PROPOSED 0 - - - - -$ 0 0 0 0 0 0 0
180 High School 020 Teachers Lounge 2X2 Troffers/2-T8 Lamps/Electronic Ballasts 4 220.0 0.22 2,400 528 105.60$ NONE PROPOSED 4 220.0 0.22 2,400 528 528 NONE PROPOSED 0 - - - - -$ 0 0 0 0 0 0 0
181 High School 020 Women's Bathroom 2X4 Troffers/2-T8 Lamps/Electronic Ballasts 3 152.1 0.15 2,400 365 73.01$ NONE PROPOSED 3 152.1 0.15 2,400 365 365 NONE PROPOSED 0 - - - - -$ 0 0 0 0 0 0 0
182 High School 020 Women's Bathroom 2X2 Troffers/2-T8 Lamps/Electronic Ballasts 7 385.0 0.39 2,400 924 184.80$ NONE PROPOSED 7 385.0 0.39 2,400 924 924 NONE PROPOSED 0 - - - - -$ 0 0 0 0 0 0 0
183 Memorial Middle School 000 Exterior Exterior Wall Packs 27 8019.0 8.02 2,400 19,246 3,849.12$ NONE PROPOSED 27 8019.0 8.02 2,400 19246 19246 NONE PROPOSED 0 - - - - -$ 0 0 0 0 0 0 0
184 Memorial Middle School 010 07 1X4 Fixtures/2-T8 Lamps/Electronic Ballasts 10 507.0 0.51 2,400 1,217 243.36$ NONE PROPOSED 10 507.0 0.51 2,400 1217 1217 NONE PROPOSED 0 - - - - -$ 0 0 0 0 0 0 0
185 Memorial Middle School 010 08 1X4 Fixtures/2-T8 Lamps/Electronic Ballasts 8 405.6 0.41 2,400 973 194.69$ NONE PROPOSED 8 405.6 0.41 2,400 973 973 NONE PROPOSED 0 - - - - -$ 0 0 0 0 0 0 0
186 Memorial Middle School 010 09 1X4 Fixtures/2-T8 Lamps/Electronic Ballasts 8 405.6 0.41 2,400 973 194.69$ NONE PROPOSED 8 405.6 0.41 2,400 973 973 NONE PROPOSED 0 - - - - -$ 0 0 0 0 0 0 0
187 Memorial Middle School 010 10 1X4 Fixtures/2-T8 Lamps/Electronic Ballasts 8 405.6 0.41 2,400 973 194.69$ NONE PROPOSED 8 405.6 0.41 2,400 973 973 NONE PROPOSED 0 - - - - -$ 0 0 0 0 0 0 0
188 Memorial Middle School 010 11 1X4 Fixtures/2-T8 Lamps/Electronic Ballasts 8 405.6 0.41 2,400 973 194.69$ NONE PROPOSED 8 405.6 0.41 2,400 973 973 NONE PROPOSED 0 - - - - -$ 0 0 0 0 0 0 0
189 Memorial Middle School 010 12 1X4 Fixtures/2-T8 Lamps/Electronic Ballasts 10 507.0 0.51 2,400 1,217 243.36$ NONE PROPOSED 10 507.0 0.51 2,400 1217 1217 NONE PROPOSED 0 - - - - -$ 0 0 0 0 0 0 0
190 Memorial Middle School 010 13 1X4 Fixtures/2-T8 Lamps/Electronic Ballasts 10 507.0 0.51 2,400 1,217 243.36$ NONE PROPOSED 10 507.0 0.51 2,400 1217 1217 NONE PROPOSED 0 - - - - -$ 0 0 0 0 0 0 0
191 Memorial Middle School 010 14 1X4 Fixtures/2-T8 Lamps/Electronic Ballasts 1 50.7 0.05 2,400 122 24.34$ NONE PROPOSED 1 50.7 0.05 2,400 122 122 NONE PROPOSED 0 - - - - -$ 0 0 0 0 0 0 0
192 Memorial Middle School 010 15 1X4 Fixtures/2-T8 Lamps/Electronic Ballasts 10 507.0 0.51 2,400 1,217 243.36$ NONE PROPOSED 10 507.0 0.51 2,400 1217 1217 NONE PROPOSED 0 - - - - -$ 0 0 0 0 0 0 0
193 Memorial Middle School 010 20 1X4 Fixtures/2-T8 Lamps/Electronic Ballasts 8 405.6 0.41 2,400 973 194.69$ NONE PROPOSED 8 405.6 0.41 2,400 973 973 NONE PROPOSED 0 - - - - -$ 0 0 0 0 0 0 0
194 Memorial Middle School 010 100 2X4 Troffers/2-T8 Lamps/Electronic Ballasts 9 456.3 0.46 2,400 1,095 219.02$ NONE PROPOSED 9 456.3 0.46 2,400 1095 1095 NONE PROPOSED 0 - - - - -$ 0 0 0 0 0 0 0
195 Memorial Middle School 010 101 2X4 Troffers/2-T8 Lamps/Electronic Ballasts 15 760.5 0.76 2,400 1,825 365.04$ NONE PROPOSED 15 760.5 0.76 2,400 1825 1825 NONE PROPOSED 0 - - - - -$ 0 0 0 0 0 0 0
196 Memorial Middle School 010 103 2X4 Troffers/2-T8 Lamps/Electronic Ballasts 15 760.5 0.76 2,400 1,825 365.04$ NONE PROPOSED 15 760.5 0.76 2,400 1825 1825 NONE PROPOSED 0 - - - - -$ 0 0 0 0 0 0 0
197 Memorial Middle School 010 104 2X4 Troffers/3-T8 Lamps/Electronic Ballasts 18 1584.0 1.58 2,400 3,802 760.32$ NONE PROPOSED 18 1584.0 1.58 2,400 3802 3802 NONE PROPOSED 0 - - - - -$ 0 0 0 0 0 0 0
198 Memorial Middle School 010 105 2X4 Troffers/2-T8 Lamps/Electronic Ballasts 15 760.5 0.76 2,400 1,825 365.04$ NONE PROPOSED 15 760.5 0.76 2,400 1825 1825 NONE PROPOSED 0 - - - - -$ 0 0 0 0 0 0 0
199 Memorial Middle School 010 107 2X4 Troffers/3-T8 Lamps/Electronic Ballasts 63 5544.0 5.54 2,400 13,306 2,661.12$ NONE PROPOSED 63 5544.0 5.54 2,400 13306 13306 NONE PROPOSED 0 - - - - -$ 0 0 0 0 0 0 0
200 Memorial Middle School 010 111 2X4 Troffers/3-T8 Lamps/Electronic Ballasts 15 1320.0 1.32 2,400 3,168 633.60$ NONE PROPOSED 15 1320.0 1.32 2,400 3168 3168 NONE PROPOSED 0 - - - - -$ 0 0 0 0 0 0 0
201 Memorial Middle School 010 114 2X4 Troffers/3-T8 Lamps/Electronic Ballasts 16 1408.0 1.41 2,400 3,379 675.84$ NONE PROPOSED 16 1408.0 1.41 2,400 3379 3379 NONE PROPOSED 0 - - - - -$ 0 0 0 0 0 0 0
202 Memorial Middle School 010 115 2X4 Troffers/3-T8 Lamps/Electronic Ballasts 16 1408.0 1.41 2,400 3,379 675.84$ NONE PROPOSED 16 1408.0 1.41 2,400 3379 3379 NONE PROPOSED 0 - - - - -$ 0 0 0 0 0 0 0
203 Memorial Middle School 010 116 2X4 Troffers/3-T8 Lamps/Electronic Ballasts 16 1408.0 1.41 2,400 3,379 675.84$ NONE PROPOSED 16 1408.0 1.41 2,400 3379 3379 NONE PROPOSED 0 - - - - -$ 0 0 0 0 0 0 0
204 Memorial Middle School 010 1A 2X4 Troffers/3-T8 Lamps/Electronic Ballasts 43 3784.0 3.78 2,400 9,082 1,816.32$ NONE PROPOSED 43 3784.0 3.78 2,400 9082 9082 NONE PROPOSED 0 - - - - -$ 0 0 0 0 0 0 0
205 Memorial Middle School 010 Boiler Room 1X4 Fixtures/2-T8 Lamps/Electronic Ballasts 12 608.4 0.61 2,400 1,460 292.03$ NONE PROPOSED 12 608.4 0.61 2,400 1460 1460 NONE PROPOSED 0 - - - - -$ 0 0 0 0 0 0 0
206 Memorial Middle School 010 Cafeteria 1X4 Suspended Fixtures/2-T8 Lamps/Electronic
Ballasts 32 1622.4 1.62 2,400 3,894 778.75$ NONE PROPOSED 32 1622.4 1.62 2,400 3894 3894 NONE PROPOSED 0 - - - - -$ 0 0 0 0 0 0 0
207 Memorial Middle School 010 Classroom 2X4 Troffers/3-T8 Lamps/Electronic Ballasts 12 1056.0 1.06 2,400 2,534 506.88$ NONE PROPOSED 12 1056.0 1.06 2,400 2534 2534 NONE PROPOSED 0 - - - - -$ 0 0 0 0 0 0 0
208 Memorial Middle School 010 Electrical Room 2X4 Troffers/2-T8 Lamps/Electronic Ballasts 4 202.8 0.20 2,400 487 97.34$ NONE PROPOSED 4 202.8 0.20 2,400 487 487 NONE PROPOSED 0 - - - - -$ 0 0 0 0 0 0 0
209 Memorial Middle School 010 Electrical Room 2X4 Troffers/2-T8 Lamps/Electronic Ballasts 6 304.2 0.30 2,400 730 146.02$ NONE PROPOSED 6 304.2 0.30 2,400 730 730 NONE PROPOSED 0 - - - - -$ 0 0 0 0 0 0 0
210 Memorial Middle School 010 Guidance 2X4 Troffers/3-T8 Lamps/Electronic Ballasts 27 2376.0 2.38 2,400 5,702 1,140.48$ NONE PROPOSED 27 2376.0 2.38 2,400 5702 5702 NONE PROPOSED 0 - - - - -$ 0 0 0 0 0 0 0
211 Memorial Middle School 010 Gym 400W Metal Halide Fixtures 24 10992.0 10.99 2,400 26,381 5,276.16$ Replace Metal Halide Fixtures with 6-Lamp
Fluorescent Highbay Fixtures 24 5424.0 5.42 2,400 13018 13018 NONE PROPOSED 0 13,363 - 5.57 13,363 2,672.64$ 168 105 15 0 0 288 6912
212 Memorial Middle School 010 Hallway 2X4 Troffers/3-T8 Lamps/Electronic Ballasts 19 1672.0 1.67 2,400 4,013 802.56$ NONE PROPOSED 19 1672.0 1.67 2,400 4013 4013 NONE PROPOSED 0 - - - - -$ 0 0 0 0 0 0 0
213 Memorial Middle School 010 Hallway 2X4 Troffers/2-T8 Lamps/Electronic Ballasts 62 3143.4 3.14 2,400 7,544 1,508.83$ NONE PROPOSED 62 3143.4 3.14 2,400 7544 7544 NONE PROPOSED 0 - - - - -$ 0 0 0 0 0 0 0
214 Memorial Middle School 010 Hallway 2X4 Troffers/4-T8 Lamps/Electronic Ballasts 21 2352.0 2.35 2,400 5,645 1,128.96$ NONE PROPOSED 21 2352.0 2.35 2,400 5645 5645 NONE PROPOSED 0 - - - - -$ 0 0 0 0 0 0 0
215 Memorial Middle School 010 Hallway 2X2 Troffers/2-T8 Lamps/Electronic Ballasts 1 55.0 0.06 2,400 132 26.40$ NONE PROPOSED 1 55.0 0.06 2,400 132 132 NONE PROPOSED 0 - - - - -$ 0 0 0 0 0 0 0
5
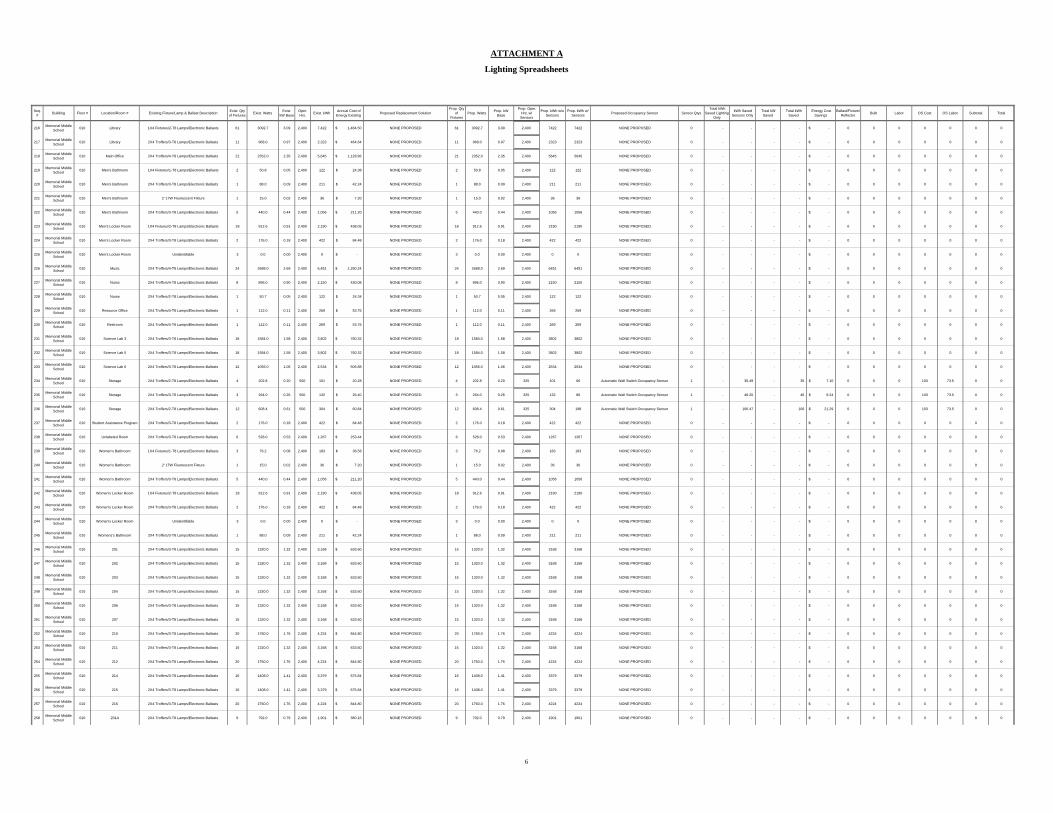
ATTACHMENT A
Lighting Spreadsheets
Seq. # Building Floor # Location/Room # Existing Fixture/Lamp & Ballast Description Exist. Qty
of Fixtures Exist. Watts Exist. kW Base
Oper. Hrs. Exist. kWh Annual Cost of
Energy Existing Proposed Replacement SolutionProp. Qty
of Fixtures
Prop. Watts Prop. kW Base
Prop. Oper. Hrs. w/ Sensors
Prop. kWh w/o Sensors
Prop. kWh w/ Sensors Proposed Occupancy Sensor Sensor Qtys
Total kWh Saved Lighting
Only
kWh Saved Sensors Only
Total kW Saved
Total kWh Saved
Energy Cost Savings
Ballast/Fixture/Reflector Bulb Labor OS Cost OS Labor Subtotal Total
216 Memorial Middle School 010 Library 1X4 Fixtures/2-T8 Lamps/Electronic Ballasts 61 3092.7 3.09 2,400 7,422 1,484.50$ NONE PROPOSED 61 3092.7 3.09 2,400 7422 7422 NONE PROPOSED 0 - - - - -$ 0 0 0 0 0 0 0
217 Memorial Middle School 010 Library 2X4 Troffers/3-T8 Lamps/Electronic Ballasts 11 968.0 0.97 2,400 2,323 464.64$ NONE PROPOSED 11 968.0 0.97 2,400 2323 2323 NONE PROPOSED 0 - - - - -$ 0 0 0 0 0 0 0
218 Memorial Middle School 010 Main Office 2X4 Troffers/4-T8 Lamps/Electronic Ballasts 21 2352.0 2.35 2,400 5,645 1,128.96$ NONE PROPOSED 21 2352.0 2.35 2,400 5645 5645 NONE PROPOSED 0 - - - - -$ 0 0 0 0 0 0 0
219 Memorial Middle School 010 Men's Bathroom 1X4 Fixtures/1-T8 Lamps/Electronic Ballasts 2 50.8 0.05 2,400 122 24.38$ NONE PROPOSED 2 50.8 0.05 2,400 122 122 NONE PROPOSED 0 - - - - -$ 0 0 0 0 0 0 0
220 Memorial Middle School 010 Men's Bathroom 2X4 Troffers/3-T8 Lamps/Electronic Ballasts 1 88.0 0.09 2,400 211 42.24$ NONE PROPOSED 1 88.0 0.09 2,400 211 211 NONE PROPOSED 0 - - - - -$ 0 0 0 0 0 0 0
221 Memorial Middle School 010 Men's Bathroom 2' 17W Fluorescent Fixture 1 15.0 0.02 2,400 36 7.20$ NONE PROPOSED 1 15.0 0.02 2,400 36 36 NONE PROPOSED 0 - - - - -$ 0 0 0 0 0 0 0
222 Memorial Middle School 010 Men's Bathroom 2X4 Troffers/3-T8 Lamps/Electronic Ballasts 5 440.0 0.44 2,400 1,056 211.20$ NONE PROPOSED 5 440.0 0.44 2,400 1056 1056 NONE PROPOSED 0 - - - - -$ 0 0 0 0 0 0 0
223 Memorial Middle School 010 Men's Locker Room 1X4 Fixtures/2-T8 Lamps/Electronic Ballasts 18 912.6 0.91 2,400 2,190 438.05$ NONE PROPOSED 18 912.6 0.91 2,400 2190 2190 NONE PROPOSED 0 - - - - -$ 0 0 0 0 0 0 0
224 Memorial Middle School 010 Men's Locker Room 2X4 Troffers/3-T8 Lamps/Electronic Ballasts 2 176.0 0.18 2,400 422 84.48$ NONE PROPOSED 2 176.0 0.18 2,400 422 422 NONE PROPOSED 0 - - - - -$ 0 0 0 0 0 0 0
225 Memorial Middle School 010 Men's Locker Room Unidentifiable 3 0.0 0.00 2,400 0 -$ NONE PROPOSED 3 0.0 0.00 2,400 0 0 NONE PROPOSED 0 - - - - -$ 0 0 0 0 0 0 0
226 Memorial Middle School 010 Music 2X4 Troffers/4-T8 Lamps/Electronic Ballasts 24 2688.0 2.69 2,400 6,451 1,290.24$ NONE PROPOSED 24 2688.0 2.69 2,400 6451 6451 NONE PROPOSED 0 - - - - -$ 0 0 0 0 0 0 0
227 Memorial Middle School 010 Nurse 2X4 Troffers/4-T8 Lamps/Electronic Ballasts 8 896.0 0.90 2,400 2,150 430.08$ NONE PROPOSED 8 896.0 0.90 2,400 2150 2150 NONE PROPOSED 0 - - - - -$ 0 0 0 0 0 0 0
228 Memorial Middle School 010 Nurse 2X4 Troffers/2-T8 Lamps/Electronic Ballasts 1 50.7 0.05 2,400 122 24.34$ NONE PROPOSED 1 50.7 0.05 2,400 122 122 NONE PROPOSED 0 - - - - -$ 0 0 0 0 0 0 0
229 Memorial Middle School 010 Resource Office 2X4 Troffers/4-T8 Lamps/Electronic Ballasts 1 112.0 0.11 2,400 269 53.76$ NONE PROPOSED 1 112.0 0.11 2,400 269 269 NONE PROPOSED 0 - - - - -$ 0 0 0 0 0 0 0
230 Memorial Middle School 010 Restroom 2X4 Troffers/4-T8 Lamps/Electronic Ballasts 1 112.0 0.11 2,400 269 53.76$ NONE PROPOSED 1 112.0 0.11 2,400 269 269 NONE PROPOSED 0 - - - - -$ 0 0 0 0 0 0 0
231 Memorial Middle School 010 Science Lab 3 2X4 Troffers/3-T8 Lamps/Electronic Ballasts 18 1584.0 1.58 2,400 3,802 760.32$ NONE PROPOSED 18 1584.0 1.58 2,400 3802 3802 NONE PROPOSED 0 - - - - -$ 0 0 0 0 0 0 0
232 Memorial Middle School 010 Science Lab 5 2X4 Troffers/3-T8 Lamps/Electronic Ballasts 18 1584.0 1.58 2,400 3,802 760.32$ NONE PROPOSED 18 1584.0 1.58 2,400 3802 3802 NONE PROPOSED 0 - - - - -$ 0 0 0 0 0 0 0
233 Memorial Middle School 010 Science Lab 6 2X4 Troffers/3-T8 Lamps/Electronic Ballasts 12 1056.0 1.06 2,400 2,534 506.88$ NONE PROPOSED 12 1056.0 1.06 2,400 2534 2534 NONE PROPOSED 0 - - - - -$ 0 0 0 0 0 0 0
234 Memorial Middle School 010 Storage 2X4 Troffers/2-T8 Lamps/Electronic Ballasts 4 202.8 0.20 500 101 20.28$ NONE PROPOSED 4 202.8 0.20 325 101 66 Automatic Wall Switch Occupancy Sensor 1 - 35.49 - 35 7.10$ 0 0 0 103 73.5 0 0
235 Memorial Middle School 010 Storage 2X4 Troffers/3-T8 Lamps/Electronic Ballasts 3 264.0 0.26 500 132 26.40$ NONE PROPOSED 3 264.0 0.26 325 132 86 Automatic Wall Switch Occupancy Sensor 1 - 46.20 - 46 9.24$ 0 0 0 103 73.5 0 0
236 Memorial Middle School 010 Storage 2X4 Troffers/2-T8 Lamps/Electronic Ballasts 12 608.4 0.61 500 304 60.84$ NONE PROPOSED 12 608.4 0.61 325 304 198 Automatic Wall Switch Occupancy Sensor 1 - 106.47 - 106 21.29$ 0 0 0 103 73.5 0 0
237 Memorial Middle School 010 Student Assistance Program 2X4 Troffers/3-T8 Lamps/Electronic Ballasts 2 176.0 0.18 2,400 422 84.48$ NONE PROPOSED 2 176.0 0.18 2,400 422 422 NONE PROPOSED 0 - - - - -$ 0 0 0 0 0 0 0
238 Memorial Middle School 010 Unlabeled Room 2X4 Troffers/3-T8 Lamps/Electronic Ballasts 6 528.0 0.53 2,400 1,267 253.44$ NONE PROPOSED 6 528.0 0.53 2,400 1267 1267 NONE PROPOSED 0 - - - - -$ 0 0 0 0 0 0 0
239 Memorial Middle School 010 Women's Bathroom 1X4 Fixtures/1-T8 Lamps/Electronic Ballasts 3 76.2 0.08 2,400 183 36.58$ NONE PROPOSED 3 76.2 0.08 2,400 183 183 NONE PROPOSED 0 - - - - -$ 0 0 0 0 0 0 0
240 Memorial Middle School 010 Women's Bathroom 2' 17W Fluorescent Fixture 1 15.0 0.02 2,400 36 7.20$ NONE PROPOSED 1 15.0 0.02 2,400 36 36 NONE PROPOSED 0 - - - - -$ 0 0 0 0 0 0 0
241 Memorial Middle School 010 Women's Bathroom 2X4 Troffers/3-T8 Lamps/Electronic Ballasts 5 440.0 0.44 2,400 1,056 211.20$ NONE PROPOSED 5 440.0 0.44 2,400 1056 1056 NONE PROPOSED 0 - - - - -$ 0 0 0 0 0 0 0
242 Memorial Middle School 010 Women's Locker Room 1X4 Fixtures/2-T8 Lamps/Electronic Ballasts 18 912.6 0.91 2,400 2,190 438.05$ NONE PROPOSED 18 912.6 0.91 2,400 2190 2190 NONE PROPOSED 0 - - - - -$ 0 0 0 0 0 0 0
243 Memorial Middle School 010 Women's Locker Room 2X4 Troffers/3-T8 Lamps/Electronic Ballasts 2 176.0 0.18 2,400 422 84.48$ NONE PROPOSED 2 176.0 0.18 2,400 422 422 NONE PROPOSED 0 - - - - -$ 0 0 0 0 0 0 0
244 Memorial Middle School 010 Women's Locker Room Unidentifiable 3 0.0 0.00 2,400 0 -$ NONE PROPOSED 3 0.0 0.00 2,400 0 0 NONE PROPOSED 0 - - - - -$ 0 0 0 0 0 0 0
245 Memorial Middle School 010 Womens's Bathroom 2X4 Troffers/3-T8 Lamps/Electronic Ballasts 1 88.0 0.09 2,400 211 42.24$ NONE PROPOSED 1 88.0 0.09 2,400 211 211 NONE PROPOSED 0 - - - - -$ 0 0 0 0 0 0 0
246 Memorial Middle School 010 201 2X4 Troffers/3-T8 Lamps/Electronic Ballasts 15 1320.0 1.32 2,400 3,168 633.60$ NONE PROPOSED 15 1320.0 1.32 2,400 3168 3168 NONE PROPOSED 0 - - - - -$ 0 0 0 0 0 0 0
247 Memorial Middle School 010 202 2X4 Troffers/3-T8 Lamps/Electronic Ballasts 15 1320.0 1.32 2,400 3,168 633.60$ NONE PROPOSED 15 1320.0 1.32 2,400 3168 3168 NONE PROPOSED 0 - - - - -$ 0 0 0 0 0 0 0
248 Memorial Middle School 010 203 2X4 Troffers/3-T8 Lamps/Electronic Ballasts 15 1320.0 1.32 2,400 3,168 633.60$ NONE PROPOSED 15 1320.0 1.32 2,400 3168 3168 NONE PROPOSED 0 - - - - -$ 0 0 0 0 0 0 0
249 Memorial Middle School 010 204 2X4 Troffers/3-T8 Lamps/Electronic Ballasts 15 1320.0 1.32 2,400 3,168 633.60$ NONE PROPOSED 15 1320.0 1.32 2,400 3168 3168 NONE PROPOSED 0 - - - - -$ 0 0 0 0 0 0 0
250 Memorial Middle School 010 206 2X4 Troffers/3-T8 Lamps/Electronic Ballasts 15 1320.0 1.32 2,400 3,168 633.60$ NONE PROPOSED 15 1320.0 1.32 2,400 3168 3168 NONE PROPOSED 0 - - - - -$ 0 0 0 0 0 0 0
251 Memorial Middle School 010 207 2X4 Troffers/3-T8 Lamps/Electronic Ballasts 15 1320.0 1.32 2,400 3,168 633.60$ NONE PROPOSED 15 1320.0 1.32 2,400 3168 3168 NONE PROPOSED 0 - - - - -$ 0 0 0 0 0 0 0
252 Memorial Middle School 010 210 2X4 Troffers/3-T8 Lamps/Electronic Ballasts 20 1760.0 1.76 2,400 4,224 844.80$ NONE PROPOSED 20 1760.0 1.76 2,400 4224 4224 NONE PROPOSED 0 - - - - -$ 0 0 0 0 0 0 0
253 Memorial Middle School 010 211 2X4 Troffers/3-T8 Lamps/Electronic Ballasts 15 1320.0 1.32 2,400 3,168 633.60$ NONE PROPOSED 15 1320.0 1.32 2,400 3168 3168 NONE PROPOSED 0 - - - - -$ 0 0 0 0 0 0 0
254 Memorial Middle School 010 212 2X4 Troffers/3-T8 Lamps/Electronic Ballasts 20 1760.0 1.76 2,400 4,224 844.80$ NONE PROPOSED 20 1760.0 1.76 2,400 4224 4224 NONE PROPOSED 0 - - - - -$ 0 0 0 0 0 0 0
255 Memorial Middle School 010 214 2X4 Troffers/3-T8 Lamps/Electronic Ballasts 16 1408.0 1.41 2,400 3,379 675.84$ NONE PROPOSED 16 1408.0 1.41 2,400 3379 3379 NONE PROPOSED 0 - - - - -$ 0 0 0 0 0 0 0
256 Memorial Middle School 010 215 2X4 Troffers/3-T8 Lamps/Electronic Ballasts 16 1408.0 1.41 2,400 3,379 675.84$ NONE PROPOSED 16 1408.0 1.41 2,400 3379 3379 NONE PROPOSED 0 - - - - -$ 0 0 0 0 0 0 0
257 Memorial Middle School 010 216 2X4 Troffers/3-T8 Lamps/Electronic Ballasts 20 1760.0 1.76 2,400 4,224 844.80$ NONE PROPOSED 20 1760.0 1.76 2,400 4224 4224 NONE PROPOSED 0 - - - - -$ 0 0 0 0 0 0 0
258 Memorial Middle School 010 201A 2X4 Troffers/3-T8 Lamps/Electronic Ballasts 9 792.0 0.79 2,400 1,901 380.16$ NONE PROPOSED 9 792.0 0.79 2,400 1901 1901 NONE PROPOSED 0 - - - - -$ 0 0 0 0 0 0 0
6
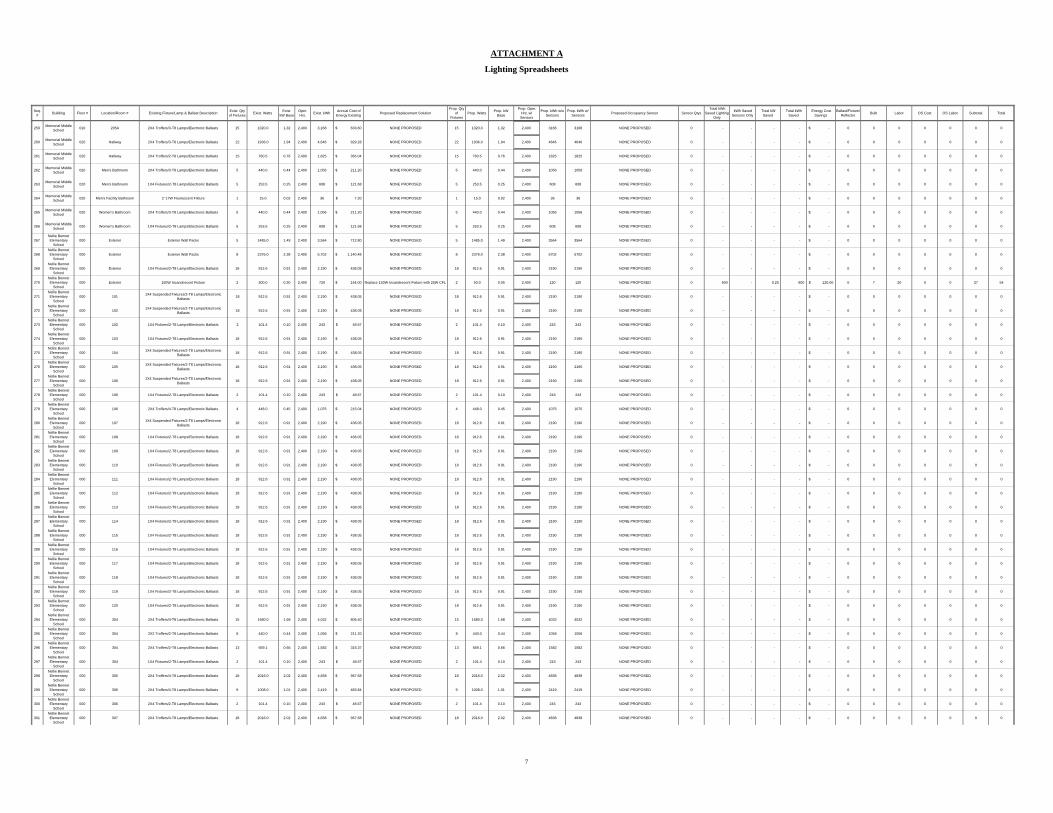
ATTACHMENT A
Lighting Spreadsheets
Seq. # Building Floor # Location/Room # Existing Fixture/Lamp & Ballast Description Exist. Qty
of Fixtures Exist. Watts Exist. kW Base
Oper. Hrs. Exist. kWh Annual Cost of
Energy Existing Proposed Replacement SolutionProp. Qty
of Fixtures
Prop. Watts Prop. kW Base
Prop. Oper. Hrs. w/ Sensors
Prop. kWh w/o Sensors
Prop. kWh w/ Sensors Proposed Occupancy Sensor Sensor Qtys
Total kWh Saved Lighting
Only
kWh Saved Sensors Only
Total kW Saved
Total kWh Saved
Energy Cost Savings
Ballast/Fixture/Reflector Bulb Labor OS Cost OS Labor Subtotal Total
259 Memorial Middle School 010 205A 2X4 Troffers/3-T8 Lamps/Electronic Ballasts 15 1320.0 1.32 2,400 3,168 633.60$ NONE PROPOSED 15 1320.0 1.32 2,400 3168 3168 NONE PROPOSED 0 - - - - -$ 0 0 0 0 0 0 0
260 Memorial Middle School 020 Hallway 2X4 Troffers/3-T8 Lamps/Electronic Ballasts 22 1936.0 1.94 2,400 4,646 929.28$ NONE PROPOSED 22 1936.0 1.94 2,400 4646 4646 NONE PROPOSED 0 - - - - -$ 0 0 0 0 0 0 0
261 Memorial Middle School 020 Hallway 2X4 Troffers/2-T8 Lamps/Electronic Ballasts 15 760.5 0.76 2,400 1,825 365.04$ NONE PROPOSED 15 760.5 0.76 2,400 1825 1825 NONE PROPOSED 0 - - - - -$ 0 0 0 0 0 0 0
262 Memorial Middle School 020 Men's Bathroom 2X4 Troffers/3-T8 Lamps/Electronic Ballasts 5 440.0 0.44 2,400 1,056 211.20$ NONE PROPOSED 5 440.0 0.44 2,400 1056 1056 NONE PROPOSED 0 - - - - -$ 0 0 0 0 0 0 0
263 Memorial Middle School 020 Men's Bathroom 1X4 Fixtures/2-T8 Lamps/Electronic Ballasts 5 253.5 0.25 2,400 608 121.68$ NONE PROPOSED 5 253.5 0.25 2,400 608 608 NONE PROPOSED 0 - - - - -$ 0 0 0 0 0 0 0
264 Memorial Middle School 020 Men's Facility Bathroom 2' 17W Fluorescent Fixture 1 15.0 0.02 2,400 36 7.20$ NONE PROPOSED 1 15.0 0.02 2,400 36 36 NONE PROPOSED 0 - - - - -$ 0 0 0 0 0 0 0
265 Memorial Middle School 020 Women's Bathroom 2X4 Troffers/3-T8 Lamps/Electronic Ballasts 5 440.0 0.44 2,400 1,056 211.20$ NONE PROPOSED 5 440.0 0.44 2,400 1056 1056 NONE PROPOSED 0 - - - - -$ 0 0 0 0 0 0 0
266 Memorial Middle School 020 Women's Bathroom 1X4 Fixtures/2-T8 Lamps/Electronic Ballasts 5 253.5 0.25 2,400 608 121.68$ NONE PROPOSED 5 253.5 0.25 2,400 608 608 NONE PROPOSED 0 - - - - -$ 0 0 0 0 0 0 0
267Nellie Bennet Elementary
School000 Exterior Exterior Wall Packs 5 1485.0 1.49 2,400 3,564 712.80$ NONE PROPOSED 5 1485.0 1.49 2,400 3564 3564 NONE PROPOSED 0 - - - - -$ 0 0 0 0 0 0 0
268Nellie Bennet Elementary
School000 Exterior Exterior Wall Packs 8 2376.0 2.38 2,400 5,702 1,140.48$ NONE PROPOSED 8 2376.0 2.38 2,400 5702 5702 NONE PROPOSED 0 - - - - -$ 0 0 0 0 0 0 0
269Nellie Bennet Elementary
School000 Exterior 1X4 Fixtures/2-T8 Lamps/Electronic Ballasts 18 912.6 0.91 2,400 2,190 438.05$ NONE PROPOSED 18 912.6 0.91 2,400 2190 2190 NONE PROPOSED 0 - - - - -$ 0 0 0 0 0 0 0
270Nellie Bennet Elementary
School000 Exterior 150W Incandescent Fixture 2 300.0 0.30 2,400 720 144.00$ Replace 150W Incandescent Fixture with 25W CFL 2 50.0 0.05 2,400 120 120 NONE PROPOSED 0 600 - 0.25 600 120.00$ 0 7 20 0 0 27 54
271Nellie Bennet Elementary
School000 101 1X4 Suspended Fixtures/2-T8 Lamps/Electronic
Ballasts 18 912.6 0.91 2,400 2,190 438.05$ NONE PROPOSED 18 912.6 0.91 2,400 2190 2190 NONE PROPOSED 0 - - - - -$ 0 0 0 0 0 0 0
272Nellie Bennet Elementary
School000 102 1X4 Suspended Fixtures/2-T8 Lamps/Electronic
Ballasts 18 912.6 0.91 2,400 2,190 438.05$ NONE PROPOSED 18 912.6 0.91 2,400 2190 2190 NONE PROPOSED 0 - - - - -$ 0 0 0 0 0 0 0
273Nellie Bennet Elementary
School000 102 1X4 Fixtures/2-T8 Lamps/Electronic Ballasts 2 101.4 0.10 2,400 243 48.67$ NONE PROPOSED 2 101.4 0.10 2,400 243 243 NONE PROPOSED 0 - - - - -$ 0 0 0 0 0 0 0
274Nellie Bennet Elementary
School000 103 1X4 Fixtures/2-T8 Lamps/Electronic Ballasts 18 912.6 0.91 2,400 2,190 438.05$ NONE PROPOSED 18 912.6 0.91 2,400 2190 2190 NONE PROPOSED 0 - - - - -$ 0 0 0 0 0 0 0
275Nellie Bennet Elementary
School000 104 1X4 Suspended Fixtures/2-T8 Lamps/Electronic
Ballasts 18 912.6 0.91 2,400 2,190 438.05$ NONE PROPOSED 18 912.6 0.91 2,400 2190 2190 NONE PROPOSED 0 - - - - -$ 0 0 0 0 0 0 0
276Nellie Bennet Elementary
School000 105 1X4 Suspended Fixtures/2-T8 Lamps/Electronic
Ballasts 18 912.6 0.91 2,400 2,190 438.05$ NONE PROPOSED 18 912.6 0.91 2,400 2190 2190 NONE PROPOSED 0 - - - - -$ 0 0 0 0 0 0 0
277Nellie Bennet Elementary
School000 106 1X4 Suspended Fixtures/2-T8 Lamps/Electronic
Ballasts 18 912.6 0.91 2,400 2,190 438.05$ NONE PROPOSED 18 912.6 0.91 2,400 2190 2190 NONE PROPOSED 0 - - - - -$ 0 0 0 0 0 0 0
278Nellie Bennet Elementary
School000 106 1X4 Fixtures/2-T8 Lamps/Electronic Ballasts 2 101.4 0.10 2,400 243 48.67$ NONE PROPOSED 2 101.4 0.10 2,400 243 243 NONE PROPOSED 0 - - - - -$ 0 0 0 0 0 0 0
279Nellie Bennet Elementary
School000 106 2X4 Troffers/4-T8 Lamps/Electronic Ballasts 4 448.0 0.45 2,400 1,075 215.04$ NONE PROPOSED 4 448.0 0.45 2,400 1075 1075 NONE PROPOSED 0 - - - - -$ 0 0 0 0 0 0 0
280Nellie Bennet Elementary
School000 107 1X4 Suspended Fixtures/2-T8 Lamps/Electronic
Ballasts 18 912.6 0.91 2,400 2,190 438.05$ NONE PROPOSED 18 912.6 0.91 2,400 2190 2190 NONE PROPOSED 0 - - - - -$ 0 0 0 0 0 0 0
281Nellie Bennet Elementary
School000 108 1X4 Fixtures/2-T8 Lamps/Electronic Ballasts 18 912.6 0.91 2,400 2,190 438.05$ NONE PROPOSED 18 912.6 0.91 2,400 2190 2190 NONE PROPOSED 0 - - - - -$ 0 0 0 0 0 0 0
282Nellie Bennet Elementary
School000 109 1X4 Fixtures/2-T8 Lamps/Electronic Ballasts 18 912.6 0.91 2,400 2,190 438.05$ NONE PROPOSED 18 912.6 0.91 2,400 2190 2190 NONE PROPOSED 0 - - - - -$ 0 0 0 0 0 0 0
283Nellie Bennet Elementary
School000 110 1X4 Fixtures/2-T8 Lamps/Electronic Ballasts 18 912.6 0.91 2,400 2,190 438.05$ NONE PROPOSED 18 912.6 0.91 2,400 2190 2190 NONE PROPOSED 0 - - - - -$ 0 0 0 0 0 0 0
284Nellie Bennet Elementary
School000 111 1X4 Fixtures/2-T8 Lamps/Electronic Ballasts 18 912.6 0.91 2,400 2,190 438.05$ NONE PROPOSED 18 912.6 0.91 2,400 2190 2190 NONE PROPOSED 0 - - - - -$ 0 0 0 0 0 0 0
285Nellie Bennet Elementary
School000 112 1X4 Fixtures/2-T8 Lamps/Electronic Ballasts 18 912.6 0.91 2,400 2,190 438.05$ NONE PROPOSED 18 912.6 0.91 2,400 2190 2190 NONE PROPOSED 0 - - - - -$ 0 0 0 0 0 0 0
286Nellie Bennet Elementary
School000 113 1X4 Fixtures/2-T8 Lamps/Electronic Ballasts 18 912.6 0.91 2,400 2,190 438.05$ NONE PROPOSED 18 912.6 0.91 2,400 2190 2190 NONE PROPOSED 0 - - - - -$ 0 0 0 0 0 0 0
287Nellie Bennet Elementary
School000 114 1X4 Fixtures/2-T8 Lamps/Electronic Ballasts 18 912.6 0.91 2,400 2,190 438.05$ NONE PROPOSED 18 912.6 0.91 2,400 2190 2190 NONE PROPOSED 0 - - - - -$ 0 0 0 0 0 0 0
288Nellie Bennet Elementary
School000 115 1X4 Fixtures/2-T8 Lamps/Electronic Ballasts 18 912.6 0.91 2,400 2,190 438.05$ NONE PROPOSED 18 912.6 0.91 2,400 2190 2190 NONE PROPOSED 0 - - - - -$ 0 0 0 0 0 0 0
289Nellie Bennet Elementary
School000 116 1X4 Fixtures/2-T8 Lamps/Electronic Ballasts 18 912.6 0.91 2,400 2,190 438.05$ NONE PROPOSED 18 912.6 0.91 2,400 2190 2190 NONE PROPOSED 0 - - - - -$ 0 0 0 0 0 0 0
290Nellie Bennet Elementary
School000 117 1X4 Fixtures/2-T8 Lamps/Electronic Ballasts 18 912.6 0.91 2,400 2,190 438.05$ NONE PROPOSED 18 912.6 0.91 2,400 2190 2190 NONE PROPOSED 0 - - - - -$ 0 0 0 0 0 0 0
291Nellie Bennet Elementary
School000 118 1X4 Fixtures/2-T8 Lamps/Electronic Ballasts 18 912.6 0.91 2,400 2,190 438.05$ NONE PROPOSED 18 912.6 0.91 2,400 2190 2190 NONE PROPOSED 0 - - - - -$ 0 0 0 0 0 0 0
292Nellie Bennet Elementary
School000 119 1X4 Fixtures/2-T8 Lamps/Electronic Ballasts 18 912.6 0.91 2,400 2,190 438.05$ NONE PROPOSED 18 912.6 0.91 2,400 2190 2190 NONE PROPOSED 0 - - - - -$ 0 0 0 0 0 0 0
293Nellie Bennet Elementary
School000 120 1X4 Fixtures/2-T8 Lamps/Electronic Ballasts 18 912.6 0.91 2,400 2,190 438.05$ NONE PROPOSED 18 912.6 0.91 2,400 2190 2190 NONE PROPOSED 0 - - - - -$ 0 0 0 0 0 0 0
294Nellie Bennet Elementary
School000 304 2X4 Troffers/4-T8 Lamps/Electronic Ballasts 15 1680.0 1.68 2,400 4,032 806.40$ NONE PROPOSED 15 1680.0 1.68 2,400 4032 4032 NONE PROPOSED 0 - - - - -$ 0 0 0 0 0 0 0
295Nellie Bennet Elementary
School000 304 2X2 Troffers/2-T8 Lamps/Electronic Ballasts 8 440.0 0.44 2,400 1,056 211.20$ NONE PROPOSED 8 440.0 0.44 2,400 1056 1056 NONE PROPOSED 0 - - - - -$ 0 0 0 0 0 0 0
296Nellie Bennet Elementary
School000 304 2X4 Troffers/2-T8 Lamps/Electronic Ballasts 13 659.1 0.66 2,400 1,582 316.37$ NONE PROPOSED 13 659.1 0.66 2,400 1582 1582 NONE PROPOSED 0 - - - - -$ 0 0 0 0 0 0 0
297Nellie Bennet Elementary
School000 304 1X4 Fixtures/2-T8 Lamps/Electronic Ballasts 2 101.4 0.10 2,400 243 48.67$ NONE PROPOSED 2 101.4 0.10 2,400 243 243 NONE PROPOSED 0 - - - - -$ 0 0 0 0 0 0 0
298Nellie Bennet Elementary
School000 305 2X4 Troffers/4-T8 Lamps/Electronic Ballasts 18 2016.0 2.02 2,400 4,838 967.68$ NONE PROPOSED 18 2016.0 2.02 2,400 4838 4838 NONE PROPOSED 0 - - - - -$ 0 0 0 0 0 0 0
299Nellie Bennet Elementary
School000 306 2X4 Troffers/4-T8 Lamps/Electronic Ballasts 9 1008.0 1.01 2,400 2,419 483.84$ NONE PROPOSED 9 1008.0 1.01 2,400 2419 2419 NONE PROPOSED 0 - - - - -$ 0 0 0 0 0 0 0
300Nellie Bennet Elementary
School000 306 2X4 Troffers/2-T8 Lamps/Electronic Ballasts 2 101.4 0.10 2,400 243 48.67$ NONE PROPOSED 2 101.4 0.10 2,400 243 243 NONE PROPOSED 0 - - - - -$ 0 0 0 0 0 0 0
301Nellie Bennet Elementary
School000 307 2X4 Troffers/4-T8 Lamps/Electronic Ballasts 18 2016.0 2.02 2,400 4,838 967.68$ NONE PROPOSED 18 2016.0 2.02 2,400 4838 4838 NONE PROPOSED 0 - - - - -$ 0 0 0 0 0 0 0
7

ATTACHMENT A
Lighting Spreadsheets
Seq. # Building Floor # Location/Room # Existing Fixture/Lamp & Ballast Description Exist. Qty
of Fixtures Exist. Watts Exist. kW Base
Oper. Hrs. Exist. kWh Annual Cost of
Energy Existing Proposed Replacement SolutionProp. Qty
of Fixtures
Prop. Watts Prop. kW Base
Prop. Oper. Hrs. w/ Sensors
Prop. kWh w/o Sensors
Prop. kWh w/ Sensors Proposed Occupancy Sensor Sensor Qtys
Total kWh Saved Lighting
Only
kWh Saved Sensors Only
Total kW Saved
Total kWh Saved
Energy Cost Savings
Ballast/Fixture/Reflector Bulb Labor OS Cost OS Labor Subtotal Total
302Nellie Bennet Elementary
School000 308 2X4 Troffers/4-T8 Lamps/Electronic Ballasts 15 1680.0 1.68 2,400 4,032 806.40$ NONE PROPOSED 15 1680.0 1.68 2,400 4032 4032 NONE PROPOSED 0 - - - - -$ 0 0 0 0 0 0 0
303Nellie Bennet Elementary
School000 308 2X2 Troffers/2-T8 Lamps/Electronic Ballasts 1 55.0 0.06 2,400 132 26.40$ NONE PROPOSED 1 55.0 0.06 2,400 132 132 NONE PROPOSED 0 - - - - -$ 0 0 0 0 0 0 0
304Nellie Bennet Elementary
School000 309 2X4 Troffers/4-T8 Lamps/Electronic Ballasts 18 2016.0 2.02 2,400 4,838 967.68$ NONE PROPOSED 18 2016.0 2.02 2,400 4838 4838 NONE PROPOSED 0 - - - - -$ 0 0 0 0 0 0 0
305Nellie Bennet Elementary
School000 310 2X4 Troffers/4-T8 Lamps/Electronic Ballasts 14 1568.0 1.57 2,400 3,763 752.64$ NONE PROPOSED 14 1568.0 1.57 2,400 3763 3763 NONE PROPOSED 0 - - - - -$ 0 0 0 0 0 0 0
306Nellie Bennet Elementary
School000 310 2X2 Troffers/2-T8 Lamps/Electronic Ballasts 3 165.0 0.17 2,400 396 79.20$ NONE PROPOSED 3 165.0 0.17 2,400 396 396 NONE PROPOSED 0 - - - - -$ 0 0 0 0 0 0 0
307Nellie Bennet Elementary
School000 103A 1X4 Fixtures/2-T8 Lamps/Electronic Ballasts 12 608.4 0.61 2,400 1,460 292.03$ NONE PROPOSED 12 608.4 0.61 2,400 1460 1460 NONE PROPOSED 0 - - - - -$ 0 0 0 0 0 0 0
308Nellie Bennet Elementary
School000 109A 2X4 Troffers/4-T8 Lamps/Electronic Ballasts 3 336.0 0.34 2,400 806 161.28$ NONE PROPOSED 3 336.0 0.34 2,400 806 806 NONE PROPOSED 0 - - - - -$ 0 0 0 0 0 0 0
309Nellie Bennet Elementary
School000 109B 2X4 Troffers/4-T8 Lamps/Electronic Ballasts 3 336.0 0.34 2,400 806 161.28$ NONE PROPOSED 3 336.0 0.34 2,400 806 806 NONE PROPOSED 0 - - - - -$ 0 0 0 0 0 0 0
310Nellie Bennet Elementary
School010 Boiler Room 1X4 Fixtures/2-T8 Lamps/Electronic Ballasts 14 709.8 0.71 2,400 1,704 340.70$ NONE PROPOSED 14 709.8 0.71 2,400 1704 1704 NONE PROPOSED 0 - - - - -$ 0 0 0 0 0 0 0
311Nellie Bennet Elementary
School010 Boy's Bathroom 2X2 Troffers/2-T8 Lamps/Electronic Ballasts 5 275.0 0.28 2,400 660 132.00$ NONE PROPOSED 5 275.0 0.28 2,400 660 660 NONE PROPOSED 0 - - - - -$ 0 0 0 0 0 0 0
312Nellie Bennet Elementary
School010 Boy's Bathroom 2X2 Troffers/2-T8 Lamps/Electronic Ballasts 8 440.0 0.44 2,400 1,056 211.20$ NONE PROPOSED 8 440.0 0.44 2,400 1056 1056 NONE PROPOSED 0 - - - - -$ 0 0 0 0 0 0 0
313Nellie Bennet Elementary
School010 Boy's Bathroom 2X2 Troffers/2-T8 Lamps/Electronic Ballasts 7 385.0 0.39 2,400 924 184.80$ NONE PROPOSED 7 385.0 0.39 2,400 924 924 NONE PROPOSED 0 - - - - -$ 0 0 0 0 0 0 0
314Nellie Bennet Elementary
School010 Boy's Bathroom 2X2 Troffers/2-T8 Lamps/Electronic Ballasts 5 275.0 0.28 2,400 660 132.00$ NONE PROPOSED 5 275.0 0.28 2,400 660 660 NONE PROPOSED 0 - - - - -$ 0 0 0 0 0 0 0
315Nellie Bennet Elementary
School010 Boy's Locker Room 2X2 Troffers/2-T8 Lamps/Electronic Ballasts 20 1100.0 1.10 2,400 2,640 528.00$ NONE PROPOSED 20 1100.0 1.10 2,400 2640 2640 NONE PROPOSED 0 - - - - -$ 0 0 0 0 0 0 0
316Nellie Bennet Elementary
School010 Cafeteria 2X4 Troffers/4-T8 Lamps/Electronic Ballasts 30 3360.0 3.36 2,400 8,064 1,612.80$ NONE PROPOSED 30 3360.0 3.36 2,400 8064 8064 NONE PROPOSED 0 - - - - -$ 0 0 0 0 0 0 0
317Nellie Bennet Elementary
School010 Computer Room 2X4 Troffers/2-T8 Lamps/Electronic Ballasts 21 1064.7 1.06 2,400 2,555 511.06$ NONE PROPOSED 21 1064.7 1.06 2,400 2555 2555 NONE PROPOSED 0 - - - - -$ 0 0 0 0 0 0 0
318Nellie Bennet Elementary
School010 CST 2X2 Troffers/2-T8 Lamps/Electronic Ballasts 25 1375.0 1.38 2,400 3,300 660.00$ NONE PROPOSED 25 1375.0 1.38 2,400 3300 3300 NONE PROPOSED 0 - - - - -$ 0 0 0 0 0 0 0
319Nellie Bennet Elementary
School010 Electrical Room 1X4 Suspended Fixtures/2-T8 Lamps/Electronic
Ballasts 3 152.1 0.15 2,400 365 73.01$ NONE PROPOSED 3 152.1 0.15 2,400 365 365 NONE PROPOSED 0 - - - - -$ 0 0 0 0 0 0 0
320Nellie Bennet Elementary
School000 Exterior 42W CFL 4 168.0 0.17 2,400 403 80.64$ NONE PROPOSED 4 168.0 0.17 2,400 403 403 NONE PROPOSED 0 - - - - -$ 0 0 0 0 0 0 0
321Nellie Bennet Elementary
School000 Girl's Bathroom 2X2 Troffers/2-T8 Lamps/Electronic Ballasts 5 275.0 0.28 2,400 660 132.00$ NONE PROPOSED 5 275.0 0.28 2,400 660 660 NONE PROPOSED 0 - - - - -$ 0 0 0 0 0 0 0
322Nellie Bennet Elementary
School000 Girl's Bathroom 2X2 Troffers/2-T8 Lamps/Electronic Ballasts 8 440.0 0.44 2,400 1,056 211.20$ NONE PROPOSED 8 440.0 0.44 2,400 1056 1056 NONE PROPOSED 0 - - - - -$ 0 0 0 0 0 0 0
323Nellie Bennet Elementary
School000 Girl's Bathroom 2X2 Troffers/2-T8 Lamps/Electronic Ballasts 7 385.0 0.39 2,400 924 184.80$ NONE PROPOSED 7 385.0 0.39 2,400 924 924 NONE PROPOSED 0 - - - - -$ 0 0 0 0 0 0 0
324Nellie Bennet Elementary
School000 Girl's Bathroom 2X2 Troffers/2-T8 Lamps/Electronic Ballasts 5 275.0 0.28 2,400 660 132.00$ NONE PROPOSED 5 275.0 0.28 2,400 660 660 NONE PROPOSED 0 - - - - -$ 0 0 0 0 0 0 0
325Nellie Bennet Elementary
School000 Girl's Locker Room 2X2 Troffers/2-T8 Lamps/Electronic Ballasts 20 1100.0 1.10 2,400 2,640 528.00$ NONE PROPOSED 20 1100.0 1.10 2,400 2640 2640 NONE PROPOSED 0 - - - - -$ 0 0 0 0 0 0 0
326Nellie Bennet Elementary
School000 Gym 400W Metal Halide Fixtures 18 8244.0 8.24 2,400 19,786 3,957.12$ Replace Metal Halide Fixtures with 6-Lamp
Fluorescent Highbay Fixtures 18 4068.0 4.07 2,400 9763 9763 NONE PROPOSED 0 10,022 - 4.18 10,022 2,004.48$ 168 105 15 0 0 288 5184
327Nellie Bennet Elementary
School000 Hallway 1X4 Fixtures/2-T8 Lamps/Electronic Ballasts 40 2028.0 2.03 2,400 4,867 973.44$ NONE PROPOSED 40 2028.0 2.03 2,400 4867 4867 NONE PROPOSED 0 - - - - -$ 0 0 0 0 0 0 0
328Nellie Bennet Elementary
School000 Hallway 2X4 Troffers/3-T8 Lamps/Electronic Ballasts 7 616.0 0.62 2,400 1,478 295.68$ NONE PROPOSED 7 616.0 0.62 2,400 1478 1478 NONE PROPOSED 0 - - - - -$ 0 0 0 0 0 0 0
329Nellie Bennet Elementary
School000 Hallway 2X2 Troffers/2-T8 Lamps/Electronic Ballasts 97 5335.0 5.34 2,400 12,804 2,560.80$ NONE PROPOSED 97 5335.0 5.34 2,400 12804 12804 NONE PROPOSED 0 - - - - -$ 0 0 0 0 0 0 0
330Nellie Bennet Elementary
School000 Hallway 1X4 Fixtures/2-T8 Lamps/Electronic Ballasts 18 912.6 0.91 2,400 2,190 438.05$ NONE PROPOSED 18 912.6 0.91 2,400 2190 2190 NONE PROPOSED 0 - - - - -$ 0 0 0 0 0 0 0
331Nellie Bennet Elementary
School000 Hallway 100W Incandescent Fixture 38 3800.0 3.80 2,400 9,120 1,824.00$ Replace 100W Incandescent Fixture with 25W CFL 38 950.0 0.95 2,400 2280 2280 NONE PROPOSED 0 6,840 - 2.85 6,840 1,368.00$ 0 7 20 0 0 27 1026
332Nellie Bennet Elementary
School000 Hallway 1X4 Fixtures/2-T8 Lamps/Electronic Ballasts 18 912.6 0.91 2,400 2,190 438.05$ NONE PROPOSED 18 912.6 0.91 2,400 2190 2190 NONE PROPOSED 0 - - - - -$ 0 0 0 0 0 0 0
333Nellie Bennet Elementary
School000 Hallway 1X4 Fixtures/1-T8 Lamps/Electronic Ballasts 25 635.0 0.64 2,400 1,524 304.80$ NONE PROPOSED 25 635.0 0.64 2,400 1524 1524 NONE PROPOSED 0 - - - - -$ 0 0 0 0 0 0 0
334Nellie Bennet Elementary
School000 Hallway Unidentifiable 16 0.0 0.00 2,400 0 -$ NONE PROPOSED 16 0.0 0.00 2,400 0 0 NONE PROPOSED 0 - - - - -$ 0 0 0 0 0 0 0
335Nellie Bennet Elementary
School000 Kitchen 1X8 Fixtures/4-T8 Lamps/Electronic Ballasts 10 1120.0 1.12 2,400 2,688 537.60$ NONE PROPOSED 10 1120.0 1.12 2,400 2688 2688 NONE PROPOSED 0 - - - - -$ 0 0 0 0 0 0 0
336Nellie Bennet Elementary
School000 Library 2X4 Troffers/3-T8 Lamps/Electronic Ballasts 30 2640.0 2.64 2,400 6,336 1,267.20$ NONE PROPOSED 30 2640.0 2.64 2,400 6336 6336 NONE PROPOSED 0 - - - - -$ 0 0 0 0 0 0 0
337Nellie Bennet Elementary
School010 Main Office 2X4 Troffers/4-T8 Lamps/Electronic Ballasts 8 896.0 0.90 2,400 2,150 430.08$ NONE PROPOSED 8 896.0 0.90 2,400 2150 2150 NONE PROPOSED 0 - - - - -$ 0 0 0 0 0 0 0
338Nellie Bennet Elementary
School010 Main Office 2X2 Troffers/2-T8 Lamps/Electronic Ballasts 11 605.0 0.61 2,400 1,452 290.40$ NONE PROPOSED 11 605.0 0.61 2,400 1452 1452 NONE PROPOSED 0 - - - - -$ 0 0 0 0 0 0 0
339Nellie Bennet Elementary
School010 Main Office 1X4 Fixtures/2-T8 Lamps/Electronic Ballasts 2 101.4 0.10 2,400 243 48.67$ NONE PROPOSED 2 101.4 0.10 2,400 243 243 NONE PROPOSED 0 - - - - -$ 0 0 0 0 0 0 0
340Nellie Bennet Elementary
School010 Men's Bathroom 2X2 Troffers/2-T8 Lamps/Electronic Ballasts 1 55.0 0.06 2,400 132 26.40$ NONE PROPOSED 1 55.0 0.06 2,400 132 132 NONE PROPOSED 0 - - - - -$ 0 0 0 0 0 0 0
341Nellie Bennet Elementary
School010 Men's Bathroom 2' 17W Fluorescent Fixture 6 90.0 0.09 2,400 216 43.20$ NONE PROPOSED 6 90.0 0.09 2,400 216 216 NONE PROPOSED 0 - - - - -$ 0 0 0 0 0 0 0
342Nellie Bennet Elementary
School010 Nurse 2X4 Troffers/2-T8 Lamps/Electronic Ballasts 2 101.4 0.10 2,400 243 48.67$ NONE PROPOSED 2 101.4 0.10 2,400 243 243 NONE PROPOSED 0 - - - - -$ 0 0 0 0 0 0 0
343Nellie Bennet Elementary
School010 Nurse 2X2 Troffers/2-T8 Lamps/Electronic Ballasts 8 440.0 0.44 2,400 1,056 211.20$ NONE PROPOSED 8 440.0 0.44 2,400 1056 1056 NONE PROPOSED 0 - - - - -$ 0 0 0 0 0 0 0
344Nellie Bennet Elementary
School010 Nurse 2' 17W Fluorescent Fixture 1 15.0 0.02 2,400 36 7.20$ NONE PROPOSED 1 15.0 0.02 2,400 36 36 NONE PROPOSED 0 - - - - -$ 0 0 0 0 0 0 0
8
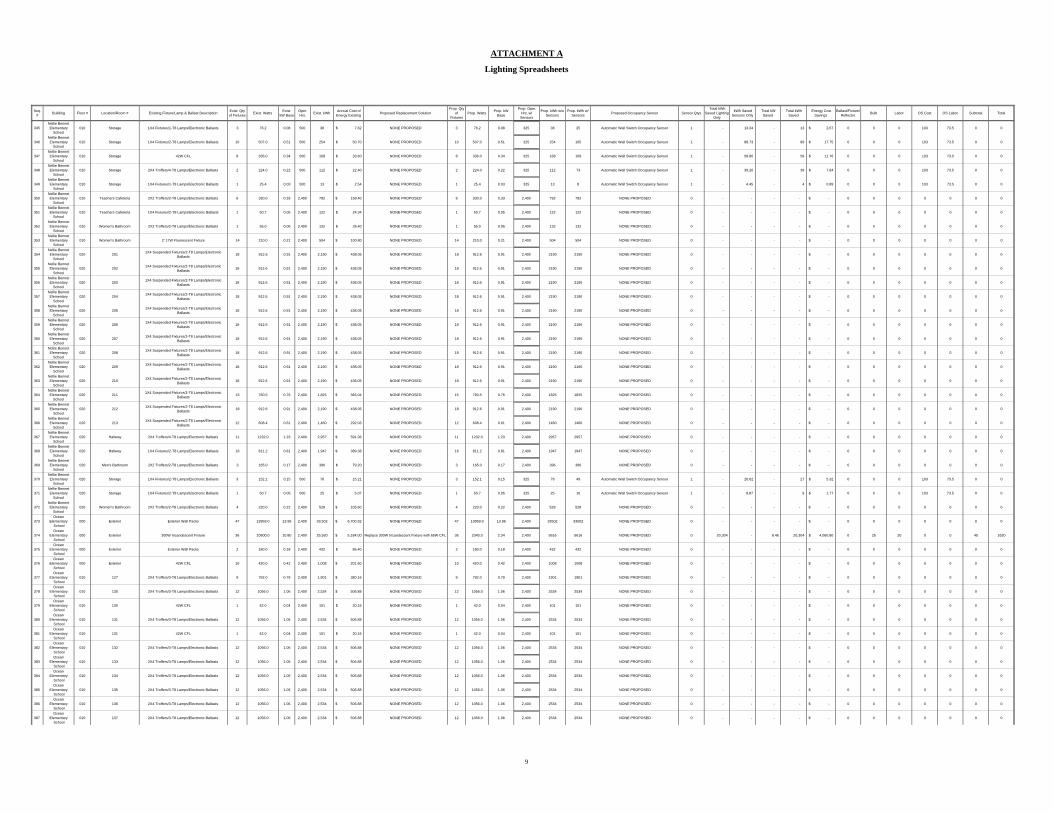
ATTACHMENT A
Lighting Spreadsheets
Seq. # Building Floor # Location/Room # Existing Fixture/Lamp & Ballast Description Exist. Qty
of Fixtures Exist. Watts Exist. kW Base
Oper. Hrs. Exist. kWh Annual Cost of
Energy Existing Proposed Replacement SolutionProp. Qty
of Fixtures
Prop. Watts Prop. kW Base
Prop. Oper. Hrs. w/ Sensors
Prop. kWh w/o Sensors
Prop. kWh w/ Sensors Proposed Occupancy Sensor Sensor Qtys
Total kWh Saved Lighting
Only
kWh Saved Sensors Only
Total kW Saved
Total kWh Saved
Energy Cost Savings
Ballast/Fixture/Reflector Bulb Labor OS Cost OS Labor Subtotal Total
345Nellie Bennet Elementary
School010 Storage 1X4 Fixtures/1-T8 Lamps/Electronic Ballasts 3 76.2 0.08 500 38 7.62$ NONE PROPOSED 3 76.2 0.08 325 38 25 Automatic Wall Switch Occupancy Sensor 1 - 13.34 - 13 2.67$ 0 0 0 103 73.5 0 0
346Nellie Bennet Elementary
School010 Storage 1X4 Fixtures/2-T8 Lamps/Electronic Ballasts 10 507.0 0.51 500 254 50.70$ NONE PROPOSED 10 507.0 0.51 325 254 165 Automatic Wall Switch Occupancy Sensor 1 - 88.73 - 89 17.75$ 0 0 0 103 73.5 0 0
347Nellie Bennet Elementary
School010 Storage 42W CFL 8 336.0 0.34 500 168 33.60$ NONE PROPOSED 8 336.0 0.34 325 168 109 Automatic Wall Switch Occupancy Sensor 1 - 58.80 - 59 11.76$ 0 0 0 103 73.5 0 0
348Nellie Bennet Elementary
School010 Storage 2X4 Troffers/4-T8 Lamps/Electronic Ballasts 2 224.0 0.22 500 112 22.40$ NONE PROPOSED 2 224.0 0.22 325 112 73 Automatic Wall Switch Occupancy Sensor 1 - 39.20 - 39 7.84$ 0 0 0 103 73.5 0 0
349Nellie Bennet Elementary
School010 Storage 1X4 Fixtures/1-T8 Lamps/Electronic Ballasts 1 25.4 0.03 500 13 2.54$ NONE PROPOSED 1 25.4 0.03 325 13 8 Automatic Wall Switch Occupancy Sensor 1 - 4.45 - 4 0.89$ 0 0 0 103 73.5 0 0
350Nellie Bennet Elementary
School010 Teachers Cafeteria 2X2 Troffers/2-T8 Lamps/Electronic Ballasts 6 330.0 0.33 2,400 792 158.40$ NONE PROPOSED 6 330.0 0.33 2,400 792 792 NONE PROPOSED 0 - - - - -$ 0 0 0 0 0 0 0
351Nellie Bennet Elementary
School010 Teachers Cafeteria 1X4 Fixtures/2-T8 Lamps/Electronic Ballasts 1 50.7 0.05 2,400 122 24.34$ NONE PROPOSED 1 50.7 0.05 2,400 122 122 NONE PROPOSED 0 - - - - -$ 0 0 0 0 0 0 0
352Nellie Bennet Elementary
School010 Women's Bathroom 2X2 Troffers/2-T8 Lamps/Electronic Ballasts 1 55.0 0.06 2,400 132 26.40$ NONE PROPOSED 1 55.0 0.06 2,400 132 132 NONE PROPOSED 0 - - - - -$ 0 0 0 0 0 0 0
353Nellie Bennet Elementary
School010 Women's Bathroom 2' 17W Fluorescent Fixture 14 210.0 0.21 2,400 504 100.80$ NONE PROPOSED 14 210.0 0.21 2,400 504 504 NONE PROPOSED 0 - - - - -$ 0 0 0 0 0 0 0
354Nellie Bennet Elementary
School020 201 1X4 Suspended Fixtures/2-T8 Lamps/Electronic
Ballasts 18 912.6 0.91 2,400 2,190 438.05$ NONE PROPOSED 18 912.6 0.91 2,400 2190 2190 NONE PROPOSED 0 - - - - -$ 0 0 0 0 0 0 0
355Nellie Bennet Elementary
School020 202 1X4 Suspended Fixtures/2-T8 Lamps/Electronic
Ballasts 18 912.6 0.91 2,400 2,190 438.05$ NONE PROPOSED 18 912.6 0.91 2,400 2190 2190 NONE PROPOSED 0 - - - - -$ 0 0 0 0 0 0 0
356Nellie Bennet Elementary
School020 203 1X4 Suspended Fixtures/2-T8 Lamps/Electronic
Ballasts 18 912.6 0.91 2,400 2,190 438.05$ NONE PROPOSED 18 912.6 0.91 2,400 2190 2190 NONE PROPOSED 0 - - - - -$ 0 0 0 0 0 0 0
357Nellie Bennet Elementary
School020 204 1X4 Suspended Fixtures/2-T8 Lamps/Electronic
Ballasts 18 912.6 0.91 2,400 2,190 438.05$ NONE PROPOSED 18 912.6 0.91 2,400 2190 2190 NONE PROPOSED 0 - - - - -$ 0 0 0 0 0 0 0
358Nellie Bennet Elementary
School020 205 1X4 Suspended Fixtures/2-T8 Lamps/Electronic
Ballasts 18 912.6 0.91 2,400 2,190 438.05$ NONE PROPOSED 18 912.6 0.91 2,400 2190 2190 NONE PROPOSED 0 - - - - -$ 0 0 0 0 0 0 0
359Nellie Bennet Elementary
School020 206 1X4 Suspended Fixtures/2-T8 Lamps/Electronic
Ballasts 18 912.6 0.91 2,400 2,190 438.05$ NONE PROPOSED 18 912.6 0.91 2,400 2190 2190 NONE PROPOSED 0 - - - - -$ 0 0 0 0 0 0 0
360Nellie Bennet Elementary
School020 207 1X4 Suspended Fixtures/2-T8 Lamps/Electronic
Ballasts 18 912.6 0.91 2,400 2,190 438.05$ NONE PROPOSED 18 912.6 0.91 2,400 2190 2190 NONE PROPOSED 0 - - - - -$ 0 0 0 0 0 0 0
361Nellie Bennet Elementary
School020 208 1X4 Suspended Fixtures/2-T8 Lamps/Electronic
Ballasts 18 912.6 0.91 2,400 2,190 438.05$ NONE PROPOSED 18 912.6 0.91 2,400 2190 2190 NONE PROPOSED 0 - - - - -$ 0 0 0 0 0 0 0
362Nellie Bennet Elementary
School020 209 1X4 Suspended Fixtures/2-T8 Lamps/Electronic
Ballasts 18 912.6 0.91 2,400 2,190 438.05$ NONE PROPOSED 18 912.6 0.91 2,400 2190 2190 NONE PROPOSED 0 - - - - -$ 0 0 0 0 0 0 0
363Nellie Bennet Elementary
School020 210 1X4 Suspended Fixtures/2-T8 Lamps/Electronic
Ballasts 18 912.6 0.91 2,400 2,190 438.05$ NONE PROPOSED 18 912.6 0.91 2,400 2190 2190 NONE PROPOSED 0 - - - - -$ 0 0 0 0 0 0 0
364Nellie Bennet Elementary
School020 211 1X4 Suspended Fixtures/2-T8 Lamps/Electronic
Ballasts 15 760.5 0.76 2,400 1,825 365.04$ NONE PROPOSED 15 760.5 0.76 2,400 1825 1825 NONE PROPOSED 0 - - - - -$ 0 0 0 0 0 0 0
365Nellie Bennet Elementary
School020 212 1X4 Suspended Fixtures/2-T8 Lamps/Electronic
Ballasts 18 912.6 0.91 2,400 2,190 438.05$ NONE PROPOSED 18 912.6 0.91 2,400 2190 2190 NONE PROPOSED 0 - - - - -$ 0 0 0 0 0 0 0
366Nellie Bennet Elementary
School020 213 1X4 Suspended Fixtures/2-T8 Lamps/Electronic
Ballasts 12 608.4 0.61 2,400 1,460 292.03$ NONE PROPOSED 12 608.4 0.61 2,400 1460 1460 NONE PROPOSED 0 - - - - -$ 0 0 0 0 0 0 0
367Nellie Bennet Elementary
School020 Hallway 2X4 Troffers/4-T8 Lamps/Electronic Ballasts 11 1232.0 1.23 2,400 2,957 591.36$ NONE PROPOSED 11 1232.0 1.23 2,400 2957 2957 NONE PROPOSED 0 - - - - -$ 0 0 0 0 0 0 0
368Nellie Bennet Elementary
School020 Hallway 1X4 Fixtures/2-T8 Lamps/Electronic Ballasts 16 811.2 0.81 2,400 1,947 389.38$ NONE PROPOSED 16 811.2 0.81 2,400 1947 1947 NONE PROPOSED 0 - - - - -$ 0 0 0 0 0 0 0
369Nellie Bennet Elementary
School020 Men's Bathroom 2X2 Troffers/2-T8 Lamps/Electronic Ballasts 3 165.0 0.17 2,400 396 79.20$ NONE PROPOSED 3 165.0 0.17 2,400 396 396 NONE PROPOSED 0 - - - - -$ 0 0 0 0 0 0 0
370Nellie Bennet Elementary
School020 Storage 1X4 Fixtures/2-T8 Lamps/Electronic Ballasts 3 152.1 0.15 500 76 15.21$ NONE PROPOSED 3 152.1 0.15 325 76 49 Automatic Wall Switch Occupancy Sensor 1 - 26.62 - 27 5.32$ 0 0 0 103 73.5 0 0
371Nellie Bennet Elementary
School020 Storage 1X4 Fixtures/2-T8 Lamps/Electronic Ballasts 1 50.7 0.05 500 25 5.07$ NONE PROPOSED 1 50.7 0.05 325 25 16 Automatic Wall Switch Occupancy Sensor 1 - 8.87 - 9 1.77$ 0 0 0 103 73.5 0 0
372Nellie Bennet Elementary
School020 Women's Bathroom 2X2 Troffers/2-T8 Lamps/Electronic Ballasts 4 220.0 0.22 2,400 528 105.60$ NONE PROPOSED 4 220.0 0.22 2,400 528 528 NONE PROPOSED 0 - - - - -$ 0 0 0 0 0 0 0
373Ocean
Elementary School
000 Exterior Exterior Wall Packs 47 13959.0 13.96 2,400 33,502 6,700.32$ NONE PROPOSED 47 13959.0 13.96 2,400 33502 33502 NONE PROPOSED 0 - - - - -$ 0 0 0 0 0 0 0
374Ocean
Elementary School
000 Exterior 300W Incandescent Fixture 36 10800.0 10.80 2,400 25,920 5,184.00$ Replace 300W Incandescent Fixture with 65W CFL 36 2340.0 2.34 2,400 5616 5616 NONE PROPOSED 0 20,304 - 8.46 20,304 4,060.80$ 0 25 20 0 0 45 1620
375Ocean
Elementary School
000 Exterior Exterior Wall Packs 2 180.0 0.18 2,400 432 86.40$ NONE PROPOSED 2 180.0 0.18 2,400 432 432 NONE PROPOSED 0 - - - - -$ 0 0 0 0 0 0 0
376Ocean
Elementary School
000 Exterior 42W CFL 10 420.0 0.42 2,400 1,008 201.60$ NONE PROPOSED 10 420.0 0.42 2,400 1008 1008 NONE PROPOSED 0 - - - - -$ 0 0 0 0 0 0 0
377Ocean
Elementary School
010 127 2X4 Troffers/3-T8 Lamps/Electronic Ballasts 9 792.0 0.79 2,400 1,901 380.16$ NONE PROPOSED 9 792.0 0.79 2,400 1901 1901 NONE PROPOSED 0 - - - - -$ 0 0 0 0 0 0 0
378Ocean
Elementary School
010 130 2X4 Troffers/3-T8 Lamps/Electronic Ballasts 12 1056.0 1.06 2,400 2,534 506.88$ NONE PROPOSED 12 1056.0 1.06 2,400 2534 2534 NONE PROPOSED 0 - - - - -$ 0 0 0 0 0 0 0
379Ocean
Elementary School
010 130 42W CFL 1 42.0 0.04 2,400 101 20.16$ NONE PROPOSED 1 42.0 0.04 2,400 101 101 NONE PROPOSED 0 - - - - -$ 0 0 0 0 0 0 0
380Ocean
Elementary School
010 131 2X4 Troffers/3-T8 Lamps/Electronic Ballasts 12 1056.0 1.06 2,400 2,534 506.88$ NONE PROPOSED 12 1056.0 1.06 2,400 2534 2534 NONE PROPOSED 0 - - - - -$ 0 0 0 0 0 0 0
381Ocean
Elementary School
010 131 42W CFL 1 42.0 0.04 2,400 101 20.16$ NONE PROPOSED 1 42.0 0.04 2,400 101 101 NONE PROPOSED 0 - - - - -$ 0 0 0 0 0 0 0
382Ocean
Elementary School
010 132 2X4 Troffers/3-T8 Lamps/Electronic Ballasts 12 1056.0 1.06 2,400 2,534 506.88$ NONE PROPOSED 12 1056.0 1.06 2,400 2534 2534 NONE PROPOSED 0 - - - - -$ 0 0 0 0 0 0 0
383Ocean
Elementary School
010 133 2X4 Troffers/3-T8 Lamps/Electronic Ballasts 12 1056.0 1.06 2,400 2,534 506.88$ NONE PROPOSED 12 1056.0 1.06 2,400 2534 2534 NONE PROPOSED 0 - - - - -$ 0 0 0 0 0 0 0
384Ocean
Elementary School
010 134 2X4 Troffers/3-T8 Lamps/Electronic Ballasts 12 1056.0 1.06 2,400 2,534 506.88$ NONE PROPOSED 12 1056.0 1.06 2,400 2534 2534 NONE PROPOSED 0 - - - - -$ 0 0 0 0 0 0 0
385Ocean
Elementary School
010 135 2X4 Troffers/3-T8 Lamps/Electronic Ballasts 12 1056.0 1.06 2,400 2,534 506.88$ NONE PROPOSED 12 1056.0 1.06 2,400 2534 2534 NONE PROPOSED 0 - - - - -$ 0 0 0 0 0 0 0
386Ocean
Elementary School
010 136 2X4 Troffers/3-T8 Lamps/Electronic Ballasts 12 1056.0 1.06 2,400 2,534 506.88$ NONE PROPOSED 12 1056.0 1.06 2,400 2534 2534 NONE PROPOSED 0 - - - - -$ 0 0 0 0 0 0 0
387Ocean
Elementary School
010 137 2X4 Troffers/3-T8 Lamps/Electronic Ballasts 12 1056.0 1.06 2,400 2,534 506.88$ NONE PROPOSED 12 1056.0 1.06 2,400 2534 2534 NONE PROPOSED 0 - - - - -$ 0 0 0 0 0 0 0
9

ATTACHMENT A
Lighting Spreadsheets
Seq. # Building Floor # Location/Room # Existing Fixture/Lamp & Ballast Description Exist. Qty
of Fixtures Exist. Watts Exist. kW Base
Oper. Hrs. Exist. kWh Annual Cost of
Energy Existing Proposed Replacement SolutionProp. Qty
of Fixtures
Prop. Watts Prop. kW Base
Prop. Oper. Hrs. w/ Sensors
Prop. kWh w/o Sensors
Prop. kWh w/ Sensors Proposed Occupancy Sensor Sensor Qtys
Total kWh Saved Lighting
Only
kWh Saved Sensors Only
Total kW Saved
Total kWh Saved
Energy Cost Savings
Ballast/Fixture/Reflector Bulb Labor OS Cost OS Labor Subtotal Total
388Ocean
Elementary School
010 138 2X4 Troffers/3-T8 Lamps/Electronic Ballasts 9 792.0 0.79 2,400 1,901 380.16$ NONE PROPOSED 9 792.0 0.79 2,400 1901 1901 NONE PROPOSED 0 - - - - -$ 0 0 0 0 0 0 0
389Ocean
Elementary School
010 150 2X4 Troffers/4-T8 Lamps/Electronic Ballasts 3 336.0 0.34 2,400 806 161.28$ NONE PROPOSED 3 336.0 0.34 2,400 806 806 NONE PROPOSED 0 - - - - -$ 0 0 0 0 0 0 0
390Ocean
Elementary School
010 151 2X4 Troffers/4-T8 Lamps/Electronic Ballasts 16 1792.0 1.79 2,400 4,301 860.16$ NONE PROPOSED 16 1792.0 1.79 2,400 4301 4301 NONE PROPOSED 0 - - - - -$ 0 0 0 0 0 0 0
391Ocean
Elementary School
010 151 42W CFL 2 84.0 0.08 2,400 202 40.32$ NONE PROPOSED 2 84.0 0.08 2,400 202 202 NONE PROPOSED 0 - - - - -$ 0 0 0 0 0 0 0
392Ocean
Elementary School
010 160 2X4 Troffers/3-T8 Lamps/Electronic Ballasts 6 528.0 0.53 2,400 1,267 253.44$ NONE PROPOSED 6 528.0 0.53 2,400 1267 1267 NONE PROPOSED 0 - - - - -$ 0 0 0 0 0 0 0
393Ocean
Elementary School
010 161 2X4 Troffers/3-T8 Lamps/Electronic Ballasts 6 528.0 0.53 2,400 1,267 253.44$ NONE PROPOSED 6 528.0 0.53 2,400 1267 1267 NONE PROPOSED 0 - - - - -$ 0 0 0 0 0 0 0
394Ocean
Elementary School
010 164 2X4 Troffers/3-T8 Lamps/Electronic Ballasts 16 1408.0 1.41 2,400 3,379 675.84$ NONE PROPOSED 16 1408.0 1.41 2,400 3379 3379 NONE PROPOSED 0 - - - - -$ 0 0 0 0 0 0 0
395Ocean
Elementary School
010 164 42W CFL 3 126.0 0.13 2,400 302 60.48$ NONE PROPOSED 3 126.0 0.13 2,400 302 302 NONE PROPOSED 0 - - - - -$ 0 0 0 0 0 0 0
396Ocean
Elementary School
010 167 2X4 Troffers/3-T8 Lamps/Electronic Ballasts 23 2024.0 2.02 2,400 4,858 971.52$ NONE PROPOSED 23 2024.0 2.02 2,400 4858 4858 NONE PROPOSED 0 - - - - -$ 0 0 0 0 0 0 0
397Ocean
Elementary School
010 170 2X4 Troffers/3-T8 Lamps/Electronic Ballasts 16 1408.0 1.41 2,400 3,379 675.84$ NONE PROPOSED 16 1408.0 1.41 2,400 3379 3379 NONE PROPOSED 0 - - - - -$ 0 0 0 0 0 0 0
398Ocean
Elementary School
010 174 2X4 Troffers/3-T8 Lamps/Electronic Ballasts 9 792.0 0.79 2,400 1,901 380.16$ NONE PROPOSED 9 792.0 0.79 2,400 1901 1901 NONE PROPOSED 0 - - - - -$ 0 0 0 0 0 0 0
399Ocean
Elementary School
010 300 2X2 Troffers/2-T8 Lamps/Electronic Ballasts 14 770.0 0.77 2,400 1,848 369.60$ NONE PROPOSED 14 770.0 0.77 2,400 1848 1848 NONE PROPOSED 0 - - - - -$ 0 0 0 0 0 0 0
400Ocean
Elementary School
010 301 2X4 Troffers/3-T8 Lamps/Electronic Ballasts 6 528.0 0.53 2,400 1,267 253.44$ NONE PROPOSED 6 528.0 0.53 2,400 1267 1267 NONE PROPOSED 0 - - - - -$ 0 0 0 0 0 0 0
401Ocean
Elementary School
010 302 2X4 Troffers/2-T8 Lamps/Electronic Ballasts 15 760.5 0.76 2,400 1,825 365.04$ NONE PROPOSED 15 760.5 0.76 2,400 1825 1825 NONE PROPOSED 0 - - - - -$ 0 0 0 0 0 0 0
402Ocean
Elementary School
010 302 42W CFL 3 126.0 0.13 2,400 302 60.48$ NONE PROPOSED 3 126.0 0.13 2,400 302 302 NONE PROPOSED 0 - - - - -$ 0 0 0 0 0 0 0
403Ocean
Elementary School
010 302 2X2 Troffers/2-T8 Lamps/Electronic Ballasts 2 110.0 0.11 2,400 264 52.80$ NONE PROPOSED 2 110.0 0.11 2,400 264 264 NONE PROPOSED 0 - - - - -$ 0 0 0 0 0 0 0
404Ocean
Elementary School
010 303 2X4 Troffers/3-T8 Lamps/Electronic Ballasts 15 1320.0 1.32 2,400 3,168 633.60$ NONE PROPOSED 15 1320.0 1.32 2,400 3168 3168 NONE PROPOSED 0 - - - - -$ 0 0 0 0 0 0 0
405Ocean
Elementary School
010 304 2X4 Troffers/3-T8 Lamps/Electronic Ballasts 12 1056.0 1.06 2,400 2,534 506.88$ NONE PROPOSED 12 1056.0 1.06 2,400 2534 2534 NONE PROPOSED 0 - - - - -$ 0 0 0 0 0 0 0
406Ocean
Elementary School
010 305 2X4 Troffers/2-T8 Lamps/Electronic Ballasts 15 760.5 0.76 2,400 1,825 365.04$ NONE PROPOSED 15 760.5 0.76 2,400 1825 1825 NONE PROPOSED 0 - - - - -$ 0 0 0 0 0 0 0
407Ocean
Elementary School
010 Administration Office 2X4 Troffers/4-T8 Lamps/Electronic Ballasts 18 2016.0 2.02 2,400 4,838 967.68$ NONE PROPOSED 18 2016.0 2.02 2,400 4838 4838 NONE PROPOSED 0 - - - - -$ 0 0 0 0 0 0 0
408Ocean
Elementary School
010 Administration Office 2X2 Troffers/2-T8 Lamps/Electronic Ballasts 4 220.0 0.22 2,400 528 105.60$ NONE PROPOSED 4 220.0 0.22 2,400 528 528 NONE PROPOSED 0 - - - - -$ 0 0 0 0 0 0 0
409Ocean
Elementary School
010 Bathroom 2X2 Troffers/2-T8 Lamps/Electronic Ballasts 3 165.0 0.17 2,400 396 79.20$ NONE PROPOSED 3 165.0 0.17 2,400 396 396 NONE PROPOSED 0 - - - - -$ 0 0 0 0 0 0 0
410Ocean
Elementary School
010 Bathroom 42W CFL 1 42.0 0.04 2,400 101 20.16$ NONE PROPOSED 1 42.0 0.04 2,400 101 101 NONE PROPOSED 0 - - - - -$ 0 0 0 0 0 0 0
411Ocean
Elementary School
010 Boiler 1X4 Fixtures/2-T8 Lamps/Electronic Ballasts 20 1014.0 1.01 2,400 2,434 486.72$ NONE PROPOSED 20 1014.0 1.01 2,400 2434 2434 NONE PROPOSED 0 - - - - -$ 0 0 0 0 0 0 0
412Ocean
Elementary School
010 Boy's Bathroom 42W CFL 1 42.0 0.04 2,400 101 20.16$ NONE PROPOSED 1 42.0 0.04 2,400 101 101 NONE PROPOSED 0 - - - - -$ 0 0 0 0 0 0 0
413Ocean
Elementary School
010 Boy's Bathroom 2X2 Troffers/2-T8 Lamps/Electronic Ballasts 3 165.0 0.17 2,400 396 79.20$ NONE PROPOSED 3 165.0 0.17 2,400 396 396 NONE PROPOSED 0 - - - - -$ 0 0 0 0 0 0 0
414Ocean
Elementary School
010 Boy's Bathroom 2X2 Troffers/2-T8 Lamps/Electronic Ballasts 1 55.0 0.06 2,400 132 26.40$ NONE PROPOSED 1 55.0 0.06 2,400 132 132 NONE PROPOSED 0 - - - - -$ 0 0 0 0 0 0 0
415Ocean
Elementary School
010 Boy's Locker Room 2X4 Troffers/2-T8 Lamps/Electronic Ballasts 3 152.1 0.15 2,400 365 73.01$ NONE PROPOSED 3 152.1 0.15 2,400 365 365 NONE PROPOSED 0 - - - - -$ 0 0 0 0 0 0 0
416Ocean
Elementary School
010 Boy's Locker Room 2X2 Troffers/2-T8 Lamps/Electronic Ballasts 1 55.0 0.06 2,400 132 26.40$ NONE PROPOSED 1 55.0 0.06 2,400 132 132 NONE PROPOSED 0 - - - - -$ 0 0 0 0 0 0 0
417Ocean
Elementary School
010 Cafeteria 400W Metal Halide Fixtures 20 9160.0 9.16 2,400 21,984 4,396.80$ Replace Metal Halide Fixtures with 6-Lamp Fluorescent Highbay Fixtures 20 4520.0 4.52 2,400 10848 10848 NONE PROPOSED 0 11,136 - 4.64 11,136 2,227.20$ 168 105 15 0 0 288 5760
418Ocean
Elementary School
010 CST 2X4 Troffers/4-T8 Lamps/Electronic Ballasts 10 1120.0 1.12 2,400 2,688 537.60$ NONE PROPOSED 10 1120.0 1.12 2,400 2688 2688 NONE PROPOSED 0 - - - - -$ 0 0 0 0 0 0 0
419Ocean
Elementary School
010 Electrical Room 1X4 Fixtures/2-T8 Lamps/Electronic Ballasts 2 101.4 0.10 2,400 243 48.67$ NONE PROPOSED 2 101.4 0.10 2,400 243 243 NONE PROPOSED 0 - - - - -$ 0 0 0 0 0 0 0
420Ocean
Elementary School
010 Faculty Dining 2X4 Troffers/3-T8 Lamps/Electronic Ballasts 7 616.0 0.62 2,400 1,478 295.68$ NONE PROPOSED 7 616.0 0.62 2,400 1478 1478 NONE PROPOSED 0 - - - - -$ 0 0 0 0 0 0 0
421Ocean
Elementary School
010 Faculty Dining 42W CFL 2 84.0 0.08 2,400 202 40.32$ NONE PROPOSED 2 84.0 0.08 2,400 202 202 NONE PROPOSED 0 - - - - -$ 0 0 0 0 0 0 0
422Ocean
Elementary School
010 Girl's Bathroom 42W CFL 1 42.0 0.04 2,400 101 20.16$ NONE PROPOSED 1 42.0 0.04 2,400 101 101 NONE PROPOSED 0 - - - - -$ 0 0 0 0 0 0 0
423Ocean
Elementary School
010 Girl's Bathroom 2X2 Troffers/2-T8 Lamps/Electronic Ballasts 3 165.0 0.17 2,400 396 79.20$ NONE PROPOSED 3 165.0 0.17 2,400 396 396 NONE PROPOSED 0 - - - - -$ 0 0 0 0 0 0 0
424Ocean
Elementary School
010 Girl's Bathroom 2X2 Troffers/2-T8 Lamps/Electronic Ballasts 3 165.0 0.17 2,400 396 79.20$ NONE PROPOSED 3 165.0 0.17 2,400 396 396 NONE PROPOSED 0 - - - - -$ 0 0 0 0 0 0 0
425Ocean
Elementary School
010 Girl's Locker Room 2X4 Troffers/2-T8 Lamps/Electronic Ballasts 3 152.1 0.15 2,400 365 73.01$ NONE PROPOSED 3 152.1 0.15 2,400 365 365 NONE PROPOSED 0 - - - - -$ 0 0 0 0 0 0 0
426Ocean
Elementary School
010 Girl's Locker Room 2X2 Troffers/2-T8 Lamps/Electronic Ballasts 1 55.0 0.06 2,400 132 26.40$ NONE PROPOSED 1 55.0 0.06 2,400 132 132 NONE PROPOSED 0 - - - - -$ 0 0 0 0 0 0 0
427Ocean
Elementary School
010 Gym 400W Metal Halide Fixtures 24 10992.0 10.99 2,400 26,381 5,276.16$ Replace Metal Halide Fixtures with 6-Lamp Fluorescent Highbay Fixtures 24 5424.0 5.42 2,400 13018 13018 NONE PROPOSED 0 13,363 - 5.57 13,363 2,672.64$ 168 105 15 0 0 288 6912
428Ocean
Elementary School
010 Hallway 2X4 Troffers/2-T8 Lamps/Electronic Ballasts 23 1166.1 1.17 2,400 2,799 559.73$ NONE PROPOSED 23 1166.1 1.17 2,400 2799 2799 NONE PROPOSED 0 - - - - -$ 0 0 0 0 0 0 0
429Ocean
Elementary School
010 Hallway 42W CFL 78 3276.0 3.28 2,400 7,862 1,572.48$ NONE PROPOSED 78 3276.0 3.28 2,400 7862 7862 NONE PROPOSED 0 - - - - -$ 0 0 0 0 0 0 0
430Ocean
Elementary School
010 Hallway Unidentifiable 4 0.0 0.00 2,400 0 -$ NONE PROPOSED 4 0.0 0.00 2,400 0 0 NONE PROPOSED 0 - - - - -$ 0 0 0 0 0 0 0
10

ATTACHMENT A
Lighting Spreadsheets
Seq. # Building Floor # Location/Room # Existing Fixture/Lamp & Ballast Description Exist. Qty
of Fixtures Exist. Watts Exist. kW Base
Oper. Hrs. Exist. kWh Annual Cost of
Energy Existing Proposed Replacement SolutionProp. Qty
of Fixtures
Prop. Watts Prop. kW Base
Prop. Oper. Hrs. w/ Sensors
Prop. kWh w/o Sensors
Prop. kWh w/ Sensors Proposed Occupancy Sensor Sensor Qtys
Total kWh Saved Lighting
Only
kWh Saved Sensors Only
Total kW Saved
Total kWh Saved
Energy Cost Savings
Ballast/Fixture/Reflector Bulb Labor OS Cost OS Labor Subtotal Total
431Ocean
Elementary School
010 Hallway 100W Incandescent Fixture 12 1200.0 1.20 2,400 2,880 576.00$ Replace 100W Incandescent Fixture with 25W CFL 12 300.0 0.30 2,400 720 720 NONE PROPOSED 0 2,160 - 0.90 2,160 432.00$ 0 7 20 0 0 27 324
432Ocean
Elementary School
010 Hallway 1X4 Suspended Fixtures/2-T8 Lamps/Electronic Ballasts 22 1115.4 1.12 2,400 2,677 535.39$ NONE PROPOSED 22 1115.4 1.12 2,400 2677 2677 NONE PROPOSED 0 - - - - -$ 0 0 0 0 0 0 0
433Ocean
Elementary School
010 Hallway 2X2 Troffers/2-T8 Lamps/Electronic Ballasts 1 55.0 0.06 2,400 132 26.40$ NONE PROPOSED 1 55.0 0.06 2,400 132 132 NONE PROPOSED 0 - - - - -$ 0 0 0 0 0 0 0
434Ocean
Elementary School
010 Kitchen 2X4 Troffers/4-T8 Lamps/Electronic Ballasts 11 1232.0 1.23 2,400 2,957 591.36$ NONE PROPOSED 11 1232.0 1.23 2,400 2957 2957 NONE PROPOSED 0 - - - - -$ 0 0 0 0 0 0 0
435Ocean
Elementary School
010 Men's Bathroom 2X2 Troffers/2-T8 Lamps/Electronic Ballasts 1 55.0 0.06 2,400 132 26.40$ NONE PROPOSED 1 55.0 0.06 2,400 132 132 NONE PROPOSED 0 - - - - -$ 0 0 0 0 0 0 0
436Ocean
Elementary School
010 Nurse 2X4 Troffers/4-T8 Lamps/Electronic Ballasts 6 672.0 0.67 2,400 1,613 322.56$ NONE PROPOSED 6 672.0 0.67 2,400 1613 1613 NONE PROPOSED 0 - - - - -$ 0 0 0 0 0 0 0
437Ocean
Elementary School
010 Nurse 2X2 Troffers/2-T8 Lamps/Electronic Ballasts 1 55.0 0.06 2,400 132 26.40$ NONE PROPOSED 1 55.0 0.06 2,400 132 132 NONE PROPOSED 0 - - - - -$ 0 0 0 0 0 0 0
438Ocean
Elementary School
010 Principal 2X4 Troffers/4-T8 Lamps/Electronic Ballasts 7 784.0 0.78 2,400 1,882 376.32$ NONE PROPOSED 7 784.0 0.78 2,400 1882 1882 NONE PROPOSED 0 - - - - -$ 0 0 0 0 0 0 0
439Ocean
Elementary School
010 Stage 1X4 Fixtures/2-T8 Lamps/Electronic Ballasts 11 557.7 0.56 2,400 1,338 267.70$ NONE PROPOSED 11 557.7 0.56 2,400 1338 1338 NONE PROPOSED 0 - - - - -$ 0 0 0 0 0 0 0
440Ocean
Elementary School
010 Storage 2X2 Troffers/2-T8 Lamps/Electronic Ballasts 1 55.0 0.06 500 28 5.50$ NONE PROPOSED 1 55.0 0.06 325 28 18 Automatic Wall Switch Occupancy Sensor 1 - 9.63 - 10 1.93$ 0 0 0 103 73.5 0 0
441Ocean
Elementary School
010 Women's Bathroom 2X2 Troffers/2-T8 Lamps/Electronic Ballasts 1 55.0 0.06 2,400 132 26.40$ NONE PROPOSED 1 55.0 0.06 2,400 132 132 NONE PROPOSED 0 - - - - -$ 0 0 0 0 0 0 0
442Ocean
Elementary School
020 201 2X4 Troffers/3-T8 Lamps/Electronic Ballasts 9 792.0 0.79 2,400 1,901 380.16$ NONE PROPOSED 9 792.0 0.79 2,400 1901 1901 NONE PROPOSED 0 - - - - -$ 0 0 0 0 0 0 0
443Ocean
Elementary School
020 202 2X4 Troffers/3-T8 Lamps/Electronic Ballasts 12 1056.0 1.06 2,400 2,534 506.88$ NONE PROPOSED 12 1056.0 1.06 2,400 2534 2534 NONE PROPOSED 0 - - - - -$ 0 0 0 0 0 0 0
444Ocean
Elementary School
020 203 2X4 Troffers/3-T8 Lamps/Electronic Ballasts 12 1056.0 1.06 2,400 2,534 506.88$ NONE PROPOSED 12 1056.0 1.06 2,400 2534 2534 NONE PROPOSED 0 - - - - -$ 0 0 0 0 0 0 0
445Ocean
Elementary School
020 204 2X4 Troffers/3-T8 Lamps/Electronic Ballasts 12 1056.0 1.06 2,400 2,534 506.88$ NONE PROPOSED 12 1056.0 1.06 2,400 2534 2534 NONE PROPOSED 0 - - - - -$ 0 0 0 0 0 0 0
446Ocean
Elementary School
020 205 2X4 Troffers/3-T8 Lamps/Electronic Ballasts 12 1056.0 1.06 2,400 2,534 506.88$ NONE PROPOSED 12 1056.0 1.06 2,400 2534 2534 NONE PROPOSED 0 - - - - -$ 0 0 0 0 0 0 0
447Ocean
Elementary School
020 206 2X4 Troffers/3-T8 Lamps/Electronic Ballasts 12 1056.0 1.06 2,400 2,534 506.88$ NONE PROPOSED 12 1056.0 1.06 2,400 2534 2534 NONE PROPOSED 0 - - - - -$ 0 0 0 0 0 0 0
448Ocean
Elementary School
020 207 2X4 Troffers/3-T8 Lamps/Electronic Ballasts 12 1056.0 1.06 2,400 2,534 506.88$ NONE PROPOSED 12 1056.0 1.06 2,400 2534 2534 NONE PROPOSED 0 - - - - -$ 0 0 0 0 0 0 0
449Ocean
Elementary School
020 208 2X4 Troffers/3-T8 Lamps/Electronic Ballasts 12 1056.0 1.06 2,400 2,534 506.88$ NONE PROPOSED 12 1056.0 1.06 2,400 2534 2534 NONE PROPOSED 0 - - - - -$ 0 0 0 0 0 0 0
450Ocean
Elementary School
020 209 2X4 Troffers/3-T8 Lamps/Electronic Ballasts 12 1056.0 1.06 2,400 2,534 506.88$ NONE PROPOSED 12 1056.0 1.06 2,400 2534 2534 NONE PROPOSED 0 - - - - -$ 0 0 0 0 0 0 0
451Ocean
Elementary School
020 210 2X4 Troffers/3-T8 Lamps/Electronic Ballasts 12 1056.0 1.06 2,400 2,534 506.88$ NONE PROPOSED 12 1056.0 1.06 2,400 2534 2534 NONE PROPOSED 0 - - - - -$ 0 0 0 0 0 0 0
452Ocean
Elementary School
020 211 2X4 Troffers/3-T8 Lamps/Electronic Ballasts 6 528.0 0.53 2,400 1,267 253.44$ NONE PROPOSED 6 528.0 0.53 2,400 1267 1267 NONE PROPOSED 0 - - - - -$ 0 0 0 0 0 0 0
453Ocean
Elementary School
020 214 2X4 Troffers/3-T8 Lamps/Electronic Ballasts 6 528.0 0.53 2,400 1,267 253.44$ NONE PROPOSED 6 528.0 0.53 2,400 1267 1267 NONE PROPOSED 0 - - - - -$ 0 0 0 0 0 0 0
454Ocean
Elementary School
020 215 2X4 Troffers/3-T8 Lamps/Electronic Ballasts 4 352.0 0.35 2,400 845 168.96$ NONE PROPOSED 4 352.0 0.35 2,400 845 845 NONE PROPOSED 0 - - - - -$ 0 0 0 0 0 0 0
455Ocean
Elementary School
020 217 2X4 Troffers/3-T8 Lamps/Electronic Ballasts 12 1056.0 1.06 2,400 2,534 506.88$ NONE PROPOSED 12 1056.0 1.06 2,400 2534 2534 NONE PROPOSED 0 - - - - -$ 0 0 0 0 0 0 0
456Ocean
Elementary School
020 224 2X4 Troffers/3-T8 Lamps/Electronic Ballasts 12 1056.0 1.06 2,400 2,534 506.88$ NONE PROPOSED 12 1056.0 1.06 2,400 2534 2534 NONE PROPOSED 0 - - - - -$ 0 0 0 0 0 0 0
457Ocean
Elementary School
020 229 2X4 Troffers/3-T8 Lamps/Electronic Ballasts 6 528.0 0.53 2,400 1,267 253.44$ NONE PROPOSED 6 528.0 0.53 2,400 1267 1267 NONE PROPOSED 0 - - - - -$ 0 0 0 0 0 0 0
458Ocean
Elementary School
020 Hallway 2X4 Troffers/2-T8 Lamps/Electronic Ballasts 22 1115.4 1.12 2,400 2,677 535.39$ NONE PROPOSED 22 1115.4 1.12 2,400 2677 2677 NONE PROPOSED 0 - - - - -$ 0 0 0 0 0 0 0
459Ocean
Elementary School
020 Hallway 2X2 Troffers/2-T8 Lamps/Electronic Ballasts 2 110.0 0.11 2,400 264 52.80$ NONE PROPOSED 2 110.0 0.11 2,400 264 264 NONE PROPOSED 0 - - - - -$ 0 0 0 0 0 0 0
460Ocean
Elementary School
020 Library 2X2 Troffers/2-T8 Lamps/Electronic Ballasts 56 3080.0 3.08 2,400 7,392 1,478.40$ NONE PROPOSED 56 3080.0 3.08 2,400 7392 7392 NONE PROPOSED 0 - - - - -$ 0 0 0 0 0 0 0
461Ocean
Elementary School
020 Library 42W CFL 19 798.0 0.80 2,400 1,915 383.04$ NONE PROPOSED 19 798.0 0.80 2,400 1915 1915 NONE PROPOSED 0 - - - - -$ 0 0 0 0 0 0 0
462Ocean
Elementary School
020 Library 2X4 Troffers/2-T8 Lamps/Electronic Ballasts 2 101.4 0.10 2,400 243 48.67$ NONE PROPOSED 2 101.4 0.10 2,400 243 243 NONE PROPOSED 0 - - - - -$ 0 0 0 0 0 0 0
463Ocean
Elementary School
020 Men's Bathroom 2X2 Troffers/2-T8 Lamps/Electronic Ballasts 3 165.0 0.17 2,400 396 79.20$ NONE PROPOSED 3 165.0 0.17 2,400 396 396 NONE PROPOSED 0 - - - - -$ 0 0 0 0 0 0 0
464Ocean
Elementary School
020 Storage 2X2 Troffers/2-T8 Lamps/Electronic Ballasts 1 55.0 0.06 500 28 5.50$ NONE PROPOSED 1 55.0 0.06 325 28 18 Automatic Wall Switch Occupancy Sensor 1 - 9.63 - 10 1.93$ 0 0 0 103 73.5 0 0
465Ocean
Elementary School
020 Storage 1X4 Fixtures/2-T8 Lamps/Electronic Ballasts 1 50.7 0.05 500 25 5.07$ NONE PROPOSED 1 50.7 0.05 325 25 16 Automatic Wall Switch Occupancy Sensor 1 - 8.87 - 9 1.77$ 0 0 0 103 73.5 0 0
466Ocean
Elementary School
020 Women's Bathroom 2X2 Troffers/2-T8 Lamps/Electronic Ballasts 3 165.0 0.17 2,400 396 79.20$ NONE PROPOSED 3 165.0 0.17 2,400 396 396 NONE PROPOSED 0 - - - - -$ 0 0 0 0 0 0 0
5,894 472.96 1,127,089 5,894 425.01 44789 1,012,049 115,041 47.96 115,774.21 $23,155 $1,176 $878 $525 $2,579 $44,789
11

APPENDIX E
SOLAR ENERGY FINANCING WORKSHEET
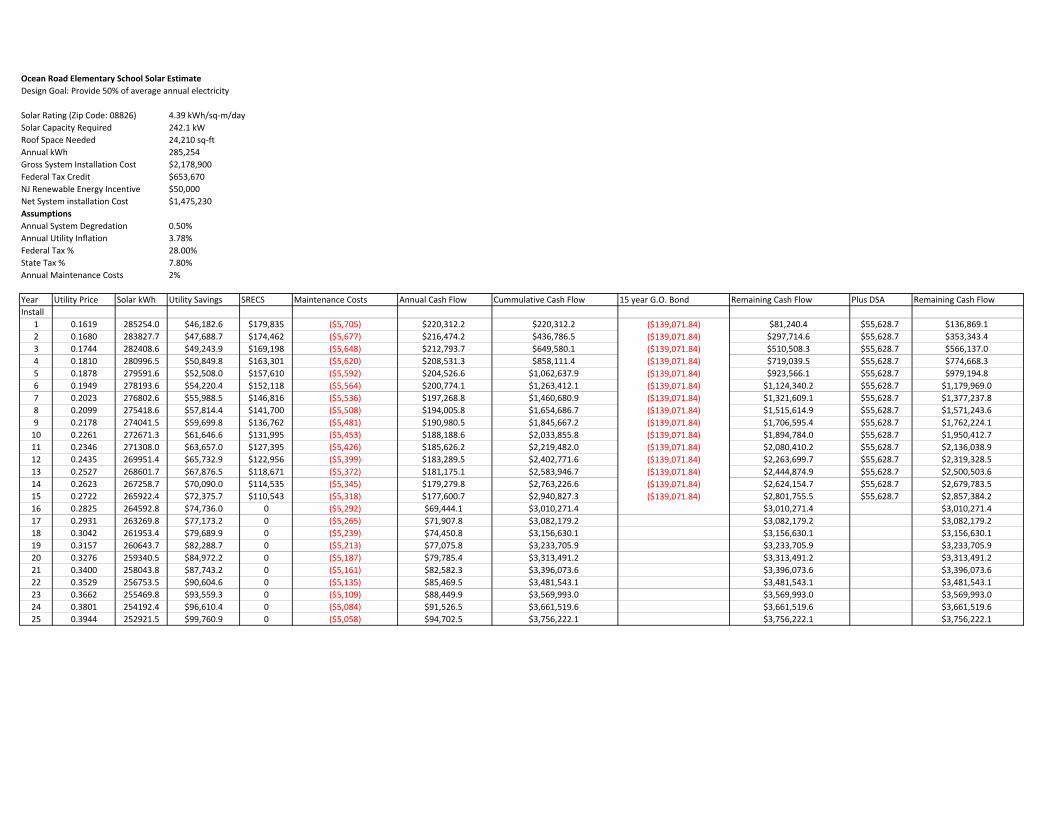
Ocean Road Elementary School Solar EstimateDesign Goal: Provide 50% of average annual electricity
Solar Rating (Zip Code: 08826) 4.39 kWh/sq‐m/daySolar Capacity Required 242.1 kWRoof Space Needed 24,210 sq‐ftAnnual kWh 285,254Gross System Installation Cost $2,178,900Federal Tax Credit $653,670NJ Renewable Energy Incentive $50,000Net System installation Cost $1,475,230AssumptionsAnnual System Degredation 0.50%Annual Utility Inflation 3.78%Federal Tax % 28.00%State Tax % 7.80%Annual Maintenance Costs 2%
Year Utility Price Solar kWh Utility Savings SRECS Maintenance Costs Annual Cash Flow Cummulative Cash Flow 15 year G.O. Bond Remaining Cash Flow Plus DSA Remaining Cash FlowInstall
1 0.1619 285254.0 $46,182.6 $179,835 ($5,705) $220,312.2 $220,312.2 ($139,071.84) $81,240.4 $55,628.7 $136,869.12 0.1680 283827.7 $47,688.7 $174,462 ($5,677) $216,474.2 $436,786.5 ($139,071.84) $297,714.6 $55,628.7 $353,343.43 0.1744 282408.6 $49,243.9 $169,198 ($5,648) $212,793.7 $649,580.1 ($139,071.84) $510,508.3 $55,628.7 $566,137.04 0.1810 280996.5 $50,849.8 $163,301 ($5,620) $208,531.3 $858,111.4 ($139,071.84) $719,039.5 $55,628.7 $774,668.35 0.1878 279591.6 $52,508.0 $157,610 ($5,592) $204,526.6 $1,062,637.9 ($139,071.84) $923,566.1 $55,628.7 $979,194.86 0.1949 278193.6 $54,220.4 $152,118 ($5,564) $200,774.1 $1,263,412.1 ($139,071.84) $1,124,340.2 $55,628.7 $1,179,969.07 0.2023 276802.6 $55,988.5 $146,816 ($5,536) $197,268.8 $1,460,680.9 ($139,071.84) $1,321,609.1 $55,628.7 $1,377,237.88 0.2099 275418.6 $57,814.4 $141,700 ($5,508) $194,005.8 $1,654,686.7 ($139,071.84) $1,515,614.9 $55,628.7 $1,571,243.69 0.2178 274041.5 $59,699.8 $136,762 ($5,481) $190,980.5 $1,845,667.2 ($139,071.84) $1,706,595.4 $55,628.7 $1,762,224.110 0.2261 272671.3 $61,646.6 $131,995 ($5,453) $188,188.6 $2,033,855.8 ($139,071.84) $1,894,784.0 $55,628.7 $1,950,412.711 0.2346 271308.0 $63,657.0 $127,395 ($5,426) $185,626.2 $2,219,482.0 ($139,071.84) $2,080,410.2 $55,628.7 $2,136,038.912 0.2435 269951.4 $65,732.9 $122,956 ($5,399) $183,289.5 $2,402,771.6 ($139,071.84) $2,263,699.7 $55,628.7 $2,319,328.513 0.2527 268601.7 $67,876.5 $118,671 ($5,372) $181,175.1 $2,583,946.7 ($139,071.84) $2,444,874.9 $55,628.7 $2,500,503.614 0.2623 267258.7 $70,090.0 $114,535 ($5,345) $179,279.8 $2,763,226.6 ($139,071.84) $2,624,154.7 $55,628.7 $2,679,783.515 0.2722 265922.4 $72,375.7 $110,543 ($5,318) $177,600.7 $2,940,827.3 ($139,071.84) $2,801,755.5 $55,628.7 $2,857,384.216 0.2825 264592.8 $74,736.0 0 ($5,292) $69,444.1 $3,010,271.4 $3,010,271.4 $3,010,271.417 0.2931 263269.8 $77,173.2 0 ($5,265) $71,907.8 $3,082,179.2 $3,082,179.2 $3,082,179.218 0.3042 261953.4 $79,689.9 0 ($5,239) $74,450.8 $3,156,630.1 $3,156,630.1 $3,156,630.119 0.3157 260643.7 $82,288.7 0 ($5,213) $77,075.8 $3,233,705.9 $3,233,705.9 $3,233,705.920 0.3276 259340.5 $84,972.2 0 ($5,187) $79,785.4 $3,313,491.2 $3,313,491.2 $3,313,491.221 0.3400 258043.8 $87,743.2 0 ($5,161) $82,582.3 $3,396,073.6 $3,396,073.6 $3,396,073.622 0.3529 256753.5 $90,604.6 0 ($5,135) $85,469.5 $3,481,543.1 $3,481,543.1 $3,481,543.123 0.3662 255469.8 $93,559.3 0 ($5,109) $88,449.9 $3,569,993.0 $3,569,993.0 $3,569,993.024 0.3801 254192.4 $96,610.4 0 ($5,084) $91,526.5 $3,661,519.6 $3,661,519.6 $3,661,519.625 0.3944 252921.5 $99,760.9 0 ($5,058) $94,702.5 $3,756,222.1 $3,756,222.1 $3,756,222.1

Nellie Bennett Elementary School Solar EstimateDesign Goal: Provide 50% of average annual electricity
Solar Rating (Zip Code: 08826) 4.39 kWh/sq‐m/daySolar Capacity Required 290 kWRoof Space Needed 29,003 sq‐ftAnnual kWh 341,728Gross System Installation Cost $2,610,270Federal Tax Credit $783,081NJ Renewable Energy Incentive $50,000Net System installation Cost $1,777,189AssumptionsAnnual System Degredation 0.50%Annual Utility Inflation 3.78%Federal Tax % 28.00%State Tax % 7.80%Annual Maintenance Costs 2%
Year Utility Price Solar kWh Utility Savings SRECS Maintenance Costs Annual Cash Flow Cummulative Cash Flow 15 year G.O. Bond Remaining Cash Flow Plus DSA Remaining Cash FlowInstall
1 0.1619 341728.0 $55,325.8 $215,438 ($6,835) $263,929.2 $263,929.2 ($167,537.88) $96,391.3 $67,015.2 $163,406.42 0.1680 340019.4 $57,130.0 $209,002 ($6,800) $259,331.4 $523,260.5 ($167,537.88) $355,722.7 $67,015.2 $422,737.83 0.1744 338319.3 $58,993.1 $202,695 ($6,766) $254,922.1 $778,182.7 ($167,537.88) $610,644.8 $67,015.2 $677,659.94 0.1810 336627.7 $60,916.9 $195,632 ($6,733) $249,815.8 $1,027,998.5 ($167,537.88) $860,460.6 $67,015.2 $927,475.85 0.1878 334944.5 $62,903.4 $188,814 ($6,699) $245,018.3 $1,273,016.8 ($167,537.88) $1,105,478.9 $67,015.2 $1,172,494.16 0.1949 333269.8 $64,954.8 $182,234 ($6,665) $240,523.0 $1,513,539.8 ($167,537.88) $1,346,001.9 $67,015.2 $1,413,017.17 0.2023 331603.5 $67,073.0 $175,883 ($6,632) $236,323.7 $1,749,863.5 ($167,537.88) $1,582,325.6 $67,015.2 $1,649,340.88 0.2099 329945.4 $69,260.3 $169,753 ($6,599) $232,414.7 $1,982,278.2 ($167,537.88) $1,814,740.3 $67,015.2 $1,881,755.59 0.2178 328295.7 $71,519.0 $163,837 ($6,566) $228,790.4 $2,211,068.6 ($167,537.88) $2,043,530.7 $67,015.2 $2,110,545.910 0.2261 326654.2 $73,851.3 $158,128 ($6,533) $225,445.8 $2,436,514.4 ($167,537.88) $2,268,976.6 $67,015.2 $2,335,991.711 0.2346 325021.0 $76,259.7 $152,617 ($6,500) $222,376.1 $2,658,890.5 ($167,537.88) $2,491,352.7 $67,015.2 $2,558,367.812 0.2435 323395.9 $78,746.6 $147,298 ($6,468) $219,576.8 $2,878,467.4 ($167,537.88) $2,710,929.5 $67,015.2 $2,777,944.613 0.2527 321778.9 $81,314.6 $142,165 ($6,436) $217,043.8 $3,095,511.2 ($167,537.88) $2,927,973.3 $67,015.2 $2,994,988.414 0.2623 320170.0 $83,966.3 $137,210 ($6,403) $214,773.3 $3,310,284.5 ($167,537.88) $3,142,746.6 $67,015.2 $3,209,761.715 0.2722 318569.1 $86,704.5 $132,429 ($6,371) $212,761.8 $3,523,046.2 ($167,537.88) $3,355,508.4 $67,015.2 $3,422,523.516 0.2825 316976.3 $89,532.1 0 ($6,340) $83,192.5 $3,606,238.8 $3,606,238.8 $3,606,238.817 0.2931 315391.4 $92,451.8 0 ($6,308) $86,144.0 $3,692,382.7 $3,692,382.7 $3,692,382.718 0.3042 313814.5 $95,466.7 0 ($6,276) $89,190.5 $3,781,573.2 $3,781,573.2 $3,781,573.219 0.3157 312245.4 $98,580.0 0 ($6,245) $92,335.1 $3,873,908.3 $3,873,908.3 $3,873,908.320 0.3276 310684.2 $101,794.8 0 ($6,214) $95,581.1 $3,969,489.4 $3,969,489.4 $3,969,489.421 0.3400 309130.7 $105,114.4 0 ($6,183) $98,931.8 $4,068,421.2 $4,068,421.2 $4,068,421.222 0.3529 307585.1 $108,542.3 0 ($6,152) $102,390.6 $4,170,811.9 $4,170,811.9 $4,170,811.923 0.3662 306047.2 $112,082.0 0 ($6,121) $105,961.1 $4,276,772.9 $4,276,772.9 $4,276,772.924 0.3801 304516.9 $115,737.1 0 ($6,090) $109,646.8 $4,386,419.7 $4,386,419.7 $4,386,419.725 0.3944 302994.3 $119,511.4 0 ($6,060) $113,451.5 $4,499,871.2 $4,499,871.2 $4,499,871.2
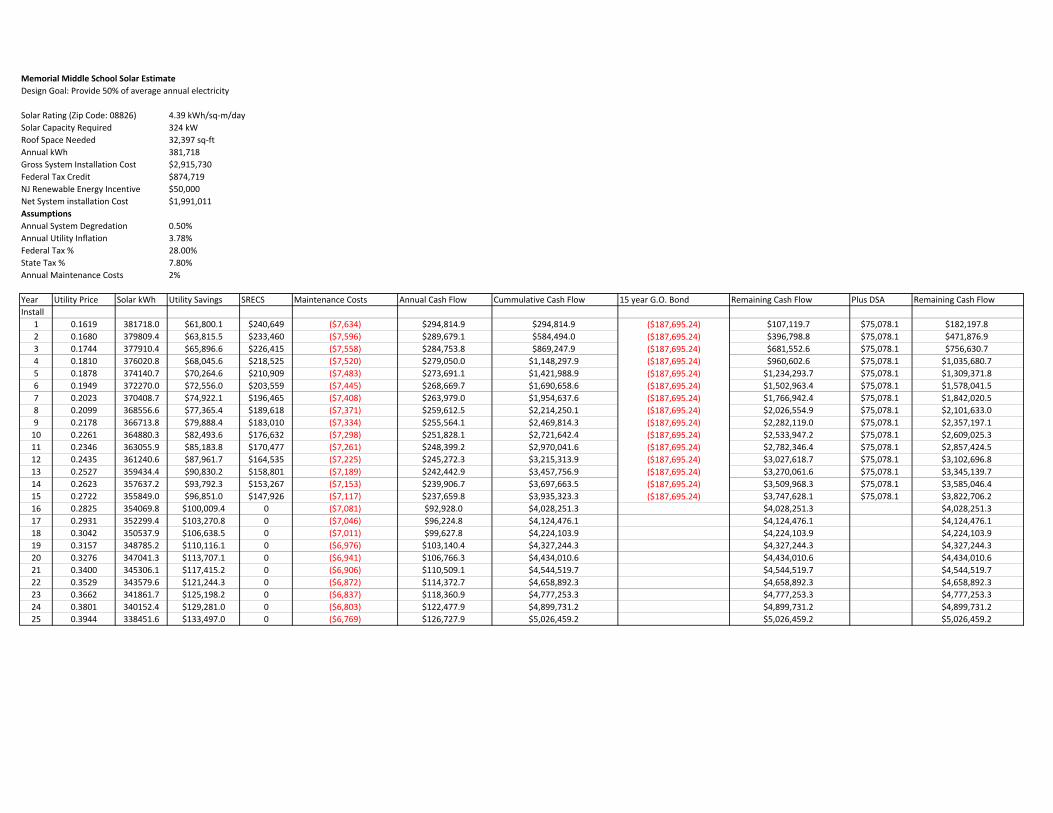
Memorial Middle School Solar EstimateDesign Goal: Provide 50% of average annual electricity
Solar Rating (Zip Code: 08826) 4.39 kWh/sq‐m/daySolar Capacity Required 324 kWRoof Space Needed 32,397 sq‐ftAnnual kWh 381,718Gross System Installation Cost $2,915,730Federal Tax Credit $874,719NJ Renewable Energy Incentive $50,000Net System installation Cost $1,991,011AssumptionsAnnual System Degredation 0.50%Annual Utility Inflation 3.78%Federal Tax % 28.00%State Tax % 7.80%Annual Maintenance Costs 2%
Year Utility Price Solar kWh Utility Savings SRECS Maintenance Costs Annual Cash Flow Cummulative Cash Flow 15 year G.O. Bond Remaining Cash Flow Plus DSA Remaining Cash FlowInstall
1 0.1619 381718.0 $61,800.1 $240,649 ($7,634) $294,814.9 $294,814.9 ($187,695.24) $107,119.7 $75,078.1 $182,197.82 0.1680 379809.4 $63,815.5 $233,460 ($7,596) $289,679.1 $584,494.0 ($187,695.24) $396,798.8 $75,078.1 $471,876.93 0.1744 377910.4 $65,896.6 $226,415 ($7,558) $284,753.8 $869,247.9 ($187,695.24) $681,552.6 $75,078.1 $756,630.74 0.1810 376020.8 $68,045.6 $218,525 ($7,520) $279,050.0 $1,148,297.9 ($187,695.24) $960,602.6 $75,078.1 $1,035,680.75 0.1878 374140.7 $70,264.6 $210,909 ($7,483) $273,691.1 $1,421,988.9 ($187,695.24) $1,234,293.7 $75,078.1 $1,309,371.86 0.1949 372270.0 $72,556.0 $203,559 ($7,445) $268,669.7 $1,690,658.6 ($187,695.24) $1,502,963.4 $75,078.1 $1,578,041.57 0.2023 370408.7 $74,922.1 $196,465 ($7,408) $263,979.0 $1,954,637.6 ($187,695.24) $1,766,942.4 $75,078.1 $1,842,020.58 0.2099 368556.6 $77,365.4 $189,618 ($7,371) $259,612.5 $2,214,250.1 ($187,695.24) $2,026,554.9 $75,078.1 $2,101,633.09 0.2178 366713.8 $79,888.4 $183,010 ($7,334) $255,564.1 $2,469,814.3 ($187,695.24) $2,282,119.0 $75,078.1 $2,357,197.110 0.2261 364880.3 $82,493.6 $176,632 ($7,298) $251,828.1 $2,721,642.4 ($187,695.24) $2,533,947.2 $75,078.1 $2,609,025.311 0.2346 363055.9 $85,183.8 $170,477 ($7,261) $248,399.2 $2,970,041.6 ($187,695.24) $2,782,346.4 $75,078.1 $2,857,424.512 0.2435 361240.6 $87,961.7 $164,535 ($7,225) $245,272.3 $3,215,313.9 ($187,695.24) $3,027,618.7 $75,078.1 $3,102,696.813 0.2527 359434.4 $90,830.2 $158,801 ($7,189) $242,442.9 $3,457,756.9 ($187,695.24) $3,270,061.6 $75,078.1 $3,345,139.714 0.2623 357637.2 $93,792.3 $153,267 ($7,153) $239,906.7 $3,697,663.5 ($187,695.24) $3,509,968.3 $75,078.1 $3,585,046.415 0.2722 355849.0 $96,851.0 $147,926 ($7,117) $237,659.8 $3,935,323.3 ($187,695.24) $3,747,628.1 $75,078.1 $3,822,706.216 0.2825 354069.8 $100,009.4 0 ($7,081) $92,928.0 $4,028,251.3 $4,028,251.3 $4,028,251.317 0.2931 352299.4 $103,270.8 0 ($7,046) $96,224.8 $4,124,476.1 $4,124,476.1 $4,124,476.118 0.3042 350537.9 $106,638.5 0 ($7,011) $99,627.8 $4,224,103.9 $4,224,103.9 $4,224,103.919 0.3157 348785.2 $110,116.1 0 ($6,976) $103,140.4 $4,327,244.3 $4,327,244.3 $4,327,244.320 0.3276 347041.3 $113,707.1 0 ($6,941) $106,766.3 $4,434,010.6 $4,434,010.6 $4,434,010.621 0.3400 345306.1 $117,415.2 0 ($6,906) $110,509.1 $4,544,519.7 $4,544,519.7 $4,544,519.722 0.3529 343579.6 $121,244.3 0 ($6,872) $114,372.7 $4,658,892.3 $4,658,892.3 $4,658,892.323 0.3662 341861.7 $125,198.2 0 ($6,837) $118,360.9 $4,777,253.3 $4,777,253.3 $4,777,253.324 0.3801 340152.4 $129,281.0 0 ($6,803) $122,477.9 $4,899,731.2 $4,899,731.2 $4,899,731.225 0.3944 338451.6 $133,497.0 0 ($6,769) $126,727.9 $5,026,459.2 $5,026,459.2 $5,026,459.2

Point Pleasant High School Solar EstimateDesign Goal: Provide 50% of average annual electricity
Solar Rating (Zip Code: 08826) 4.39 kWh/sq‐m/daySolar Capacity Required 669 kWRoof Space Needed 66,892 sq‐ftAnnual kWh 788,155Gross System Installation Cost $6,020,280Federal Tax Credit $1,806,084NJ Renewable Energy Incentive $50,000Net System installation Cost $4,164,196AssumptionsAnnual System Degredation 0.50%Annual Utility Inflation 3.78%Federal Tax % 28.00%State Tax % 7.80%Annual Maintenance Costs 2%
Year Utility Price Solar kWh Utility Savings SRECS Maintenance Costs Annual Cash Flow Cummulative Cash Flow 15 year G.O. Bond Remaining Cash Flow Plus DSA Remaining Cash FlowInstall
1 0.1619 788155.0 $127,602.3 $496,882 ($15,763) $608,721.3 $608,721.3 ($392,564.16) $216,157.1 $157,025.7 $373,182.82 0.1680 784214.2 $131,763.5 $482,038 ($15,684) $598,117.0 $1,206,838.2 ($392,564.16) $814,274.1 $157,025.7 $971,299.73 0.1744 780293.2 $136,060.5 $467,493 ($15,606) $587,947.6 $1,794,785.8 ($392,564.16) $1,402,221.6 $157,025.7 $1,559,247.34 0.1810 776391.7 $140,497.5 $451,201 ($15,528) $576,170.5 $2,370,956.3 ($392,564.16) $1,978,392.2 $157,025.7 $2,135,417.85 0.1878 772509.7 $145,079.3 $435,476 ($15,450) $565,105.6 $2,936,061.9 ($392,564.16) $2,543,497.8 $157,025.7 $2,700,523.46 0.1949 768647.2 $149,810.5 $420,300 ($15,373) $554,737.7 $3,490,799.6 ($392,564.16) $3,098,235.4 $157,025.7 $3,255,261.17 0.2023 764803.9 $154,696.0 $405,653 ($15,296) $545,052.5 $4,035,852.1 ($392,564.16) $3,643,288.0 $157,025.7 $3,800,313.68 0.2099 760979.9 $159,740.7 $391,516 ($15,220) $536,036.8 $4,571,888.9 ($392,564.16) $4,179,324.8 $157,025.7 $4,336,350.59 0.2178 757175.0 $164,950.1 $377,871 ($15,144) $527,677.9 $5,099,566.8 ($392,564.16) $4,707,002.7 $157,025.7 $4,864,028.410 0.2261 753389.2 $170,329.2 $364,703 ($15,068) $519,964.0 $5,619,530.8 ($392,564.16) $5,226,966.7 $157,025.7 $5,383,992.311 0.2346 749622.2 $175,883.8 $351,993 ($14,992) $512,884.0 $6,132,414.9 ($392,564.16) $5,739,850.7 $157,025.7 $5,896,876.412 0.2435 745874.1 $181,619.6 $339,726 ($14,917) $506,427.8 $6,638,842.7 ($392,564.16) $6,246,278.5 $157,025.7 $6,403,304.213 0.2527 742144.7 $187,542.4 $327,886 ($14,843) $500,585.8 $7,139,428.5 ($392,564.16) $6,746,864.3 $157,025.7 $6,903,890.014 0.2623 738434.0 $193,658.3 $316,459 ($14,769) $495,349.1 $7,634,777.5 ($392,564.16) $7,242,213.4 $157,025.7 $7,399,239.015 0.2722 734741.8 $199,973.7 $305,431 ($14,695) $490,709.7 $8,125,487.2 ($392,564.16) $7,732,923.1 $157,025.7 $7,889,948.716 0.2825 731068.1 $206,495.1 0 ($14,621) $191,873.7 $8,317,361.0 $8,317,361.0 $8,317,361.017 0.2931 727412.8 $213,229.1 0 ($14,548) $198,680.8 $8,516,041.8 $8,516,041.8 $8,516,041.818 0.3042 723775.7 $220,182.7 0 ($14,476) $205,707.2 $8,721,749.0 $8,721,749.0 $8,721,749.019 0.3157 720156.8 $227,363.1 0 ($14,403) $212,959.9 $8,934,708.9 $8,934,708.9 $8,934,708.920 0.3276 716556.1 $234,777.6 0 ($14,331) $220,446.5 $9,155,155.4 $9,155,155.4 $9,155,155.421 0.3400 712973.3 $242,433.9 0 ($14,259) $228,174.5 $9,383,329.9 $9,383,329.9 $9,383,329.922 0.3529 709408.4 $250,340.0 0 ($14,188) $236,151.8 $9,619,481.7 $9,619,481.7 $9,619,481.723 0.3662 705861.4 $258,503.8 0 ($14,117) $244,386.6 $9,863,868.2 $9,863,868.2 $9,863,868.224 0.3801 702332.1 $266,933.9 0 ($14,047) $252,887.2 $10,116,755.4 $10,116,755.4 $10,116,755.425 0.3944 698820.4 $275,638.8 0 ($13,976) $261,662.4 $10,378,417.9 $10,378,417.9 $10,378,417.9

APPENDIX F
GLACIAL ENERGY – ALTERNATIVE ELECTRIC SUPPLIER QUOTE

Savings Analysis Proposal - JCP&L
This proposal illustrates how you can maximize your energy cost savings by choosing Glacial Energy as your preferred electricity supplier.This proposal is based on your organization's estimated usage (kwh) and demand (kw) over the coming year.
Secure your savings today!
Contract Summary - Forecasted Price ComparisonCompany Name: Point Pleasant Board Of EducationBilling Address: Nellie F Bennett Elementary School, 2000 Riviera Parkway, Point Pleasant, NJ 08742
Forecasted Customer Usage Data SummaryStart Month: Oct-09
Number of LDC Accounts: 12 Usage (kwh): 3,624,730 Retail Margin Adder: N/A Avg Monthly Usage (kwh): 302,061
Peak Monthly kw: 1190Peak Load Factor: 35%
Estimated Rate Comparison over the next 12 months Capacity PLC: 719 Transmission PLC: 740
Avg Rate ($/kwh)*: 0.12248$ Annual Utility Charges: 443,945$ Savings Summary
Glacial Energy Index: 0.10393$ Estimated Savings vs. Utility 67,234$ Glacial Charges: 376,712$ Savings (Glacial vs. Utility) 15%
0.0750
0.1000
0.1250
0.1500
0.1750
0.2000
Rat
es ($
/kw
h)
Glacial Energy Index - Forecast Rate Comparison
Glacial Index Includes:a. Estimated weighted average Wholesale Energy priceb. Ancillary Services & requirementsc. Zonal Congestiond. Market Scheduling and Forecasting Feese. PJM ISO Feesf. Transmission Losses & Chargesg. Capacity Chargesh. NJ SUT
Glacial Index Excludes: a. Any charges from the LDC companies - Wiresb. Non NJ SUT Taxes (SUT rates & charges noted above) LDC Account No: Physical Address:
1 080195941600003519882 08019594160000352015
1. The Glacial Index price is based in large part on forecasted ISO charges and estimated future zonal energy prices. 3 080195941600004432112. The forward tariff rates are based on the latest, pending or estimated utility rates (inclusive of NJ SUT), applicable for this rate schedule(s). 4 08019594160000443246Rate listed is an average over the next 12 months. Your current average utility rate for September 2009 is $0.11909/kwh. 5 08019594160000486974 The graph above beyond 9/30/2009, reflect published rate changes and/or rate estimations. 6 08019594160000487008
7 080195941600009189558 080195941600009461919 08019594160000955350
10 0801959416000305038111 0801959416000559003612 08019594160006317117
Estimated_Rate Comparison_New Jersey_September 09,2009_Point Pleasant Board Of Education
Board of Education Office, 2100 Panther Path, Point Pleasant,Memorial Middle School, 808 Laura Herbert Drive, Point Pleas
Point Pleasant High School, 808 Laura Herbert Drive, Point PleOcean Road Elementary School, Benedict Street, Point PleasaNellie F Bennett Elementary School, 2000 Riviera Parkway, PoBoard of Education Office, 2100 Panther Path, Point Pleasant,Ocean Road Elementary School, Benedict Street, Point Pleasa
Nellie F Bennett Elementary School, 2000 Riviera Parkway, PoNellie F Bennett Elementary School, 2000 Riviera Parkway, PoMemorial Middle School, 808 Laura Herbert Drive, Point PleasPoint Pleasant High School, 808 Laura Herbert Drive,, Point PPoint Pleasant High School, 808 Laura Herbert Drive, Point Ple
0.0250
0.0500
0.0750
0.1000
0.1250
0.1500
0.1750
0.2000
Oct-09 Nov-09 Dec-09 Jan-10 Feb-10 Mar-10 Apr-10 May-10 Jun-10 Jul-10 Aug-10 Sep-10
Rat
es ($
/kw
h)
Billing Month
Glacial Energy Index - Forecast Rate Comparison
Glacial IndexJCP&L Rate
0
80000
160000
240000
320000
400000
kwh
Historical Customer Usage Data
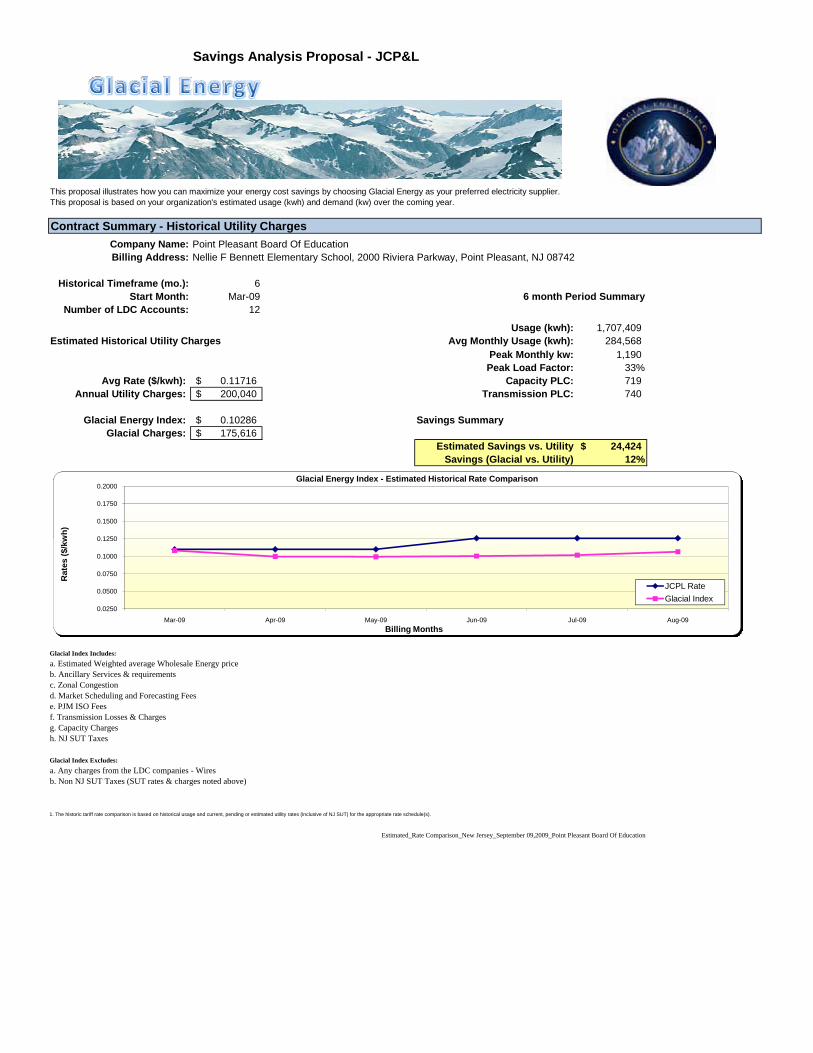
Savings Analysis Proposal - JCP&L
This proposal illustrates how you can maximize your energy cost savings by choosing Glacial Energy as your preferred electricity supplier.This proposal is based on your organization's estimated usage (kwh) and demand (kw) over the coming year.
Contract Summary - Historical Utility ChargesCompany Name: Point Pleasant Board Of EducationBilling Address: Nellie F Bennett Elementary School, 2000 Riviera Parkway, Point Pleasant, NJ 08742
Historical Timeframe (mo.): 6Start Month: Mar-09 6 month Period Summary
Number of LDC Accounts: 12
Usage (kwh): 1,707,409 Estimated Historical Utility Charges Avg Monthly Usage (kwh): 284,568
Peak Monthly kw: 1,190 Peak Load Factor: 33%
Avg Rate ($/kwh): 0.11716$ Capacity PLC: 719 Annual Utility Charges: 200,040$ Transmission PLC: 740
Glacial Energy Index: 0.10286$ Savings SummaryGlacial Charges: 175,616$
Estimated Savings vs. Utility 24,424$ Savings (Glacial vs. Utility) 12%
0.1250
0.1500
0.1750
0.2000
kwh)
Glacial Energy Index - Estimated Historical Rate Comparison
Glacial Index Includes:a. Estimated Weighted average Wholesale Energy priceb. Ancillary Services & requirementsc. Zonal Congestiond. Market Scheduling and Forecasting Feese. PJM ISO Feesf. Transmission Losses & Chargesg. Capacity Chargesh. NJ SUT Taxes
Glacial Index Excludes: a. Any charges from the LDC companies - Wiresb. Non NJ SUT Taxes (SUT rates & charges noted above)
1. The historic tariff rate comparison is based on historical usage and current, pending or estimated utility rates (inclusive of NJ SUT) for the appropriate rate schedule(s).
Estimated_Rate Comparison_New Jersey_September 09,2009_Point Pleasant Board Of Education
0.0250
0.0500
0.0750
0.1000
0.1250
0.1500
0.1750
0.2000
Mar-09 Apr-09 May-09 Jun-09 Jul-09 Aug-09
Rat
es ($
/kw
h)
Billing Months
Glacial Energy Index - Estimated Historical Rate Comparison
JCPL RateGlacial Index

APPENDIX G
NJ SMARTSTART INCENTIVES INFORMATION AND WORKSHEETS

2009 Prescriptive Lighting Application
Prescriptive Lighting Information
Total Incentives (per attached Worksheet calculations):
$__________ Note: Prescriptive Lighting Worksheet must accompany this application.
Customer InformationCompany Electric Utility Serving Applicant Electric Account No. Installation Date
Facility Address City State Zip
Type of Project Size of Building
❑ New Construction ❑ Renovation ❑ Equipment Replacement ❑ School
Company Mailing Address City State Zip
Contact Person (Name/Title) Telephone No. Fax No. ( ) ( )
Incorporated? ❑ Yes ❑ No ❑ Exempt Federal Tax ID# or SSN Email Address
Incentive Payment to Please assign payment to contractor/vendor/other indicated below
❑ Customer ❑ Contractor ❑ Other Customer Signature
003-02/09
Payee Information (Must submit W-9 form with application)
Contractor/Vendor Information (if different from Payee)
Company Contact Name Incorporated? Federal Tax ID# ❑ Yes ❑ NoStreet Address City State Zip Telephone No. ( )
Company Contact Name Incorporated? Federal Tax ID# ❑ Yes ❑ NoStreet Address City State Zip Telephone No. ( )
Email Address
Email Address

Recessed and Surface-Mounted Compact Fluorescents(New Fixtures Replacing Incandescent Fixtures Only): Only available for hard-wired, electronically ballasted new fixtures with rare earth phosphor lamps and 4-pin based tubes (including: twin tube, quad tube, triple tube, 2D or circline lamps), THD<33% and BF>0.9
High-Efficiency Fluorescent Fixtures:For retrofit of T-12 fixtures to T-5 or T-8 with electronic ballasts
For replacement of fixtures with new T-5 or T-8 fixtures
Specific Program Requirements* These requirements are in addition to the Program Terms and Conditions.
Visit our web site: www.NJCleanEnergy.com
Mail or fax your application package dIRECTLy to the Commercial/Industrial Market Manager.
Type of Fixture Incentive
$25 per 1-lamp fixture$30 per 2-lamp or more fixture
$10 per fixture (1 & 2 lamps retrofit) $20 per fixture (3 & 4 lamps retrofit)
Prescriptive Lighting Measures and Incentives*
1. Please refer to the program guide for additional applicable technical requirements.
2. Include the manufacturer’s specification sheet with the application package and mail or fax directly to the Commercial/Industrial Market Manager.
3. Incentives for T-5 and T-8 lamps with electronic ballasts are available only for fixtures with a Total Harmonic Distortion of ≤ 20%.
4. All eligible lighting devices must be UL listed. 5. R equirements for CFL fixtures (must meet all requirements): ■ Fixtures must be new and Energy Star qualified ■ Fixtures must have replaceable electronic ballasts ■ Total Harmonic Distortion (THD) must not exceed 33% ■ Power factor of the ballast must be no less than 90% ■ The manufacturer must warrant all fixtures for a minimum of
3 years. Warranty does not pertain to lamps or photocells not physically part of the fixture.
■ The installer must warrant installation of fixtures for a minimum of 1 year.
6. Pulse Start Metal Halide (including pole-mounted parking lot lighting) must have a 12% minimum wattage reduction.
7. T-5 or T-8 Fixtures replacing incandescent or T-12 fluorescent fixtures greater than 250 watt or High Intensity Discharge shall comply as follows:
7.1 T-5 fixtures replacing T-12 fluorescent or incandescent fixtures 250 watts or greater, or HID fixtures shall have a ballast factor greater than or equal to 1.0; have reflectivity greater than or equal to 91%; have a minimum 2 lamps; and be designated as F54T5 HO.
7.2 T-8 fixtures replacing T-12 fluorescent or incandescent fixtures 250 watts or greater, or HID fixtures shall have a ballast factor greater than or equal to 1.14; have reflectivity greater than or equal to 91%; have a minimum of 4 lamps; and be designated as F32T8, minimum 32 watts.
7.3 T-8 to T-8 replacement requires delamping and new reflectors resulting in a more efficient light system with maintained light levels.
New Jersey SmartStart Buildings® is a registered trademark. Use of the mark without the permission of the New Jersey Board of Public Utilities, Office of Clean Energy is prohibited. *Incentives/Requirements subject to change.
New Jersey's Clean Energy Programc/o TRC Energy Services
900 Route 9 North, Suite 104 · Woodbridge, NJ 07095
Phone: 866-657-6278 · Fax: 732-855-0422
HID, T-12, IncandescentHID, T-12, IncandescentHID, T-12, Incandescent
HID onlyHID onlyHID onlyT-12 only T-12 only
≥ 1000 Watts400-999 Watt250-399 Watt175-249 Watt100-174 Watt75-99 Watt <250 Watt<250 Watt
T-5, T-8T-5, T-8T-5, T-8T-5, T-8T-5, T-8T-5, T-8
T-5, T-8 (1 & 2 lamp)T-5, T-8 (3 & 4 lamp)
$284$100$50$43$30$16$25$30
Type of Old Fixture Wattage of Old Fixture Type of New Fixture Incentive Per Fixture Removed
For retrofit of T-8 fixtures by permanent delamping & new reflectorsNew Construction & Complete RenovationLED Exit Signs (new fixtures only): For existing facilities with connected load ≤75 kWFor existing facilities with connected load ≥ 75 kWPulse Start Metal Halide (for fixtures ≥ 150 watts)Parking lot low bay - LED
T-12 to T-8 fixtures by permanent delamping & new reflectors
$20 per fixturePerformance based only$20 per fixture$10 per fixture$25 per fixture (includes parking lot lighting)$43 per fixture$30 per fixture
ACkNOWLEDgEMENT
CUSTOMER'S SIgNATURE ___________________________________________________________________________
By signing, I certify that I have read, understand and agree to the Specific Program Requirements/Terms and Conditions listed on this application form, I will also submit for approval a properly completed application package, which includes this signed application, worksheet (if applicable), manufacturer’s specification sheets and complete utility bill (name and address on utility bill must match name and address on application).

Program Terms and Conditions
Definitions:
Design Incentives – Incentives that may be offered to design professionals by the Program.
Design Services – Services that may be offered to design professionals under the Program.
Energy-Efficient Measures – Any device eligible to receive a Program Incentive payment through the NJ Clean Energy Commercial and Industrial Program (New Jersey SmartStart Buildings).
New Jersey Utilities – The regulated electric and/or gas utilities in the State of New Jersey. They are: Atlantic City Electric, Jersey Central Power & Light, Rockland Electric Company, New Jersey Natural Gas, Elizabethtown Gas, PSE&G, and South Jersey Gas.
Administrator – New Jersey Board of Public Utilities, Office of Clean Energy
Participating Customers – Those non-residential electric and/or gas service customers of the New Jersey Utilities who participate in this Program.
Product Installation or Equipment Installation – Installation of the Energy-Efficient Measures.
Market Manager – TRC Energy Services (see below). The NJ Board of Public Utilities has transferred responsibility for the NJ SmartStart Buildings Program from the NJ Utilities to TRC.
Program – The Commercial and Industrial Energy-Efficient Construction Program (New Jersey SmartStart Buildings) offered herein by the New Jersey Board of Public Utilities, Office of Clean Energy pursuant to state regulatory approval under the New Jersey Electric Discount and Energy Competition Act, NJSA 48:3-49, et seq.
Program Incentives – Refers to the amount or level of incentive that the Program provides to participating customers pursuant to the Program offered herein (see description below under “Incentive Amount” heading).
Program Offer – Program Incentives are available to non-residential retail electric and/or gas service customers of the New Jersey Utilities identified above. Program Incentives for new construction are available only for projects in areas designated for growth in the State Plan. Public school (K-12) new construction projects are exempted from this restriction and are eligible for new Program incentives throughout the State. Customers, or their trade allies, can determine if a location is in a designated growth area by referring to the Smart Growth Locator available from the HMFA website or contact the Market Manager if you are uncertain about project eligibility.
Application and Eligibility Process – The Program pays incentives after the installation of qualified energy efficient measures that were pre-approved (for exceptions to this condition, please refer to “exceptions for approval”.) In order to be eligible for Program Incentives, a Customer, or an agent (contractor/vendor) authorized by a Customer, must submit a properly completed application package. The package must include an application signed by the customer; a complete (current) utility bill; and technology worksheet and manufacturer’s cut sheets (where appropriate). This information must be submitted to the Market Manager before equipment is installed. Applications for measures that are self installed by customers must be submitted by the customer and not the sales vendor of the measure, however, the customer may elect to assign payment of the incentives to the sales vendor. This application package must be received by the Market Manager on or before December 31, 2009 in order to be eligible for 2009 incentives. The Market Manager will review the application package to determine if the project is eligible for a Program Incentive. If eligible, the Customer will receive an approval letter with the estimated authorized incentive amount and the date by which the equipment must be installed in order for the approval to remain in effect. Upon receipt of an approval letter, the Customer may then proceed to install the equipment listed on the approved application. Equipment installed prior to the date of the Market Manager’s approval letter is not eligible for an incentive. The Market Manager reserves the right to conduct a pre-inspection of the facility prior to the installation of equipment. This will be done prior to the issuance of the approval letter. All equipment must be purchased within 12 months of date of application. Any Customer and/or Agent who purchases equipment prior to the receipt of an incentive approval letter does so at his/her own risk.
Exceptions for Approval – The Application and Eligibility Process pertains to all projects except for those involving either Unitary HVAC or Motors having an incentive amount less than $5,000. These measures, at this incentive level, may be installed without prior approval. In addition, but at the sole discretion of the Market Manager, emergency replacement of equipment may not require a prior approval determination and letter. In such cases, please notify the Market Manager of such emergencies as early as possible, that an application will soon be sent in that was not pre-approved.
Post Installation Approval – After installation is completed, the Customer, or an agent authorized by the Customer, must finalize and submit an invoice for the purchase of the equipment (material cost must be broken out from labor costs), and any other required documentation as specified on the equipment application or in the Market Manager’s initial approval letter.
NJ SmartStart Buildings®

Please refer to the Program Guide on the NJCleanEnergy.com/ssb website for the complete Application and Eligibility Process.
The Market Manager reserves the right to verify sales transactions and to have reasonable access to Participating Customer’s facility to inspect both pre-existing product or equipment (if applicable) and the Energy-Efficient Measures installed under this Program, either prior to issuing incentives or at a later time.
Energy-Efficient Measures must be installed in buildings located within a New Jersey Utilities’ service territory and designated on the Participating Customer’s incentive application. Program Incentives are available for qualified Energy-Efficient Measures as listed and described in the Program materials and incentive applications. The Participating Customer must ultimately own the equipment, either through an up-front purchase or at the end of a short-term lease. (Design Incentives are available to design professionals as described in the Program materials and applications. A different and separate agreement must be executed by participating design professionals to be eligible for this type of incentive. The design professional does not need to be based in New Jersey.)
Equipment procured by Participating Customers through another program offered by New Jersey's Clean Energy Program or the New Jersey Utilities, as applicable, is not eligible for incentives through this program. Customers who have not contributed to the Societal Benefits Charge of the applicable New Jersey Utility are not be eligible for incentives offered through this program.
Incentive Amount – Program Incentives will equal either: a) the approved Program Incentive amount, or b) the actual equipment cost of the Energy-Efficient Measure, whichever is less, as determined by the Market Manager. Products offered at no direct cost to the customer are ineligible. Incomplete application submissions, applications requiring inspections and unanticipated high volume of activities may cause processing delays. Program Incentives are limited to $500,000 per utility account in a calendar year. Contact the Market Manager regarding any questions.
Tax Liability – The Market Manager will not be responsible for any tax liability that may be imposed on any Participating Customer as a result of the payment of Program Incentives. All Participating Customers must supply their Federal Tax Identification number or social security number to the Market Manager on the application form in order to receive a Program Incentive. In addition, Participating Customers must also provide a Tax Clearance Form (Business Assistance or Incentive Clearance Certificate) that is dated within 90 days of equipment installation
Endorsement – The Market Manager and Administrator do not endorse, support or recommend any particular manufacturer, product or system design in promoting this Program.
Warranties – THE MARKET MANAGER AND ADMINISTRATOR DO NOT WARRANT THE PERFORMANCE OF INSTALLED EQUIPMENT, AND/OR SERVICES RENDERED AS PART OF THIS PROGRAM, EITHER EXPRESSLY OR IMPLICITLY. NO WARRANTIES OR REPRESENTATIONS OF ANY KIND, WHETHER STATUTORY, EXPRESSED, OR IMPLIED, INCLUDING, WITHOUT LIMITATIONS, WARRANTIES OF MERCHANTABILITY OR FITNESS FOR A PARTICULAR PURPOSE REGARDING EQUIPMENT OR SERVICES PROVIDED BY A MANUFACTURER OR VENDOR. CONTACT YOUR VENDOR/SERVICES PROVIDER FOR DETAILS REGARDING PERFORMANCE AND WARRANTIES.
Limitation of Liability – By virtue of participating in this Program, Participating Customers agree to waive any and all claims or damages against the Market Manager or the Administrator, except the receipt of the Program Incentive. Participating Customers agree that the Market Manager’s and Administrator’s liability, in connection with this Program, is limited to paying the Program Incentive specified. Under no circumstances shall the Market Manager, its representatives, or subcontractors, or the Administrator, be liable for any lost profits, special, punitive, consequential or incidental damages or for any other damages or claims connected with or resulting from participation in this Program. Further, any liability attributed to the Market Manager under this Program shall be individual, and not joint and/or several.
Assignment – The Participating Customer may assign Program Incentive payments to a specified vendor.
Participating Customer’s Certification – Participating Customer certifies that he/she purchased and installed the equipment listed in their application at their defined New Jersey location. Participating Customer agrees that all information is true and that he/she has conformed to all of the Program and equipment requirements listed in the application.
Termination – The New Jersey Board of Public Utilities reserves the right to extend, modify (this includes modification of Program Incentive levels) or terminate this Program without prior or further notice.
Acknowledgement – I have read, understood and am in compliance with all rules and regulations concerning this incentive program. I certify that all information provided is correct to the best of my knowledge, and I give the Market Manager permission to share my records with the New Jersey Board of Public Utilities, and contractors it selects to manage, coordinate or evaluate the NJ SmartStart Buildings Program. Additionally, I allow reasonable access to my property to inspect the installation and performance of the technologies and installations that are eligible for incentives under the guidelines of New Jersey’s Clean Energy Program.

2009 Prescriptive Lighting Incentive WorksheetCustomer InformationCompany
Check here if multiple worksheets are being submitted for one project/building.
Facility Address
Prescriptive Lighting Information
Total (including additional sheets)
For additional fixtures, attach additional sheets and check here
Date Submitted
Reason Fixture Type Fixture Type Location Size of A B Total Incentives N–New Installed Removed (Bldg/Rm) Replaced Incentive # of (AxB) R–Replaced Lamps Per Fixture Units in Watts (Table) (Examples) R 2x4 3L T-5 2x4 3L T-12 Office $20 8 $20 x 8 = $160
R 2x2 2L T-8 2x2 2L T-12 Office $10 10 $10 x 10 = $100
R 28w CFL 100w Incan. Supply Room $25 3 $25 x 3 = $75
R 250w Pulse Start Metal Halide 400w Mercury Vapor Warehouse $45 3 $45 x 3 = $135
002–02/09
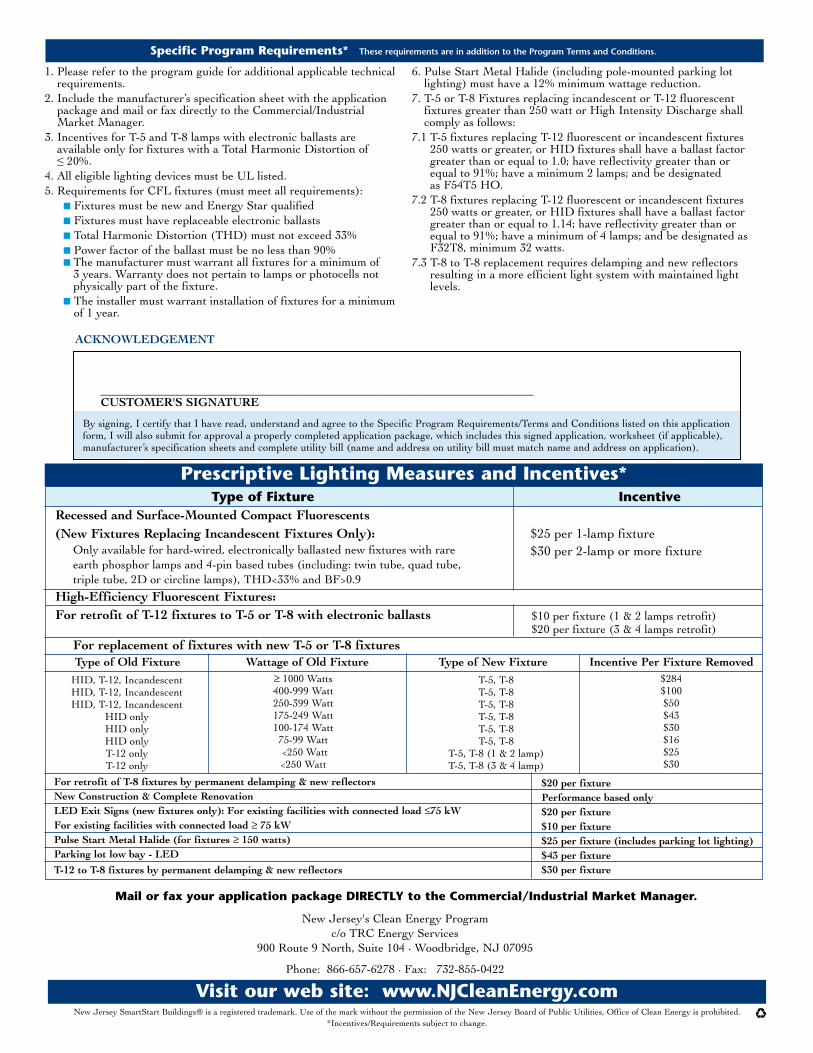
Recessed and Surface-Mounted Compact Fluorescents(New Fixtures Replacing Incandescent Fixtures Only): Only available for hard-wired, electronically ballasted new fixtures with rare earth phosphor lamps and 4-pin based tubes (including: twin tube, quad tube, triple tube, 2D or circline lamps), THD<33% and BF>0.9
High-Efficiency Fluorescent Fixtures:For retrofit of T-12 fixtures to T-5 or T-8 with electronic ballasts
For replacement of fixtures with new T-5 or T-8 fixtures
Specific Program Requirements* These requirements are in addition to the Program Terms and Conditions.
Visit our web site: www.NJCleanEnergy.com
Mail or fax your application package dIRECTLy to the Commercial/Industrial Market Manager.
Type of Fixture Incentive
$25 per 1-lamp fixture$30 per 2-lamp or more fixture
$10 per fixture (1 & 2 lamps retrofit) $20 per fixture (3 & 4 lamps retrofit)
Prescriptive Lighting Measures and Incentives*
1. Please refer to the program guide for additional applicable technical requirements.
2. Include the manufacturer’s specification sheet with the application package and mail or fax directly to the Commercial/Industrial Market Manager.
3. Incentives for T-5 and T-8 lamps with electronic ballasts are available only for fixtures with a Total Harmonic Distortion of ≤ 20%.
4. All eligible lighting devices must be UL listed. 5. R equirements for CFL fixtures (must meet all requirements): ■ Fixtures must be new and Energy Star qualified ■ Fixtures must have replaceable electronic ballasts ■ Total Harmonic Distortion (THD) must not exceed 33% ■ Power factor of the ballast must be no less than 90% ■ The manufacturer must warrant all fixtures for a minimum of
3 years. Warranty does not pertain to lamps or photocells not physically part of the fixture.
■ The installer must warrant installation of fixtures for a minimum of 1 year.
6. Pulse Start Metal Halide (including pole-mounted parking lot lighting) must have a 12% minimum wattage reduction.
7. T-5 or T-8 Fixtures replacing incandescent or T-12 fluorescent fixtures greater than 250 watt or High Intensity Discharge shall comply as follows:
7.1 T-5 fixtures replacing T-12 fluorescent or incandescent fixtures 250 watts or greater, or HID fixtures shall have a ballast factor greater than or equal to 1.0; have reflectivity greater than or equal to 91%; have a minimum 2 lamps; and be designated as F54T5 HO.
7.2 T-8 fixtures replacing T-12 fluorescent or incandescent fixtures 250 watts or greater, or HID fixtures shall have a ballast factor greater than or equal to 1.14; have reflectivity greater than or equal to 91%; have a minimum of 4 lamps; and be designated as F32T8, minimum 32 watts.
7.3 T-8 to T-8 replacement requires delamping and new reflectors resulting in a more efficient light system with maintained light levels.
New Jersey SmartStart Buildings® is a registered trademark. Use of the mark without the permission of the New Jersey Board of Public Utilities, Office of Clean Energy is prohibited. *Incentives/Requirements subject to change.
New Jersey's Clean Energy Programc/o TRC Energy Services
900 Route 9 North, Suite 104 · Woodbridge, NJ 07095
Phone: 866-657-6278 · Fax: 732-855-0422
HID, T-12, IncandescentHID, T-12, IncandescentHID, T-12, Incandescent
HID onlyHID onlyHID onlyT-12 only T-12 only
≥ 1000 Watts400-999 Watt250-399 Watt175-249 Watt100-174 Watt75-99 Watt <250 Watt<250 Watt
T-5, T-8T-5, T-8T-5, T-8T-5, T-8T-5, T-8T-5, T-8
T-5, T-8 (1 & 2 lamp)T-5, T-8 (3 & 4 lamp)
$284$100$50$43$30$16$25$30
Type of Old Fixture Wattage of Old Fixture Type of New Fixture Incentive Per Fixture Removed
For retrofit of T-8 fixtures by permanent delamping & new reflectorsNew Construction & Complete RenovationLED Exit Signs (new fixtures only): For existing facilities with connected load ≤75 kWFor existing facilities with connected load ≥ 75 kWPulse Start Metal Halide (for fixtures ≥ 150 watts)Parking lot low bay - LED
T-12 to T-8 fixtures by permanent delamping & new reflectors
$20 per fixturePerformance based only$20 per fixture$10 per fixture$25 per fixture (includes parking lot lighting)$43 per fixture$30 per fixture
ACkNOWLEDgEMENT
CUSTOMER'S SIgNATURE ___________________________________________________________________________
By signing, I certify that I have read, understand and agree to the Specific Program Requirements/Terms and Conditions listed on this application form, I will also submit for approval a properly completed application package, which includes this signed application, worksheet (if applicable), manufacturer’s specification sheets and complete utility bill (name and address on utility bill must match name and address on application).

Program Terms and Conditions
Definitions:
Design Incentives – Incentives that may be offered to design professionals by the Program.
Design Services – Services that may be offered to design professionals under the Program.
Energy-Efficient Measures – Any device eligible to receive a Program Incentive payment through the NJ Clean Energy Commercial and Industrial Program (New Jersey SmartStart Buildings).
New Jersey Utilities – The regulated electric and/or gas utilities in the State of New Jersey. They are: Atlantic City Electric, Jersey Central Power & Light, Rockland Electric Company, New Jersey Natural Gas, Elizabethtown Gas, PSE&G, and South Jersey Gas.
Administrator – New Jersey Board of Public Utilities, Office of Clean Energy
Participating Customers – Those non-residential electric and/or gas service customers of the New Jersey Utilities who participate in this Program.
Product Installation or Equipment Installation – Installation of the Energy-Efficient Measures.
Market Manager – TRC Energy Services (see below). The NJ Board of Public Utilities has transferred responsibility for the NJ SmartStart Buildings Program from the NJ Utilities to TRC.
Program – The Commercial and Industrial Energy-Efficient Construction Program (New Jersey SmartStart Buildings) offered herein by the New Jersey Board of Public Utilities, Office of Clean Energy pursuant to state regulatory approval under the New Jersey Electric Discount and Energy Competition Act, NJSA 48:3-49, et seq.
Program Incentives – Refers to the amount or level of incentive that the Program provides to participating customers pursuant to the Program offered herein (see description below under “Incentive Amount” heading).
Program Offer – Program Incentives are available to non-residential retail electric and/or gas service customers of the New Jersey Utilities identified above. Program Incentives for new construction are available only for projects in areas designated for growth in the State Plan. Public school (K-12) new construction projects are exempted from this restriction and are eligible for new Program incentives throughout the State. Customers, or their trade allies, can determine if a location is in a designated growth area by referring to the Smart Growth Locator available from the HMFA website or contact the Market Manager if you are uncertain about project eligibility.
Application and Eligibility Process – The Program pays incentives after the installation of qualified energy efficient measures that were pre-approved (for exceptions to this condition, please refer to “exceptions for approval”.) In order to be eligible for Program Incentives, a Customer, or an agent (contractor/vendor) authorized by a Customer, must submit a properly completed application package. The package must include an application signed by the customer; a complete (current) utility bill; and technology worksheet and manufacturer’s cut sheets (where appropriate). This information must be submitted to the Market Manager before equipment is installed. Applications for measures that are self installed by customers must be submitted by the customer and not the sales vendor of the measure, however, the customer may elect to assign payment of the incentives to the sales vendor. This application package must be received by the Market Manager on or before December 31, 2009 in order to be eligible for 2009 incentives. The Market Manager will review the application package to determine if the project is eligible for a Program Incentive. If eligible, the Customer will receive an approval letter with the estimated authorized incentive amount and the date by which the equipment must be installed in order for the approval to remain in effect. Upon receipt of an approval letter, the Customer may then proceed to install the equipment listed on the approved application. Equipment installed prior to the date of the Market Manager’s approval letter is not eligible for an incentive. The Market Manager reserves the right to conduct a pre-inspection of the facility prior to the installation of equipment. This will be done prior to the issuance of the approval letter. All equipment must be purchased within 12 months of date of application. Any Customer and/or Agent who purchases equipment prior to the receipt of an incentive approval letter does so at his/her own risk.
Exceptions for Approval – The Application and Eligibility Process pertains to all projects except for those involving either Unitary HVAC or Motors having an incentive amount less than $5,000. These measures, at this incentive level, may be installed without prior approval. In addition, but at the sole discretion of the Market Manager, emergency replacement of equipment may not require a prior approval determination and letter. In such cases, please notify the Market Manager of such emergencies as early as possible, that an application will soon be sent in that was not pre-approved.
Post Installation Approval – After installation is completed, the Customer, or an agent authorized by the Customer, must finalize and submit an invoice for the purchase of the equipment (material cost must be broken out from labor costs), and any other required documentation as specified on the equipment application or in the Market Manager’s initial approval letter.
NJ SmartStart Buildings®

Please refer to the Program Guide on the NJCleanEnergy.com/ssb website for the complete Application and Eligibility Process.
The Market Manager reserves the right to verify sales transactions and to have reasonable access to Participating Customer’s facility to inspect both pre-existing product or equipment (if applicable) and the Energy-Efficient Measures installed under this Program, either prior to issuing incentives or at a later time.
Energy-Efficient Measures must be installed in buildings located within a New Jersey Utilities’ service territory and designated on the Participating Customer’s incentive application. Program Incentives are available for qualified Energy-Efficient Measures as listed and described in the Program materials and incentive applications. The Participating Customer must ultimately own the equipment, either through an up-front purchase or at the end of a short-term lease. (Design Incentives are available to design professionals as described in the Program materials and applications. A different and separate agreement must be executed by participating design professionals to be eligible for this type of incentive. The design professional does not need to be based in New Jersey.)
Equipment procured by Participating Customers through another program offered by New Jersey's Clean Energy Program or the New Jersey Utilities, as applicable, is not eligible for incentives through this program. Customers who have not contributed to the Societal Benefits Charge of the applicable New Jersey Utility are not be eligible for incentives offered through this program.
Incentive Amount – Program Incentives will equal either: a) the approved Program Incentive amount, or b) the actual equipment cost of the Energy-Efficient Measure, whichever is less, as determined by the Market Manager. Products offered at no direct cost to the customer are ineligible. Incomplete application submissions, applications requiring inspections and unanticipated high volume of activities may cause processing delays. Program Incentives are limited to $500,000 per utility account in a calendar year. Contact the Market Manager regarding any questions.
Tax Liability – The Market Manager will not be responsible for any tax liability that may be imposed on any Participating Customer as a result of the payment of Program Incentives. All Participating Customers must supply their Federal Tax Identification number or social security number to the Market Manager on the application form in order to receive a Program Incentive. In addition, Participating Customers must also provide a Tax Clearance Form (Business Assistance or Incentive Clearance Certificate) that is dated within 90 days of equipment installation
Endorsement – The Market Manager and Administrator do not endorse, support or recommend any particular manufacturer, product or system design in promoting this Program.
Warranties – THE MARKET MANAGER AND ADMINISTRATOR DO NOT WARRANT THE PERFORMANCE OF INSTALLED EQUIPMENT, AND/OR SERVICES RENDERED AS PART OF THIS PROGRAM, EITHER EXPRESSLY OR IMPLICITLY. NO WARRANTIES OR REPRESENTATIONS OF ANY KIND, WHETHER STATUTORY, EXPRESSED, OR IMPLIED, INCLUDING, WITHOUT LIMITATIONS, WARRANTIES OF MERCHANTABILITY OR FITNESS FOR A PARTICULAR PURPOSE REGARDING EQUIPMENT OR SERVICES PROVIDED BY A MANUFACTURER OR VENDOR. CONTACT YOUR VENDOR/SERVICES PROVIDER FOR DETAILS REGARDING PERFORMANCE AND WARRANTIES.
Limitation of Liability – By virtue of participating in this Program, Participating Customers agree to waive any and all claims or damages against the Market Manager or the Administrator, except the receipt of the Program Incentive. Participating Customers agree that the Market Manager’s and Administrator’s liability, in connection with this Program, is limited to paying the Program Incentive specified. Under no circumstances shall the Market Manager, its representatives, or subcontractors, or the Administrator, be liable for any lost profits, special, punitive, consequential or incidental damages or for any other damages or claims connected with or resulting from participation in this Program. Further, any liability attributed to the Market Manager under this Program shall be individual, and not joint and/or several.
Assignment – The Participating Customer may assign Program Incentive payments to a specified vendor.
Participating Customer’s Certification – Participating Customer certifies that he/she purchased and installed the equipment listed in their application at their defined New Jersey location. Participating Customer agrees that all information is true and that he/she has conformed to all of the Program and equipment requirements listed in the application.
Termination – The New Jersey Board of Public Utilities reserves the right to extend, modify (this includes modification of Program Incentive levels) or terminate this Program without prior or further notice.
Acknowledgement – I have read, understood and am in compliance with all rules and regulations concerning this incentive program. I certify that all information provided is correct to the best of my knowledge, and I give the Market Manager permission to share my records with the New Jersey Board of Public Utilities, and contractors it selects to manage, coordinate or evaluate the NJ SmartStart Buildings Program. Additionally, I allow reasonable access to my property to inspect the installation and performance of the technologies and installations that are eligible for incentives under the guidelines of New Jersey’s Clean Energy Program.
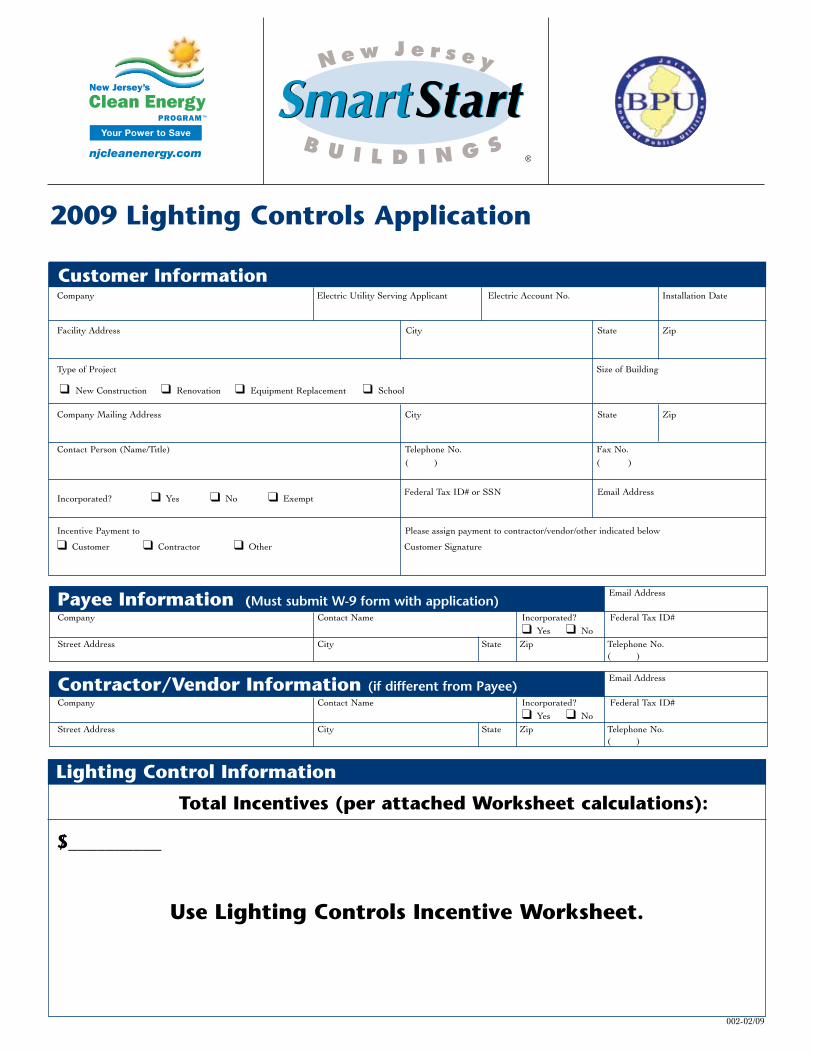
2009 Lighting Controls Application
Lighting Control Information
Total Incentives (per attached Worksheet calculations):
$__________
Use Lighting Controls Incentive Worksheet.
002-02/09
Customer InformationCompany Electric Utility Serving Applicant Electric Account No. Installation Date
Facility Address City State Zip
Type of Project Size of Building
❑ New Construction ❑ Renovation ❑ Equipment Replacement ❑ School
Company Mailing Address City State Zip
Contact Person (Name/Title) Telephone No. Fax No. ( ) ( )
Incorporated? ❑ Yes ❑ No ❑ Exempt Federal Tax ID# or SSN Email Address
Incentive Payment to Please assign payment to contractor/vendor/other indicated below
❑ Customer ❑ Contractor ❑ Other Customer Signature
Payee Information (Must submit W-9 form with application)
Contractor/Vendor Information (if different from Payee)
Company Contact Name Incorporated? Federal Tax ID# ❑ Yes ❑ NoStreet Address City State Zip Telephone No. ( )
Company Contact Name Incorporated? Federal Tax ID# ❑ Yes ❑ NoStreet Address City State Zip Telephone No. ( )
Email Address
Email Address
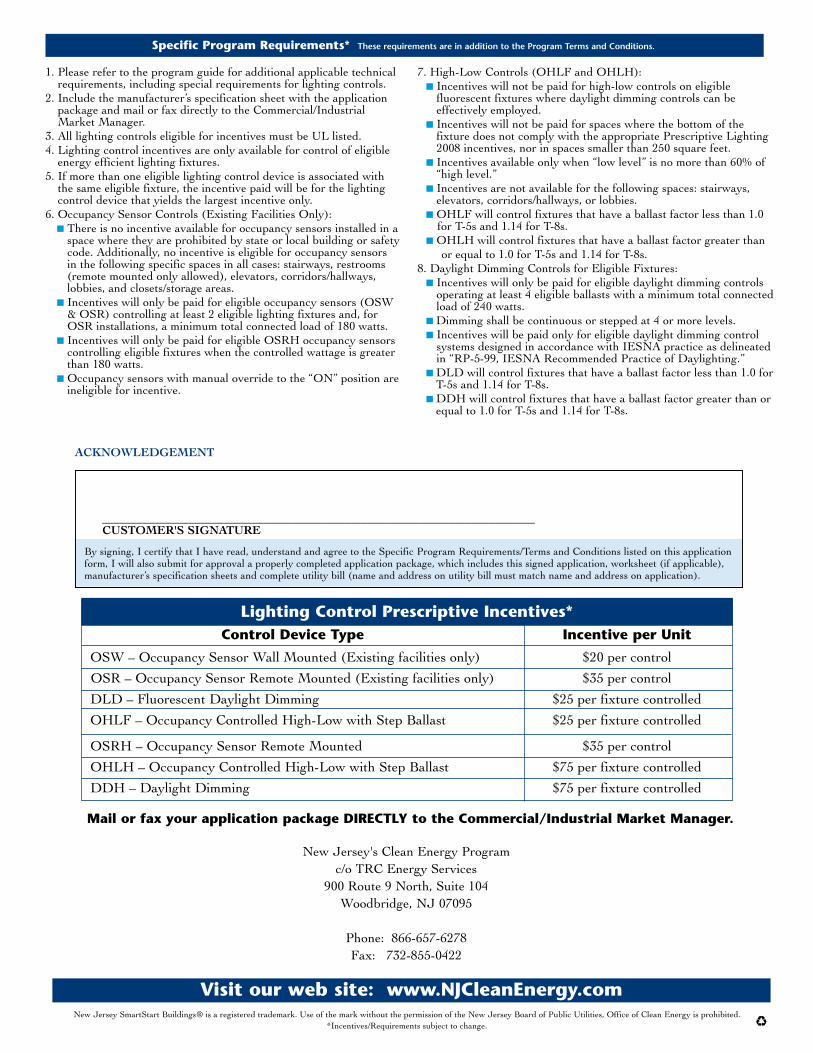
Specific Program Requirements* These requirements are in addition to the Program Terms and Conditions.
Visit our web site: www.NJCleanEnergy.com
Mail or fax your application package dIRECTLy to the Commercial/Industrial Market Manager.
Lighting Control Prescriptive Incentives* Control device Type Incentive per Unit
OSW – Occupancy Sensor Wall Mounted (Existing facilities only) $20 per control
OSR – Occupancy Sensor Remote Mounted (Existing facilities only) $35 per control
DLD – Fluorescent Daylight Dimming $25 per fixture controlled
OHLF – Occupancy Controlled High-Low with Step Ballast $25 per fixture controlled
OSRH – Occupancy Sensor Remote Mounted $35 per control
OHLH – Occupancy Controlled High-Low with Step Ballast $75 per fixture controlled
DDH – Daylight Dimming $75 per fixture controlled
1. Please refer to the program guide for additional applicable technical requirements, including special requirements for lighting controls.
2. Include the manufacturer’s specification sheet with the application package and mail or fax directly to the Commercial/Industrial Market Manager.
3. All lighting controls eligible for incentives must be UL listed.4. Lighting control incentives are only available for control of eligible
energy efficient lighting fixtures.5. If more than one eligible lighting control device is associated with
the same eligible fixture, the incentive paid will be for the lighting control device that yields the largest incentive only.
6. Occupancy Sensor Controls (Existing Facilities Only): ■ There is no incentive available for occupancy sensors installed in a
space where they are prohibited by state or local building or safety code. Additionally, no incentive is eligible for occupancy sensors in the following specific spaces in all cases: stairways, restrooms (remote mounted only allowed), elevators, corridors/hallways, lobbies, and closets/storage areas.
■ Incentives will only be paid for eligible occupancy sensors (OSW & OSR) controlling at least 2 eligible lighting fixtures and, for OSR installations, a minimum total connected load of 180 watts.
■ Incentives will only be paid for eligible OSRH occupancy sensors controlling eligible fixtures when the controlled wattage is greater than 180 watts.
■ Occupancy sensors with manual override to the “ON” position are ineligible for incentive.
7. High-Low Controls (OHLF and OHLH): ■ Incentives will not be paid for high-low controls on eligible
fluorescent fixtures where daylight dimming controls can be effectively employed.
■ Incentives will not be paid for spaces where the bottom of the fixture does not comply with the appropriate Prescriptive Lighting 2008 incentives, nor in spaces smaller than 250 square feet.
■ Incentives available only when “low level” is no more than 60% of “high level.”
■ Incentives are not available for the following spaces: stairways, elevators, corridors/hallways, or lobbies.
■ OHLF will control fixtures that have a ballast factor less than 1.0 for T-5s and 1.14 for T-8s. ■ OHLH will control fixtures that have a ballast factor greater than or equal to 1.0 for T-5s and 1.14 for T-8s.8. Daylight Dimming Controls for Eligible Fixtures: ■ Incentives will only be paid for eligible daylight dimming controls
operating at least 4 eligible ballasts with a minimum total connected load of 240 watts.
■ Dimming shall be continuous or stepped at 4 or more levels. ■ Incentives will be paid only for eligible daylight dimming control
systems designed in accordance with IESNA practice as delineated in “RP-5-99, IESNA Recommended Practice of Daylighting.”
■ DLD will control fixtures that have a ballast factor less than 1.0 for T-5s and 1.14 for T-8s.
■ DDH will control fixtures that have a ballast factor greater than or equal to 1.0 for T-5s and 1.14 for T-8s.
New Jersey SmartStart Buildings® is a registered trademark. Use of the mark without the permission of the New Jersey Board of Public Utilities, Office of Clean Energy is prohibited. *Incentives/Requirements subject to change.
New Jersey's Clean Energy Programc/o TRC Energy Services
900 Route 9 North, Suite 104Woodbridge, NJ 07095
Phone: 866-657-6278Fax: 732-855-0422
Acknowledgement
cUStomeR'S SignAtURe ___________________________________________________________________________
By signing, I certify that I have read, understand and agree to the Specific Program Requirements/Terms and Conditions listed on this application form, I will also submit for approval a properly completed application package, which includes this signed application, worksheet (if applicable), manufacturer’s specification sheets and complete utility bill (name and address on utility bill must match name and address on application).
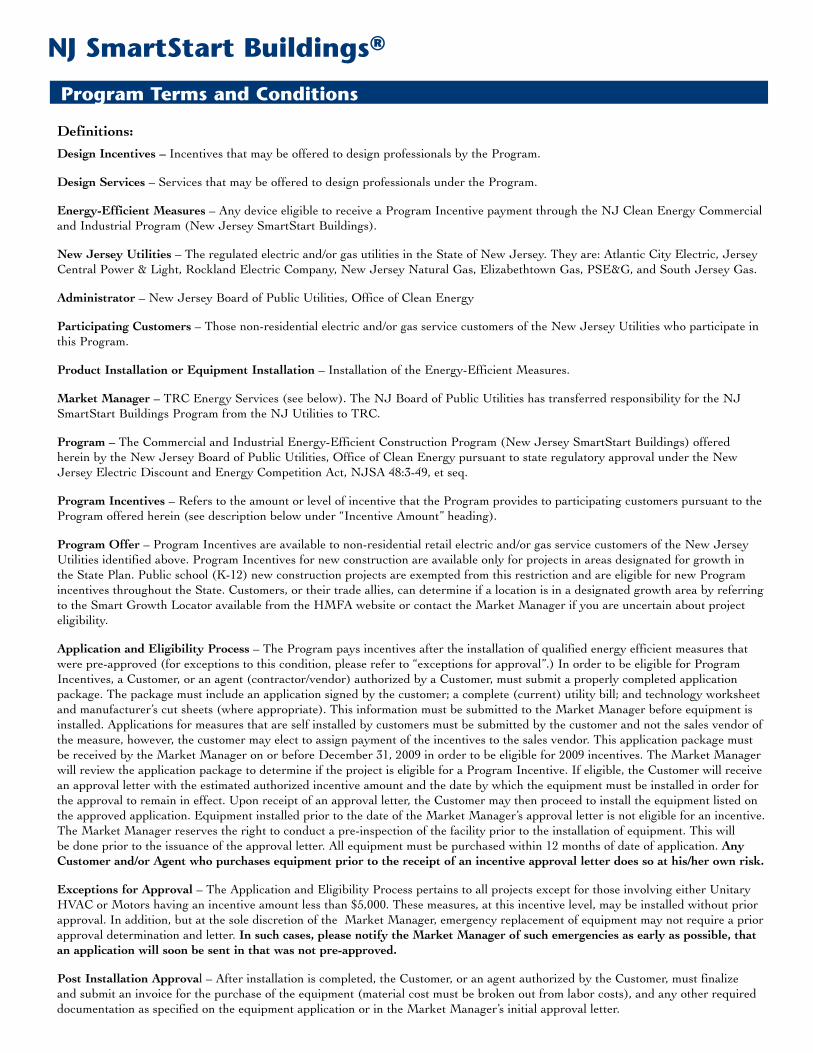
Program Terms and Conditions
definitions:
design incentives – Incentives that may be offered to design professionals by the Program.
design Services – Services that may be offered to design professionals under the Program.
energy-efficient measures – Any device eligible to receive a Program Incentive payment through the NJ Clean Energy Commercial and Industrial Program (New Jersey SmartStart Buildings).
new Jersey Utilities – The regulated electric and/or gas utilities in the State of New Jersey. They are: Atlantic City Electric, Jersey Central Power & Light, Rockland Electric Company, New Jersey Natural Gas, Elizabethtown Gas, PSE&G, and South Jersey Gas.
Administrator – New Jersey Board of Public Utilities, Office of Clean Energy
Participating customers – Those non-residential electric and/or gas service customers of the New Jersey Utilities who participate in this Program.
Product installation or equipment installation – Installation of the Energy-Efficient Measures.
market manager – TRC Energy Services (see below). The NJ Board of Public Utilities has transferred responsibility for the NJ SmartStart Buildings Program from the NJ Utilities to TRC.
Program – The Commercial and Industrial Energy-Efficient Construction Program (New Jersey SmartStart Buildings) offered herein by the New Jersey Board of Public Utilities, Office of Clean Energy pursuant to state regulatory approval under the New Jersey Electric Discount and Energy Competition Act, NJSA 48:3-49, et seq.
Program incentives – Refers to the amount or level of incentive that the Program provides to participating customers pursuant to the Program offered herein (see description below under “Incentive Amount” heading).
Program offer – Program Incentives are available to non-residential retail electric and/or gas service customers of the New Jersey Utilities identified above. Program Incentives for new construction are available only for projects in areas designated for growth in the State Plan. Public school (K-12) new construction projects are exempted from this restriction and are eligible for new Program incentives throughout the State. Customers, or their trade allies, can determine if a location is in a designated growth area by referring to the Smart Growth Locator available from the HMFA website or contact the Market Manager if you are uncertain about project eligibility.
Application and eligibility Process – The Program pays incentives after the installation of qualified energy efficient measures that were pre-approved (for exceptions to this condition, please refer to “exceptions for approval”.) In order to be eligible for Program Incentives, a Customer, or an agent (contractor/vendor) authorized by a Customer, must submit a properly completed application package. The package must include an application signed by the customer; a complete (current) utility bill; and technology worksheet and manufacturer’s cut sheets (where appropriate). This information must be submitted to the Market Manager before equipment is installed. Applications for measures that are self installed by customers must be submitted by the customer and not the sales vendor of the measure, however, the customer may elect to assign payment of the incentives to the sales vendor. This application package must be received by the Market Manager on or before December 31, 2009 in order to be eligible for 2009 incentives. The Market Manager will review the application package to determine if the project is eligible for a Program Incentive. If eligible, the Customer will receive an approval letter with the estimated authorized incentive amount and the date by which the equipment must be installed in order for the approval to remain in effect. Upon receipt of an approval letter, the Customer may then proceed to install the equipment listed on the approved application. Equipment installed prior to the date of the Market Manager’s approval letter is not eligible for an incentive. The Market Manager reserves the right to conduct a pre-inspection of the facility prior to the installation of equipment. This will be done prior to the issuance of the approval letter. All equipment must be purchased within 12 months of date of application. Any customer and/or Agent who purchases equipment prior to the receipt of an incentive approval letter does so at his/her own risk.
exceptions for Approval – The Application and Eligibility Process pertains to all projects except for those involving either Unitary HVAC or Motors having an incentive amount less than $5,000. These measures, at this incentive level, may be installed without prior approval. In addition, but at the sole discretion of the Market Manager, emergency replacement of equipment may not require a prior approval determination and letter. in such cases, please notify the market manager of such emergencies as early as possible, that an application will soon be sent in that was not pre-approved.
Post installation Approval – After installation is completed, the Customer, or an agent authorized by the Customer, must finalize and submit an invoice for the purchase of the equipment (material cost must be broken out from labor costs), and any other required documentation as specified on the equipment application or in the Market Manager’s initial approval letter.
NJ SmartStart Buildings®

Please refer to the Program Guide on the NJCleanEnergy.com/ssb website for the complete Application and Eligibility Process.
The Market Manager reserves the right to verify sales transactions and to have reasonable access to Participating Customer’s facility to inspect both pre-existing product or equipment (if applicable) and the Energy-Efficient Measures installed under this Program, either prior to issuing incentives or at a later time.
Energy-Efficient Measures must be installed in buildings located within a New Jersey Utilities’ service territory and designated on the Participating Customer’s incentive application. Program Incentives are available for qualified Energy-Efficient Measures as listed and described in the Program materials and incentive applications. The Participating Customer must ultimately own the equipment, either through an up-front purchase or at the end of a short-term lease. (Design Incentives are available to design professionals as described in the Program materials and applications. A different and separate agreement must be executed by participating design professionals to be eligible for this type of incentive. The design professional does not need to be based in New Jersey.)
Equipment procured by Participating Customers through another program offered by New Jersey's Clean Energy Program or the New Jersey Utilities, as applicable, is not eligible for incentives through this program. Customers who have not contributed to the Societal Benefits Charge of the applicable New Jersey Utility are not be eligible for incentives offered through this program.
incentive Amount – Program Incentives will equal either: a) the approved Program Incentive amount, or b) the actual equipment cost of the Energy-Efficient Measure, whichever is less, as determined by the Market Manager. Products offered at no direct cost to the customer are ineligible. Incomplete application submissions, applications requiring inspections and unanticipated high volume of activities may cause processing delays. Program Incentives are limited to $500,000 per utility account in a calendar year. Contact the Market Manager regarding any questions.
tax liability – The Market Manager will not be responsible for any tax liability that may be imposed on any Participating Customer as a result of the payment of Program Incentives. All Participating Customers must supply their Federal Tax Identification number or social security number to the Market Manager on the application form in order to receive a Program Incentive. In addition, Participating Customers must also provide a Tax Clearance Form (Business Assistance or Incentive Clearance Certificate) that is dated within 90 days of equipment installation
endorsement – The Market Manager and Administrator do not endorse, support or recommend any particular manufacturer, product or system design in promoting this Program.
warranties – THE MARKET MANAGER AND ADMINISTRATOR DO NOT WARRANT THE PERFORMANCE OF INSTALLED EQUIPMENT, AND/OR SERVICES RENDERED AS PART OF THIS PROGRAM, EITHER EXPRESSLY OR IMPLICITLY. NO WARRANTIES OR REPRESENTATIONS OF ANY KIND, WHETHER STATUTORY, EXPRESSED, OR IMPLIED, INCLUDING, WITHOUT LIMITATIONS, WARRANTIES OF MERCHANTABILITY OR FITNESS FOR A PARTICULAR PURPOSE REGARDING EQUIPMENT OR SERVICES PROVIDED BY A MANUFACTURER OR VENDOR. CONTACT YOUR VENDOR/SERVICES PROVIDER FOR DETAILS REGARDING PERFORMANCE AND WARRANTIES.
limitation of liability – By virtue of participating in this Program, Participating Customers agree to waive any and all claims or damages against the Market Manager or the Administrator, except the receipt of the Program Incentive. Participating Customers agree that the Market Manager’s and Administrator’s liability, in connection with this Program, is limited to paying the Program Incentive specified. Under no circumstances shall the Market Manager, its representatives, or subcontractors, or the Administrator, be liable for any lost profits, special, punitive, consequential or incidental damages or for any other damages or claims connected with or resulting from participation in this Program. Further, any liability attributed to the Market Manager under this Program shall be individual, and not joint and/or several.
Assignment – The Participating Customer may assign Program Incentive payments to a specified vendor.
Participating customer’s certification – Participating Customer certifies that he/she purchased and installed the equipment listed in their application at their defined New Jersey location. Participating Customer agrees that all information is true and that he/she has conformed to all of the Program and equipment requirements listed in the application.
termination – The New Jersey Board of Public Utilities reserves the right to extend, modify (this includes modification of Program Incentive levels) or terminate this Program without prior or further notice.
Acknowledgement – I have read, understood and am in compliance with all rules and regulations concerning this incentive program. I certify that all information provided is correct to the best of my knowledge, and I give the Market Manager permission to share my records with the New Jersey Board of Public Utilities, and contractors it selects to manage, coordinate or evaluate the NJ SmartStart Buildings Program. Additionally, I allow reasonable access to my property to inspect the installation and performance of the technologies and installations that are eligible for incentives under the guidelines of New Jersey’s Clean Energy Program.

2009 Lighting Controls Incentive WorksheetCustomer InformationCompany
Check here if multiple worksheets are being submitted for one project/building.
Facility Address
Lighting Controls Information
Total(including additional sheets)
For additional fixtures, attach additional sheets and check here
*For OSW and OSR, insert number of control devices; for DLD and OHLF, insert total number of ballasts controlled; for OHLH and DDH, insert total number of fixtures controlled.
Date Submitted
Location Reason Control Fixture Type Watts A B C N–New Device Controlled Controlled # of Fixtures # of Units* Incentive Total R–Replaced Type per Device Controlled per Unit Incentive per Device (B x C)
(Examples)
R OSW 4-lamp, T8 2 4 $20 4 x $20 = $80
R OSR 2-lamp, T8 6 2 $35 2 x $35 = $70
R DLD 2-lamp, T8 6 $25 6 x $25 = $150
R OHLF 4-lamp, T8 12 $25 12 x $25 = $300
R OHLH 150w MH 10 5 $75 5 x $75 = $375
R DDH 250w HPS 12 4 $75 4 x $75 = $300
001-01/09
Specific Program Requirements* These requirements are in addition to the Program Terms and Conditions.
Visit our web site: www.NJCleanEnergy.com
Mail or fax your application package DIRECTLy to the Commercial/Industrial Market Manager.
Lighting Control Prescriptive Incentives* Control Device Type Incentive per Unit
OSW – Occupancy Sensor Wall Mounted (Existing facilities only) $20 per control
OSR – Occupancy Sensor Remote Mounted (Existing facilities only) $35 per control
DLD – Fluorescent Daylight Dimming $25 per fixture controlled
OHLF – Occupancy Controlled High-Low with Step Ballast $25 per fixture controlled
OSRH – Occupancy Sensor Remote Mounted $35 per control
OHLH – Occupancy Controlled High-Low with Step Ballast $75 per fixture controlled
DDH – Daylight Dimming $75 per fixture controlled
1. Please refer to the program guide for additional applicable technical requirements, including special requirements for lighting controls.
2. Include the manufacturer’s specification sheet with the application package and mail or fax directly to the Commercial/Industrial Market Manager.
3. All lighting controls eligible for incentives must be UL listed.4. Lighting control incentives are only available for control of eligible
energy efficient lighting fixtures.5. If more than one eligible lighting control device is associated with
the same eligible fixture, the incentive paid will be for the lighting control device that yields the largest incentive only.
6. Occupancy Sensor Controls (Existing Facilities Only): ■ There is no incentive available for occupancy sensors installed in a
space where they are prohibited by state or local building or safety code. Additionally, no incentive is eligible for occupancy sensors in the following specific spaces in all cases: stairways, restrooms (remote mounted only allowed), elevators, corridors/hallways, lobbies, and closets/storage areas.
■ Incentives will only be paid for eligible occupancy sensors (OSW & OSR) controlling at least 2 eligible lighting fixtures and, for OSR installations, a minimum total connected load of 180 watts.
■ Incentives will only be paid for eligible OSRH occupancy sensors controlling eligible fixtures when the controlled wattage is greater than 180 watts.
■ Occupancy sensors with manual override to the “ON” position are ineligible for incentive.
7. High-Low Controls (OHLF and OHLH): ■ Incentives will not be paid for high-low controls on eligible
fluorescent fixtures where daylight dimming controls can be effectively employed.
■ Incentives will not be paid for spaces where the bottom of the fixture does not comply with the appropriate Prescriptive Lighting 2008 incentives, nor in spaces smaller than 250 square feet.
■ Incentives available only when “low level” is no more than 60% of “high level.”
■ Incentives are not available for the following spaces: stairways, elevators, corridors/hallways, or lobbies.
■ OHLF will control fixtures that have a ballast factor less than 1.0 for T-5s and 1.14 for T-8s.
■ OHLH will control fixtures that have a ballast factor greater than or equal to 1.0 for T-5s and 1.14 for T-8s.
8. Daylight Dimming Controls for Eligible Fixtures: ■ Incentives will only be paid for eligible daylight dimming controls
operating at least 4 eligible ballasts with a minimum total connected load of 240 watts.
■ Dimming shall be continuous or stepped at 4 or more levels. ■ Incentives will be paid only for eligible daylight dimming control
systems designed in accordance with IESNA practice as delineated in “RP-5-99, IESNA Recommended Practice of Daylighting.”
■ DLD will control fixtures that have a ballast factor less than 1.0 for T-5s and 1.14 for T-8s.
■ DDH will control fixtures that have a ballast factor greater than or equal to 1.0 for T-5s and 1.14 for T-8s.
New Jersey SmartStart Buildings® is a registered trademark. Use of the mark without the permission of the New Jersey Board of Public Utilities, Office of Clean Energy is prohibited. *Incentives/Requirements subject to change.
New Jersey's Clean Energy Programc/o TRC Energy Services
900 Route 9 North, Suite 104Woodbridge, NJ 07095
Phone: 866-657-6278Fax: 732-855-0422

Program Terms and Conditions
Definitions:
Design Incentives – Incentives that may be offered to design professionals by the Program.
Design Services – Services that may be offered to design professionals under the Program.
Energy-Efficient Measures – Any device eligible to receive a Program Incentive payment through the NJ Clean Energy Commercial and Industrial Program (New Jersey SmartStart Buildings).
New Jersey Utilities – The regulated electric and/or gas utilities in the State of New Jersey. They are: Atlantic City Electric, Jersey Central Power & Light, Rockland Electric Company, New Jersey Natural Gas, Elizabethtown Gas, PSE&G, and South Jersey Gas.
Administrator – New Jersey Board of Public Utilities, Office of Clean Energy
Participating Customers – Those non-residential electric and/or gas service customers of the New Jersey Utilities who participate in this Program.
Product Installation or Equipment Installation – Installation of the Energy-Efficient Measures.
Market Manager – TRC Energy Services (see below). The NJ Board of Public Utilities has transferred responsibility for the NJ SmartStart Buildings Program from the NJ Utilities to TRC.
Program – The Commercial and Industrial Energy-Efficient Construction Program (New Jersey SmartStart Buildings) offered herein by the New Jersey Board of Public Utilities, Office of Clean Energy pursuant to state regulatory approval under the New Jersey Electric Discount and Energy Competition Act, NJSA 48:3-49, et seq.
Program Incentives – Refers to the amount or level of incentive that the Program provides to participating customers pursuant to the Program offered herein (see description below under “Incentive Amount” heading).
Program Offer – Program Incentives are available to non-residential retail electric and/or gas service customers of the New Jersey Utilities identified above. Program Incentives for new construction are available only for projects in areas designated for growth in the State Plan. Public school (K-12) new construction projects are exempted from this restriction and are eligible for new Program incentives throughout the State. Customers, or their trade allies, can determine if a location is in a designated growth area by referring to the Smart Growth Locator available from the HMFA website or contact the Market Manager if you are uncertain about project eligibility.
Application and Eligibility Process – The Program pays incentives after the installation of qualified energy efficient measures that were pre-approved (for exceptions to this condition, please refer to “exceptions for approval”.) In order to be eligible for Program Incentives, a Customer, or an agent (contractor/vendor) authorized by a Customer, must submit a properly completed application package. The package must include an application signed by the customer; a complete (current) utility bill; and technology worksheet and manufacturer’s cut sheets (where appropriate). This information must be submitted to the Market Manager before equipment is installed. Applications for measures that are self installed by customers must be submitted by the customer and not the sales vendor of the measure, however, the customer may elect to assign payment of the incentives to the sales vendor. This application package must be received by the Market Manager on or before December 31, 2009 in order to be eligible for 2009 incentives. The Market Manager will review the application package to determine if the project is eligible for a Program Incentive. If eligible, the Customer will receive an approval letter with the estimated authorized incentive amount and the date by which the equipment must be installed in order for the approval to remain in effect. Upon receipt of an approval letter, the Customer may then proceed to install the equipment listed on the approved application. Equipment installed prior to the date of the Market Manager’s approval letter is not eligible for an incentive. The Market Manager reserves the right to conduct a pre-inspection of the facility prior to the installation of equipment. This will be done prior to the issuance of the approval letter. All equipment must be purchased within 12 months of date of application. Any Customer and/or Agent who purchases equipment prior to the receipt of an incentive approval letter does so at his/her own risk.
Exceptions for Approval – The Application and Eligibility Process pertains to all projects except for those involving either Unitary HVAC or Motors having an incentive amount less than $5,000. These measures, at this incentive level, may be installed without prior approval. In addition, but at the sole discretion of the Market Manager, emergency replacement of equipment may not require a prior approval determination and letter. In such cases, please notify the Market Manager of such emergencies as early as possible, that an application will soon be sent in that was not pre-approved.
Post Installation Approval – After installation is completed, the Customer, or an agent authorized by the Customer, must finalize and submit an invoice for the purchase of the equipment (material cost must be broken out from labor costs), and any other required documentation as specified on the equipment application or in the Market Manager’s initial approval letter.
NJ SmartStart Buildings®

Please refer to the Program Guide on the NJCleanEnergy.com/ssb website for the complete Application and Eligibility Process.
The Market Manager reserves the right to verify sales transactions and to have reasonable access to Participating Customer’s facility to inspect both pre-existing product or equipment (if applicable) and the Energy-Efficient Measures installed under this Program, either prior to issuing incentives or at a later time.
Energy-Efficient Measures must be installed in buildings located within a New Jersey Utilities’ service territory and designated on the Participating Customer’s incentive application. Program Incentives are available for qualified Energy-Efficient Measures as listed and described in the Program materials and incentive applications. The Participating Customer must ultimately own the equipment, either through an up-front purchase or at the end of a short-term lease. (Design Incentives are available to design professionals as described in the Program materials and applications. A different and separate agreement must be executed by participating design professionals to be eligible for this type of incentive. The design professional does not need to be based in New Jersey.)
Equipment procured by Participating Customers through another program offered by New Jersey's Clean Energy Program or the New Jersey Utilities, as applicable, is not eligible for incentives through this program. Customers who have not contributed to the Societal Benefits Charge of the applicable New Jersey Utility are not be eligible for incentives offered through this program.
Incentive Amount – Program Incentives will equal either: a) the approved Program Incentive amount, or b) the actual equipment cost of the Energy-Efficient Measure, whichever is less, as determined by the Market Manager. Products offered at no direct cost to the customer are ineligible. Incomplete application submissions, applications requiring inspections and unanticipated high volume of activities may cause processing delays. Program Incentives are limited to $500,000 per utility account in a calendar year. Contact the Market Manager regarding any questions.
Tax Liability – The Market Manager will not be responsible for any tax liability that may be imposed on any Participating Customer as a result of the payment of Program Incentives. All Participating Customers must supply their Federal Tax Identification number or social security number to the Market Manager on the application form in order to receive a Program Incentive. In addition, Participating Customers must also provide a Tax Clearance Form (Business Assistance or Incentive Clearance Certificate) that is dated within 90 days of equipment installation
Endorsement – The Market Manager and Administrator do not endorse, support or recommend any particular manufacturer, product or system design in promoting this Program.
Warranties – THE MARKET MANAGER AND ADMINISTRATOR DO NOT WARRANT THE PERFORMANCE OF INSTALLED EQUIPMENT, AND/OR SERVICES RENDERED AS PART OF THIS PROGRAM, EITHER EXPRESSLY OR IMPLICITLY. NO WARRANTIES OR REPRESENTATIONS OF ANY KIND, WHETHER STATUTORY, EXPRESSED, OR IMPLIED, INCLUDING, WITHOUT LIMITATIONS, WARRANTIES OF MERCHANTABILITY OR FITNESS FOR A PARTICULAR PURPOSE REGARDING EQUIPMENT OR SERVICES PROVIDED BY A MANUFACTURER OR VENDOR. CONTACT YOUR VENDOR/SERVICES PROVIDER FOR DETAILS REGARDING PERFORMANCE AND WARRANTIES.
Limitation of Liability – By virtue of participating in this Program, Participating Customers agree to waive any and all claims or damages against the Market Manager or the Administrator, except the receipt of the Program Incentive. Participating Customers agree that the Market Manager’s and Administrator’s liability, in connection with this Program, is limited to paying the Program Incentive specified. Under no circumstances shall the Market Manager, its representatives, or subcontractors, or the Administrator, be liable for any lost profits, special, punitive, consequential or incidental damages or for any other damages or claims connected with or resulting from participation in this Program. Further, any liability attributed to the Market Manager under this Program shall be individual, and not joint and/or several.
Assignment – The Participating Customer may assign Program Incentive payments to a specified vendor.
Participating Customer’s Certification – Participating Customer certifies that he/she purchased and installed the equipment listed in their application at their defined New Jersey location. Participating Customer agrees that all information is true and that he/she has conformed to all of the Program and equipment requirements listed in the application.
Termination – The New Jersey Board of Public Utilities reserves the right to extend, modify (this includes modification of Program Incentive levels) or terminate this Program without prior or further notice.
Acknowledgement – I have read, understood and am in compliance with all rules and regulations concerning this incentive program. I certify that all information provided is correct to the best of my knowledge, and I give the Market Manager permission to share my records with the New Jersey Board of Public Utilities, and contractors it selects to manage, coordinate or evaluate the NJ SmartStart Buildings Program. Additionally, I allow reasonable access to my property to inspect the installation and performance of the technologies and installations that are eligible for incentives under the guidelines of New Jersey’s Clean Energy Program.
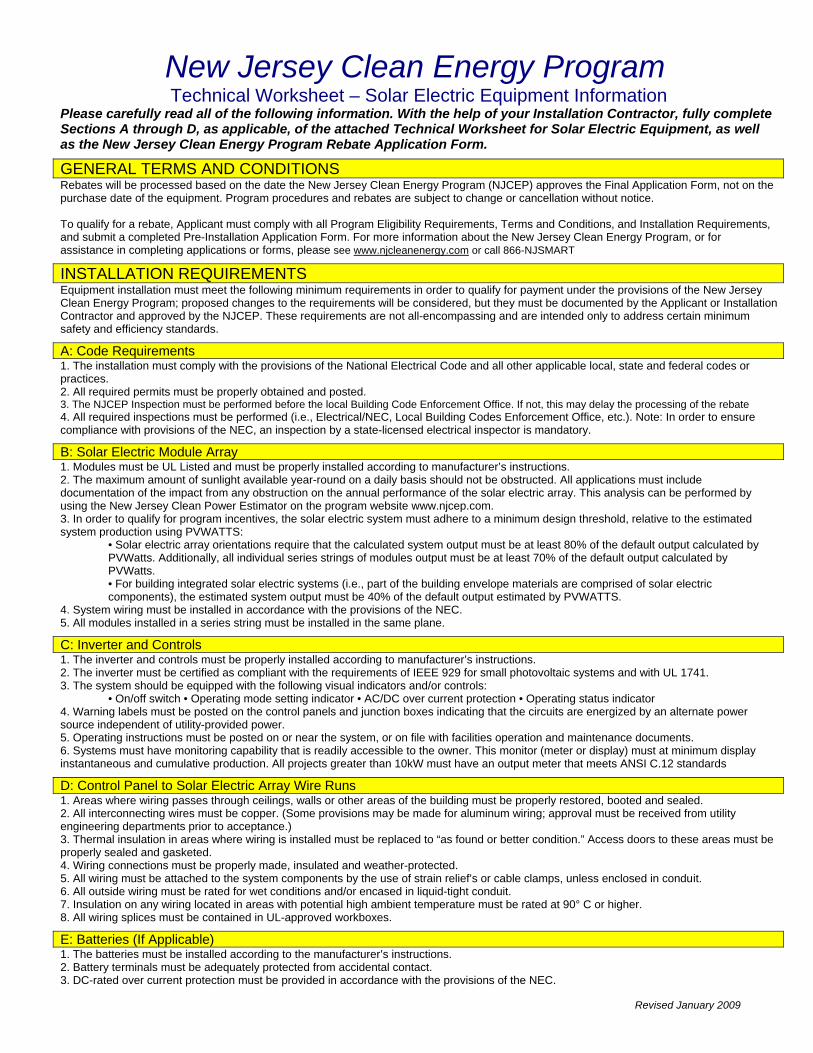
New Jersey Clean Energy Program Technical Worksheet – Solar Electric Equipment Information
Please carefully read all of the following information. With the help of your Installation Contractor, fully complete Sections A through D, as applicable, of the attached Technical Worksheet for Solar Electric Equipment, as well as the New Jersey Clean Energy Program Rebate Application Form.
Rebates will be processed based on the date the New Jersey Clean Energy Program (NJCEP) approves the Final Application Form, not on the purchase date of the equipment. Program procedures and rebates are subject to change or cancellation without notice. To qualify for a rebate, Applicant must comply with all Program Eligibility Requirements, Terms and Conditions, and Installation Requirements, and submit a completed Pre-Installation Application Form. For more information about the New Jersey Clean Energy Program, or for assistance in completing applications or forms, please see www.njcleanenergy.com or call 866-NJSMART
Equipment installation must meet the following minimum requirements in order to qualify for payment under the provisions of the New Jersey Clean Energy Program; proposed changes to the requirements will be considered, but they must be documented by the Applicant or Installation Contractor and approved by the NJCEP. These requirements are not all-encompassing and are intended only to address certain minimum safety and efficiency standards.
1. The installation must comply with the provisions of the National Electrical Code and all other applicable local, state and federal codes or practices. 2. All required permits must be properly obtained and posted. 3. The NJCEP Inspection must be performed before the local Building Code Enforcement Office. If not, this may delay the processing of the rebate 4. All required inspections must be performed (i.e., Electrical/NEC, Local Building Codes Enforcement Office, etc.). Note: In order to ensure compliance with provisions of the NEC, an inspection by a state-licensed electrical inspector is mandatory.
1. Modules must be UL Listed and must be properly installed according to manufacturer’s instructions. 2. The maximum amount of sunlight available year-round on a daily basis should not be obstructed. All applications must include documentation of the impact from any obstruction on the annual performance of the solar electric array. This analysis can be performed by using the New Jersey Clean Power Estimator on the program website www.njcep.com. 3. In order to qualify for program incentives, the solar electric system must adhere to a minimum design threshold, relative to the estimated system production using PVWATTS:
• Solar electric array orientations require that the calculated system output must be at least 80% of the default output calculated by PVWatts. Additionally, all individual series strings of modules output must be at least 70% of the default output calculated by PVWatts. • For building integrated solar electric systems (i.e., part of the building envelope materials are comprised of solar electric components), the estimated system output must be 40% of the default output estimated by PVWATTS.
4. System wiring must be installed in accordance with the provisions of the NEC. 5. All modules installed in a series string must be installed in the same plane.
1. The inverter and controls must be properly installed according to manufacturer’s instructions. 2. The inverter must be certified as compliant with the requirements of IEEE 929 for small photovoltaic systems and with UL 1741. 3. The system should be equipped with the following visual indicators and/or controls:
• On/off switch • Operating mode setting indicator • AC/DC over current protection • Operating status indicator 4. Warning labels must be posted on the control panels and junction boxes indicating that the circuits are energized by an alternate power source independent of utility-provided power. 5. Operating instructions must be posted on or near the system, or on file with facilities operation and maintenance documents. 6. Systems must have monitoring capability that is readily accessible to the owner. This monitor (meter or display) must at minimum display instantaneous and cumulative production. All projects greater than 10kW must have an output meter that meets ANSI C.12 standards
1. Areas where wiring passes through ceilings, walls or other areas of the building must be properly restored, booted and sealed. 2. All interconnecting wires must be copper. (Some provisions may be made for aluminum wiring; approval must be received from utility engineering departments prior to acceptance.) 3. Thermal insulation in areas where wiring is installed must be replaced to “as found or better condition.” Access doors to these areas must be properly sealed and gasketed. 4. Wiring connections must be properly made, insulated and weather-protected. 5. All wiring must be attached to the system components by the use of strain relief’s or cable clamps, unless enclosed in conduit. 6. All outside wiring must be rated for wet conditions and/or encased in liquid-tight conduit. 7. Insulation on any wiring located in areas with potential high ambient temperature must be rated at 90° C or higher. 8. All wiring splices must be contained in UL-approved workboxes.
1. The batteries must be installed according to the manufacturer’s instructions. 2. Battery terminals must be adequately protected from accidental contact. 3. DC-rated over current protection must be provided in accordance with the provisions of the NEC.
Revised January 2009
GENERAL TERMS AND CONDITIONS
INSTALLATION REQUIREMENTS
A: Code Requirements
B: Solar Electric Module Array
C: Inverter and Controls
D: Control Panel to Solar Electric Array Wire Runs
E: Batteries (If Applicable)

New Jersey Clean Energy Program Technical Worksheet – Solar Electric Equipment Information
Original Application Date: _________________ Revised Application Date: ______________________ Customer Name: _______________________________ Application Number: _________________ (Corresponding to Rebate Application Form) (Assigned by the NJBPU) A: EQUIPMENT INFORMATION 1. Solar Electric Module Manufacturer: ________________________ Module Model Number: _____________________________ 2. Power Rating per Module: ________ DC Watts (Refer to STC conditions) Number of Modules: _____________________________ 3. Total Array Output: _______ _ DC Watts (No. of Modules x Power Rating) 4. Inverter Manufacturer: __________________________________ Inverter Model Number: _____________________ 5. Inverter’s Continuous AC Rating: _________________________ AC Watts Number of Inverters: _____________________ 6. Total Inverter Output: ________ AC Watts (Inverter Continuous AC Rating x Number of Inverters) 7. Inverter’s Peak Efficiency: ______ _ _ (Refer to manufacturer’s peak efficiency rating)
1. Solar Electric Array Location: _ Rooftop _ Pole Mount or Ground Mount Location: 2. Solar Electric Module Orientation: __________ degrees (e.g., 180 degrees magnetic south)
Note: in Central New Jersey, magnetic south compass reading is 10 degrees east of true south. 3. Solar Electric Module Tilt: ___________ degrees (e.g., flat mount = 0 degrees; vertical mount = 90 degrees) 4. Solar Electric Module Tracking: _Fixed _Single-axis _Double-axis 5. Inverter Location: _ Indoor _ Outdoor Location: _________________________________________________________________ 6. Utility-Accessible AC Disconnect Switch Location: ________________________________________________________________ 7. System Type and Mode of Operation:
_ Utility interactive (parallel/capable of back feeding the meter) (_ with battery backup) _ Dedicated circuit, utility power as backup (transfer switch) (_ with battery charging) _ Stand-alone (system confined to an independent circuit, no utility backup) (_ with battery charging)
1. System rated output (Section A, line 3 above): ____________ DC Watts 2. Incentive Calculation (Calculate appropriate incentive based on System Rated Output):
Residential Applicants that perform Energy Efficiency Audit a. 0 to 10,000 Watts x $1.75/Watt = $___________________+
Commercial, Farm, Public and Non-Profit 0 to 50,000 Watts x $1.00/Watt = $_____________________+
Residential Applicants that do not perform Energy Efficiency Audit b. 0 to 10,000 Watts x $1.55/Watt = $___________________+
Large PV Project Applications > 50,000 Watts = $____Not eligible for rebates____________
d. Total Rebate Calculation: $__________________________
Total Rebate Calculation: $____________________________
3. School Applicants: Maximum Annual School Rebate: $________________ (For Public School applicants, enter the lesser value from no. 6 on the School Application form or $50,000) 4. Total Installed System Cost: $_____________________________
(Eligible installed system cost includes all equipment, installation, and applicable interconnection costs before the New Jersey Clean Energy Program incentive.)
5. Requested Incentive (Enter the appropriate value from C2. b or c): $___________________________________
1. Module: _____ Years at _____ Percent of Rated Power Output 2. Inverter:_____ Years 3. Installation: _____ Years Revised January 2009
B: PROPOSED INSTALLATION/INTERCONNECTION INFORMATION
C: INCENTIVE REQUEST CALCULATION
D: WARRANTY INFORMATION

APPENDIX H
ENGINEER OPINION OF PROBABLE CONSTRUCTION COSTS

Page 1 of 1
CDM PROJECT CONSTRUCTION COST ESTIMATE
15 British American Blvd Location: Point Pleasant School DistrictLatham, NY 12110 Estimate by: RKAPhone (518) 782-4500 Checked by: MGFax (518) 786-3810
ITEM DESCRIPTION QTY UNIT MATERIAL MATERIAL QTY UNIT LABOR LABOR TOTALUNIT COST SUBTOTAL COST SUBTOTAL
Point Pleasant High School
1Boiler, Gas-Fired, Condensing High Efficiency2,000 MBH 5 ea. 170,000.00$ 5 ea. 5,750.00$ 28,750.00$ 198,750.00$ Subtotal 170,000.00 28,750.00
SUBTOTAL = 198,750.00$ MARKUP % = 0.15$
MARKUP = 29,812.50$ SUB-TOTAL w/ OH & P = 228,562.50$
CONTINGENCY % = 0.25CONTINGENCY = 57,140.63$
BUDGET COST ESTIMATE = 285,703.13$
2:18 PM 9/4/2009
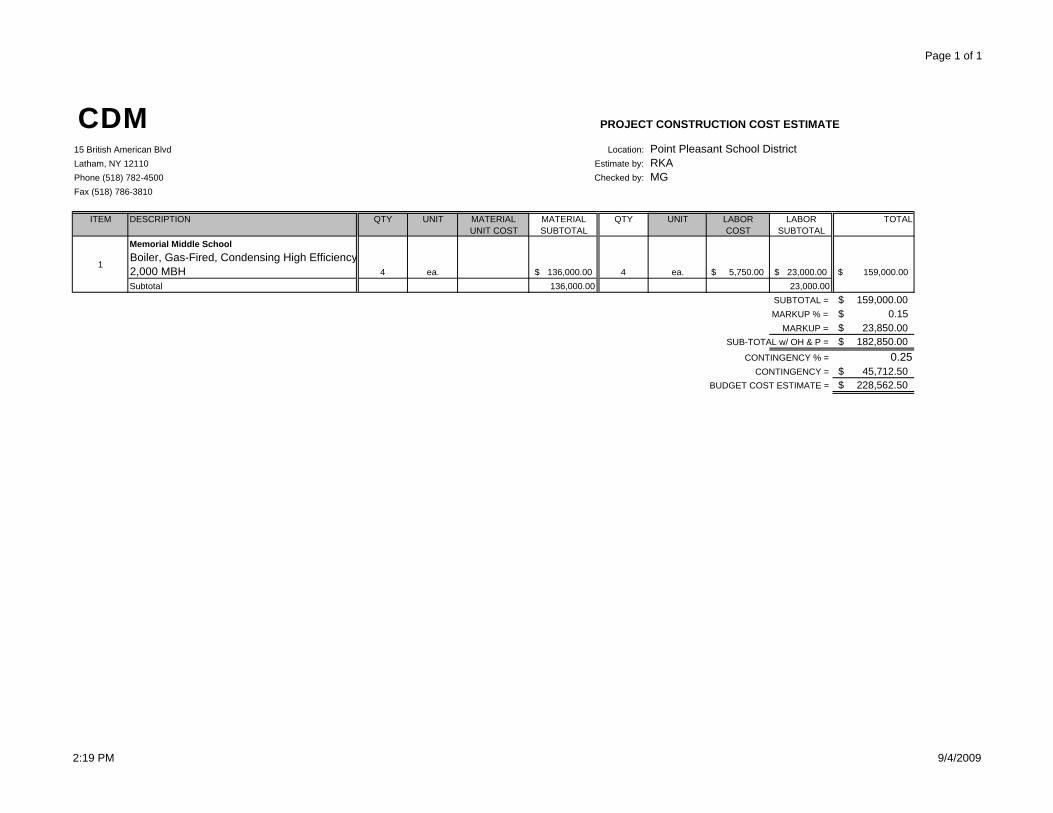
Page 1 of 1
CDM PROJECT CONSTRUCTION COST ESTIMATE
15 British American Blvd Location: Point Pleasant School DistrictLatham, NY 12110 Estimate by: RKAPhone (518) 782-4500 Checked by: MGFax (518) 786-3810
ITEM DESCRIPTION QTY UNIT MATERIAL MATERIAL QTY UNIT LABOR LABOR TOTALUNIT COST SUBTOTAL COST SUBTOTAL
Memorial Middle School
1Boiler, Gas-Fired, Condensing High Efficiency2,000 MBH 4 ea. 136,000.00$ 4 ea. 5,750.00$ 23,000.00$ 159,000.00$ Subtotal 136,000.00 23,000.00
SUBTOTAL = 159,000.00$ MARKUP % = 0.15$
MARKUP = 23,850.00$ SUB-TOTAL w/ OH & P = 182,850.00$
CONTINGENCY % = 0.25CONTINGENCY = 45,712.50$
BUDGET COST ESTIMATE = 228,562.50$
2:19 PM 9/4/2009

Page 1 of 1
CDM PROJECT CONSTRUCTION COST ESTIMATE
15 British American Blvd Location: Point Pleasant School DistrictLatham, NY 12110 Estimate by: BPCPhone (518) 782-4500 Checked by: MGFax (518) 786-3810
ITEM DESCRIPTION QTY UNIT MATERIAL MATERIAL QTY UNIT LABOR LABOR TOTALUNIT COST SUBTOTAL COST SUBTOTAL
Nellie Bennett Elementary School
1Boiler, Gas-Fired, Condensing High Efficiency, 3,000 MBH 2 ea. 40,000.00$ 80,000.00$ 2 ea. 5,750.00$ 11,500.00$ 91,500.00$ Subtotal 80,000.00 11,500.00
SUBTOTAL = 91,500.00$ MARKUP % = 0.15$
MARKUP = 13,725.00$ SUB-TOTAL w/ OH & P = 105,225.00$
CONTINGENCY % = 0.25CONTINGENCY = 26,306.25$
BUDGET COST ESTIMATE = 131,531.25$ ,$
2:27 PM 9/8/2009
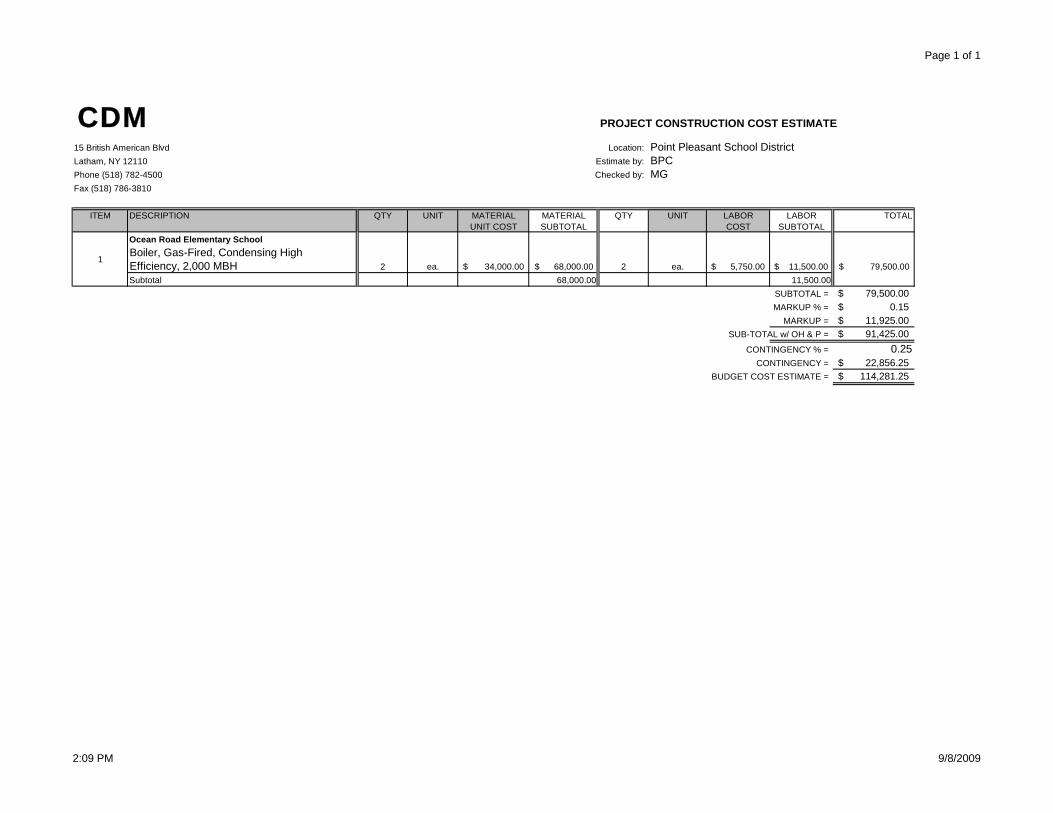
Page 1 of 1
CDM PROJECT CONSTRUCTION COST ESTIMATE
15 British American Blvd Location: Point Pleasant School DistrictLatham, NY 12110 Estimate by: BPCPhone (518) 782-4500 Checked by: MGFax (518) 786-3810
ITEM DESCRIPTION QTY UNIT MATERIAL MATERIAL QTY UNIT LABOR LABOR TOTALUNIT COST SUBTOTAL COST SUBTOTAL
Ocean Road Elementary School
1Boiler, Gas-Fired, Condensing High Efficiency, 2,000 MBH 2 ea. 34,000.00$ 68,000.00$ 2 ea. 5,750.00$ 11,500.00$ 79,500.00$ Subtotal 68,000.00 11,500.00
SUBTOTAL = 79,500.00$ MARKUP % = 0.15$
MARKUP = 11,925.00$ SUB-TOTAL w/ OH & P = 91,425.00$
CONTINGENCY % = 0.25CONTINGENCY = 22,856.25$
BUDGET COST ESTIMATE = 114,281.25$ ,$
2:09 PM 9/8/2009

Page 1 of 1
CDM PROJECT CONSTRUCTION COST ESTIMATE
15 British American Blvd Location: Point Pleasant School DistrictLatham, NY 12110 Estimate by: RKAPhone (518) 782-4500 Checked by: MGFax (518) 786-3810
ITEM DESCRIPTION QTY UNIT MATERIAL & LABOR MATERIAL TOTALUNIT COST SUBTOTAL
Point Pleasant High School1 DDC Control System 156,902 SF 0.40$ 62,760.80$ 62,760.80$
Subtotal 62,760.80SUBTOTAL = 62,760.80$ MARKUP % = 0.15$
MARKUP = 9,414.12$ SUB-TOTAL w/ OH & P = 72,174.92$
CONTINGENCY % = 0.25CONTINGENCY = 18,043.73$
BUDGET COST ESTIMATE = 90,218.65$
Notes:1. DDC Control System Pricing is estimated at $0.40 per square foot2. One control or sensor point is estimated at $500, thus this system would provide for approximately 144 points
2:19 PM 9/4/2009

Page 1 of 1
CDM PROJECT CONSTRUCTION COST ESTIMATE
15 British American Blvd Location: Point Pleasant School DistrictLatham, NY 12110 Estimate by: RKAPhone (518) 782-4500 Checked by: MGFax (518) 786-3810
ITEM DESCRIPTION QTY UNIT MATERIAL & LABOR MATERIAL TOTALUNIT COST SUBTOTAL
Memorial Middle School1 DDC Control System 100,000 SF 0.40$ 40,000.00$ 40,000.00$
Subtotal 40,000.00SUBTOTAL = 40,000.00$ MARKUP % = 0.15$
MARKUP = 6,000.00$ SUB-TOTAL w/ OH & P = 46,000.00$
CONTINGENCY % = 0.25CONTINGENCY = 11,500.00$
BUDGET COST ESTIMATE = 57,500.00$
Notes:1. DDC Control System Pricing is estimated at $0.40 per square foot2. One control or sensor point is estimated at $500, thus this system would provide for approximately 92 points
2:19 PM 9/4/2009

Page 1 of 1
CDM PROJECT CONSTRUCTION COST ESTIMATE
15 British American Blvd Location: Point Pleasant School DistrictLatham, NY 12110 Estimate by: BPCPhone (518) 782-4500 Checked by: MGFax (518) 786-3810
ITEM DESCRIPTION QTY UNIT MATERIAL & LABOR MATERIAL TOTALUNIT COST SUBTOTAL
Nellie Bennett Elementary School1 DDC Control System 88,500 SF 0.40$ 35,400.00$ 35,400.00$
Subtotal 35,400.00SUBTOTAL = 35,400.00$ MARKUP % = 0.15$
MARKUP = 5,310.00$ SUB-TOTAL w/ OH & P = 40,710.00$
CONTINGENCY % = 0.25CONTINGENCY = 10,177.50$
BUDGET COST ESTIMATE = 50,887.50$
Notes:1. DDC Control System Pricing is estimated at $0.40 per square foot
$2. One control or sensor point is estimated at $500, thus this system would provide for approximately 70 points.
3:49 PM 9/8/2009
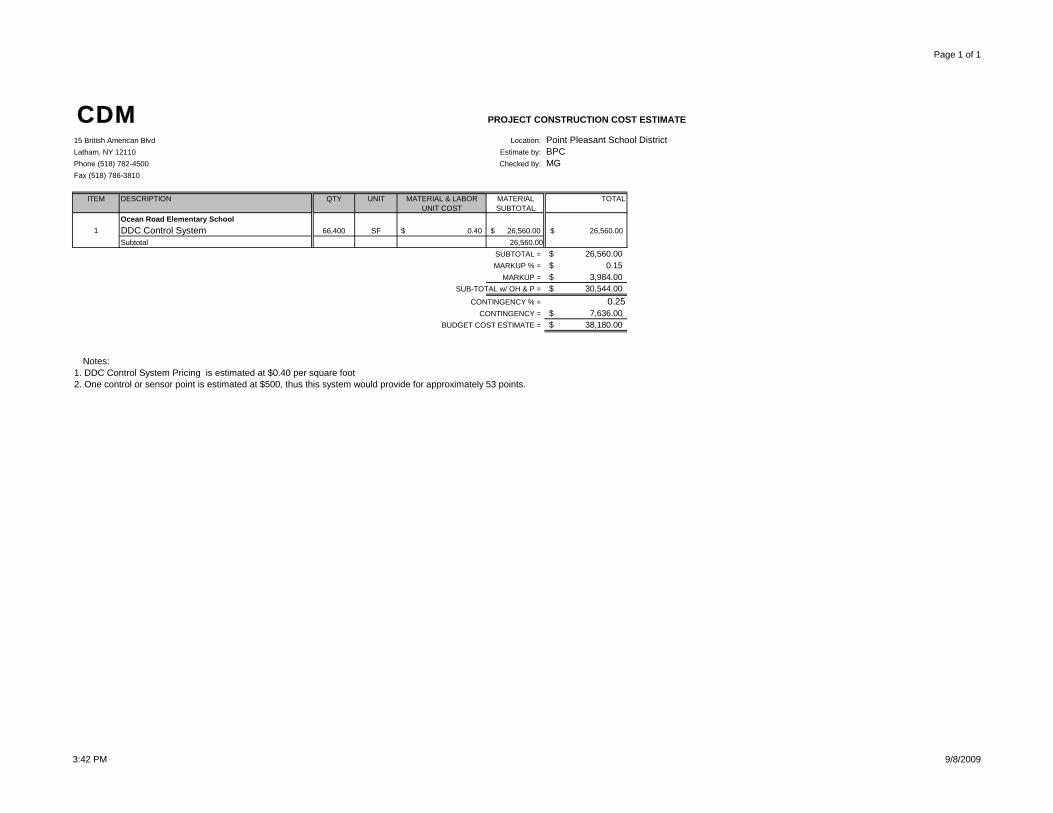
Page 1 of 1
CDM PROJECT CONSTRUCTION COST ESTIMATE
15 British American Blvd Location: Point Pleasant School DistrictLatham, NY 12110 Estimate by: BPCPhone (518) 782-4500 Checked by: MGFax (518) 786-3810
ITEM DESCRIPTION QTY UNIT MATERIAL & LABOR MATERIAL TOTALUNIT COST SUBTOTAL
Ocean Road Elementary School1 DDC Control System 66,400 SF 0.40$ 26,560.00$ 26,560.00$
Subtotal 26,560.00SUBTOTAL = 26,560.00$ MARKUP % = 0.15$
MARKUP = 3,984.00$ SUB-TOTAL w/ OH & P = 30,544.00$
CONTINGENCY % = 0.25CONTINGENCY = 7,636.00$
BUDGET COST ESTIMATE = 38,180.00$
Notes:1. DDC Control System Pricing is estimated at $0.40 per square foot
$2. One control or sensor point is estimated at $500, thus this system would provide for approximately 53 points.
3:42 PM 9/8/2009

Page 1 of 13
CDM PROJECT CONSTRUCTION COST ESTIMATE
15 British American Blvd Location: Point Pleasant Board of EducationLatham, NY 12110 Estimate by: RGPhone (518) 782-4500 Checked by: JMFax (518) 786-3810
ITEM DESCRIPTION QTY UNIT MATERIAL MATERIAL QTY UNIT LABOR LABOR TOTALUNIT COST SUBTOTAL COST SUBTOTAL
Memorial Middle School1 Lighting Upgrades - Option 1 1 ls. 47,052.00$ 47,052.00$ 1 ls.. 18,477.00$ 18,477.00$ 65,529.00$
Subtotal 47,052.00 18,477.00SUBTOTAL = 65,529.00$ MARKUP % = 0.43$
MARKUP = 28,177.47$ BUDGET COST ESTIMATE = 93,706.47$
3:17 PM 9/5/2009

Page 2 of 13
CDM PROJECT CONSTRUCTION COST ESTIMATE
15 British American Blvd Location: Point Pleasant Board of EducationLatham, NY 12110 Estimate by: RGPhone (518) 782-4500 Checked by: JMFax (518) 786-3810
ITEM DESCRIPTION QTY UNIT MATERIAL MATERIAL QTY UNIT LABOR LABOR TOTALUNIT COST SUBTOTAL COST SUBTOTAL
Memorial Middle School1 Lighting Upgrades - Option 2 1 ls. 6,552.00$ 6,552.00$ 1 ls.. 360.00$ 360.00$ 6,912.00$
Subtotal 6,552.00 360.00SUBTOTAL = 6,912.00$ MARKUP % = 0.43$
MARKUP = 2,972.16$ BUDGET COST ESTIMATE = 9,884.16$
3:17 PM 9/5/2009

Page 3 of 13
CDM PROJECT CONSTRUCTION COST ESTIMATE
15 British American Blvd Location: Point Pleasant Board of EducationLatham, NY 12110 Estimate by: RGPhone (518) 782-4500 Checked by: JMFax (518) 786-3810
ITEM DESCRIPTION QTY UNIT MATERIAL MATERIAL QTY UNIT LABOR LABOR TOTALUNIT COST SUBTOTAL COST SUBTOTAL
High School1 Lighting Upgrades - Option 1 1 ls. 47,217.00$ 47,217.00$ 1 ls.. 9,769.00$ 9,769.00$ 56,986.00$
Subtotal 47,217.00 9,769.00SUBTOTAL = 56,986.00$ MARKUP % = 0.43$
MARKUP = 24,503.98$ BUDGET COST ESTIMATE = 81,489.98$
3:17 PM 9/5/2009
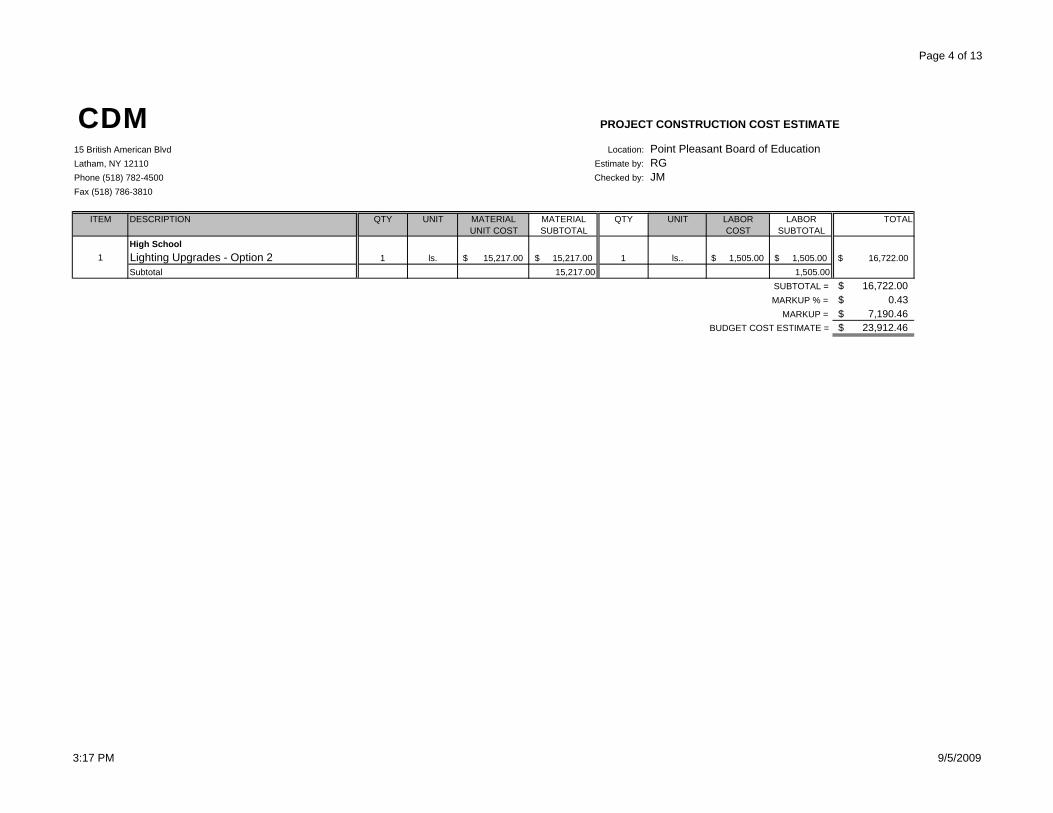
Page 4 of 13
CDM PROJECT CONSTRUCTION COST ESTIMATE
15 British American Blvd Location: Point Pleasant Board of EducationLatham, NY 12110 Estimate by: RGPhone (518) 782-4500 Checked by: JMFax (518) 786-3810
ITEM DESCRIPTION QTY UNIT MATERIAL MATERIAL QTY UNIT LABOR LABOR TOTALUNIT COST SUBTOTAL COST SUBTOTAL
High School1 Lighting Upgrades - Option 2 1 ls. 15,217.00$ 15,217.00$ 1 ls.. 1,505.00$ 1,505.00$ 16,722.00$
Subtotal 15,217.00 1,505.00SUBTOTAL = 16,722.00$ MARKUP % = 0.43$
MARKUP = 7,190.46$ BUDGET COST ESTIMATE = 23,912.46$
3:17 PM 9/5/2009

Page 5 of 13
CDM PROJECT CONSTRUCTION COST ESTIMATE
15 British American Blvd Location: Point Pleasant Board of EducationLatham, NY 12110 Estimate by: RGPhone (518) 782-4500 Checked by: JMFax (518) 786-3810
ITEM DESCRIPTION QTY UNIT MATERIAL MATERIAL QTY UNIT LABOR LABOR TOTALUNIT COST SUBTOTAL COST SUBTOTAL
Ocean Road Elementary School1 Lighting Upgrades - Option 1 1 ls. 85,096.00$ 85,096.00$ 1 ls.. 33,529.00$ 33,529.00$ 118,625.00$
Subtotal 85,096.00 33,529.00SUBTOTAL = 118,625.00$ MARKUP % = 0.43$
MARKUP = 51,008.75$ BUDGET COST ESTIMATE = 169,633.75$
3:17 PM 9/5/2009

Page 6 of 13
CDM PROJECT CONSTRUCTION COST ESTIMATE
15 British American Blvd Location: Point Pleasant Board of EducationLatham, NY 12110 Estimate by: RGPhone (518) 782-4500 Checked by: JMFax (518) 786-3810
ITEM DESCRIPTION QTY UNIT MATERIAL MATERIAL QTY UNIT LABOR LABOR TOTALUNIT COST SUBTOTAL COST SUBTOTAL
Ocean Road Elementary School1 Lighting Upgrades - Option 2 1 ls. 12,996.00$ 12,996.00$ 1 ls.. 1,620.00$ 1,620.00$ 14,616.00$
Subtotal 12,996.00 1,620.00SUBTOTAL = 14,616.00$ MARKUP % = 0.43$
MARKUP = 6,284.88$ BUDGET COST ESTIMATE = 20,900.88$
3:17 PM 9/5/2009

Page 7 of 13
CDM PROJECT CONSTRUCTION COST ESTIMATE
15 British American Blvd Location: Point Pleasant Board of EducationLatham, NY 12110 Estimate by: RGPhone (518) 782-4500 Checked by: JMFax (518) 786-3810
ITEM DESCRIPTION QTY UNIT MATERIAL MATERIAL QTY UNIT LABOR LABOR TOTALUNIT COST SUBTOTAL COST SUBTOTAL
Nellie Bennett Elementary School1 Lighting Upgrades - Option 1 1 ls. 27,194.00$ 27,194.00$ 1 ls.. 9,793.00$ 9,793.00$ 36,987.00$
Subtotal 27,194.00 9,793.00SUBTOTAL = 36,987.00$ MARKUP % = 0.43$
MARKUP = 15,904.41$ BUDGET COST ESTIMATE = 52,891.41$
3:17 PM 9/5/2009

Page 8 of 13
CDM PROJECT CONSTRUCTION COST ESTIMATE
15 British American Blvd Location: Point Pleasant Board of EducationLatham, NY 12110 Estimate by: RGPhone (518) 782-4500 Checked by: JMFax (518) 786-3810
ITEM DESCRIPTION QTY UNIT MATERIAL MATERIAL QTY UNIT LABOR LABOR TOTALUNIT COST SUBTOTAL COST SUBTOTAL
Nellie Bennett Elementary School1 Lighting Upgrades - Option 2 1 ls. 5,194.00$ 5,194.00$ 1 ea. 1,070.00$ 1,070.00$ 6,264.00$
Subtotal 5,194.00 1,070.00SUBTOTAL = 6,264.00$ MARKUP % = 0.43$
MARKUP = 2,693.52$ BUDGET COST ESTIMATE = 8,957.52$
3:17 PM 9/5/2009

Page 9 of 13
CDM PROJECT CONSTRUCTION COST ESTIMATE
15 British American Blvd Location: Point Pleasant Board of EducationLatham, NY 12110 Estimate by: RGPhone (518) 782-4500 Checked by: JMFax (518) 786-3810
ITEM DESCRIPTION QTY UNIT MATERIAL MATERIAL QTY UNIT LABOR LABOR TOTALUNIT COST SUBTOTAL COST SUBTOTAL
Administration Building1 Lighting Upgrades 1 ls. 55.00$ 55.00$ 1 ea. 220.00$ 220.00$ 275.00$
Subtotal 55.00 220.00SUBTOTAL = 275.00$ MARKUP % = 0.43$
MARKUP = 118.25$ BUDGET COST ESTIMATE = 393.25$
3:17 PM 9/5/2009
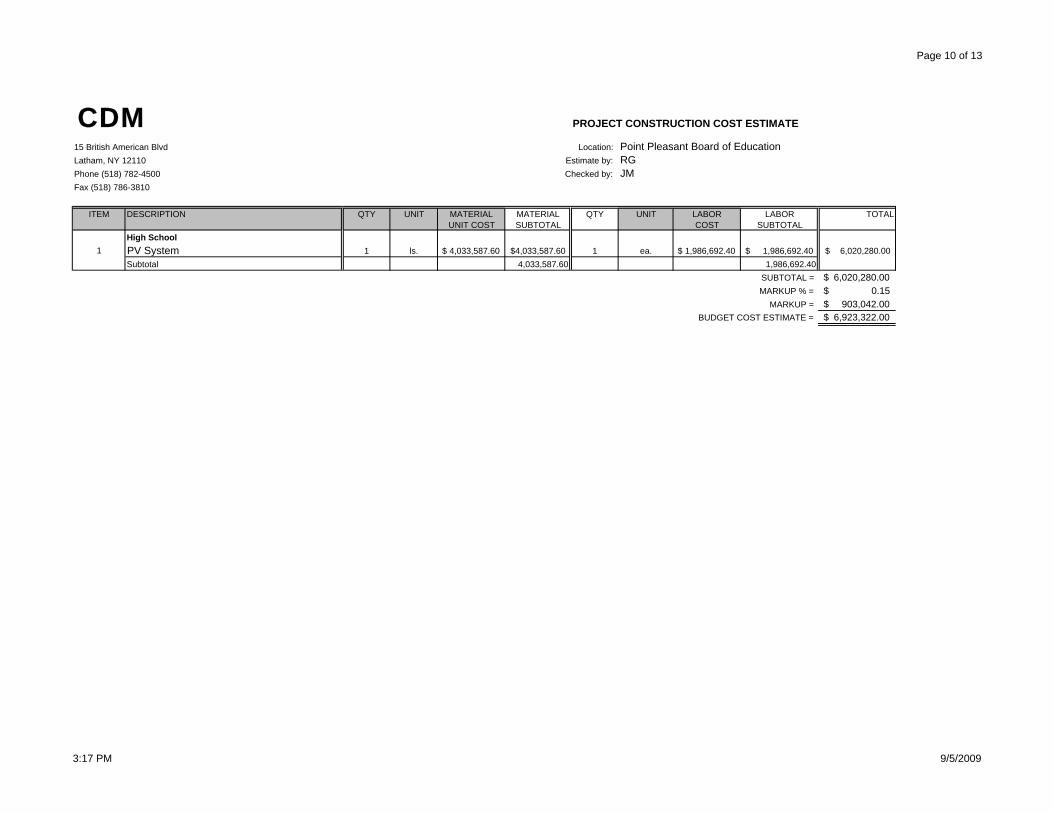
Page 10 of 13
CDM PROJECT CONSTRUCTION COST ESTIMATE
15 British American Blvd Location: Point Pleasant Board of EducationLatham, NY 12110 Estimate by: RGPhone (518) 782-4500 Checked by: JMFax (518) 786-3810
ITEM DESCRIPTION QTY UNIT MATERIAL MATERIAL QTY UNIT LABOR LABOR TOTALUNIT COST SUBTOTAL COST SUBTOTAL
High School1 PV System 1 ls. 4,033,587.60$ 4,033,587.60$ 1 ea. 1,986,692.40$ 1,986,692.40$ 6,020,280.00$
Subtotal 4,033,587.60 1,986,692.40SUBTOTAL = 6,020,280.00$ MARKUP % = 0.15$
MARKUP = 903,042.00$ BUDGET COST ESTIMATE = 6,923,322.00$
3:17 PM 9/5/2009
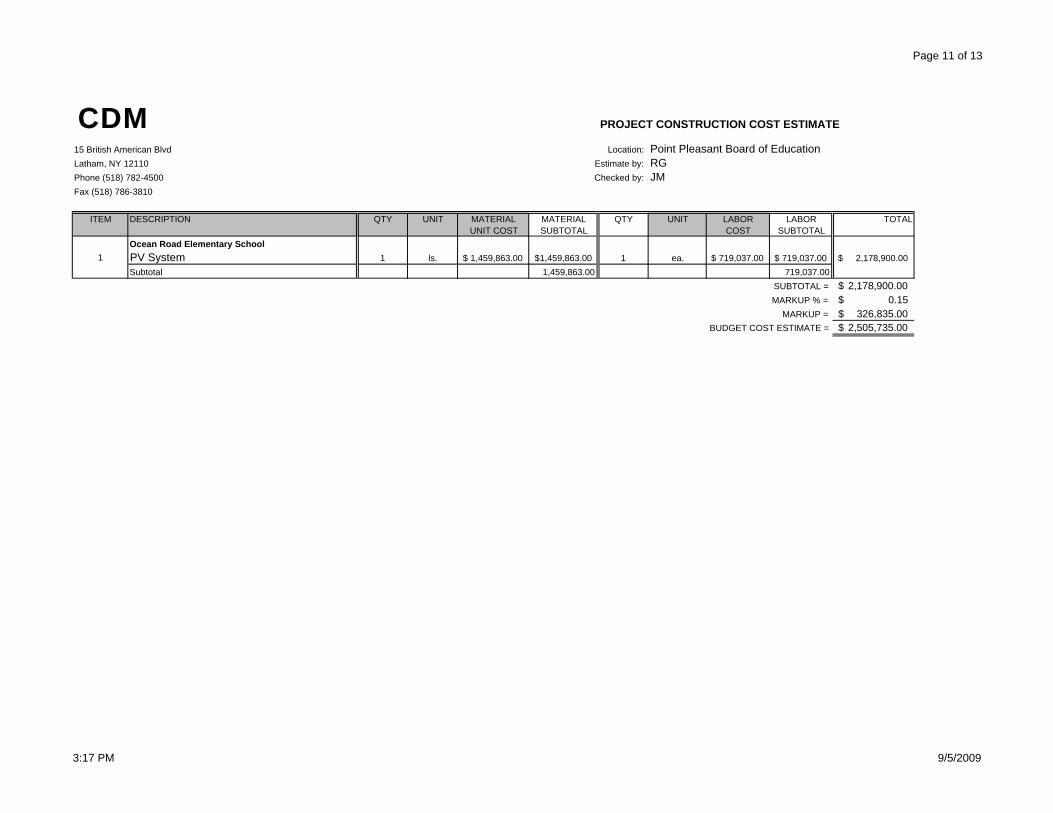
Page 11 of 13
CDM PROJECT CONSTRUCTION COST ESTIMATE
15 British American Blvd Location: Point Pleasant Board of EducationLatham, NY 12110 Estimate by: RGPhone (518) 782-4500 Checked by: JMFax (518) 786-3810
ITEM DESCRIPTION QTY UNIT MATERIAL MATERIAL QTY UNIT LABOR LABOR TOTALUNIT COST SUBTOTAL COST SUBTOTAL
Ocean Road Elementary School1 PV System 1 ls. 1,459,863.00$ 1,459,863.00$ 1 ea. 719,037.00$ 719,037.00$ 2,178,900.00$
Subtotal 1,459,863.00 719,037.00SUBTOTAL = 2,178,900.00$ MARKUP % = 0.15$
MARKUP = 326,835.00$ BUDGET COST ESTIMATE = 2,505,735.00$
3:17 PM 9/5/2009

Page 12 of 13
CDM PROJECT CONSTRUCTION COST ESTIMATE
15 British American Blvd Location: Point Pleasant Board of EducationLatham, NY 12110 Estimate by: RGPhone (518) 782-4500 Checked by: JMFax (518) 786-3810
ITEM DESCRIPTION QTY UNIT MATERIAL MATERIAL QTY UNIT LABOR LABOR TOTALUNIT COST SUBTOTAL COST SUBTOTAL
Memorial Middle School1 PV System 1 ls. 1,953,539.00$ 1,953,539.00$ 1 ls.. 962,190.90$ 962,190.90$ 2,915,729.90$
Subtotal 1,953,539.00 962,190.90SUBTOTAL = 2,915,729.90$ MARKUP % = 0.15$
MARKUP = 437,359.49$ BUDGET COST ESTIMATE = 3,353,089.39$
3:17 PM 9/5/2009
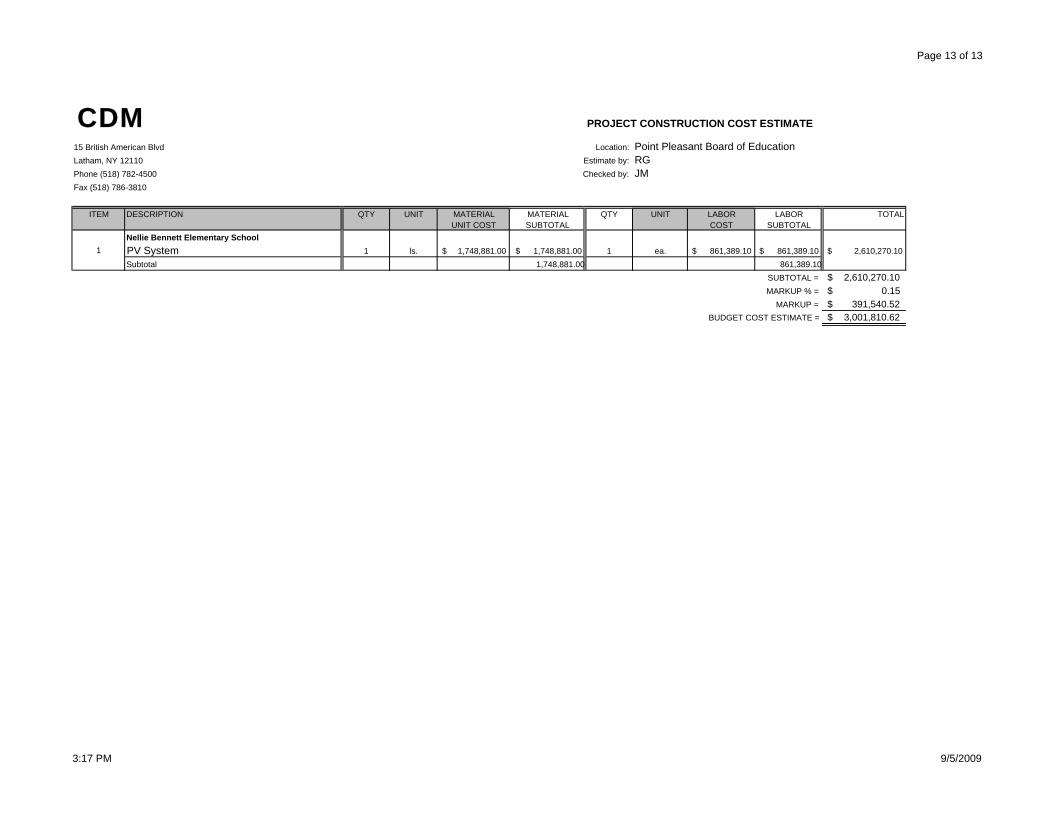
Page 13 of 13
CDM PROJECT CONSTRUCTION COST ESTIMATE
15 British American Blvd Location: Point Pleasant Board of EducationLatham, NY 12110 Estimate by: RGPhone (518) 782-4500 Checked by: JMFax (518) 786-3810
ITEM DESCRIPTION QTY UNIT MATERIAL MATERIAL QTY UNIT LABOR LABOR TOTALUNIT COST SUBTOTAL COST SUBTOTAL
Nellie Bennett Elementary School1 PV System 1 ls. 1,748,881.00$ 1,748,881.00$ 1 ea. 861,389.10$ 861,389.10$ 2,610,270.10$
Subtotal 1,748,881.00 861,389.10SUBTOTAL = 2,610,270.10$ MARKUP % = 0.15$
MARKUP = 391,540.52$ BUDGET COST ESTIMATE = 3,001,810.62$
3:17 PM 9/5/2009

APPENDIX I
FACILITY DATA FORMS
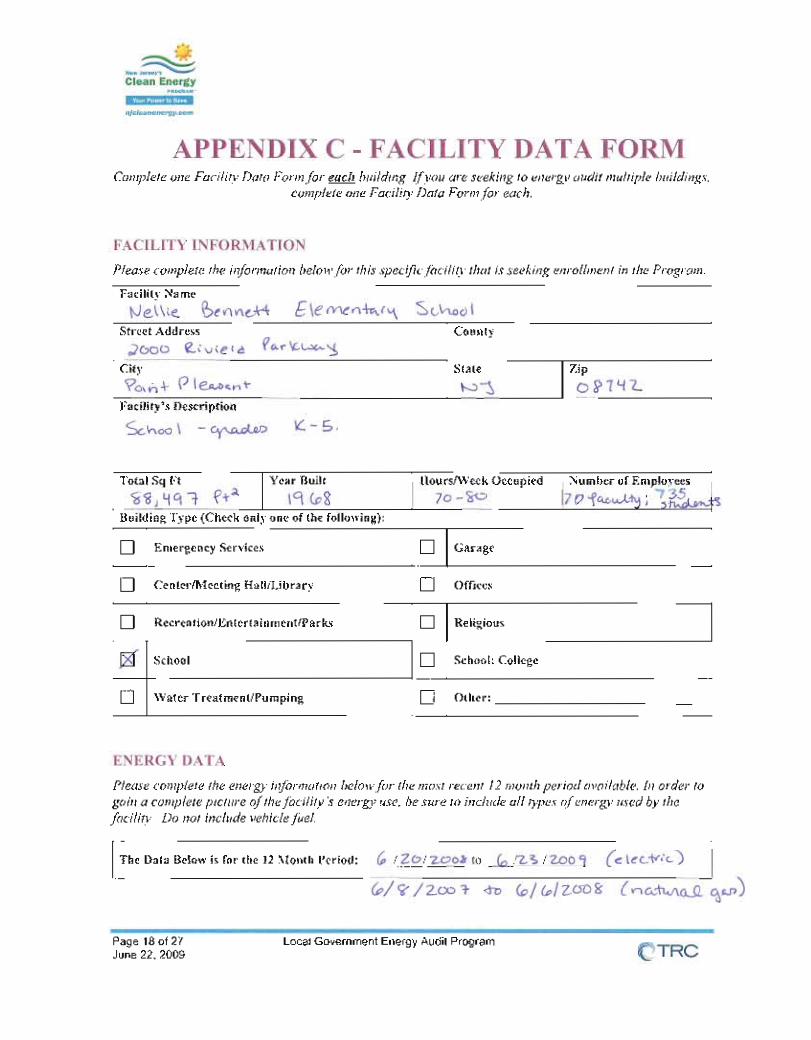

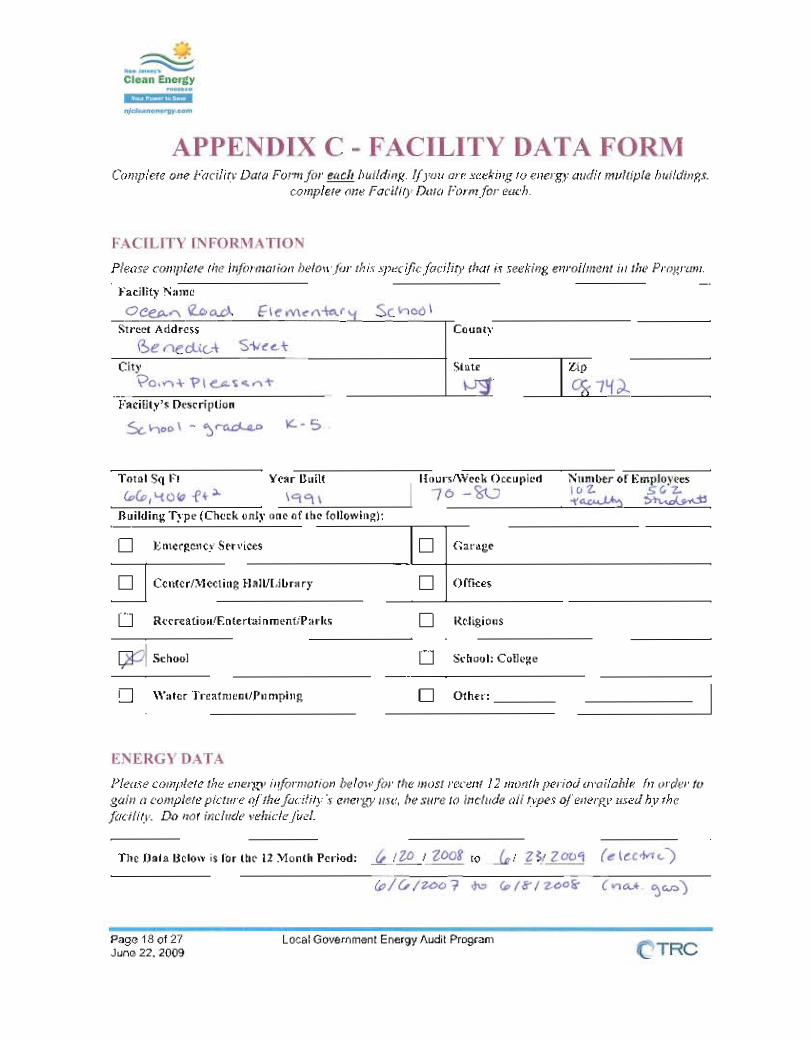
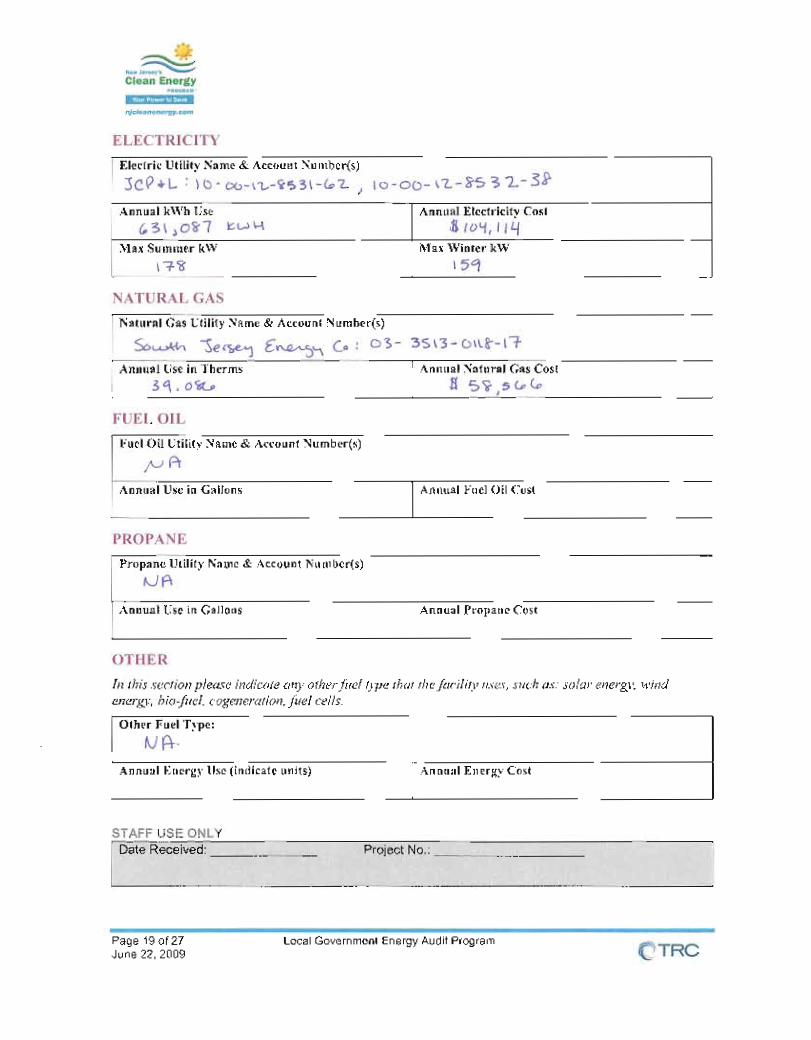
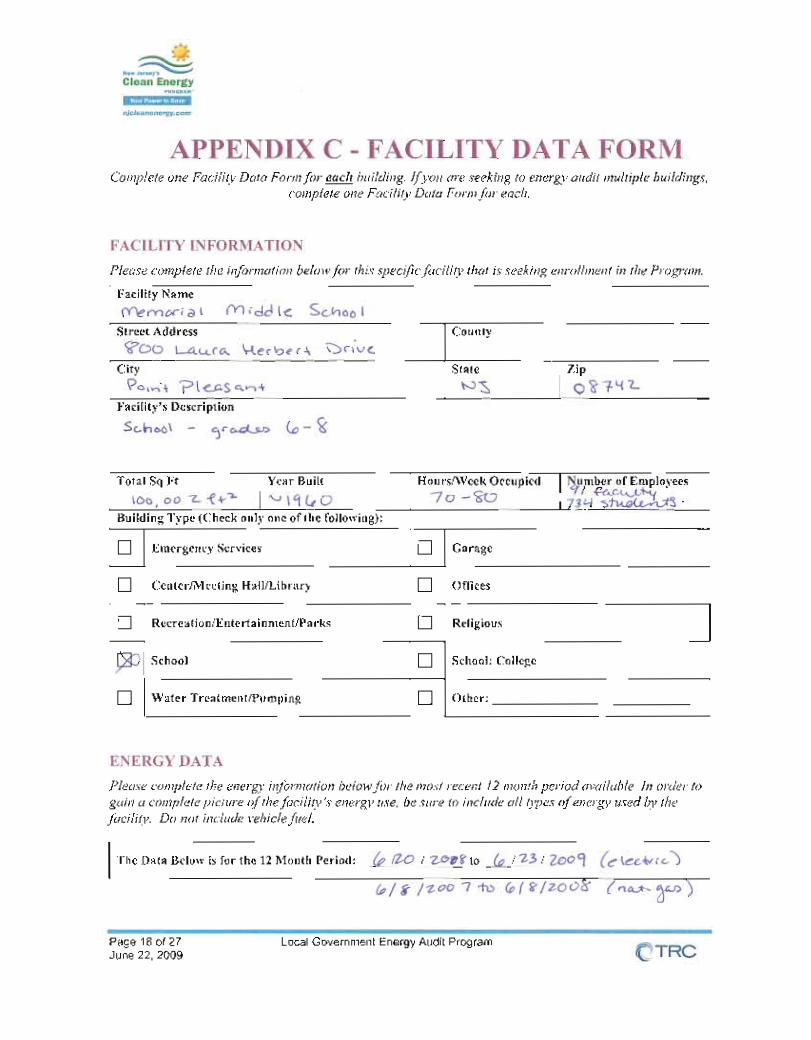
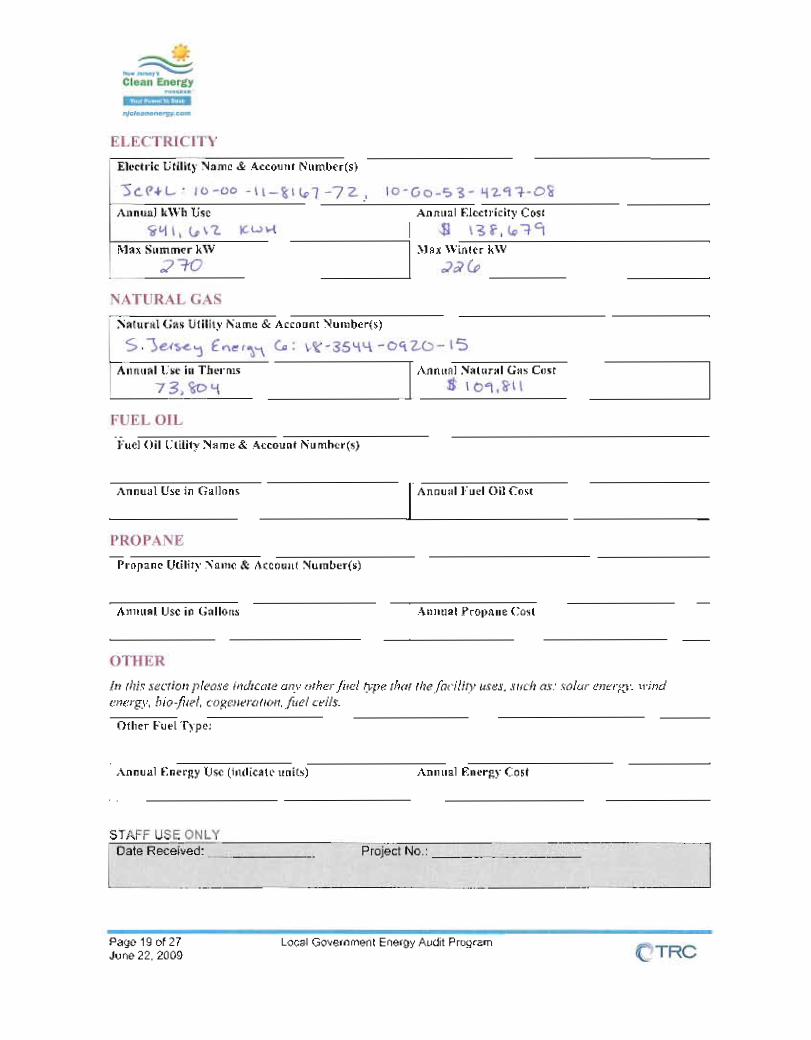
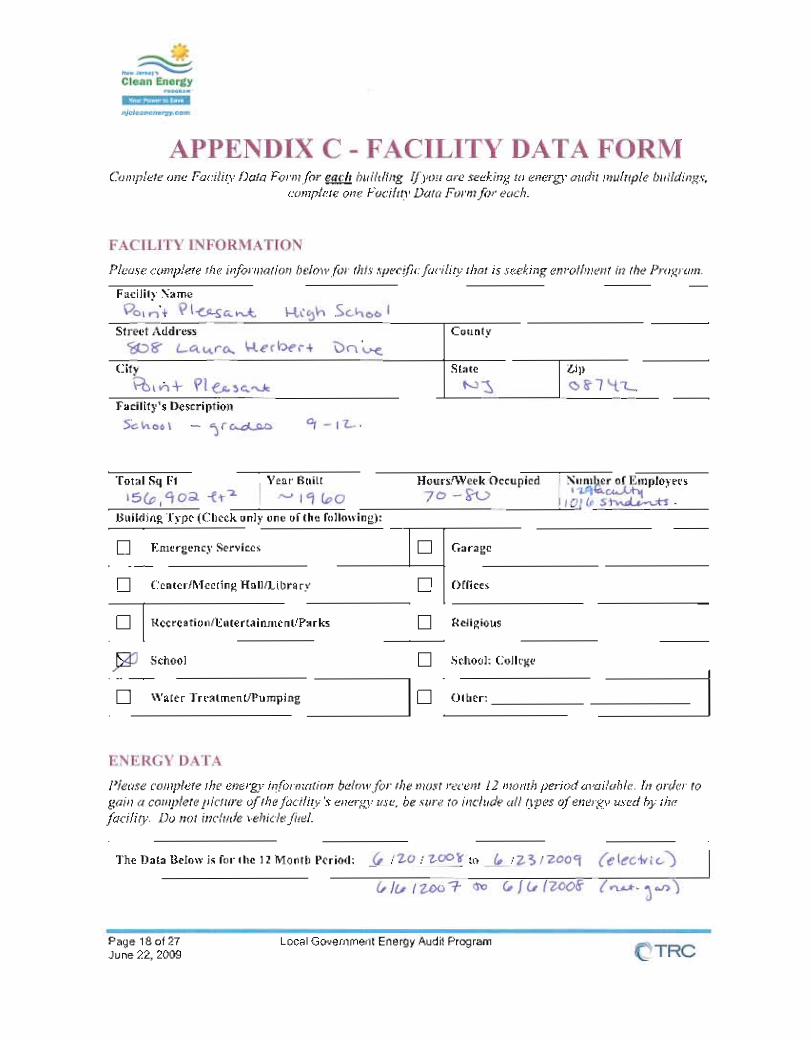
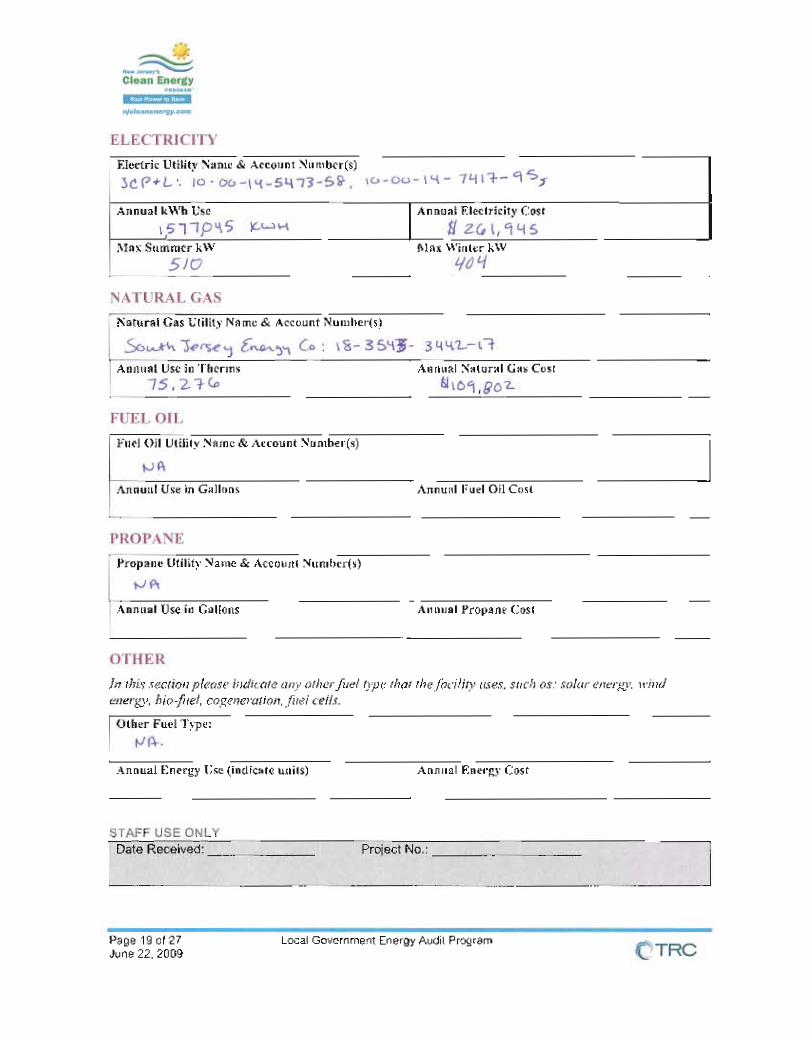
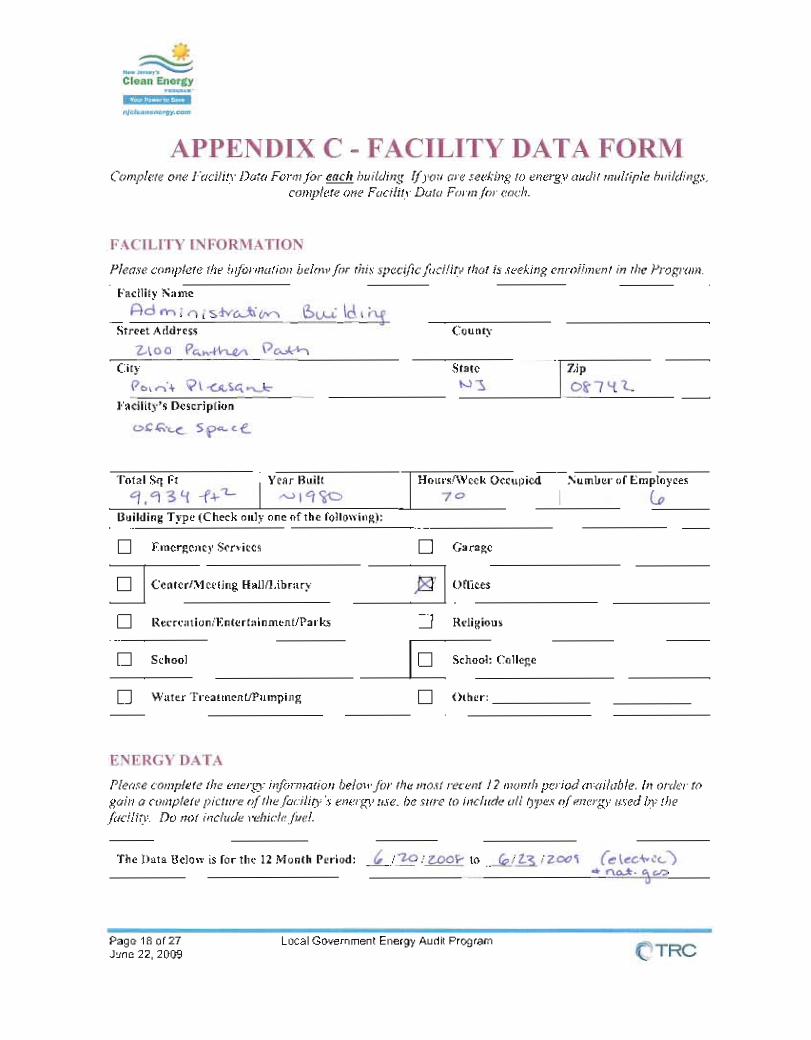


APPENDIX J
LIFETIME SAVINGS

ECMNellie Bennett ‐ Boiler Upgrade
Nellie Bennett ‐ BMS
Ocean Road ‐ Boiler Upgrade Ocean Road ‐ BMS
Memorial Middle School ‐ Boiler
UpgradeMemorial Middle School ‐ BMS
High School ‐ Boiler Upgrade High School ‐ BMS
Administration Building Lighting
Upgrade
Nellie Bennett ‐ Lighting
Upgrade Option 1
Nellie Bennett ‐ Lighting
Upgrade Option 2
Ocean Road ‐ Lighting
Upgrade Option 1
Ocean Road ‐ Lighting
Upgrade Option 2
Memorial Middle School ‐ Lighting
Upgrade Option 1
Memorial Middle School ‐ Lighting
Upgrade Option 2
High School ‐ Lighting
Upgrade Option 1
High School ‐ Lighting
Upgrade Option 2
Nellie Bennett ‐ Solar
Ocean Road ‐ Solar
Memorial Middle School ‐ Solar
High School ‐ Solar
Assumed Inflation (Gas) 2% 2% 2% 2% 2% 2% 2% 2%Initial Yearly Savings (Gas) $15,144.00 $11,348.00 $11,999.00 $8,209.00 $13,910.00 $14,509.00 $14,196.00 $12,776.00Assumed Inflation (Electricity) 3% 3% 3% 3% 3% 3% 3% 3% 3% 3% 3% 3% 3% 3% 3% 3% 3% 3% 3% 3% 3%Initial Yearly Savings (Electricity) $1,418.00 $1,753.00 $4,760.00 $7,362.00 $142.60 $4,635.80 $3,540.50 $12,680.50 $9,398.30 $4,576.50 $2,710.30 $8,301.20 $7,363.30 $55,325.00 $46,182.60 $61,800.10 $127,602.30Assumed Average Useful Life (Years) 18 15 18 15 18 15 18 15 20 20 20 20 20 20 20 20 20 25 25 25 25
Lifetime Savings $324,268.06 $222,618.96 $256,926.34 $174,565.56 $297,845.27 $339,441.02 $303,969.19 $357,865.90 $3,831.72 $124,565.68 $95,134.56 $340,729.78 $252,535.84 $122,972.27 $72,826.78 $223,056.35 $197,854.63 $2,017,108.80 $1,683,783.62 $2,253,186.18 $4,652,285.98
Year Annual Savings Annual Savings Annual Savings Annual Savings Annual Savings Annual Savings Annual Savings Annual Savings Annual Savings Annual Savings Annual Savings Annual Savings Annual Savings Annual Savings Annual Savings Annual Savings Annual Savings Annual Savings Annual Savings Annual Savings Annual Savings1 $15,144.00 $12,766.00 $11,999.00 $9,962.00 $13,910.00 $19,269.00 $14,196.00 $20,138.00 $142.60 $4,635.80 $3,540.50 $12,680.50 $9,398.30 $4,576.50 $2,710.30 $8,301.20 $7,363.30 $55,325.00 $46,182.60 $61,800.10 $127,602.302 $15,446.88 $13,035.50 $12,238.98 $10,178.77 $14,188.20 $19,701.98 $14,479.92 $20,614.38 $146.88 $4,774.87 $3,646.72 $13,060.92 $9,680.25 $4,713.80 $2,791.61 $8,550.24 $7,584.20 $56,984.75 $47,568.08 $63,654.10 $131,430.373 $15,755.82 $13,310.82 $12,483.76 $10,400.40 $14,471.96 $20,145.05 $14,769.52 $21,102.50 $151.28 $4,918.12 $3,756.12 $13,452.74 $9,970.66 $4,855.21 $2,875.36 $8,806.74 $7,811.72 $58,694.29 $48,995.12 $65,563.73 $135,373.284 $16,070.93 $13,592.08 $12,733.43 $10,627.01 $14,761.40 $20,598.45 $15,064.91 $21,602.65 $155.82 $5,065.66 $3,868.80 $13,856.32 $10,269.78 $5,000.87 $2,961.62 $9,070.95 $8,046.08 $60,455.12 $50,464.97 $67,530.64 $139,434.485 $16,392.35 $13,879.41 $12,988.10 $10,858.70 $15,056.63 $21,062.43 $15,366.21 $22,115.15 $160.50 $5,217.63 $3,984.86 $14,272.01 $10,577.87 $5,150.89 $3,050.47 $9,343.07 $8,287.46 $62,268.77 $51,978.92 $69,556.56 $143,617.516 $16,720.20 $14,172.96 $13,247.87 $11,095.61 $15,357.76 $21,537.25 $15,673.53 $22,640.31 $165.31 $5,374.16 $4,104.41 $14,700.17 $10,895.21 $5,305.42 $3,141.98 $9,623.37 $8,536.08 $64,136.84 $53,538.29 $71,643.25 $147,926.047 $17,054.60 $14,472.86 $13,512.82 $11,337.84 $15,664.92 $22,023.18 $15,987.00 $23,178.46 $170.27 $5,535.39 $4,227.54 $15,141.18 $11,222.06 $5,464.58 $3,236.24 $9,912.07 $8,792.17 $66,060.94 $55,144.44 $73,792.55 $152,363.828 $17,395.70 $14,779.25 $13,783.08 $11,585.53 $15,978.22 $22,520.48 $16,306.74 $23,729.94 $175.38 $5,701.45 $4,354.37 $15,595.42 $11,558.72 $5,628.52 $3,333.33 $10,209.43 $9,055.93 $68,042.77 $56,798.77 $76,006.33 $156,934.739 $17,743.61 $15,092.27 $14,058.74 $11,838.80 $16,297.78 $23,029.43 $16,632.88 $24,295.08 $180.64 $5,872.49 $4,485.00 $16,063.28 $11,905.49 $5,797.37 $3,433.33 $10,515.71 $9,327.61 $70,084.05 $58,502.74 $78,286.52 $161,642.7810 $18,098.48 $15,412.08 $14,339.92 $12,097.78 $16,623.74 $23,550.32 $16,965.53 $24,874.24 $186.06 $6,048.67 $4,619.55 $16,545.18 $12,262.65 $5,971.29 $3,536.33 $10,831.18 $9,607.44 $72,186.58 $60,257.82 $80,635.11 $166,492.0611 $18,460.45 $15,738.82 $14,626.71 $12,362.61 $16,956.21 $24,083.43 $17,304.84 $25,467.79 $191.64 $6,230.13 $4,758.14 $17,041.53 $12,630.53 $6,150.43 $3,642.42 $11,156.12 $9,895.66 $74,352.17 $62,065.55 $83,054.17 $171,486.8212 $18,829.66 $16,072.66 $14,919.25 $12,633.42 $17,295.34 $24,629.07 $17,650.94 $26,076.08 $197.39 $6,417.03 $4,900.88 $17,552.78 $13,009.45 $6,334.95 $3,751.69 $11,490.80 $10,192.53 $76,582.74 $63,927.52 $85,545.79 $176,631.4313 $19,206.25 $16,413.74 $15,217.63 $12,910.36 $17,641.24 $25,187.54 $18,003.96 $26,699.51 $203.31 $6,609.54 $5,047.91 $18,079.36 $13,399.73 $6,524.99 $3,864.24 $11,835.53 $10,498.31 $78,880.22 $65,845.34 $88,112.17 $181,930.3714 $19,590.38 $16,762.23 $15,521.99 $13,193.56 $17,994.07 $25,759.16 $18,364.04 $27,338.46 $209.41 $6,807.83 $5,199.34 $18,621.74 $13,801.72 $6,720.74 $3,980.17 $12,190.59 $10,813.25 $81,246.63 $67,820.71 $90,755.53 $187,388.2815 $19,982.19 $17,118.30 $15,832.43 $13,483.17 $18,353.95 $26,344.24 $18,731.32 $27,993.35 $215.70 $7,012.06 $5,355.32 $19,180.39 $14,215.77 $6,922.37 $4,099.57 $12,556.31 $11,137.65 $83,684.03 $69,855.33 $93,478.20 $193,009.9316 $20,381.83 $16,149.07 $18,721.03 $19,105.95 $222.17 $7,222.43 $5,515.98 $19,755.81 $14,642.25 $7,130.04 $4,222.56 $12,933.00 $11,471.78 $86,194.55 $71,950.99 $96,282.54 $198,800.2317 $20,789.47 $16,472.06 $19,095.45 $19,488.07 $228.83 $7,439.10 $5,681.46 $20,348.48 $15,081.51 $7,343.94 $4,349.24 $13,320.99 $11,815.93 $88,780.38 $74,109.52 $99,171.02 $204,764.2318 $21,205.26 $16,801.50 $19,477.36 $19,877.83 $235.70 $7,662.27 $5,851.91 $20,958.93 $15,533.96 $7,564.26 $4,479.71 $13,720.62 $12,170.41 $91,443.80 $76,332.80 $102,146.15 $210,907.1619 $242.77 $7,892.14 $6,027.46 $21,587.70 $15,999.98 $7,791.18 $4,614.10 $14,132.24 $12,535.53 $94,187.11 $78,622.79 $105,210.53 $217,234.3720 $250.05 $8,128.90 $6,208.29 $22,235.33 $16,479.98 $8,024.92 $4,752.53 $14,556.20 $12,911.59 $97,012.72 $80,981.47 $108,366.85 $223,751.4121 $99,923.10 $83,410.91 $111,617.85 $230,463.9522 $102,920.80 $85,913.24 $114,966.39 $237,377.8723 $106,008.42 $88,490.64 $118,415.38 $244,499.2024 $109,188.67 $91,145.36 $121,967.84 $251,834.1825 $112,464.33 $93,879.72 $125,626.88 $259,389.20

APPENDIX K
MAINTENANCE COST SAVINGS
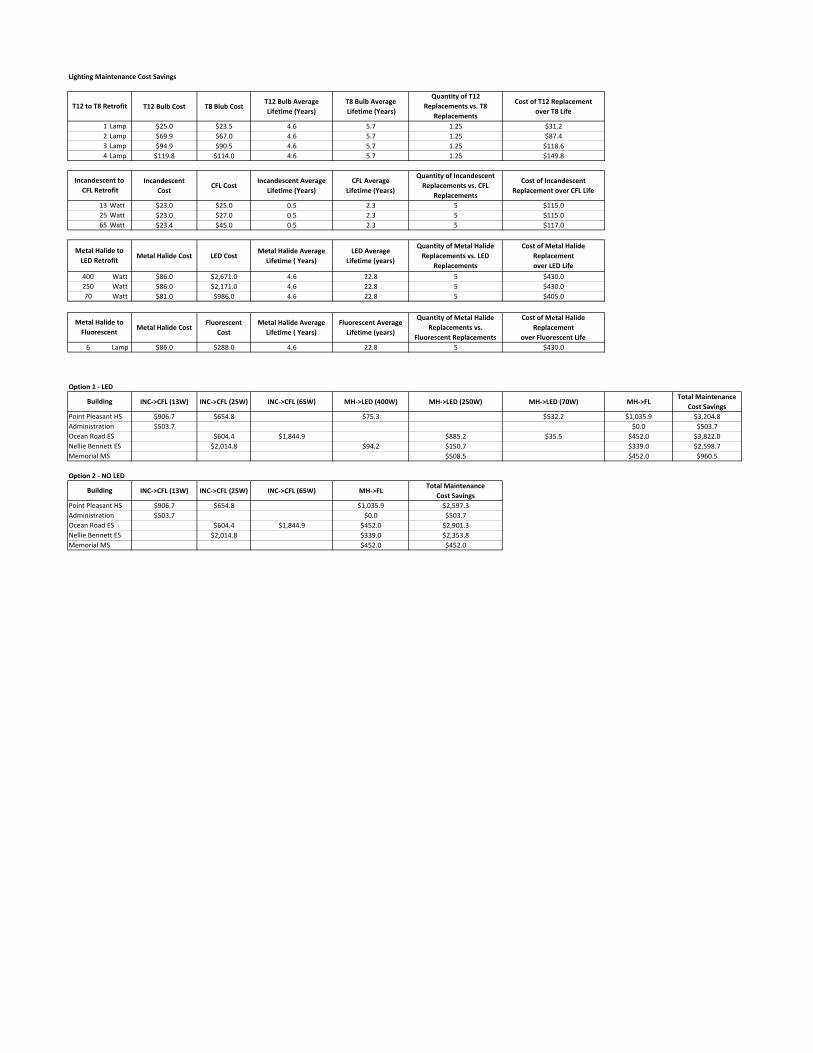
Lighting Maintenance Cost Savings
T12 Bulb Cost T8 Blub CostT12 Bulb Average Lifetime (Years)
T8 Bulb Average Lifetime (Years)
Quantity of T12 Replacements vs. T8
Replacements
Cost of T12 Replacement over T8 Life
1 Lamp $25.0 $23.5 4.6 5.7 1.25 $31.22 Lamp $69.9 $67.0 4.6 5.7 1.25 $87.43 Lamp $94.9 $90.5 4.6 5.7 1.25 $118.64 Lamp $119.8 $114.0 4.6 5.7 1.25 $149.8
Incandescent Cost
CFL CostIncandescent Average
Lifetime (Years)CFL Average
Lifetime (Years)
Quantity of Incandescent Replacements vs. CFL
Replacements
Cost of Incandescent Replacement over CFL Life
13 Watt $23.0 $25.0 0.5 2.3 5 $115.025 Watt $23.0 $27.0 0.5 2.3 5 $115.065 Watt $23.4 $45.0 0.5 2.3 5 $117.0
Metal Halide Cost LED CostMetal Halide Average
Lifetime ( Years)LED Average
Lifetime (years)
Quantity of Metal HalideReplacements vs. LED
Replacements
Cost of Metal Halide Replacement over LED Life
400 Watt $86.0 $2,671.0 4.6 22.8 5 $430.0250 Watt $86.0 $2,171.0 4.6 22.8 5 $430.070 Watt $81.0 $986.0 4.6 22.8 5 $405.0
Metal Halide CostFluorescent
CostMetal Halide Average
Lifetime ( Years)Fluorescent Average Lifetime (years)
Quantity of Metal HalideReplacements vs.
Fluorescent Replacements
Cost of Metal Halide Replacement
over Fluorescent Life6 Lamp $86.0 $288.0 4.6 22.8 5 $430.0
Option 1 ‐ LED
INC‐>CFL (13W) INC‐>CFL (25W) INC‐>CFL (65W) MH‐>LED (400W) MH‐>LED (250W) MH‐>LED (70W) MH‐>FLTotal Maintenance
Cost SavingsPoint Pleasant HS $906.7 $654.8 $75.3 $532.2 $1,035.9 $3,204.8Administration $503.7 $0.0 $503.7Ocean Road ES $604.4 $1,844.9 $885.2 $35.5 $452.0 $3,822.0Nellie Bennett ES $2,014.8 $94.2 $150.7 $339.0 $2,598.7Memorial MS $508.5 $452.0 $960.5
Option 2 ‐ NO LED
INC‐>CFL (13W) INC‐>CFL (25W) INC‐>CFL (65W) MH‐>FLTotal Maintenance
Cost SavingsPoint Pleasant HS $906.7 $654.8 $1,035.9 $2,597.3Administration $503.7 $0.0 $503.7Ocean Road ES $604.4 $1,844.9 $452.0 $2,901.3Nellie Bennett ES $2,014.8 $339.0 $2,353.8Memorial MS $452.0 $452.0
T12 to T8 Retrofit
Incandescent to CFL Retrofit
Metal Halide to LED Retrofit
Metal Halide to Fluorescent
Building
Building