Embed Size (px)
Citation preview

Place of Pattern in Proteomic Biomarker Discovery†
Michael A. Gillette,*,‡,§ D. R. Mani,*,‡ and Steven A. Carr*,‡
The Broad Institute of MIT and Harvard, 320 Charles Street, Cambridge, Massachusetts 02141, andMassachusetts General Hospital, 55 Fruit Street, Boston, Massachusetts 02114
Received April 8, 2005
The role of pattern in biomarker discovery and clinical diagnosis is examined in its historical context.The use of MS-derived pattern is treated as a logical extension of prior applications of non-MS-derivedpattern. Criticisms pertaining to specific technology platforms and analytic methodologies are consideredseparately from the larger issues of pattern utility and deployment in biomarker discovery. We presenta hybrid strategy that marries the desirable attributes of high-information content MS pattern with thecapability to obtain identity, and explore the key steps in establishing a data analysis pipeline for pattern-based biomarker discovery.
Keywords: biomarker discovery • proteomics • diagnostic • mass spectrometry • serum/plasma • pattern • machinelearning • pattern recognition • feature selection • classification
Introduction: Biomarkers, Patterns, and Diagnosis
Biomarkers are indicators of relevant biological conditions.In medical and pharmacogenomic applications, they areintended to provide answers, or to substantially increase theprobability of particular answers, to a variety of essentialquestions: Does an individual have a given disease? Is thedisease improving or worsening? Is therapy having the desiredeffect? Biomarkers have a role in risk assessment, diseaseprediction, early detection, diagnosis, prognosis, disease moni-toring, and evaluation of therapeutic response. As such,improved biomarkers are urgently needed to facilitate bothclinical care and biomedical research. Significant efforts arebeing made to find novel biomarkers in a plethora of fieldsincluding cardiovascular disease, inflammatory disease,neurodegenerative disease, and cancer.
Biomarker discovery has historically been dominated bytargeted approaches, in which candidates derived from biologi-cal knowledge are evaluated for their correlations with biologi-cal conditions. The relative paucity of markers that have madeit into clinical practice from these approaches has led manyto the conclusion that unbiased discovery strategies, unen-cumbered by the constraints of current biological knowledge,are better suited to the development of novel biomarkers. Suchmarkers may derive from many biological sources. In cancer,for instance, important diagnostic possibilities have emergedfrom the domains of cytogenetics, DNA methylation, mRNAexpression, and protein analysis.
Whatever the “unbiased” source of biomarker candidates,the fundamental observation of a reliable state-specific differ-ence is virtually always at the level of pattern recognition;
interpretation, if it comes at all, is a subsequent event (Figure1). Cytogenetic abnormalities, for example, are often deter-mined to be diagnostic of disease long before the associatedgenetic mechanisms are understood. Gene expression analyses,popular and promising sources for candidate biomarker sig-natures in recent years, proffer patterns in high dimensionalityexpression space for disease classification and prognosis.Though the signatures come with gene labels for the constitu-ent components, the existence of those labels does not improvetheir performance characteristics as biomarkers per se. Indeed,labels may be wrong (not uncommon in early versions ofcommercial arrays), or essentially arbitrary (as with extendedsequence tag designations), without prejudice to the test. Were
† Part of the Biomarkers special issue.* To whom correspondence should be addressed. E-mails: gillette@
broad.mit.edu, [email protected]; [email protected].‡ The Broad Institute of MIT and Harvard.§ Massachusetts General Hospital.
Figure 1. Diagnostic patterns in clinical medicine. The use ofpattern is widespread in clinical medicine, and often precedesmolecular understanding of disease pathogenesis. (a) Plain chestradiograph of sarcoidosis; (b) Trisomy 21 karyotype of Down’ssyndrome; (c) mRNA expression heat map in lung adenocarci-mona vs control; (d) Serum-derived mass spectra in disease andcontrol.
10.1021/pr0500962 CCC: $30.25 2005 American Chemical Society Journal of Proteome Research 2005, 4, 1143-1154 1143Published on Web 07/20/2005

there no labels, what would principally be sacrificed is notbiomarker qualification but the possibility of their interpreta-tion, and hence the ability to translate them to differentanalytical platforms, to use them to gain biological insight, orto derive from them candidates for therapeutic intervention.As anyone faced with the prospect of determining the signifi-cance of a diagnostic gene list from a microarray experimentwill confirm, such interpretation is in any case often highlyspeculative, or utterly elusive.
Far from being unique to modern biomarker discovery,pattern recognition has always been a central part of medicaldiagnostics. Hippocrates coined the Greek term karkinos(cancer in Latin) to refer to malignant growth, reputedlybecause the pattern of growth (or of surrounding vessels)reminded him of the legs of a crab. Galen recognized thepattern of rubor, dolor, calor, and tumor (redness, pain, heat,and swelling) that to this day form the cornerstones of thediagnosis of local inflammation. Virchow’s artful use of micro-scopic pattern advanced cellular pathology as the standard formedical classification and diagnosis. Despite the generally moresophisticated understanding of disease pathogenesis, patternrecognition retains its importance in contemporary diagnos-tics: chest pressure with arm radiation, nausea, and diaphoresisare suspicious for myocardial ischemia; bilateral hilar lymphnode enlargement on an otherwise unremarkable chest X-raysuggests sarcoidosis; a particular histopathologic appearancewith standard stains conveys the diagnosis of a particular lungcancer subtype. Technological advances in magnetic resonanceimaging (MRI), positron emission tomography (PET), andcomputer-aided tomography (CAT or CT) have provided a suiteof noninvasive tools for generating image-based patterns ofdisease presence and stage in both research and clinical settings(see Chandra et al., this Special Issue). Throughout the evolu-tion of medical diagnostics, recognition of and reliance uponpattern has typically precededsand supplied the impetus fors
a deeper understanding of the underpinnings of that pattern,but those diagnostics retain their utility even when thatunderstanding is not forthcoming.
The venerable, comfortable interplay between pattern anddiagnostics that has extended naturally to most domains ofbiomarker discovery has quite recently evolved into an uneasytension with respect to protein biomarkers. As proteins are keystructural elements, catalysts, and communication lines inbiological systems, and disturbances in proteins fundamentalto disease, they have long been thought to provide a particularlyrich source of biomarkers. Since at least the 1950s there hasbeen support for the idea that plasma protein pattern mightprovide important insight into the presence and activity ofdisease. Assays to measure >100 different proteins in bloodhave been developed and are in routine use in clinicalchemistry labs today.1 Differential two-dimensional polyacry-lamide gel electrophoresis (2D-PAGE) has been a mainstay ofproteomic biomarker discovery.2 Though fruitful, the methodhas faced challenges of limited sensitivity, reproducibility, andthroughput.
With advances in biological mass spectrometry methods andinstrumentation, mass spectrometry (MS) of complex mixturesof proteins or peptides derived from blood or other readilyaccessible body fluids has now emerged as the preferredstrategy for proteomic biomarker discovery. The landscape ofanalytical and computational methods being employed forbiomarker discovery in serum, plasma or other biofluids is quitediverse. Currently available platforms for biomarker discovery
fall roughly into two categories: (1) pattern-based methods thatfocus on production of MS-derived protein pattern via SELDI,3,4
MALDI,5 or electrospray6 and (2) methods that rely on pro-teolytic digestion of plasma proteins to peptides with analysisby LC-MS/MS.7-11 This latter approach is “identity-based” inthat the output consists of lists of peptide sequences whichare associated with the proteins from which they are derived.There have been no solid data, reproducibility studies or, mostimportantly, follow-on validation studies to indicate withcertainty which approaches are the most robust, and no clearconsensus has emerged in the literature. Nevertheless, despitethe long history of successful use of pattern in diagnosis, thesuggestion that MS-derived pattern can lead to biomarkers hasbecome a focus of considerable contention in the field.12,13 Inthis paper, we give careful consideration to the role of patternin protein biomarker discovery, espousing the view that theapt question is not whether MS pattern is useful but how bestto use it. In particular, we believe that hybrid strategies thatcombine the best attributes of pattern- and identity-basedmethods may provide an optimal approach to the discoveryof proteomic biomarkers by mass spectrometry.
Relative Quantitation from Pattern in Mass Spectrometry
The fundamental output of all mass spectrometers, regard-less of type, ionization mode or performance characteristics isa spectrum plotting mass-to-charge ratio on the x-axis versusdetected ion flux on the y-axis. Subsequent interpretation ofspectra, using characteristics such as isotope distribution,accurate mass, and sequence information (in tandem MSexperiments) may allow portions of the spectrum to be labeledwith a protein or peptide identity. Whether it carries an identitylabel or not, what gives a peptide or protein the status of abiomarker is its consistent variation in some fundamentalcharacteristic, such as abundance, between two states, suchas presence or absence of disease. Such abundance variationcan occur via many mechanisms, including differential expres-sion, sequestration, secretion, leakage, cleavage, etc. Thoughstatic elements in the sampled proteome, or those whosechanges are random with respect to the distinction of interest,may be of interest or import for some other reason, they donot advance the cause of biomarker discovery. Estimation ofdifferential abundance requires relative quantitation, a difficultthing to do precisely by MS. A variety of methods have beendeveloped for quantitation of proteins in complex mixtures thatinvolve stable isotopic labeling.14,15 An important aspect of thesemethods is that quantitation requires digestion to peptides ofa size amenable to sequencing (typically 6-20 residues).Because MS-based peptide sequencing typically provides muchless than 50% sequence coverage of any given protein, oneseldom knows how much of the sequence of a given protein isactually present, or if a mixture of varying length proteinsrelated to the parent protein is present. Alternatively, theintensity or peak area (in ion counts) of parent ions (as well asthe fragment ions derived from specific parent ions byMS/MS) can be used as a semiquantitative estimate of thechange in abundance of the peptides or proteins they represent(for a peptide example, see MacCoss et al.16). While less precisethan the isotopic labeling methods described above, ioncurrent-based abundance measurements can be made onintact proteins without digestion to peptides, while isotopiclabeling methods cannot. Regardless of whether it is derivedfrom peptides or proteins, m/z and abundance pattern infor-mation is exploited in virtually all MS based biomarker
reviews Gillette et al.
1144 Journal of Proteome Research • Vol. 4, No. 4, 2005
discovery efforts to obtain relative quantitative differencesbetween the measured states (e.g., diseased and control). Whatis principally at issue between advocates and detractors ofpattern-based methods is thus less the use of pattern than howthe patterns are generated, their quality (resolution, precision,accuracy, and reproducibility), and whether and how identityis interposed between pattern and diagnostic. This can be moreclearly appreciated by considering two broad applications ofMS pattern: pattern as biomarker, and pattern to guide orenrich biomarker discovery.
Pattern As Biomarker. In the most direct application of massspectrometric pattern to biomarker discovery, a class-specificdifferential pattern extracted from primary mass spectra canitself serve as a complex biomarker. Proponents of this ap-proach generally build their case on a number of observationsor assumptions central to the larger biomarker discovery effort.First, they contend that an MS profile with suitable perfor-mance characteristics (sensitivity and specificity) with respectto a disease would represent a functional diagnostic suitablefor clinical validation and deployment. Second, they note thebroad consensus view that the heterogeneity and complexityof host, environment, and disease imply that individual markerswill rarely be sufficient for establishing diagnosis or prognosis,but that instead, panels of markers will typically be required.Because biomarker profiles are extracted from complex MS datawith powerful machine learning algorithms, and because thoseprofiles likely reflect contributions from a number of differentmolecular entities, this approach embraces the idea of multiplecomplementary markers at a very fundamental level. Third,they note that the same heterogeneities that suggest the needfor multiple markers imply that large numbers of samples willneed to be analyzed for effective marker discovery. Sincegenerally speaking the move from primary mass spectrum toprotein identification is time-consuming, largely because italmost always is done in combination with lengthy LC frac-tionation, there is a sample throughput cost to identity thatmay be both prohibitive and unnecessary.
While this strategy is not dependent upon or constrained toany particular technology platform, it has been pioneered andparticularly championed by Petricoin and Liotta at the NationalInstitutes of Health, Grizzle at the University of Alabama,Birmingham, Semmes at Eastern Virginia Medical School, andChan at Johns Hopkins, together with scientists from CiphergenBiosystems (Fremont, California), all using some variation ofCiphergen’s surface-enhanced laser desorption/ionization massspectrometry (SELDI-MS) approach. SELDI is a variant ofMALDI in which the metal target surface is coated with achromatographic stationary phase such as reverse phase, ionexchange, or immobilized metal affinity. In the Ciphergeninstrument, these targets (or “chips” in their nomenclature)have 8 or 16 discrete target spots. These surfaces are intendedto selectively retain a subset of proteins from complex bioma-terials such as serum or cell lysate. Typically, samples areanalyzed using a relatively low performance time-of-flight massspectrometer, though Liotta and Petricoin have more recentlymoved to a higher data quality hybrid quadrupole time-of-flighttandem mass spectrometer. After initial data processing, a widearray of machine learning approaches has been used to extractinformative features and build accurate classifiers (see below).
Although not the first account of SELDI-derived biomarkerpatterns, the landmark publication in Lancet by Liotta andPetricoin described a biomarker panel consisting of five m/zpeaks capable of discriminating serum from women with and
without ovarian cancer with 100% sensitivity, 95% specificity,and a nominal positive predictive value of 94%.4 Scores of otherpublications have described discriminant SELDI derived pat-terns for breast cancer,17,18 lung cancer,19,20 prostate cancer,21,22
pancreatic cancer,23,24 bladder cancer,25 gastric cancer,26 coloncancer,27,28 kidney cancer,29,30 brain cancers,31 and hepato-cellular carcinoma,32 as well as such nonmalignant diseases assevere acute respiratory syndrome (SARS),33,34 urolithiasis,35 andliver cirrhosis.36,37 The lofty promise and high profile of theLancet paper led it to come under particularly close scrutinyand repeated reanalysis, and we and others have noted asignificant number of serious concerns. For instance, informa-tion in the noise region of the spectra allows effective clas-sification; small numbers of randomly selected mass/chargevalues markedly outperform chance and may perform as wellas the features that were used in the paper for classification;sample subsets have markedly different global spectral char-acteristics; and nominally discriminant features from thepublished experiment are uninformative in a subsequentlyanalyzed dataset generated by the same authors with the sametechnology and made available online (ref 38; Gillette and Mani,unpublished analysis). These analyses, facilitated by the com-mendable decision of the authors to provide public access toall primary data (http://home.ccr.cancer.gov/ncifdaproteom-ics/ppatterns.asp) raise concerns regarding intrinsic data bias(likely artifactual, though of uncertain provenance), inadequatestatistical rigor, and lack of generalizability of results. The claimof 94% positive predictive value has also been discredited, asit is based on the 43% “prevalence” of diseased samples in theanalysis, rather than the 0.04% prevalence of the disease in alow risk clinical setting.39 The resulting cautionary tale is areminder that chance and bias must be avoided if possiblethrough careful study design, that data should be systematicallyscrutinized for evidence of bias, that analyses should beconducted with statistical rigor, and that discovered patternsshould ultimately be validated in totally independent samplesets.40,41 Some of these points are addressed at greater lengthin the section on data analysis (below). Interested readers arealso referred to the study by Zhang and colleagues for anexample of a study in which chance and bias were properlyconsidered.42
Additional, more general criticisms have been directed at theSELDI technology itself. The low resolution, precision, andaccuracy of the mass spectrometer may diminish the yield ofdetectable peptide and protein ions and complicate cross-spectral comparisons. Reproducibility studies show higherspectral correlations from different spots on the same chip thanacross chips, suggesting possible room for improvement in chipmanufacturing tolerances.43 A major concern is that minimalsample fractionation coupled with low binding capacity of thechip chromatographic surfaces make it inevitable that abun-dant proteins will (perhaps overwhelmingly) predominate inthe spectra, an expectation that appears to be borne out in thevery small number of SELDI studies in which identification waspursued and achieved.44-46 This is important because somechanges in abundant proteins are known or may prove to benonspecific markers of illness or inflammation, and so may bemuch less informative once outside the artificial constraintsof a biomarker discovery experiment, in which a comparisonis often staged between specific disease samples and healthycontrols, rather than between different types of disease. On theother hand, protein biomarkers identified by mass spectrometryare virtually never fully characterized, and there have been
Pattern in Proteomic Biomarker Discovery reviews
Journal of Proteome Research • Vol. 4, No. 4, 2005 1145

suggestions that disease specificity may be conferred bydifferent isoforms or differential cleavage of abundantproteins.47-49 In the latter case, the abundant protein may actas a biological amplifier of a subtler signal of differentialenzyme abundance or activity.
Unfortunately, concerns about data quality and analysis,highly publicized skepticism about the specific findings of thelandmark Lancet paper, dramatic representations of the resultsin lay publications, and the dearth of examples of clinicallyvalidated diagnostic MS patterns, have conspired with generalreservations about the performance characteristics of the SELDIplatform, (particularly among expert biological mass spec-trometrists), to lead to a serious and sometimes unreflectiveskepticism regarding the potential of mass spectrometric pat-tern as biomarker. However, the merits of individual biomarkerdiscovery efforts and of SELDI or other specific platformsshould be evaluated separately from the general concept andstrategy of pattern-based diagnostics, and the shortcomings inany one should not be held as indictments of the others.
Experimental approaches to pattern-based biomarker dis-covery can be designed to substantially address the aforemen-tioned concerns. Depth of coverage can be improved withabundant protein depletion and separation using multipledimensions of orthogonal chromatography with bead-based orother high binding capacity materials (though at some cost insample throughput). Over the course of multiple biomarkerdiscovery efforts, it should become clearer whether and wherethere is a “sweet spot” between throughput and depth, andbetween simplicity of processing and information content ofspectra. High information content pattern data can be gener-ated using mass spectrometers capable of high mass accuracyand high resolution to facilitate alignment across spectra (seebelow). The ionization method and analyzer employed can alsobe selected to provide high dynamic range within each massspectrum (whether MALDI, SELDI or LC-ESMS) to facilitatedetection of minor components in the presence of major ones.Transparent, well-validated machine learning algorithms canbe employed, and resulting diagnostic profiles can be evaluatedwith statistical rigor. Some positive steps in this direction wererecently taken by Paul Tempst and colleagues.5 They used beadbased rather than flat surface affinity chromatography, increas-ing their binding capacity by more than 2 orders of magnitude,and coupled this with relatively high performance MALDI-TOFMS. This yielded a feature space of over 400 well-defined peaks,richer than with comparable SELDI strategies, with instrumentprecision that facilitated alignment across spectra. Electrospraybased methods in which accurate retention time informationsupplements mass/charge and intensity data have also beenrecently described.7,8 Electrospray has some specific advantagesfor the analysis of high-complexity biological samples whichwill be described below.
Although methods for robustly detecting high quality dis-criminant MS patterns in biofluids may negate the absoluterequirement for identification of the peptides and proteins thatconstitute the pattern, identity retains advantages. Knowing theidentity of the constituent peptides and proteins may increaseconfidence in the robustness of the assay, provide biologicalinsight into disease pathogenesis, suggest therapeutic targets,and create the opportunity for transfer of the assay to analternative technology platform (e.g., enzyme-linkedimmunosorbent assays (ELISAs)). The latter is important as theability to utilize an MS platform in a clinical chemistry settingfor MS-pattern based diagnostics is essentially untested. Though
identification does not enhance biomarker performance perse, it may be difficult to protect intellectual property aroundan otherwise uncharacterized MS profile, decreasing the likeli-hood of resource commitment to the validation and clinicaldevelopment of a pattern-based diagnostic (Leigh Anderson,personal communication).
Pattern to Guide or Enrich Biomarker Discovery: Impactof Dynamic Range, Resolution and Mass Accuracy. Generallyspeaking, what is of interest in biomarker discovery is only thatset of molecular species that varies in a detectable andconsistent way between relevant states, such as disease andcontrol. Those who advocate the use of identified biomarkersare thus likely to care about the identities of only a small subsetof the constituents of a complex sample. Time and resourcesdirected to the identification of other components are in thissense wasted. Herein lies the motivation for the use of massspectrometric pattern to guide or to enrich biomarker discov-ery. The distinction between these turns on whether any MS/MS data are obtained concurrently with primary MS datacollection. In the “pattern to guide” approach, full scan massspectra are subjected to feature selection and machine learningmethods, and only those peaks that appear to be informativeare selected for identification. In the “pattern to enrich”approach, tandem mass spectra acquired in a data-dependentmanner during primary data acquisition are supplemented ina secondary, guided analysis after the MS data have been minedwith pattern recognition methods (see further discussionbelow). Both approaches are facilitated by use of high quality,high information content data.
The dynamic range, mass resolution and mass accuracy ofthe mass spectrometer employed have a significant impact onthe information content of the pattern obtained. High instru-mental dynamic range is necessary to deal with the enormousdynamic range of proteins present in plasma.2 Many highlyabundant proteins and their metabolic breakdown productsmay be present at 3 to 5 orders of magnitude higher concen-tration than proteins of likelier direct biological relevance todisease. There are two categories of dynamic range importantto biomarker discovery: dynamic range within a spectrum orscan, and dynamic range obtained across an entire experimentconsisting of many scans. In the latter case, dynamic range isimproved beyond single spectrum values through chromato-graphic separation that effectively separates in time the moreabundant from the less abundant components. Dynamic rangewithin a spectrum is strongly affected by the ionization modeemployed, with MALDI/SELDI TOF resulting in the lowestdynamic range, typically on the order of low parts per hundred.By contrast, the dynamic range of electrospray in full scanmode is typically on the order of parts per thousand, while fortargeted analyses such as multiple reaction monitoring MS fordetection of peptides in plasma, electrospray can achieve upto four orders of linear dynamic range.50
The ability to align, detect abundance changes in, andconfidently track these patterns across multiple patient samplesare the central analytical requirements for proteomic patternor “feature” recognition. The higher the instrumental massresolution and mass accuracy, the easier and more reliablethese tasks become. Assignment of accurate masses to molec-ular species observed on low performance instruments isgenerally acknowledged to be impossible. However, there is astandard misconception about the capabilities of intermediateresolution (10-20 K) and mass accuracy (5-50 ppm) instru-ments, particularly orthogonal quadrupole/quadrupole time-
reviews Gillette et al.
1146 Journal of Proteome Research • Vol. 4, No. 4, 2005
of-flight MS systems such as the QStar (Applied Biosystems)and Q-Tof (Waters). These instruments have the capability ofallowing “exact” mass measurements of pure or nearly purechemical species with uncertainties of less than 10 ppm.51-55
However, it must be borne in mind that such performance,which requires measurement accuracy and reproducibility towithin 1% of the peak widths obtained, is only achievable inthe absence of other mixture components of similar mass. Inother words, these instruments will often be inaccurate incomplex mixtures such as minimally fractionated plasma, sinceadjacent peaks will not be resolved.
As with the approach of using pattern as biomarker, thegeneral strategy of guiding biomarker discovery by pattern doesnot constrain the technologies used for the discovery effort.Indeed, this is the strategy that has been employed in thosecases in which biomarker candidates selected by SELDI weresubsequently identified. It is important to point out that a widedisparity exists between our present relative inability to definesequence information sufficient to identify proteins (>10 kDa)by direct MS analysis and the relative ease with which this canbe done for peptides (<3 kDa). The difficulties are made moresevere by the fact that singly charged ions obtained by MALDI/SELDI for large peptides and proteins do not tend to fragmentin a manner that produces useful information. Therefore,transitioning from protein pattern produced by MALDI toprotein identity is generally quite difficult, and typically involvestracking the specific peak of interest through sufficient stepsof chromatographic purification to ensure that upon digestionwith trypsin, the peptides observed in the digest are largelyderived from the protein of interest. The inherent difficulty ofthis approach accounts in part for both the small number ofproteins identified in these studies and the tendency of thosethat have been identified to represent highly abundant con-sitituents of plasma.
In contrast to MALDI, electrospray produces multiply chargedions that fragment relatively easily, allowing at least partialsequence information to be obtained on large peptides andproteins. Until recently, however, a significant drawback hadbeen the inability to define the charge states and therefore themasses of the fragment ions produced. This limitation haslargely been overcome with the availability of MS instrumentssuch as Fourier transform-ion cyclotron resonance MS (FTMS)that can achieve resolution of up to 500 000 with massaccuracies of 1-5 ppm.56 In addition, novel fragmentationmethods such as electron capture dissociation (ECD)57-61 andelectron-transfer dissociation (ETD)62 are available for the large,multiply charged ions produced by ESMS (but not for singlycharged ions), and these methods are uniquely suited tosequence analysis of large peptides and small proteins.
While pattern has commonly been used to guide biomarkeridentification, an important variation on that approach thathas not to our knowledge been previously described is the useof pattern to enrich biomarker discovery. In this approach, themain thrust of biomarker discovery proceeds normally throughanalysis of complex materials with on-line data-dependent MS/MS, generating lists of identified molecular species whosebiomarker candidacy can be initially assessed by the pseudo-quantitation methods incorporated into some mass spectrom-etry software packages (e.g., the Approxiquant feature inSpectrum Mill, Agilent Inc.) Thus in the first analysis, identityis achieved before biomarker status is determined. This in-creasingly common approach is especially compelling withtandem instruments such as the LTQ-FT (a hybrid instrument
consisting of a linear ion trap and an FTMS from Thermo Inc.)where data-driven sequence information on a subset of peaksis available with little cost in duty-cycle and sample throughput.Even with substantial separation over multiple dimensions ofchromatography, however, body fluid fractions are likely toretain a high degree of complexity. In this setting there is ahigh likelihood that data-dependent methods will fail to triggerMS/MS analyses on a substantial subset of peaks. Furthermore,even when appropriately triggered on peaks reflecting realpeptides, sufficiently high-confidence identities will not alwaysbe attained. A consequence of this is potentially significantinformation loss. Strategies such as replicate analyses withexclusion lists may allow recovery of some of this informationwithin the context of a purely identity-driven paradigm. Theeffect of stochastic sampling in complex samples suggests,however, that there will continue to be a large number of MSpeaks for which identity information is unavailable.
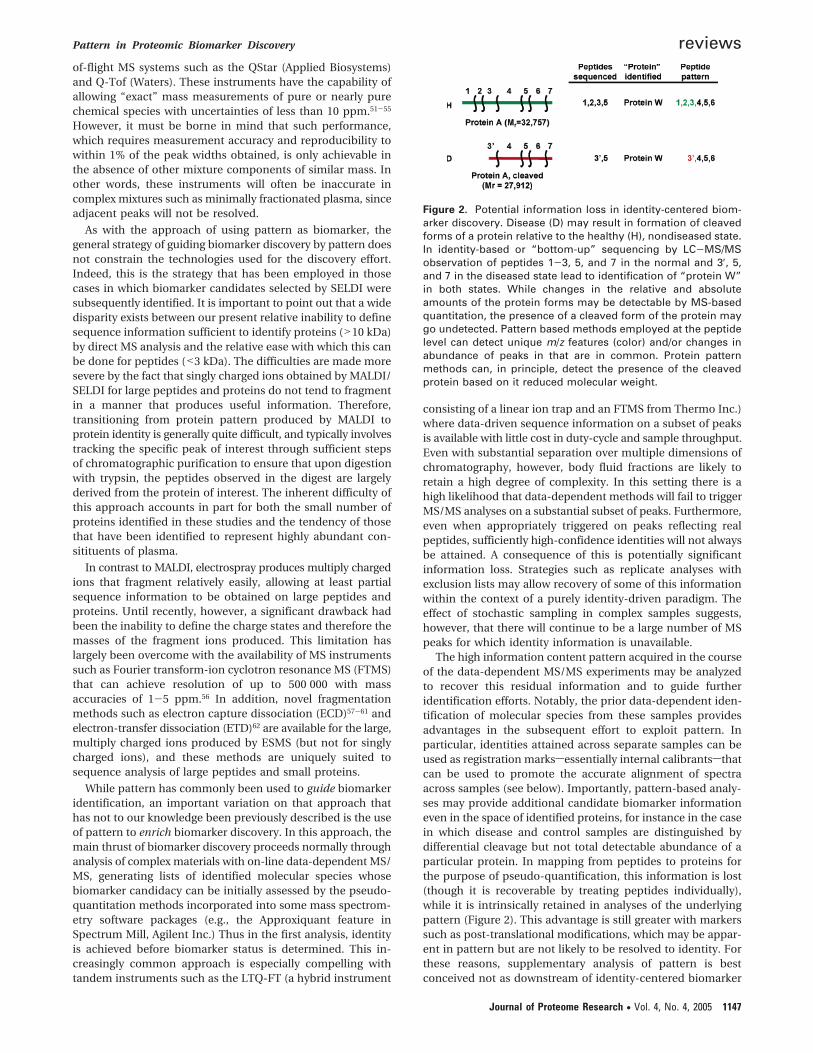
The high information content pattern acquired in the courseof the data-dependent MS/MS experiments may be analyzedto recover this residual information and to guide furtheridentification efforts. Notably, the prior data-dependent iden-tification of molecular species from these samples providesadvantages in the subsequent effort to exploit pattern. Inparticular, identities attained across separate samples can beused as registration markssessentially internal calibrantssthatcan be used to promote the accurate alignment of spectraacross samples (see below). Importantly, pattern-based analy-ses may provide additional candidate biomarker informationeven in the space of identified proteins, for instance in the casein which disease and control samples are distinguished bydifferential cleavage but not total detectable abundance of aparticular protein. In mapping from peptides to proteins forthe purpose of pseudo-quantification, this information is lost(though it is recoverable by treating peptides individually),while it is intrinsically retained in analyses of the underlyingpattern (Figure 2). This advantage is still greater with markerssuch as post-translational modifications, which may be appar-ent in pattern but are not likely to be resolved to identity. Forthese reasons, supplementary analysis of pattern is bestconceived not as downstream of identity-centered biomarker
Figure 2. Potential information loss in identity-centered biom-arker discovery. Disease (D) may result in formation of cleavedforms of a protein relative to the healthy (H), nondiseased state.In identity-based or “bottom-up” sequencing by LC-MS/MSobservation of peptides 1-3, 5, and 7 in the normal and 3′, 5,and 7 in the diseased state lead to identification of “protein W”in both states. While changes in the relative and absoluteamounts of the protein forms may be detectable by MS-basedquantitation, the presence of a cleaved form of the protein maygo undetected. Pattern based methods employed at the peptidelevel can detect unique m/z features (color) and/or changes inabundance of peaks in that are in common. Protein patternmethods can, in principle, detect the presence of the cleavedprotein based on it reduced molecular weight.
Pattern in Proteomic Biomarker Discovery reviews
Journal of Proteome Research • Vol. 4, No. 4, 2005 1147
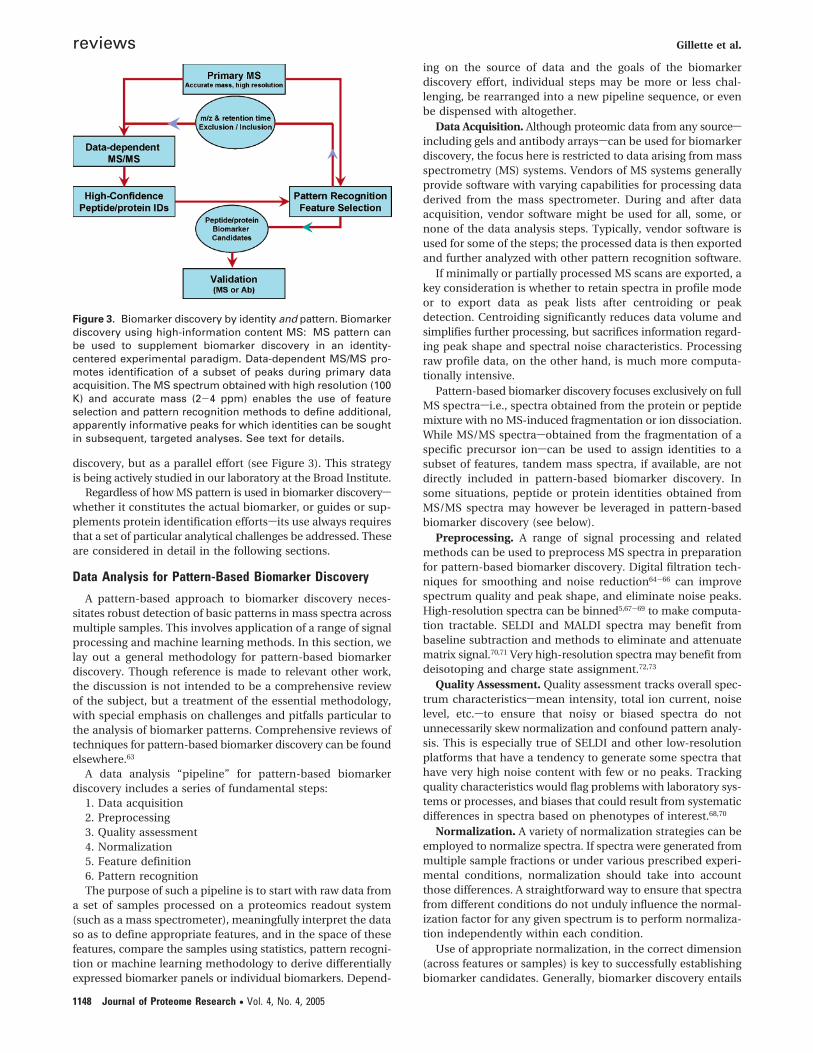
discovery, but as a parallel effort (see Figure 3). This strategyis being actively studied in our laboratory at the Broad Institute.
Regardless of how MS pattern is used in biomarker discoverys
whether it constitutes the actual biomarker, or guides or sup-plements protein identification effortssits use always requiresthat a set of particular analytical challenges be addressed. Theseare considered in detail in the following sections.
Data Analysis for Pattern-Based Biomarker Discovery
A pattern-based approach to biomarker discovery neces-sitates robust detection of basic patterns in mass spectra acrossmultiple samples. This involves application of a range of signalprocessing and machine learning methods. In this section, welay out a general methodology for pattern-based biomarkerdiscovery. Though reference is made to relevant other work,the discussion is not intended to be a comprehensive reviewof the subject, but a treatment of the essential methodology,with special emphasis on challenges and pitfalls particular tothe analysis of biomarker patterns. Comprehensive reviews oftechniques for pattern-based biomarker discovery can be foundelsewhere.63
A data analysis “pipeline” for pattern-based biomarkerdiscovery includes a series of fundamental steps:
1. Data acquisition2. Preprocessing3. Quality assessment4. Normalization5. Feature definition6. Pattern recognitionThe purpose of such a pipeline is to start with raw data from
a set of samples processed on a proteomics readout system(such as a mass spectrometer), meaningfully interpret the dataso as to define appropriate features, and in the space of thesefeatures, compare the samples using statistics, pattern recogni-tion or machine learning methodology to derive differentiallyexpressed biomarker panels or individual biomarkers. Depend-
ing on the source of data and the goals of the biomarkerdiscovery effort, individual steps may be more or less chal-lenging, be rearranged into a new pipeline sequence, or evenbe dispensed with altogether.
Data Acquisition. Although proteomic data from any sources
including gels and antibody arraysscan be used for biomarkerdiscovery, the focus here is restricted to data arising from massspectrometry (MS) systems. Vendors of MS systems generallyprovide software with varying capabilities for processing dataderived from the mass spectrometer. During and after dataacquisition, vendor software might be used for all, some, ornone of the data analysis steps. Typically, vendor software isused for some of the steps; the processed data is then exportedand further analyzed with other pattern recognition software.
If minimally or partially processed MS scans are exported, akey consideration is whether to retain spectra in profile modeor to export data as peak lists after centroiding or peakdetection. Centroiding significantly reduces data volume andsimplifies further processing, but sacrifices information regard-ing peak shape and spectral noise characteristics. Processingraw profile data, on the other hand, is much more computa-tionally intensive.
Pattern-based biomarker discovery focuses exclusively on fullMS spectrasi.e., spectra obtained from the protein or peptidemixture with no MS-induced fragmentation or ion dissociation.While MS/MS spectrasobtained from the fragmentation of aspecific precursor ionscan be used to assign identities to asubset of features, tandem mass spectra, if available, are notdirectly included in pattern-based biomarker discovery. Insome situations, peptide or protein identities obtained fromMS/MS spectra may however be leveraged in pattern-basedbiomarker discovery (see below).
Preprocessing. A range of signal processing and relatedmethods can be used to preprocess MS spectra in preparationfor pattern-based biomarker discovery. Digital filtration tech-niques for smoothing and noise reduction64-66 can improvespectrum quality and peak shape, and eliminate noise peaks.High-resolution spectra can be binned5,67-69 to make computa-tion tractable. SELDI and MALDI spectra may benefit frombaseline subtraction and methods to eliminate and attenuatematrix signal.70,71 Very high-resolution spectra may benefit fromdeisotoping and charge state assignment.72,73
Quality Assessment. Quality assessment tracks overall spec-trum characteristicssmean intensity, total ion current, noiselevel, etc.sto ensure that noisy or biased spectra do notunnecessarily skew normalization and confound pattern analy-sis. This is especially true of SELDI and other low-resolutionplatforms that have a tendency to generate some spectra thathave very high noise content with few or no peaks. Trackingquality characteristics would flag problems with laboratory sys-tems or processes, and biases that could result from systematicdifferences in spectra based on phenotypes of interest.68,70
Normalization. A variety of normalization strategies can beemployed to normalize spectra. If spectra were generated frommultiple sample fractions or under various prescribed experi-mental conditions, normalization should take into accountthose differences. A straightforward way to ensure that spectrafrom different conditions do not unduly influence the normal-ization factor for any given spectrum is to perform normaliza-tion independently within each condition.
Use of appropriate normalization, in the correct dimension(across features or samples) is key to successfully establishingbiomarker candidates. Generally, biomarker discovery entails
Figure 3. Biomarker discovery by identity and pattern. Biomarkerdiscovery using high-information content MS: MS pattern canbe used to supplement biomarker discovery in an identity-centered experimental paradigm. Data-dependent MS/MS pro-motes identification of a subset of peaks during primary dataacquisition. The MS spectrum obtained with high resolution (100K) and accurate mass (2-4 ppm) enables the use of featureselection and pattern recognition methods to define additional,apparently informative peaks for which identities can be soughtin subsequent, targeted analyses. See text for details.
reviews Gillette et al.
1148 Journal of Proteome Research • Vol. 4, No. 4, 2005

normalization across samples where some global aspect of theMS outputslike total ion current, average intensity, etc.sareequalized among all samples under consideration. On someoccasions, especially when there is suspected bias, or whensample similarity needs to be assessed (say, for clustering),feature by feature normalization (e.g., standardization to zeromean and unit standard deviation) may be appropriate.
Care must be exercised when using normalization methodsthat are dependent on the minimum and/or maximum intensi-ties of spectra, since aspects such as baseline correction andinclusion of matrix signature (in SELDI or MALDI spectra) cansignificantly affect the normalization.70
Feature Definition. Once data have been preprocessed andnormalized, analysis proceeds with definition of features to beused for pattern recognition. Feature definition is a uniquerequirement of pattern-based biomarker discovery, and can bethought of as the equivalent of protein/peptide identity inidentity-based biomarker discovery.
The two extremes of the feature definition spectrum areexemplified by: (i) direct use of all recorded m/z values (orretention timesm/z pairs in the case of LC-MS) as features;and (ii) use of spectral peaks identified by some peak detectionmethod. Peak detection has the advantage of deriving acompact set of features by effectively filtering out noise, butmay also eliminate potentially informative low abundancefeatures. On the other hand, the use of raw m/z values retainslow abundance features, but could also result in retention of alarge number of “features” arising from noise. If sufficientsamples were available, these noisy features could be disre-garded during pattern recognition, facilitating the mining oftruly informative biomarkers. In practice, however, samplenumbers or sample processing capabilities are virtually alwayslimiting, making it significantly harder to winnow extraneousor irrelevant features and retain true, generalizable biomarkers.Binning provides an intermediate method wherein several m/zvalues in a given bin are summarized and represented as asingle feature. Chromatography-based MS can include binningin both m/z and retention time.
Irrespective of whether features are defined by peaks, rawm/z values, or something between, a common set of featuresis needed across all samples under consideration as it isimpossible to compare samples and identify phenotypic mark-ers without a common feature set. This requirement is easy tofulfill when dealing with binned or raw m/z values: A masterset of coordinates is chosen and samples interpolated to deriveabundance at these common features. With peak detection thechallenge is substantially greater. Peak matching across samplesis complicated by the fact that the same protein or peptidemay have slightly different m/z values (depending on theprecision of the mass spectrometer), and highly varying reten-tion times (due to the inexact nature of chromatography).
The next section more closely examines particular challengesof feature definition including peak detection, peak matching,and the relative advantages of detected peaks and raw m/zvalues as features.
Peak Detection. Peak detection is a substantial science untoitself, with approaches derived for a wide variety of situationsand a broad range of applications. For processing proteomicsspectra, use of a series of digital convolution (moving window)filters is an effective peak detection strategy.64,66 Other ap-proaches to peak detection include a range of signal processingtechniques such as matched filtration74,75 and signal-to-noiseanalysis.74,76
Peak Matching. Having detected peaks in spectra, the nextcritical challenge is to decide what to count as the “same peak”between different sample spectra. A straightforward approachis window-based peak matching, where all peaks within a given(fixed or adaptive) m/z window are considered to be the “same”peak.70 A variant of window-based peak matching has beendescribed by Adam and colleagues.77 A peak alignment strategyusing a genetic algorithm to group peaks so as to maximizepeak number in a group from different samples, and minimizepeak number in a group from the same sample, has also beendescribed.78 Other peak matching methods include hierarchicalclustering,76 linear or piece-wise linear warping, dynamicprogramming and wavelet analysis.67,79,80
A probabilistic approach to peak matching uses a mixtureof Gaussians to model peaks in the spectra. Using the observedpeak locations for all spectra within a given condition, theGaussian mixture model is fit using the expectation maximiza-tion (EM) algorithm, by iteratively maximizing the likelihoodfunction.81,82 While this approach provides the location ofpeaks, the number of peaks can be decided using a modelselection criterion like the Bayesian information criterion(BIC).83
Although high precision mass spectrometers such as FTMSsystems can reduce the need for peak matching, higherprecision instruments also scan at higher sampling rates,resulting in more m/z values being recorded, and thus enablingthe detection of smaller and finer peaksswhich still need tobe aligned. In some measure, therefore, the alignment problemscales with instrument performance.
Tandem mass spectrometry enables the identification ofsome of the peaks in a sample. Such identified peaks can beused as landmarks for aligning (unidentified) peaks acrosssamples. This technique can be especially effective if peptidesidentified in one sample can be propagated to other samplesto establish common alignment landmarks. Extension of thismethod with large landmark databases could result in asignificant blurring of the line between pattern-based andidentity-based biomarker discovery.
Peaks vs Raw m/z Features. Compared to raw m/z values,peak detection represents a condensation of the potentialfeature space. It is plausible that this is associated withinformation loss, especially with respect to the probablyimportant subset of low abundance biomarkers. We exploredthis issue by building predictive models (classifiers) for thesame phenotype with both raw m/z values and peaks asfeatures.
Spectra from serum samples for one of four types of cancersproduced using a SELDI mass spectrometer (Ciphergen Bio-systems, Freemont, California) were used for the analysis:
• Acute Lymphoblastic Leukemia (ALL): 80 control samples,82 B-cell ALL samples with serum drawn at diagnosis (timeT0), and 38 samples from patients in remission (time T1, 5months after initiation of treatment) were scanned using (i)immobilized metal affinity capture (IMAC) target arrays (“chips”)with sinapinic acid (SPA) matrix and (ii) weak cation exchange(WCX) chips with alpha-cyano-4-hydroxy cinnamic acid (CHCA)matrix. Data from this set were used to build B-cell ALL vsControl and T0 vs T1 classifiers.
• Lung Cancer: Adenocarcinoma (47), small-cell carcinoma(49), squamous-cell carcinoma (48) and control (46) sampleswere scanned using IMAC-SPA and WCX-CHCA to provide datafor adenocarcinoma vs control, small-cell carcinoma vs controland squamous-cell carcinoma vs control classifiers.
Pattern in Proteomic Biomarker Discovery reviews
Journal of Proteome Research • Vol. 4, No. 4, 2005 1149
• Melanoma: Melamona vs control classifiers were builtusing 25 cancer and 25 control samples scanned using IMAC-SPA.
• Ovarian Cancer: A dataset containing 162 ovarian cancerand 91 control serum scans on WCX-CHCA was downloadedfrom the NCI-FDA Clinical Proteomics web site.84 Classifierswere built to separate cancer vs control.
ALL, lung and melanoma samples were separated (“pre-fractionated”) into 6 fractions using anion exchange beads. Outof the 6 fractions, only fraction 1 was used for ALL and lung,while melanoma samples used pooled fractions 1+2 and 5+6.Ovarian cancer samples were not pre-fractionated.
Spectra resulting from scanning these samples were baselinesubtracted and processed to generate datasets using one of twofeature definition methods:
• Peaks: Peak detection was followed by probabilistic peakmatching based on a Gaussian mixture model learned usingexpectation maximization.
• Raw m/z: Raw m/z values from the spectra were used withno peak detection.
Using features (peaks or raw m/z values) from the fourcancers, classifiers were built to discriminate phenotypes ofinterest using multiple algorithms:
• Decision trees were generated with no feature selection,using 10-fold cross-validation (CV) for error estimation.
• K-NN classifiers were built with k ) 3 and 10-fold CV, usingthe top 5, 10 and 50 signal-to-noise-ratio85 selected features,with feature selection run inside the CV loop.
• Decision tree and k-NN models were generated usinggenetic algorithms (GA) for feature selection. A 10-fold CV outerloop was used for error estimation. In each fold of crossvalidation, the best 5 or 10 features were selected using a
genetic algorithm with either decision tree or k-NN leave-one-out cross-validation error as the objective function. Thesefeatures were used to build a decision tree or k-NN (respec-tively) model, which was applied to the excluded data subsetto estimate error.
This scheme results in construction of a multitude ofclassifiers for each classification of interest. For example, thelung cancer adenocarcinoma vs control classification will havea total of 32 classifiers: a decision tree, k-NN models with 5,10, and 50 features, GA-trees with 5 and 10 features, and GA-kNN models with 5 and 10 features for each of the 4 combina-tions of feature definition (peaks or raw m/z values) andscanning condition (IMAC-SPA or WCX-CHCA).
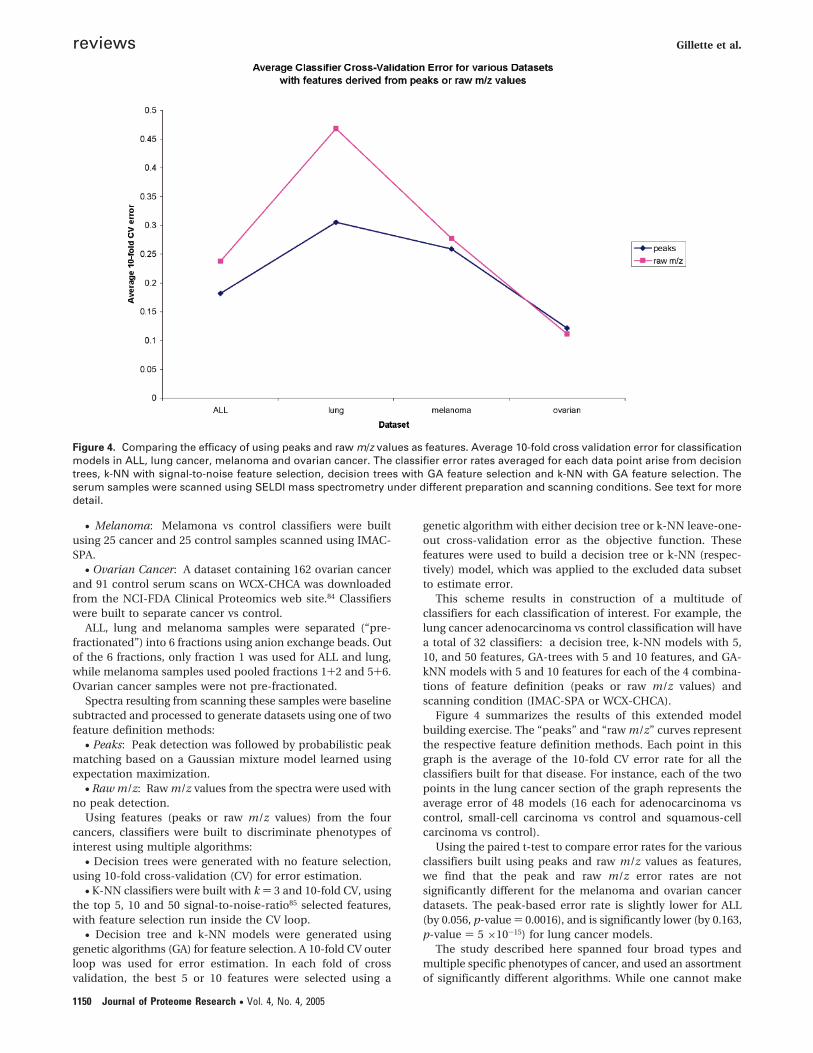
Figure 4 summarizes the results of this extended modelbuilding exercise. The “peaks” and “raw m/z” curves representthe respective feature definition methods. Each point in thisgraph is the average of the 10-fold CV error rate for all theclassifiers built for that disease. For instance, each of the twopoints in the lung cancer section of the graph represents theaverage error of 48 models (16 each for adenocarcinoma vscontrol, small-cell carcinoma vs control and squamous-cellcarcinoma vs control).
Using the paired t-test to compare error rates for the variousclassifiers built using peaks and raw m/z values as features,we find that the peak and raw m/z error rates are notsignificantly different for the melanoma and ovarian cancerdatasets. The peak-based error rate is slightly lower for ALL(by 0.056, p-value ) 0.0016), and is significantly lower (by 0.163,p-value ) 5 ×10-15) for lung cancer models.
The study described here spanned four broad types andmultiple specific phenotypes of cancer, and used an assortmentof significantly different algorithms. While one cannot make
Figure 4. Comparing the efficacy of using peaks and raw m/z values as features. Average 10-fold cross validation error for classificationmodels in ALL, lung cancer, melanoma and ovarian cancer. The classifier error rates averaged for each data point arise from decisiontrees, k-NN with signal-to-noise feature selection, decision trees with GA feature selection and k-NN with GA feature selection. Theserum samples were scanned using SELDI mass spectrometry under different preparation and scanning conditions. See text for moredetail.
reviews Gillette et al.
1150 Journal of Proteome Research • Vol. 4, No. 4, 2005

conclusive statements from such an empirical study, the dataseem to indicate that a small set of carefully selected m/z values(peaks) is as informative as the entire spectrum (raw m/zvalues). When the phenotypes are difficult to distinguish, asin lung cancer, an increase in features appears to hurt clas-sification by introducing excessive noise, resulting in higherclassifier accuracy with peak detection (see Figure 4).
Postprocessing. In the primary processing of complexsample materials, it is common for individual samples to beseparated into multiple fractions, and indeed for each fractionto undergo additional orthogonal chromatography or tootherwise be scanned under different conditions, such as withvariable LC gradients or different laser desorption matrixes.These must be treated separately. For each condition, thefeature definition process creates a table of features andintensities with each individual sample typically having a subsetof those features. Features that are not detected in a particularsample can be either marked as missing, or filled in withinterpolated amplitudes. Although dealing with discrete data(e.g., peak present vs absent) is conceptually appealing, ourpreliminary analyses suggest reduced accuracy with classifiersderived from discretized rather than continuous data (notshown). One might speculate that the peak amplitudes though“semiquantitative,” might nevertheless be informative, andhence result in lower classification error rates. This issue ofdiscrete vs interpolated peaks warrants further study.
Completion of postprocessing results in a table consistingof features and associated amplitudes for all samples in a givencondition. The full feature space available to pattern recogni-tion algorithms is the concatenation of these tables across allfractions and conditions. On the basis of practical consider-ations, each of these feature tables can be analyzed individually,or the grand set of concatenated features explored simulta-neously.
Pattern Recognition. A variety of machine learning andpattern recognition techniques86,87 can be used to mine pro-teomics data, to cluster the data in search of known or novelgroups, to build classifiers to recognize classes of significance,and to find discriminant biomarkers. The specifics of the toolsand methods used in any project will depend a great deal onthe goals and scientific objectives of that project. Algorithmsfor pattern recognition include weighted voting (WV),85
k-nearest neighbors (k-NN),85,86 decision trees,88 neural net-works,89 large Bayes classifiers (LB),90 and genetic algorithms,91
among many others.As with gene expression data, the major challenge in apply-
ing pattern recognition and machine learning to proteomic dataanalysis is the curse of dimensionality:86 the presence of a largenumber of attributes or features (several hundreds to severalthousands or more), with only a small number of samples (tensto a few hundreds). Effective feature selection methods aretherefore needed in order to leverage pattern recognitiontechniquessboth to build classifiers to discriminate betweenphenotypes of interest, and to identify biomarkers individuallyor in panels.
Biomarker discovery requires identification of features thateffectively distinguish between classes of interest. This can beachieved by (i) ranking each feature based on its ability toseparate the samples into appropriate classes thereby identify-ing the best individual biomarkers, (ii) using all features to buildan accurate classifier and then probing the classifier todetermine a panel of biomarkers, or (iii) adopting an inter-mediate approach where feature ranking is used to identify a
smaller subset of features that are then used either directly, orin a classification algorithm to determine a biomarker panel.
Feature selection and ranking can be performed using avariety of techniques including the t-test, signal-to-noise-ratio,85
genetic algorithms, and area under the ROC curve. Most featureselection methods either include or can be easily combinedwith some random permutation test to measure the statisticalsignificance of the importance of each feature. On the basis ofhow these p-values are computed, they may need to beadjusted for multiple hypothesis testing. In addition to evaluat-ing statistical significance, permutation p-values can also beusedseither exclusively or in combination with other scoress
for feature ranking.The output of feature selection, or the best n peaks arising
from feature ranking are not only bona fide potential biomar-kers, but can also be used as input to other machine learningalgorithms such as k-NN, weighted voting or large Bayes90
classifiers to demarcate a biomarker panel constituted by ahandful of features. Although the same feature selectionapproach could be used with decision trees, the intrinsicfeatures of that algorithm allow it to effectively select andprioritize features, especially when combined with tracking ofsurrogates and variable importance computation.88 It shouldbe emphasized that when features arising from feature selectionor ranking are used to train a classifier using cross-validation,the feature selection must be done inside the cross-validationloop. Performing feature selection first and then running cross-validation will result in over-fitting, leading to artificially lowerror rates.
Numerous other approaches have been taken to patternrecognition in proteomics data. Petricoin and colleagues4 usedan approach in which the raw m/z values (with no peakdetection) constituted the feature space. Several random, butsmall (5-20), subsets of these m/z values were chosen and usedas input to a genetic algorithm. The fitness function for thegenetic algorithm was based on the segregating power of thesubset of m/z values in a self-organizing map. Adam and co-workers77 used the area under the ROC curve (AUC) for featureselection with decision tree classifiers. Support vector machines(SVM)92 is another technique that has become increasinglypopular for classification. SVMs have the ability to directly dealwith a large number of features without the need for featureselection. Li, et al.93 used a variant of the SVM termed unifiedmaximum separability analysis (UMSA). By using adjustableparameters, UMSA can produce classifiers that encompasslinear discriminant analysis and optimal margin hyperplaneSVM classifiers. Decision trees,21 and various statistical tests94
and procedures (t-test, Kruskal-Wallis test, significance analysisfor microarrays, etc.) have also been used in feature selection,in classification, and to determine differentially expressedmarkers. A more complete survey of pattern recognitionmethods as applied to proteomics is presented by Listgartenand Emili.63
Classifier Error Rate as a Criterion for Parameter Optimi-zation. In the pattern-based approach to biomarker discovery,a relatively large fraction of the proteome is captured (repre-sented by the mass spectral peaks) and analyzed in order tosearch for patterns of peaks that discriminate phenotypes orcharacteristics of interest. Since the identity of biomarkers isunknown, there is no “gold standard” for optimizing patternrecognition and data preprocessing parameters: the “correctsolution” is unknown. Parameter optimization will thereforehave to be made based on secondary criteria. Classification
Pattern in Proteomic Biomarker Discovery reviews
Journal of Proteome Research • Vol. 4, No. 4, 2005 1151
error rate is a reasonable surrogate criterion that can be usednot only for parameter optimization, but also to assess therelative information content arising from various fractions anddifferent scanning conditions.
Parameter optimization using classifier error rate can resultin the generation of a large number of models with differentparameter settings derived from the same data. Thus somewhatparadoxically, the effort to minimize classifier error can resultin parameter settings that over-fit the specific data with poorgeneralization to unseen data. To avoid this scenario, use of aseparate (unseen) validation set to assess the error rate of thefinal models after all optimization and model selection isrecommended.
Robust Biomarker Discovery. From a biological perspective,one of the main goals of analyzing proteomics data is touncover relevant and real biomarkers for distinctions of clinicaland/or biological importance. To this end, supervised learningapproaches use known sample labels to derive discriminatingfeatures that effectively separate the classes of interest. In thecase of proteomic data, these discriminating featuressormarkerssare peaks (or m/z values) occurring in specificfractions under specific preparation and scanning conditions.In assessing the validity of these markers, it is reasonable toexpect them to remain effectivesprobably to a lesser degree,but nevertheless better than randomly selected featuresswhendeployed in classifiers beyond the pattern recognition algorithmused in their discovery. The large number of features and smallnumber of samples in most proteomic studies could result inmarkers that are essentially based on noise or other bias, andtherefore not biologically valid.
Analysis of proteomics data has also revealed that intrinsicbias may falsely identify biomarkers and contribute to high
classification accuracy. For example, in the Lancet ovariancancer study4 there is evidence to suggest that the cancers andcontrols have statistically significant differences (even afternormalization) in the mean spectral intensity level. Suchsystematic differences raise the possibility that extremelyaccurate classifiers might tap into this global bias,38,95 inaddition to or exclusive of additional reliance on genuine,“biological” markers.
To avoid such pitfalls, we propose the following steps in theanalysis of proteomic data for biomarker discovery:
(1) Use a model development approach that generates adistribution of misclassification error. Partitioning the availabledata into multiple random train/test splits, or using n-fold crossvalidation, bootstrap, or other suitable methods, allows morerobust assessment of model performance.
(2) Evaluate data for signs and significance of bias.(a) Identify significant class-specific differences in global
metrics of relevance to the classifier (e.g., in mean spectral orpeak amplitude). The presence of global class-specific biasescan produce “biomarkers” that are unrelated to the biologyunder consideration.
(b) Look for better-than-chance performance of classifiersusing small numbers of randomly selected features. Theexistence of bias can significantly enhance the performanceof such classifiers.
(3) Compare the performance of selected features (putativebiomarkers) with models built on comparable numbers ofrandom features. Robust, biologically derived biomarkers oughtto be more informative for the classification of interest than arandom subset of features.
(4) Use putative biomarkers as classification features in othercredentialed algorithms, demonstrating that those features
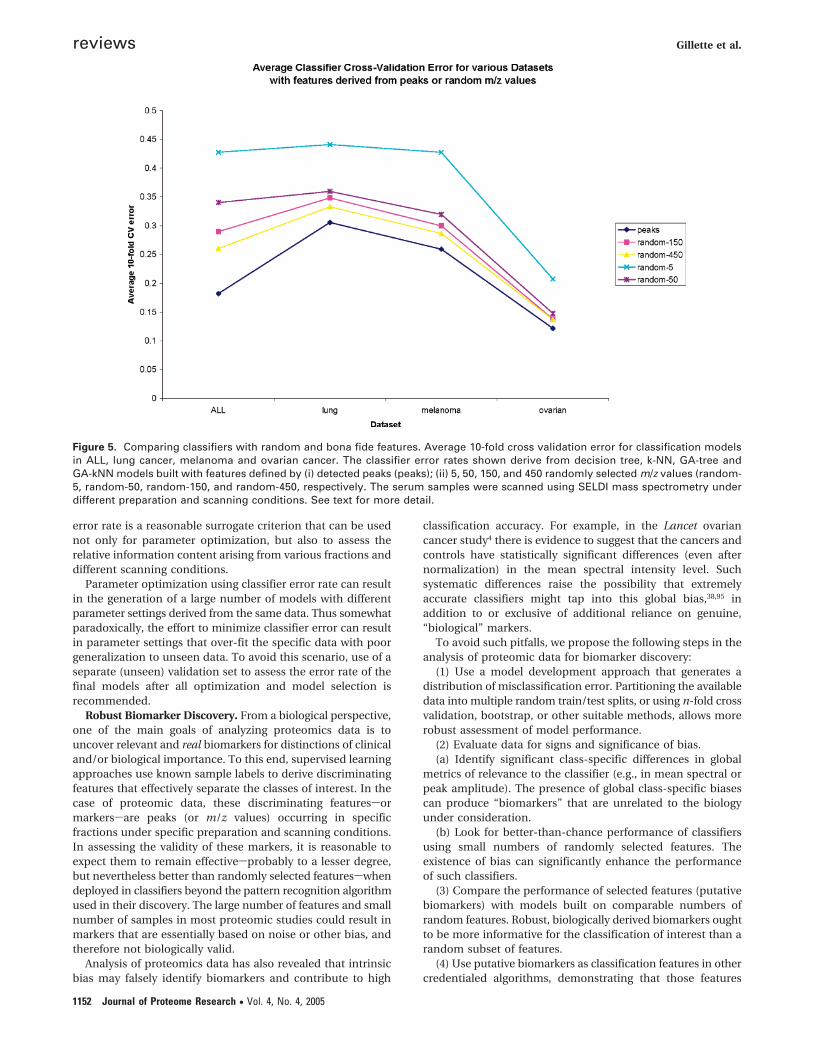
Figure 5. Comparing classifiers with random and bona fide features. Average 10-fold cross validation error for classification modelsin ALL, lung cancer, melanoma and ovarian cancer. The classifier error rates shown derive from decision tree, k-NN, GA-tree andGA-kNN models built with features defined by (i) detected peaks (peaks); (ii) 5, 50, 150, and 450 randomly selected m/z values (random-5, random-50, random-150, and random-450, respectively. The serum samples were scanned using SELDI mass spectrometry underdifferent preparation and scanning conditions. See text for more detail.
reviews Gillette et al.
1152 Journal of Proteome Research • Vol. 4, No. 4, 2005

continue to outperform random features, and that classificationperformance does not degrade catastrophically. While featuresoptimized for one algorithm may be far from optimal for adifferent algorithm, putative biomarkers consistently outper-forming random features in a variety of algorithms are lesslikely to be false positives.
(5) Whenever possible, validate markers in a fully indepen-dent dataset (i.e., from a different source, or prospectively).
We believe that these tests will help avoid the promulgationof spurious biomarkers, and allow research efforts to be focusedon the most promising candidates. Protein identification anddirect biological confirmation will of course remain the defini-tive standards for validation.
Figure 5 illustrates some of the ramifications of our proposedapproach to pattern-based biomarker discovery. Using thesame spectral data underlying Figure 4 (see the “Peaks vs Rawm/z Features” subsection), the issue of bias and the perfor-mance of classifiers built with randomly selected raw m/zvalues are explored in this figure. In addition to datasetsgenerated via peak detection, 4 random datasets were gener-ated by selecting 5, 50, 150, and 450 raw m/z values at random,with no peak detection, and recording intensity at these m/zvalues for all sample spectra. As before, classifiers were builtfor the phenotypes of interest. To account for unusually well-performing or poorly performing random m/z values, eachrandom dataset was recreated 5 times, with models subse-quently rerun and errors averaged. The average error rates aresummarized by the “random-5”, “random-50”, “random-150”and “random-450” curves in Figure 5. For comparison the errorrate curve for classifiers built using bona fide peaks is alsoincluded in the figure. It is clear from the figure that classifiersget progressively more accurate as more and more randomfeatures are included. Given the relatively low resolution of themass spectrometer and consequent broad peaks of the SELDIspectra, increasing the number of randomly selected m/z valuesincreases the probability that actual peaks in the spectra arerepresented. As such, the error rate progressively approximatesthe error rate for bona fide peaks. Figure 5 is still more revealingwith respect to likely effects of bias in the various datasets. Inthe ovarian cancer data, a small number of random m/z valuescan produce models with error rates significantly lower thanthe 50% error expected by chance, suggesting the presence ofglobal bias in the data. By contrast, there is less evidence ofbias in the melanoma data, and much less apparent bias inthe ALL and lung cancer data.
Conclusion
Pattern has long been instrumental in clinical diagnosis, andit remains at the center of MS-based biomarker discovery.Though a high-quality, well-validated MS pattern may itselfserve as a biomarker, pattern can also be used to facilitatediscovery in approaches that emphasize the importance ofidentifying constituent peptides and proteins. A novel applica-tion of pattern is its use to supplement biomarker candidatesderived from data-dependent LC-MS/MS experiments. How-ever pattern is employed, it should be derived from highquality, scrupulously processed data, and analyzed with sta-tistical rigor. Ongoing studies should clarify which experimentalstrategies, technology platforms, and analytic approaches aremost fruitful for biomarker discovery. Production of fullyvalidated biomarkers remains the only pertinent standard bywhich alternative methodologies should be judged.
Acknowledgment. The authors thank Jacob Jaffe forhelpful discussions regarding the use of previously identifiedpeaks in subsequent pattern-based biomarker discovery.
References
(1) Burtis, C. A., Ashwood, E. R., Eds. Tietz Textbook of ClinicalChemistry; W. B. Saunders Co.: Philadelphia, PA., 1999.
(2) Anderson, N. L.; Anderson, N. G. Mol. Cell Proteomics 2002, 1,845-867.
(3) Petricoin, E. F.; Zoon, K. C.; Kohn, E. C.; Barrett, J. C.; Liotta, L.A. Nat. Rev. Drug Discov. 2002, 1, 683-695.
(4) Petricoin, E. F.; Ardekani, A. M.; Hitt, B. A.; Levine, P. J.; Fusaro,V. A.; Steinberg, S. M.; Mills, G. B.; Simone, C.; Fishman, D. A.;Kohn, E. C.; Liotta, L. A. Lancet 2002, 359, 572-577.
(5) Villanueva, J.; Philip, J.; Entenberg, D.; Chaparro, C. A.; Tanwar,M. K.; Holland, E. C.; Tempst, P. Anal. Chem 2004, 76, 1560-1570.
(6) VerBerkmoes, N. C.; Bundy, J. L.; Hauser, L.; Asano, K. G.;Razumovskaya, J.; Larimer, F.; Hettich, R. L.; Stephenson, J. L.,Jr. J. Proteome Res. 2002, 1, 239-252.
(7) Shen, Y.; Moore, R. J.; Zhao, R.; Blonder, J.; Auberry, D. L.;Masselon, C.; Pasa-Tolic, L.; Hixson, K. K.; Auberry, K. J.; Smith,R. D. Anal. Chem. 2003, 75, 3596-3605.
(8) Wang, W.; Zhou, H.; Lin, H.; Roy, S.; Shaler, T. A.; Hill, L. R.;Norton, S.; Kumar, P.; Anderle, M.; Becker, C. H. Anal. Chem.2003, 75, 4818-4826.
(9) Adkins, J. N.; Varnum, S. M.; Auberry, K. J.; Moore, R. J.; Angell,N. H.; Smith, R. D.; Springer, D. L.; Pounds, J. G. Mol. Cell.Proteomics 2002, 1, 947-955.
(10) Tirumalai, R. S.; Chan, K. C.; Prieto, D. A.; Issaq, H. J.; Conrads,T. P.; Veenstra, T. D. Mol. Cell. Proteomics 2003, 2, 1096-1103.
(11) Shen, Y.; Jacobs, J. M.; Camp, D. G., 2nd; Fang, R.; Moore, R. J.;Smith, R. D.; Xiao, W.; Davis, R. W.; Tompkins, R. G. Anal. Chem.2004, 76, 1134-1144.
(12) Diamandis, E. P. Mol. Cell. Proteomics 2004, 3, 367-378.(13) Diamandis, E. P.; van der Merwe, D. E. Clin. Cancer Res. 2005,
11, 963-965.(14) Tao, W. A.; Aebersold, R. Curr. Opin. Biotechnol. 2003, 14, 110-
118.(15) Qian, W. J.; Monroe, M. E.; Liu, T.; Jacobs, J. M.; Anderson, G. A.;
Shen, Y.; Moore, R. J.; Anderson, D. J.; Zhang, R.; Calvano, S. E.;Lowry, S. F.; Xiao, W.; Moldawer, L. L.; Davis, R. W.; Tompkins,R. G.; Camp, D. G., 2nd; Smith, R. D. Mol. Cell. Proteomics 2005.
(16) MacCoss, M. J.; Wu, C. C.; Liu, H.; Sadygov, R.; Yates, J. R., 3rdAnal. Chem. 2003, 75, 6912-6921.
(17) Laronga, C.; Becker, S.; Watson, P.; Gregory, B.; Cazares, L.; Lynch,H.; Perry, R. R.; Wright, G. L., Jr.; Drake, R. R.; Semmes, O. J. Dis.Markers 2003, 19, 229-238.
(18) Vlahou, A.; Laronga, C.; Wilson, L.; Gregory, B.; Fournier, K.;McGaughey, D.; Perry, R. R.; Wright, G. L., Jr.; Semmes, O. J. Clin.Breast Cancer 2003, 4, 203-209.
(19) Xiao, X. Y.; Tang, Y.; Wei, X. P.; He, D. C. Biomed. Environ Sci.2003, 16, 140-148.
(20) Zhukov, T. A.; Johanson, R. A.; Cantor, A. B.; Clark, R. A.; Tockman,M. S. Lung Cancer 2003, 40, 267-279.
(21) Qu, Y.; Adam, B. L.; Yasui, Y.; Ward, M. D.; Cazares, L. H.;Schellhammer, P. F.; Feng, Z.; Semmes, O. J.; Wright, G. L., Jr.Clin. Chem. 2002, 48, 1835-1843.
(22) Li, J.; White, N.; Zhang, Z.; Rosenzweig, J.; Mangold, L. A.; Partin,A. W.; Chan, D. W. J. Urol. 2004, 171, 1782-1787.
(23) Koopmann, J.; Zhang, Z.; White, N.; Rosenzweig, J.; Fedarko, N.;Jagannath, S.; Canto, M. I.; Yeo, C. J.; Chan, D. W.; Goggins, M.Clin. Cancer Res. 2004, 10, 860-868.
(24) Rosty, C.; Christa, L.; Kuzdzal, S.; Baldwin, W. M.; Zahurak, M.L.; Carnot, F.; Chan, D. W.; Canto, M.; Lillemoe, K. D.; Cameron,J. L.; Yeo, C. J.; Hruban, R. H.; Goggins, M. Cancer Res. 2002, 62,1868-1875.
(25) Zhang, Y. F.; Wu, D. L.; Guan, M.; Liu, W. W.; Wu, Z.; Chen, Y.M.; Zhang, W. Z.; Lu, Y. Clin. Biochem. 2004, 37, 772-779.
(26) Ebert, M. P.; Meuer, J.; Wiemer, J. C.; Schulz, H. U.; Reymond,M. A.; Traugott, U.; Malfertheiner, P.; Rocken, C. J. Proteome Res.2004, 3, 1261-1266.
(27) Chen, Y. D.; Zheng, S.; Yu, J. K.; Hu, X. Clin. Cancer Res. 2004,10, 8380-8385.
(28) Yu, J. K.; Chen, Y. D.; Zheng, S. World J. Gastroenterol. 2004, 10,3127-3131.
(29) Junker, K.; Gneist, J.; Melle, C.; Driesch, D.; Schubert, J.; Claussen,U.; Von Eggeling, F. Int. J. Mol. Med. 2005, 15, 285-290.
(30) Won, Y.; Song, H. J.; Kang, T. W.; Kim, J. J.; Han, B. D.; Lee, S. W.Proteomics 2003, 3, 2310-2316.
Pattern in Proteomic Biomarker Discovery reviews
Journal of Proteome Research • Vol. 4, No. 4, 2005 1153

(31) Liu, J.; Zheng, S.; Yu, J. K.; Zhang, J. M.; Chen, Z. J. Zhejiang Univ.Sci. B 2005, 6, 4-10.
(32) Poon, T. C.; Yip, T. T.; Chan, A. T.; Yip, C.; Yip, V.; Mok, T. S.;Lee, C. C.; Leung, T. W.; Ho, S. K.; Johnson, P. J. Clin. Chem. 2003,49, 752-760.
(33) Kang, X.; Xu, Y.; Wu, X.; Liang, Y.; Wang, C.; Guo, J.; Wang, Y.;Chen, M.; Wu, D.; Bi, S.; Qiu, Y.; Lu, P.; Cheng, J.; Xiao, B.; Hu,L.; Gao, X.; Liu, J.; Song, Y.; Zhang, L.; Suo, F.; Chen, T.; Huang,Z.; Zhao, Y.; Lu, H.; Pan, C.; Tang, H. Clin. Chem. 2005, 51, 56-64.
(34) Yip, T. T.; Chan, J. W.; Cho, W. C.; Wang, Z.; Kwan, T. L.; Law, S.C.; Tsang, D. N.; Chan, J. K.; Lee, K. C.; Cheng, W. W.; Ma, V. W.;Yip, C.; Lim, C. K.; Ngan, R. K.; Au, J. S.; Chan, A.; Lim, W. W.Clin. Chem. 2005, 51, 47-55.
(35) Cadieux, P. A.; Beiko, D. T.; Watterson, J. D.; Burton, J. P.; Howard,J. C.; Knudsen, B. E.; Gan, B. S.; McCormick, J. K.; Chambers, A.F.; Denstedt, J. D.; Reid, G. J. Clin. Lab Anal. 2004, 18, 170-175.
(36) Schwegler, E. E.; Cazares, L.; Steel, L. F.; Adam, B. L.; Johnson,D. A.; Semmes, O. J.; Block, T. M.; Marrero, J. A.; Drake, R. R.Hepatology 2005, 41, 634-642.
(37) Zhu, X. D.; Zhang, W. H.; Li, C. L.; Xu, Y.; Liang, W. J.; Tien, P.World J. Gastroenterol. 2004, 10, 2327-2329.
(38) Baggerly, K. A.; Morris, J. S.; Coombes, K. R. Bioinformatics 2004,20, 777-785.
(39) Pearl, D. C. Lancet 2002, 360, 169-170; author reply 170-161.(40) Ransohoff, D. F. Nat. Rev. Cancer 2004, 4, 309-314.(41) Ransohoff, D. F. Nat. Rev. Cancer 2005, 5, 142-149.(42) Zhang, Z.; Bast, R. C., Jr.; Yu, Y.; Li, J.; Sokoll, L. J.; Rai, A. J.;
Rosenzweig, J. M.; Cameron, B.; Wang, Y. Y.; Meng, X. Y.;Berchuck, A.; Van Haaften-Day, C.; Hacker, N. F.; de Bruijn, H.W.; van der Zee, A. G.; Jacobs, I. J.; Fung, E. T.; Chan, D. W. CancerRes. 2004, 64, 5882-5890.
(43) Liggett, W. S.; Barker, P. E.; Semmes, O. J.; Cazares, L. H. Dis.Markers 2004, 20, 295-307.
(44) Le, L.; Chi, K.; Tyldesley, S.; Flibotte, S.; Diamond, D. L.; Kuzyk,M. A.; Sadar, M. D. Clin. Chem. 2005.
(45) Woong-Shick, A.; Sung-Pil, P.; Su-Mi, B.; Joon-Mo, L.; Sung-Eun,N.; Gye-Hyun, N.; Young-Lae, C.; Ho-Sun, C.; Heung-Jae, J.;Chong-Kook, K.; Young-Wan, K.; Byoung-Don, H.; Hyun-Sun, J.Cancer Sci. 2005, 96, 197-201.
(46) Rai, A. J.; Zhang, Z.; Rosenzweig, J.; Shih Ie, M.; Pham, T.; Fung,E. T.; Sokoll, L. J.; Chan, D. W. Arch. Pathol. Lab. Med. 2002, 126,1518-1526.
(47) Malik, G.; Ward, M. D.; Gupta, S. K.; Trosset, M. W.; Grizzle, W.E.; Adam, B. L.; Diaz, J. I.; Semmes, O. J. Clin. Cancer Res. 2005,11, 1073-1085.
(48) Fung, E. T.; Yip, T. T.; Lomas, L.; Wang, Z.; Yip, C.; Meng, X. Y.;Lin, S.; Zhang, F.; Zhang, Z.; Chan, D. W.; Weinberger, S. R. Int.J. Cancer 2005.
(49) Paradis, V.; Degos, F.; Dargere, D.; Pham, N.; Belghiti, J.; Degott,C.; Janeau, J. L.; Bezeaud, A.; Delforge, D.; Cubizolles, M.;Laurendeau, I.; Bedossa, P. Hepatology 2005, 41, 40-47.
(50) Hunter, C.; Basa, L. iScience Proteomics Technology Note (AppliedBiosystems Application Note) 2004, 1-3.
(51) Colombo, M.; Sirtori, F. R.; Rizzo, V. Rapid Commun. MassSpectrom. 2004, 18, 511-517.
(52) Eckers, C.; Wolff, J. C.; Haskins, N. J.; Sage, A. B.; Giles, K.;Bateman, R. Anal. Chem. 2000, 72, 3683-3688.
(53) Charles, L. Rapid Commun. Mass Spectrom. 2003, 17, 1383-1388.(54) Pelander, A.; Ojanpera, I.; Laks, S.; Rasanen, I.; Vuori, E. Anal.
Chem. 2003, 75, 5710-5718.(55) Sleno, L.; Volmer, D. A.; Marshall, A. G. J. Am. Soc. Mass Spectrom.
2005, 16, 183-198.(56) Spengler, B. J. Am. Soc. Mass Spectrom. 2004, 15, 703-714.(57) Zubarev, R. A.; Kelleher, N. L.; McLafferty, F. W. J. Am. Chem.
Soc. 1998, 120, 3265-3266.(58) Kruger, N. A.; Zubarev, R. A.; Horn, D. M.; McLafferty, F. W. Int.
J. Mass Spectrom. 1999, 187, 787-793.(59) Kelleher, N. L.; Zubarev, R. A.; Bush, K.; Furie, B.; Furie, B. C.;
McLafferty, F. W.; Walsh, C. T. Anal. Chem. 1999, 71, 4250-4253.(60) Shi, S. D.; Hemling, M. E.; Carr, S. A.; Horn, D. M.; Lindh, I.;
McLafferty, F. W. Anal. Chem. 2001, 73, 19-22.(61) Horn, D. M.; Zubarev, R. A.; McLafferty, F. W. J. Am. Soc. Mass
Spectrom. 2000, 11, 320-332.
(62) Syka, J. E.; Coon, J. J.; Schroeder, M. J.; Shabanowitz, J.; Hunt, D.F. Proc. Natl. Acad. Sci. U.S.A. 2004, 101, 9528-9533.
(63) Listgarten, J.; Emili, A. Mol. Cell. Proteomics 2005.(64) Carroll, J. A.; Beavis, R. C. Rapid Commun. Mass Spectrom. 1996,
13, 1683-1687.(65) Gonzalez, R. C.; Woods, R. E. Digital Image Processing; Addison-
Wesley: Reading, MA, 2002.(66) Smith, S. W. The Scientist and Engineer’s Guide to Digital Signal
Processing; California Technical Publishing: San Deigo, CA,1997.
(67) Radulovic, D.; Jelveh, S.; Ryu, S.; Hamilton, T. G.; Foss, E.; Mao,Y.; Emili, A. Mol. Cell. Proteomics 2004, 3, 984-997.
(68) Conrads, T. P.; Fusaro, V. A.; Ross, S.; Johann, D.; Rajapakse, V.;Hitt, B. A.; Steinberg, S. M.; Kohn, E. C.; Fishman, D. A.; Whitely,G.; Barrett, J. C.; Liotta, L. A.; Petricoin, E. F., 3rd; Veenstra, T. D.Endocr. Relat. Cancer 2004, 11, 163-178.
(69) Wiener, M. C.; Sachs, J. R.; Deyanova, E. G.; Yates, N. A. Anal.Chem. 2004, 76, 6085-6096.
(70) Mani, D. R.; Gillette, M. A. In Next Generation of Data-MiningApplications; Kantardzic, M., Zurada, J., Eds.; Wiley-IEEE Press:2005.
(71) Sauve, A. C.; Speed, T. P., Baltimore, MD 2004.(72) Senko, M. W.; Beu, S. C.; McLafferty, F. W. J. Am. Soc. Mass
Spectrom. 1995, 6, 52-56.(73) Senko, M. W.; Beu, S. C.; McLafferty, F. W. J. Am. Soc. Mass
Spectrom. 1995, 6, 229-233.(74) Yasui, Y.; Pepe, M.; Thompson, M. L.; Adam, B. L.; Wright, G. L.,
Jr.; Qu, Y.; Potter, J. D.; Winget, M.; Thornquist, M.; Feng, Z.Biostatistics 2003, 4, 449-463.
(75) Andreev, V. P.; Rejtar, T.; Chen, H. S.; Moskovets, E. V.; Ivanov,A. R.; Karger, B. L. Anal. Chem. 2003, 75, 6314-6326.
(76) Tibshirani, R.; Hastie, T.; Narasimhan, B.; Soltys, S.; Shi, G.; Koong,A.; Le, Q. T. Bioinformatics 2004, 20, 3034-3044.
(77) Adam, B. L.; Qu, Y.; Davis, J. W.; Ward, M. D.; Clements, M. A.;Cazares, L. H.; Semmes, O. J.; Schellhammer, P. F.; Yasui, Y.; Feng,Z.; Wright, G. L., Jr. Cancer Res. 2002, 62, 3609-3614.
(78) Yanagisawa, K.; Shyr, Y.; Xu, B. J.; Massion, P. P.; Larsen, P. H.;White, B. C.; Roberts, J. R.; Edgerton, M.; Gonzalez, A.; Nadaf, S.;Moore, J. H.; Caprioli, R. M.; Carbone, D. P. Lancet 2003, 362,433-439.
(79) Bylund, D.; Danielsson, R.; Malmquist, G.; Markides, K. E. J.Chromatogr. A 2002, 961, 237-244.
(80) Randolph, T. W.; Yasui, Y. In UW Biostatistics Working PaperSeries; University of Washington Press: Seattle, WA 2004.
(81) Gelman, A.; Carlin, J. B.; Stern, H. S.; Rubin, D. B. Bayesian DataAnalysis; CRC Press: Boca Raton, FL 2003.
(82) Banfield, J. D.; Raftery, A. E. Biometrics 1993, 49, 803-821.(83) Kass, R. E.; Raftery, A. E. J. Am. Stat. Assoc. 1995, 90, 773-795.(84) NCI-FDA, 2002.(85) Golub, T. R.; Slonim, D. K.; Tamayo, P.; Huard, C.; Gaasenbeek,
M.; Mesirov, J. P.; Coller, H.; Loh, M. L.; Downing, J. R.; Caligiuri,M. A.; Bloomfield, C. D.; Lander, E. S. Science 1999, 286, 531-537.
(86) Hastie, T.; Tibshirani, R.; Friedman, J. H. Elements of StatisticalLearning; Springer-Verlag: New York, 2001.
(87) Mitchell, T. M. Machine Learning; McGraw-Hill, New York 1997.(88) Brieman, L.; Friedman, J.; Olshen, R.; Stone, C. Classification and
Regression Trees; Wadsworth: Belmont CA 1984.(89) Haykin, S. Neural Networks: A Comprehensive Foundation, 2nd
ed.; Prentice Hall: New York, 1998.(90) Meretakis, D.; Wuthrich, B. 1999; 165-174.(91) Koza, J. R. Genetic Programming: On the Programming of
Computers by Means of Natural Selection; MIT Press: Cambridge,1992.
(92) Christianini, N.; Shawe-Taylor, J. An Introduction to SupportVector Machines and Other Kernel-Based Learning Methods;Cambridge University Press: New York, 2000.
(93) Li, J.; Zhang, Z.; Rosenzweig, J.; Wang, Y. Y.; Chan, D. W. Clin.Chem. 2002, 48, 1296-1304.
(94) Jobson, J. D. Applied Multivariate Data Analysis; Springer-Verlag: New York, 1996.
(95) Sorace, J. M.; Zhan, M. BMC Bioinformatics 2003, 4, 24.
PR0500962
reviews Gillette et al.
1154 Journal of Proteome Research • Vol. 4, No. 4, 2005