Embed Size (px)
Citation preview
Pilot Study: Road–Tyre Friction Prediction byStatistical Methods and Data Fusion
Lauri Loven⇤, Ekaterina Gilman⇤, Jukka Riekki⇤, Esa Laara†, Timo Sukuvaara‡, Kari Maenpaa‡, withMikko J. Sillanpaa† and Susanna Pirttikangas⇤
⇤ Center for Ubiquitous ComputingUniversity of Oulu
Oulu, Finland,{first.last}@oulu.fi
† Applied Mathematics and StatisticsUniversity of Oulu
Oulu, Finland,{first.last}@oulu.fi
‡ Arctic Research CenterFinnish Meteorological Institute
Sodankyla, Finland,{first.last}@fmi.fi
Abstract—In this article, we report a pilot study to predicttyre–road friction by data fusion and statistical inference meth-ods. We trained a prediction model, based on linear regression,with weather data, traffic data and official road database infor-mation as covariates, and friction measurements of four separatetest runs as ground truth. We assessed the validity of the modelby standard diagnostics as well as cross validation. The resultsindicated that the method is promising; however, more data arerequired to ensure the model is not overfitted.
I. INTRODUCTION
Weather prediction is of great interest for many domains.Transportation, in particular, values weather prediction as itimproves driving safety and sustainability and, in general,helps to reduce costs [1], [2].
Predicting the tire–road friction coefficient is of particularinterest, as slippery roads are demanding for both the roadmaintenance authorities as well as the drivers. Friction dependson diverse factors like weather, road material and trafficdensity, varying from one location to another. However, itis very challenging to provide reliable online predictions offriction by ordinary measurement approaches. New methodsthus need to be developed to predict friction in differentlocations from the data available either from environmentalsensors or from drivers.
As this research contains theoretical uncertainties (due tosmall data set sizes), we perform an exploratory study with theintent of building a simple prediction model and measuring itsquality.
II. DATA
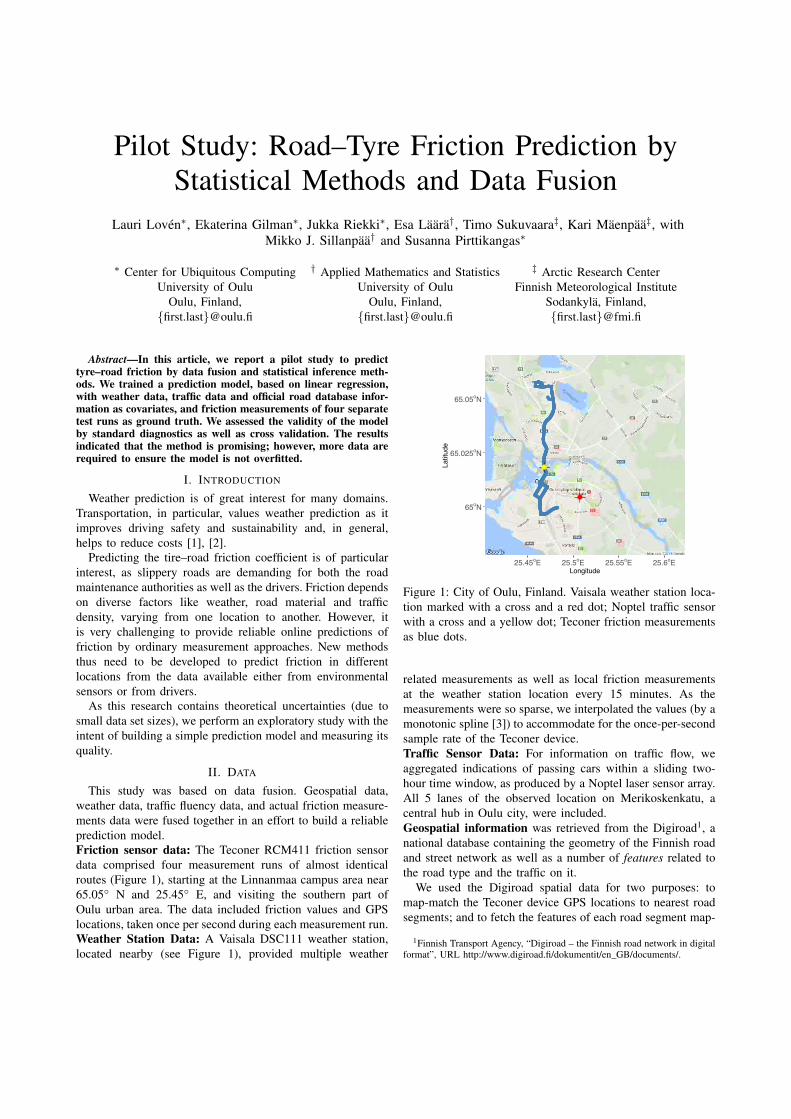
This study was based on data fusion. Geospatial data,weather data, traffic fluency data, and actual friction measure-ments data were fused together in an effort to build a reliableprediction model.Friction sensor data: The Teconer RCM411 friction sensordata comprised four measurement runs of almost identicalroutes (Figure 1), starting at the Linnanmaa campus area near65.05� N and 25.45� E, and visiting the southern part ofOulu urban area. The data included friction values and GPSlocations, taken once per second during each measurement run.Weather Station Data: A Vaisala DSC111 weather station,located nearby (see Figure 1), provided multiple weather
65oN
65.025oN
65.05oN
25.45oE 25.5oE 25.55oE 25.6oELongitude
Latit
ude
Figure 1: City of Oulu, Finland. Vaisala weather station loca-tion marked with a cross and a red dot; Noptel traffic sensorwith a cross and a yellow dot; Teconer friction measurementsas blue dots.
related measurements as well as local friction measurementsat the weather station location every 15 minutes. As themeasurements were so sparse, we interpolated the values (by amonotonic spline [3]) to accommodate for the once-per-secondsample rate of the Teconer device.Traffic Sensor Data: For information on traffic flow, weaggregated indications of passing cars within a sliding two-hour time window, as produced by a Noptel laser sensor array.All 5 lanes of the observed location on Merikoskenkatu, acentral hub in Oulu city, were included.Geospatial information was retrieved from the Digiroad1, anational database containing the geometry of the Finnish roadand street network as well as a number of features related tothe road type and the traffic on it.
We used the Digiroad spatial data for two purposes: tomap-match the Teconer device GPS locations to nearest roadsegments; and to fetch the features of each road segment map-
1Finnish Transport Agency, “Digiroad – the Finnish road network in digitalformat”, URL http://www.digiroad.fi/dokumentit/en GB/documents/.
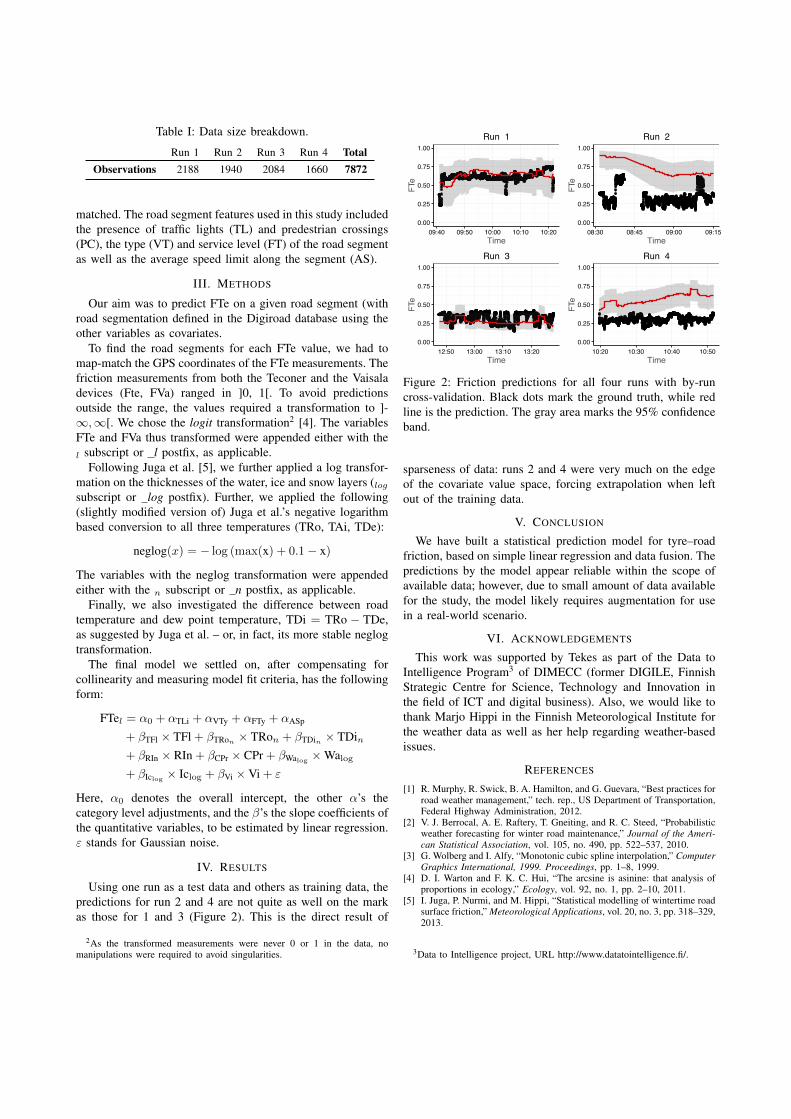
Table I: Data size breakdown.
Run 1 Run 2 Run 3 Run 4 TotalObservations 2188 1940 2084 1660 7872
matched. The road segment features used in this study includedthe presence of traffic lights (TL) and predestrian crossings(PC), the type (VT) and service level (FT) of the road segmentas well as the average speed limit along the segment (AS).
III. METHODS
Our aim was to predict FTe on a given road segment (withroad segmentation defined in the Digiroad database using theother variables as covariates.
To find the road segments for each FTe value, we had tomap-match the GPS coordinates of the FTe measurements. Thefriction measurements from both the Teconer and the Vaisaladevices (Fte, FVa) ranged in ]0, 1[. To avoid predictionsoutside the range, the values required a transformation to ]-1,1[. We chose the logit transformation2 [4]. The variablesFTe and FVa thus transformed were appended either with thel
subscript or l postfix, as applicable.Following Juga et al. [5], we further applied a log transfor-
mation on the thicknesses of the water, ice and snow layers (log
subscript or log postfix). Further, we applied the following(slightly modified version of) Juga et al.’s negative logarithmbased conversion to all three temperatures (TRo, TAi, TDe):
neglog(x) = � log (max(x) + 0.1� x)
The variables with the neglog transformation were appendedeither with the
n
subscript or n postfix, as applicable.Finally, we also investigated the difference between road
temperature and dew point temperature, TDi = TRo � TDe,as suggested by Juga et al. – or, in fact, its more stable neglogtransformation.
The final model we settled on, after compensating forcollinearity and measuring model fit criteria, has the followingform:
FTel
= ↵
0
+ ↵TLi + ↵VTy + ↵FTy + ↵ASp
+ �TFl ⇥ TFl + �TRon ⇥ TRon
+ �TDin ⇥ TDin
+ �RIn ⇥ RIn + �CPr ⇥ CPr + �Walog
⇥ Walog
+ �Iclog
⇥ Iclog
+ �Vi ⇥ Vi + "
Here, ↵
0
denotes the overall intercept, the other ↵’s thecategory level adjustments, and the �’s the slope coefficients ofthe quantitative variables, to be estimated by linear regression." stands for Gaussian noise.
IV. RESULTS
Using one run as a test data and others as training data, thepredictions for run 2 and 4 are not quite as well on the markas those for 1 and 3 (Figure 2). This is the direct result of
2As the transformed measurements were never 0 or 1 in the data, nomanipulations were required to avoid singularities.
0.00
0.25
0.50
0.75
1.00
09:40 09:50 10:00 10:10 10:20Time
FTe
Run 1
0.00
0.25
0.50
0.75
1.00
08:30 08:45 09:00 09:15Time
FTe
Run 2
0.00
0.25
0.50
0.75
1.00
12:50 13:00 13:10 13:20Time
FTe
Run 3
0.00
0.25
0.50
0.75
1.00
10:20 10:30 10:40 10:50Time
FTe
Run 4
Figure 2: Friction predictions for all four runs with by-runcross-validation. Black dots mark the ground truth, while redline is the prediction. The gray area marks the 95% confidenceband.
sparseness of data: runs 2 and 4 were very much on the edgeof the covariate value space, forcing extrapolation when leftout of the training data.
V. CONCLUSION
We have built a statistical prediction model for tyre–roadfriction, based on simple linear regression and data fusion. Thepredictions by the model appear reliable within the scope ofavailable data; however, due to small amount of data availablefor the study, the model likely requires augmentation for usein a real-world scenario.
VI. ACKNOWLEDGEMENTS
This work was supported by Tekes as part of the Data toIntelligence Program3 of DIMECC (former DIGILE, FinnishStrategic Centre for Science, Technology and Innovation inthe field of ICT and digital business). Also, we would like tothank Marjo Hippi in the Finnish Meteorological Institute forthe weather data as well as her help regarding weather-basedissues.
REFERENCES
[1] R. Murphy, R. Swick, B. A. Hamilton, and G. Guevara, “Best practices forroad weather management,” tech. rep., US Department of Transportation,Federal Highway Administration, 2012.
[2] V. J. Berrocal, A. E. Raftery, T. Gneiting, and R. C. Steed, “Probabilisticweather forecasting for winter road maintenance,” Journal of the Ameri-
can Statistical Association, vol. 105, no. 490, pp. 522–537, 2010.[3] G. Wolberg and I. Alfy, “Monotonic cubic spline interpolation,” Computer
Graphics International, 1999. Proceedings, pp. 1–8, 1999.[4] D. I. Warton and F. K. C. Hui, “The arcsine is asinine: that analysis of
proportions in ecology,” Ecology, vol. 92, no. 1, pp. 2–10, 2011.[5] I. Juga, P. Nurmi, and M. Hippi, “Statistical modelling of wintertime road
surface friction,” Meteorological Applications, vol. 20, no. 3, pp. 318–329,2013.
3Data to Intelligence project, URL http://www.datatointelligence.fi/.