Embed Size (px)
Citation preview

1750 Massachusetts Avenue, NW | Washington, DC 20036-1903 USA | +1.202.328.9000 | www.piie.com
PIIE BRIEFING 20-2
Euijin Jung, Arvind Subramanian, and Steven R. Weisman, editors
September 2020
A Wary Partnership: Future of US-India Economic Relations

2 PIIE BR 20-2 | SEPTEMBER 2020
Cover image: Eduardo Munoz/REUTERS
Contents
INTRODUCTION 3 Arvind Subramanian and Steven R. Weisman
1 HAS INDIA OCCUPIED THE EXPORT SPACE VACATED BY CHINA? 6 21ST CENTURY EXPORT PERFORMANCE AND POLICY IMPLICATIONS Shoumitro Chatterjee and Arvind Subramanian
2 INDIA’S WEAK LINKS TO AMERICA’S SUPPLY CHAINS 27 Mary E. Lovely and Yimin Yi
3 POTENTIAL TRADE BETWEEN INDIA AND THE UNITED STATES 47 Euijin Jung
4 HAS INDIA’S TRADE NEGOTIATING STRATEGY HIT A DEAD END? 70 Jeffrey J. Schott
5 US-INDIA LABOR MIGRATION: A $117 BILLION BENEFIT TO THE 85 UNITED STATES Jacob Funk Kirkegaard
6 THE NEW TRIANGLE: CAN THE UNITED STATES ENCOURAGE INDIA 119 TO BECOME A COUNTERWEIGHT TO CHINA? Steven R. Weisman

3 PIIE BR 20-2 | SEPTEMBER 2020
IntroductionArvind Subramanian and Steven R. Weisman
A world afflicted by pandemic and economic crises has led many if not most countries to turn inward and away from the global trading and financial system. India and the United States are no exceptions. Despite some recent reforms, India has reversed a three-decade-long trend of steady liberalization, by imposing curbs on imports and foreign investment and subsidizing domestic production; and under President Donald Trump, the United States has aggressively pursued an economic approach he and others have appropriately labeled “America First.”
These policies of economic nationalism may be seductive and understandable in times of economic stress. But as the essays in this volume demonstrate, they have tended historically to impede rather than enhance economic growth. Unfortunately, the COVID-19 plague has, if anything, accelerated economic nationalism, jeopardizing the future of an era of global economic cooperation that has, on balance, delivered more advantages than costs—lifting hundreds of millions out of poverty and benefiting consumers in countries rich and poor, though at the cost of some significant job displacement in advanced and developing countries.
In this PIIE Briefing, a variety of authors trace the complex economic relationship between India and the rest of the world, focusing on the United States. They emphasize the contrast between political ties between Washington and New Delhi, which have steadily improved since the 1980s, culminating in the landmark nuclear agreement in 2005, and economic ties, which have lagged despite intensive negotiations and pledges of cooperation.
The current moment of uncertainty and turbulence may not seem to be the time for a new collaborative chapter in this frequently contentious economic relationship. But the authors argue instead that a crisis can compel leaders of both countries to rethink their failed policies and expand, not reduce, their economic cooperation. By examining the record of international economic policies in the world’s two most populous democracies, this volume can illuminate a path forward. There are no illusions in these essays about the costs and obstacles. Their assumption is that learning the lessons of the past can guide the way for progress in the future.
Looming undeniably over that path forward is China, which has emerged in the last 40 years as the preeminent economic and export superpower in Asia and indeed the world. For their own reasons, India and the United States see China’s rise as a concern that has deepened military cooperation, with Washington viewing India as a potential counterweight to China in East Asia and with India looking to Washington for military assistance in the wake of Beijing’s aggression in the Himalayan border with India.
Reinforcing that hope in Washington, in very recent years, is that China’s ability to expand its share of world merchandise exports has stalled because of increased costs in its labor-intensive export sector, among other factors,
Arvind Subramanian, nonresident senior fellow at the Peterson Institute for International Economics, is professor of economics at Ashoka University and founding director of the Ashoka Center for Economic Policy, Haryana, India. He was chief economic adviser to the Government of India between 2014 and 2018. Steven R. Weisman is vice president for publications and communications at the Peterson Institute for International Economics. He served as New Delhi bureau chief for the New York Times in 1985–88.

4 PIIE BR 20-2 | SEPTEMBER 2020
leading President Xi Jinping and his team to emphasize domestic consumption rather than exports. But can India fulfill the hopes of its friends around the world that it can become an export powerhouse like China? In their opening essay, Shoumitro Chatterjee and Arvind Subramanian raise the issue of whether India will be able to step into the “export space” as Vietnam, Bangladesh, Mexico, and other countries have done on the margins. An important and innovative point in their essay is that, despite India’s reputation as relying principally on domestic factors of growth, the record shows that trade has been an important cause of India’s economic health in recent decades. But the authors also cautiously conclude that India has a long way to go before it can become a major exporter of manufactured goods. They recommend that India focus instead on its record of export of business and commercial services, particularly those dependent on India’s innovative high-technology sector.
Mary Lovely and Yimin Yi, sounding a similar theme, also note that the trade war between China and the United States should have opened opportunities for India, enabling investors to take advantage of Prime Minister Narendra Modi’s commercial reforms making India more hospitable to business expansion. Their chapter assesses this potential through a comparison of current US trade and investment patterns with the two countries. A main conclusion drawn from the data is that the profile of Indian exports to the United States differs systematically from that of China, limiting Indian capacity to seize an advantage in the sectors dominated by multinational supply chains. Although India has steadily reduced some trade and investment barriers, inward foreign investment has grown slowly. India’s services sector, particularly in information, telecommunications, and other high-technology sectors has drawn foreign investment, but manufacturing has lagged. Accordingly, despite the opportunity presented by the US-China trade war, India is not yet poised to supplant China in American supply chains.
Focusing more on the specific area of trade, Euijin Jung employs a gravity model to illustrate that in light of the size, diverse economies, and commonalities between India and the United States, trade in goods and services between the two countries has performed far below potential at least since the 1970s. Her research presents a series of Indian policies, including export and import barriers, curbs on foreign investments, poor infrastructure, and costly domestic subsidies, that account for the poor performance on trade. And her study considers the sources of remaining trade frictions between the two countries, including the Trump administration’s removal of special preferences to India’s exports granted because of its status as a developing country.
In the same vein, Jeffrey J. Schott traces the history of inward-oriented trade policies adopted by India, despite the fact that India was one of the 23 founding signatories of the General Agreement on Tariffs and Trade (GATT) in 1947 and has actively participated in eight rounds of multilateral trade negotiations under the GATT and its successor, the World Trade Organization (WTO). For all these historic commitments, India has stuck with its mercantilist strategy of seeing exports as good and imports as bad, an approach that has hampered both. Indian domestic subsidies and other efforts to shield domestic manufacturers and farmers from international competition has raised the cost of goods produced in India and undercut its competitiveness. India, he maintains, has

5 PIIE BR 20-2 | SEPTEMBER 2020
“painted itself into a corner” and will be losing out even more to China because of its resistance to more open trade relations with countries in the region and throughout the world.
The concluding essays in this volume deal with issues outside the realm of trade and commercial ties. Jacob Funk Kirkegaard assesses the enormous economic impact of the 4.5 million Indian nationals living in the United States, the single largest overseas Indian community in the world. Small wonder that the Trump administration’s crackdown on work, family, and student visas has roiled US-India relations as much as any of these business-related matters. Indian immigration, despite the current US attitudes, is vital to many economic sectors in the United States, from healthcare to high technology, civil services, and entrepreneurship, making the Indian population one of the most successful. For India, the United States is the source of $13 billion in overseas remittances. An open attitude toward immigration is essential for both countries, he argues.
Finally, Steven R. Weisman fills in the details of what he describes as the ongoing “triangular” relationship involving the United States, India, and China, concluding that if Washington seeks to play India off against its neighbor, India will seek to move closer to Washington to respond to China. His essay traces the history of US-India political, security, and economic relations since India’s independence from British rule in 1947, arguing that these are inextricably intertwined. Five previous US presidents, two Democrats and three Republicans, have tried to draw India closer to Washington, but until Trump they were careful not to get into a severe economic confrontation over trade and immigration. The Trump-Modi relationship has been highlighted by mutual praise and visits, but the friendly talk has failed to resolve economic disagreements. Nevertheless, what India sees as a threat from China, underscored by a border clash in early 2020, may give the United States more leverage to bring India into closer political influence.
The Peterson Institute for International Economics is proud of its history of examining US-India economic relations. Many scholars and writers helped the authors sharpen their arguments in these essays, and they are thanked in the individual pieces published in this volume. But PIIE wishes in particular to thank the Smith Richardson Foundation for its support of this project, which had its inception some years ago and has had to be updated as current events changed calculations in both countries. The authors and editors hope that this volume will help illuminate ways that these relations can improve despite the global turmoil over combating the COVID-19 pandemic and the economic crisis that may take years to overcome.

6 PIIE BR 20-2 | SEPTEMBER 2020
1 Has India Occupied the Export Space Vacated by China? 21st Century Export Performance and Policy ImplicationsShoumitro Chatterjee and Arvind Subramanian
THE CHINA OPPORTUNITY AFTER THE LAST GLOBAL FINANCIAL CRISIS
An important question of the last decade has been whether India can occupy the export space ceded by China. After the last global financial crisis (GFC), India, among other countries, scented a major trading opportunity that would help sustain its growth momentum. India’s annual economic growth had been rapid leading up to the GFC (nearly 8.5 percent), as had its growth in trade (about 15 percent). Global growth and trade declined sharply after the GFC.
The hope was that a new opportunity would be created by China or rather from China’s success-based exit from low-skilled manufacturing. China’s rapid economic growth, propelled by its productivity and export boom, led to high rates of income and wage growth. At some point, it was expected that the Lewis Curve would turn up, and China’s rising wages would gradually make it less competitive in a range of less-skilled activities (Das and N’Diaye 2013). Various estimates suggest that real wages in China have risen sharply since 2003–04, especially for low-skilled manufacturing jobs (Meiyan 2010, Zhang et al. 2011). As a result, China would have to cede export space to other, less rich, lower-wage countries, such as India.
The premise for this potential export opportunity was India’s own export performance leading up to the GFC. India posted rapid rates of export growth, both overall and in manufacturing, between 2000 and 2008 (figure 1.1). The average annual rate of growth was 21.5 percent for total exports and 19.8 percent for manufacturing exports, compared with 12.5 and 11.6 percent, respectively, for the world as a whole. As a result, India’s share of global merchandise exports rose from 0.64 percent in 2000 to 1.28 percent in 2008, and its share of global manufacturing exports rose from 0.62 to 1.2 percent. For a country of India’s size, these market shares are still small (China’s global manufacturing export share in 2008 was 12.8 percent, 10 times that of India), but the change from 2000—a doubling of global market share—was striking, holding out the promise of further improvement.
Against this background, this chapter addresses three questions:
• Did China create an export opportunity?
• If so, was India able to exploit it?
• What are the implications for an Indian globalization strategy going forward?
Shoumitro Chatterjee is assistant professor of economics at Pennsylvania State University and visiting fellow at the Centre for Policy Research, New Delhi. Arvind Subramanian, nonresident senior fellow at the Peterson Institute for International Economics, is professor of economics at Ashoka University and founding director of the Ashoka Center for Economic Policy, The authors are grateful to Fred Bergsten, Devesh Kapur, Jacob Kirkegaard, Aaditya Mattoo, Marcus Noland, Jeff Schott, Nick Lardy, Steve Weisman, and Nicolas Véron for very helpful comments; to Gordon Hanson for pointing out useful data sources; and to David Xu for excellent research assistance. They are particularly grateful to Josh Felman for several discussions on this topic over many years; his comments immeasurably improved this chapter.

7 PIIE BR 20-2 | SEPTEMBER 2020
share of world market10%
6
20
.64 .70 .76 .79 .85 .96 1.02 1.21 1.28
4.92 5.40 6.23 7.00 7.70 8.52 9.18 9.86 9.86
average annual growth of exports(percent)
2000 2001 2002 2003 2004 2005 2006 2007 2008
.62 .66 .71 .73 .78 .90 .92 1.11 1.20
5.53 6.08 7.058.02
8.9910.30
11.31 12.16 12.78
2000 2001 2002 2003 2004 2005 2006 2007 2008
Figure 1.1Annual growth and shares of global merchandise and manufacturing exports by India and China among the world’s top 50 exporters, 2000–08
a. Merchandise exports
Note: Export growth is calculated over previous 5-year rolling windows.Source: See appendix 1A; Chatterjee and Subramanian (2020).
40
20
0
–20
40
20
0
–20
China
China
World
World
India
India
4
8
10%
6
20
4
8
average annual growth of exports(percent)
b. Manufacturing exports

8 PIIE BR 20-2 | SEPTEMBER 2020
The chapter’s main findings and conclusions are the following. China did cede export space in labor-intensive sectors, but India did not occupy it, for two reasons. First, productivity and export competitiveness deteriorated broadly, which is reflected in a significant moderation of India’s global market share gains post-GFC.
The stellar pre-GFC performance, including rising global market share, owed to the accumulated reforms of the late 1990s and 2000s (Arnold et al. 2016). Its dilution post-GFC owed to a host of policies and factors that affected agriculture (a ban on the sale and purchase of cattle for slaughter), minerals (tightening of regulations in response to corruption scandals), and pharmaceuticals (exposure of malfeasance in key firms); decline of finance in the West affecting demand for India’s specific comparative advantage in services; and an overly strong exchange rate since 2014 and weak actions to address the twin balance sheet problems.
Second, even pre-GFC, there was underperformance in unskilled-labor-intensive sectors such as apparel and footwear, which was obscured by the overall stellar export performance. The annual average gain in India’s global market share was about 10 percent in the high-skilled manufacturing sectors and 8 percent in low-skilled manufacturing sectors between 2000 and 2008. However, most of the market share gained in low-skilled manufacturing was in pearls and precious stones. Since the crude stones are imported and cut and polished stones reexported the sector generates little value added to the economy. India’s pre-GFC gain in global market share of low-skilled manufacturing goods falls by 6 percentage points if we remove pearls and precious stones.
Structurally, India faces two serious barriers to improving long-run export growth: its massive underperformance in unskilled labor manufacturing especially relative to the new export stars and the possibility that even high-skilled exports in services will run into constraints of the supply of skilled labor. Put more sharply, on the one hand, India never exploited the potentially long, horizontal portion of the unskilled-labor Lewis Curve in manufacturing. On the other hand, the skilled-labor Lewis Curve in services is showing signs of turning up prematurely. In contrast, China has exploited the horizontal portion of the manufacturing Lewis Curve for several decades before it started to turn up.
Unexciting as India’s prospects might be for long–run export growth, it cannot afford to give up on an export and trade strategy because that has been one of the key sources of booming growth in the 1990s and 2000s and one cause for the growth slowdown in the 2010s. Meanwhile, the external environment for trade, already worsening since the GFC, might deteriorate further post-COVID-19. With stagnant productivity domestically, India’s exports will move closer in line with this weakening global export growth. An inward turn in policies in the last few years adds salt to the wound and makes India’s export and broader growth prospects seem bleak. Such external and internal developments only evoke a Beckettian sense of “I can’t go on, I must go on” about India’s trade. Because without trade, there will be tepid growth with serious development consequences. And yet to revive trade, an absolutely necessary and far from sufficient condition will be to reverse what now seems a sustained reversal of outward-oriented policies. The new self-reliant growth strategy is almost an oxymoron and reeks of delusional “this time will be different” thinking.

9 PIIE BR 20-2 | SEPTEMBER 2020
Did China Vacate Export Space and Who Occupied It?
China’s rise as the factory of the world is well documented (Lardy 1994, 1998, 2004). Did it vacate space in exports in recent years, and if so, to what extent was India able to occupy it?
China’s global market share in merchandise and manufacturing exports has not declined since the GFC. As figure 1.4 (shown later) illustrates, China gained market share in both aggregate and manufacturing exports by about 4 to 5 percentage points. For example, China’s global market share in manufacturing exports increased from 12.8 percent in 2008 to 17.5 percent in 2018.
China did cede export space in certain manufacturing subsectors, however. Its market share declined in a number of subsectors, including footwear (down 7.5 percentage points from its peak share of 40 percent); apparel (down 5.8 percentage points from its peak share of 38 percent); and leather (down 3.6 percentage points from its peak share of 34 percent) (figure 1.2). The total export space vacated by China in manufacturing was nearly $140 billion—57 percent of India’s total manufacturing exports.
Not unexpectedly, China’s global market share declined more in labor-intensive sectors. Figure 1.3 plots the change in peak global market share in the top 25 manufacturing subsectors (defined in terms of China’s global market share) against an index that measures their skill intensity. The correlation is negative, with large declines in sectors that are intensive in highly unskilled labor
Figure 1.2Change in China’s global export market share
Note: The decline is calculated as the average share in 2017 and 2018 relative to the peak share in 2007–18. Figure includes all sectors in which China’s market shared declined by at least 0.5 percentage points. Figures in front of the bars show the decline (calculated as the decline in global market share times average global exports in 2017–18) in billions of dollars.Source: CEPII-BACI. See appendix 1A.
$12.2 billion
3.1
29.5
3.1
18.9
14.1
5.5
1.3
39.7
1.7
6.3
1.4
2.6
Footwear
Ceramics
Apparel
Leather
Iron and steel
Pearls and precious stones
Furniture
Misc. base metals
Electrical equipment
Wood and wood articles
Optics, etc.
Rubber and rubber articles
Other metals
0 2 4 6 8decline in global market share
(percentage points)

10 PIIE BR 20-2 | SEPTEMBER 2020
and relatively small declines or gains in skill-intensive sectors. A one standard deviation decrease in skill intensity is associated with an additional 1.1 percentage point decline in China’s peak market share.1 As wages and incomes in China have risen, it vacated space in unskilled-labor-intensive sectors; the China-exit opportunity for other developing countries was real.
India has not been among the big beneficiaries of China’s declining competitiveness, especially in the labor-intensive sectors of footwear, apparel, and leather (table 1.1). Vietnam occupied most of the space vacated by China; Bangladesh did so in apparel. India’s gain in almost all these sectors is a small fraction of the space vacated by China.
India has not lost overall market share post-GFC; it simply has not taken advantage of the opportunity created. Most of India’s post-GFC performance is reflected by a single sector, pearls and precious stones.
1 The skill intensity index is a measure of revealed human capital intensity in a two-digit sector discounted by the share of valued added in that sector accounted for by wages. If the share of labor in value-added is large or the sector employs less educated workers, its skill intensity index will be low. A sector with a small labor share or highly educated work force will have a high skill intensity index.
export space vacated by China
index of skill intensity
Manufacturing of straw, basketwork, etc.
Silk
Cotton
Stone, plaster articles
Ceramic products
Glass, glassware
Electrical machinery & equipment
Railway equipment
Toys, games
Leather
Apparel
Footwear
Wool, animalhair yarn
Musicalinstruments
Iron, steel
Articles ofbase metal Clocks, watches & parts
Animal productsLac, gums, resins
Preparation of meat, fishExplosives, matches
Misc. manufacturing articlesTextiles
Furniture, lighting, signs
Machinery, mechanical appliances
.10
.05
0
10 15 20 25 30
Figure 1.3Correlation between skill intensity of sector and change in China’s share of global exports
Source: World Bank, World Development Indicators; NBER’s manufacturing industry database; Pierce and Schott (2012). For details, see Chatterjee and Subramanian (2020).

11 PIIE BR 20-2 | SEPTEMBER 2020
Why Didn’t India Occupy the Space Vacated by China?
China vacated space in labor-intensive sectors, and India did not occupy it in any meaningful sense. The promise that blazing pre-GFC export performance would continue was belied. Export performance failed to take off because (a) India experienced a generalized deterioration in productivity and competitiveness post-GFC and (b) key labor-intensive sectors did not perform well enough before the GFC to warrant optimism in the first place.
Generalized deterioration in competitiveness
Post-GFC, the Indian economy experienced a generalized and substantial decline in productivity growth and competitiveness. It manifested itself not as a decline in global market share but as a sharp decline in the increase in market share.
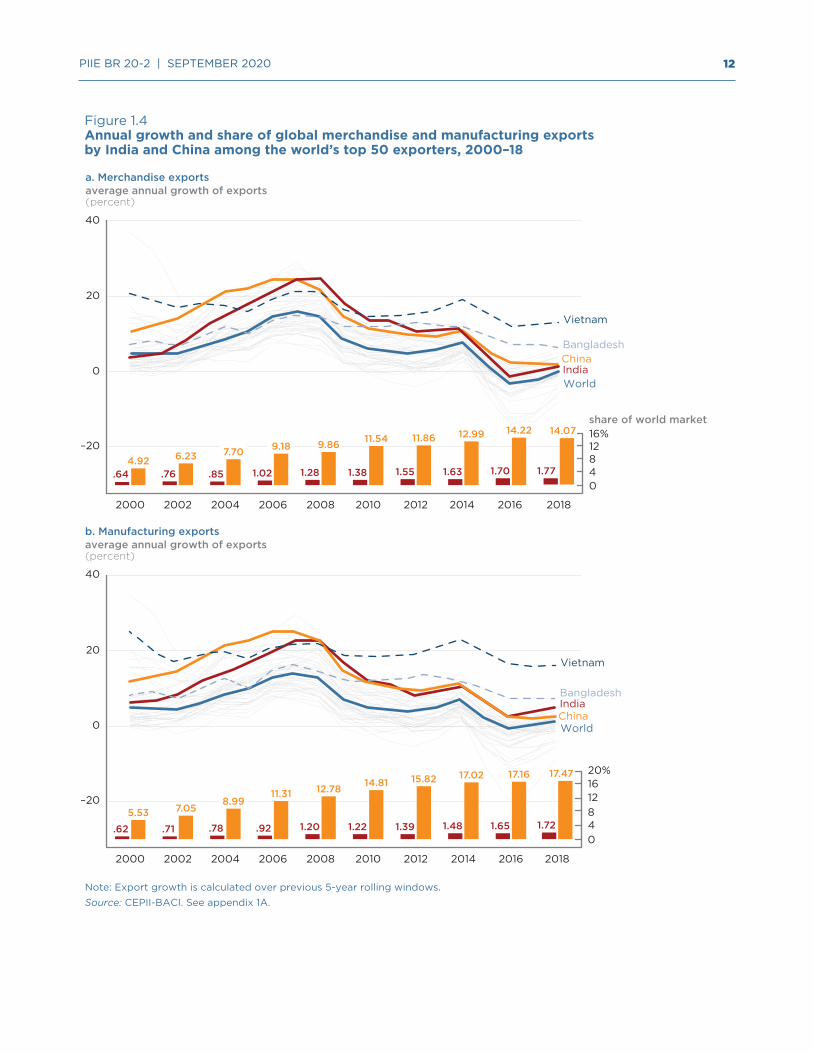
Figure 1.42 depicts the growth in aggregate merchandise and manufacturing exports, respectively, for the period 2000–18. India’s average annual growth rate of total exports was 24.4 percent during 2002–08 (boom period from
2 The figures for India’s share of world merchandise trade differ slightly from those cited in chap-ter 2 because the authors there use data from the World Bank’s World Development Indicators.
SUBRAMANIAN - chapter 1
Table 1.1 Major beneficiaries of China’s loss of global market share (percent)
Sector
China’s loss of global market share Top three gainers
Increase in market share
India’s gain in global market share
Footwear 7.5
Vietnam 5.9
0.1Germany 1.4
Belgium 0.7
Ceramics 6.0
Spain 1.2
1.0Italy 1.1
India 1
Apparel 5.8
Vietnam 2.9
0.2Bangladesh 2.8
Spain 0.7
Leather 3.4
Vietnam 2.5
0.2Italy 1.6
France 1.5
Iron and steel 2.7
India 0.4
0.4Belgium 0.3
Indonesia 0.3
Pearls, gems, etc. 2.3
India 3.5
3.5Israel 1.1
United States 1
Furniture 2.2
Poland 0.9
0.1Vietnam 0.8
Czech Republic 0.4
Source: See appendix 1A.
12 PIIE BR 20-2 | SEPTEMBER 2020
.62 .71 .78 .92 1.20 1.22 1.39 1.48 1.655.53 7.05
8.9911.31 12.78 14.81 15.82 17.02 17.16
2000 2002 2004 2006 2008 2010 2012 2014 2016
Note: Export growth is calculated over previous 5-year rolling windows.Source: CEPII-BACI. See appendix 1A.
40
20
0
–20
1.72
17.47
2018
World
IndiaChina
Vietnam
Bangladesh
.64 .76 .85 1.02 1.28 1.38 1.55 1.63 1.704.92 6.23 7.70 9.18 9.86 11.54 11.86 12.99 14.22
average annual growth of exports(percent)
2000 2002 2004 2006 2008 2010 2012 2014 2016
a. Merchandise exports
40
20
0
–20
China
WorldIndia
1.77
14.07
Bangladesh
Vietnam
Figure 1.4Annual growth and share of global merchandise and manufacturing exports by India and China among the world’s top 50 exporters, 2000–18
share of world market16%128
04
20%
12
40
8
16
average annual growth of exports(percent)
b. Manufacturing exports
2018

13 PIIE BR 20-2 | SEPTEMBER 2020
hereon) compared with 5.2 percent before. After the crisis, India’s export growth declined substantially to about 1.5 percent (2011–18) as it did for other countries. But India continued to gain global market share, albeit at a slower pace post-GFC. So, a decline in absolute performance (reflected in decelerating export growth) without a deterioration in performance relative to most other countries characterized India’s export performance post-GFC. As can also be seen from figure 1.4, the big exceptions to the global trend were Vietnam and Bangladesh.
The story is similar for manufacturing (figure 1.4, panel b). Before the GFC, India’s manufacturing exports soared, registering the highest growth rates in the world. Post-GFC, India’s impressive performance continued in manufacturing (unlike in minerals and agriculture). India gained market share in both periods, but growth was slightly attenuated after the GFC. India’s manufacturing exports grew at an average annual rate of 7 percent in 1995–2002; growth soared to 22.7 percent in 2002–08 before falling to 4.4 percent post-GFC. The decline reflected the global slowdown in the post-GFC years, not a deterioration in India’s manufacturing performance. India ranked 18th in terms of the annual growth rate of exports of manufacturing goods between 1995 and 2001. During the boom years, it rose to fourth in the world. When the world slowed post-GFC, the growth of manufacturing slowed substantially, but India ranked fifth.
We undertake a simple global market share decomposition for Indian exports. We do this for aggregate exports (merchandise and services) and also for a decomposition of the aggregate into five sectors: agriculture, minerals, low-skilled manufacturing, high-skilled manufacturing and services. The decomposition is meant to help us identify the distinct sources of comparative advantage of India: land and endowments for agriculture and minerals and different types of skilled labor for the other three sectors. A major caveat is that services are equated with high-skilled labor, which may not be strictly accurate especially since services as we have defined include tourism.
The results of the decomposition exercise are as follows (see Chatterjee and Subramanian 2020 for details of the formal derivation):
Change in growth in aggregate Indian exports (the difference between growth before and after the GFC) = change in growth of aggregate world exports (A)
plus change in aggregate market share of Indian exports (B)
Change in aggregate market share of Indian exports (B) = trade-weighted average change in global market share of the five sectors (C) + trade-weighted
average difference in a sector’s share in Indian and global exports (D)
The weights in C are the shares of individual sectors in India’s aggregate exports; the weights in D are world export growth rates of the individual sectors. The impact of D is small, so B is close to C. As a result:
Change in growth in aggregate Indian exports (the difference between growth before and after the GFC) = change in growth of aggregate world exports (A)
plus the weighted average change in global market share of the five sectors (C).
A represents a pure external demand effect: As global exports change, Indian exports change commensurately. C (the change in global market share) represents an internal productivity effect: An increase in India’s global
14 PIIE BR 20-2 | SEPTEMBER 2020
market share means that India’s exports are doing better than those of global competitors, which can occur only if its domestic productivity is rising faster than that of competitors.
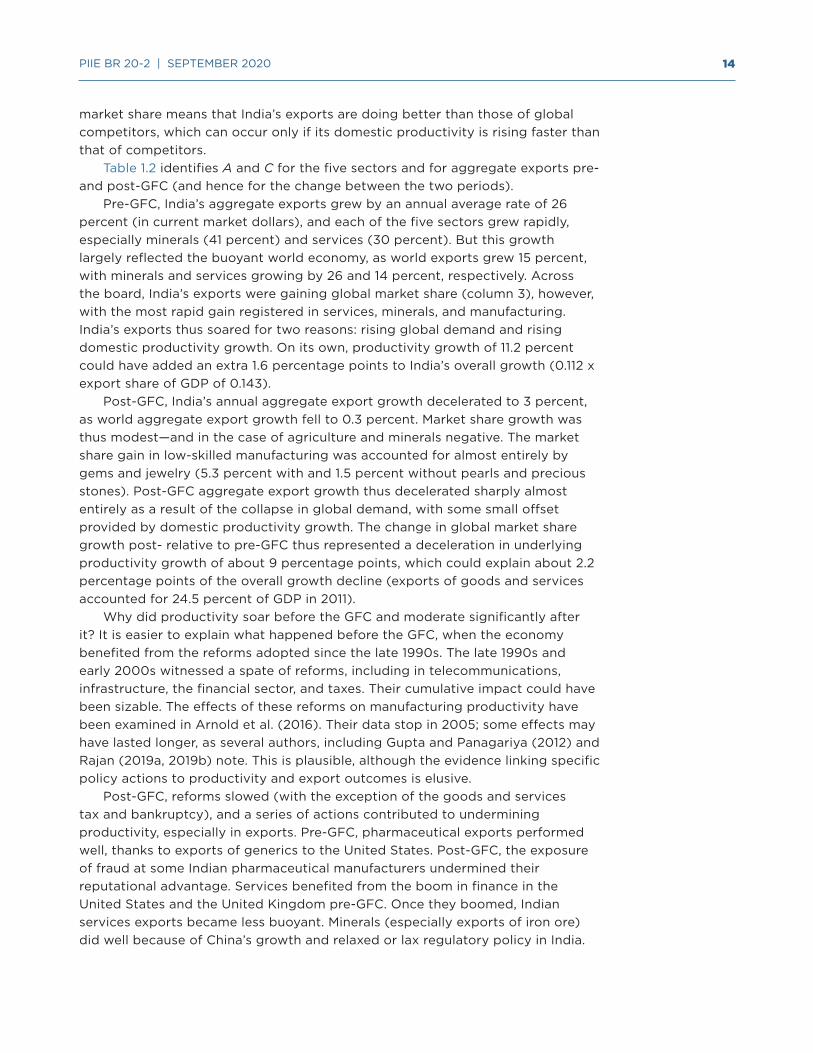
Table 1.2 identifies A and C for the five sectors and for aggregate exports pre- and post-GFC (and hence for the change between the two periods).
Pre-GFC, India’s aggregate exports grew by an annual average rate of 26 percent (in current market dollars), and each of the five sectors grew rapidly, especially minerals (41 percent) and services (30 percent). But this growth largely reflected the buoyant world economy, as world exports grew 15 percent, with minerals and services growing by 26 and 14 percent, respectively. Across the board, India’s exports were gaining global market share (column 3), however, with the most rapid gain registered in services, minerals, and manufacturing. India’s exports thus soared for two reasons: rising global demand and rising domestic productivity growth. On its own, productivity growth of 11.2 percent could have added an extra 1.6 percentage points to India’s overall growth (0.112 x export share of GDP of 0.143).
Post-GFC, India’s annual aggregate export growth decelerated to 3 percent, as world aggregate export growth fell to 0.3 percent. Market share growth was thus modest—and in the case of agriculture and minerals negative. The market share gain in low-skilled manufacturing was accounted for almost entirely by gems and jewelry (5.3 percent with and 1.5 percent without pearls and precious stones). Post-GFC aggregate export growth thus decelerated sharply almost entirely as a result of the collapse in global demand, with some small offset provided by domestic productivity growth. The change in global market share growth post- relative to pre-GFC thus represented a deceleration in underlying productivity growth of about 9 percentage points, which could explain about 2.2 percentage points of the overall growth decline (exports of goods and services accounted for 24.5 percent of GDP in 2011).
Why did productivity soar before the GFC and moderate significantly after it? It is easier to explain what happened before the GFC, when the economy benefited from the reforms adopted since the late 1990s. The late 1990s and early 2000s witnessed a spate of reforms, including in telecommunications, infrastructure, the financial sector, and taxes. Their cumulative impact could have been sizable. The effects of these reforms on manufacturing productivity have been examined in Arnold et al. (2016). Their data stop in 2005; some effects may have lasted longer, as several authors, including Gupta and Panagariya (2012) and Rajan (2019a, 2019b) note. This is plausible, although the evidence linking specific policy actions to productivity and export outcomes is elusive.
Post-GFC, reforms slowed (with the exception of the goods and services tax and bankruptcy), and a series of actions contributed to undermining productivity, especially in exports. Pre-GFC, pharmaceutical exports performed well, thanks to exports of generics to the United States. Post-GFC, the exposure of fraud at some Indian pharmaceutical manufacturers undermined their reputational advantage. Services benefited from the boom in finance in the United States and the United Kingdom pre-GFC. Once they boomed, Indian services exports became less buoyant. Minerals (especially exports of iron ore) did well because of China’s growth and relaxed or lax regulatory policy in India.

15 PIIE BR 20-2 | SEPTEMBER 2020
SUBRAMANIAN - chapter 1
Table 1.2Decomposition of India’s export performance before and after the global financial crisis, by sector
Sector
Before global financial crisis (2002–08)
After global financial crisis (2011–18)
(1)India’s exports
(2)World exports
(3)Change in global market share of India’s exports) (1) – (2)
(4)India’s exports
(5)World exports
(6)Change in global market share of India’s exports (4) – (5)
Agriculture 18.5 13.2 5.2 –1.2 0.7 –1.9
Minerals 41.1 25.8 15.3 –8.8 –8.2 –0.7
Low-skilled manufacturing 21.2 13.7 7.5 5.7 0.5 5.3
High-skilled manufacturing 23.6 13.4 10.2 3.8 1.1 2.7
Services 29.5 13.8 15.7 5.0 3.3 1.7
Total 26.1 14.9 11.2 2.8 0.3 2.4
Low-skilled manufacturing without pearls and precious stones
14.3 12.3 2.0 2.3 0.8 1.5
Apparel, textile, leather, footwear
12.3 8.8 3.5 0.6 1.2 –0.5
Difference
(7)India’s exports (4) – (1)
(8)World exports (5) – (2)
(9)Change in global market share of India’s exports (6) – (3)
Agriculture –19.6 –12.6 –7.1
Minerals –49.9 –34.0 –15.9
Low-skilled manufacturing –15.5 –13.2 –2.3
High-skilled manufacturing –19.9 –12.4 –7.5
Services –24.5 –10.5 –14.0
Total –23.3 –14.5 –8.8
Low-skilled manufacturing without pearls and precious stones
–11.9 –11.5 –0.4
Apparel, textile, leather, footwear
–11.7 –7.6 –4.0
Note: Figures are annual average growth rates (in percent), except where otherwise specified. To avoid confusion, we report the change in global market share as the excess of the growth of domestic exports over global exports in each category. Thus, the unit of change in global market share is percent, not percentage points. The latter will, of course, depend on India’s initial level of global market share in percent. Thus, a 10 percent change in global market share as we compute it will translate as a 0.1 percentage point gain in market share if India’s initial global market share is 1 percent.
Source: See appendix 1A.

16 PIIE BR 20-2 | SEPTEMBER 2020
Once the Supreme Court of India intervened, mineral exports also declined. After 2014, more zealous enforcement of the ban on beef contributed to the decline in India’s agricultural exports.
The value of the rupee appreciated sharply between 2014 and 2018, undermining India’s export competitiveness. The pre-GFC boom also left a legacy of weak financial and corporate balance sheets, which festered without adequate policy attention, contributing to a further weakening of dynamism (Subramanian and Felman 2019).
The Achilles heel of low-skilled manufacturing
In addition to the broad reasons why India did not occupy the export space vacated by China, there are specific reasons related to India’s exports of key unskilled-labor-intensive exports.
Figure 1.5 plots increases in global market shares for India’s top 25 manufacturing subsectors versus the index of skill intensity. Pre-GFC, all subsectors saw large increases in market share, topped by pearls and precious stones, electronics, and vehicles. But these gains are uncorrelated with skill intensity: A 1 standard deviation reduction in skill intensity is associated with an additional market share gain of just 0.1 percentage point.
Pre-GFC, India registered only very modest market share gains (3.5 percentage points) in apparel, leather, and footwear (the most unskilled-labor-
Source: See appendix 1A; Chatterjee and Subramanian (2020).
export space gained by India pre-GFC
index of skill intensity
Pearls, precious stones
Ships, boats
.6
.4
10 20 30 40 50
Figure 1.5Correlation between skill intensity and increases in India’s share of global exports, 2000–08, by sector
.2
0
Aircraft & parts
Other metals
FurnitureElectrical equipment
Iron, steel VehiclesMachinery
Opticalappliances Paper & products
Plastics Misc. chemical productsOrganic chemicals
PerfumesDyesInorganicchemicals
Cement, stone arts
LeatherApparelCotton
Footwear RubberTextilesPharmaceuticals

17 PIIE BR 20-2 | SEPTEMBER 2020
intensive sectors), suggesting that competitiveness in these sectors had not improved markedly.3 It is therefore not surprising that India did not exploit the opportunity created by China.
IS EXPORT PESSIMISM JUSTIFIED? REVISITING THE STRUCTURE OF INDIAN EXPORTS
Aggregate and manufacturing export performance was spectacular pre-GFC, as reflected in both double-digit rates of growth and rising global market shares. This export performance became more nuanced post-GFC, reflected in sharply lower rates of export growth but still rising global market shares, albeit at a more modest pace than before the GFC. India was not able to occupy the export space vacated by China post-GFC because this space was in relatively unskilled labor goods, which were not the sectors of Indian specialization.
The outlook for the future could be darker than past performance would imply. To understand why that might be the case, it is instructive to look at the structure of Indian exports and its evolution since 1995.
For a labor-abundant country like India, the share of low-skilled exports (manufacturing) is low and the share of higher-skilled exports (manufacturing and services) is high and rising (figure 1.6). Between 1995 and 2018, the share of lower-skilled manufacturing exports in India’s total manufacturing exports fell from about 34 percent to 20 percent. So, today just one-fifth of total exports are based on low-skilled labor. In contrast, the share of skill-based exports rose, from 42 percent in 1995 to 65 percent in 2018.
At one level, this changing structure is not inconsistent with the natural trajectory of development: As countries become richer, their specialization should change from unskilled to skill-based activities. But in India both of these trends are cause for concern. The former reflects failure more than success and the latter while reflecting past success portends future challenges. Put differently, this overall structure provides clues to India’s two potential long-run export vulnerabilities: Its inability to emulate the performance of China, Vietnam, and Bangladesh in becoming an export powerhouse of relatively low-skilled manufacturing sectors such as clothing, footwear, and electronics; and its overreliance on skill-based exports, which risks being unsustainable over the medium run because the underlying supply of skills is limited.
Figure 1.7 illustrates the problem with India’s export performance in manufacturing. For India and the three current low-skilled export powerhouses (China, Bangladesh, and Vietnam), it plots an index that captures the skill intensity of aggregate manufacturing exports. For its level of income, India’s index is well above that of China, Bangladesh, and Vietnam to begin with and remains so over time. In terms of both the level and change, India’s skilled export intensity is too high.
3 Table 1.2 seems to suggest that India’s global market share rose robustly in low-skilled manu-facturing even post-GFC. It is misleading, however, because all the gains came from the performance of gems and jewelry. Confining the analysis to the key labor-intensive sectors in which China vacated space—apparel, textiles, leather, and footwear—shows more modest gains pre-GFC of 3.5 percent and a market share decline of –0.6 percent post-GFC.

18 PIIE BR 20-2 | SEPTEMBER 2020
In itself, this high and rising skill intensity need not have been a problem if it had been associated with high and rising exports. But these developments were associated with poor performance in low-skill-intensive exports. India’s global market share in low-skill-intensive exports was about 3.5 percent in 2018, compared with 22.8 percent for China, 2.9 percent for Vietnam, and 1.5 percent for Bangladesh. But these numbers need to be adjusted for a country’s size and potential. The metric that underscores India’s underperformance is the difference between its market share of global low-skill-intensive exports and its share of the global working-age population. Poor countries with abundant low-skilled labor should be specializing roughly proportionately in production of low-skill-intensive goods. By this measure, the contrast with the other countries is striking.
Bangladesh and Vietnam are close to the zero line in figure 1.8, indicating that their global export market shares are roughly equal to their shares of the
share in total exports(percent)
1995
1996
1997
1998
1999
2000
2001
2002
2003
2004
2005
2006
2007
2008
2009
2010
2011
2012
2013
2014
2015
2016
2017
2018
Agriculture MineralsLow-skilledmanufacturing
High-skilledmanufacturing Services
Figure 1.6Sectoral composition of India’s annual exports, 1995–2018
Source: See appendix 1A; Chatterjee and Subramanian (2020).
19%
21
18
16
14
12
12
11
10
9
7
7
7
7
7
7
8
10
10
9
8
7
7
7
5%
4
3
4
2
3
4
5
7
9
11
12
12
13
12
15
16
14
15
13
8
7
8
9
3%
32
32
32
31
32
30
29
27
24
24
19
24
22
21
16
18
17
17
18
21
20
21
22
23%
25
26
23
23
24
24
25
26
25
24
24
22
23
24
24
24
24
25
25
25
25
25
26
27
30
30
29
29
30
34
35
37
35
35
37
37
34
35
34
35
39
38
39
39
19%
18
21

19 PIIE BR 20-2 | SEPTEMBER 2020
export share–weighted human capital/labor share index
6 7 8 9log GDP per capita
(constant 2010 United States dollars)
Figure 1.7Relationship between skill intensity of manufacturing exports and per capita GDP in China, Bangladesh, India, and Vietnam
Note: Data spans 1995–2018.Source: See appendix 1A; Chatterjee and Subramanian (2020).
18
16
14
12
India
China
Bangladesh
Vietnam
low-skilled manufacturing GMS minus share of working-age population
6 7 8 9log GDP per capita
(constant 2010 United States dollars)
Figure 1.8Share of global exports of low-skill-intensive products minus share of global working-age population in China, Bangladesh, India, and Vietnam
Note: Data spans 1995–2018. The y axis label is the di�erence between each country’s global market share (GMS) in low-skilled manufacturing exports and its share in the world’s working-age population. Source: See appendix 1A; Chatterjee and Subramanian (2020).
.05
–.05
–.10
–1.5India
China
Bangladesh
Vietnam
20 PIIE BR 20-2 | SEPTEMBER 2020
global working-age population. China started with a huge mismatch; today its global export share is about 2–3 percentage points greater than its population share. By contrast, India’s market share of global low-skill-intensive exports is 15 percentage points less than its share of the global working-age population, and this share remained fairly constant between 1995 and 2018.4 India’s underperformance is staggering.
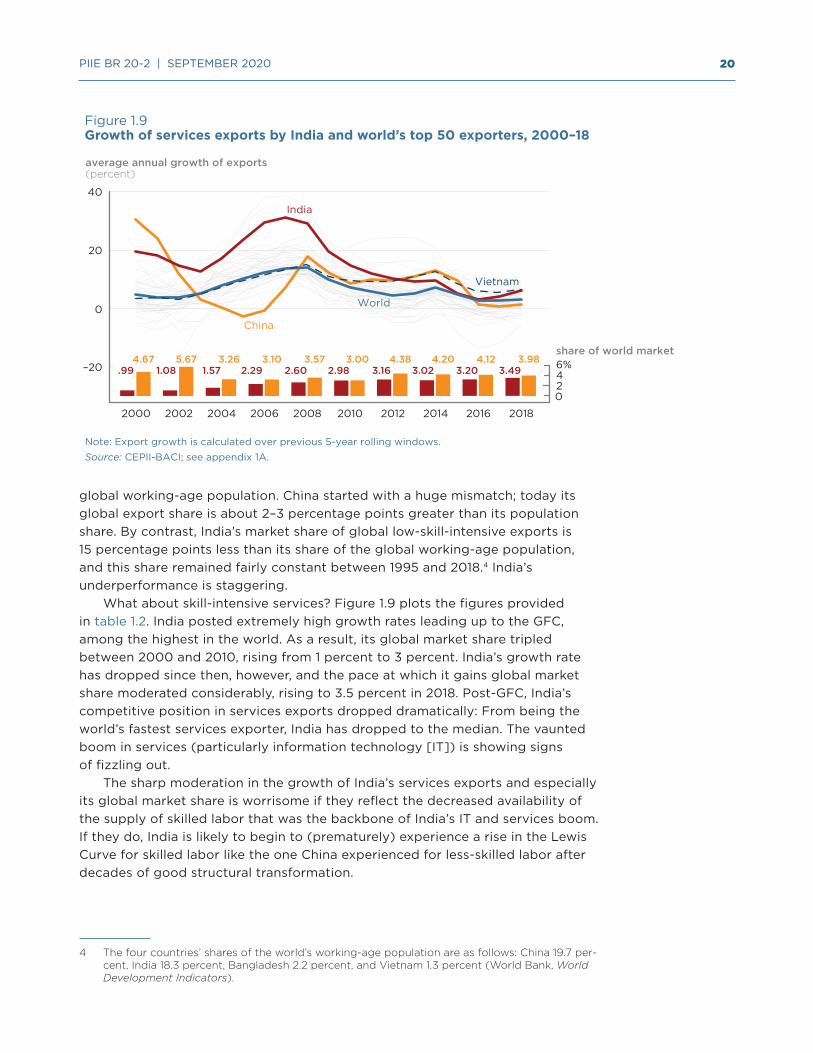
What about skill-intensive services? Figure 1.9 plots the figures provided in table 1.2. India posted extremely high growth rates leading up to the GFC, among the highest in the world. As a result, its global market share tripled between 2000 and 2010, rising from 1 percent to 3 percent. India’s growth rate has dropped since then, however, and the pace at which it gains global market share moderated considerably, rising to 3.5 percent in 2018. Post-GFC, India’s competitive position in services exports dropped dramatically: From being the world’s fastest services exporter, India has dropped to the median. The vaunted boom in services (particularly information technology [IT]) is showing signs of fizzling out.
The sharp moderation in the growth of India’s services exports and especially its global market share is worrisome if they reflect the decreased availability of the supply of skilled labor that was the backbone of India’s IT and services boom. If they do, India is likely to begin to (prematurely) experience a rise in the Lewis Curve for skilled labor like the one China experienced for less-skilled labor after decades of good structural transformation.
4 The four countries’ shares of the world’s working-age population are as follows: China 19.7 per-cent, India 18.3 percent, Bangladesh 2.2 percent, and Vietnam 1.3 percent (World Bank, World Development Indicators).
China
average annual growth of exports(percent)
2000 2002 2004 2006 2008 2010 2012 2014 2016 2018
Figure 1.9Growth of services exports by India and world’s top 50 exporters, 2000–18
Note: Export growth is calculated over previous 5-year rolling windows.Source: CEPII-BACI; see appendix 1A.
40
20
0
–204.67 5.67 3.26 3.10 3.57 3.00 4.38 4.20 4.12 3.98
.99 1.08 1.57 2.29 2.60 2.98 3.16 3.02 3.20 3.49
share of world market
0
46%
2
World
Vietnam
India

21 PIIE BR 20-2 | SEPTEMBER 2020
SHOULD INDIA ABANDON EXPORT-LED GROWTH?
India has been unable to exploit the opportunity created by rising wages in China and its ceding of space. Does that mean that India should give up on an export- and trade-based growth strategy?
Two strands warrant a reexamination of whether trade is necessary for growth, especially the kind of high growth India aspires to. First, there is a backlash against globalization in advanced countries. If developing countries’ trading opportunities shrink as a result, their growth prospects could be affected, especially as the world trading environment has weakened since the GFC, as reflected in the deceleration of annual global export growth from 15 percent before to 0.3 percent after the GFC.
COVID-19 (and the recovery from it) will probably exacerbate this trend, as countries reconsider the tradeoff between the benefits of specialization and the risks it creates in times of crisis, at least for essential commodities such as food and medicines.
Second, a belief is gaining traction in India that its development model is based on consumption rather than exports and trade. This belief is strongly reflected in current debates about growth. Some observers attribute the growth slowdown to declining consumption. Others argue that the fact that growth is strong but trade is weak is proof that high consumption is sustaining growth.
Abandoning an export- and trade-led strategy would be folly for India. Both its own history and cross-country evidence suggest that doing so would lead to a low-growth destiny, which India cannot afford given its stage of development. Low export growth would make GDP growth in the 6 percent plus range unattainable.
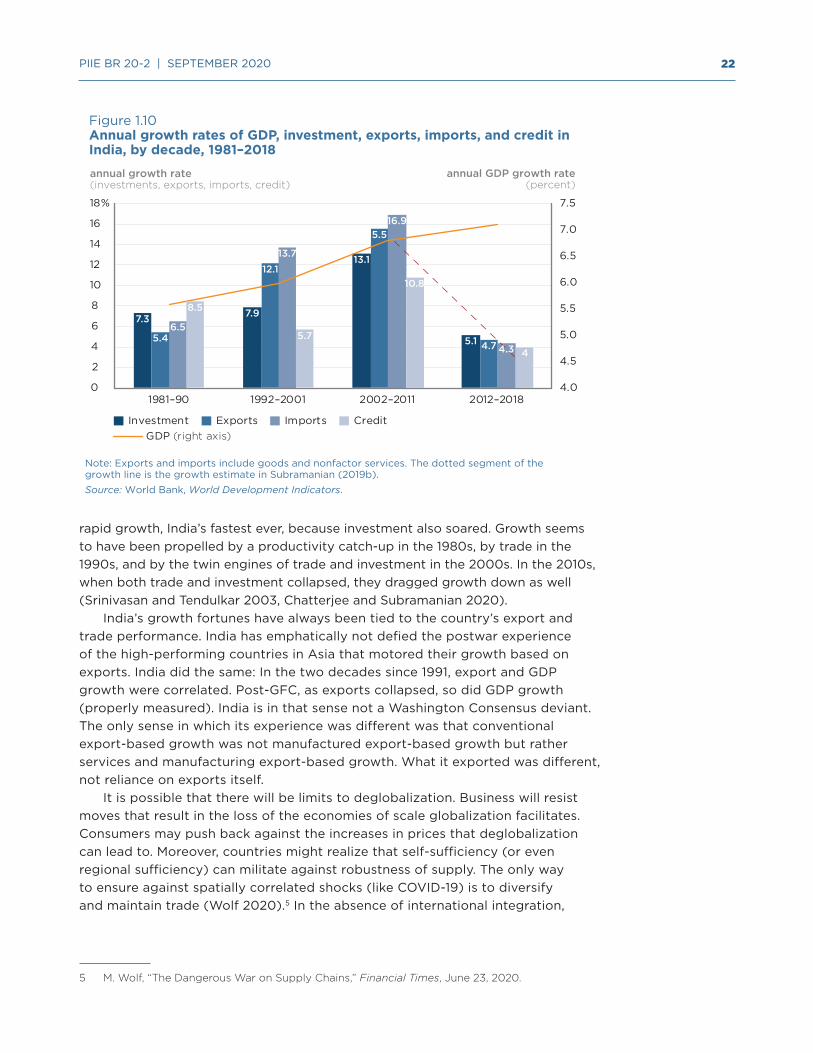
Consider the evidence. India’s tryst with growth started in the 1980s (figure 1.10). GDP per capita growth more than doubled in the decades following 1980, with the annual average growth rate rising from 1.7 percent in 1950–80 to 3.8 percent in 1980–2000. This takeoff was initially triggered by the government’s pro-business outlook in the 1980s; it was reinvigorated and sustained by the pro-market liberalization of the economy in 1991 (Rodrik and Subramanian 2005). In the near-decade leading up to the GFC came the global boom created by trade hyperglobalization, the growth of global value chains, the rise of multinationals, and the credit-commodity supercycle. India rode the wave. GDP per capita rose by an average rate of almost 7.5 percent a year between 2002 and 2008, making India the second-fastest-growing major economy in the world (after China).
Between 2012 and 2018, annual GDP growth was officially reported to have been about 7 percent. But even a cursory look at figure 1.10 gives a sense of how implausible that official estimate is. Subramanian (2019a, 2019b) estimates that real growth is substantially below the official number. In 2019–20, nearly all the major macroeconomic indicators of activity—consumption, investment, credit, trade, power demand, tax collection—were either in negative or barely positive growth territory, suggesting that India is in the midst of a major slowdown, its first since the early 1990s (Subramanian and Felman 2019).
India’s growth takeoff in the 1980s was not accompanied by a large increase in trade. It seems to have been powered by rapid productivity growth. Trade seems to have played a major role in both the rapid growth of the 1990s and the 2000s and the collapse in this decade. The 2000s seemed to have witnessed especially
22 PIIE BR 20-2 | SEPTEMBER 2020
rapid growth, India’s fastest ever, because investment also soared. Growth seems to have been propelled by a productivity catch-up in the 1980s, by trade in the 1990s, and by the twin engines of trade and investment in the 2000s. In the 2010s, when both trade and investment collapsed, they dragged growth down as well (Srinivasan and Tendulkar 2003, Chatterjee and Subramanian 2020).
India’s growth fortunes have always been tied to the country’s export and trade performance. India has emphatically not defied the postwar experience of the high-performing countries in Asia that motored their growth based on exports. India did the same: In the two decades since 1991, export and GDP growth were correlated. Post-GFC, as exports collapsed, so did GDP growth (properly measured). India is in that sense not a Washington Consensus deviant. The only sense in which its experience was different was that conventional export-based growth was not manufactured export-based growth but rather services and manufacturing export-based growth. What it exported was different, not reliance on exports itself.
It is possible that there will be limits to deglobalization. Business will resist moves that result in the loss of the economies of scale globalization facilitates. Consumers may push back against the increases in prices that deglobalization can lead to. Moreover, countries might realize that self-sufficiency (or even regional sufficiency) can militate against robustness of supply. The only way to ensure against spatially correlated shocks (like COVID-19) is to diversify and maintain trade (Wolf 2020).5 In the absence of international integration,
5 M. Wolf, “The Dangerous War on Supply Chains,” Financial Times, June 23, 2020.
Figure 1.10Annual growth rates of GDP, investment, exports, imports, and credit in India, by decade, 1981–2018
Note: Exports and imports include goods and nonfactor services. The dotted segment of the growth line is the growth estimate in Subramanian (2019b).Source: World Bank, World Development Indicators.
4.0
4.5
5.0
5.5
6.0
6.5
7.0
7.5
0
2
4
6
8
10
12
14
16
18%
1981–90 1992–2001 2002–2011 2012–2018
GDP (right axis)
annual growth rate(investments, exports, imports, credit)
annual GDP growth rate(percent)
Investment Exports Imports Credit
7.3
5.46.5
7.9
12.113.7 13.1
15.516.9
10.8
5.1 4.7 4.3 4
5.7
8.5

23 PIIE BR 20-2 | SEPTEMBER 2020
the average resident of a low- or lower-middle-income country may not live in a market large enough to experience sustained poverty reduction (Goldberg and Reed 2020).
A POST-COVID-19 GLOBALIZATION STRATEGY: “I CAN’T GO ON, I MUST GO ON”
Stellar export and trade performance were critical to India’s growth revival between 1990 and 2010; weak trade performance since the GFC has coincided with lackluster growth. There is no Mumbai or Delhi Consensus suggesting that India blazed a path different from that of the East Asian stars (by relying on consumption, for example). India’s experience was unique only in that its stellar trade performance of two decades extended beyond manufacturing, especially to skilled services and to a lesser extent agri-commodities.
That model of trade-led growth is now changing, because of both external and domestic factors. First, the world trading environment has become less hospitable since the GFC, as reflected in the decline in global export growth from 15 percent before the GFC to 0.3 percent after it. That trend will probably be exacerbated post-COVID-19, as countries reconsider the tradeoff between the benefits of specialization and the risks it creates.
Second, China will continue to vacate space as it becomes more prosperous. Post-COVID-19 it might also be coerced into ceding space because the deglobalization that follows could be targeted against China, in the form of greater trade and investment barriers against its exports and companies by countries around the world.
Domestically, India’s government has reversed a longstanding policy of steady trade policy liberalization. It has increased tariffs and favored domestic incumbents in other ways in a number of sectors, including telecommunications and retail. Indian ambivalence toward integration was manifested in its stance on the Doha Round in 2015 and its decision not to join the Regional Comprehensive Economic Partnership (RCEP). All of these trends will make any strategy of accelerating exports via integration with global value chains more difficult.
The main implication of these trends is that India must moderate, possibly significantly, its growth expectations, because trade opportunities will diminish. India failed to exploit the opportunity created by China; structural reasons render it unlikely to do so in the future.
As a result, India cannot expect to grow at the pre-GFC rate of 8–9 percent a year. Potential growth will be several percentage points lower, unless it can decisively change its international competitiveness and reverse the reversal of trade policies, including domestic sentiment, which has turned even more inward looking recently. Given the deterioration of the external environment since the GFC, India will have to run uphill to grow rapidly.
As India is as much an agricultural-commodity exporter as it is a manufacturing exporter, any domestic policy actions that are inimical to agricultural exports (such as export bans and taxes and social policies affecting livestock trade) or commodity exports (such as regulatory restrictions on mining) would hurt overall exports. As an important agricultural exporter, India must be alert to the opening up of new opportunities, such as the market for fresh produce in the Gulf and Middle East, which are currently supplied by Europe. As

24 PIIE BR 20-2 | SEPTEMBER 2020
a result of COVID-19, the European Union is struggling to find workers to harvest crops and manage farms. In addition, countries are likely to use food to serve domestic needs and to stockpile it in the post-COVID-19 world. India could take advantage of the opportunity this change creates to enter this market.
One of the big disappointments post-GFC has been the fact that India has become only an average exporter of services, not a superstar. The policy agenda for boosting services could be less formidable than that for manufacturing; skills could be upgraded in conjunction with firms in this sector that are close to the global technology frontier. India’s services exports (which brought in $200 billion in 2018) are narrowing the gap with manufacturing exports (which brought in $325 billion). Globally, services exports have grown more rapidly than manufacturing exports since the GFC (services exports growth has been 3.3 percent per annum compared with 0.9 percent per annum for export growth of manufactured goods), suggesting that a focus on services may make sense. The domestic diffusion from skill-intensive services exports would be lower than for low-skilled manufacturing, but Indian merchandise exports were never really low-skill intensive, as figure 1.6 suggests.
One important commonality to the performance of manufacturing, agricultural, and services exports has been the relative decline of their market shares since 2014. A common competitive shock may have affected India’s exports. Between 2014 and 2018, India’s exchange rate appreciated by nearly 20 percent in real effective terms. Maintaining competitive exchange rates should be a key concern of policymakers; the desire to continue opening the capital account and equating currency strength with national pride can become an obstacle to a serious globalization-cum-growth strategy.
Another area for action is restoration of India’s reputation. Misconduct by a few firms (Ranbaxy in pharmaceuticals, call center scams originating in India, and visa fraud by IT firms, for example) have hurt the Indian brand and exports. The government must take steps to work with trade partners to ensure that such episodes do not recur. Restoration of trust will be the foundation of revival.
Darker external and internal developments evoke a Beckettian sense of “I can’t go on, I must go on” about India’s trade. Without trade, growth will be tepid, possibly returning to the pre-1980s “Hindu rate of growth,” with serious development consequences. Reviving trade will require a reversal of what now seems to be a sustained reversal of outward-oriented policies. At a time when the post-GFC, post-COVID-19, antiglobalization headwinds threaten to stall trade, India’s new self-reliant growth strategy is almost an oxymoron, smacking of delusional “this time will be different” thinking.
REFERENCES
Arnold, J.M., B. Javorcik, M. Lipscomb, and A. Mattoo, A. 2016. Services Reform and Manufacturing Performance: Evidence from India. Economic Journal 126, no. 590: 1–39.
Chatterjee, S., and A. Subramanian. 2020. India’s Export and Growth Performance: 4 Decades, 2 Models, 1½ Surprises. Ashoka Center for Economic Policy Working Paper No. 01. Sonipat, Haryana, India: Ashoka University.
Das, M., and M.P.M. N’Diaye. 2013. Chronicle of a Decline Foretold: Has China Reached the Lewis Turning Point? Washington: International Monetary Fund.
Goldberg, P. K., and T. Reed. 2020. Income Distribution, International Integration, and Sustained Poverty Reduction. NBER Working Paper w27286. Cambridge, MA: National Bureau of Economic Research.
25 PIIE BR 20-2 | SEPTEMBER 2020
Gupta, P. and Panagariya, A., 2012. Economic Reforms and Election Outcomes. In India’s Reforms: How They Produced Inclusive Growth, ed. J. Bhagwati and A. Panagariya, pp. 51-89. Oxford University Press.
Lardy, N. R. 1994. China in the World Economy. Washington: Peterson Institute Press.
Lardy, N. R. 1998. China’s Unfinished Economic Revolution. Washington: Brookings Institution Press.
Lardy, N. R. 2004. Integrating China into the Global Economy. Washington: Brookings Institution Press.
Meiyan, W. 2010. The Rise of Labor Cost and the Fall of Labor Input: Has China Reached Lewis Turning Point? China Economic Journal, 3, no. 2: 137–53.
Pierce, J.R., and P.K. Schott. 2012. A Concordance between Ten-Digit US Harmonized System Codes and SIC/NAICS Product Classes and Industries. Journal of Economic and Social Measurement 37, no. 1–2: 61–96.
Rajan, R. 2019a. India’s Economy: How Did We Get Here? OP Jindal Lecture, Brown University, Providence, RI. Available at https://tinyurl.com/rajan2019a.
Rajan, R. 2019b. The Vision Thing: Where Do We Go from Here? OP Jindal Lecture, Brown University, Providence, RI. Available at https://tinyurl.com/rajan2019b.
Rodrik, D., and A. Subramanian. 2005. From “Hindu Growth” to Productivity Surge: The Mystery of the Indian Growth Transition. IMF Staff Paper 52, no. 2: 193–228. Washington: International Monetary Fund.
Srinivasan, T.N., and Suresh Tendulkar. 2003. Reintegrating India with the World Economy. Washington: Peterson Institute for International Economics.
Subramanian, A. 2019a. India’s GDP Mis-estimation: Likelihood, Magnitudes, Mechanisms, and Implications. CID Faculty Working Paper 354. Cambridge, MA: Center for International Development, Harvard University.
Subramanian, A. 2019b. Validating India’s GDP Growth Estimates. CID Faculty Working Paper 357. Cambridge, MA: Center for International Development, Harvard University.
Subramanian, A., and J. Felman. 2019. India’s Great Slowdown: What Happened? What’s the Way Out? CID Discussion Paper 369. Cambridge, MA. Harvard Kennedy School.
Zhang, X., J. Yang, and S. Wang. 2011. China Has Reached the Lewis Turning Point. China Economic Review 22, no. 4: 542–54.
26 PIIE BR 20-2 | SEPTEMBER 2020
APPENDIX 1A DATA SOURCES, ECONOMIES INCLUDED, AND SECTOR DEFINITIONS
DATA SOURCES AND ECONOMIES INCLUDED
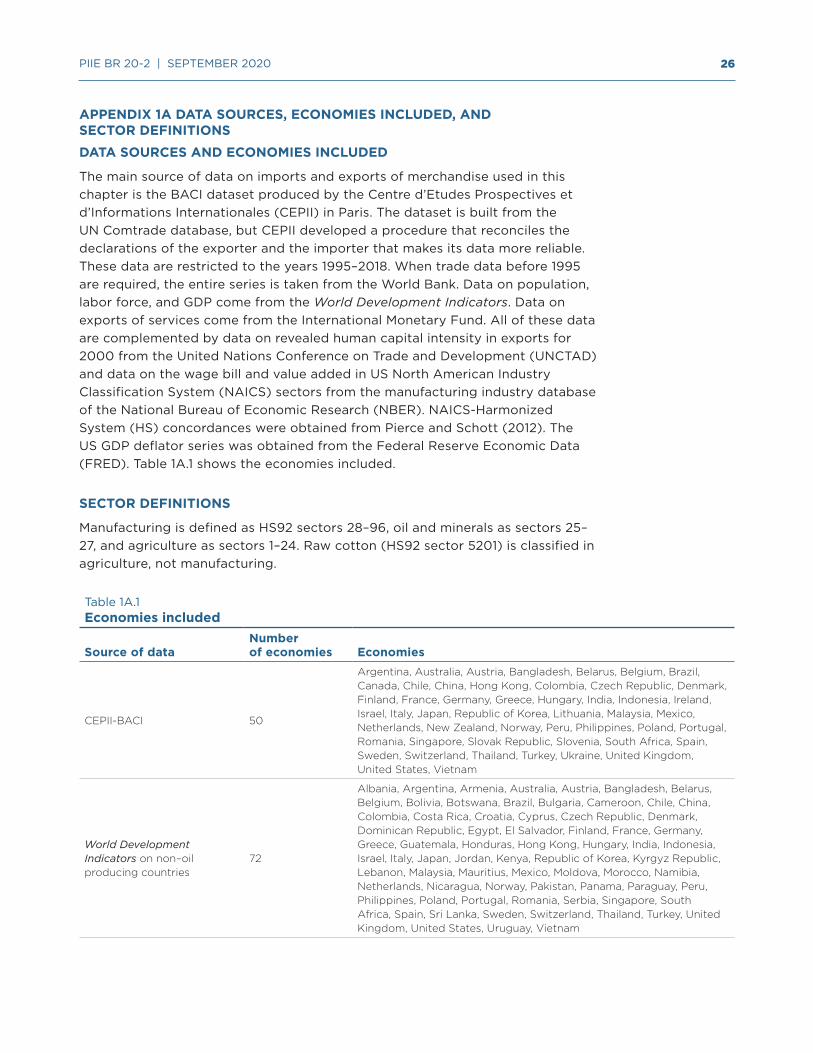
The main source of data on imports and exports of merchandise used in this chapter is the BACI dataset produced by the Centre d’Etudes Prospectives et d’Informations Internationales (CEPII) in Paris. The dataset is built from the UN Comtrade database, but CEPII developed a procedure that reconciles the declarations of the exporter and the importer that makes its data more reliable. These data are restricted to the years 1995–2018. When trade data before 1995 are required, the entire series is taken from the World Bank. Data on population, labor force, and GDP come from the World Development Indicators. Data on exports of services come from the International Monetary Fund. All of these data are complemented by data on revealed human capital intensity in exports for 2000 from the United Nations Conference on Trade and Development (UNCTAD) and data on the wage bill and value added in US North American Industry Classification System (NAICS) sectors from the manufacturing industry database of the National Bureau of Economic Research (NBER). NAICS-Harmonized System (HS) concordances were obtained from Pierce and Schott (2012). The US GDP deflator series was obtained from the Federal Reserve Economic Data (FRED). Table 1A.1 shows the economies included.
SECTOR DEFINITIONS
Manufacturing is defined as HS92 sectors 28–96, oil and minerals as sectors 25–27, and agriculture as sectors 1–24. Raw cotton (HS92 sector 5201) is classified in agriculture, not manufacturing.
Table 1A.1Economies included
Source of dataNumber of economies Economies
CEPII-BACI 50
Argentina, Australia, Austria, Bangladesh, Belarus, Belgium, Brazil, Canada, Chile, China, Hong Kong, Colombia, Czech Republic, Denmark, Finland, France, Germany, Greece, Hungary, India, Indonesia, Ireland, Israel, Italy, Japan, Republic of Korea, Lithuania, Malaysia, Mexico, Netherlands, New Zealand, Norway, Peru, Philippines, Poland, Portugal, Romania, Singapore, Slovak Republic, Slovenia, South Africa, Spain, Sweden, Switzerland, Thailand, Turkey, Ukraine, United Kingdom, United States, Vietnam
World Development Indicators on non–oil producing countries
72
Albania, Argentina, Armenia, Australia, Austria, Bangladesh, Belarus, Belgium, Bolivia, Botswana, Brazil, Bulgaria, Cameroon, Chile, China, Colombia, Costa Rica, Croatia, Cyprus, Czech Republic, Denmark, Dominican Republic, Egypt, El Salvador, Finland, France, Germany, Greece, Guatemala, Honduras, Hong Kong, Hungary, India, Indonesia, Israel, Italy, Japan, Jordan, Kenya, Republic of Korea, Kyrgyz Republic, Lebanon, Malaysia, Mauritius, Mexico, Moldova, Morocco, Namibia, Netherlands, Nicaragua, Norway, Pakistan, Panama, Paraguay, Peru, Philippines, Poland, Portugal, Romania, Serbia, Singapore, South Africa, Spain, Sri Lanka, Sweden, Switzerland, Thailand, Turkey, United Kingdom, United States, Uruguay, Vietnam

27 PIIE BR 20-2 | SEPTEMBER 2020
2 India’s Weak Links to America’s Supply ChainsMary E. Lovely and Yimin Yi
The trade war between China and the United States—which began in 2018 and has raised tariffs on bilateral trade in goods by the two countries to almost 20 percent—has disrupted the supply chains on which US manufacturers have grown to depend. As a result, many multinational companies have turned to other countries, including Vietnam, Bangladesh, and Mexico, to produce at least some inputs. Their actions highlight the ongoing response of US suppliers to overreliance on a single source country.
In theory, this trade war should also have opened opportunities for India, a country seeking greater employment creation in manufacturing. India’s advantages derive from its vast labor force, growing domestic market, and recent reforms under Prime Minister Narendra Modi to make India more hospitable to business investment.
This chapter assesses the potential for Indian merchandise exports to displace Chinese merchandise exports to the United States given current conditions. The assessment is based on a comparison of current US trade and investment patterns with the two countries. A main conclusion drawn from the data is that the profile of Indian exports to the United States differs systematically from that of China, limiting Indian capacity to seize an advantage in the sectors dominated by multinational supply chains. Although India has steadily reduced trade and investment barriers, the flow of inward foreign investment has grown slowly. American multinational enterprise activity in India is skewed away from manufacturing, in contrast to US investment in China. While India’s services sector, particularly in information, telecommunications, and other high-technology sectors has drawn foreign investment, manufacturing has lagged. Accordingly, despite the opportunity presented by the US-China trade war, India is not yet poised to supplant China in American supply chains. Indeed, collapsing world trade and supply chain retrenchment due to the global pandemic now pose additional challenges for India’s attempts to expand its manufacturing sector.
IS THE US-CHINA TRADE WAR AN OPPORTUNITY FOR INDIA?
Through its prowess in business process outsourcing, India now ranks among the world’s top 10 services-exporting countries. In contrast, it has made only slow progress in entering foreign goods markets. India’s share of world merchandise trade is small; it provided just 1.47 percent of world merchandise exports in 2010
Mary E. Lovely, senior fellow at the Peterson Institute for International Economics, is professor of economics and Melvin A. Eggers Faculty Scholar at Syracuse University’s Maxwell School of Citizenship and Public Affairs. Yimin Yi a PhD candidate in economics at the Department of Economics, Syracuse University. The authors thank Christopher Collins and David Xu for excellent research assistance.

28 PIIE BR 20-2 | SEPTEMBER 2020
and raised that share to only 1.66 percent in 2018.1 This performance reflects the slow development of India’s manufacturing sector, which for years contributed only about 15 percent of GDP, just below the 2018 average for its lower-middle-income peers (15.4 percent) and significantly below the 2018 average for middle-income countries (19.5 percent).2
India has progressively reduced or eliminated barriers on foreign investment in virtually all manufacturing sectors. Since taking office in 2014, Prime Minister Modi has promoted the Make in India campaign, a drive to build the country’s manufacturing capacity by lowering barriers to foreign investment and introducing regulatory reforms. These steps are in line with the Chinese playbook for leveraging trade and investment reforms to promote manufacturing. India needs manufacturing-led growth, as it has an expanding labor force yet suffers from underemployment and low productivity. To absorb workers migrating out of agriculture, India must produce employment for those with limited or no skills, a process historically associated with a rising share of manufacturing in GDP. Job creation in industry also creates demand for services, adding further life to job creation and income growth.3
Looming over Indian aspirations—as well as those of other low- and lower-middle-income countries eager for industrialization—is the massive scale and sophistication of China’s manufacturing. Since its accession to the World Trade Organization (WTO), China has moved to the center of the sprawling East Asian supply network, benefiting from the development of global value chains (GVCs). The fragmentation of high-tech manufacturing, which separates the production of intermediates from final assembly, intensified the share of GVC trade in total trade, especially to feed the burgeoning markets for transport equipment and electrical and optical devices.4 Despite almost two decades of rapid wage growth, China maintained and upgraded its role in these value chains, as evidenced by the steady increase in the domestic value added share of its merchandise exports.
China’s success in raising manufacturing employment is often seen as a model. But it also poses challenges to countries that seek to emulate it. Indian policymakers increasingly see Chinese imports as a threat to domestic manufacturing, as evidenced by recent increases in Indian tariffs on goods imported primarily from China.5 This fear was most recently manifested in India’s 11th-hour withdrawal from the China-centric Regional Comprehensive Economic
1 India’s share of world merchandise trade computed using data from the World Bank’s World Development Indicators. The figures differ slightly from those cited in figure 1.4 (panel a) in chapter 1 because the authors there use a different source (BACI dataset of the Centre d’Etudes Prospectives et d’Informations Internationales [CEPII]).
2 Manufacturing share of GDP obtained from World Bank, World Development Indicators. Figures cited are for 2018.
3 Panagariya (2019) emphasizes the need for India to accelerate formal job creation, especially for people with limited or no skills. He argues that developing a robust manufacturing sector is essential to achieving these objectives.
4 Chapter 1 of the World Development Report 2020 (World Bank 2020b) documents the growth of GVC trade and the contribution of individual manufacturing sectors to these trends.
5 Indian tariff hikes focused on goods for which China is a major supplier appear in the 2018 budget. See Mary E. Lovely, “Narendra Modi’s Rise in Import Tariffs Will Hurt India’s Economy,” op-ed, Financial Times, February 19, 2018, https://www.piie.com/commentary/op-eds/narendra-modis-rise-import-tariffs-will-hurt-indias-economy.

29 PIIE BR 20-2 | SEPTEMBER 2020
Partnership (RCEP). India runs a large merchandise trade deficit with China; its defensive actions suggest that it views China’s lead as too great for poorer countries to catch up to without significant protective walls.
The US-China trade war now requires the world’s manufacturing leader to fight for the world’s largest market with a substantial handicap. This competitive challenge, coupled with the pandemic-induced urgency to diversify sourcing, may outweigh the advantages of China’s rich networks of domestic suppliers. Can the double-whammy of COVID-19 and the US-China confrontation provide an opening for India to deepen its links to global supply chains? The Y2K (Year 2000) episode gave a permanent boost to Indian services exports by creating the urgent need for computer programmers. Could US tariffs and the search for supply chain resiliency provide a similar foothold for Indian manufactured exports?6
Trade conflict between the world’s two largest economies evolved over a two-year period beginning in early 2018, when the United States levied new duties on Chinese steel, aluminum, solar panels, and washing machines. The conflict escalated in mid-2018, when the United States levied tariffs on $250 billion of Chinese exports in retaliation for alleged intellectual property theft, forced technology transfer, and blocked market access.7 Additional tariffs on an estimated $110 billion in US imports followed in September 2019. Bown (2020) estimates that average US tariffs on imports from China remained at 19.3 percent after the signing of a bilateral “Phase 1 deal” in February 2020.8 The tariffs levied by the United States are thus an exogenous shock to Chinese export competitiveness in its most important market of potentially sufficient magnitude to disrupt global supply chains.
Under these circumstances, will the foreign-owned, globally connected firms that provide the bulk of US imports from China find India an attractive alternative location? This chapter examines current trade and investment patterns to assess the depth of existing linkages between India and the United States. Its premise is that foreign firms seek locations with advantages that have already been established by successful participation in GVCs.
India did not experience much of a lift from the US tariffs, because Chinese exports are more concentrated in sectors that are closely linked to GVCs and the presence of foreign-invested firms than Indian exports are. These differences in trade patterns reflect differences in both the magnitude and composition of foreign direct investment (FDI) in the two countries. India has steadily reduced barriers to foreign investment, but it has made only limited progress becoming part of global supply networks.
6 Mitra and Ranjan (2008b) construct a model of offshoring with externalities and firm hetero-geneity. Because of the presence of externalities, temporary shocks can permanently raise the extent of offshoring. Mitra and Ranjan (2008a) argue that the Y2K problem induced offshor-ing to India, permanently raising export activity in its business services sector. They provide evidence that India’s share of software exports rose dramatically after 1998 and continued to rise into the new century.
7 For a detailed timeline of US-China trade conflicts, see Chad P. Bown and Melina Kolb, “Trump’s Trade War Timeline: An Up-to-Date Guide,” March 13, 2020, Peterson Institute for International Economics, https://www.piie.com/blogs/trade-investment-policy-watch/trump-trade-war-china-date-guide.
8 For the average tariffs on Chinese exports over the course of the trade war, see Bown (2020).

30 PIIE BR 20-2 | SEPTEMBER 2020
DID INDIA GAIN US MARKET SHARE DURING THE US-CHINA TRADE WAR?
India’s labor abundance, foreign investment inflows, and trade liberalization make it a potential host for new export activity displaced from China by higher American tariffs. Following the imposition of new US tariffs in mid-2018, China’s exports to the United States fell substantially. Figure 2.1 shows changes in US market shares in 2019 and 2017 for two groups of imports: imports for which China was subject to new tariffs in 2018 and imports that were not. Products from China that were directly hit with new tariffs lost 4.0 percentage points of the US
Hong Kong
Taiwan
South Korea
Japan
Vietnam
India
Mexico
Singapore
EU15
Rest of world
China
Figure 2.1Changes in shares of US imports by selected economies between 2017 and 2019
Sources: USA Trade Online, Census Bureau, https://usatrade.census.gov; Bown (2019).
Products that do not face US tari�sProducts that face US tari�s
–.5
–.1
–.6
–.2
–.1–.3
–.4–5.7
–.2
.8
1.23.9
.2.3
1.4.1
.4
.61.3
.5
.3
.6
0 percentage point changein market share

31 PIIE BR 20-2 | SEPTEMBER 2020
market; products from China that were not hit with new tariffs lost an even larger share of the US market (5.7 percentage points). Several economies, particularly Mexico, Vietnam, and Taiwan, increased their share of the US market.
India’s market share rose for the group of products for which China was subject to new tariffs.9 Within both groups, exports rose for some products and fell for others. Gains and losses were concentrated in a few sectors.
This chapter highlights four sectors in which India gained US market share—pharmaceutical products and medicines, apparel, computer equipment, and communications equipment—to illustrate the heterogeneity of Indian experience following the imposition of tariffs on China.10 The United States did not raise tariffs on Chinese exports of pharmaceutical products and medicines (a sector in which Indian exports to the United States have long exceeded those from China) or apparel (a sector that was not subjected to new tariffs until late in the trade war but for which India’s US market share is small). It did raise tariffs on the two other sectors—computer equipment and communications equipment—both of which rely heavily on GVCs and intrafirm trade.
Figure 2.2 shows the ratio of India’s exports to the United States relative to China’s exports to the United States. In the apparel sector, India’s relative exports to the United States were rising before the tariffs were raised. The increase in 2019 followed the upward trend begun in 2012. Chinese exports of most apparel products were not subject to US tariffs until September 2019.
Indian exports of pharmaceutical products and medicines began to exceed those from China in the early 2000s. Indian exports dipped significantly in 2017, perhaps as a result of changes in the market for specific drugs. By 2019, Indian exports seem to be returning to their relative trend in comparison to those from China. The value of Indian exports of pharmaceutical products and medicines was almost three times that of China.
India’s export capacity is linked to that of China in these two sectors. China’s presence in global supply networks plays a role in India’s success in pharmaceutical products and medicines and its expanding presence in textile products. In pharmaceuticals and medicines, China is a major source of the chemical inputs used by Indian firms to manufacture active ingredients. These firms experienced supply bottlenecks during the coronavirus outbreak in China in early 2020.11
9 A host of factors—including idiosyncratic shocks to product demand, country-specific events, and general macroeconomic conditions—can cause fluctuations in import values. Controlling for these factors, Fajgelbaum et al. (2020) estimate that imports of products from countries targeted by US tariffs fell by an average of 31.7 percent in 2018.
10 Sectors are defined using the North American Industrial Classification System (NAICS).
11 India depends on China for about 70 percent of the active pharmaceutical ingredients (APIs) it uses in pharmaceutical manufacturing. Chinese supplies were largely restored in April 2020. The Indian government reportedly set aside $1.2 billion to help its pharmaceutical sector reduce its reliance on Chinese supplies (see “Indian Government Moves on APIs, as Chinese Supplies Are Returning,” The Pharmaletter, April 1, 2020, https://www.thepharmaletter.com/article/indian-government-moves-on-apis-as-chinese-supplies-are-returning).
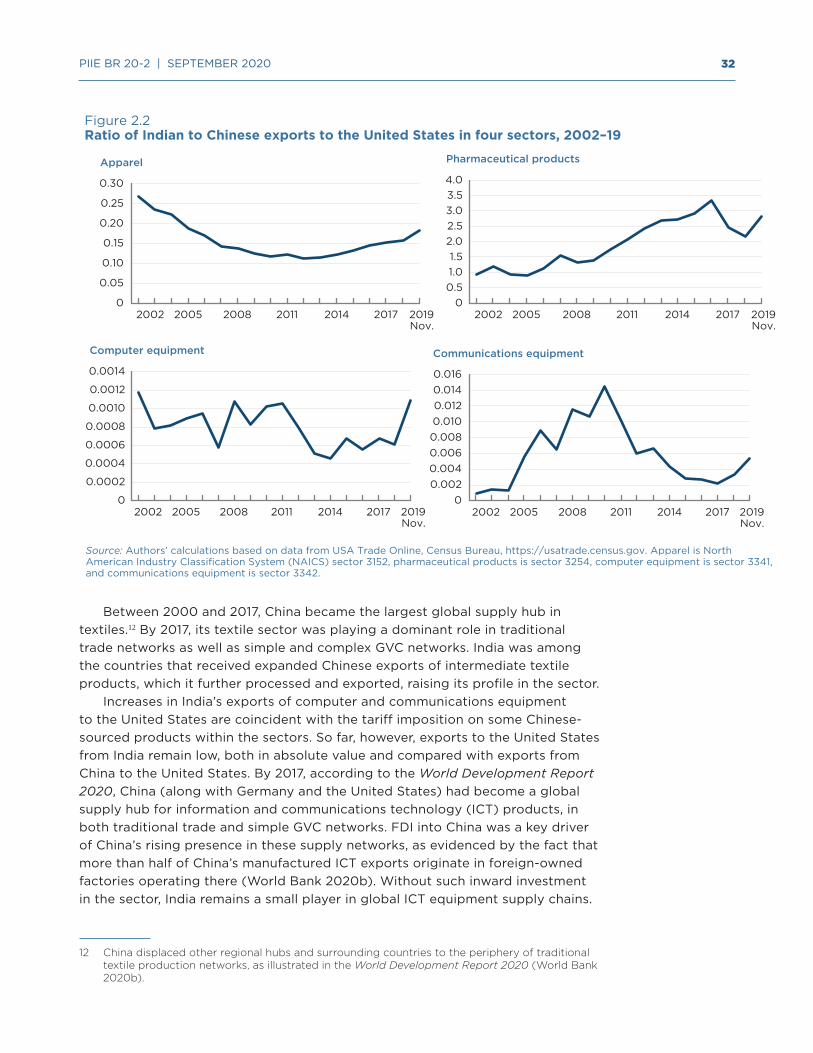
32 PIIE BR 20-2 | SEPTEMBER 2020
Between 2000 and 2017, China became the largest global supply hub in textiles.12 By 2017, its textile sector was playing a dominant role in traditional trade networks as well as simple and complex GVC networks. India was among the countries that received expanded Chinese exports of intermediate textile products, which it further processed and exported, raising its profile in the sector.
Increases in India’s exports of computer and communications equipment to the United States are coincident with the tariff imposition on some Chinese-sourced products within the sectors. So far, however, exports to the United States from India remain low, both in absolute value and compared with exports from China to the United States. By 2017, according to the World Development Report 2020, China (along with Germany and the United States) had become a global supply hub for information and communications technology (ICT) products, in both traditional trade and simple GVC networks. FDI into China was a key driver of China’s rising presence in these supply networks, as evidenced by the fact that more than half of China’s manufactured ICT exports originate in foreign-owned factories operating there (World Bank 2020b). Without such inward investment in the sector, India remains a small player in global ICT equipment supply chains.
12 China displaced other regional hubs and surrounding countries to the periphery of traditional textile production networks, as illustrated in the World Development Report 2020 (World Bank 2020b).
Figure 2.2Ratio of Indian to Chinese exports to the United States in four sectors, 2002–19
Source: Authors’ calculations based on data from USA Trade Online, Census Bureau, https://usatrade.census.gov. Apparel is North American Industry Classification System (NAICS) sector 3152, pharmaceutical products is sector 3254, computer equipment is sector 3341, and communications equipment is sector 3342.
0
0.05
0.10
0.15
0.20
0.25
0.30
Apparel
00.51.01.5
2.02.53.03.54.0
Pharmaceutical products
0
0.0002
0.0004
0.0006
0.0008
0.0010
0.0012
0.0014
Computer equipment
00.0020.0040.0060.0080.0100.0120.0140.016
2002 2005 2008 2011 2014 2017 2019Nov.
Communications equipment
2002 2005 2008 2011 2014 2017 2019Nov.
2002 2005 2008 2011 2014 2017 2019Nov.
2002 2005 2008 2011 2014 2017 2019Nov.

33 PIIE BR 20-2 | SEPTEMBER 2020
HOW DO CHINESE AND INDIAN EXPORTS TO THE UNITED STATES COMPARE?
Indian exporters are best placed to replace Chinese exporters in sectors where they already produce similar products and have already established relationships with buyers in North America. Analysis of the magnitude, extent, and nature of Chinese exports and their similarity with Indian exports suggests that India is not well equipped to replace China in US supply chains.
India improved its relative performance in the US market over the past decade (table 2.1). By 2018, the value of US merchandise imports from India was 9.4 percent of the value of merchandise imports from China, up from 7.1 percent in 2009.
India has acquired more than 9 percent of the US import market in four sectors (table 2.2).13 The first two, fish and marine products and forestry products, are natural resource based. The other two, textile mill products and miscellaneous manufacturing (which includes jewelry and medical devices), are more tightly woven into global supply chains. In no other sector, including the labor-intensive sectors of apparel and footwear, does India have a US market share above 10 percent.
Chinese exports account for more than 30 percent of US import value in a wide variety of sectors. China accounts for more than half the value of shipments of textile mill products and printed matter and related products. It is also a
13 These sectors are defined by the NAICS, the standard used by federal statistical agencies to classify business establishments for the purpose of collecting, analyzing, and publishing statis-tical data on the US business economy.
LOVELY - chapter 2
Table 2.1US merchandise imports from China and India, 2009–18 (billions of dollars)
YearUS imports from India
US imports from China
2009 22.04 309.53
2010 30.71 382.96
2011 37.46 417.34
2012 41.90 444.39
2013 43.22 459.11
2014 46.99 486.30
2015 46.68 504.03
2016 47.73 481.31
2017 50.52 525.76
2018 56.44 563.20
Source: UN Comtrade database.
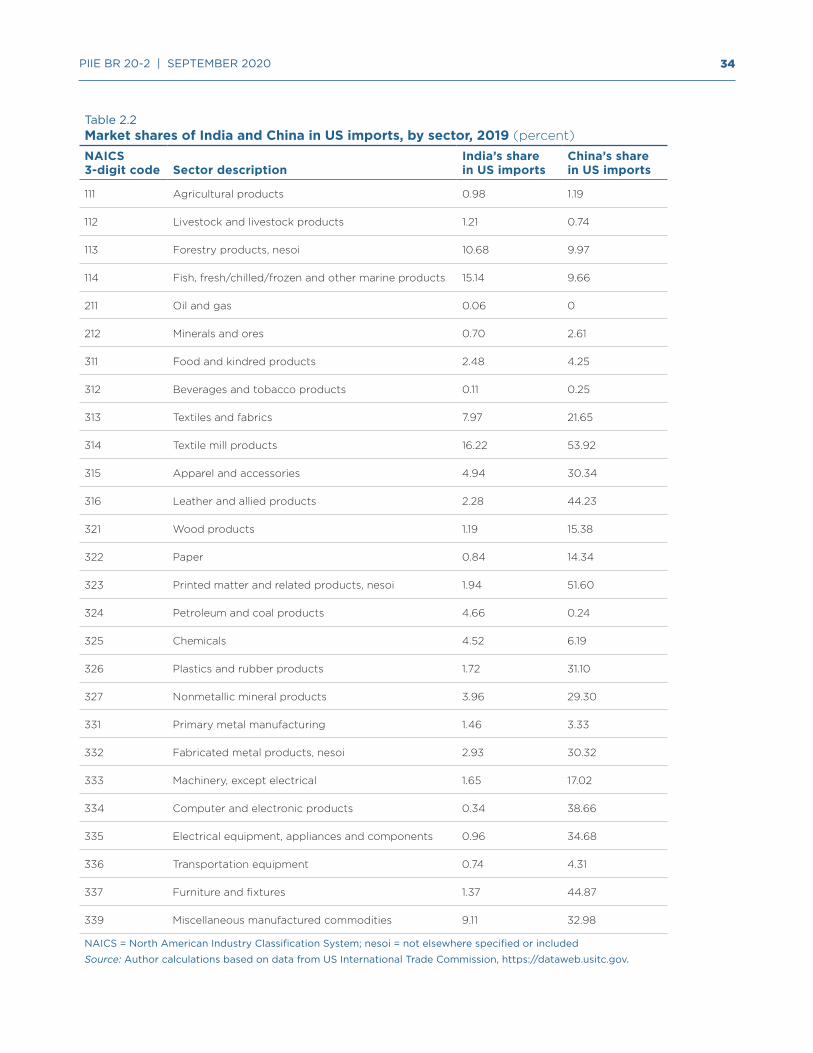
34 PIIE BR 20-2 | SEPTEMBER 2020
LOVELY - chapter 2
Table 2.2Market shares of India and China in US imports, by sector, 2019 (percent)
NAICS 3-digit code Sector description
India’s share in US imports
China’s share in US imports
111 Agricultural products 0.98 1.19
112 Livestock and livestock products 1.21 0.74
113 Forestry products, nesoi 10.68 9.97
114 Fish, fresh/chilled/frozen and other marine products 15.14 9.66
211 Oil and gas 0.06 0
212 Minerals and ores 0.70 2.61
311 Food and kindred products 2.48 4.25
312 Beverages and tobacco products 0.11 0.25
313 Textiles and fabrics 7.97 21.65
314 Textile mill products 16.22 53.92
315 Apparel and accessories 4.94 30.34
316 Leather and allied products 2.28 44.23
321 Wood products 1.19 15.38
322 Paper 0.84 14.34
323 Printed matter and related products, nesoi 1.94 51.60
324 Petroleum and coal products 4.66 0.24
325 Chemicals 4.52 6.19
326 Plastics and rubber products 1.72 31.10
327 Nonmetallic mineral products 3.96 29.30
331 Primary metal manufacturing 1.46 3.33
332 Fabricated metal products, nesoi 2.93 30.32
333 Machinery, except electrical 1.65 17.02
334 Computer and electronic products 0.34 38.66
335 Electrical equipment, appliances and components 0.96 34.68
336 Transportation equipment 0.74 4.31
337 Furniture and fixtures 1.37 44.87
339 Miscellaneous manufactured commodities 9.11 32.98
NAICS = North American Industry Classification System; nesoi = not elsewhere specified or included
Source: Author calculations based on data from US International Trade Commission, https://dataweb.usitc.gov.
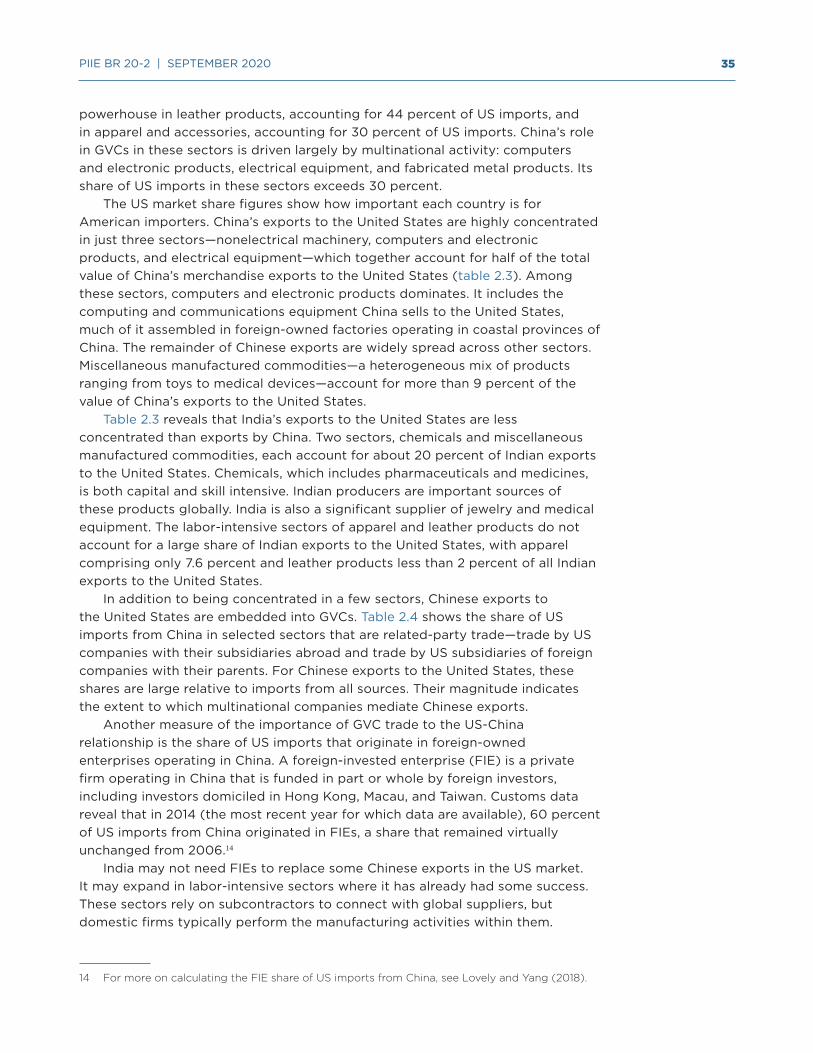
35 PIIE BR 20-2 | SEPTEMBER 2020
powerhouse in leather products, accounting for 44 percent of US imports, and in apparel and accessories, accounting for 30 percent of US imports. China’s role in GVCs in these sectors is driven largely by multinational activity: computers and electronic products, electrical equipment, and fabricated metal products. Its share of US imports in these sectors exceeds 30 percent.
The US market share figures show how important each country is for American importers. China’s exports to the United States are highly concentrated in just three sectors—nonelectrical machinery, computers and electronic products, and electrical equipment—which together account for half of the total value of China’s merchandise exports to the United States (table 2.3). Among these sectors, computers and electronic products dominates. It includes the computing and communications equipment China sells to the United States, much of it assembled in foreign-owned factories operating in coastal provinces of China. The remainder of Chinese exports are widely spread across other sectors. Miscellaneous manufactured commodities—a heterogeneous mix of products ranging from toys to medical devices—account for more than 9 percent of the value of China’s exports to the United States.
Table 2.3 reveals that India’s exports to the United States are less concentrated than exports by China. Two sectors, chemicals and miscellaneous manufactured commodities, each account for about 20 percent of Indian exports to the United States. Chemicals, which includes pharmaceuticals and medicines, is both capital and skill intensive. Indian producers are important sources of these products globally. India is also a significant supplier of jewelry and medical equipment. The labor-intensive sectors of apparel and leather products do not account for a large share of Indian exports to the United States, with apparel comprising only 7.6 percent and leather products less than 2 percent of all Indian exports to the United States.
In addition to being concentrated in a few sectors, Chinese exports to the United States are embedded into GVCs. Table 2.4 shows the share of US imports from China in selected sectors that are related-party trade—trade by US companies with their subsidiaries abroad and trade by US subsidiaries of foreign companies with their parents. For Chinese exports to the United States, these shares are large relative to imports from all sources. Their magnitude indicates the extent to which multinational companies mediate Chinese exports.
Another measure of the importance of GVC trade to the US-China relationship is the share of US imports that originate in foreign-owned enterprises operating in China. A foreign-invested enterprise (FIE) is a private firm operating in China that is funded in part or whole by foreign investors, including investors domiciled in Hong Kong, Macau, and Taiwan. Customs data reveal that in 2014 (the most recent year for which data are available), 60 percent of US imports from China originated in FIEs, a share that remained virtually unchanged from 2006.14
India may not need FIEs to replace some Chinese exports in the US market. It may expand in labor-intensive sectors where it has already had some success. These sectors rely on subcontractors to connect with global suppliers, but domestic firms typically perform the manufacturing activities within them.
14 For more on calculating the FIE share of US imports from China, see Lovely and Yang (2018).

36 PIIE BR 20-2 | SEPTEMBER 2020
LOVELY - chapter 2 LOVELY - chapter 2
Table 2.3Distribution of US imported goods from India and China by product type, 2019 (percent of total)
NAICS 3-digit code Sector description India’s share China’s share
111 Agricultural products 0.64 0.10
112 Livestock and livestock products 0.14 0.01
113 Forestry products, nesoi 0.48 0.06
114 Fish, fresh/chilled/frozen and other marine products 4.15 0.34
211 Oil and gas 0.12 0
212 Minerals and ores 0.07 0.03
311 Food and kindred products 2.91 0.64
312 Beverages and tobacco products 0.05 0.01
313 Textiles and fabrics 1.12 0.39
314 Textile mill products 6.52 2.78
315 Apparel and accessories 7.58 5.97
316 Leather and allied products 1.54 3.83
321 Wood products 0.37 0.62
322 Paper 0.30 0.67
323 Printed matter and related products, nesoi 0.20 0.67
324 Petroleum and coal products 5.85 0.04
325 Chemicals 20.30 3.57
326 Plastics and rubber products 1.74 4.04
327 Nonmetallic mineral products 1.63 1.55
331 Primary metal manufacturing 2.15 0.63
332 Fabricated metal products, nesoi 3.82 5.06
333 Machinery, except electrical 5.33 7.04
334 Computer and electronic products 2.27 33.14
335 Electrical equipment, appliances and components 2.01 9.36
336 Transportation equipment 5.24 3.92
337 Furniture and fixtures 1.00 4.18
339 Miscellaneous manufactured commodities 20.25 9.40
NAICS = North American Industry Classification System; nesoi = not elsewhere specified or included
Source: Author calculations based on data from US International Trade Commission, https://dataweb.usitc.gov.
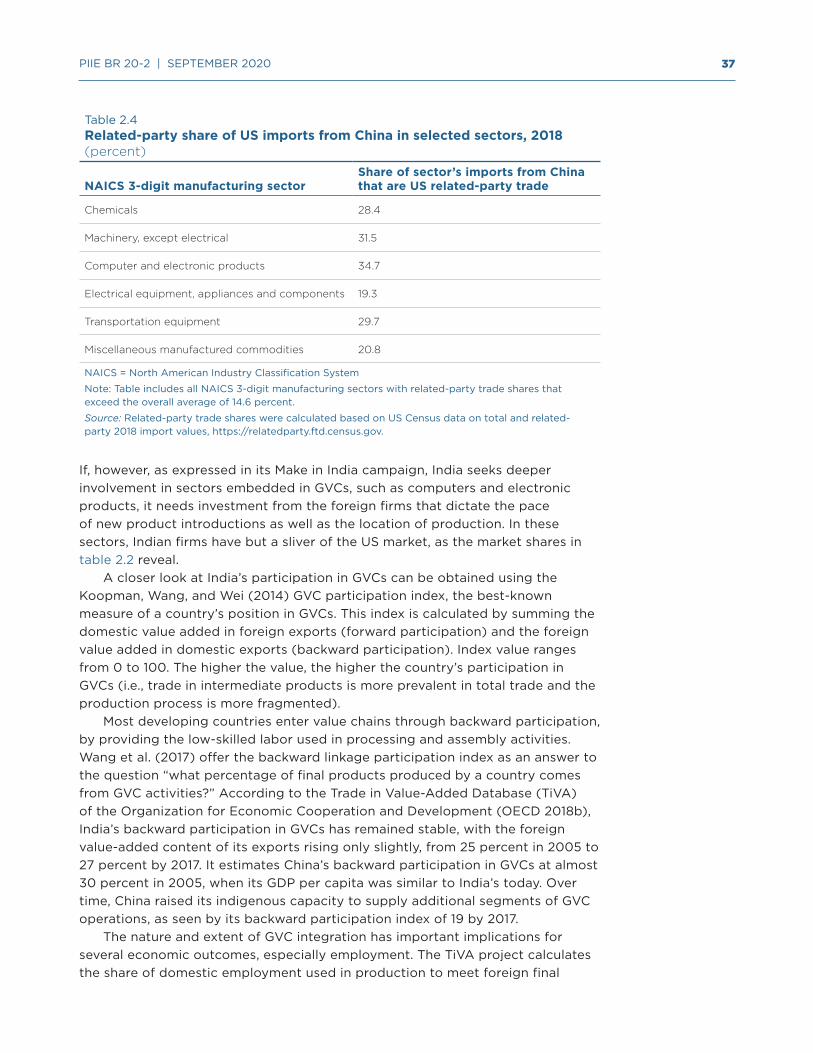
37 PIIE BR 20-2 | SEPTEMBER 2020
If, however, as expressed in its Make in India campaign, India seeks deeper involvement in sectors embedded in GVCs, such as computers and electronic products, it needs investment from the foreign firms that dictate the pace of new product introductions as well as the location of production. In these sectors, Indian firms have but a sliver of the US market, as the market shares in table 2.2 reveal.
A closer look at India’s participation in GVCs can be obtained using the Koopman, Wang, and Wei (2014) GVC participation index, the best-known measure of a country’s position in GVCs. This index is calculated by summing the domestic value added in foreign exports (forward participation) and the foreign value added in domestic exports (backward participation). Index value ranges from 0 to 100. The higher the value, the higher the country’s participation in GVCs (i.e., trade in intermediate products is more prevalent in total trade and the production process is more fragmented).
Most developing countries enter value chains through backward participation, by providing the low-skilled labor used in processing and assembly activities. Wang et al. (2017) offer the backward linkage participation index as an answer to the question “what percentage of final products produced by a country comes from GVC activities?” According to the Trade in Value-Added Database (TiVA) of the Organization for Economic Cooperation and Development (OECD 2018b), India’s backward participation in GVCs has remained stable, with the foreign value-added content of its exports rising only slightly, from 25 percent in 2005 to 27 percent by 2017. It estimates China’s backward participation in GVCs at almost 30 percent in 2005, when its GDP per capita was similar to India’s today. Over time, China raised its indigenous capacity to supply additional segments of GVC operations, as seen by its backward participation index of 19 by 2017.
The nature and extent of GVC integration has important implications for several economic outcomes, especially employment. The TiVA project calculates the share of domestic employment used in production to meet foreign final
LOVELY - chapter 2
Table 2.4Related-party share of US imports from China in selected sectors, 2018 (percent)
NAICS 3-digit manufacturing sectorShare of sector’s imports from China that are US related-party trade
Chemicals 28.4
Machinery, except electrical 31.5
Computer and electronic products 34.7
Electrical equipment, appliances and components 19.3
Transportation equipment 29.7
Miscellaneous manufactured commodities 20.8
NAICS = North American Industry Classification System
Note: Table includes all NAICS 3-digit manufacturing sectors with related-party trade shares that exceed the overall average of 14.6 percent.
Source: Related-party trade shares were calculated based on US Census data on total and related-party 2018 import values, https://relatedparty.ftd.census.gov.

38 PIIE BR 20-2 | SEPTEMBER 2020
demand (i.e., the share of domestic employment that is dependent on overseas markets). Perhaps surprisingly, the OECD finds that both China and India have similar dependencies: About 12 percent of employment in each country was dependent on foreign final demand in 2015 (OECD 2018a). The mix of jobs dependent on GVC trade in the two countries differs, however. Services constitute almost a third of value added in exports for India, a much larger share than in China (OECD 2018a).
Another indicator of the slow progress of Indian manufacturers into GVCs is payments for the use of intellectual property. Manufacturers engaged in high-tech activity must compensate foreign intellectual property owners for the use of their proprietary assets.15 Indian payments have grown steadily since 2007, a sign of growing engagement with technology value chains, even as India lags far behind China (figure 2.3).
FOREIGN INVESTMENT IN INDIAN MANUFACTURING
The World Bank’s assessment of the drivers of GVC participation finds that after controlling for factor endowments, institutional quality, and trade policy, the presence of FIEs is important in generating backward GVC participation (World Bank 2020b). Although the link between FDI and GVC participation is hard to
15 Intellectual property assets include patents, trademarks, and copyrights; industrial processes and designs, including trade secrets; and franchises. They can be used through licensing agree-ments for the production of originals or prototypes (such as copyrights on books and manu-scripts, computer software, cinematographic works, and sound recordings) and related rights (such as for live performances and television, cable, or satellite broadcast).
1997 2000 2003 2006 2009 2012 2015 2018
35
30
25
20
15
10
5
0
payments for use of intellectual property(billions of dollars)
Figure 2.3 Annual payments for use of intellectual property in India and China, 1997–2018
Note: Charges for the use of intellectual property are payments by residents and receipts from nonresidents for the authorized use of proprietary rights and the use, through licensing agreements, of produced originals or prototypes and related rights. Source: World Bank, World Development Indicators.
China
India

39 PIIE BR 20-2 | SEPTEMBER 2020
disentangle (as they are highly correlated across countries), multinational firms are involved at some stage of production in virtually all GVCs. Across countries that have successfully entered GVCs, FDI inflows pick up substantially before entry into basic manufacturing or more advanced value chains.
India’s experience appears to conform to these broad patterns. Its share of world manufacturing exports is correlated with FDI in its manufacturing sector (figure 2.4). Despite increased flows of foreign investment to India, however, its share of total world manufacturing exports remains below 2 percent.
India has many characteristics that are attractive to foreign firms seeking a location for export-oriented manufacturing. First, India has a relatively young and growing labor supply. Education in India is compulsory for all children aged 6–14 and provided free of charge at public schools. Second, successive Indian governments have prioritized investment in infrastructure, including electricity generation and distribution; air, rail, and seaports; and interior roads. Third, in recent years India has reduced regulatory costs and trade barriers. Sustained business reforms over the past several years helped India jump to 63rd in the World Bank’s 2020 Doing Business rankings, indicating an improving business climate for investment in the country.
As a location for export production, however, India’s frequent changes of tariff rates, reflecting the gap between its most favored nation (MFN) rates and bound rates, raises uncertainty for foreign investors. In 2018, India’s simple average applied MFN tariff rate was 17.1 percent and its average bound rate 50.8 percent (as Euijin Jung notes in chapter 3 of this volume). Although rates are much higher for agricultural imports than for manufactures, in its last two budgets India raised tariffs on both ICT products and automobiles and parts.
FDI in India’s manufacturing sector(millions of dollars)
India’s share of world manufacturing exports(percent)
2.0
1.8
1.6
1.4
1.2
1.0
0.8
0 2,000 4,000 6,000 8,000 10,000 12,000
Figure 2.4Correlation between India’s share of world manufacturing exports and foreign direct investment in its manufacturing sector, 2000–18
Source: Data on FDI in India’s manufacturing sector data are from the Reserve Bank of India’s annual reports. Data on India’s share of world manufacturing exports are from the World Bank, World Development Indicators.

40 PIIE BR 20-2 | SEPTEMBER 2020
India encourages inward manufacturing investment while frequently changing tariffs by offering tariff rebates to investors under certain circumstances. Most relevant for its ambition to enter GVCs is the Special Economic Zone (SEZ) Act, which passed in 2005. It encourages foreign capital to enter India by “making available goods and services free of taxes and duties, creating integrated infrastructure for export production, enabling expeditious and single-window approval mechanisms, and offering a package of incentives to attract foreign and domestic investment to promote export-led growth.”16 The broad category of SEZs encompasses several types of zones, including free trade zones and export-processing zones. The act also addresses difficulties experienced by some foreign investors in assembling land parcels for development, by facilitating the appropriation of land for export-oriented zones.
By some accounts, foreign investment and employment in these zones grew steadily. Other evaluations give India’s SEZs low marks. Alkon (2018) assesses the developmental effects of India’s SEZs, leveraging an original dataset on their locations together with 2001 and 2011 census data that include a host of social and economic development variables. He defines developmental spillovers as changes in development “inputs,” such as basic infrastructure and government services, as well as changes in employment. He finds that SEZs failed to bring about local socioeconomic development. His framework suggests that place-based export policies such as SEZs can be beneficial to local development only when local politicians are incentivized, through elections or promotion, to support such development (as is the case in China) and rent extraction is sufficiently constrained. The absence of these incentives and constraints in India, he concludes, contributed to the ineffectiveness of its SEZs in spurring development. In particular, local officials selected sites for SEZs based on real estate speculation rather than the economic potential of a region.
Have India’s commercial and FDI promotion policies resulted in inward investment tied to GVCs? In nominal terms, the value of FDI in India more than doubled between 2013–14 and 2017–18 (table 2.5). Ownership of 29 percent of this investment is registered in Mauritius, a well-known tax haven. The second-largest official source is Singapore, which may be a platform for investors from China. Relatively small flows came from Japan and South Korea and none came from Taiwan, all key locations for multinationals driving GVCs.
About 29 percent of inward FDI over this period flowed into India’s manufacturing sector. In contrast, 46 percent of FDI in China went to manufacturing. The share directed to communication and business services was much lower in China than in India.17
Contrasting the pattern of US FDI in India and China yields additional insight into India’s attractiveness to foreign investors. The magnitude of US investment was far smaller in India than in China. Total assets of US multinational enterprise affiliates in India were $195 billion in 2017 (BEA 2019). A third of these assets (34
16 Wisconsin Economic Development Corporation, “India’s Special Economic Zones Boost Foreign Investment,” August 1, 2018, https://wedc.org/export/market-intelligence/posts/indias-special-economic-zones-boost-foreign-investment/.
17 Chinese FDI inflows obtained from National Bureau of Statistics of China. Comparison of FDI into services between the two countries is difficult due to different service industry classifica-tions.

41 PIIE BR 20-2 | SEPTEMBER 2020
percent) were in finance and insurance, and 24 percent were in manufacturing. In contrast, total assets of US multinational enterprises in China were $719 billion in 2017, with the largest share (40 percent) in manufacturing. 18
Sales of goods and services by all US affiliates in India totaled $111 billion in 2017, 82 percent of which were by majority-owned affiliates. In contrast, sales of goods and services by all US foreign affiliates in China totaled $544 billion
18 Asset data taken from BEA’s Table I.B5, available online at https://www.bea.gov/worldwide-activities-us-multinational-enterprises-revised-2017-statistics.
LOVELY - chapter 2 LOVELY - chapter 2
Table 2.5Foreign direct investment (FDI) flows to India, by source country and industry, 2013–17 (millions of dollars)
Source/sector 2013–14 2014–15 2015–16 2016–17 2017–18(p)Cumulative inflows
Percent to total inflows
Total foreign direct investment
16,054 24,748 36,068 36,317 37,366 150,553 100.00
Country-wise inflows
Mauritius 3,695 5,878 7,452 13,383 13,415 43,823 29.11
Singapore 4,415 5,137 12,479 6,529 9,273 37,833 25.13
Netherlands 1,157 2,154 2,330 3,234 2,677 11,552 7.67
United States 617 1,981 4,124 2,138 1,973 10,833 7.20
Japan 1,795 2,019 1,818 4,237 1,313 11,182 7.43
Cayman Islands 25 72 440 49 1,140 1,726 1.15
Germany 650 942 927 845 1,095 4,459 2.96
Hong Kong 85 325 344 134 1,044 1,932 1.28
United Kingdom 111 1,891 842 1,301 716 4,861 3.23
Switzerland 356 292 195 502 506 1,851 1.23
United Arab Emirates 239 327 961 645 408 2,580 1.71
France 229 347 392 487 403 1,858 1.23
China 121 505 461 198 350 1,635 1.09
Italy 185 167 279 364 308 1,303 0.87
South Korea 189 138 241 466 293 1,327 0.88
Cyprus 546 737 488 282 290 2,343 1.56
Canada 11 153 52 32 274 522 0.35
Other 1,626 1,682 2,243 1,490 1,889 8,930 5.93
Table continues
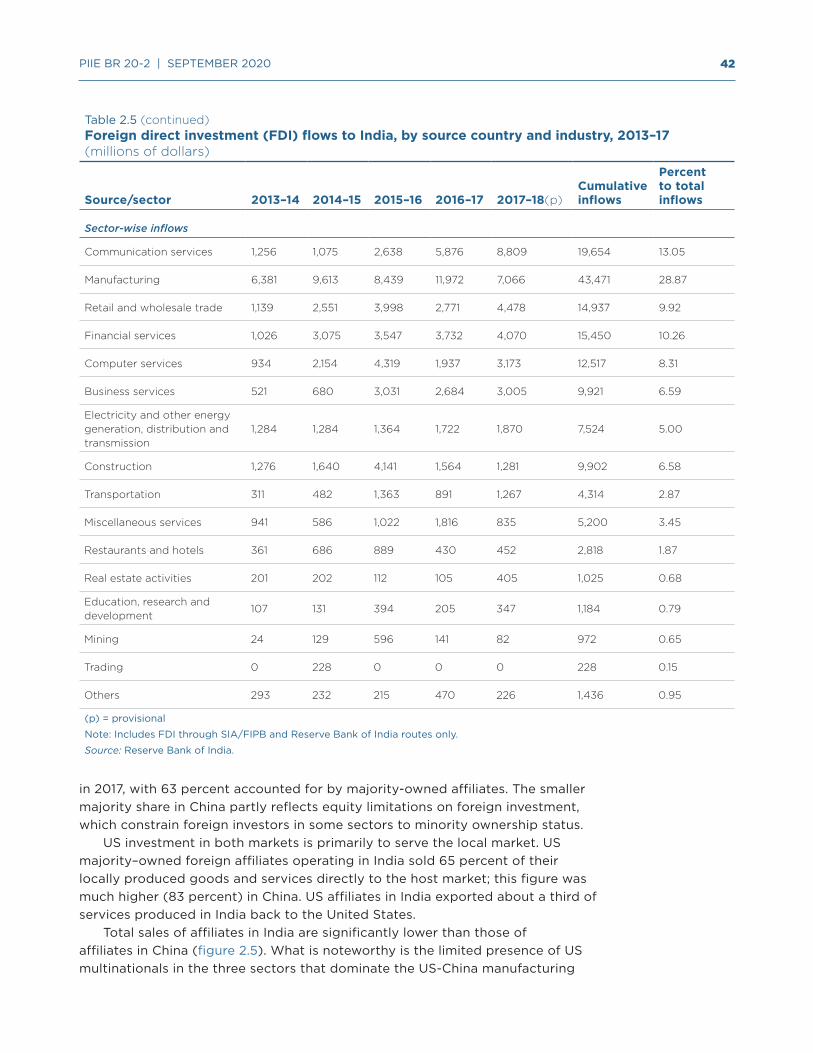
42 PIIE BR 20-2 | SEPTEMBER 2020
in 2017, with 63 percent accounted for by majority-owned affiliates. The smaller majority share in China partly reflects equity limitations on foreign investment, which constrain foreign investors in some sectors to minority ownership status.
US investment in both markets is primarily to serve the local market. US majority–owned foreign affiliates operating in India sold 65 percent of their locally produced goods and services directly to the host market; this figure was much higher (83 percent) in China. US affiliates in India exported about a third of services produced in India back to the United States.
Total sales of affiliates in India are significantly lower than those of affiliates in China (figure 2.5). What is noteworthy is the limited presence of US multinationals in the three sectors that dominate the US-China manufacturing
LOVELY - chapter 2
Table 2.5 (continued)Foreign direct investment (FDI) flows to India, by source country and industry, 2013–17 (millions of dollars)
Source/sector 2013–14 2014–15 2015–16 2016–17 2017–18(p)Cumulative inflows
Percent to total inflows
Sector-wise inflows
Communication services 1,256 1,075 2,638 5,876 8,809 19,654 13.05
Manufacturing 6,381 9,613 8,439 11,972 7,066 43,471 28.87
Retail and wholesale trade 1,139 2,551 3,998 2,771 4,478 14,937 9.92
Financial services 1,026 3,075 3,547 3,732 4,070 15,450 10.26
Computer services 934 2,154 4,319 1,937 3,173 12,517 8.31
Business services 521 680 3,031 2,684 3,005 9,921 6.59
Electricity and other energy generation, distribution and transmission
1,284 1,284 1,364 1,722 1,870 7,524 5.00
Construction 1,276 1,640 4,141 1,564 1,281 9,902 6.58
Transportation 311 482 1,363 891 1,267 4,314 2.87
Miscellaneous services 941 586 1,022 1,816 835 5,200 3.45
Restaurants and hotels 361 686 889 430 452 2,818 1.87
Real estate activities 201 202 112 105 405 1,025 0.68
Education, research and development
107 131 394 205 347 1,184 0.79
Mining 24 129 596 141 82 972 0.65
Trading 0 228 0 0 0 228 0.15
Others 293 232 215 470 226 1,436 0.95
(p) = provisional
Note: Includes FDI through SIA/FIPB and Reserve Bank of India routes only.
Source: Reserve Bank of India.

43 PIIE BR 20-2 | SEPTEMBER 2020
LOVELY - chapter 2
Table 2.5 (continued)Foreign direct investment (FDI) flows to India, by source country and industry, 2013–17 (millions of dollars)
Source/sector 2013–14 2014–15 2015–16 2016–17 2017–18(p)Cumulative inflows
Percent to total inflows
Sector-wise inflows
Communication services 1,256 1,075 2,638 5,876 8,809 19,654 13.05
Manufacturing 6,381 9,613 8,439 11,972 7,066 43,471 28.87
Retail and wholesale trade 1,139 2,551 3,998 2,771 4,478 14,937 9.92
Financial services 1,026 3,075 3,547 3,732 4,070 15,450 10.26
Computer services 934 2,154 4,319 1,937 3,173 12,517 8.31
Business services 521 680 3,031 2,684 3,005 9,921 6.59
Electricity and other energy generation, distribution and transmission
1,284 1,284 1,364 1,722 1,870 7,524 5.00
Construction 1,276 1,640 4,141 1,564 1,281 9,902 6.58
Transportation 311 482 1,363 891 1,267 4,314 2.87
Miscellaneous services 941 586 1,022 1,816 835 5,200 3.45
Restaurants and hotels 361 686 889 430 452 2,818 1.87
Real estate activities 201 202 112 105 405 1,025 0.68
Education, research and development
107 131 394 205 347 1,184 0.79
Mining 24 129 596 141 82 972 0.65
Trading 0 228 0 0 0 228 0.15
Others 293 232 215 470 226 1,436 0.95
(p) = provisional
Note: Includes FDI through SIA/FIPB and Reserve Bank of India routes only.
Source: Reserve Bank of India.
relationship: electrical equipment, computers and electronic products, and machinery. As of 2017, the last year for which data are available, there was no evidence that US companies invested in India for manufacturing in these sectors.
Research and development (R&D) expenditures by US multinational enterprises in India and China are similar, at about $3.5 billion in 2017. But expenditures are directed in very different ways in the two host countries (figure 2.6). India is the host primarily for innovative activities by service affiliates, whereas China is the host primarily for innovative activities by manufacturing affiliates.
THE CROWDED FIELD OF CONTENDERS VYING TO REPLACE CHINA
Multinational supply chains have responded to trade hostility between the United States and China by moving some production to Mexico and emerging Asia. Continued trade conflict, which now seems destined to center on technology products, is likely to further reduce reliance on China as a key source of exports of components and parts to the United States. The COVID-19 pandemic adds urgency to the search for new locations for supply chain production.
With its large domestic market, huge labor force, and improved business conditions, India would seem to be a promising candidate for new FDI in manufacturing. But global supply chains do not seem headed in India’s direction. India has gained US market share in some manufacturing sectors,
99.9
3.5
1.1
5.6
1.7
$7.2 billion
Food
Chemicals
Primary and fabricated metals
Machinery
Computers and electronic products
Electrical equipment, appliances and components
Transportation equipment
sales(billions of dollars)
Figure 2.5Sales of US manufacturing affiliates in India and China, by sector, 2017
Note: For data confidentiality, the BEA does not provide total sales in some sectors so there may be some sales in sectors without data. Source: Authors’ calculations based on data from the US Bureau of Economic Analysis (BEA 2019) on US direct investment abroad.
10.3
$59.2 billion
8.3
86.6
11.3
11.1
IndiaChina

44 PIIE BR 20-2 | SEPTEMBER 2020
but the largest gains are in sectors where India already displayed strength, notably pharmaceuticals and medicines. Despite a long commitment to reform and greater openness to foreign investment, India’s share of world exports has increased only sluggishly. It maintains only a small share of the US market for labor-intensive manufactured goods such as apparel, footwear, and wood products. Sectors where India is a major supplier—textile mill products and chemicals (largely pharmaceuticals)—depend on intermediates imported from China.
India’s trade patterns reflect its failure to link into GVCs for computers and communications devices, product categories in which its share of the US market is low. Most foreign investment flows into business services, not manufacturing. India’s weak link to high-tech manufacturing is evidenced by the fact that US multinational affiliates spend four times as much in India on R&D in professional, scientific, and technical services as they do on manufacturing-related R&D.
India’s recent attempts to attract investment—such as a cut in its corporate tax rate in fall 2019—have attracted some high-profile manufacturing investment. In November 2019, for example, Salcomp, a Finnish supplier to Apple, announced that it would invest $279 million in India to recast a facility once owned by
2,098
552
1,035
2,342
$517 million$692 million
0
500
1,000
1,500
2,000
2,500
3,000
3,500
4,000
China India
R&D expenditures(millions of dollars)
Figure 2.6Research and development expenditures by US majority–owned affiliates in India and China, 2017
Source: Authors’ calculations based on data from the US Bureau of Economic Analysis (BEA 2019) on US direct investment abroad.
Professional, scientific, and technical servicesTotal manufacturing
Other
45 PIIE BR 20-2 | SEPTEMBER 2020
Nokia.19 The renovated facility will make mobile chargers and other smartphone components. Beyond individual projects, however, recent trends for India suggest that the pace of foreign investment in India will increase only slowly.
Additional sweeteners for foreign investors are reportedly in the offing.20 The Indian government recently identified specific sectors—electrical equipment, pharmaceuticals and medicines, medical devices, electronics, heavy engineering, solar equipment, food processing, chemicals, and textiles—as focus areas for promoting foreign investment in manufacturing. Beyond tax breaks, the new program will attempt to further ease the process of assembling land for industrial development. Government consolidation of land parcels and site preparation are among the ways in which foreign entry into these sectors is to be subsidized.
The US push away from China offers new opportunities to developing countries seeking links to multinational firms’ GVCs. India is not alone in its desire to supplant China in the global supply chains that drive much of today’s international trade. Emerging Southeast Asian countries are using investment subsidies to compete actively for companies willing to move factories out of China.21 Indonesia, for example, is using new tax breaks and land subsidies to attract foreign investors. India thus stands in a crowded field, with a limited track record of success.
REFERENCES
Alkon, M. 2018. Do Special Economic Zones Induce Developmental Spillovers? Evidence from India’s States. World Development 107: 396-409.
BEA (Bureau of Economic Analysis). 2019. Survey of US Direct Investment Abroad. Washington.
Bown, Chad P. 2019. Trump’s Fall 2019 China Tariff Plan: Five Things You Need to Know. Trade and Investment Policy Watch, August 14. Washington: Peterson Institute for International Economics. Available at https://www.piie.com/blogs/trade-and-investment-policy-watch/trumps-fall-2019-china-tariff-plan-five-things-you-need-know.
Bown, Chad P. 2020. US-China Trade War Tariffs: An Up-to-Date Chart, February 14. Washington: Peterson Institute for International Economics. Available at https://www.piie.com/research/piie-charts/us-china-trade-war-tariffs-date-chart.
Fajgelbaum, P.D., P.K. Goldberg, P.J. Kennedy, and A.K. Khandelwal. 2020. The Return to Protectionism. Quarterly Journal of Economics 135, no. 1: 1–55.
Koopman, R., Z. Wang, and S.-J. Wei. 2014. Tracing Value-Added and Double Counting in Gross Export. American Economic Review 104, no. 2: 459–94.
Lovely, Mary E., and Yang Liang. 2018. Trump Tariffs Primarily Hit Multinational Supply Chains, Harm US Technology Competitiveness. PIIE Policy Brief 18-12. Washington: Peterson Institute for International Economics. Available at https://www.piie.com/system/files/documents/pb18-12.pdf.
19 Sankalp Phartiyal, “Apple Supplier Salcomp to Invest $279 Million In New Indian Plant,” Reuters, November 25, 2019, https://www.reuters.com/article/us-apple-india/apple-supplier-salcomp-to-invest-279-million-in-new-indian-plant-idUSKBN1XZ0ZU.
20 Shruti Srivastava, “India Pledges Easy Access to Land for Factories Leaving China,” Bloomberg, May 4, 2020, https://www.bloomberg.com/news/articles/2020-05-04/india-offers-land-twice-luxembourg-s-size-to-firms-leaving-china.
21 Koya Jibiki, “Southeast Asia Vies for Foreign Manufacturers Leaving China,” Nikkei Asian Review, July 4, 2020, https://asia.nikkei.com/Economy/Southeast-Asia-vies-for-foreign-manufacturers-leaving-China.

46 PIIE BR 20-2 | SEPTEMBER 2020
Mitra, D., and P. Ranjan. 2008a. The Economics of Offshoring. Singapore Economic Review 53, no. 3: 357–69.
Mitra, D., and P. Ranjan. 2008b. Temporary Shocks and Offshoring: The Role of External Economies and Firm Heterogeneity. Journal of Development Economics 87, no. 1: 76–84.
OECD (Organization for Economic Cooperation and Development). 2018a. The Changing Nature of International Production: Insights from Trade in Value Added and Related Indicators. Paris. Available at https://www.oecd.org/industry/ind/tiva-2018-flyer.pdf.
OECD (Organization for Economic Cooperation and Development). 2018b. Trade in Value-Added Database. Paris. Available at http://www.oecd.org/sti/ind/measuring-trade-in-value-added.htm.
Panagariya, A. 2019. Free Trade and Prosperity: How Openness Helps Developing Countries Grow Richer and Combat Poverty. New York: Oxford University Press.
Wang, Z., S.-J. Wei, X. Yu, and K. Zhu. 2017. Measures of Participation in Global Value Chains and Global Business Cycles. NBER Working Paper 23222. Cambridge, MA: National Bureau of Economic Research.
World Bank. 2020a. Doing Business. Washington.
World Bank. 2020b. World Development Report 2020: Trading for Development in the Age of Global Value Chains. Washington.

47 PIIE BR 20-2 | SEPTEMBER 2020
3 Potential Trade between India and the United States Euijin Jung
This chapter uses a gravity model to show that India and the United States could have been trading at a much higher level than they did in recent decades. A range of impediments has prevented the world’s two most populous democracies from opening their countries to trade and investment opportunities except trade in high-technology and other services.
India has used trade restriction measures excessively in recent years, including during the COVID-19 pandemic and resulting global economic downturn. These tariff and nontariff barriers to trade have weakened India’s export competitiveness. The lack of trade reform is dramatized best by the failure of the governments led by President Donald Trump and Prime Minister Narendra Modi to reach even a modest “mini deal” at the close of 2019 and beginning of 2020, despite dramatic outreach efforts and visits by the two men to each other’s countries. As a result, the outlook for improved trade cooperation is bleak, especially in light of protectionist developments in the wake of the pandemic.
As a single-country market, the United States is the leading export market for Indian merchandise and services. India’s exports and imports of merchandise increased and its traded products became more diversified over the past 20 years. But India’s merchandise imports from the United States are well below predicted levels, according to the gravity model used in this study. In contrast, US service imports from India, especially in information technology (IT) and telecommunications, are well above the levels the model predicts. According to the estimation derived from the model, India could increase its merchandise trade with the United States.
The model was run before the collapse in world trade in the spring of 2020. The global lockdown has disrupted trade for all countries; it may take years before travel levels return to what they were before 2020. This study nevertheless provides a roadmap for what both countries need to do to return to a healthy trading relationship and improve their trade ties.
The main impediment to India’s growth in trade is a protectionist mindset that dates from the early years of its independence movement. A legacy of feeling exploited by the British Empire, which forced India to purchase British goods instead of producing them domestically, infused India’s earliest leaders with a determination to be self-sufficient economically. Many trade policies continue to reflect this protectionism and inward-looking attitude, which hinder trade growth. India’s key trade barriers include not just tariffs but also a large number of trade remedy applications, such as antidumping and countervailing duties allowed by the World Trade Organization (WTO) to combat subsidized (“dumped”) imports or imports that threaten to destroy domestic industries.
Euijin Jung is a research fellow at the Peterson Institute for International Economics.

48 PIIE BR 20-2 | SEPTEMBER 2020
India also maintains price controls on agricultural and medical products, and it applies export subsidies that require recipients to use domestic instead of imported goods. Such trade barriers raise the cost of tradable goods for Indian farmers, manufacturers, and service providers, weakening their export competitiveness and hurting global trade environment.
Frictions over these barriers have been a fact of life in India-US trade relations for decades, despite occasional breakthroughs. But trade tensions sharpened in 2018, when the Trump administration imposed tariffs on all steel and aluminum imports from many countries, including India, citing the threat to national security. In 2019, the United States made India ineligible for the US Generalized System of Preferences (GSP), which provides preferential treatment on some imports from least developed countries. Many disputes between India and the United States remain unsettled because the WTO’s Appellate Body has become dysfunctional as a result of the refusal of the Trump administration to fill vacancies. In 2020, India’s digital tax on foreign e-commerce companies faced a US Section 301 investigation, which could end with possible tariff imposition. As the digital tax mainly targets US tech firms such as Amazon, the US government has launched the investigation to determine if such a digital tax imposed by several countries would hurt the US firms with unfair treatment. Further deterioration in economic relations threatens the future of trade and commerce between the two countries.
The public health and economic crisis from the coronavirus pandemic poses an additional challenge to economic cooperation. Global trade is expected to decline by 13–32 percent in 2020 because of the pandemic.1 Suffering from a shortage of medical supplies, India, the United States, and many other countries have curbed exports of personal protective gear and agricultural goods and lowered tariffs on medical supply products. A 5 percent health assessment charge added to imports of medical equipment was not suspended during the crisis. At the same time, they have ramped up domestic production, with the goal of increasing self-sufficiency, empowering protectionist voices. US Trade Representative Robert Lighthizer continually argues that companies operating overseas should bring their jobs back to the United States in the uncertain global environment.2 Prime Minister Modi has called on India to avoid supply chain disruption through domestic production in manufacturing.3
India’s goal of increasing self-sufficiency was reinforced in May 2020, when Modi unveiled a $260 billion COVID-19 relief package, amounting to more than 10 percent of India’s GDP. In announcing the initiative, Modi emphasized domestic production of goods. “Be vocal about local!” he declared. “Who can stop us from becoming a self-reliant India?”4
This chapter is organized as follows. The first section describes India’s current trade landscape. The second section uses a gravity model to analyze India’s trade with the United States. The third section examines trade barriers that suppress
1 World Trade Organization, “Trade Set to Plunge as COVID-19 Pandemic Upends Global Economy,” press release, April 8, 2020.
2 Robert E. Lighthizer, “The Era of Offshoring US Jobs Is Over,” New York Times, May 11, 2020.
3 Amy Kazmin, “Modi the Reformer Reappears as Coronavirus Hits India’s Economy,” Financial Times, May 14, 2020.
4 Jeffrey Gettleman and Hari Kumar, “Modi Announces $260 Billion Relief Package to Ease Lockdown Pain,” New York Times, May 13, 2020.

49 PIIE BR 20-2 | SEPTEMBER 2020
India-US merchandise trade. The fourth section identifies recent bilateral trade frictions. The last section summarizes the chapter’s conclusions.
INDIA’S TRADE LANDSCAPE
Since the global financial crisis, trade as a percentage of GDP has fluctuated in India, falling from 56 percent in 2012 to 40 percent in 2016 (figure 3.1). To stem the decline, India announced a series of programs and initiatives to improve its trade performance. On April 1, 2015, it unveiled its foreign trade policy 2015–20 (FTP), with the goal of increasing its share of global goods and services exports from 2.0 percent to 3.5 percent by March 31, 2020.5 That goal fell short even before the COVID-19 crisis caused a collapse in global trade. On December 5, 2017, India removed the target from its midterm review of the FTP, focusing instead on diversifying products and markets and improving trade facilitation in India.6
The FTP is closely linked to other government initiatives to enhance India’s competitiveness, including Make in India, Digital India, and Skills India. Make in India is a national program to attract foreign investment in 25 manufacturing sectors.7 These efforts aim to improve India’s performance on the World Bank’s
5 Because of COVID-19, the FTP was extended to 2021; see Minister of State for Commerce & Industry, Foreign Trade Policy Statement, April 1, 2015, https://www.ibef.org/download/Foreign-Trade-Policy-Statement-(2015-2020).pdf.
6 Minister of State for Commerce & Industry, Foreign Trade Policy Statement, December 5, 2017, https://content.dgft.gov.in/Website/ftpst17-051217%20(3).pdf.
7 The sectors include automobiles, automobile components, aviation, biotechnology, chemicals, construction, defense manufacturing, electrical machinery, electronic systems, food process-ing, IT and business process management (BPM), leather, media and entertainment, mining, pharmaceuticals, ports, railways, renewable energy, roads and highways, space, textiles and garments, thermal power, tourism and hospitality, and wellness.
Figure 3.1India’s trade as percent of GDP, 1970–2019
Source: Data from the World Bank World Development Indicators database; Trademap.org, using UN Comtrade database; WTO data portal, https://data.wto.org; IMF World Economic Outlook, October 2019 (accessed on June 22, 2020).
60
50
40
30
20
10
01970 1975 1980 1985 1990 1995 2000 2005 2010 2015 2019
Total two-way trade
Exports of goods and services
Imports of goods and services
56%
40%
percent of GDP

50 PIIE BR 20-2 | SEPTEMBER 2020
Doing Business index, which rose from 130th in 2016 to 63rd in 2020, in order to show investors India’s commitment to reform. India improved its cross-border trade by ensuring easy custom clearance procedures, building a single electronic platform, upgrading port infrastructure, and improving the electronic submission of documents—all steps that reduce cross-border trade costs (World Bank 2020). Digital India focuses on developing digital infrastructure, integration of services across jurisdictions, and accessibility of digital resources. Skills India is a campaign to train more than 400 million people in India with new skills by 2022.
These measures appeared to have improved India’s two-way trade in goods and services, which reached $1.2 trillion in 2018 (figure 3.2). India accounted for 1.7 percent of world merchandise exports and 3.5 percent of world service exports in 2018 (WTO 2019a). Its combined share of merchandise and service exports was 2.1 percent of the global total, far less than the 3.5 percent set in 2015.
GRAVITY MODEL ESTIMATES: LESS MERCHANDISE, MORE SERVICES TRADE BETWEEN THE UNITED STATES AND INDIA
This section presents a gravity model analysis to estimate potential trade between the two countries, both merchandise and services. While bilateral trade in merchandise and services increased exponentially, India-US trade in merchandise could have been better.
Trade in Goods and Services
India’s exports depend on the vast US market. India’s two-way merchandise trade with the United States grew from $12 billion in 2001 to $89 billion in 2019; its service trade with the United States increased from $5 billion to $54 billion
Exports of goods to world Imports of goods from worldExports of services to world Imports of services from world
Source: Data from Trademap.org using, based on UN Comtrade database; WTO data portal, https://data.wto.org (accessed on June 22, 2020).
0
200
400
600
800
1,000
1,200
2005 2007 2009 2011 2013 2015 2017 2019
Figure 3.2India’s trade in goods and services with the world
billions of dollars
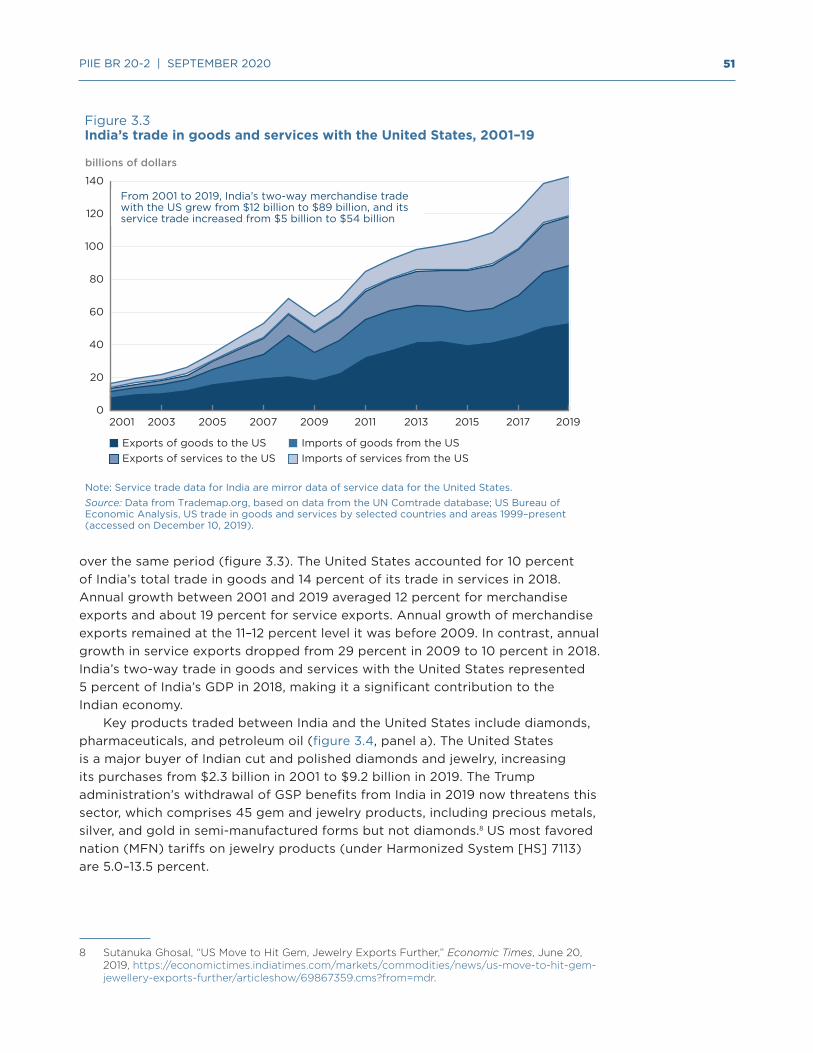
51 PIIE BR 20-2 | SEPTEMBER 2020
over the same period (figure 3.3). The United States accounted for 10 percent of India’s total trade in goods and 14 percent of its trade in services in 2018. Annual growth between 2001 and 2019 averaged 12 percent for merchandise exports and about 19 percent for service exports. Annual growth of merchandise exports remained at the 11–12 percent level it was before 2009. In contrast, annual growth in service exports dropped from 29 percent in 2009 to 10 percent in 2018. India’s two-way trade in goods and services with the United States represented 5 percent of India’s GDP in 2018, making it a significant contribution to the Indian economy.
Key products traded between India and the United States include diamonds, pharmaceuticals, and petroleum oil (figure 3.4, panel a). The United States is a major buyer of Indian cut and polished diamonds and jewelry, increasing its purchases from $2.3 billion in 2001 to $9.2 billion in 2019. The Trump administration’s withdrawal of GSP benefits from India in 2019 now threatens this sector, which comprises 45 gem and jewelry products, including precious metals, silver, and gold in semi-manufactured forms but not diamonds.8 US most favored nation (MFN) tariffs on jewelry products (under Harmonized System [HS] 7113) are 5.0–13.5 percent.
8 Sutanuka Ghosal, “US Move to Hit Gem, Jewelry Exports Further,” Economic Times, June 20, 2019, https://economictimes.indiatimes.com/markets/commodities/news/us-move-to-hit-gem-jewellery-exports-further/articleshow/69867359.cms?from=mdr.
Exports of goods to the US Imports of goods from the USExports of services to the US Imports of services from the US
Figure 3.3India’s trade in goods and services with the United States, 2001–19
Note: Service trade data for India are mirror data of service data for the United States.Source: Data from Trademap.org, based on data from the UN Comtrade database; US Bureau of Economic Analysis, US trade in goods and services by selected countries and areas 1999–present (accessed on December 10, 2019).
0
20
40
60
80
100
120
140
2001 2003 2005 2007 2009 2011 2013 2015 2017 2019
From 2001 to 2019, India’s two-way merchandise trade with the US grew from $12 billion to $89 billion, and its service trade increased from $5 billion to $54 billion
billions of dollars
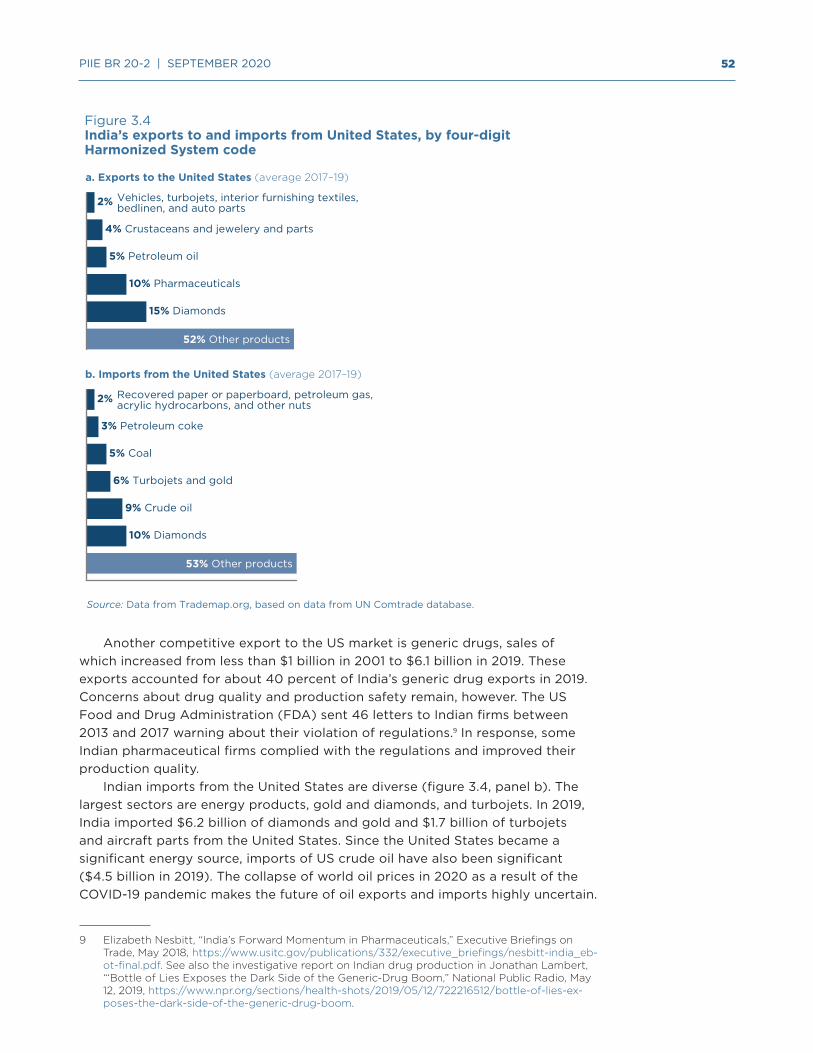
52 PIIE BR 20-2 | SEPTEMBER 2020
Another competitive export to the US market is generic drugs, sales of which increased from less than $1 billion in 2001 to $6.1 billion in 2019. These exports accounted for about 40 percent of India’s generic drug exports in 2019. Concerns about drug quality and production safety remain, however. The US Food and Drug Administration (FDA) sent 46 letters to Indian firms between 2013 and 2017 warning about their violation of regulations.9 In response, some Indian pharmaceutical firms complied with the regulations and improved their production quality.
Indian imports from the United States are diverse (figure 3.4, panel b). The largest sectors are energy products, gold and diamonds, and turbojets. In 2019, India imported $6.2 billion of diamonds and gold and $1.7 billion of turbojets and aircraft parts from the United States. Since the United States became a significant energy source, imports of US crude oil have also been significant ($4.5 billion in 2019). The collapse of world oil prices in 2020 as a result of the COVID-19 pandemic makes the future of oil exports and imports highly uncertain.
9 Elizabeth Nesbitt, “India’s Forward Momentum in Pharmaceuticals,” Executive Briefings on Trade, May 2018, https://www.usitc.gov/publications/332/executive_briefings/nesbitt-india_eb-ot-final.pdf. See also the investigative report on Indian drug production in Jonathan Lambert, “‘Bottle of Lies Exposes the Dark Side of the Generic-Drug Boom,” National Public Radio, May 12, 2019, https://www.npr.org/sections/health-shots/2019/05/12/722216512/bottle-of-lies-ex-poses-the-dark-side-of-the-generic-drug-boom.
Figure 3.4India’s exports to and imports from United States, by four-digit Harmonized System code
2%
4% Crustaceans and jewelery and parts
5% Petroleum oil
10% Pharmaceuticals
15% Diamonds
52% Other products
a. Exports to the United States (average 2017–19)
Source: Data from Trademap.org, based on data from UN Comtrade database.
3% Petroleum coke
5% Coal
6% Turbojets and gold
9% Crude oil
10% Diamonds
53% Other products
b. Imports from the United States (average 2017–19)
Vehicles, turbojets, interior furnishing textiles, bedlinen, and auto parts
2% Recovered paper or paperboard, petroleum gas, acrylic hydrocarbons, and other nuts

53 PIIE BR 20-2 | SEPTEMBER 2020
India and the United States deepened their integration in service trade more rapidly than they did with other countries. Information, computer, and telecommunications (ICT); research and development (R&D); and travel services accounted for more than three-quarters of India’s service exports to the United States in 2018 (table 3.1), underscoring India’s strong comparative advantage in these sectors. Travel services (including tourism and business and educational travel to the United States) make up two-thirds of India’s service imports from the United States. In 2018, the United States welcomed about 1.4 million visitors from India, an 8.5 percent increase over the previous year (US International Trade Administration 2019). The second-largest service sector for Indian imports from the United States is intellectual property, but Washington placed India on a priority “watch list” in 2019 (USTR 2019a) because of its record of piracy and counterfeiting. The United States has also accused India of violating patents in pharmaceuticals and the agricultural chemical industry.
Potential Trade in Goods and Services
Economists using gravity models estimate that India-US trade should be higher than it is, given the sizes of their economies and the distance between the two countries.10 This section shows the results of two types of regressions, ordinary least squares (OLS) and Poisson Pseudo Maximum Likelihood (PPML), that were used to estimate the performance of trade (of merchandise and services) between India and the United States using the specification of Mishra and Roy (2016). The estimations include a larger number of observations and the fixed effect of exporter-year and importer-year, which Mishra and Roy were unable to use in their PPML estimation because of computational limitations in their modeling.11
The augmented gravity model includes dummy variables for specific country pairs. The sample includes bilateral trade flows of 204 countries to 204 trading partners between 1970 and 2015. Merchandise bilateral trade flows are from the International Monetary Fund’s Direction of Trade Statistics (DOTS) database, reported in current US dollars.12 Bilateral service trade flows are from the database of the Organization for Economic Cooperation and Development
10 Using a gravity equation, Tinbergen (1962) finds that trade flows between two countries are proportional to their GDP and inversely proportional to the distance between them. Based on his approach, the gravity equation evolved, with advances in both theory and estimation techniques. The gravity model developed by Anderson and van Wincoop (2003) became the foundation for the study of the impact of the determinants of bilateral trade, such as geo-graphical barriers, cultural barriers, and trade costs. The log-linearized models estimated by ordinary least squares (OLS) are broadly used in gravity equations. Silva and Tenreyro (2006) argue that a problem of error heteroskedasticity in the log-linear specification generates bi-ases in the Anderson and van Wincoop (2003) specification. They propose using the Poisson Pseudo Maximum Likelihood (PPML) estimators, which reduce the bias of the estimators and deal with the zero values by not using the log-linear specification. Mishra and Roy (2016) use an augmented gravity model by adding country pair dummy variables (importer-exporter) to estimate trade potential between India and the United States.
11 Correia, Guimarães, and Zylkin (2019) provide new STATA codes for estimation of (pseudo) Poisson regression models with multiple high-dimensional fixed effects, which resolves the computational limitation issue.
12 “Trade flows should be in nominal, not real, terms, because exports are effectively deflated by the two multilateral resistance terms, which are unobserved price indices. Deflating exports using different price indices such as the CPI or the GDP deflator, would not adequately capture the unobserved multilateral resistance terms and could produce misleading results” (Shepherd 2016, 9).

54 PIIE BR 20-2 | SEPTEMBER 2020
Table 3.1India’s commercial services exports to and imports from the United States, 2018
Service type
India’s exports to the US
India’s imports from the US
Billions of dollars Percent
Billions of dollars Percent
Maintenance and repair services n.i.e. 0 0.1 0.8 3.4
Transportation 0.7 2.2 1.8 7.3
Travel 3.3 11.0 14.4 58.2
Insurance services 0.1 0.3 0.3 1.1
Financial services 0.5 1.6 1.2 5.0
Charges for the use of intellectual property n.i.e. 1.2 4.2 3.4 13.9
Information, computer, and telecommunications (ICT) services
15.3 51.9 1.3 5.2
Research and development services 4.1 13.8 0.1 0.5
Professional and management consulting services
2.6 8.8 0.7 2.9
Technical, trade-related, and other business services
1.8 6.1 0.6 2.5
Total commercial services 29.5 100.0 24.8 100.0
n.i.e. = not included elsewhere
Note: Data are mirror data. They exclude government-related services.
Source: US Bureau of Economic Analysis (accessed on January 17, 2020).
JUNG - chapter 3
(OECD), which covers service imports of 33 OECD countries from 224 partners between 2006 and 2015. Other standard variables—for example, country pair variables such as GDP, GDP per capita, bilateral distance, common border, common language, religious similarity, common currency, common legal origin, colonial ties, regional trade agreement, WTO membership—are collected from the Centre d’Etudes Prospectives et d’Informations Internationales (CEPII) gravity database.13
The augmented gravity equation is expressed by the following equation:
Mijt=α0 + β1DummyIndia-US + β2DummyUS-India + β3log(GDPit) + β4log(GDPjt) + β5log(Distij) + β6log(GDPpcit) + β7log(GDPpcjt) + β10Zijt + πit + gjt + εijt
where i and j denote countries and t denotes the year. In the OLS estimation, the dependent variable, Mijt, is the natural logarithm of imports of country i from country j at time t, which is assumed proportional to the natural logarithm of GDPit and GDPjt, GDPpcjt, and GDPpcjt and the trade-weighted distance (Distij) between country i and j. Each observation in the regressions represents a
13 CEPII makes available a balanced gravity dataset for all world pairs of countries for 1948–2015 (see http://www.cepii.fr/CEPII/en/bdd_modele/presentation.asp?id=8, accessed on September 9, 2019).

55 PIIE BR 20-2 | SEPTEMBER 2020
particular year and importer-exporter pair. The dependent variable for the PPML estimator is specified as imports of country i from country j at time t in levels rather than in logarithms, expressed in millions of US dollars.
Zijt is a vector of explanatory variables, which include indirect measures of trade costs, such as common border, common language, common religion, colonial ties, and trade liberalization, represented by membership in a common regional free trade agreement. The parameters πit and gjt indicate the fixed effects of importer-year and exporter-year, respectively, thereby controlling for observed and unobserved country-specific and time-varying characteristics. This model tries to control for some multilateral resistances that push one country to trade with another. The multilateral resistances are unobservable factors that would affect a country’s trade with its trading partners. Baldwin and Taglioni (2006) suggest that the country pair fixed effect is the best way to remove bias in the coefficient stemming from the omitted determinants of bilateral trade. However, inclusion of pair dummies cannot estimate time-invariant variables, such as the India-US pair dummy. So, the second-best solution—country-time fixed effects—was applied to the model.
The coefficients of interest—β1 and β2 on the two dummies—indicate the strength of India’s imports from the United States (DummyIndia-US), and US imports from India (DummyUS-India). The first coefficient is an indicator of how much India imports from the United States, controlling for GDP, GDP per capita, distance, and trade determinants. A negative β1 suggests that India’s imports from the United States are below its trade potential; a positive β1 indicates that India’s imports are above its potential (Mishra and Roy 2016). The second coefficient, β2, indicates how much India exports to the United States.
Column 1 in table 3.2 shows the result from estimating a log-linearized model over the full sample for 1970–2015.14 The estimated coefficient on the dummy for India’s imports from the United States is negative and statistically significant at the 1 percent level. The magnitude of the coefficient on DummyIndia-US is –0.412, indicating that India’s imports from the United States are about 34 percent below the predicted level for the whole sample, after controlling for all other trade determinants.15 The coefficient of DummyUS-India is estimated as –0.434 and statistically significant at the 1 percent level, indicating that US imports from India are 35 percent below what they should be. India’s two-way trade with the United States was thus far below its potential between 1970 and 2015.
Column 2 presents the result from the same equation augmented for new pair dummies related to India and key trading partners, including the European Union, China, the United Arab Emirates, and Saudi Arabia. After adding these dummies, the coefficients of the India-US pair dummies yield the same results as in column 1, strengthening the implication that bilateral trade between India
14 Five variables (GDP for importer and exporter, GDP per capita for importer and exporter, and the exporter’s WTO membership) were omitted because of collinearity with fixed effects, after the large dimensional fixed effect was used.
15 Given the log-linear specification of the gravity model, the dependent export variable is ex-pressed in logarithmic terms and the independent variable is expressed as a dummy variable (0 or 1). The estimated impact of the presence of an India-US (dummy variable of 1) on imports is computed in percentage terms, as 100 * [exp(β1) – 1]. In this expression, β1 is the estimated coefficient for the India-US pair dummy variable of 1 and exp(β1) is the value of the natural number e raised to the exponent β1. If the coefficient is –0.412, the value of exp(β1) is 0.662 and the percentage compression in exports is estimated as 100*(0.662 – 1.00) = –33.8.

56 PIIE BR 20-2 | SEPTEMBER 2020
and the United States has been substantially underperforming. For the India-EU pair, a similar estimation is provided. For the India-China pair, the coefficients for India’s imports from China and China’s imports from India also indicate underperformance at a statistically significant level, but the magnitude of each coefficient is much larger than their counterparts for the India-US pair.
For example, the coefficient for India’s imports from China (–2.539) indicates that imports are almost 92 percent below potential. For the India-UAE and India-Saudi Arabia pairs, India’s imports are estimated well above world average with statistical significance.16
The sample is divided into five periods, in order to reveal variation in the coefficients over time, (see column 3–7). Relative to world trade, the performance of trade between India and the United States deteriorated over time. In the 1970s, India imported more from the United States than the model predicted; in other periods, imports underperformed.
16 The regression including oil rent (as a percent of GDP) resulted in omission of variables be-cause of collinearity. For the regression on nonpetroleum imports, the coefficients of India-UAE and India-Saudi Arabia are statistically significant and positive.
Table 3.2Summary of ordinary least squares (OLS) estimation in gravity model
Variable(1)OLS 1
(2)OLS 2
(3)1970s
(4)1980s
(5)1990s
(6)2000s
(7)2010–2015
India-US–0.412***(0.106)
–0.464***(0.114)
0.564***(0.108)
–0.0237(0.0774)
–0.361***(0.103)
–1.092***(0.106)
–1.766***(0.0842)
US-India–0.434***(0.0889)
–0.454***(0.0898)
–0.0994(0.0932)
0.425***(0.130)
–0.255***(0.0949)
–1.201***(0.0685)
–1.186***(0.0603)
India-China–2.539***(0.202)
–5.052***(0.871)
–1.910***(0.170)
–2.280***(0.302)
–2.260***(0.119)
–3.024***(0.109)
China-India–1.904***(0.120)
–2.088***(0.196)
–1.379***(0.113)
–1.873***(0.0818)
–3.140***(0.206)
India-UAE0.858***(0.237)
–0.640(0.933)
1.850***(0.151)
2.149***(0.119)
0.323***(0.0746)
–0.0955(0.199)
UAE-India0.284***(0.0805)
0.881***(0.116)
0.567***(0.0753)
0.416***(0.0691)
0.150(0.0913)
–0.859***(0.271)
India-Saudi Arabia1.647***(0.106)
1.430***(0.145)
1.654***(0.203)
2.541***(0.0954)
1.163***(0.206)
1.473***(0.126)
Saudi Arabia-India0.238***(0.0751)
0.905***(0.0843)
0.643***(0.144)
0.247**(0.114)
–0.231***(0.0441)
–0.456***(0.0992)
India-EU–0.531***(0.0770)
–0.289***(0.110)
–0.240***(0.0842)
–0.210***(0.0676)
–0.557***(0.102)
–1.095***(0.0941)
EU-India–0.156***(0.0319)
–0.184**(0.0753)
0.0357(0.0710)
–0.101(0.0716)
–0.259***(0.0563)
–0.182**(0.0768)
Log distance–1.445***(0.00872)
–1.445***(0.00873)
–1.082***(0.0158)
–1.293***(0.0154)
–1.391***(0.0157)
–1.590***(0.0154)
–1.679***(0.0246)
Common border0.366***(0.0241)
0.377***(0.0240)
0.335***(0.0515)
0.273***(0.0511)
0.591***(0.0452)
0.440***(0.0446)
0.567***(0.0658)
Common currency0.594***(0.0416)
0.593***(0.0416)
0.817***(0.0749)
0.903***(0.0758)
0.871***(0.0864)
0.248***(0.0750)
0.420***(0.0939)
Table continues
JUNG - chapter 3 JUNG - chapter 3

57 PIIE BR 20-2 | SEPTEMBER 2020
This finding is different from that of Mishra and Roy (2016), who estimate that India’s exports to the United States are 34 percent above the predicted line over the full sample.17 The difference could reflect the fact that their sample covers 1970–2009 and 51 advanced and emerging-market economies whereas the sample in this paper covers a longer period and a larger number of countries. The period 2010–15 shows a significant and negative coefficient, indicating that trade performance was well below the predictive level. The other trade determinants show similar magnitudes and the same signs of the coefficients as in Mishra and Roy (2016).
In table 3.3, the PPML estimator includes zero trade values in the whole sample and exporter-year and importer-year fixed effect. In column 1, a smaller but negative sign coefficient of the DummyIndia-US variable indicates that India’s imports from the United States did not reach their potential. India’s average imports from the United States were 36 percent below the world average, similar to what was predicted in the OLS estimation. The PPML estimator shows that the coefficient for US imports from India is not statistically significant, however, casting doubt on trade underperformance in that direction.
17 Their estimated coefficient on US exports to India is negative but statistically insignificant.
JUNG - chapter 3
Table 3.2 (continued)Summary of ordinary least squares (OLS) estimation in gravity model
Variable(1)OLS 1
(2)OLS 2
(3)1970s
(4)1980s
(5)1990s
(6)2000s
(7)2010–2015
Religious similarity0.310***(0.0204)
0.311***(0.0204)
–0.0190(0.0426)
0.185***(0.0441)
0.456***(0.0356)
0.441***(0.0390)
0.264***(0.0504)
Common language0.308***(0.0185)
0.310***(0.0185)
0.164***(0.0396)
0.188***(0.0404)
0.140***(0.0372)
0.387***(0.0337)
0.557***(0.0441)
Common language used by more than 9% of population
0.228***(0.0164)
0.228***(0.0164)
0.241***(0.0376)
0.140***(0.0370)
0.335***(0.0309)
0.254***(0.0309)
0.209***(0.0408)
Free trade agreement0.552***(0.0190)
0.550***(0.0191)
0.0448(0.0674)
0.206***(0.0594)
0.343***(0.0445)
0.558***(0.0304)
0.362***(0.0345)
Common legal system0.372***(0.0105)
0.370***(0.0105)
0.288***(0.0220)
0.329***(0.0209)
0.432***(0.0206)
0.388***(0.0189)
0.324***(0.0253)
Importer as GATT member –0.398(0.464)
–0.398(0.464)
–0.182(0.459)
Colonial ties1.066***(0.0185)
1.066***(0.0185)
1.235***(0.0306)
1.211***(0.0313)
1.078***(0.0378)
0.967***(0.0400)
0.787***(0.0536)
Constant26.92***(0.369)
26.91***(0.369)
23.52***(0.138)
25.72***(0.137)
26.18***(0.138)
27.72***(0.398)
28.77***(0.218)
Observations 661,265 661,265 74,433 95,351 144,093 210,755 136,633
R-squared 0.741 0.741 0.733 0.726 0.736 0.746 0.751
Importer-year fixed effects Yes Yes Yes Yes Yes Yes Yes
Exporter-year fixed effects Yes Yes Yes Yes Yes Yes Yes
UAE = United Arab Emirates; GATT = General Agreement on Tariffs and Trade
Robust standard errors in parentheses
*** p<0.01, ** p<0.05, * p<0.1
Source: Author’s calculations.

58 PIIE BR 20-2 | SEPTEMBER 2020
When other pairs are included, the coefficient of the DummyIndia-US still has a negative sign but with a larger magnitude. In column 2, the PPML estimator shows that the coefficient of the DummyIndia-US is larger but negative. The coefficient of DummyUS-India is statistically significant and positive, indicating that India’s exports to the United States are 9 percent above the world average. The India-EU trade coefficients are similar. India’s trade with China is estimated to have underperformed and trade with the United Arab Emirates and Saudi Arabia overperformed the world average. These results are statistically significant.
Columns 3–7 show the coefficients of each country pair in each 10-year period. As predicted in the OLS results, India is estimated to have overimported from the United States in the 1970s and underimported in other periods. The coefficient of DummyIndia-US in 2010–15 suggests that India’s imports from the United States were 50 percent below the world average. The coefficient of DummyUS-India in the same period shows that India’s exports to the United States were 23 percent above the world average.
Service imports are used as a dependent variable of the same equation above to estimate service trade between India and the United States (table 3.4). Because of the limited dataset, the variables DummyUS-India and DummyEU-India were included. The coefficients in both the OLS and PPML estimations are positive and statistically significant, implying that US service imports from India were above
Table 3.3Summary of PPML estimation in gravity model
Variable(1)PPML 1
(2)PPML 2
(3)1970s
(4)1980s
(5)1990s
(6)2000s
(7)2010–2015
India-US–0.357***(0.0311)
–0.464***(0.0361)
0.209(0.133)
–0.255***(0.0551)
–0.568***(0.0816)
–0.400***(0.0583)
–0.492***(0.0326)
US-India0.0716(0.0533)
0.0927**(0.0451)
–0.125**(0.0580)
0.242***(0.0567)
0.0692**(0.0351)
–0.0420(0.0417)
0.231***(0.0745)
India-China–0.939***(0.0564)
–3.624***(0.751)
–1.617***(0.178)
–1.753***(0.117)
–0.969***(0.0716)
–0.942***(0.0794)
China-India–0.882***(0.103)
–1.717***(0.189)
–1.111***(0.101)
–0.481***(0.0680)
–1.145***(0.112)
India-UAE0.810***(0.0767)
–0.503**(0.246)
0.530***(0.204)
1.237***(0.137)
0.718***(0.126)
0.805***(0.104)
UAE-India1.391***(0.105)
0.991***(0.0875)
1.180***(0.0572)
1.370***(0.0637)
1.520***(0.0951)
1.282***(0.171)
India-Saudi Arabia0.546***(0.0615)
–0.329***(0.118)
0.237(0.235)
0.967***(0.0546)
0.415***(0.130)
0.584***(0.0766)
Saudi Arabia-India0.341***(0.0611)
0.167**(0.0707)
0.169**(0.0810)
0.453***(0.0850)
0.478***(0.0843)
0.236**(0.101)
India-EU–0.230***(0.0637)
0.384***(0.0724)
0.477***(0.0626)
0.265***(0.0621)
–0.103(0.0947)
–0.482***(0.0337)
EU-India0.127***(0.0366)
0.262***(0.0723)
0.424***(0.0519)
0.457***(0.0380)
0.0996**(0.0485)
0.0366(0.0662)
Log distance–0.746***(0.0144)
–0.736***(0.0140)
–0.816***(0.0187)
–0.778***(0.0183)
–0.648***(0.0224)
–0.737***(0.0242)
–0.740***(0.0262)
Common border0.355***(0.0223)
0.404***(0.0202)
0.383***(0.0330)
0.401***(0.0312)
0.473***(0.0383)
0.381***(0.0306)
0.392***(0.0399)
Table continues
JUNG - chapter 3 JUNG - chapter 3
Table 3.3 (continued)Summary of PPML estimation in gravity model
Variable(1)PPML 1
(2)PPML 2
(3)1970s
(4)1980s
(5)1990s
(6)2000s
(7)2010–2015
Common currency0.00556(0.0356)
0.00163(0.0354)
0.174**(0.0838)
–0.101**(0.0516)
–0.259***(0.0839)
–0.0283(0.0431)
0.0572(0.0606)
Religious similarity–0.0654**(0.0298)
–0.0502*(0.0287)
–0.616***(0.0719)
–0.333***(0.0582)
0.0798**(0.0352)
0.0410(0.0432)
–0.0670(0.0545)
Common language–0.173***(0.0190)
–0.167***(0.0188)
0.0114(0.0584)
–0.00124(0.0421)
–0.116***(0.0376)
–0.166***(0.0296)
–0.224***(0.0327)
Common language used by more than 9% of population
0.237***(0.0196)
0.223***(0.0202)
0.215***(0.0463)
0.288***(0.0358)
0.329***(0.0388)
0.239***(0.0311)
0.161***(0.0357)
Free trade agreement0.406***(0.0179)
0.400***(0.0193)
0.181***(0.0599)
0.270***(0.0466)
0.576***(0.0472)
0.463***(0.0297)
0.366***(0.0284)
Common legal system0.226***(0.0155)
0.210***(0.0154)
0.203***(0.0375)
0.185***(0.0313)
0.194***(0.0270)
0.232***(0.0241)
0.183***(0.0291)
Importer as GATT member –5.375***(0.328)
–5.377***(0.331)
–5.358***(0.336)
Colonial ties0.128***(0.0216)
0.134***(0.0214)
0.342***(0.0553)
0.0691*(0.0408)
0.0849**(0.0388)
0.0873**(0.0347)
0.217***(0.0433)
Constant33.70***(0.334)
33.62***(0.336)
27.22***(0.158)
27.82***(0.158)
27.21***(0.196)
33.66***(0.378)
29.00***(0.225)
Observations 1,157,830 1,157,830 165,321 218,533 271,211 319,163 183,600
Importer-year fixed effects Yes Yes Yes Yes Yes Yes Yes
Exporter-year fixed effects Yes Yes Yes Yes Yes Yes Yes
PPML = Poisson Pseudo Maximum Likelihood; UAE = United Arab Emirates; GATT = General Agreement on Tariffs and Trade
Robust standard errors in parentheses
*** p<0.01, ** p<0.05, * p<0.1
Source: Author’s calculations.

59 PIIE BR 20-2 | SEPTEMBER 2020
their potential (overperforming).18 The coefficient of DummyEU-India is positive and statistically significant in the PPML, indicating that the potential for India’s service exports to the European Union was reached.
India’s merchandise imports from the United States are estimated to be below the world average after controlling for economic size, proximity to overseas markets, and other trade cost factors. India’s imports from the United States are estimated to be below the world average in most years, and its exports to the United States are estimated to be above the world average in some years. As India grew rapidly in developing its services sector, its trade in services with the United States and the European Union appears to be much higher than the world average. A reasonable conclusion is that India still has significant potential to expand merchandise trade with the United States. To do so, however, India must undertake trade reform and invest in infrastructure, including ports, roads, and railways. It should also try to de-escalate geopolitical tensions with potential trading partners. How to accomplish that goal is the subject of the next section.
18 India has a studentized residual of between –2 and 2, which shows that it is not an outlier.
JUNG - chapter 3
Table 3.3 (continued)Summary of PPML estimation in gravity model
Variable(1)PPML 1
(2)PPML 2
(3)1970s
(4)1980s
(5)1990s
(6)2000s
(7)2010–2015
Common currency0.00556(0.0356)
0.00163(0.0354)
0.174**(0.0838)
–0.101**(0.0516)
–0.259***(0.0839)
–0.0283(0.0431)
0.0572(0.0606)
Religious similarity–0.0654**(0.0298)
–0.0502*(0.0287)
–0.616***(0.0719)
–0.333***(0.0582)
0.0798**(0.0352)
0.0410(0.0432)
–0.0670(0.0545)
Common language–0.173***(0.0190)
–0.167***(0.0188)
0.0114(0.0584)
–0.00124(0.0421)
–0.116***(0.0376)
–0.166***(0.0296)
–0.224***(0.0327)
Common language used by more than 9% of population
0.237***(0.0196)
0.223***(0.0202)
0.215***(0.0463)
0.288***(0.0358)
0.329***(0.0388)
0.239***(0.0311)
0.161***(0.0357)
Free trade agreement0.406***(0.0179)
0.400***(0.0193)
0.181***(0.0599)
0.270***(0.0466)
0.576***(0.0472)
0.463***(0.0297)
0.366***(0.0284)
Common legal system0.226***(0.0155)
0.210***(0.0154)
0.203***(0.0375)
0.185***(0.0313)
0.194***(0.0270)
0.232***(0.0241)
0.183***(0.0291)
Importer as GATT member –5.375***(0.328)
–5.377***(0.331)
–5.358***(0.336)
Colonial ties0.128***(0.0216)
0.134***(0.0214)
0.342***(0.0553)
0.0691*(0.0408)
0.0849**(0.0388)
0.0873**(0.0347)
0.217***(0.0433)
Constant33.70***(0.334)
33.62***(0.336)
27.22***(0.158)
27.82***(0.158)
27.21***(0.196)
33.66***(0.378)
29.00***(0.225)
Observations 1,157,830 1,157,830 165,321 218,533 271,211 319,163 183,600
Importer-year fixed effects Yes Yes Yes Yes Yes Yes Yes
Exporter-year fixed effects Yes Yes Yes Yes Yes Yes Yes
PPML = Poisson Pseudo Maximum Likelihood; UAE = United Arab Emirates; GATT = General Agreement on Tariffs and Trade
Robust standard errors in parentheses
*** p<0.01, ** p<0.05, * p<0.1
Source: Author’s calculations.

60 PIIE BR 20-2 | SEPTEMBER 2020
TRADE MEASURES ADOPTED IN INDIA SINCE THE GLOBAL FINANCIAL CRISIS
India’s steps to improve its export competitiveness have been accompanied by trade protection in manufacturing sectors. These actions have most likely been self-destructive. The Indian government continues to intervene in trade.
Global Trade Alert (GTA), an independent nongovernment organization that collects data on trade, records policy interventions by countries and identifies whether they are liberalizing or protectionist by creating unfair competition from imports through domestic subsidies, price controls, tariff rates, local content restrictions, and similar steps. In India, liberalizing announcements have been
JUNG - chapter 3
Table 3.4Ordinary least squares and PPML estimations in the gravity model of services trade
Variable (1)OLS 1
(2)PPML 1
US-India1.172***(0.0681)
1.491***(0.107)
EU-India0.0587(0.126)
0.725***(0.158)
Log distance–1.225***(0.0375)
–0.653***(0.0266)
Common border0.305***(0.0776)
0.230***(0.0477)
Common currency–0.392***(0.112)
–0.0212(0.0668)
Religious similarity–0.0805(0.0606)
0.932***(0.0880)
Common language–0.185***(0.0686)
0.0714(0.0630)
Common language used by more than 9 percent of population
0.370***(0.0606)
0.258***(0.0681)
Free trade agreement0.0692(0.0753)
0.196***(0.0503)
Common legal system0.523***(0.0369)
0.0181(0.0377)
Colonial ties1.120***(0.0985)
0.101**(0.0470)
Constant13.53***(0.322)
13.30***(0.234)
Observations 18,995 21,510
R-squared 0.868
Importer-year fixed effects Yes Yes
Exporter-year fixed effects Yes Yes
PPML = Poisson Pseudo Maximum Likelihood
Robust standard errors in parentheses
*** p<0.01, ** p<0.05, * p<0.1
Source: Author’s calculations.
SCHOTT - chapter 4

61 PIIE BR 20-2 | SEPTEMBER 2020
far fewer than protectionist measures: 49 of 122 protective policy interventions in 2018 restricted trade with US firms, and just 10 of India’s 37 liberalizing interventions encouraged trade with the United States (figure 3.5).
Import Tariffs and Additional Charges
India has long favored tariffs and quotas to limit imports. Before a burst of liberalization prompted by its financial crisis in the 1990s, India maintained an inward-looking development strategy (Srinivasan and Tendulkar 2003), emphasizing domestic production to meet its needs and relying on export and import controls, licenses, and duties. At the urging of the IMF during India’s 1991 balance of payments crisis, the government undertook many structural reforms, led by Finance Minister Manmohan Singh, a Cambridge University–trained economist who later became prime minister. As part of structural reform, India withdrew all export subsidies and most quantitative restrictions on intermediate and capital goods imports. By 2001, most import licenses and tariffs on goods had been removed, the number of products subject to export control had declined, and trade in services had been substantially liberalized (Panagariya
Figure 3.5Harmful and liberal trade measures adopted by India, 2009–19 (number of policies)
Source: Global Trade Alert database (accessed on June 22, 2020).
0
10
20
30
40
50
60
2009 2011 2013 2015 2017 2019
Liberal measures to world
Liberal measures to the US
0
20
40
60
80
100
120
140
2009 2011 2013 2015 2017 2019
Harmful measures to world
Harmful measures to the US
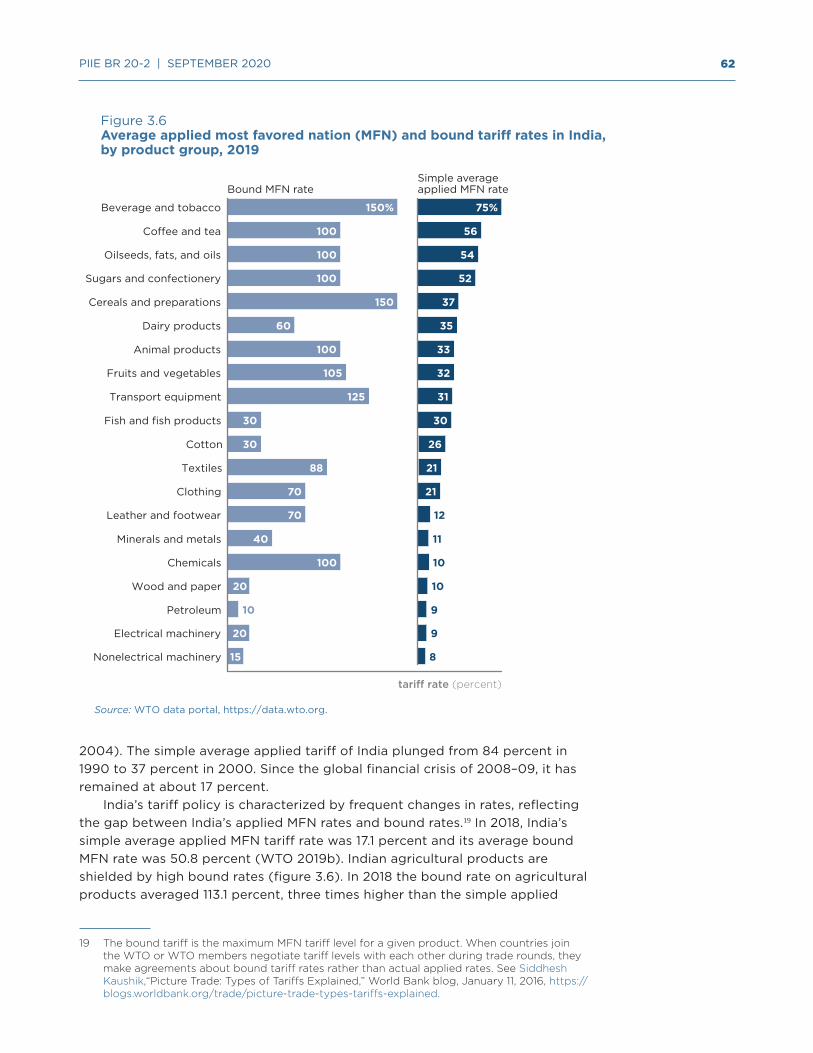
62 PIIE BR 20-2 | SEPTEMBER 2020
2004). The simple average applied tariff of India plunged from 84 percent in 1990 to 37 percent in 2000. Since the global financial crisis of 2008–09, it has remained at about 17 percent.
India’s tariff policy is characterized by frequent changes in rates, reflecting the gap between India’s applied MFN rates and bound rates.19 In 2018, India’s simple average applied MFN tariff rate was 17.1 percent and its average bound MFN rate was 50.8 percent (WTO 2019b). Indian agricultural products are shielded by high bound rates (figure 3.6). In 2018 the bound rate on agricultural products averaged 113.1 percent, three times higher than the simple applied
19 The bound tariff is the maximum MFN tariff level for a given product. When countries join the WTO or WTO members negotiate tariff levels with each other during trade rounds, they make agreements about bound tariff rates rather than actual applied rates. See Siddhesh Kaushik,“Picture Trade: Types of Tariffs Explained,” World Bank blog, January 11, 2016, https://blogs.worldbank.org/trade/picture-trade-types-tariffs-explained.
Figure 3.6Average applied most favored nation (MFN) and bound tariff rates in India,by product group, 2019
Source: WTO data portal, https://data.wto.org.
Simple averageapplied MFN rateBound MFN rate
Beverage and tobacco
Co�ee and tea
Oilseeds, fats, and oils
Sugars and confectionery
Cereals and preparations
Dairy products
Animal products
Fruits and vegetables
Transport equipment
Fish and fish products
Cotton
Textiles
Clothing
Leather and footwear
Minerals and metals
Chemicals
Wood and paper
Petroleum
Electrical machinery
Nonelectrical machinery
75%150%
100 56
54100
52100
37150
60 35
33100
32105
31125
30 30
2630
2188
70 21
1270
40 11
10100
20 10
910
920
815
tari� rate (percent)

63 PIIE BR 20-2 | SEPTEMBER 2020
MFN tariff rate of 38.8 percent. Nonagricultural imports face lower tariff rates than agricultural imports, allowing the government to revise tariff rates to offset international and domestic price changes and accommodate domestic political pressures from the all-important farming sector (WTO 2015).
Frequent fluctuations in tariff rates raise the cost of doing business with India, however, and increase uncertainty for firms, especially firms dependent on imported components or exports of sensitive goods. The basic custom duty on about 50 products in agricultural, ICT, and automobiles and parts increased by 2–10 percent in the 2018–19 Union Budget.20 In the 2020–21 Union Budget, India announced tariff hikes on various products. The automobile sector, for example—a focus of government support—continues to enjoy import protection. In the 2020–21 Union Budget, basic custom tariffs on commercial vehicles increased to 40 percent, and ICT parts and products faced 20 percent tariffs instead of 10 percent, effective April 1, 2020.21 However, the government provides import tariff concessions to exporters who rely on imported goods for their exports. Tariffs on some agricultural products, including certain grains and wheat seeds, were raised 100 percent as of February 2020. These ups and downs take a toll on firms’ competitiveness and the reliability of the trade sector (Joumard, Arriola, and Dek 2019).
India adds another layer to the cost of trade at the customs border by imposing various surcharges, excise duties, and other forms of taxation. In the trade sector, the 12.5 percent excise tax on goods produced in India was subsumed into the Goods and Services Tax (GST) as of July 2017, reducing the cost burden on Indian importers. 22 But the Social Welfare Surcharge—10 percent of the aggregate of custom duties and other taxes imposed on imported goods—is still applied.23 In addition, in the 2020–21 Union Budget, a 5 percent health assessment charge is added to medical equipment, even during the COVID-19 pandemic. These additional charges remain costly for importers and exporters in India.
Price Controls
Price controls on agricultural, petroleum, and pharmaceutical products function as trade barriers. Minimum support prices (MSPs) ensure a minimum price for 25 agricultural commodities, in order to protect farmers against price declines caused by weather, distribution problems, and unequal size of buffer stocks across the regions while keeping prices affordable for consumers. The government announces the MSP at the beginning of the sowing season. It covers the cost of production and provides farmers with a reasonable profit margin.
These controls depress investment and growth and backfire on farmers, worsening their impoverished conditions while racking up fiscal deficits for the government. Controls sometimes lead to overproduction and costly government stockpiles. The system also motivates farmers to produce the crops the Indian
20 The Union Budget is annual financial statement of India Ministry of Finance and includes an estimate of income and expenditure of the Indian government on the fiscal year basis. This includes changes in tariff rates on imported products.
21 See https://www.indiabudget.gov.in/doc/cen/dojstru1.pdf.
22 Petroleum products and liquor products are exempt from the GST.
23 The Social Welfare Surcharge replaced the education cess (which had been 1 percent of ag-gregated customs duties) and the secondary and higher education cess (which had been 2 percent).

64 PIIE BR 20-2 | SEPTEMBER 2020
government procures, which discourages crop diversification. Many farmers, unaware of this program or not living in states where it is in effect, sell their crops at market prices lower than the MSP (Aditya et al. 2017), motivating them to demand even more protection against imports.
The jerry-built protection system is a legacy of a country that in its first decades was not self-sufficient in food and has been haunted by a history of famine. Persuading Indian voters to open up markets to foreign imported food is a hard sell.
India’s price controls on medical devices hinders trade with US exporters. India’s Department of Pharmaceuticals and National Pharmaceutical Pricing Authority (NPPA) has the authority to set price ceilings on the National List of Essential Medicines (NLEM), with the objective of ensuring the availability of essential medicines at affordable prices. But the price cap squeezes profit margins of manufacturers, discouraging research and development. Manufacturers then turn to making nonessential drugs not subject to the NLEM. When the NPPA started to impose the price cap on devices such as knee implants and coronary stents that are not subject to the NLEM, the pharmaceutical sector objected.24 US exporters, backed by the US government, charge that these controls stifle innovation and access to the Indian market (USTR 2019b).
Export Subsidy
India uses export subsidies, trade finance, and tax-based export incentives to promote exports. To boost its export competitiveness, its foreign trade policy 2015–20 adopted two new schemes, under which exporters receive export subsidy support from state governments and are granted duty credit scrips on export values at specified rates (box 3.1). The Merchandise Exports from India Scheme (MEIS) covers more than 8,000 products, including agricultural goods, textiles, pharmaceuticals, metal products, and manufacturing products, awarding duty credit scrips of 2–5 percent. Duty credit scrips provide import tariff concessions to exporters that rely on imported goods for their exports. If, for example, the scrip is 2 percent, a firm exporting $1,000 worth of goods is exempt from $20 worth of import duty. In addition, several subsidy programs continue to offer exemptions from customs duties and internal taxes linked to export performance.
In 2018, the United States challenged these schemes as unfair trade practices, charging that five of them, including the MEIS, were inconsistent with WTO rules against export support.25 The US Trade Representative also demanded that India halt all export incentives if India’s per capita national income exceeded $1,000 for three consecutive years. A WTO panel found that exemptions from duties,
24 E. Kumar Sharma, “New Year 2020: After a Turbulent Decade, Pharma Sector Prays for Calmer Waters,” Business Today, December 31, 2019, https://www.businesstoday.in/sectors/pharma/new-year-2020-after-a-turbulent-decade-pharma-sector-prays-for-calmer-waters/story/392903.html.
25 The five programs include (a) the Export-Oriented Units (EOU), Electronics Hardware Technology Park (EHTP), and Bio-Technology Park (BTP) schemes; (b) the Export Promotion Capital Goods (EPCG) Scheme; (c) the Special Economic Zones (SEZ) Scheme; (d) duty stipu-lations described in the proceedings as the Duty-Free Imports for Exporters Scheme (DFIS); and (e) the MEIS.

65 PIIE BR 20-2 | SEPTEMBER 2020
deductions from taxable income, and the duty credit scrips under the MEIS violated the WTO Safeguards and Countervailing Measures (SCM) Agreement and determined that India was no longer eligible to use these export promotion devices (WTO 2019c). India rejected the finding and appealed to the WTO Appellate Body, which has become moribund because it lacks enough members to act, as the result of the Trump administration’s refusal to approve members.
In 2019, India modified its stance to comply with the WTO rulings. India launched a new scheme, the Remission of Duties or Taxes on Export Products (RoDTEP) that it said is consistent with the WTO rules. This program is replacing the MEIS in phases. The benefit of this new scheme is that it refunds certain taxes and duties, such as value added tax (VAT) on fuel for transportation and the tax
Box 3.1 New export schemes introduced as part of India’s foreign trade policy of 2015–20
The foreign trade policy of 2015–20 introduced two new schemes: Merchandise Exports from India Scheme (MEIS) and Service Exports from India Scheme (SEIS). For grant of rewards under MEIS, countries have been categorized into three groups, with rewards ranging from 2 to 5 percent. Under SEIS, reward rates are between 3 and 5 percent. Duty credit scrips issued under the two schemes and the goods imported against these scrips are fully transferable.
In 2017, the MEIS incentive rate was raised by 2 percent across the board for labor-intensive/micro and small and medium-sized enterprise (MSME) sectors. The step costs the government Rs. 80 billion ($1.1 billion). Table B3.1.1 shows the major sectors that benefited from the increase. The validity period of duty credit scrips was raised from 18 to 24 months, and the goods and services tax rates on the transfer or sale of scrips was reduced to zero.
Table B3.1.1 Sectors benefiting from increase in incentive rate under the Merchandise Exports from India Scheme (MEIS)
Sector Benefit
Ready-made garments Rs.27 billion ($370 million)
Agriculture and related products Rs.14 billion ($190 million)
Services (hotels, restaurants, hospitals, educational services, and so forth)
Rs.11 billion ($150 million)
Handmade carpets Rs.9 billion ($120 million)
Leather and footwear articles Rs.8 billion ($110 million)
Marine products Rs.8 billion ($110 million)
Telecom and electronic components Rs.4 billion ($55 million)
Medical and surgical equipment Rs.2 billion ($28 million)
Source: India Brand Equity Foundation (IBEF), Foreign Trade Policy 2015–20: Key Highlights, April 7, 2015, https://www.ibef.org/pages/foreign-trade-policy-2015-20-key-highlights; IBEF, Mid-Term Review of Foreign Trade Policy: An Update, February 13, 2018, https://www.ibef.org/blogs/mid-term-review-of-foreign-trade-policy-an-update.
JUNG - chapter 3 JUNG - chapter 3

66 PIIE BR 20-2 | SEPTEMBER 2020
on electricity for manufacturing, that were not refunded under the MEIS. Whether the new measure complies with the WTO ruling will be known only when India releases details of the scheme.
Authorized Trade Remedies
India is one of most frequent users of trade remedies permitted by the WTO, which allows countries to impose duties under special circumstances. Antidumping duties can be imposed on imports that are sold under market price (dumped); countervailing duties can be imposed on goods that are subsidized. Safeguard measures are quotas or duties imposed when imports cause or threaten to cause serious injury to a country’s domestic industry. Allowing such remedies reflects recognition by the WTO and its members that trade barriers can serve a legitimate purpose in protecting national security, public health, and certain vital interests.
Between 1995 and 2019, India sent 848 antidumping duty notifications to the WTO, more than any other WTO member.26 Why does India use such barriers so frequently? Bown and Tovar (2011) suggest that following tariff reform in the 1990s, India re-erected trade barriers under economic and political pressures from threatened industries in the early 2000s.
Of the 655 antidumping measures in force between 1995 and 2019, 29 (about 4.4 percent) were imposed on US exports. The United States imposed 24 antidumping cases against India, 5.4 percent of the total of 443 in roughly the same time period, according to the WTO, making US actions a significant barrier to Indian exporters.
However legitimate or understandable India’s trade actions have been, they have not helped overall economic growth or provided fair market access for foreign goods. It would be in India’s self-interest to improve transparency and efficiency in its trade policy.
SOURCES OF REMAINING TRADE FRICTIONS
Trade frictions with the United States continue to impede India’s export growth and cast a pall on its relationship with Washington. President Trump’s restrictions on a host of trading partners have ensnared India (as well as many other countries).
The first measure that India faced was Section 232 of the Trade Expansion Act of 1962, which the Trump administration invoked to impose tariffs and quotas on imports of steel and aluminum on national security grounds. Canada and Mexico escaped these penalties when they entered into the US-Mexico-Canada Agreement (USMCA). On other countries the United States imposes quotas and tariffs (25 percent on steel and 10 percent on aluminum). As a result, the value of India’s steel exports to the United States dropped from $732 million in 2017 to
26 For WTO antidumping statistics, see https://www.wto.org/english/tratop_e/adp_e/adp_e.htm; for statistics on safeguard measures, see https://www.wto.org/english/tratop_e/safeg_e/safeg_e.htm (both accessed on January 27, 2020). India has sent 938 antidumping notifica-tions to the WTO; the United States has sent 715. They have sent 46 and 12 notifications on safeguards, respectively.

67 PIIE BR 20-2 | SEPTEMBER 2020
$402 million in 2018.27 As India’s steel exports to the United States are a trivial 1.2 percent of US steel imports, the impact on the US steel industry was slight. India filed a case in the WTO against US steel and aluminum tariffs and retaliated by increasing tariff rates on $1.4 billion of US exports (Bown 2019).
In another blow, on June 5, 2019, the Trump trade team terminated India’s eligibility for the GSP, in retaliation to India’s protectionism. As a result, India lost duty-free status on $6.3 billion of its exports to the United States, about 11 percent of its total. These exports face US tariffs of 1–7 percent (Akhtar and Kronstadt 2020). In retaliation, India imposed higher tariff rates on many US products.28 Efforts to defuse the GSP confrontation with a trade agreement failed, despite reciprocal visits by Prime Minister Modi and President Trump.
India has troubled trade relations with many countries, not just the United States. Of the 593 cases brought to the WTO dispute settlement system between 1995 and 2019, India filed 24 against other WTO members and 32 cases were brought against India. But the United States is at the head of the list, accounting for 46 percent of all cases that India filed (11 cases). The United States has filed the second-largest number of complaints (8) about Indian trade practices, representing 25 percent of all cases against India; the European Union filed 11 cases against India. The US actions targeted Indian import licensing and prohibitions, domestic content requirements, export subsidies, and India’s retaliation against the Section 232 steel and aluminum tariffs. Various disputes remain in limbo because of the nonfunctioning status of the WTO Appellate Body.
The bilateral trade friction could get worse because of the US tariff threat to countries, including India, that imposed or consider imposing digital service taxes on foreign tech companies. On April 1, 2020, a 2 percent digital tax on revenues of online business entered into effect in India. This tax is applied to foreign businesses without physical presence in India, such as Amazon. The Trump administration has threatened to impose Section 301 measures to restrict imports from India, European countries, and others if its investigation concludes that such taxes discriminate against US businesses.29
CONCLUSION
To increase its share of global goods and services exports, India should pursue trade liberalization; attract foreign investment; and invest in its dilapidated ports, roads, railways, and other infrastructure. It would be in India’s self-interest to reduce tariffs, remove barriers to imports, and support its export sector with measures other than subsidies, which prompt retaliation by trading partners. Greater economic integration with trading partners would reduce trade costs and improve market access for Indian exporters.
27 US Steel Import Monitor, https://enforcement.trade.gov/steel/license/index.html (accessed on December 11, 2019).
28 Nidhi Verma and Neha Dasgupta, “India to Impose Retaliatory Tariffs on 28 US Goods from Sunday,” Reuters, June 15, 2019, https://www.reuters.com/article/us-usa-trade-india/india-to-impose-retaliatory-tariffs-on-28-us-goods-from-sunday-idUSKCN1TG0H0.
29 Office of the US Trade Representative, “USTR Initiates Section 301 Investigations of Digital Services Taxes,” Press Release, June 2, 2020.
68 PIIE BR 20-2 | SEPTEMBER 2020
Such steps will not be easy in the current environment of protectionism triggered by the United States. Even before the coronavirus pandemic, trade tensions were weakening business confidence and creating uncertainty, dampening global trade growth. The global growth forecast was downgraded in 2019; the trade coverage by import restrictive measures increased by 27 percent, from $588.3 billion in 2017 to $746.9 billion in 2019 (WTO 2019d). India’s export sector, which is vital to its growth prospects, faces a bleak future unless leadership changes the direction of trade policies.
The world is not entirely unreceptive to such a course change. India’s trading partners have forged bilateral and regional free trade agreements granting preferential market access to participants. The European Union established a free trade agreement with Vietnam and with the Mercosur countries (Argentina, Brazil, Paraguay, and Uruguay) in 2020. In the wake of the US withdrawal from the Trans-Pacific Partnership, the remaining 11 countries signed a Comprehensive and Progressive Agreement for Trans-Pacific Partnership (CPTPP), which entered into force in December 2018. Negotiations are proceeding to conclude a Regional Comprehensive Economic Partnership (RCEP) agreement among 10 member states of the Association of Southeast Asian Nations (ASEAN) and 5 Asian countries.
India has opted not to join either the CPTPP or the RCEP. Prime Minister Modi won a resounding reelection victory in 2019, giving him latitude in theory to resist domestic pressures to maintain protectionist policies. President Trump’s visit to India February 24–25, 2020, raised hopes of what was described as a possible “mini trade deal.” But those efforts failed.30 For the time being, protectionism in both countries, the COVID-19 pandemic, and the economic shock from it have dashed any hopes for such a change. It may take a long time for India to rediscover the merits of freer trade, as it did in the early 1990s.
REFERENCES
Aditya, K.S., S.P. Subash, K.V. Praveen, M.L. Nithyashree, N. Bhuvana, and Akriti Sharma. 2017. Awareness about Minimum Support Price and Its Impact on Diversification Decision on Farmers in India. Asia & the Pacific Policy Studies 4, no. 3: 514–26.
Akhtar, Shayerah Ilias, and K. Alan Kronstadt. 2020. US-India Trade Relations. Congressional Research Service in Focus, February 14. Washington. Available at https://fas.org/sgp/crs/row/IF10384.pdf.
Anderson, James E., and Eric van Wincoop. 2003. Gravity with Gravitas: A Solution to the Border Puzzle. American Economic Review 93, no. 1: 170–12.
Baldwin, Richard, and Daria Taglioni. 2006. Gravity for Dummies and Dummies for Gravity Equations. CEPR Discussion Paper 5850. Washington: Center for Economic Policy Research.
Bown, Chad. 2019. Trump’s Mini-Trade War with India. PIIE Trade and Investment Policy Watch, July 8. Washington: Peterson Institute for International Economics.
30 Ravi Agrawal, “How Trump’s Trade Strategy Met Its Match in India,” Foreign Policy, February 25, 2020, https://foreignpolicy.com/2020/02/25/trump-trade-strategy-india-visit-modi-delhi-violence-protests/.
69 PIIE BR 20-2 | SEPTEMBER 2020
Bown, Chad P., and Patricia Tovar. 2011. Trade Liberalization, Antidumping, and Safeguards: Evidence from India’s Tariff Reform. Journal of Development Economics 96, no. 1: 115–125.
Correia, Sergio, Paulo Guimarães, and Tom Zylkin. 2019. PPMLHDFE: Fast Poisson Estimation with High-Dimensional Fixed Effects. Available at https://arxiv.org/abs/1903.01690.
Joumard, Isabelle, Christine Arriola, and Marnix Dek. 2020. Challenges and Opportunities of India’s Enhanced Participation in the Global Economy. OECD Economics Department Working Paper 1597. Paris: Organization for Economic Cooperation and Development. Available at https://dx.doi.org/10.1787/a6facd16-en.
Mishra, Prachi, and Devesh Roy. 2016. India–US Trade and Investment: Have They Been up to Potential? Global Economy Journal 16, no. 3: 539–67.
Panagariya, Arvind. 2004. India’s Trade Reform: Progress, Impact and Future Strategy. Indian Policy Forum 1, March 26. Washington: Brookings Institution. Available at https://www.brookings.edu/wp-content/uploads/2016/07/2004_panagariya.pdf.
Shepherd, Ben. 2016. The Gravity Model of International Trade: A User Guide. An Updated Version. Bangkok: UN Economic and Social Commission for Asia and the Pacific.
Silva, J.M.C. Santos, and Silvana Tenreyro. 2006. The Log of Gravity. Review of Economics and Statistics 88, no. 4: 641–58.
Srinivasan, T.N., and Suresh D. Tendulkar. 2003. Reintegrating India with the World Economy. Washington: Institute for International Economics.
Tinbergen, Jan. 1962. Shaping the World Economy: Suggestions for an International Economics Policy. New York: Twentieth Century Fund.
US ITA (US International Trade Administration). 2019. India: Travel and Tourism. October 13. Washington. Available at https://www.trade.gov/knowledge-product/india-travel-and-tourism.
USTR (Office of the United States Trade Representative). 2019a. 2019 Special 301 Report. Washington.
USTR (Office of the United States Trade Representative). 2019b. 2019 National Trade Estimate Report on Foreign Trade Barriers. Washington.
World Bank. 2020. Doing Business 2020: Comparing Business Regulation in 190 Economies. Washington.
WTO (World Trade Organization). 2015. Trade Policy Review: India. WT/TPR/S/313/Rev.1, September 14. Geneva.
WTO (World Trade Organization). 2019a. Trade Profiles 2019. Geneva.
WTO (World Trade Organization). 2019b. Tariff Profiles 2019. Geneva.
WTO (World Trade Organization). 2019c. India: Export Related Measures. Report of Panel. WT/DS541/R, October 31. Geneva.
WTO (World Trade Organization). 2019d. Report Shows Trade Restrictions by WTO Members at Historically High Levels. December 12, Geneva. https://www.wto.org/english/news_e/news19_e/dgra_12dec19_e.htm.
70 PIIE BR 20-2 | SEPTEMBER 2020
4 Has India’s Trade Negotiating Strategy Hit a Dead End?Jeffrey J. Schott
India was one of the 23 founding signatories of the General Agreement on Tariffs and Trade (GATT) in 1947, and it has been one of the most active developing-country participants in the nine rounds of multilateral trade negotiations under the GATT and its successor, the World Trade Organization (WTO). Indian officials held the second-ranking post of deputy director general of both the GATT and the WTO secretariats from 1973 to 2013, and Indian negotiators represented other developing countries in many high-level negotiating sessions during the Tokyo, Uruguay, and Doha Rounds.1
India’s participation in trade negotiations throughout the postwar period has focused on opening opportunities for export of its manufactures to advanced economies while limiting its own commitments to trade reform, especially in agriculture. India lowered its average tariffs throughout the WTO era via both unilateral reforms and preferential trading arrangements with most of its Asian trading partners except China.2 As a result, India’s average tariff on industrial and farm products is 17 percent—about half the level when the WTO entered into force, in 1995.
Political support for this mercantilist strategy remains strong today, in large measure because Indian officials also provide substantial domestic subsidies, actively impose antidumping and countervailing duties against unfairly priced imports, and deploy other nontariff measures to shield domestic industry and farmers from import competition.3 The cumulative impact of these protectionist policies raises the cost of producing goods in India and undercuts India’s international competitiveness. Indian producers now find themselves at a substantial cost disadvantage versus Chinese firms in their home market and in competition for export sales to other developing countries.
India’s policymakers have painted themselves into a corner. They cannot enter deals in the WTO or in the Asia-Pacific region that include China and thus accord more access to the Indian market for Chinese firms. As a result, India has stalled WTO reforms and walked away from regional pacts, which invariably include China. That is now a serious problem as China enters into preferential trading arrangements that discriminate against Indian exporters.
1 For an excellent summary of India’s role in the GATT and WTO, see chapter 3 of Srinivasan and Tendulkar (2003).
2 India has not concluded preferential deals with China, the European Union, or the United States; bilateral trade with these economies is subject to the WTO’s most favored nation (MFN) tariffs.
3 In the first seven years of the WTO, India was second only to the United States in initiating anti-dumping cases. It remains one of the foremost users of these measures today.
Jeffrey J. Schott is senior fellow at the Peterson Institute for International Economics.
71 PIIE BR 20-2 | SEPTEMBER 2020
INDIA AND THE MULTILATERAL TRADING SYSTEM
Like most developing countries, India made few commitments to trade reform in the first four decades of GATT trade negotiations and bound only a small number of its tariffs in its GATT schedule. Doing so would have required it to set maximum tariff levels or bind tariffs as part of its GATT obligations, limiting its ability to raise tariffs at will above those bound levels to protect domestic industry and farmers without paying compensation to other GATT countries.
Even when India committed to binding its tariffs at a fixed maximum rate, those tariff bindings were generally set well above applied rates (i.e., the rates currently levied by Indian customs). The gap between bound and applied rates has afforded India substantial flexibility to impose new import protection without offering compensation to, or suffering retaliation by, affected trading partners. In short, to the extent that it undertook reform obligations, India’s commitments to tariff liberalization were designed to allow it to increase its applied tariffs substantially without violating GATT obligations. When India unilaterally cut its tariffs, it was not required to maintain those reduced rates and could raise tariffs at will up to the high bound levels without incurring legal consequence. And India was still able to benefit from reform commitments by other GATT members who bound their tariff cuts in their GATT schedules.
India also championed efforts to introduce provisions in GATT and WTO agreements that confer special and differential treatment (SDT) for developing countries. The SDT clauses allowed developing countries to avoid many GATT disciplines and defer the implementation of many others. Coupled with other exceptions for balance of payments purposes, India was able to defer liberalization of its tariffs and quantitative restrictions and maintain discriminatory regulations that favored domestic industries.
India was not the only developing country to “free ride” during the GATT era—enjoying improved access to foreign markets for its exports without making reciprocal concessions—but it was the most prominent advocate for SDT for developing countries in the GATT. The entire GATT era (1948–94) was marked by “free riding” by developing countries until the Uruguay Round agreements, signed in 1994, required India and others to accept new obligations as part of their accession to the WTO.
But India’s “free ride” on the trading system was anything but free; ultimately, it has been self-defeating. Because developing countries did not offer to reduce barriers to their markets, developed countries gave low priority to liberalizing their own restrictions impeding imports, particularly labor-intensive manufactures, from developing countries. The most notable example was the 1974 Multifiber Arrangement, under which developed countries set quotas to limit imports of textiles and clothing. India and other developing countries were also hard pressed to get rich countries to cut back agricultural subsidies, which protected domestic farmers from import competition and promoted agricultural exports.
Moreover, by not requiring developing countries to abide by significant international disciplines, India and others were under less pressure to reduce import barriers and increase competition by foreign firms in their home markets, sheltering high-cost, inefficient domestic production. This approach appealed to Indian politicians who feared that multinationals would dominate the economy.

72 PIIE BR 20-2 | SEPTEMBER 2020
But it left India and other countries vulnerable to competition from other developing countries, especially China, that were willing to lower tariffs to force adjustment of domestic industries to improve their international competitiveness.
Indeed, when China entered the WTO, at the end of 2001, its tariffs were significantly lower than those of India or most other developing countries that had participated in the eight rounds of GATT tariff cuts. Moreover, unlike India, China agreed to bind all its more than 7,500 tariff lines; the simple average bound rate was 12.4 percent—about the same as the average applied rate. In contrast, India undertook far more limited commitments in the Uruguay Round and increased its bindings only from 6 percent to 67 percent of its tariff lines. Rates were up to 300 percent for farm products and 40 percent for manufactures, with a simple average bound rate of 54 percent. India’s simple average MFN applied tariff after the Uruguay Round cuts was 34.9 percent, almost three times higher than China’s.4 India’s average MFN applied rate dropped to 17 percent in 2018, but it is still almost twice that of China (WTO 2019).
India has pursued trade reforms in fits and starts since the early 1990s, when the government reduced tariffs and simplified import licensing requirements as part of major economic reforms introduced by then finance minister and later prime minister Manmohan Singh. Liberalization focused on imports of intermediate goods needed by domestic industries to boost their competitiveness more than final consumer goods like textiles and clothing; it allowed India to undertake new obligations in the Uruguay Round to bind tariffs and reduce the number of quantitative restrictions. However, in 1998, India postponed the reform of quantitative restrictions on about 2,300 tariff lines for balance of payments reasons (Srinivasan and Tendulkar 2003). The quantitative restrictions were removed in 2000–01, after the United States won a WTO dispute challenging the measures.
Since the WTO replaced the GATT, in 1995, India has earned a reputation as the most prominent gadfly of international trade negotiations. It grudgingly accepted the Uruguay Round accords, despite its strong opposition to the intellectual property pact and other new WTO requirements. India had no choice but to do so if it wanted to enter the WTO, which no longer allowed free riding. As in many developing countries, officials in India thought that the changes required by new WTO obligations were excessive and thus demanded that future WTO negotiations focus primarily on development issues (especially cuts by developed countries in their farm subsidies) as payback for developing countries’ “overpayment” in the previous trade round. To that end, India opposed adding the “Singapore issues” to the WTO negotiating agenda,5 and unsuccessfully tried to block the launch of the Doha Development Round in 2001, because the agenda was not limited to holdover issues of concern to developing countries. India subsequently blocked WTO consensus on concluding the Doha Round in
4 Data are from WTO Trade Policy Reviews of China (2006) and India (1998).
5 At the first WTO ministerial, in Singapore in December 1996, countries agreed to add invest-ment, competition policy, transparency in government procurement, and trade facilitation to the WTO agenda. All of these issues except talks on a trade facilitation agreement were dropped from the Doha Round in 2004.

73 PIIE BR 20-2 | SEPTEMBER 2020
the summer of 2008, when a deal was within reach (Blustein 2009, chapter 13), claiming that developed countries’ reform commitments, especially on cutting farm subsidies, were inadequate.
Over the past decade, India has introduced restrictive local content requirements (LCRs) to favor domestic firms by deterring imports of intermediate goods, most prominently in support of India’s manufacturers of solar panels under the Jawaharlal Nehru National Solar Mission program. Those measures distorted trade for several years before being successfully challenged by the United States in the WTO (Hufbauer et al. 2013, chapter 7). (Unfortunately, the United States has emulated India’s restrictive LCR policy in the revised LCRs for auto production in the new United States-Mexico-Canada Agreement.) India also held WTO talks on fisheries subsidies hostage in 2019, to blunt the development of new WTO disciplines that would curtail India’s large subsidy programs. As in other WTO negotiations, India has demanded the inclusion of SDT provisions that would limit the need to cut Indian fishery subsidies. The talks were scheduled to conclude at the June 2020 WTO ministerial meeting, which was postponed because of the COVID-19 pandemic. Prospects for agreement on new fish subsidy disciplines are not bright: India, China, and other countries strongly resist US demands to substantially forgo SDT in the prospective accord.
To be sure, India’s record has not been uniformly protectionist. Since the Uruguay Round, India has lowered its average applied tariffs on manufactures from about 35 percent in 1997 to 17 percent in 2018, although it maintains much higher bound rates, which allow it to quickly raise barriers without contravening WTO obligations. India also agreed to eliminate duties on more than 200 tariff lines in the first Information Technology Agreement (ITA) in 1997 (WTO 1998). It did not participate in the revised version of that pact, the ITA2, in 2015, however, which expanded the scope of information technology (IT) products subject to tariff liberalization (WTO 2017). India’s reluctance to negotiate additional ITA liberalization was not unexpected. Its tariffs on advanced technology goods are among the highest in the world (Greene 2013).
India also accepted the Trade Facilitation Agreement (TFA) at the Bali WTO ministerial, in December 2013. The TFA streamlines customs procedures to expedite customs clearance, thereby reducing international trade costs. It includes SDT provisions that provide extensive transition periods for developing countries to implement the required customs reforms based on their level of development. Several months after the ministerial, India blocked the protocol of amendment to the WTO that was required to complete the legal process for formal approval of the deal (Schott and Hufbauer 2014) and demanded exemptions from WTO disciplines for its subsidies for food stocks and distribution. In so doing, it stalled implementation of the WTO’s first major trade deal that would have primarily benefited developing countries. Only after receiving additional concessions related to its subsidy programs did India accept the TFA, in April 2016.
On services, India has sought to augment commitments in the General Agreement on Trade in Services (GATS) to improve the ability of Indian workers in services to work abroad. Indian officials have targeted reforms to relax restrictive visa policies in developed countries and provide mutual recognition of high-skilled worker qualifications (see chapter 5 of this Briefing). However, India
74 PIIE BR 20-2 | SEPTEMBER 2020
remained on the sidelines of the plurilateral negotiations of the Trade in Services Agreement when a subset of WTO members sought to advance services trade reforms beyond existing GATS requirements.
In sum, India has been a prominent player in the GATT and the WTO, promoting special preferences and exemptions for developing countries but often obstructing progress on trade liberalization and the development of new obligations to constrain trade-distorting domestic policies. Its primary focus has been on maintaining its own flexibility to restrict imports, through SDT provisions and unbridled use of domestic and export subsidies and trade remedies, even if they obstruct progress in multilateral trade negotiations. But one reaps what one sows, and India’s plantings have not produced a bumper crop of trade benefits for its own economy. Instead, India has turned to bilateral and regional initiatives to spur trade growth.
INDIA’S BILATERAL AND REGIONAL INITIATIVES
As prospects for multilateral trade negotiations faded in the early years of the 21st century, India adopted a two-track strategy of negotiating neighborhood trade deals as a complement or substitute for prospective WTO reforms (table 4.1). India struck bilateral merchandise trade deals with Sri Lanka (2001), Nepal (2002), Afghanistan (2003), Singapore (2005), and Bhutan (2006). These pacts complemented a broader regional deal, the South Asian Free Trade Area (SAFTA), negotiated in 2004–05 by India and Bangladesh, Bhutan, Maldives, Nepal, Pakistan, and Sri Lanka. SAFTA was the first Indian trade deal to cover trade in services.6
India’s initial regional trade pacts were generally limited in scope, focusing mainly on reducing tariffs protecting merchandise trade. For example, the Asia-Pacific Trade Agreement (formerly the Bangkok Agreement) initially eliminated duties on only 1.7 percent of India’s tariff lines. Often the pacts committed to tariff preferences (lower than the MFN rates in WTO schedules) but did not require the elimination of the entire tariff. In each case, India demanded that a large list of import-sensitive products be exempted from the tariff liberalization or subject to quotas. The agreements generally include provisions on trade remedy measures, product standards, and rules of origin but contain few substantive commitments to “nontraditional” rule-making areas such as competition policy and environment and labor standards.
India’s subsequent trade pacts with Singapore (2005), South Korea (2010), and Japan (2011) include disciplines on goods, services, and investment, and the bilateral pact with Malaysia (2011) covers goods and services. Although many commitments closely parallel India’s WTO obligations, these free trade agreements (FTAs) represent India’s most comprehensive trade pacts to date.
India broadened the scope and coverage of its bilateral pacts in Southeast Asia in 2010 through the FTA with the Association of Southeast Asian Nations (ASEAN).
6 The India-Singapore FTA was the first bilateral pact to cover services; it was negotiated follow-ing the conclusion of SAFTA.

75 PIIE BR 20-2 | SEPTEMBER 2020
Initially, the pact covered only trade in goods; an agreement on trade in services and investment was finalized in December 2012. When the tariff reforms are fully implemented, in 2022, about 75 percent of tariff lines will be duty free (WTO 2015). India committed to eliminating all tariffs on 4,000 tariff lines within 10 years and designated nearly 15 percent of its tariff lines for phased reduction. It excluded 489 products from tariff concessions, including agricultural items (302), textiles and clothing (81), machinery and automotive products (52), and chemicals and plastics (32) (Raju 2010). As the pact’s unwieldy rules of origin seem to discourage firms from applying for FTA preferential tariffs, the impetus to trade growth is probably limited.
The India-ASEAN FTA on services and investment aims to improve market access for a broad range of services sectors, such as engineering, tourism and travel, and transport and educational services. However, the scope of agreed reforms was shallow, partly because of the slow pace of services reforms among the ASEAN countries in their own integration process and their unwillingness to
SCHOTT - chapter 4
Table 4.1India’s 21st century free trade agreements
Free trade pact signed and in effect
Bilateral merchandise trade in 2018 (billions of dollars)
Percent share of India’s merchandise trade with world
Partner group
Status year Imports Exports Imports Exports
India-Malaysia Comprehensive Economic Cooperation Agreement
Malaysia 2011 12.9 6.5 2.1 2.0
India-Japan Comprehensive Economic Partnership Agreement
Japan 2011 15.2 4.7 2.5 1.5
ASEAN-India Comprehensive Economic Cooperation Agreement
ASEAN 2010 69.4 36.1 11.2 11.2
India-Republic of Korea Comprehensive Economic Partnership Agreement
South Korea 2010 19.7 4.8 3.2 1.5
India-Mercosur Preferential Trade Agreement
Mercosur 2009 16.8 4.6 2.7 1.4
India-Chile Preferential Trading Agreement
Chile 2007 2.3 0.9 0.4 0.3
India-Gulf Cooperation Council Free Trade Area
GCC 2006 94.2 40.0 15.3 12.4
Bhutan-India Trade Agreement Bhutan 2006 0.3 0.7 0 0.2
South Asian Free Trade Area South Asia 2006 4.6 24.6 0.7 7.6
India-Singapore Comprehensive Economic Cooperation Agreement
Singapore 2005 16.9 10.4 2.7 3.2
Afghanistan-India Preferential Trading Agreement
Afghanistan 2003 0.5 0.7 0.1 0.2
Indo-Nepal Treaty of Trade Nepal 2002 0.5 7.3 0.1 2.3
India-Sri Lanka Free Trade Agreement
Sri Lanka 2001 1.5 4.7 0.2 1.4
ASEAN = Association of Southeast Asian Nations; Mercosur = Southern Common Market; GCC = Cooperation Council for the Arab States of the Gulf
Source: Asian Development Bank’s Free Trade Agreements database, https://aric.adb.org/database/fta; UN Comtrade data via World Bank’s World Integrated Trade Solutions (WITS) database.

76 PIIE BR 20-2 | SEPTEMBER 2020
open up to India’s services providers when India was offering so little in terms of investment reforms in the negotiations. According to Narayan (2012), India consequently dropped its demands that ASEAN countries further open services sectors for independent professionals and contractual services suppliers; in turn, ASEAN members excluded provisions on prudential measures in the financial services chapter. In the event, the deal was substantially watered down.
Over the past decade, India also launched FTA negotiations with Canada, the European Union, Australia, and New Zealand. These talks had a more extensive agenda, covering services, investment, government procurement, intellectual property rights, and competition policy. However, these initiatives bogged down because of political resistance in India to tariff cuts on sensitive products like automobiles, new disciplines on Indian subsidies for farmers and manufacturers, and the opening of access to foreign bidding on India’s public procurement contracts. As a result, the talks have been inactive for some time.
The following subsections summarize the high-water marks for India’s trade commitments in its most advanced trading pacts with Singapore, Japan, and South Korea. They underscore the limits of India’s willingness to commit to trade reforms that go beyond what has been achieved with ASEAN members and identify the potholes on the road to broader free trade pacts with the United States, the European Union, and others.
Tariff Liberalization
India’s trade pacts with Japan and Korea reduce or eliminate most tariffs on bilateral trade, albeit often with broad exceptions for key manufacturing sectors. In the Comprehensive Economic Partnership Agreement (CEPA) between Japan and India, India committed to the immediate elimination of 17.4 percent of tariff lines (compared with 87.0 percent by Japan), including in sectors like textiles and clothing, and phased reduction of 66.3 percent of tariff lines, generally within 10 years. India made concessions on key sectors like electrical and nonelectrical machinery, but broad exclusions for more than 1,500 products, including passenger vehicles, some automotive components, and some chemical items, greatly mitigated the potential for increased trade (Hoda 2011).
In the India-Korea CEPA, India committed to eliminating duties for 85 percent of tariff lines within 10 years, but overall trade preferences to Korea were not substantial, because of large-scale exceptions for 1,895 tariff lines. Fisheries and various agricultural products (including dairy produce, vegetables, fruits and nuts, spices, and tobacco) were fully exempt or subject to restrictive regulations.
Services
India’s trade pacts with Korea and Japan use a positive list approach to scheduling commitments, under which each country negotiates a list of services that will be covered by the obligations of the agreement. These pacts include professional and business services, telecommunications, environmental services, education, and tourism. These new FTA commitments involve mostly incremental improvements to reforms already undertaken in India’s revised GATS offers submitted to the WTO, however (Hoda 2011). For example, in the Singapore-India CEPA, these so-called GATS-plus commitments include
77 PIIE BR 20-2 | SEPTEMBER 2020
removing the requirement of obtaining prior approval from India’s Foreign Investment Promotion Board (Roy, Marchetti, and Lim 2006). India limits the percentage of foreign equity and ownership in many strategic sectors, such as telecommunications, audio-visual services, and financial services; other important sectors remain exempt from national treatment obligations.7
India’s agreements with Singapore, Korea, and Japan include a separate chapter that embeds labor mobility commitments relating to the cross-border provision of labor services (Mode 4). Each chapter sets out criteria for the temporary entry of business visitors, intracorporate transferees, independent professionals, and contractual services suppliers from the partner country. The pacts also establish fast-track and streamlined visa application procedures and requests for visa extensions. In addition, the partner countries commit to developing mutual recognition agreements in certain sectors, such as education, that allow the licensing and certification standards of each of the partner countries to be applied in all the countries. India’s trade pacts with Singapore and Korea further specify that temporary entry will not be limited by labor market or economic needs testing and that visiting services providers will not be required to make social security contributions in the host country. India unsuccessfully sought similar commitments from the European Union (see Modwel and Singh 2012, Hoda 2012).
Government Procurement
India is not a member of the WTO Government Procurement Agreement (GPA), and Indian trade pacts contain few obligations covering access to bidding on government contracts for goods and services. The India-Korea CEPA does not include bilateral commitments to liberalizing government procurement, but it outlines “cooperative activities” related to the exchange of information and knowledge of regulatory policies (Article 13.12). The India-Japan CEPA provisions contain some transparency and information-sharing commitments; they also establish that MFN treatment is applicable only to central government procurement. India and Japan have committed to reviewing these limited commitments once India accedes to the GPA. India’s failed negotiations with the European Union discussed transparency and market access provisions, but India was not willing to cover procurement contracts for lucrative projects sought by EU negotiators in the sectors of public transportation infrastructure, energy, and telecommunications (Modwel and Singh 2012).
The government procurement market in India is large and opaque, with central and subnational government purchases estimated at 25–30 percent of GDP. India has made strides to make the market more transparent and competitive, but it still lacks transparency, national treatment protection, and nondiscrimination commitments consistent with the GPA. Modwel and Singh (2012) outline the considerable domestic and policy challenges in India—including divergent federal and state policies and a lack of transparency and accountability in procurement procedures—that have prevented India from making meaningful commitments to further open its market. Like many countries,
7 The European Union pressed India to further improve market access in key sectors, including banking, insurance, accounting and legal services, multibrand retail, and air transport services, without evident success.

78 PIIE BR 20-2 | SEPTEMBER 2020
India’s procurement policies are molded by political and economic pressures to reserve public contracts for domestic firms. To accord preferences for domestic firms, India has increasingly required LCRs for goods covered by government procurement contracts. The “Buy India” preferential market access rules aim to spur domestic manufacturing in the information and communications technology (ICT) sector, by mandating LCRs for procurement by the government and state-owned enterprises, as well as for the purchases of telecommunications and computer equipment by private network providers with government licenses, on the basis of national security concerns.
Intellectual Property Rights
India is party to international agreements that set standards for the protection of intellectual property rights (IPR), including various conventions of the World Intellectual Property Organization (WIPO) as well as the WTO Agreement on Trade-Related Aspects of Intellectual Property Rights (TRIPS). India’s FTAs broadly affirm the rights and obligations of the TRIPS agreement but do not extend much beyond longstanding commitments on patent, trademark, and copyright protection.
India’s CEPAs with Singapore and Korea do not include detailed provisions on patents, copyrights, and trademarks. The India-Japan CEPA only briefly outlines provisions on patent and trademark protection, including geographical indications. The Korea-India CEPA notes that the agreement should not preclude either country from implementing additional intellectual property rules that are “TRIPS-plus,” but most of India’s bilateral trade pacts simply affirm existing international obligations.
The India-Korea CEPA specifies that IPR enforcement measures must be consistent with TRIPS obligations, but it does not call for enforcement or border measures as remedies for intellectual property infringement or counterfeiting. Simply put, India has never been keen on using trade pacts to enforce IPRs. It was forced to accept TRIPS as part of the Uruguay Round package, but it prefers the flexibility accorded by WIPO conventions to circumvent monopoly powers of patent holders, in order to benefit its generic drug manufacturers, among others.8
Environment and Labor
Like many developing countries, India has shied away from substantive commitments to obligations on environment and labor in its trade pacts, preferring language that simply commits countries to enforcing their own laws. India’s CEPAs with Singapore, Korea, and Japan include standard but basically hortatory language that the promotion of trade and investment should not prevent parties from enforcing domestic health, safety, or environmental measures. India’s trade pacts with Korea and Japan offer the most direct
8 India boasts one of the world’s largest pharmaceutical industries. It is a major producer of low-cost generic medicines and reports annual exports of about $14 billion to developing economies and advanced markets, including the United States, the European Union, Australia, and Japan. The European Union pressed India to include data exclusivity provisions regarding pharmaceuticals and agricultural chemicals and to extend higher levels of protection for geo-graphical indications beyond wine and spirits to agricultural products; India’s refusal contrib-uted to the failure of the talks (Hoda 2012).

79 PIIE BR 20-2 | SEPTEMBER 2020
language on commitments to refrain from lowering environmental standards to attract investment, stating that “it is inappropriate to encourage investment activities. . .by relaxing its environmental measures. To this effect each Party should not waive or otherwise derogate from such environmental measures as an encouragement for establishment, acquisition or expansion of investments” (Japan-India CEPA, Article 99). The India-Japan CEPA also includes an article devoted to environmental protection that commits both countries to ensuring that their laws and regulations provide “adequate levels” of environmental protection, to strive for improvements, and to monitor compliance of such laws and regulations (Article 8).
Provisions on labor standards are not included in any of India’s agreements. Although India has ratified four International Labor Organization (ILO) conventions, it has yet to ratify other core conventions related to the freedom of association, collective bargaining, and child labor.9
INDIA AND THE REGIONAL COMPREHENSIVE ECONOMIC PARTNERSHIP
While India was pursuing incremental reforms in trade pacts with ASEAN, Japan, and Korea, other countries in the region, and throughout Asia and the Pacific, were developing regional initiatives to augment the trade reforms and updates to the trade rulebook that had eluded participants in the Doha Round in the WTO. In March 2010, negotiations began between the United States and seven of its Asia-Pacific trading partners on a new Trans-Pacific Partnership (TPP), which encompassed 12 countries in a high-standard, comprehensive FTA by the time it was signed, in February 2016. The TPP included a diverse set of participants, large and small, rich and poor, all ascribing to common rules with very limited exceptions (Schott 2019). Key Asian trading powers such as China, India, and Korea did not participate. The Trump administration withdrew from the pact in its first week in power, in January 2017; the pact was salvaged by the other 11 signatories and renamed the Comprehensive and Progressive Agreement for Trans-Pacific Partnership (CPTPP). The CPTPP entered into force in late December 2018.
While the TPP negotiations were advancing, in late 2012 the 10-member ASEAN and Australia, China, India, Japan, Korea, and New Zealand launched talks on a Regional Comprehensive Economic Partnership (RCEP) (table 4.2). Although China is the largest participant, the RCEP talks have been led by ASEAN, not China. The ASEAN members have sought to deepen their existing trade ties with bilateral FTA partners10 and to use the pressure of the trade talks to forge more unified policies among ASEAN members in their ASEAN Economic Community.
That said, there is substantial overlap in the membership of the two regional trade initiatives. Seven of the 16 RCEP participants are TPP signatories; the two pacts are not mutually exclusive. Countries that wanted to use an international trade pact to reinforce efforts at domestic economic reform sought the binding
9 The European Union reportedly pushed for India’s recognition of core international labor stan-dards and ratification of ILO conventions (Hoda 2012).
10 Countries that have an FTA with the ASEAN are eligible to participate in RCEP negotiations.
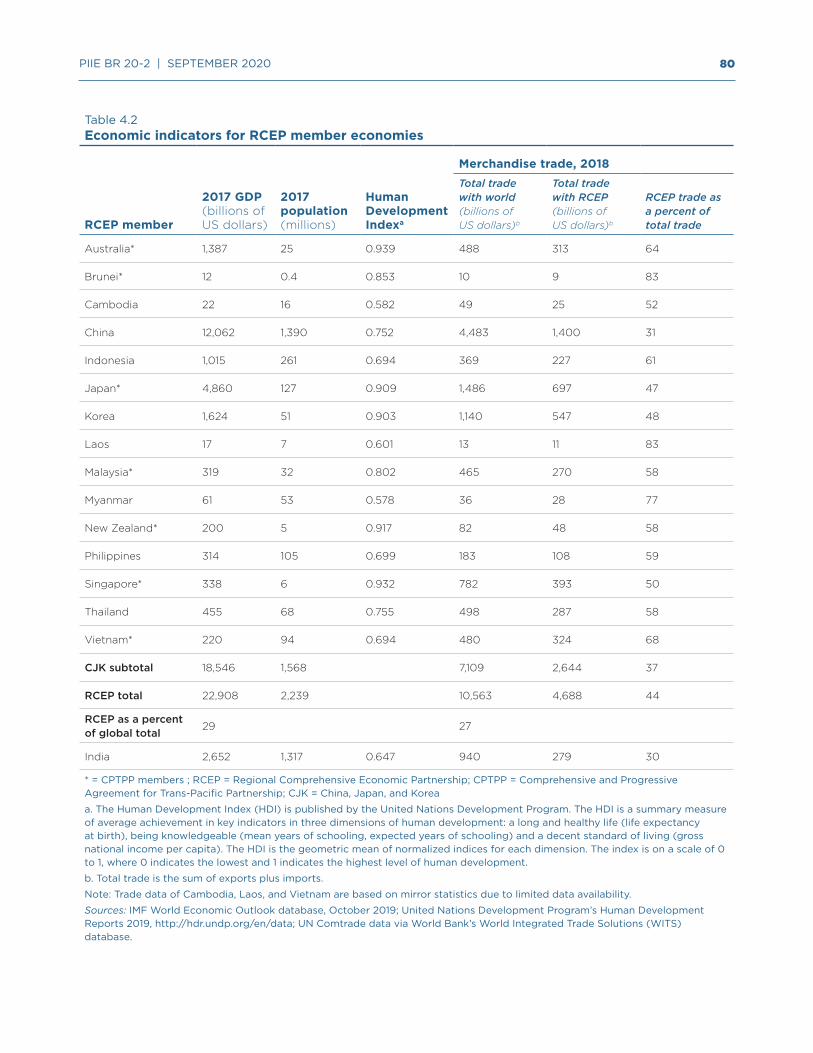
80 PIIE BR 20-2 | SEPTEMBER 2020
SCHOTT - chapter 4
Table 4.2 Economic indicators for RCEP member economies
RCEP member
2017 GDP (billions of US dollars)
2017 population (millions)
Human Development Indexa
Merchandise trade, 2018Total trade with world (billions of US dollars)b
Total trade with RCEP (billions of US dollars)b
RCEP trade as a percent of total trade
Australia* 1,387 25 0.939 488 313 64
Brunei* 12 0.4 0.853 10 9 83
Cambodia 22 16 0.582 49 25 52
China 12,062 1,390 0.752 4,483 1,400 31
Indonesia 1,015 261 0.694 369 227 61
Japan* 4,860 127 0.909 1,486 697 47
Korea 1,624 51 0.903 1,140 547 48
Laos 17 7 0.601 13 11 83
Malaysia* 319 32 0.802 465 270 58
Myanmar 61 53 0.578 36 28 77
New Zealand* 200 5 0.917 82 48 58
Philippines 314 105 0.699 183 108 59
Singapore* 338 6 0.932 782 393 50
Thailand 455 68 0.755 498 287 58
Vietnam* 220 94 0.694 480 324 68
CJK subtotal 18,546 1,568 7,109 2,644 37
RCEP total 22,908 2,239 10,563 4,688 44
RCEP as a percent of global total
29 27
India 2,652 1,317 0.647 940 279 30
* = CPTPP members ; RCEP = Regional Comprehensive Economic Partnership; CPTPP = Comprehensive and Progressive Agreement for Trans-Pacific Partnership; CJK = China, Japan, and Korea
a. The Human Development Index (HDI) is published by the United Nations Development Program. The HDI is a summary measure of average achievement in key indicators in three dimensions of human development: a long and healthy life (life expectancy at birth), being knowledgeable (mean years of schooling, expected years of schooling) and a decent standard of living (gross national income per capita). The HDI is the geometric mean of normalized indices for each dimension. The index is on a scale of 0 to 1, where 0 indicates the lowest and 1 indicates the highest level of human development.
b. Total trade is the sum of exports plus imports.
Note: Trade data of Cambodia, Laos, and Vietnam are based on mirror statistics due to limited data availability.
Sources: IMF World Economic Outlook database, October 2019; United Nations Development Program’s Human Development Reports 2019, http://hdr.undp.org/en/data; UN Comtrade data via World Bank’s World Integrated Trade Solutions (WITS) database.
81 PIIE BR 20-2 | SEPTEMBER 2020
commitments of the TPP; those that, like India, did not or could not meet the TPP’s exacting requirements pursued negotiations on the more flexible and incremental approach to trade reforms of the RCEP.
The RCEP is not as comprehensive as the TPP, its Asia-Pacific counterpart. Its requirements are more flexible and its enforcement procedures less stringent. RCEP seeks to dismantle barriers on merchandise and services trade through the gradual liberalization of tariffs and the reduction of nontariff barriers, with provisions for differential treatment and reductions in intraregional disparities. It represents a substantive upgrade from the India-ASEAN FTA, with obligations across 20 chapters, including digital trade, services, and investment.11 Tariff liberalization reportedly covers more than 90 percent of tariff lines, although some cuts have long transition periods. The RCEP also includes product-specific regional content requirements that are common to all member countries, giving significant value to being inside the group.
The RCEP is the only FTA initiative involving both India and China, which explains in large measure why the talks have had such a long gestation period. India was willing to reduce its list of products exempt from or subject to partial liberalization compared with its previous FTAs, but it would not extend such concessions to China. India has frequently been cited as the major impediment to reaching consensus on RCEP obligations since at least 2015. In November 2019, Prime Minister Narendra Modi announced that India would not sign the final RCEP agreement, deferring for some time at least obligations to further open its market to imports from China and the other RCEP members. India is the only one of the 16 countries that participated in the RCEP negotiations to decline to sign the pact. A major reason for stepping back was to maintain tariffs to protect domestic industries against imports of manufactured goods from China and other RCEP members.
Even without India, the RCEP is the world’s largest regional trade arrangement, with a combined GDP of about $23 trillion and a population of 2.2 billion. India never had a strong political constituency supporting participation in the RCEP, even though the prospective pact includes countries that account for 30 percent of total Indian merchandise trade. RCEP is ASEAN led, but the three northeast Asian countries together account for 81 percent of RCEP members’ GDP and two-thirds of their combined global trade. China alone accounts for more than half of RCEP GDP. In simple terms, RCEP looks too much like a China-India FTA. India was not willing to offer new concessions to Chinese firms to access the Indian market.
While hoping that India’s leaders have a change of heart about the regional pact, the other RCEP countries are going forward without India. That is bad news for India’s manufacturers, because the pact’s content rules will favor sourcing from China and other RCEP members and could thus pose a major new barrier to Indian exports to Asian countries. It is hard to see new Indian trade initiatives emerging in the region when its trading partners have signed on to RCEP’s regional trading rules and standards.
11 The legal text of the RCEP is under final review and was not yet publicly available as of September 2020.
82 PIIE BR 20-2 | SEPTEMBER 2020
A US-INDIA BILATERAL PACT?
Based on precedents in its bilateral and regional agreements, it would be difficult for India to meet the standards of US FTAs, in terms of both the coverage of issues and the depth of liberalization and trade reform demanded by the US Congress. In many areas, including IPR, government procurement, and environmental and labor standards, the US and Indian positions are far apart.
In the near term, India is simply not ready to implement and enforce a comprehensive set of trade and investment obligations comparable to those contained in the standard US trade pact, now represented by the United States-Mexico-Canada agreement. Even in the medium term, it is hard to see where there would be political support for the substantial trade and domestic policy reforms that would be needed to bring India’s practices into conformity with the high standards of the US pacts. The fact that India is not willing to undertake even the modest obligations of the RCEP seems to indicate that Indian officials want to continue to keep close rein on foreign competitors’ access to the Indian market. And by revoking India’s access to unilateral US trade preferences, US officials also seem to be placing priority on raising rather than lowering barriers to bilateral trade. Although business leaders in both countries still clamor for at least a mini deal involving cooperation on regulatory issues, a full-fledged bilateral trade pact is dead in the water.
Can the gap be narrowed? Efforts to do so in the India-EU trade talks, which are now at an impasse after several years of progress in fits and starts, are instructive. The EU negotiating priorities in many areas mirrored those sought by US officials, and India-EU talks have stalled on key issues where the United States would also insist on changes in Indian policies.
In the near term, US-India talks are likely to follow the pattern of other Trump trade initiatives. Barriers to bilateral trade will rise, as they have with India’s exclusion from the US Generalized System of Preferences (GSP). US officials will demand Indian purchases of US products in return for a partial restoration of the trade preferences. Indian officials may be amenable to defense procurement commitments and some energy purchases from US suppliers to offset Iranian supplies subject to US sanctions. But India is still vulnerable to US financial sanctions against firms that purchase Iranian oil and banks that execute the transactions, a cloud that hovers over prospective trade talks.
Services are the obvious area for US-India initiatives, given the strength of IT providers in both countries. Even here, however, Indian demands for changes in US visa policy could quickly dim US interest in a bilateral pact.
Improving the mobility of Indian professionals in the United States has been a longstanding Indian trade priority; high-skilled Indian workers account for the largest share of the very limited number of US temporary employment visas. India’s concerns include the restrictiveness of the current H-1B quota; the absence of an India-US totalization agreement, which would exempt Indian workers on temporary work visas from social security contributions and increased H-1B and L-1 visa fees. Indian officials regard the increased

83 PIIE BR 20-2 | SEPTEMBER 2020
visa fees as prima facie discrimination against Indian professionals, given the disproportionate effect of the policy on Indian IT and computer services and software companies.12
As Congress has warned US trade negotiators not to cover any activity that could be considered part of US immigration policy, they are highly reluctant to discuss liberalization of policies affecting the provision of labor services. The United States has made exceptions to this broad rule of thumb in past negotiations, through the creation of special categories of visas, the allotment of visa quotas, or term extensions for select countries.13 The Trump administration seems unlikely to follow those precedents.
CONCLUSIONS
Looking at what India has done and has avoided doing in the past 20 years of bilateral, regional, and multilateral trade negotiations, it seems evident that Indian officials remain wedded to a policy of import substitution that runs counter to the negotiation of comprehensive free trade pacts. The Make in India policy and the stimulus measures introduced in response to the COVID-19 pandemic rely on trade protection as part of the strategy to promote the self-sufficiency of domestic industry. The prospect of increased foreign market access has failed to sway the protectionist lobbies that want to maintain India’s labyrinth of trade barriers. And India’s trading partners now increasingly question offering unilateral tariff preferences or extensive exemptions from negotiated trade reforms to Indian companies.
Meanwhile, India has thrown sand in the gears of multilateral trade reforms, and new WTO deals seem few and far away. Even worse, the weak WTO track record has sparked a backlash against current rules and procedures—and not just against the Appellate Body and WTO dispute settlement procedures. The United States is pressing the WTO to claw back special and differential treatment. US sanctions against Iran’s oil customers pose a substantial threat to bilateral trade and investment, further complicating prospects for a US-India FTA. And in Asia, Indian exporters face heightened discrimination as RCEP regional content rules discourage sourcing from companies outside the 15-member bloc. India’s free ride on the trading system is coming to an end; its trade negotiating strategy has reached a dead end.
12 Government of India, “Anand Sharma Pushes for Free Movement of Professionals,” press re-lease, September 23, 2011.
13 For example, the North American Free Trade Agreement (NAFTA) created the TN NAFTA pro-fessional visa, which allows Canadians and Mexicans to work temporarily in the United States in designated professions (engineering, accounting, and sciences). The US-Singapore FTA es-tablished the H-1B1 visa with similar temporary employment opportunities. The United States–Korea Free Trade Agreement, (KORUS FTA) extends the validity of L-1 visas for intracompany transferees to five years, up from the one- to three-year period that existed previously.

84 PIIE BR 20-2 | SEPTEMBER 2020
REFERENCES
Blustein, Paul. 2009. Misadventures of the Most Favored Nations: Clashing Egos, Inflated Ambitions, and the Great Shambles of the World Trade System. New York: PublicAffairs.
Greene, William. 2013. Export Potential for US Advanced Technology Goods to India Using a Gravity Model Approach. Office of Economics Working Paper 2013-03B. Washington: US International Trade Commission. Available at https://www.usitc.gov/publications/332/EC201303B.pdf.
Hoda, Anwarul. 2011. How Much Difference Will India-Japan CEPA Make? ICRIER Trade Policy and WTO Newsletter, April. New Delhi: Indian Council for Research on International Economic Relations. Available at http://icrier.org/pdf/Trade_policy_and_WTO_Newsletter_april2011.pdf.
Hoda, Anwarul. 2012. European Union, Regional and Interregional Economic Integration and India. ICRIER Trade Policy and WTO Newsletter, April: 3–7. New Delhi: Indian Council for Research on International Economic Relations. Available at http://www.icrier.org/pdf/april2012_wto_Newsletter.pdf.
Hufbauer, Gary Clyde, Jeffrey J. Schott, Cathleen Cimino, Martin Vieiro, and Erika Wada. 2013. Local Content Requirements: A Global Problem. Policy Analyses in International Economics 102. Washington: Peterson Institute for International Economics.
Modwel, Suman, and Surendra Singh. 2012. The EU-India FTA Negotiations: Leading to an Agreement or Disagreement? ORF Occasional Paper #32, February. Delhi: Observer Research Foundation.
Narayan, S. 2012. India ASEAN FTA in Services. ISAS Brief 262, December 21. Singapore: Institute of South Asian Studies, National University of Singapore. Available at https://www.files.ethz.ch/isn/157880/ISAS_Brief_261_-_India_ASEAN_FTA_in_Services_03012013111901.pdf.
Raju, Sunitha. 2010. ASEAN-India FTA: Emerging Issues for Trade in Agriculture. New Delhi: Indian Institute of Foreign Trade. Available at http://agritrade.iift.ac.in/html/Training/ASEAN%20%E2%80%93%20India%20FTA%20%20Emerging%20Issues%20for%20Trade%20in%20Agriculture/Sunita%20Raju%20mam.pdf.
Roy, Martin, Juan Marchetti, and Hoe Lim. 2006. Services Liberalization in the New Generation of Preferential Trade Agreements (PTAs): How Much Further than the GATS? Staff Working Paper ERSD-2006-07, September. Geneva: World Trade Organization. Available at https://www.wto.org/english/res_e/reser_e/ersd200607_e.pdf.
Schott, Jeffrey J. 2019. The TPP: Origins and Outcomes. In Handbook of International Trade Agreements, ed. Robert E. Looney, 401–11. New York: Routledge.
Schott, Jeffrey J., and Gary Clyde Hufbauer 2014. Putting the Trade Facilitation Agreement Back on Track after India’s Obstruction. Trade and Investment Policy Watch blog, August 5, 2014. Washington: Peterson Institute for International Economics. Available at https://www.piie.com/blogs/trade-investment-policy-watch/putting-trade-facilitation-agreement-back-track-after-indias.
Srinivasan, T.N., and Suresh D. Tendulkar. 2003. Reintegrating India with the World Economy. Washington: Institute for International Economics.
WTO (World Trade Organization). 1998. Trade Policy Review: India 1998. Geneva.
WTO (World Trade Organization). 2006. Trade Policy Review: China 2006. Geneva.
WTO (World Trade Organization). 2015. Trade Policy Review: India 2015. Geneva.
WTO (World Trade Organization). 2017. 20 Years of the Information Technology Agreement. Geneva.
WTO (World Trade Organization). 2019. World Tariff Profiles 2019. Geneva.
85 PIIE BR 20-2 | SEPTEMBER 2020
5 US-India Labor Migration: A $117 Billion Benefit to the United States Jacob Funk Kirkegaard
About 4.5 million Indian citizens live in the United States—the single-largest overseas Indian community in the world. US policies toward immigrants and their families have become an emotional as well as an economic flashpoint that may equal or even exceed trade in terms of its sensitivity.
Indian migration to the United States is economically important for both countries. The United States is among the largest sources of overseas remittances to India, with about $13 billion sent in 2018. Indians in the United States work as high-tech specialists, medical professionals, civil servants, and entrepreneurs.1 Americans of Indian descent are among the most economically successful population groups in the United States, enjoying the highest median incomes of any ethnic group in recent years.2
Immigration policy has become highly politically contentious in the United States since the arrival of President Donald Trump. Tougher immigration rules and enforcement were among the most important parts of Trump’s political platform. These policies have strained US-India relations, aggravating hostility in India toward Trump’s removal of longstanding trade preferences for India’s exports, lack of Indian willingness to purchase American nuclear technology,3 and the Trump administration’s objections to Indian weapons purchases from Russia.4
The disputes center on visa rules and go back to before President Trump entered office. In 2016, India complained to the World Trade Organization (WTO) over fees charged to applicants of temporary worker visas into the United States. In 2019, the Trump administration informed India that it might limit the number of H-1B visas granted to high-skilled professionals from India. Earlier, it considered revoking work authorization for spouses and other family members of
1 In 2018, US remittances to India were exceeded only by the level of Indian remittances com-ing from the United Arab Emirates (UAE). See World Bank Bilateral Remittance Matrix 2018, https://www.knomad.org/sites/default/files/2019-11/Bilateralremittancematrix2018_Oct2019.xlsx.
2 US Census Bureau, 2017 American Community Survey, https://www.census.gov/programs-sur-veys/acs/news/data-releases/2017/release.html.
3 The 2007 Nuclear Accord envisioned that India would purchase six Westinghouse nuclear reactors. More than 12 years later, the deal has not been finalized, depriving the US government of a major commercial boost to bilateral trade and a reason for accepting the political conces-sions made to India in the accord. See https://economictimes.indiatimes.com/industry/energy/power/npcil-westinghouse-deal-still-many-differences-to-resolve/articleshow/74328698.cms?from=mdr.
4 India is among the world’s largest arms importers. Russia exported more than $20 billion worth of arms to India in the last decade, accounting for two thirds of India’s total foreign arms purchases. Data from the Stockholm International Peace Research Institute (SIPRI) at http://armstrade.sipri.org/armstrade/page/values.php.
Jacob Funk Kirkegaard is nonresident senior fellow at the Peterson Institute for International Economics (PIIE) and resident senior fellow at the German Marshall Fund of the United States office in Brussels. He has resided in the United States on an E-16 (priority worker, alien with extraordinary ability) green card sponsored by PIIE. He previously held H-1B initial, H-1B continuing, and O-1A temporary visas sponsored by PIIE. This chapter updates and expands part of the analysis in Kirkegaard (2015).
86 PIIE BR 20-2 | SEPTEMBER 2020
Indian citizens in the United States on H-4 visas.5 Since 2015, more than 100,000 Indian spouses (overwhelmingly women) a year have received H-4 visas (US Department of State 2019) often to work as teachers, doctors, engineers, and entrepreneurs (Bier 2020).
Until the COVID-19 pandemic, the Trump administration did not act to significantly reduce the level of Indian labor migration to the United States, although it did tighten some visa eligibility criteria, leading to a modest increase in rejection rates for H-1B visas. The number of work visas granted to Indians under the Trump and Obama administrations did not differ greatly.
In the second quarter of 2020, however, the Trump administration restricted inflows of legal immigrants to the United States, including a very large number from India, with the stated intent of protecting American workers during the pandemic. In April 2020, President Trump signed Presidential Proclamation 10014, temporarily banning the entry of new lawful permanent residents (green card holders), except people working in the medical field, investors, and immediate relatives of US citizens (Federal Register 2020). On June 22, he announced the suspension of entry of new temporary visa holders, effectively severing the entry path to the United States for tens of thousands of high-skilled Indian and other temporary workers.
Because of these tensions, less noticed than tensions in other areas, the foundation for continued deep, productive, and expanding US-Indian labor migration relations is under long-term political threat. The consequences are particularly important in many services and technology sectors.
Estimating the size of the economic impact of these actions is not easy, because data on bilateral labor migration relations are sometimes difficult to collect. The United States carefully records immigration, but the availability of detailed Indian visa and immigration data for US citizens is limited and does not consistently cover an extended period. Consequently, this chapter draws mostly on US immigration data.
The chapter argues that the United States would do well to take an expansive view of issuing visas for high-skilled Indian citizens and that doing so would benefit both India and the United States. It estimates the value of Indian migration to the United States at more than $117 billion in 2019, a level that significantly surpasses the value of US goods and services imports from India.
LEGAL PERMANENT MIGRATION TO THE UNITED STATES FROM INDIA
US immigration law distinguishes between permanent immigrant and temporary nonimmigrant visas. Permanent immigrant status includes green cards, which enable non-US citizens to work. Temporary visas are granted to tourists, businesspeople, students, and temporary workers, all of whom are eligible to seek adjustment of their status to that of permanent immigrants. If employed immigrants become permanent immigrants, they do not increase the US labor force; only their immigration status changes.
5 In early 2020, the Trump administration seemingly changed its position on work authoriza-tions for H-4 visa holders, arguing against their termination in a lawsuit in federal court. See “Trump Administration Argues in Favor of EAD for H-4 Visa Holders,” News India, May 8, 2020, https://www.newsindiatimes.com/trump-administration-argues-in-favor-of-ead-for-h-4-visa-holders/#:~:text=An%20H-4%20visa%20is,stage%20of%20seeking%20permanent%20residency.

87 PIIE BR 20-2 | SEPTEMBER 2020
Table 5.1 lists the total annual number of green cards given to foreigners from 2007 to 2018 broken down by the entry group, major category of entry class and detailed category of employment-based entry category.6
The United States issues more than 1 million green cards a year, about evenly split between new arrivals and people already living in the United States who adjust their status. About 500,000–550,000 foreigners arrive in the United States each year on newly issued green cards. Nonemployment-related categories of permanent immigration—family-sponsored, immediate relatives, diversity-based, and refugees—account for most new green cards issued annually.
6 All immigration data in the United States collected by the federal government are for the fiscal year (October 1–September 30).
KIRKEGAARD - chapter 5
Table 5.1Persons obtaining legal permanent resident status, by type and class of admission, FY2007–FY2018
Type and class of admission
FY2007 FY2008
TotalAdjustments of status
New arrivals Total
Adjustments of status
New arrivals
Total, all immigrants 1,052,415 621,047 431,368 1,107,126 640,568 466,558
Family-sponsored preferences 194,900 52,059 142,841 227,761 56,899 170,862
Immediate relatives of US citizens 494,920 277,188 217,732 488,483 251,090 237,393
Diversity 42,127 1,360 40,767 41,761 1,440 40,321
Refugees and asylees 136,125 136,125 — 166,392 166,392 —
Other 22,167 21,216 951 16,218 15,205 1,013
Total nonemployment based 890,239 487,948 402,291 940,615 491,026 449,589
Total nonemployment based, percent share of total
85% 79% 93% 85% 77% 96%
Total nonemployment based, breakdown (percent)
55% 45% 52% 48%
Total employment-based preferences 162,176133,09982%
29,07718%
166,511149,54290%
16,96910%
First: Priority workers 26,69723,80289%
2,89511%
36,67835,08296%
1,5964%
Second: Professionals with advanced degrees or aliens of exceptional ability
44,16242,99197%
1,1713%
70,04668,83298%
1,2142%
Third: Skilled workers, professionals, and needed unskilled workers
85,03062,64274%
22,38826%
48,90338,98180%
9,92220%
Fourth: Certain special immigrants 5,4813,34961%
2,13239%
9,5246,31666%
3,20834%
Fifth: Employment creation (investors) 80631539%
49161%
1,36033124%
1,02976%
Table continues

88 PIIE BR 20-2 | SEPTEMBER 2020
The Immigration and Naturalization Act (INA) of 1990 revised the system to favor family-based permanent migration, reserving only 140,000 green cards a year for employment-based immigration.7
Employment-based green cards fall into five categories:
1 priority workers (aliens with extraordinary ability, outstanding professors or researchers, and multinational executives or managers),
2 professionals with advanced degrees or aliens of exceptional ability (professionals holding advanced degrees),
7 If family-based immigration visas are not used up, employment-based immigration can fill the gap. As this is almost always the case, the annual number of employment-based green cards can exceed the 140,000 limit.
KIRKEGAARD - chapter 5
Table 5.1 (continued)Persons obtaining legal permanent resident status, by type and class of admission, FY2007–FY2018
Type and class of admission
FY2009 FY2010
TotalAdjustments of status
New arrivals Total
Adjustments of status
New arrivals
Total, all immigrants 1,130,818 667,776 463,042 1,042,625 566,576 476,049
Family-sponsored preferences 211,859 39,787 172,072 214,589 26,279 188,310
Immediate relatives of US citizens 535,554 309,073 226,481 476,414 252,842 223,572
Diversity 47,879 1,277 46,602 49,763 1,571 48,192
Refugees and asylees 177,368 177,368 — 136,291 136,291 —
Other 14,124 13,136 988 17,225 13,583 3,642
Total nonemployment based 986,784 540,641 446,143 894,282 430,566 463,716
Total nonemployment based, percent share of total
87% 81% 96% 86% 76% 97%
Total nonemployment based, breakdown (percent)
55% 45% 48% 52%
Total employment-based preferences 144,034127,13588%
16,89912%
148,343136,01092%
12,3338%
First: Priority workers 40,92439,42096%
1,5044%
41,05539,07095%
1,9855%
Second: Professionals with advanced degrees or aliens of exceptional ability
45,55244,33697%
1,2163%
53,94652,38897%
1,5583%
Third: Skilled workers, professionals, and needed unskilled workers
40,39833,52583%
6,87317%
39,76234,43387%
5,32913%
Fourth: Certain special immigrants 13,4728,86966%
4,60334%
11,1009,38485%
1,71615%
Fifth: Employment creation (investors) 3,68898527%
2,70373%
2,48073530%
1,74570%
Table continues

89 PIIE BR 20-2 | SEPTEMBER 2020
3 skilled workers, professionals with baccalaureate degrees, and needed unskilled workers,
4 certain special immigrants (broadcast employees; ministers; employees of the US government abroad; foreign medical school graduates who were licensed to practice in the United States January 9, 1978; retired employees of international organizations; juvenile court dependents; retired NATO-6 civilian employees, and religious workers), and
5 employment creators (investors).
The first three categories make up the overwhelming majority of employment-based permanent migration to the United States (table 5.2). Adjustment of status changes accounts for more than 90 percent of new permanent migration. Nearly all permanent employment–based migrants to the United States already reside (and are probably employed) in the United
KIRKEGAARD - chapter 5
Table 5.1 (continued)Persons obtaining legal permanent resident status, by type and class of admission, FY2007–FY2018
Type and class of admission
FY2011 FY2012
TotalAdjustments of status
New arrivals Total
Adjustments of status
New arrivals
Total, all immigrants 1,062,040 580,092 481,948 1,031,631 547,559 484,072
Family-sponsored preferences 234,931 28,346 206,585 202,019 18,560 183,459
Immediate relatives of US citizens 453,158 243,174 209,984 478,780 239,986 238,794
Diversity 50,103 1,617 48,486 40,320 1,356 38,964
Refugees and asylees 168,460 168,460 — 150,614 150,614 —
Other 16,049 14,111 1,938 15,900 11,027 4,873
Total nonemployment based 922,701 455,708 466,993 887,633 421,543 466,090
Total nonemployment based, percent share of total
87% 79% 97% 86% 77% 96%
Total nonemployment based, breakdown (percent)
49% 51% 47% 53%
Total employment-based preferences 139,339124,38489%
14,95511%
143,998126,01688%
17,98212%
First: Priority workers 25,25123,60593%
1,6467%
39,31637,79996%
1,5174%
Second: Professionals with advanced degrees or aliens of exceptional ability
66,83165,14097%
1,6913%
50,95949,41497%
1,5453%
Third: Skilled workers, professionals, and needed unskilled workers
37,21629,75780%
7,45920%
39,22931,20880%
8,02120%
Fourth: Certain special immigrants 6,7015,30679%
1,39521%
7,8666,64484%
1,22216%
Fifth: Employment creation (investors) 3,34057617%
2,76483%
6,62895114%
5,67786%
Table continues

90 PIIE BR 20-2 | SEPTEMBER 2020
States when they receive their green cards. The temporary visa system evidently operates as a conveyor belt toward permanent residence. Fifty-five percent of the visas in these three categories go to spouses and children of workers, effectively becoming family-sponsored migration.
Among green card holders of Indian origin, employment-based preference is the biggest reason for permanent migration in most years (table 5.3), though the level has dropped to below 40 percent. Permanent Indian migrants are thus far more likely to be employed and contribute to the economy than permanent migrants as a whole.
KIRKEGAARD - chapter 5
Table 5.1 (continued)Persons obtaining legal permanent resident status, by type and class of admission, FY2007–FY2018
Type and class of admission
FY2013 FY2014
TotalAdjustments of status
New arrivals Total
Adjustments of status
New arrivals
Total, all immigrants 990,553 530,802 459,751 1,016,518 535,126 481,392
Family-sponsored preferences 210,303 26,415 183,888 229,104 23,202 205,902
Immediate relatives of US citizens 439,460 232,105 207,355 416,456 228,128 188,328
Diversity 45,618 1,505 44,113 53,490 1,331 52,159
Refugees and asylees 119,630 119,630 — 134,242 134,242 —
Other 14,432 11,138 3,294 31,630 18,578 13,052
Total nonemployment based 829,443 390,793 438,650 864,922 405,481 459,441
Total nonemployment based, percent share of total
84% 74% 95% 85% 76% 95%
Total nonemployment based, breakdown (percent)
47% 53% 47% 53%
Total employment-based preferences 161,110140,00987%
21,10113%
151,596129,64586%
21,95114%
First: Priority workers 38,97837,28396%
1,6954%
40,55438,81396%
1,7414%
Second: Professionals with advanced degrees or aliens of exceptional ability
63,02660,95697%
2,0703%
48,80146,87296%
1,9294%
Third: Skilled workers, professionals, and needed unskilled workers
43,63234,93780%
8,69520%
43,15635,58882%
7,56818%
Fourth: Certain special immigrants 6,9315,60281%
1,32919%
8,3626,93383%
1,42917%
Fifth: Employment creation (investors) 8,5431,23114%
7,31286%
10,7231,43913%
9,28487%
Table continues

91 PIIE BR 20-2 | SEPTEMBER 2020
TEMPORARY MIGRATION FROM INDIA: L-1, L-2, H-1B, AND H-4 VISAS
The US nonimmigrant visa system covers many types of temporary exchanges of people between the United States and India. The number of temporary visas issued to Indian nationals rose from about 250,000 in 1997 to nearly 1 million by 2015 (figure 5.1). The change reflected an increase in business and tourist visas and visas for temporary workers and their dependents.
Over the same period, more than 50,000 Indian students and educational exchange visitors a year came to the United States. Temporary worker migration represents a little less than a third of all nonimmigrant people flows from India to the United States.
The two main temporary work visa categories are L-1 and the H-1B. The L-1 visa covers company transferees, including managers or people with specialized
KIRKEGAARD - chapter 5
Table 5.1 (continued)Persons obtaining legal permanent resident status, by type and class of admission, FY2007–FY2018
FY2015 FY2016
Type and class of admission TotalAdjustments of status
New Arrivals Total
Adjustments of status
New arrivals
Total, all immigrants 1,051,031 542,315 508,716 1,183,505 565,427 618,078
Family-sponsored preferences 213,910 16,783 197,127 238,087 15,116 222,971
Immediate relatives of US citizens 465,068 230,194 234,874 566,706 257,302 309,404
Diversity 47,934 1,268 46,666 49,865 1,048 48,817
Refugees and asylees 151,995 151,995 — 157,425 157,425 —
Other 28,077 20,097 7,980 33,529 20,896 12,633
Total nonemployment based 906,984 420,337 486,647 1,045,612 451,787 593,825
Total nonemployment based, percent share of total
86% 78% 96% 88% 80% 96%
Total nonemployment based, breakdown (percent)
46% 54% 43% 57%
Total employment-based preferences 144,047121,97885%
22,06915%
137,893113,64082%
24,25318%
First: Priority workers 41,68839,92496%
1,7644%
42,86240,44594%
2,4176%
Second: Professionals with advanced degrees or aliens of exceptional ability
44,34442,53196%
1,8134%
38,85836,44894%
2,4106%
Third: Skilled workers, professionals, and needed unskilled workers
37,24329,64880%
7,59520%
35,93326,87875%
9,05525%
Fourth: Certain special immigrants 10,5848,89084%
1,69416%
10,3778,47882%
1,89918%
Fifth: Employment creation (investors) 10,18898510%
9,20390%
9,8631,39114%
8,47286%
Table continues

92 PIIE BR 20-2 | SEPTEMBER 2020
knowledge; the L-2 visa covers their dependents.8 The H-1B visa covers specialty high-skilled occupations, including defense and research personnel and fashion
8 The main sources of data on these worker categories are the US State Department and the US Department of Homeland Security. The Department of State’s annual Reports of the Visa Office and the Department of Homeland Security’s annual Yearbook of Immigration Statistics include data on the number of visas issued at US consular offices abroad by the nationality of the recipient. However, as in the case of green cards, looking only at the number of new L-1 and H-1B visas issued by the US State Department is misleading, as it ignores the sizable num-ber of H-1B visas given to foreigners already residing and often working in the United States through changes in visa status. However, as the L-1 visa is given only to intracompany trans-ferees and requires that the recipient has “been working for a qualifying organization abroad for one continuous year within the three years immediately preceding his or her admission to the United States,” this issue generally does not concern this category. The second source of information about temporary workers in the United States is the annual Characteristics of H-1B Specialty Occupation Workers report to the US Congress by the US Citizenship and Immigration Services (USCIS). This report provides a more comprehensive picture of the use of the H-1B program, as it includes data on both recipients entering H-1B visa status coming from abroad and inside the United States as well as the wages and industry/occupational categories of these recipients.
KIRKEGAARD - chapter 5
Table 5.1 (continued)Persons obtaining legal permanent resident status, by type and class of admission, FY2007–FY2018
Type and class of admission
FY2017 FY2018
TotalAdjustments of status
New arrivals Total
Adjustments of status
New arrivals
Total, all immigrants 1,127,167 549,086 578,081 1,096,611 567,884 528,727
Family-sponsored preferences 232,238 13,478 218,760 216,563 12,448 204,114
Immediate relatives of US citizens 516,508 252,231 264,277 478,961 237,321 241,640
Diversity 51,592 918 50,674 45,350 1,117 44,233
Refugees and asylees 146,003 146,003 — 185,909 185,909 —
Other 42,971 23,126 19,845 31,657 20,742 10,916
Total nonemployment based 989,312 435,756 553,556 958,440 457,537 500,903
Total nonemployment based, percent share of total
88% 79% 96% 87% 81% 95%
Total nonemployment based, breakdown (percent)
44% 56% 48% 52%
Total employment-based preferences 137,855113,33082%
24,52518%
138,171110,34780%
27,82420%
First: Priority workers 41,06038,49694%
2,5646%
39,51435,37390%
4,14110%
Second: Professionals with advanced degrees or aliens of exceptional ability
39,33136,21792%
3,1148%
40,09536,82192%
3,2748%
Third: Skilled workers, professionals, and needed unskilled workers
38,08329,37777%
8,70623%
39,22828,56873%
10,66027%
Fourth: Certain special immigrants 9,5047,61080%
1,89420%
9,7117,88681%
1,82519%
Fifth: Employment creation (investors) 9,8771,63017%
8,24783%
9,6231,69918%
7,92482%
Source: Department of Homeland Security, Yearbook of Immigration Statistics 2007–2018.

93 PIIE BR 20-2 | SEPTEMBER 2020
KIRKEGAARD - chapter 5
Table 5.2 Persons obtaining legal permanent resident status in first, second and third employment-based preferences, by entry group and detailed category, FY2007–FY2018
FY2007 FY2008
Type and class of admission TotalAdjustments of status
New arrivals Total
Adjustments of status
New arrivals
First, second, and third employment-based preferences
155,889 129,435 26,454 155,627 142,895 12,732
Total priority workers 69,809 63,012 6,797 70,315 67,675 2,640
Total dependents (spouses and children) 85,864 66,207 19,657 85,308 75,216 10,092
Total priority workers, share of total 45% 49% 26% 45% 47% 21%
Total dependents (spouses and children), share of total
55% 51% 74% 55% 53% 79%
First preference: Priority workers 26,697 23,802 2,895 36,678 35,082 1,596
First preference workers 10,967 9,958 1,009 15,184 14,638 546
Total dependents (spouses and children) 15,730 13,844 1,886 21,494 20,444 1,050
First preference workers, share of total 41% 42% 35% 41% 42% 34%
Total dependents (spouses and children), share of total
59% 58% 65% 59% 58% 66%
Second preference: Professionals with advanced degrees or aliens of exceptional ability
44,162 42,991 1,171 70,046 68,832 1,214
Second preference workers 22,303 21,843 460 34,535 34,054 481
Total dependents (spouses and children) 21,859 21,148 711 35,511 34,778 733
Second preference workers, share of total 51% 51% 39% 49% 49% 40%
Total dependents (spouses and children), share of total
49% 49% 61% 51% 51% 60%
Third preference: Skilled workers, professionals, and needed unskilled workers
85,030 62,642 22,388 48,903 38,981 9,922
Third prefence workers 36,539 31,211 5,328 20,596 18,983 1,613
Total dependents (spouses and children) 48,275 31,215 17,060 28,303 19,994 8,309
Third preference workers, share of total 43% 50% 24% 42% 49% 16%
Total dependents (spouses and children), share of total
57% 50% 76% 58% 51% 84%
Table continues
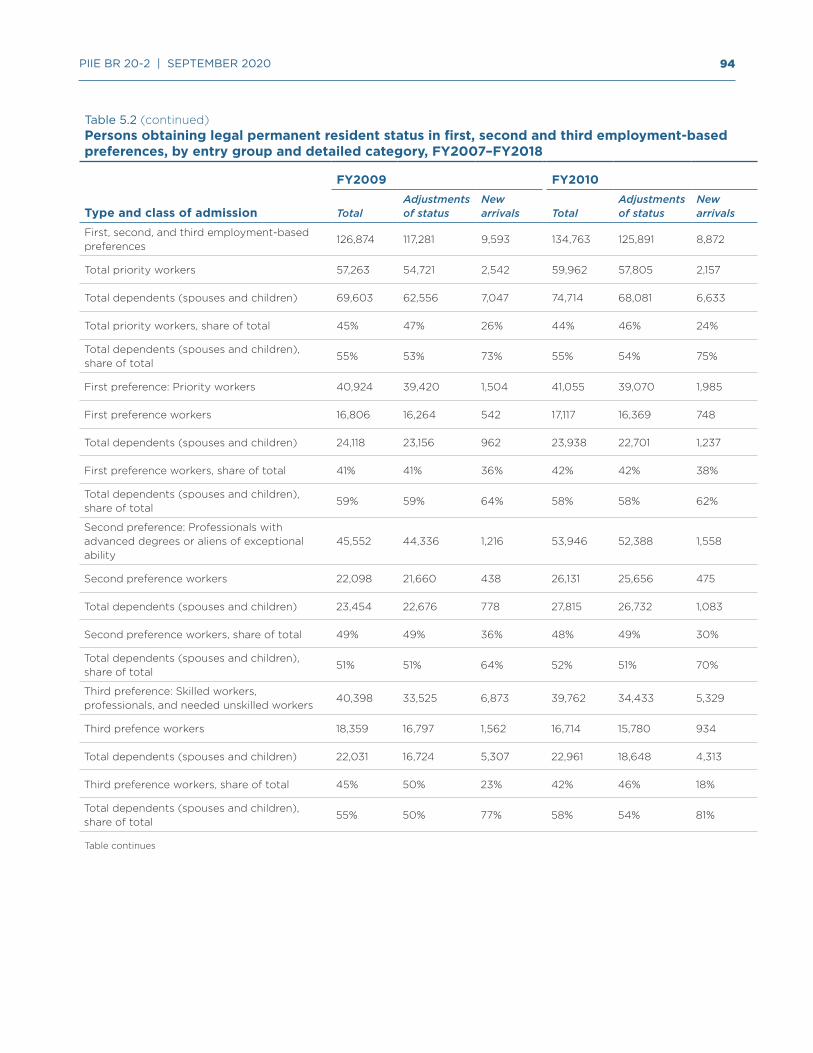
94 PIIE BR 20-2 | SEPTEMBER 2020
KIRKEGAARD - chapter 5
Table 5.2 (continued)Persons obtaining legal permanent resident status in first, second and third employment-based preferences, by entry group and detailed category, FY2007–FY2018
Type and class of admission
FY2009 FY2010
TotalAdjustments of status
New arrivals Total
Adjustments of status
New arrivals
First, second, and third employment-based preferences
126,874 117,281 9,593 134,763 125,891 8,872
Total priority workers 57,263 54,721 2,542 59,962 57,805 2,157
Total dependents (spouses and children) 69,603 62,556 7,047 74,714 68,081 6,633
Total priority workers, share of total 45% 47% 26% 44% 46% 24%
Total dependents (spouses and children), share of total
55% 53% 73% 55% 54% 75%
First preference: Priority workers 40,924 39,420 1,504 41,055 39,070 1,985
First preference workers 16,806 16,264 542 17,117 16,369 748
Total dependents (spouses and children) 24,118 23,156 962 23,938 22,701 1,237
First preference workers, share of total 41% 41% 36% 42% 42% 38%
Total dependents (spouses and children), share of total
59% 59% 64% 58% 58% 62%
Second preference: Professionals with advanced degrees or aliens of exceptional ability
45,552 44,336 1,216 53,946 52,388 1,558
Second preference workers 22,098 21,660 438 26,131 25,656 475
Total dependents (spouses and children) 23,454 22,676 778 27,815 26,732 1,083
Second preference workers, share of total 49% 49% 36% 48% 49% 30%
Total dependents (spouses and children), share of total
51% 51% 64% 52% 51% 70%
Third preference: Skilled workers, professionals, and needed unskilled workers
40,398 33,525 6,873 39,762 34,433 5,329
Third prefence workers 18,359 16,797 1,562 16,714 15,780 934
Total dependents (spouses and children) 22,031 16,724 5,307 22,961 18,648 4,313
Third preference workers, share of total 45% 50% 23% 42% 46% 18%
Total dependents (spouses and children), share of total
55% 50% 77% 58% 54% 81%
Table continues

95 PIIE BR 20-2 | SEPTEMBER 2020
KIRKEGAARD - chapter 5
Table 5.2 (continued)Persons obtaining legal permanent resident status in first, second and third employment-based preferences, by entry group and detailed category, FY2007–FY2018
Type and class of admission
FY2011 FY2012
TotalAdjustments of status
New arrivals Total
Adjustments of status
New arrivals
First, second, and third employment-based preferences
129,298 118,502 10,796 129,504 118,421 11,083
Total priority workers 59,808 56,903 2,905 58,694 55,328 3,366
Total dependents (spouses and children) 69,087 61,200 7,887 70,802 63,088 7,714
Total priority workers, share of total 46% 48% 27% 45% 47% 30%
Total dependents (spouses and children), share of total
53% 52% 73% 55% 53% 70%
First preference: Priority workers 25,251 23,605 1,646 39,316 37,799 1,517
First preference workers 10,665 10,097 568 16,286 15,770 516
Total dependents (spouses and children) 14,586 13,508 1,078 23,030 22,029 1,001
First preference workers, share of total 42% 43% 35% 41% 42% 34%
Total dependents (spouses and children), share of total
58% 57% 65% 59% 58% 66%
Second preference: Professionals with advanced degrees or aliens of exceptional ability
66,831 65,140 1,691 50,959 49,414 1,545
Second preference workers 33,577 33,055 522 24,719 24,261 458
Total dependents (spouses and children) 33,254 32,085 1,169 26,240 25,153 1,087
Second preference workers, share of total 50% 51% 31% 49% 49% 30%
Total dependents (spouses and children), share of total
50% 49% 69% 51% 51% 70%
Third preference: Skilled workers, professionals, and needed unskilled workers
37,216 29,757 7,459 39,229 31,208 8,021
Third prefence workers 15,566 13,751 1,815 17,689 15,297 2,392
Total dependents (spouses and children) 21,247 15,607 5,640 21,532 15,906 5,626
Third preference workers, share of total 42% 46% 24% 45% 49% 30%
Total dependents (spouses and children), share of total
57% 52% 76% 55% 51% 70%
Table continues

96 PIIE BR 20-2 | SEPTEMBER 2020
KIRKEGAARD - chapter 5
Table 5.2 (continued)Persons obtaining legal permanent resident status in first, second and third employment-based preferences, by entry group and detailed category, FY2007–FY2018
Type and class of admission
FY2013 FY2014
TotalAdjustments of status
New arrivals Total
Adjustments of status
New arrivals
First, second, and third employment-based preferences
145,636 133,176 12,460 132,511 121,273 11,238
Total priority workers 67,389 63,418 3,971 61,353 57,608 3,745
Total dependents (spouses and children) 77,580 69,542 8,038 71,158 63,665 7,493
Total priority workers, share of total 46% 48% 32% 46% 48% 33%
Total dependents (spouses and children), share of total
53% 52% 65% 54% 52% 67%
First preference: Priority workers 38,978 37,283 1,695 40,554 38,813 1,741
First preference workers 16,225 15,616 609 16,913 16,274 639
Total dependents (spouses and children) 22,753 21,667 1,086 23,641 22,539 1,102
First preference workers, share of total 42% 42% 36% 42% 42% 37%
Total dependents (spouses and children), share of total
58% 58% 64% 58% 58% 63%
Second preference: Professionals with advanced degrees or aliens of exceptional ability
63,026 60,956 2,070 48,801 46,872 1,929
Second preference workers 31,130 30,484 646 23,694 23,076 618
Total dependents (spouses and children) 31,896 30,472 1,424 25,107 23,796 1,311
Second preference workers, share of total 49% 50% 31% 49% 49% 32%
Total dependents (spouses and children), share of total
51% 50% 69% 51% 51% 68%
Third preference: Skilled workers, professionals, and needed unskilled workers
43,632 34,937 8,695 43,156 35,588 7,568
Third prefence workers 20,034 17,318 2,716 20,746 18,258 2,488
Total dependents (spouses and children) 22,931 17,403 5,528 22,410 17,330 5,080
Third preference workers, share of total 46% 50% 31% 48% 51% 33%
Total dependents (spouses and children), share of total
53% 50% 64% 52% 49% 67%
Table continues
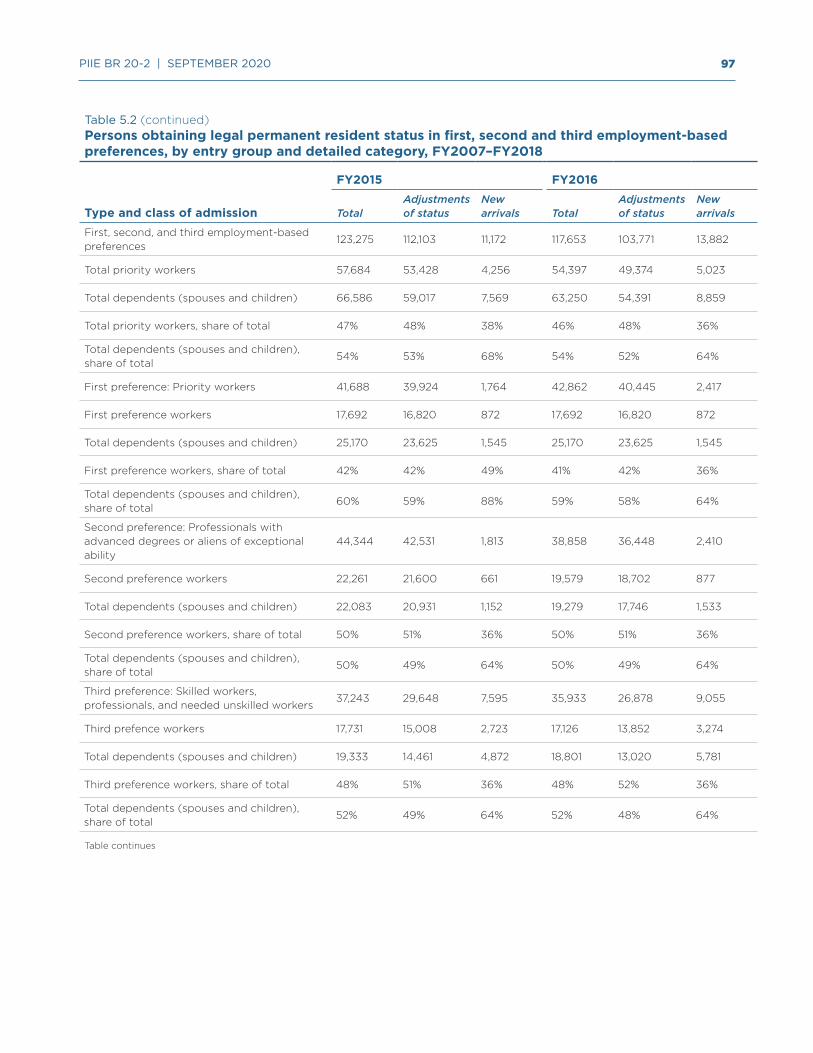
97 PIIE BR 20-2 | SEPTEMBER 2020
KIRKEGAARD - chapter 5
Table 5.2 (continued)Persons obtaining legal permanent resident status in first, second and third employment-based preferences, by entry group and detailed category, FY2007–FY2018
Type and class of admission
FY2015 FY2016
TotalAdjustments of status
New arrivals Total
Adjustments of status
New arrivals
First, second, and third employment-based preferences
123,275 112,103 11,172 117,653 103,771 13,882
Total priority workers 57,684 53,428 4,256 54,397 49,374 5,023
Total dependents (spouses and children) 66,586 59,017 7,569 63,250 54,391 8,859
Total priority workers, share of total 47% 48% 38% 46% 48% 36%
Total dependents (spouses and children), share of total
54% 53% 68% 54% 52% 64%
First preference: Priority workers 41,688 39,924 1,764 42,862 40,445 2,417
First preference workers 17,692 16,820 872 17,692 16,820 872
Total dependents (spouses and children) 25,170 23,625 1,545 25,170 23,625 1,545
First preference workers, share of total 42% 42% 49% 41% 42% 36%
Total dependents (spouses and children), share of total
60% 59% 88% 59% 58% 64%
Second preference: Professionals with advanced degrees or aliens of exceptional ability
44,344 42,531 1,813 38,858 36,448 2,410
Second preference workers 22,261 21,600 661 19,579 18,702 877
Total dependents (spouses and children) 22,083 20,931 1,152 19,279 17,746 1,533
Second preference workers, share of total 50% 51% 36% 50% 51% 36%
Total dependents (spouses and children), share of total
50% 49% 64% 50% 49% 64%
Third preference: Skilled workers, professionals, and needed unskilled workers
37,243 29,648 7,595 35,933 26,878 9,055
Third prefence workers 17,731 15,008 2,723 17,126 13,852 3,274
Total dependents (spouses and children) 19,333 14,461 4,872 18,801 13,020 5,781
Third preference workers, share of total 48% 51% 36% 48% 52% 36%
Total dependents (spouses and children), share of total
52% 49% 64% 52% 48% 64%
Table continues

98 PIIE BR 20-2 | SEPTEMBER 2020
KIRKEGAARD - chapter 5
Table 5.2 (continued)Persons obtaining legal permanent resident status in first, second and third employment-based preferences, by entry group and detailed category, FY2007–FY2018
Type and class of admission
FY2017 FY2018
TotalAdjustments of status
New arrivals Total
Adjustments of status
New arrivals
First, second, and third employment-based preferences
118,474 104,090 14,384 118,837 100,762 18,075
Total priority workers 54,490 49,316 5,174 55,030 48,029 7,001
Total dependents (spouses and children) 63,981 54,771 9,210 63,807 52,733 11,074
Total priority workers, share of total 46% 47% 36% 46% 48% 39%
Total dependents (spouses and children), share of total
54% 53% 64% 54% 52% 61%
First preference: Priority workers 41,060 38,496 2,564 39,514 35,373 4,141
First preference workers 16,943 15,966 977 15,932 14,434 1,498
Total dependents (spouses and children) 24,117 22,530 1,587 23,582 20,939 2,643
First preference workers, share of total 41% 41% 38% 40% 41% 36%
Total dependents (spouses and children), share of total
59% 59% 62% 60% 59% 64%
Second preference: Professionals with advanced degrees or aliens of exceptional ability
39,331 36,217 3,114 40,095 36,821 3,274
Second preference workers 19,432 18,339 1,093 20,011 18,802 1,209
Total dependents (spouses and children) 19,899 17,878 2,021 20,084 18,019 2,065
Second preference workers, share of total 49% 51% 35% 50% 51% 37%
Total dependents (spouses and children), share of total
51% 49% 65% 50% 49% 63%
Third preference: Skilled workers, professionals, and needed unskilled workers
38,083 29,377 8,706 39,228 28,568 10,660
Third prefence workers 18,115 15,011 3,104 19,087 14,793 4,294
Total dependents (spouses and children) 19,965 14,363 5,602 20,141 13,775 6,366
Third preference workers, share of total 48% 51% 36% 49% 52% 40%
Total dependents (spouses and children), share of total
52% 49% 64% 51% 48% 60%
Note: In some instances, the detailed subcategory value of particular immigration categories are suppressed by the Department of Homeland Security for confidentiality reasons. This may cause some of the summary numbers and shares in this table to not to add up.
Source: Department of Homeland Security, Yearbook of Immigration Statistics 2007–2018.
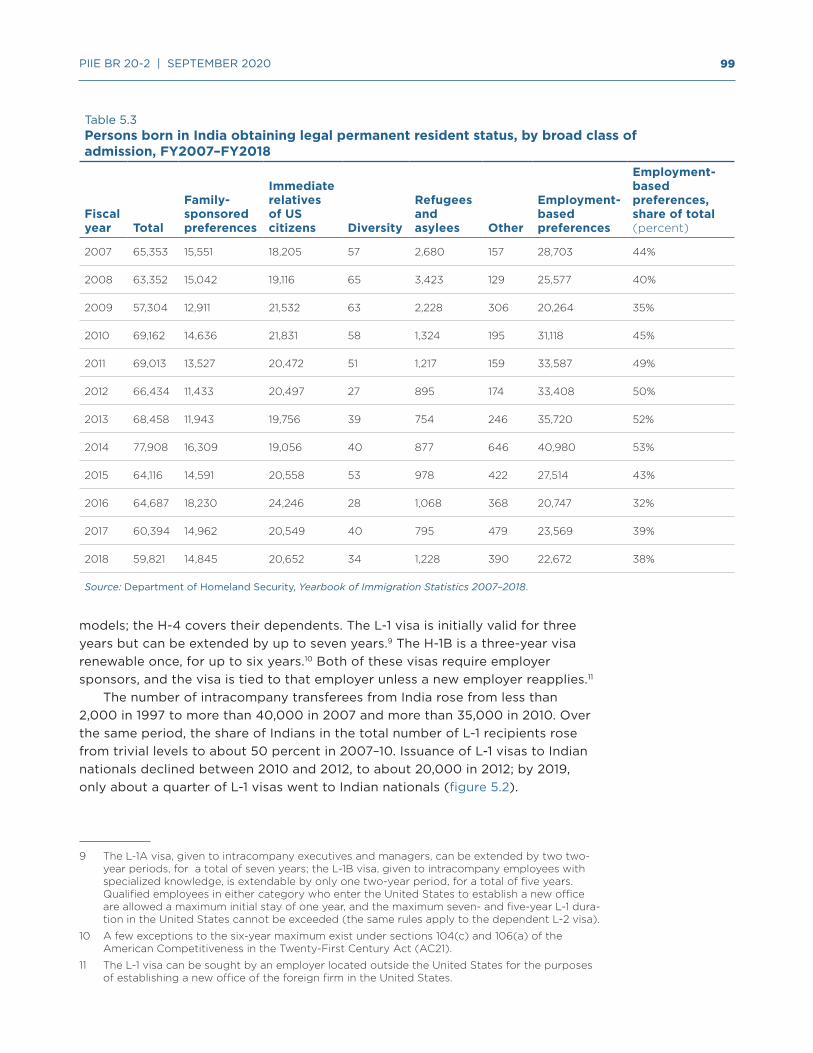
99 PIIE BR 20-2 | SEPTEMBER 2020
models; the H-4 covers their dependents. The L-1 visa is initially valid for three years but can be extended by up to seven years.9 The H-1B is a three-year visa renewable once, for up to six years.10 Both of these visas require employer sponsors, and the visa is tied to that employer unless a new employer reapplies.11
The number of intracompany transferees from India rose from less than 2,000 in 1997 to more than 40,000 in 2007 and more than 35,000 in 2010. Over the same period, the share of Indians in the total number of L-1 recipients rose from trivial levels to about 50 percent in 2007–10. Issuance of L-1 visas to Indian nationals declined between 2010 and 2012, to about 20,000 in 2012; by 2019, only about a quarter of L-1 visas went to Indian nationals (figure 5.2).
9 The L-1A visa, given to intracompany executives and managers, can be extended by two two-year periods, for a total of seven years; the L-1B visa, given to intracompany employees with specialized knowledge, is extendable by only one two-year period, for a total of five years. Qualified employees in either category who enter the United States to establish a new office are allowed a maximum initial stay of one year, and the maximum seven- and five-year L-1 dura-tion in the United States cannot be exceeded (the same rules apply to the dependent L-2 visa).
10 A few exceptions to the six-year maximum exist under sections 104(c) and 106(a) of the American Competitiveness in the Twenty-First Century Act (AC21).
11 The L-1 visa can be sought by an employer located outside the United States for the purposes of establishing a new office of the foreign firm in the United States.
KIRKEGAARD - chapter 5
Table 5.3Persons born in India obtaining legal permanent resident status, by broad class of admission, FY2007–FY2018
Fiscal year Total
Family-sponsored preferences
Immediate relatives of US citizens Diversity
Refugees and asylees Other
Employment-based preferences
Employment-based preferences, share of total (percent)
2007 65,353 15,551 18,205 57 2,680 157 28,703 44%
2008 63,352 15,042 19,116 65 3,423 129 25,577 40%
2009 57,304 12,911 21,532 63 2,228 306 20,264 35%
2010 69,162 14,636 21,831 58 1,324 195 31,118 45%
2011 69,013 13,527 20,472 51 1,217 159 33,587 49%
2012 66,434 11,433 20,497 27 895 174 33,408 50%
2013 68,458 11,943 19,756 39 754 246 35,720 52%
2014 77,908 16,309 19,056 40 877 646 40,980 53%
2015 64,116 14,591 20,558 53 978 422 27,514 43%
2016 64,687 18,230 24,246 28 1,068 368 20,747 32%
2017 60,394 14,962 20,549 40 795 479 23,569 39%
2018 59,821 14,845 20,652 34 1,228 390 22,672 38%
Source: Department of Homeland Security, Yearbook of Immigration Statistics 2007–2018.
KIRKEGAARD - chapter 5

100 PIIE BR 20-2 | SEPTEMBER 2020
L-2 visas reflect the same trends. These figures matter for employment, because spouses of L-1 recipients on L-2 visas are eligible to apply for employment authorization. Because many spouses who enter the US labor force on L-2 visa are not subject to employment restrictions, they effectively have a better labor force status than their spouses. As they can change their status in the United States, the statistics in figure 5.2 may underrepresent their true numbers.12
12 As most L-2 recipients who are already working probably work in the United States, this route will likely bring only a very limited number of additions to the US labor force. For purposes of analyzing the temporary worker flows between the United States and India, it is of trivial importance and will henceforth be ignored here.
Figure 5.1Nonimmigrant visas issued by the United States to Indian nationals, 1997–2019
Source: US Department of State, Reports of the Visa O ce.
thousands of visas
1,000
800
600
400
200
01997 2001 2007 2013 2019
OtherTemporary workers and their dependents (H, L)Student and exchange visas (F, J)Business and tourist visas (B1, B2)
a. Number of visas, by type
0
10
20
30
40
50
60
70
80
90
100
percentb. Percent share of visas, by type
1997 2001 2007 2013 2019
1999 2003 2005 2009 2011 2015 2017
1999 2003 2005 2009 2011 2015 2017
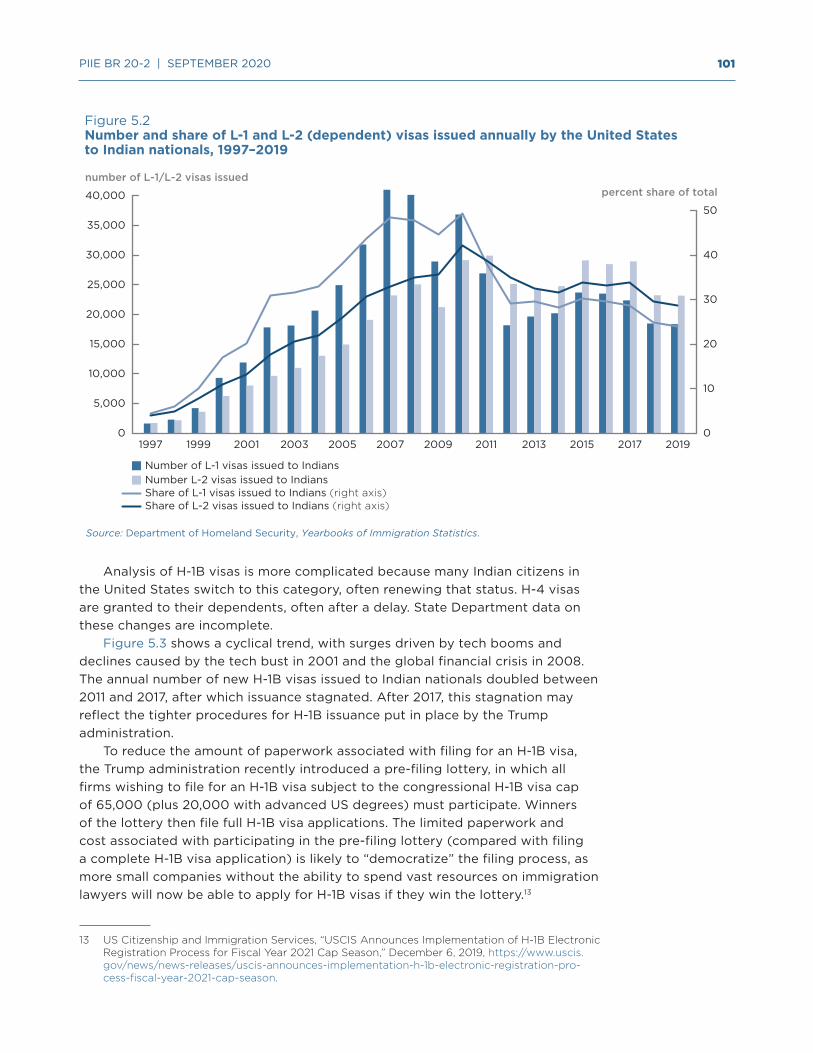
101 PIIE BR 20-2 | SEPTEMBER 2020
Analysis of H-1B visas is more complicated because many Indian citizens in the United States switch to this category, often renewing that status. H-4 visas are granted to their dependents, often after a delay. State Department data on these changes are incomplete.
Figure 5.3 shows a cyclical trend, with surges driven by tech booms and declines caused by the tech bust in 2001 and the global financial crisis in 2008. The annual number of new H-1B visas issued to Indian nationals doubled between 2011 and 2017, after which issuance stagnated. After 2017, this stagnation may reflect the tighter procedures for H-1B issuance put in place by the Trump administration.
To reduce the amount of paperwork associated with filing for an H-1B visa, the Trump administration recently introduced a pre-filing lottery, in which all firms wishing to file for an H-1B visa subject to the congressional H-1B visa cap of 65,000 (plus 20,000 with advanced US degrees) must participate. Winners of the lottery then file full H-1B visa applications. The limited paperwork and cost associated with participating in the pre-filing lottery (compared with filing a complete H-1B visa application) is likely to “democratize” the filing process, as more small companies without the ability to spend vast resources on immigration lawyers will now be able to apply for H-1B visas if they win the lottery.13
13 US Citizenship and Immigration Services, “USCIS Announces Implementation of H-1B Electronic Registration Process for Fiscal Year 2021 Cap Season,” December 6, 2019, https://www.uscis.gov/news/news-releases/uscis-announces-implementation-h-1b-electronic-registration-pro-cess-fiscal-year-2021-cap-season.
Figure 5.2Number and share of L-1 and L-2 (dependent) visas issued annually by the United States to Indian nationals, 1997–2019
0
10
20
30
40
50
0
5,000
10,000
15,000
20,000
25,000
30,000
35,000
40,000 percent share of totalnumber of L-1/L-2 visas issued
Source: Department of Homeland Security, Yearbooks of Immigration Statistics.
1997 2001 2003 2005 2007 2009 20111999 2013 2015 2017 2019
Number of L-1 visas issued to IndiansNumber L-2 visas issued to IndiansShare of L-1 visas issued to Indians (right axis)Share of L-2 visas issued to Indians (right axis)
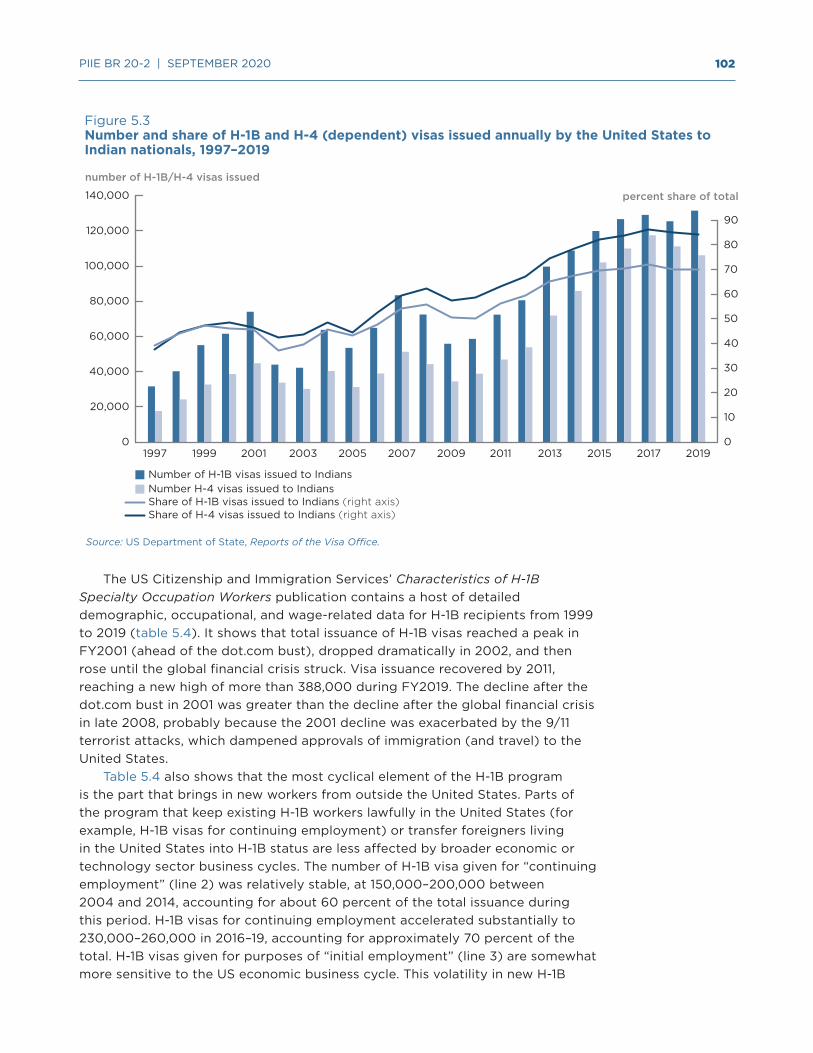
102 PIIE BR 20-2 | SEPTEMBER 2020
The US Citizenship and Immigration Services’ Characteristics of H-1B Specialty Occupation Workers publication contains a host of detailed demographic, occupational, and wage-related data for H-1B recipients from 1999 to 2019 (table 5.4). It shows that total issuance of H-1B visas reached a peak in FY2001 (ahead of the dot.com bust), dropped dramatically in 2002, and then rose until the global financial crisis struck. Visa issuance recovered by 2011, reaching a new high of more than 388,000 during FY2019. The decline after the dot.com bust in 2001 was greater than the decline after the global financial crisis in late 2008, probably because the 2001 decline was exacerbated by the 9/11 terrorist attacks, which dampened approvals of immigration (and travel) to the United States.
Table 5.4 also shows that the most cyclical element of the H-1B program is the part that brings in new workers from outside the United States. Parts of the program that keep existing H-1B workers lawfully in the United States (for example, H-1B visas for continuing employment) or transfer foreigners living in the United States into H-1B status are less affected by broader economic or technology sector business cycles. The number of H-1B visa given for “continuing employment” (line 2) was relatively stable, at 150,000–200,000 between 2004 and 2014, accounting for about 60 percent of the total issuance during this period. H-1B visas for continuing employment accelerated substantially to 230,000–260,000 in 2016–19, accounting for approximately 70 percent of the total. H-1B visas given for purposes of “initial employment” (line 3) are somewhat more sensitive to the US economic business cycle. This volatility in new H-1B
0
10
20
30
40
50
60
70
80
90
0
20,000
40,000
60,000
80,000
100,000
120,000
140,000
Number of H-1B visas issued to IndiansNumber H-4 visas issued to IndiansShare of H-1B visas issued to Indians (right axis)Share of H-4 visas issued to Indians (right axis)
Figure 5.3Number and share of H-1B and H-4 (dependent) visas issued annually by the United States to Indian nationals, 1997–2019
number of H-1B/H-4 visas issued
percent share of total
1997 2001 2003 2005 2007 2009 20111999 2013 2015 2017 2019
Source: US Department of State, Reports of the Visa O ce.
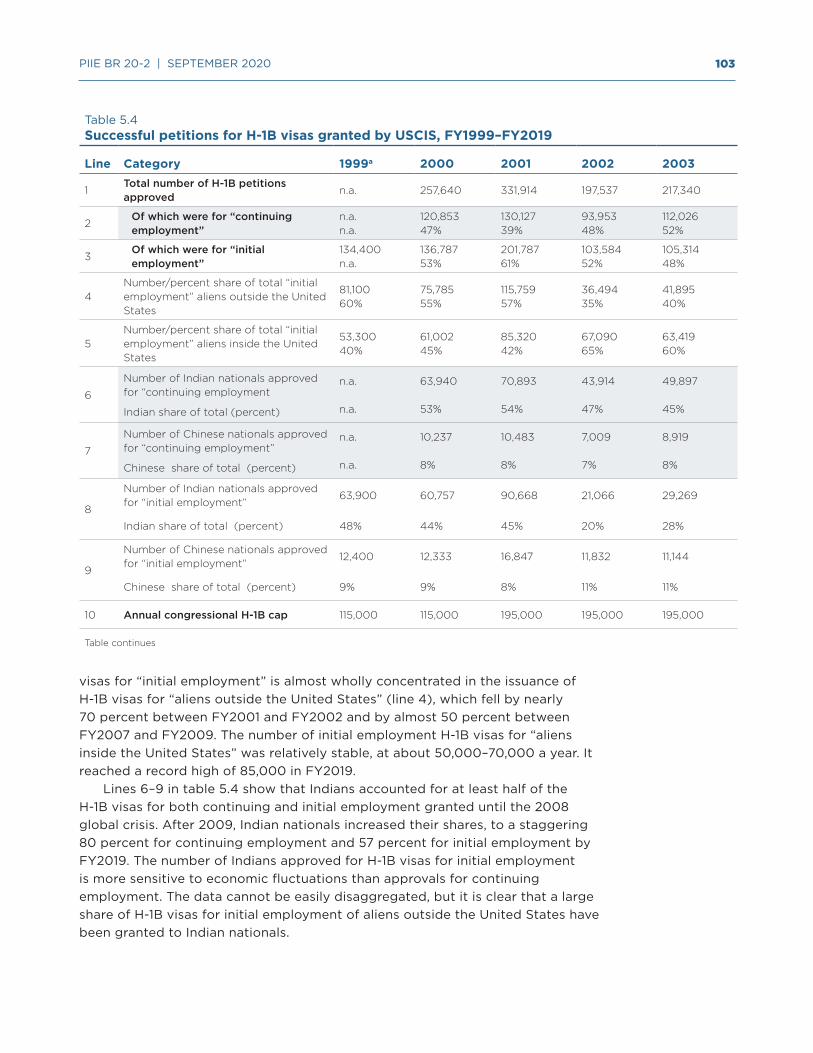
103 PIIE BR 20-2 | SEPTEMBER 2020
visas for “initial employment” is almost wholly concentrated in the issuance of H-1B visas for “aliens outside the United States” (line 4), which fell by nearly 70 percent between FY2001 and FY2002 and by almost 50 percent between FY2007 and FY2009. The number of initial employment H-1B visas for “aliens inside the United States” was relatively stable, at about 50,000–70,000 a year. It reached a record high of 85,000 in FY2019.
Lines 6–9 in table 5.4 show that Indians accounted for at least half of the H-1B visas for both continuing and initial employment granted until the 2008 global crisis. After 2009, Indian nationals increased their shares, to a staggering 80 percent for continuing employment and 57 percent for initial employment by FY2019. The number of Indians approved for H-1B visas for initial employment is more sensitive to economic fluctuations than approvals for continuing employment. The data cannot be easily disaggregated, but it is clear that a large share of H-1B visas for initial employment of aliens outside the United States have been granted to Indian nationals.
Table 5.4Successful petitions for H-1B visas granted by USCIS, FY1999–FY2019
Line Category 1999a 2000 2001 2002 2003
1Total number of H-1B petitions approved
n.a. 257,640 331,914 197,537 217,340
2Of which were for “continuing employment”
n.a.n.a.
120,85347%
130,12739%
93,95348%
112,02652%
3Of which were for “initial employment”
134,400n.a.
136,78753%
201,78761%
103,58452%
105,31448%
4Number/percent share of total “initial employment” aliens outside the United States
81,10060%
75,78555%
115,75957%
36,49435%
41,89540%
5Number/percent share of total “initial employment” aliens inside the United States
53,30040%
61,00245%
85,32042%
67,09065%
63,41960%
6
Number of Indian nationals approved for “continuing employment
Indian share of total (percent)
n.a. 63,940 70,893 43,914 49,897
n.a. 53% 54% 47% 45%
7
Number of Chinese nationals approved for “continuing employment”
Chinese share of total (percent)
n.a. 10,237 10,483 7,009 8,919
n.a. 8% 8% 7% 8%
8
Number of Indian nationals approved for “initial employment”
63,900 60,757 90,668 21,066 29,269
Indian share of total (percent) 48% 44% 45% 20% 28%
9
Number of Chinese nationals approved for “initial employment”
12,400 12,333 16,847 11,832 11,144
Chinese share of total (percent) 9% 9% 8% 11% 11%
10 Annual congressional H-1B cap 115,000 115,000 195,000 195,000 195,000
Table continues
KIRKEGAARD - chapter 5
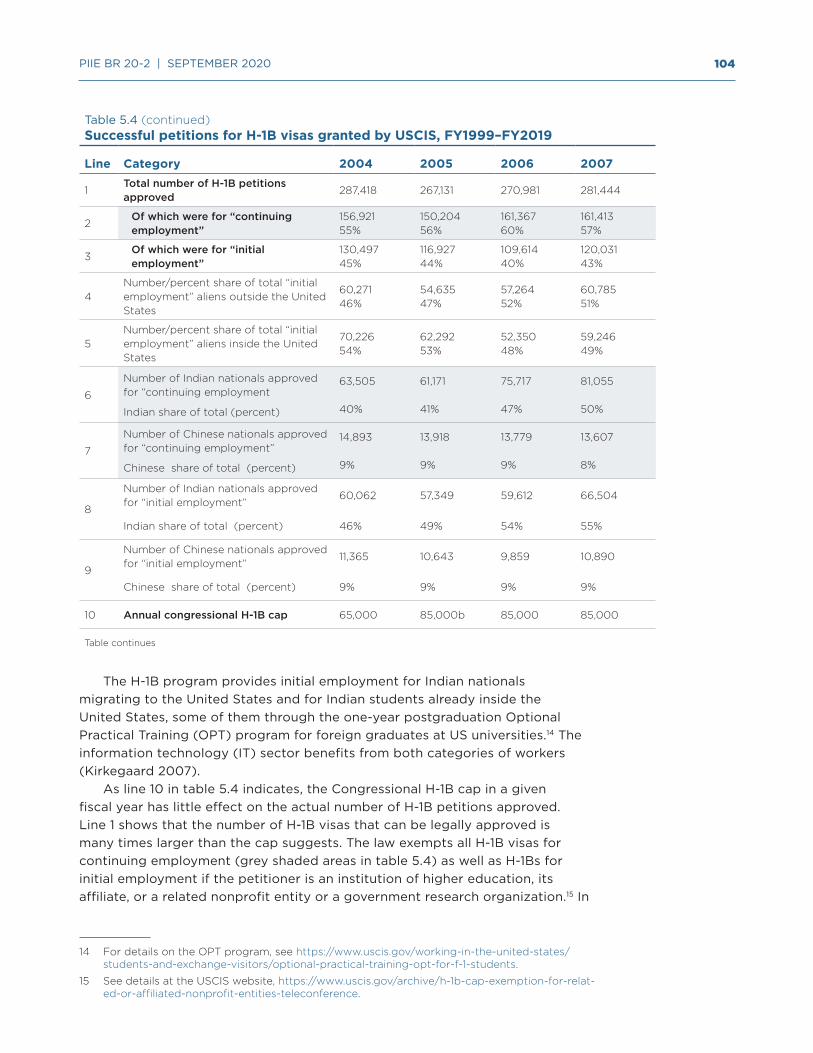
104 PIIE BR 20-2 | SEPTEMBER 2020
The H-1B program provides initial employment for Indian nationals migrating to the United States and for Indian students already inside the United States, some of them through the one-year postgraduation Optional Practical Training (OPT) program for foreign graduates at US universities.14 The information technology (IT) sector benefits from both categories of workers (Kirkegaard 2007).
As line 10 in table 5.4 indicates, the Congressional H-1B cap in a given fiscal year has little effect on the actual number of H-1B petitions approved. Line 1 shows that the number of H-1B visas that can be legally approved is many times larger than the cap suggests. The law exempts all H-1B visas for continuing employment (grey shaded areas in table 5.4) as well as H-1Bs for initial employment if the petitioner is an institution of higher education, its affiliate, or a related nonprofit entity or a government research organization.15 In
14 For details on the OPT program, see https://www.uscis.gov/working-in-the-united-states/students-and-exchange-visitors/optional-practical-training-opt-for-f-1-students.
15 See details at the USCIS website, https://www.uscis.gov/archive/h-1b-cap-exemption-for-relat-ed-or-affiliated-nonprofit-entities-teleconference.
Table 5.4 (continued)Successful petitions for H-1B visas granted by USCIS, FY1999–FY2019
Line Category 2004 2005 2006 2007
1Total number of H-1B petitions approved
287,418 267,131 270,981 281,444
2Of which were for “continuing employment”
156,92155%
150,20456%
161,36760%
161,41357%
3Of which were for “initial employment”
130,49745%
116,92744%
109,61440%
120,03143%
4Number/percent share of total “initial employment” aliens outside the United States
60,27146%
54,63547%
57,26452%
60,78551%
5Number/percent share of total “initial employment” aliens inside the United States
70,22654%
62,29253%
52,35048%
59,24649%
6
Number of Indian nationals approved for “continuing employment
Indian share of total (percent)
63,505 61,171 75,717 81,055
40% 41% 47% 50%
7
Number of Chinese nationals approved for “continuing employment”
Chinese share of total (percent)
14,893 13,918 13,779 13,607
9% 9% 9% 8%
8
Number of Indian nationals approved for “initial employment”
60,062 57,349 59,612 66,504
Indian share of total (percent) 46% 49% 54% 55%
9
Number of Chinese nationals approved for “initial employment”
11,365 10,643 9,859 10,890
Chinese share of total (percent) 9% 9% 9% 9%
10 Annual congressional H-1B cap 65,000 85,000b 85,000 85,000
Table continues
KIRKEGAARD - chapter 5

105 PIIE BR 20-2 | SEPTEMBER 2020
effect, the H-1B cap affects private businesses hiring new foreign employees on H-1B visas. Even the annual number of H-1B visas granted for initial employment can exceed the Congressional cap. These factors highlight the importance of the H-1B program to nonprofit, research, and higher education organizations in the United States.
US LABOR MIGRATION TO INDIA
Very limited data are available from the Indian government on the scope of inward labor migration. The government’s statistical agency publishes data on Indian visa issuance by visa category and consular office.16 Assuming that the
16 See data at https://data.gov.in/catalog/issuance-visa-various-foreign-nationals-against-various-categories-visas?filters%5Bfield_catalog_reference%5D=88718&format=json&offset=0&limit=6&sort%5Bcreated%5D=desc.
Table 5.4 (continued)Successful petitions for H-1B visas granted by USCIS, FY1999–FY2019
Line Category 2008 2009 2010 2011
1Total number of H-1B petitions approved
276,252 214,271 192,990 269,653
2Of which were for “continuing employment”
166,91760%
127,97160%
116,36360%
163,20861%
3Of which were for “initial employment”
109,33540%
86,30040%
76,62740%
106,44539%
4Number/percent share of total “initial employment” aliens outside the United States
55,33551%
33,28339%
34,84845%
48,66546%
5Number/percent share of total “initial employment” aliens inside the United States
53,44249%
53,01761%
41,77955%
57,78054%
6
Number of Indian nationals approved for “continuing employment
Indian share of total (percent)
87,890 69,098 68,294 100,345
53% 54% 59% 61%
7
Number of Chinese nationals approved for “continuing employment”
Chinese share of total (percent)
15,017 11,866 9,621 13,622
9% 9% 8% 8%
8
Number of Indian nationals approved for “initial employment”
61,739 33,961 34,617 55,972
Indian share of total (percent) 56% 39% 45% 53%
9
Number of Chinese nationals approved for “initial employment”
9,157 8,989 7,480 10,165
Chinese share of total (percent) 8% 10% 10% 10%
10 Annual congressional H-1B cap 85,000 85,000 85,000 85,000
Table continues
KIRKEGAARD - chapter 5

106 PIIE BR 20-2 | SEPTEMBER 2020
vast majority of visas issued at Indian consulates in the United States go to US citizens, these data provide some insights into Americans’ temporary labor migration to India.
An Indian employment visa is granted to a foreigner who is a highly skilled and/or qualified professional.17 Employment visas are not granted for jobs for which qualified Indians are available; for routine, ordinary, or secretarial/clerical jobs; or to Pakistani nationals.18 An Indian employment visa requires a salary above about $23,000 a year and is valid for up to five years.
As a populous country in which hundreds of millions of people live in poverty, India is not a major destination for foreign migrants: In 2011, it had just 5.5 million migrant workers (about 0.5 percent of the population). The Indian government data indicate that 78,000 employment visas were issued between 2010 and 2014,
17 India also issues “project visas” for foreign nationals working on approved projects in the power and steel industry.
18 For details, see https://mha.gov.in/PDF_Other/AnnexIII_01022018.pdf.
Table 5.4 (continued)Successful petitions for H-1B visas granted by USCIS, FY1999–FY2019
Line Category 2012 2013 2014 2015
1Total number of H-1B petitions approved
262,569 286,773 315,857 275,317
2Of which were for “continuing employment”
125,67948%
158,48255%
191,531 61%
161,714 59%
3Of which were for “initial employment”
136,89052%
12829145%
124,32639%
113,60341%
4Number/percent share of total “initial employment” aliens outside the United States
74,99755%
68,78554%
68,39055%
62,65655%
5Number/percent share of total “initial employment” aliens inside the United States
61,89345%
59,50646%
55,93645%
50,94745%
6
Number of Indian nationals approved for “continuing employment
Indian share of total (percent)
81,890 105,278 138,023 123,984
65% 66% 72% 77%
7
Number of Chinese nationals approved for “continuing employment”
Chinese share of total (percent)
8,441 10,778 12,685 11,231
7% 7% 7% 7%
8
Number of Indian nationals approved for “initial employment”
86,477 81,992 82,263 71,263
Indian share of total (percent) 63% 64% 66% 63%
9
Number of Chinese nationals approved for “initial employment”
11,409 12,651 13,708 15438
Chinese share of total (percent) 8% 10% 11% 14%
10 Annual congressional H-1B cap 85,000 85,000 85,000 85,000
Table continues
KIRKEGAARD - chapter 5

107 PIIE BR 20-2 | SEPTEMBER 2020
with German and Japanese nationals accounting for more than half of them.19 Employment visas issued at US consular offices (a rough approximation for visas to US nationals) represented just 0.3 percent of total issuance during the period for which data were available.
The extremely small number of Indian employment visas issued to Americans relative to nationals from several other G-7 countries seems surprising. It may be explained to a degree by the large number of nonresident Indians living in
19 Data on daily visa issuance by individual overseas Indian consular offices on the data.gov.in website appear very raw and include what upon initial inspection look like extensive double counting of entries. The absolute levels reported in this chapter should therefore be ap-proached with extreme caution, as they likely include significant doubling counting and are thus biased upward. As it is not obvious that such double counting would affect some coun-tries more than others, the relative difference in levels among countries reported in this chapter may be more accurate than the absolute figures.
Table 5.4 (continued)Successful petitions for H-1B visas granted by USCIS, FY1999–FY2019
Line Category 2016 2017 2018 2019
1Total number of H-1B petitions approved
345,262 365,682 332,358 388,403
2Of which were for “continuing employment”
230,759 67%
257,581 70%
238,74372%
249,47664%
3Of which were for “initial employment”
114,50333%
108,10130%
93,61528%
138,92736%
4Number/percent share of total “initial employment” aliens outside the United States
58,89651%
60,51156%
35,40138%
53,31138%
5Number/percent share of total “initial employment” aliens inside the United States
55,60749%
47,59044%
58,21462%
85,61662%
6
Number of Indian nationals approved for “continuing employment
Indian share of total (percent)
185,489 208,608 192,641 199,068
80% 81% 81% 80%
7
Number of Chinese nationals approved for “continuing employment”
Chinese share of total (percent)
15,214 19,312 21,675 25,119
7% 7% 9% 10%
8
Number of Indian nationals approved for “initial employment”
70,737 67,815 51,353 79,423
Indian share of total (percent) 62% 63% 55% 57%
9
Number of Chinese nationals approved for “initial employment”
16781 15165 18,025 25,490
Chinese share of total (percent) 15% 14% 19% 18%
10 Annual congressional H-1B cap 85,000 85,000 85,000 85,000
n.a. = not available
a. Period from May 1998 to July 1999.
b. Includes in 2005 and subsequent years 20,000 H-1B visas for foreign graduates of U.S. universities. Shaded parts denominate H-1B petition categories wholly excluded from the H-1B annual congressional cap.
Source: Kirkegaard (2005); US Citizenship and Immigration Services (USCIS).
KIRKEGAARD - chapter 5

108 PIIE BR 20-2 | SEPTEMBER 2020
the United States, many of whom do not require an Indian employment visa to return to work in India as they retain their Indian citizenship. Large numbers of nonresident Indians in the United States may “crowd out” other American workers who would otherwise have gone to India for work reasons. Americans may also be discouraged from working in India because of its high taxes.
The US-India labor migration relationship is extremely uneven, as flows from India to the United States are very, very high while flows in the other direction are extremely low. The US-India imbalance is also striking in comparison with other advanced economies, suggesting that India’s generally low level of economic development and closed economy cannot explain away all the imbalance.
ECONOMIC AND TRADE IMPACT OF US-INDIA LABOR MIGRATION
Indian labor migration to the United States may represent the most important regularized bilateral economic tie between the two countries.20 This fact will come as little surprise to anyone following the debate over outsourcing and offshoring in the United States (for examples of this debate, see Kirkegaard 2004, 2005, 2007). But the overwhelming scale of Indian dominance in US permanent and temporary employment migration is not well understood or appreciated. The dollar value of this relationship is difficult to quantify, because of data deficiencies and misconceptions. Two problem in assessing the situation are clear:
1 Because official US sources provide the only available data, any calculation of the bilateral labor migration relationship must be a de facto gross figure rather than a net value for the two-way relationship. In trade terms, it is as if only US imports and Indian exports can be captured.
2 The US–India bilateral labor migration relationship involves both permanent and temporary migration. Trade transaction measures follow the methodologies of the International Monetary Fund’s Balance of Payments (IMF 2011) and the General Agreement on Trade in Services (GATS) (UNSD 2010), which focus on transactions between residents and nonresidents. No attempt to quantify the value of permanent migration (for example, residents) between the United States and India is made. Only temporary migration related to nonresidents is quantified, a methodology that ignores the sizable economic advantage to the United States and India derived from permanent labor migration from India.
The economic value of one side of the bilateral labor migration relationship can be approximated by relying on the preliminary methodology used in Kirkegaard (2008), which estimates the value of US Mode 4 computer and information services imports. The vast majority of temporary workers migrating from India to the United States are in the services sectors covered by the GATS,
20 It is difficult to estimate the economic impact of illegal immigration to the United States from any individual country. However, it is possible that the economic impact of illegal immigration from Mexico to the United States makes that bilateral labor relationship more important than the US-India relationship.

109 PIIE BR 20-2 | SEPTEMBER 2020
which distinguishes four modes of supply. In quantifying the value of bilateral US–India labor migration, the specific mode of transaction makes little difference as long as temporary work is involved.
The 2010 Manual on Statistics of International Trade in Services (UNSD 2010) distinguished between Mode 3 commercial presence (in which temporary workers are employed mostly at foreign affiliates and deliver their services via a resident firm) and Mode 4 (presence of natural persons). In Mode 4, temporary workers can be self-employed, contractual services suppliers, intracompany transferees, or services sellers entering a country to set up a commercial presence. Conceptually, L-1 and H-1B visa data for Indian temporary workers in the United States fall overwhelmingly in Mode 4, but no modal distinction can be made from the visa issuance data, which are “single category.” One must adopt the definition of temporary residence embedded in the L-1 and H-1B visa category durations in US temporary immigration law (2 x 3 years for the H-1B visa and 3 + 2 or 4 years for the L-1 visa category).21
The US Citizenship and Immigration Services publishes an annual report called the Characteristics of H-1B Specialty Occupation Workers that includes the median wages earned by H-1B recipients by sector. Because data on the number of H-1B or L-1 visa holders in the United States at any given point in time are not available, some assumptions need to be made about the numbers and wages earned by Indian temporary workers to quantify the value of the US-India labor migration relationship.
No information is available for sectoral employment by nationality, but assuming that most Indian H-1B workers are employed in “computer-related occupations,”22 median wages for this category is a reasonable, if conservative, proxy for the wages earned by Indian H-1B workers in the United States.23 Median wages are available for H-1B workers on both initial and continuing employment visas, with the latter typically earning about $15,000 more than the former, reflecting the experience and higher seniority of temporary H-1B workers employed while on their second three-year visa.24
No similar wage information is available for L-1 visa recipients. Therefore, an assumption has to be made about the substitutability of the H-1B and L-1 visas.25 Indian L-1 workers are assigned a median wage equal to the average of the
21 The IMF balance of payments manual defines workers located in a country for more than one year as residents. The GATS is ambiguous on the matter, leaving it to the host country to de-fine the duration of “temporary.” This chapters follows the GATS recommendation.
22 This category includes jobs in the Bureau of Labor Statistics’ Occupational Employment Survey (OES) major occupational group 15-0000, “Computer and Mathematical Occupations,” http://www.bls.gov/oes/current/oes150000.htm.
23 H-1B wages are subject to a “prevailing wage requirement,” which acts as a de facto wage floor. There is no upper limit to the wages of an H-1B worker. Kirkegaard (2005) finds that a sizable number of H-1B workers earn substantially above prevailing US wages. The H-1B wage distribu-tion is hence skewed toward the upper tail. Estimates of median wages are therefore substan-tially lower than “average H-1B wages.” Consequently, estimates for total wages earned by H-1B visa holders will be conservative, likely biased significantly downward.
24 Annual nominal wage increases of 5 percent are assumed for all H-1B visa holders during their three-year stays. This increase is in relation to the roughly $15,000 difference in wages be-tween initial and continuing employment H-1B workers, a conservative wage growth estimate.
25 In their annual 10-K filings, some large Indian IT services firms publish the number of H-1B and L-1 visa holder numbers, lending credence to the assumption of substitutability between the two categories. See also Kirkegaard (2007).

110 PIIE BR 20-2 | SEPTEMBER 2020
annual median wages earned by H-1B workers in computer-related occupations in initial and continuing employment, respectively. Because the L-1 visa is renewable for up to seven years and includes many senior executives, this assumption about wages earned by Indian L-1 recipients is conservative.
No departure data exist for H-1B or L-1 visas holders. All data should therefore be treated as gross data. In addition, an assumption must stipulate that all H-1B recipients remain employed in the United States for the entire three-year duration of their visas.26 Indian L-1 visa holders are assumed to be employed in the United States for on average of five years after the initial visa issuance. This assumption makes no allowance for Indian H-1B or L-1 visa holders who are granted multiple visas during their time in the United States (if, for example, they shift employers one or more times). This fact places an upward bias on estimates of the total number of visa holders.
Wage costs account for most of the total cost of goods sold (COGS) of Indian firms relying on temporary workers in the United States to staff their on-site delivery services model.27 Wages do not constitute the entire value of the transaction embodied in the presence of Indian temporary workers in the United States, however. A company’s gross profit margin must be added to the COGS to capture the full value of the trade flow.28 Kirkegaard (2008) finds that gross profit margins in the US IT services industry of 30–40 percent are common. A 20 percent gross margin for Indian temporary workers in the United States is thus a prudent and conservative assumption about the total value of the economic value of the temporary migration trade flow in a sector in which profit margins have been falling.
Table 5.5 shows the median wages of Indian H-1B and L-1 temporary workers in the United States. It approximates the value of one side of the US-India bilateral labor migration relationship, subject to the caveats and assumptions discussed.
The estimated number of Indian H-1B visa holders employed in the United States in FY2002–19 ranged from 260,000 to 800,000; the estimated number of Indian L-1 visa holders rose from just over 45,000 in FY2002 to about 150,000–175,000 by FY2011–12, before declining to just over 100,000 in FY2017–19.
Related estimated wages paid to Indian temporary workers in the United States increased from about $25 billion early in the period in 2003 to about $110 billion by 2019. The total annual embedded economic value of the temporary bilateral labor migration relationship between the United States and India rose from $26 billion–$33 billion in 2002–05 to more than $117 billion by 2019.
26 This assumption seems realistic given the very large number of Indian nationals that apply for their second “continuing employment” H-1B visa (see table 5.5).
27 The COGS refers to the costs of production directly attributable to the product sold (variable costs). It includes direct labor costs and materials but not indirect (fixed) costs, such as build-ings, distribution, and administration. These costs are likely a very small share of total costs.
28 Gross profit margin refers to company revenues minus the COGS. Given the assumed low level of company fixed costs associated with the presence of Indian temporary workers in the United States, operating with gross profit margins is appropriate.

111 PIIE BR 20-2 | SEPTEMBER 2020
Table 5.5Estimated value, number of, and wages earned by Indian temporary workers in the United States, FY2002–FY2019
Fiscal year 2002 2003 2004 2005 2006Total estimated Indian H-1B visa holders
351,238 305,707 267,713 321,253 377,416
Total estimated Indian L-1 visa holders 45,508 61,356 77,798 93,418 113,297
Total estimated wages earned by Indian H-1B visa holders (billions of US dollars)
22.4 19.1 16.8 20.9 25.6
Total estimated wages earned by Indian L-1 visa holders (billions of US dollars)
2.9 3.8 5.1 6.5 8.0
Total wages earned in the United States by temporary Indian H-1B/L-1 workers (billions of US dollars)
25.3 23.0 21.9 27.4 33.6
Total value of embedded economic bilateral US-India temporary worker relationship, including 20% gross profit margin (billions of US dollars)
30.3 27.5 26.3 32.8 40.4
US recorded services imports from India, annual total (billions of US dollars)
1.9 2.0 2.7 4.8 7.1
US recorded goods imports from India, annual total (billions of US dollars)
12 13 16 19 22
Reported US “compensation of employees” of Indian nationality (billions of US dollars)
0.1 0.1 0.2 0.2 0.2
Reported US “private remittances and other transfers” to Indian nationals (billions of US dollars)
n.a. n.a. n.a. n.a. n.a.
Total value of embedded economic bilateral US-India temporary worker relationship, percent share of current $US Indian GDP (calendar year)
5.8% 4.5% 3.6% 3.9% 4.3%
Addendum:Reported median annual wages for H-1B workers (US dollars)
Initial employment, first year $55,000 $50,500 $50,000 $50,000 $55,000
Continuing employment, first year $64,739 $63,000 $65,000 $68,000 $70,000
Assumed median wages, L-1 workers $59,870 $56,750 $57,500 $59,000 $62,500
Table continues
KIRKEGAARD - chapter 5
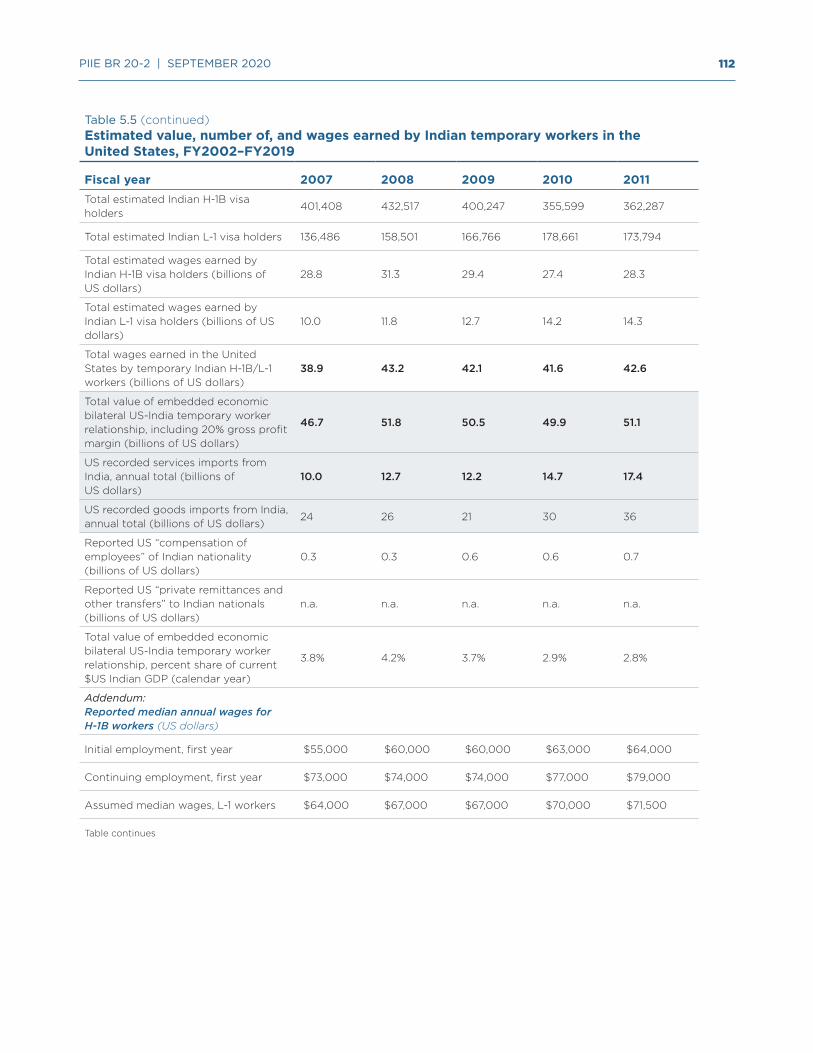
112 PIIE BR 20-2 | SEPTEMBER 2020
Table 5.5 (continued)Estimated value, number of, and wages earned by Indian temporary workers in the United States, FY2002–FY2019
Fiscal year 2007 2008 2009 2010 2011Total estimated Indian H-1B visa holders
401,408 432,517 400,247 355,599 362,287
Total estimated Indian L-1 visa holders 136,486 158,501 166,766 178,661 173,794
Total estimated wages earned by Indian H-1B visa holders (billions of US dollars)
28.8 31.3 29.4 27.4 28.3
Total estimated wages earned by Indian L-1 visa holders (billions of US dollars)
10.0 11.8 12.7 14.2 14.3
Total wages earned in the United States by temporary Indian H-1B/L-1 workers (billions of US dollars)
38.9 43.2 42.1 41.6 42.6
Total value of embedded economic bilateral US-India temporary worker relationship, including 20% gross profit margin (billions of US dollars)
46.7 51.8 50.5 49.9 51.1
US recorded services imports from India, annual total (billions of US dollars)
10.0 12.7 12.2 14.7 17.4
US recorded goods imports from India, annual total (billions of US dollars)
24 26 21 30 36
Reported US “compensation of employees” of Indian nationality (billions of US dollars)
0.3 0.3 0.6 0.6 0.7
Reported US “private remittances and other transfers” to Indian nationals (billions of US dollars)
n.a. n.a. n.a. n.a. n.a.
Total value of embedded economic bilateral US-India temporary worker relationship, percent share of current $US Indian GDP (calendar year)
3.8% 4.2% 3.7% 2.9% 2.8%
Addendum:Reported median annual wages for H-1B workers (US dollars)
Initial employment, first year $55,000 $60,000 $60,000 $63,000 $64,000
Continuing employment, first year $73,000 $74,000 $74,000 $77,000 $79,000
Assumed median wages, L-1 workers $64,000 $67,000 $67,000 $70,000 $71,500
Table continues
KIRKEGAARD - chapter 5

113 PIIE BR 20-2 | SEPTEMBER 2020
Table 5.5 (continued)Estimated value, number of, and wages earned by Indian temporary workers in the United States, FY2002–FY2019
Fiscal year 2012 2013 2014 2015 2016Total estimated Indian H-1B visa holders
427,595 511,954 575,923 602,803 671,759
Total estimated Indian L-1 visa holders 150,975 130,494 121,778 108,646 105,237
Total estimated wages earned by Indian H-1B visa holders (billions of US dollars)
33.4 42.3 47.5 43.4 59.6
Total estimated wages earned by Indian L-1 visa holders (billions of US dollars)
12.7 11.7 10.8 9.9 9.6
Total wages earned in the United States by temporary Indian H-1B/L-1 workers (billions of US dollars)
46.0 54.0 58.4 53.3 69.2
Total value of embedded economic bilateral US-India temporary worker relationship, including 20% gross profit margin (billions of US dollars)
55.3 64.8 70.0 64.0 83.0
US recorded services imports from India, annual total (billions of US dollars)
18.8 20.4 22.4 24.7 25.8
US recorded goods imports from India, annual total (billions of US dollars)
41 42 46 45 46
Reported US “compensation of employees” of Indian nationality (billions of US dollars)
0.7 0.8 1.0 1.1 1.2
Reported US “private remittances and other transfers” to Indian nationals (billions of US dollars)
12.0 11.1 11.2 11.7 10.7
Total value of embedded economic bilateral US-India temporary worker relationship, percent share of current $US Indian GDP (calendar year)
3.0% 3.5% 3.4% 3.0% 3.6%
Addendum:Reported median annual wages for H-1B workers (US dollars)
Initial employment, first year $65,000 $66,000 $67,000 $70,000 $72,000
Continuing employment, first year $80,000 $85,000 $84,000 $88,000 $89,000
Assumed median wages, L-1 workers $72,500 $75,500 $75,500 $79,000 $80,500
Table continues
KIRKEGAARD - chapter 5

114 PIIE BR 20-2 | SEPTEMBER 2020
Table 5.5 (continued)Estimated value, number of, and wages earned by Indian temporary workers in the United States, FY2002–FY2019
Fiscal year 2017 2018 2019Total estimated Indian H-1B visa holders
727,896 776,643 798,908
Total estimated Indian L-1 visa holders 109,410 108,225 106,382
Total estimated wages earned by Indian H-1B visa holders (billions of US dollars)
65.6 79.6 86.5
Total estimated wages earned by Indian L-1 visa holders (billions of US dollars)
10.1 11.2 11.7
Total wages earned in the United States by temporary Indian H-1B/L-1 workers (billions of US dollars)
75.7 90.9 98.2
Total value of embedded economic bilateral US-India temporary worker relationship, including 20% gross profit margin (billions of US dollars)
90.8 109.0 117.9
US recorded services imports from India, annual total (billions of US dollars)
28.1 29.6 n.a.
US recorded goods imports from India, annual total (billions of US dollars)
49 54 58
Reported US “compensation of employees” of Indian nationality (billions of US dollars)
1.2 1.0 1.5
Reported US “private remittances and other transfers” to Indian nationals (billions of US dollars)
11.7 12.7 n.a.
Total value of embedded economic bilateral US-India temporary worker relationship, percent share of current $US Indian GDP (calendar year)
3.4% 4.0% 4.0%
Addendum:Reported median annual wages for H-1B workers (US dollars)
Initial employment, first year $76,000 $85,000 $92,000
Continuing employment, first year $90,000 $101,000 $107,000
Assumed median wages, L-1 workers $83,000 $93,000 $99,500
n.a. = not available
Sources: US Citizenship and Immigration Services; US Bureau of Economic Analysis; US Census Bureau; World Bank Bilateral Remittance Matrices; IMF World Economic Outlook, April 2019.
KIRKEGAARD - chapter 5

115 PIIE BR 20-2 | SEPTEMBER 2020
Table 5.5 (continued)Estimated value, number of, and wages earned by Indian temporary workers in the United States, FY2002–FY2019
Fiscal year 2017 2018 2019Total estimated Indian H-1B visa holders
727,896 776,643 798,908
Total estimated Indian L-1 visa holders 109,410 108,225 106,382
Total estimated wages earned by Indian H-1B visa holders (billions of US dollars)
65.6 79.6 86.5
Total estimated wages earned by Indian L-1 visa holders (billions of US dollars)
10.1 11.2 11.7
Total wages earned in the United States by temporary Indian H-1B/L-1 workers (billions of US dollars)
75.7 90.9 98.2
Total value of embedded economic bilateral US-India temporary worker relationship, including 20% gross profit margin (billions of US dollars)
90.8 109.0 117.9
US recorded services imports from India, annual total (billions of US dollars)
28.1 29.6 n.a.
US recorded goods imports from India, annual total (billions of US dollars)
49 54 58
Reported US “compensation of employees” of Indian nationality (billions of US dollars)
1.2 1.0 1.5
Reported US “private remittances and other transfers” to Indian nationals (billions of US dollars)
11.7 12.7 n.a.
Total value of embedded economic bilateral US-India temporary worker relationship, percent share of current $US Indian GDP (calendar year)
3.4% 4.0% 4.0%
Addendum:Reported median annual wages for H-1B workers (US dollars)
Initial employment, first year $76,000 $85,000 $92,000
Continuing employment, first year $90,000 $101,000 $107,000
Assumed median wages, L-1 workers $83,000 $93,000 $99,500
n.a. = not available
Sources: US Citizenship and Immigration Services; US Bureau of Economic Analysis; US Census Bureau; World Bank Bilateral Remittance Matrices; IMF World Economic Outlook, April 2019.
KIRKEGAARD - chapter 5
By way of comparison, recorded US imports of private services from India amounted to just $3,028 billion in (calendar year) 2018, despite having risen rapidly over the period.29 Recorded US goods imports from India (on a balance of payments basis) stood at $58 billion in 2019—less than half the estimate of the economic value of temporary workers from Indian working in the United States that year (see table 5.5). the discrepancies between estimated total wages paid to Indian temporary workers in the United States estimated based on comprehensive visa issuance data and reported balance of payment–compliant compensation of employees and private remittances and other transfers (for example, workers’ remittances) made to Indian nationals from the United States are.30 Total recorded employee compensation paid to Indian nationals earning wages in the United States never rose above $1.5 billion a year over the 2002–19 period, whereas recorded bilateral remittances reached $13 billion.
Total recorded remittances from the United States to India were hence only about one-eighth of total estimated temporary worker wages in 2019 shown in table 5.5. This very large discrepancy is rooted in several definitional and data collection issues. The sixth edition of the IMF Balance of Payments Manual redefined what a remittance is. For migrants relocating for less than one year, “workers’ remittances flows” are part of the current account; for workers who are abroad for more than a year (and hence classified as resident in their new country), the “stock of migrants’ transfers” are part of the capital account.
The total compensation for temporary Indian workers in the United States estimated in this chapter makes no guesses about what share of this compensation is sent back to India and what share is spent and paid in taxes by workers in the United States. Given the significant number of dependent H-4 and L-2 visas issued to Indians, it is evident, though, that temporary workers from India frequently bring at least some family members to the United States, suggesting that they consume a sizable share of their US earnings, reducing the amount of remittances possible. Official data capture of remittances through bank transfer records are often spotty and miss large informal flows. They also undercount flows via money transfer operators, post offices, and mobile money transfers platforms, which are gaining in popularity.
29 Indian services exports reported by the Reserve Bank of India are generally substantially larger than US imports reported by the US Bureau of Economic Analysis (BEA) because of the statistical collection methods relied on by the Reserve Bank of India, which uses firm surveys of Indian IT services exporters’ sales in the United States. Such firm-level data are generally re-ported on a Generally Accepted Accounting Practices (GAAP) standard rather than the meth-od used in the IMF balance of payments manual. As a result, since 1997–98, Indian software export data have included items like onsite development costs, expenditures on employees, and office maintenance expenses in the United States. Indian software and IT services export numbers are therefore likely substantially inflated relative to IMF balance of payments–compli-ant data. Consequently, only US BEA data—which have their own set of flaws—are reported here. See GAO (2005), OECD (2006), and Kirkegaard (2008).
30 In principle, the IMF balance of payments captures wage payments to nonresidents present in a country as long as H-1B and L-1 visas are valid in these two entries. Compensation of employ-ees comprises wages, salaries, and other benefits (in cash or in kind) earned by individuals in economies other than those in which they are residents for work performed for and paid for by residents of those economies. Workers’ remittances cover current transfers by migrants who are employed in other countries and considered residents there (for example, living there for more than 12 months).

116 PIIE BR 20-2 | SEPTEMBER 2020
Table 5.5 relates the total value of the bilateral US-India temporary worker relationship to Indian GDP. This share declined from 6 percent of Indian GDP in 2002 to 4.5 percent in 2019, as the (US dollar–denominated) denominator rose with Indian economic growth.31
There are large natural overlaps between recorded services trade data and the estimated value of the bilateral temporary labor relationship. The two numbers must not be viewed as additive. The question is which better captures the true value of the bilateral economic relationship.
The bilateral balance of payments data from the US Bureau of Economic Analysis generally underestimate the scale of the relationship. Estimates of the wages paid to Indian temporary workers in the United States based on visa data are much larger than estimates based on balance of payments data, for three main reasons.
First, the visa data are compulsory and comprehensive; they therefore include all Indians temporarily working in the United States. In contrast, the balance of payments data are based on surveys of US businesses and financial transaction records, which are subject to significant sampling uncertainty. Visa-based data are therefore likely be more accurate than balance of payments data for estimating the wages of all Indian nationals working in the United States at any one time.
Second, the definitional period of “temporary nonresidency” in the visa data–based estimates in table 5.5 is the period of legal residency granted by the visa category (five or six years) rather than the 12 months specified by the IMF balance of payments data. In principle, the recorded level of “compensation for employees” of Indian nationality covers only the first year of their stay in the United States and should hence be much lower than the visa data–based estimates reported in table 5.5. The recorded annual balance of payments–compliant flows from the United States to India are less than $1 billion, however, which, given the estimated number of temporary Indian workers in their first year of employment in the United States, is too low to be credible.
Third, the lion’s share of wages paid to Indian temporary workers in the United States will likely be spent and paid in taxes inside the United States; it will be captured in financial transaction records and balance of payments data in the form of worker remittances. Consequently, one would expect recorded remittances to be substantially smaller than estimated wages received by Indian temporary workers.
US–India labor migration is a very significant factor in the economic relationship between the two countries, even if traditional official data output fail to adequately capture it. This relationship is far larger than traditional balance of payments data suggest. At more than $117 billion a year in 2019, it surpasses the value of US goods and services imports from India.
31 As the estimates in table 5.5 do not include the efforts of Indian working spouses of L-1 and H-1B visa holders, this number will be biased downward.
117 PIIE BR 20-2 | SEPTEMBER 2020
CONCLUSION
India is by far the most important source of both permanent and temporary US employment-based migration, with Indian nationals accounting for about half of all US employment-based permanent migration in recent years. Indian nationals also made up a staggering 70–80 percent of the total number of entrants on the two main high-skilled temporary US visa categories (H-1B and L-1) in recent years.
Since 2010, however, the Indian share of L-1 visa recipients has declined. Limited data on employment-based temporary migration to India also suggest that very few US nationals go to India for work, even compared with nationals from some other G-7 countries. The presence of large numbers of nonresident Indians in the United States can explain only part of this phenomenon. Labor migration between the two countries is thus extremely lopsided.
The estimated (one-sided) economic value of the temporary worker flows from India to the United States is estimated at more than $117 billion in 2019. This value exceeds the total value recorded by US statistical authorities of Indian exports of goods and services to the United States in recent years. The estimated economic value of these workers is more than eight times the combined recorded bilateral balance of payment flows in the compensation of employees and worker remittances categories.
Labor migration between India and the United States is so important that its inclusion will be a sine qua non in any discussion of the future relationship between the two countries. Anti-immigration rhetoric and administrative measures by the Trump administration have not—yet—undermined the economically highly beneficial relationship for the United States.
The issue of visas for Indian nationals working in the United States remains a source of tension, however; the impact the new H-1B visa lottery will have on Indian dominance of the program is not yet clear. In June 2020, President Trump banned the entry of all new temporary workers (and their dependents) to the United States on both H-1B and L-1 visas. The pandemic had already dramatically reduced the number of new temporary workers coming to the United States, including from India. The ban will keep these numbers extremely low.
REFERENCES
Bier, David. J. 2020. The Facts about H-4 Visas for Spouses of H-1B Workers. June 16. Washington: Cato Institute. Available at https://www.cato.org/blog/facts-about-h-4-visas-spouses-h-1b-workers.
Federal Register. 2020. Suspension of Entry of Immigrants Who Present a Risk to the United States Labor Market during the Economic Recovery Following the 2019 Novel Coronavirus Outbreak. April 27. Washington. Available at https://www.federalregister.gov/documents/2020/04/27/2020-09068/suspension-of-entry-of-immigrants-who-present-a-risk-to-the-united-states-labor-market-during-the.
GAO (Government Accountability Office). 2005. US and India Data on Offshoring Show Significant Differences. GAO Report to Congressional Committees GAO-06-116. Washington.
IMF (International Monetary Fund). 2011. Balance of Payments and International Investment Position Manual, 6th ed. Washington: International Monetary Fund. Available at http://www.imf.org/external/pubs/ft/bop/2007/bopman6.htm.

118 PIIE BR 20-2 | SEPTEMBER 2020
Kirkegaard, Jacob Funk. 2004. Outsourcing—Stains on the White Collar? Washington: Peterson Institute for International Economics. Available at http://www.piie.com/publications/papers/kirkegaard0204.pdf.
Kirkegaard, Jacob Funk. 2005. Outsourcing and Skill Imports: Foreign High-Skilled Workers on H-1B and L-1 Visas in the United States. PIIE Working Paper 05-15. Washington: Peterson Institute For International Economics.
Kirkegaard, Jacob Funk. 2007. The Accelerating Decline in America’s High-Skilled Workforce: Implications for Immigration Policy. Policy Analyses in International Economics 84. Washington: Peterson Institute For International Economics.
Kirkegaard, Jacob Funk. 2008. Recent Trade Patterns and Modes of Supply in Computer and Information Services in the United States and NAFTA Partners. PIIE Working Paper 08-10. Washington: Peterson Institute For International Economics.
Kirkegaard, Jacob Funk. 2015. The Economic Scope and Future of US-India Labor Migration Issues. PIIE Working Paper 15-1. Washington: Peterson Institute For International Economics.
OECD (Organization for Economic Cooperation and Development). 2006. OECD Information Technology Outlook 2006. Paris.
UNSD (United Nations Statistics Division). 2010. Manual on Statistics of International Trade in Services 2010. New York. Available at http://unstats.un.org/unsd/tradeserv/tfsits/manual.htm.
USCIS (US Citizenship and Immigration Services). 2004–19. Characteristics of H-1B Specialty Occupation Workers. Washington.
US Department of Homeland Security. 2007–18. Yearbook of Immigration Statistics. Washington.
US Department of State. 2003–19. Report of the Visa Office. Washington.

119 PIIE BR 20-2 | SEPTEMBER 2020
6 The New Triangle: Can the United States Encourage India to Become a Counterweight to China?Steven R. Weisman
For most of their shared history, India and the United States have viewed their relationship through the lenses of conflicting strategic and economic goals. Despite a stream of declarations of friendship and mutually important values over many presidential administrations, the world’s two largest democracies have fluctuated through many highs and lows, marked by pledges of cooperation but also misunderstandings of history, self-identity, and their own views of economic and political independence.
Before President Donald Trump took office, in 2017, five US presidents—two Democrats and three Republicans—had tried to draw India closer to the United States, in part by offering military assistance and encouraging New Delhi to lower trade and investment barriers, but not at the cost of alienating Indian governments loath to upset protected special interests.
President Trump’s efforts have adjusted—and tested—that approach. Under Trump, the United States has pressed the traditional effort to deepen ties with India, including in military cooperation, while taking a more belligerently confrontational approach on trade. The administration recently cut back on temporary work visas that have long enabled Indian nationals and their families, especially those associated with the high-tech sector, to reside and work throughout the United States and send remittances home. As a result, mutual misperceptions on both sides continue to complicate the outlook for the economic and political progress they seek.
In 2020, a new alignment of strategic, political, and economic interests between India and the United States may be in the offing. Rising Indian tensions with China could be deepening relations between Washington and New Delhi. The main impetus for this potential reshuffling was a clash of military forces on the India-China border in the Himalayan mountain region in early June that left 20 Indian soldiers and possibly some Chinese soldiers dead. The two sides reportedly did not use firearms, but their use of clubs, knives, and other weapons was enough to inflict the damage. Border tensions have continued since that flareup.
The episode in June shocked leaders and followers in New Delhi, because it came only two years after Prime Minister Narendra Modi and President Xi Jinping of China held a summit in Wuhan, where they pledged mutual friendship and cooperation on a range of issues, and only a year after President Xi visited the southern Indian city of Chennai and paid a visit to ancient temples at nearby
Steven R. Weisman is vice president for publications and communications at the Peterson Institute for International Economics. He served as New Delhi bureau chief for the New York TImes in 1985–88. He thanks Ashley J. Tellis of the Carnegie Endowment for International Peace and Alyssa Ayres of the Council on Foreign Relations for contributing insights to this chapter.

120 PIIE BR 20-2 | SEPTEMBER 2020
Mamallapuram. The border clashes dissipated the “spirit of Wuhan” and the “spirit of Mamallapuram,” reviving tensions that have existed since China thrashed Indian troops in a war over disputed border territories in 1962.
After the 2020 episode, India retaliated against China by loosening economic ties and building up its military. The Trump administration rushed to embrace India’s position, blaming China for the confrontation, just as the Kennedy administration did in 1962. The headlines in Indian newspapers about US support could bolster Prime Minister Modi’s efforts to overcome other misgivings about US policies and move closer to Washington.1
These developments underscore what Ashley J. Tellis of the Carnegie Endowment has called a new and troubled “triangular relationship between the United States, China, and India” as a wild card in global politics (Tellis 2020). Or, as the Council on Foreign Relations scholars Alyssa Ayres, Elizabeth Economy, and Daniel Markey have put it, a new “tense triangle” of China, India, and the United States has become a major factor in the power relationships of the region. Because of the danger of hostility among these three countries spinning out of control, these authors have called for a “high-level trilateral arrangement” or even a “trilateral institution with a permanent headquarters and staff” that would help facilitate communication and ease tensions in the region and even the world (Ayres, Economy, and Markey 2016; see also Madan 2020).
Such an arrangement would seem to be a distant prospect at best. But the three countries have plenty to talk about—to draw closer but also to keep a distance. For example, despite their shared concerns, including criticism of China over the spread of the COVID-19 pandemic, India resists being labeled as the West’s counterweight to Chinese influence in Asia. India has declined to join China’s vast infrastructure development program under the Belt and Road Initiative, fearing that China is turning it into means to encircle India with infrastructure and military facilities. In India’s eyes, China’s inroads in countries that surround it, from Myanmar to Sri Lanka to Pakistan, add to what it sees as encroachment on the Himalayan border. As of the summer of 2020, India had not gone along with US efforts to block ties to and purchases by the Chinese telecommunications giant Huawei, but such a move remained a possibility. After the border clashes, India cut off nearly 60 Chinese mobile apps, including TikTok, a popular platform for short-form videos.
On the other hand, India remains dependent on Chinese imports for its own participation in manufacturing supply chains especially the production of generic drugs, a sector in which India is a global leader. Accordingly, India may be careful about further retaliation, many economic analysts say. In the Middle East, India has supported US efforts to keep Iran from getting nuclear weapons, but it has also rebuffed US efforts to isolate Iran economically, and India continues to depend on Iran for its energy needs, despite American objections. Nearly 30 years after the end of the Cold War, when India was often aligned with the Soviet Union, Modi’s government has also resisted US appeals to avoid buying Russian anti-aircraft missile systems.
1 Maria Abi-Habib, “India Ponders Siding with West against China,” New York Times, June 22, 2020.
121 PIIE BR 20-2 | SEPTEMBER 2020
The difficulties in the India-US relationship may be underscored by what happened and what did not happen surrounding their leaders’ visits in 2019 and 2020. Like the exchange of visits with China, these episodes highlighted the ambivalence on both sides. President Trump visited India in late February 2020, where he was accorded an enthusiastic “Namaste Trump” reception at a cricket match in Ahmedabad. His visit reciprocated Prime Minister Modi’s 2019 visit to Houston, where he and Trump joined in a “Howdy Modi” celebration at a football stadium. Many political analysts believed the rally was likely to help Trump win votes among the Indian diaspora in the United States, which tends to vote Democratic but is also proudly nationalist when it comes to India and broadly supportive of Modi’s nationalist policies.
But the two countries’ pledges of economic cooperation sputtered and then failed during Trump’s visit. The two sides had been trying to reach a mutual accommodation on trade since 2018. In New Delhi, they were unable to reach even a limited accord on tariffs and investment. Instead, they left in place a series of escalating tariff barriers they had adopted the previous year in a futile effort to try to pressure each other, each blaming the other for intransigence.
The Trump visit was marred by riots in the eastern part of the city, where mob violence resulted in the death of more than 50 people, primarily Muslims. The rioting was sparked by protests against Modi’s crackdown on the Muslim-majority state of Jammu and Kashmir and a new law fast-tracking citizenship for refugees from Afghanistan, Bangladesh, and Pakistan from six religions other than Islam. The refugee policy raised concerns that nation-wide implementation of a citizenship register might strip millions of Indian Muslims of their citizenship for lack of sufficient documents.
Negotiations to resolve the trade issue were moribund when, shortly after the June 2020 border clash, Trump jolted India with the news that he was suspending new work visas for hundreds of thousands of foreigners seeking employment in the United States. Among the people potentially affected by the freeze are many Indians seeking temporary or permanent employment in the United States in computer programming and other high-tech fields. In July, the Trump administration also suspended visas for students attending classes held only online. That action might have affected at least some of the 200,000 Indians enrolled in US colleges and universities had it not been rescinded amid an outcry from leading educational institutions, governors, and attorneys general in many states. These steps were a shock to many big companies and Indian families, including some who work in high-tech fields in Texas, where Modi had been cheered at “Howdy Modi” in 2019.
The “tense triangle” of the United States, China, and India can best be understood by tracing the history of Indian economic and political relations with the outside world since its independence and partition in 1947. For all its progress as an economic and political power, India today is caught between the desire to assert itself as a global leader, politically and economically, as befitting its legacy of an ancient civilization, and the desire to avoid being trapped by alliances and dependence on others, especially in trade, investment, and military affairs (Ayres 2018). Since independence, it has gone from “nonalignment” during the Cold War to what India’s external affairs minister, Subrahmanyam Jaishankar,

122 PIIE BR 20-2 | SEPTEMBER 2020
calls “multi-alignment”—an attempt to navigate the world with partnerships but to avoid being entangled by any of them—at the close of the second decade of the 21st century.
In an insightful speech in November 2019, Minister Jaishankar noted the uneasy relationship between India and the rest of the world, including the West in general and the United States in particular, over many decades. Among the factors that have come to define new rules of international and economic relations, he cited not just the rise of China but also the end of the Cold War; the last global financial crisis, which led to challenges to US economic supremacy; the volatility of the Middle East; the continuing ambitions of Russia; the strategic importance of Latin America and Africa; and the rising influence and economic clout of the emerging markets (the “tigers”) of East Asia.
Jaishankar also cited India’s important reorientation since the 1990s toward greater tolerance of foreign investment and a less overregulated market economy, which until the COVID-19 crisis had led to historically strong economic growth, at least according to official figures, even if India’s economic expansion had started to slow even before the pandemic. These factors have created a world that is different from the one that existed before, according to Jaishankar. “If the world is different,” he added, “we need to think, talk, and engage accordingly. Falling back on the past is unlikely to help with the future.”2
Minister Jaishankar’s candid lecture, acknowledging failures as well as successes, sheds light on India’s relationship with the outside world over nearly 75 years, focusing on what he described as six phases. It begins with the humiliating defeat in the war with China in 1962 and covers three wars with Pakistan, an economic crisis followed by an economic revitalization in the early 1990s, nuclear tests and nuclear agreements, and the economic reforms of recent years. These phases also help illuminate the triangle today with the United States and China. The following narrative borrows from Minister Jaishankar’s structure, with additional analysis by the author of this chapter (see also Ayres 2018; Metcalf and Metcalf 2012; and Bipan 2009).
PHASE ONE: INDIA’S “OPTIMISTIC NONALIGNMENT”
Following its birth and violent separation from Pakistan in 1947, India gained the world’s admiration as the biggest and most prominent example of decolonization in the postwar era. The founding prime minister, Jawaharlal Nehru, a Cambridge-educated lawyer and socialist, established Indian neutrality in the Cold War between the Soviet Union and the United States. While Pakistan, dominated by its military, was happy to sign up to Washington’s crusade against Soviet communism—and to receive military assistance, as a so-called frontline state in the Baghdad Pact led by the United States and Britain—India chose what External Affairs Minister Jaishankar calls “optimistic nonalignment.” India went farther, seeking to lead more than 100 countries in Asia and Africa in the Nonaligned Movement.
2 Subrahmanyam Jaishankar, Fourth Ramnath Goenka Lecture, 2019, https://mea.gov.in/Speeches-Statements.htm?dtl/32038/External+Affairs+Ministers+speech+at+the+4th+Ramnath+Goenka+Lecture+2019.

123 PIIE BR 20-2 | SEPTEMBER 2020
This “optimistic” phase crashed as the long-simmering border conflict with China in the Himalayas erupted in war in 1962. The war ended with China occupying territory claimed by India, dealing Nehru and the government a humiliating blow. President John F. Kennedy sided with India in the clash, sending limited military supplies and dispatching an aircraft carrier group to the Bay of Bengal while warning Pakistan to stay out.3 Nehru was grateful, and friendly relations blossomed when Kennedy sent his wife, Jacqueline, on a splashy tour of India. But the American preoccupation with Cuban and Soviet intervention in the Western Hemisphere prevented the Kennedy administration from doing anything more than provide restricted military assistance to help India. As a result, Nehru renewed his determination that India’s security concerns were best served by refusal to take sides between the West and the Soviet Union.
Although India was officially nonaligned in the Cold War, its economic system bore considerable resemblance to the Soviet model. That system included central planning (with five-year plans) and the state’s holding of the “commanding heights” of the national economy, a phrase adopted by Lenin and often invoked by Nehru. The government was avowedly and officially socialist, but not entirely so. Heavy industries were state owned or state controlled; much of the rest of the economy was state regulated. Some commerce and small-scale business remained in the private sector, however, with a handful of private industrial empires owned by the Tata, Birla, and other wealthy families.
The economy was also self-sufficient. A slogan of India’s independence movement was swadeshi (self-reliance), symbolized by Mahatma Gandhi’s spinning wheel and his leading of the Salt March, intended by Gandhi to show India’s determination to create its own textiles from its own cotton and produce its own necessities like salt. In modern times, Prime Minister Modi has channeled that impulse, calling for self-reliance and Make in India approaches to economic growth.
In its early decades, India welcomed foreign aid, however reluctantly, including “food for peace” assistance under the PL 480 program championed by the Kennedy and Johnson administrations. It did not, however, accept foreign imports or investment, which might have modernized its economy more rapidly in the decades after independence (Yergin and Stanislaw 1998).
PHASE TWO: “REALISM AND RECOVERY”
The second phase of Indian foreign interests, according to Minister Jaishankar, was a period of “realism and recovery” from the China disaster, during 1962–71. Weighed down by sluggish growth and a loss of self-confidence, India was on the defensive in this period, preoccupied by seemingly intractable poverty and unrest in places like Muslim-dominated Kashmir, the tribal areas of the northeast, and the southern state of Tamil Nadu. Nehru referred to this restiveness as reflecting India’s “fissiparous” tendencies, a propensity to break apart. In 1965, Pakistani forces infiltrated the Kashmir region hoping to stir an uprising. India retaliated. The second India-Pakistan war lasted nearly three weeks and ended in stalemate, at the cost of thousands of casualties. The war reinforced New Delhi’s
3 Bruce Riedel, “JFK Stopped a China-India War. Can Trump? The Nuclear Stakes Are Much Higher Now,” Daily Beast, August 7, 2017.

124 PIIE BR 20-2 | SEPTEMBER 2020
longstanding suspicions that foreign influence was stirring up rebelliousness among its ethnic minorities, particularly Muslims, who make up roughly a seventh of its population. Relations with the United States were further strained in the 1960s, as President Lyndon Johnson escalated American prosecution of the Vietnam War, which New Delhi feared and resented as an intrusion of US hubris and hegemony in India’s backyard.
India got a boost in this period from US science. Norman Borlaug, the Nobel Peace Prize–winning American agronomist, collaborated with M.S. Swaminathan and other Indian scientists to achieve breakthroughs that increased agricultural production—the so-called Green Revolution—allowing India to achieve food self-sufficiency over the coming decades.4 But its economy was still guided by economists who favored central planning and government control. The few private companies that existed were national champions supported by the government, but the “license-permit-quota” Raj strangled economic growth and innovation, despite Nehru’s farsighted creation of a string of Indian research institutes of science and technology.
Without foreign technology and investment, the Indian economy seemed stuck in a time gone by, with spotty electricity and utilities, its backwardness symbolized by the ubiquity of its 1950s-era domestically produced automobile—still the only car on Indian roads well into the 1980s. During this period, India depended in part on development advice and resources from the World Bank and the Ford Foundation and to some extent on US economic assistance. These institutions also supported large infrastructure projects sponsored by the government, including electricity generation from dams that caused extensive environmental damage and homelessness among tribal groups (Yergin and Stanislaw 1998).
PHASE THREE: GREATER REGIONAL SUPREMACY
At the end of 1970, India’s neighborhood blew up with an election in Pakistan that resulted in a victory by political forces in East Pakistan. Military leaders in Islamabad and Rawalpindi felt they had no choice but to crack down on the distant Bengali state in 1971. A brutal suppression of the eastern region provoked massive uprisings, prompting Prime Minister Indira Gandhi, Nehru’s daughter, who succeeded to the post of prime minister in 1966, to boldly intervene with Indian troops to “liberate” the new country of Bangladesh. Its creation instantly improved India’s strategic calculations, as it was now no longer squeezed on both sides by a menacing Pakistan. Pakistan was humiliated, determined to guard against what it viewed as Indian aggression to destroy it as a viable state.
At the same time, the United States emerged as a more dangerous foe in the eyes of South Block, the government headquarters where the prime minister and the diplomatic corps worked. India denounced the escalation of the Vietnam War, and President Richard Nixon’s invasion of Cambodia in 1970 fueled the perception that the United States posed a threat. But once again the emergence of the tense triangle played a major role, exacerbating tensions.
4 See the Council on Foreign Relations’ timeline on US-India relations, https://www.cfr.org/time-line/us-india-relations.

125 PIIE BR 20-2 | SEPTEMBER 2020
Nixon’s greatest foreign policy achievement of the era was the US opening to China, culminating in Nixon’s visit to China in 1971. Nixon and his secretary of state, Henry Kissinger, believed in balance-of-power global politics. Their aim was to open relations with China and throw the Soviet Union off balance, pressuring it to induce its ally, North Vietnam, to make peace with the United States. But Nixon’s path to China went through Pakistan, resulting in US support for the generals and their political allies in Islamabad. This alliance had been expanding throughout the 1950s, 1960s, and 1970s. (The notorious American U-2 spy plane flights over Russia were operated out of Pakistan air bases.)
Once Nixon took office, the Pakistani leadership helped Kissinger reach out to the Chinese. It was through Pakistan that Kissinger had made the clandestine visits that paved the way for reconciliation between Washington and Beijing. When war erupted between India and Pakistan, following Mrs. Gandhi’s invasion of East Pakistan, a leaked cable suggesting the Nixon administration’s “tilt” of its foreign policy toward Pakistan created a furious response in New Delhi. To bolster its security, India signed a treaty of “peace and friendship” with the Soviet Union and accelerated its own nuclear research, culminating in its explosion of a “peaceful” nuclear device in the deserts of Rajasthan in 1974. But Mrs. Gandhi, for all the support she commanded because of success in that war, was beset by internal strife, including mass protests by her critics. She responded with force, declaring a national “emergency” in which opponents were arrested and civil liberties suspended. The “emergency” lasted a year and a half. In its wake, Mrs. Gandhi was defeated for reelection in 1977.
Mrs. Gandhi returned to power in 1980, remaining in office until her assassination in late 1984 at the hands of her own Sikh security guards. The Sikh religion is a breakaway monotheistic faith founded in the 15th century. Sikhs were a dominant force in the relatively prosperous and rebellious state of Punjab. Many began calling for an independent state for Punjab, yet another example of India’s “fissiparous” tendencies. In 1984, Mrs. Gandhi sent military forces to recapture the Golden Temple in Amritsar from Sikh rebels seeking Punjabi independence. Her assassination was an act of revenge, but many Indian officials were convinced that Pakistan had encouraged the Punjab rebellion in retaliation for India’s support of Bangladesh.
Despite these factors feeding into estrangement between Washington and New Delhi, there were some efforts to advance US-Indian political and economic relations in the 1970s and 1980s. To encourage better ties, the United States forgave the bulk of the money India owed for food assistance under the PL 480 program dating from the 1950s.
President Jimmy Carter visited New Delhi in 1978. One of his main concerns was nuclear nonproliferation, which led him to block shipments of low-enriched uranium fuel for India’s Tarapur nuclear power plant.
In the 1980s, President Ronald Reagan reached out to Mrs. Gandhi, resolving the nuclear fuel issue and offering limited military assistance to encourage India’s self-sufficiency in the region. Mrs. Gandhi visited the White House in a state visit

126 PIIE BR 20-2 | SEPTEMBER 2020
in 1982 and pledged cautiously to work with the Reagan administration to “find a common area, how so ever small.”5 In conjunction with the spirit of that visit, the United States held a “Festival of India” celebration to celebrate Indian culture.
Prime Minister Rajiv Gandhi, who succeeded his mother after her assassination in 1984, experimented with opening the Indian economy. His government lifted regulations governing the size of firms, reduced taxes, and opened the country to imports of consumer goods and high-tech products like computers and auto parts. But these reforms were limited by opposition from vested interests; they ran out of steam as Rajiv Gandhi’s popularity declined, in part because of corruption scandals. India did enjoy a burst in economic growth in the 1980s, vindicating the hopes of those who advocated greater market economics in the Indian system.
But there were discordant notes even in this period of somewhat greater openness. To Indians, the peril of foreign investment came dramatically to the forefront in 1984, when a leak from a Union Carbide pesticide plant in Bhopal in central India killed an estimated 7,000 people living in the neighborhood, many in shacks abutting the factory. It remains the worst industrial disaster in world history, worse than Chernobyl, in 1986. The outrage throughout India crystallized longstanding suspicions about exploitation by foreign investors, feelings felt even today (Metcalf and Metcalf 2012).
In 1979, the Soviet Union invaded Afghanistan and installed a puppet Communist regime in Kabul. President Carter and then President Reagan responded by vastly increasing military assistance to Pakistan, where the military leadership felt threatened by the Soviet presence next door. India did not feel threatened at all by a pro-Soviet regime in Kabul. Of greater concern was that through Pakistan, the United States channeled billions of dollars of assistance (clandestinely given through the CIA and Saudi Arabia) to Muslim jihadists in Afghanistan. India warned Washington against helping both the Pakistani military—by selling it F-16 fighter jets and other equipment—and Muslim radicals, who New Delhi feared would ally themselves with anti-Indian Islamic militants in, among other places, Jammu and Kashmir. India’s warnings went unheeded in Washington. It was clear that US-India relations would still be defined by the Washington-Moscow rivalry.
PHASE FOUR: THE RESHAPING OF RELATIONS AS THE COLD WAR ENDS
Two revolutions occurred at the beginning of the 1990s. One was global and political, the other was internal to India. The global and political earthquake was precipitated by the collapse of the Soviet Union, only a few years after it abandoned Afghanistan, and the emergence of the United States as the unquestioned leader in what some called a new “unipolar” world. China had snuffed out its democracy movement in 1989 at Tiananmen Square. Minister Jaishankar calls the fall of the modern Russian “empire” in the same time frame as a historic moment that “encouraged a radical rethink in India on a broad range of issues.
5 See the Council on Foreign Relations’ timeline on US-India relations, https://www.cfr.org/time-line/us-india.
127 PIIE BR 20-2 | SEPTEMBER 2020
In keeping with that “radical rethink,” India intensified its efforts to improve relations with the United States, as well as relations with China and other countries in East Asia. India also opened relations with Israel, which it had feared getting close to, lest such a step enflame its own Muslim community. Responding to reports of Pakistan moving toward a nuclear weapons capability, India exploded its own nuclear bombs in 1998, abandoning the pretense that it was engaging only in peaceful nuclear research.
Pakistan responded aggressively to these steps, exploding its own nuclear weapon in 1998 and sending troops the following year into the northern city of Kargil, in the Indian state of Jammu and Kashmir, only to be repulsed at great cost by Indian forces. Fearing that the border strife might easily escalate into a nuclear conflict, President Bill Clinton tried to broker an agreement in what amounted to a serious skirmish in the ongoing Indian-Pakistan war. But by helping to persuade Pakistan to withdraw from Indian territory, he inadvertently sped the downfall of Prime Minister Nawaz Sharif in a military coup carried out by General Pervez Musharraf, who had masterminded the Pakistani misadventure in Kargil.
A second historically significant development for India also occurred in the 1990s, beginning with a balance of payments crisis that precipitated a radical rethinking of Indian economic policy. Both Mrs. Gandhi and her son Rajiv had campaigned on the theme of garibi hatao (remove poverty), but India’s lethargic economic growth hampered their efforts. In 1991, skyrocketing oil prices resulting from Iraqi president Saddam Hussein’s invasion of Kuwait and the subsequent US invasion of Iraq launched by President George H. W. Bush, a former US ambassador to China, crushed India’s imported energy–dependent economy.
The sclerotic legacy of the old socialist-oriented regime had caught up with India; the collapse of the Soviet Union was a reminder of such regimes’ vulnerability. These circumstances came together to persuade India’s leaders that the country’s regulations had stifled growth by forcing companies to get permission for even small changes in production and management. India’s hundreds of state-owned enterprises were losing money, compounding government deficits and balance of payment problems. India’s opposition to foreign imports and investments had discouraged innovation, leaving it reliant on backward technology and production.
In the summer of 1991, India’s debts consumed such a large percentage of its GDP that its foreign exchange reserves were barely enough to pay for a couple weeks of energy and other imports. To manage the situation, Prime Minister Narasimha Rao, Finance Minister Manmohan Singh, and Commerce Minister P. Chidambaram introduced dramatic new openings to international trade and investment, deregulation, privatization, and tax reforms. In his address to Parliament, Prime Minister Rao described the Indian economy as “at the edge of a precipice” (Yergin and Stanislaw 1998).
The reforms adopted by the Rao government helped India leave behind its notorious “Hindu rate of growth,” which had been limited to about 2 percent, the same as its population increase. In subsequent years, India would achieve annual growth rates of 7–8 percent.
A major success of the turn to market economics was the rise of software and high-tech development in places like Bangalore and Hyderabad. These businesses drew on investment from Indians living in the United States and in turn sent
128 PIIE BR 20-2 | SEPTEMBER 2020
entrepreneurs to Silicon Valley (Metcalf and Metcalf 2012). Equally important, the reforms undertaken by “the center” in New Delhi were soon adopted in various Indian states, most notably the western state of Gujarat, which had for many years incubated an entrepreneurial spirit, owing to its coastal reliance on commerce and shipping through the Arabian Sea. It was there that a future chief minister, Narendra Modi, would adopt the market-oriented model that would propel him to the prime minister post years later.
PHASE FIVE: A WORLD LESS UNIPOLAR
The 9/11 attacks on the United States by Muslim extremists—some associated with Saudi Arabia and the jihadists who organized the anti-Soviet war in Afghanistan—and the incursions into Indian territory from Pakistan reshaped global politics yet again. From India’s point of view, the United States was now enmeshed in its “global war on terror,” which New Delhi supported in general. But India shared worldwide concerns about the misadventure of invading Iraq under President George W. Bush to overthrow Saddam Hussein and rid Iraq of what turned out to be nonexistent nuclear, chemical, and biological weapons. Suddenly, India was back in the business of triangulating with China—or as Minister Jaishankar put it, India “discovered the benefits of working with different powers on different issues.” Doing so meant reaching out to Russia as well as China, as both were making comebacks economically and politically on the world stage (in Russia’s case as an emerging petrostate).
President George W. Bush, who took office in 2001, came to the White House professing great respect for the Indian diaspora’s entrepreneurial achievements in his home state of Texas and elsewhere, especially in the high-tech sphere. Determined to improve relations with New Delhi, he negotiated a historic nuclear agreement in 2005, abandoning the longstanding US opposition to India’s nuclear ambitions. In return for a US commitment of full cooperation with India on civilian nuclear power, India took the extraordinary step of separating its civilian and military nuclear facilities and placing all its civil nuclear facilities under International Atomic Energy Agency (IAEA) safeguards and inspections. President Bush made a successful visit to India in 2006.
In the first decade of the 21st century, India achieved an annual economic growth rate of 6–8 percent and was renowned for its supply of information technology services to the United States and the world. These factors lifted Indian confidence and made deeper relations with the United States possible, with revitalized hopes in Washington that in its era of higher economic growth, India at last could serve as a regional counterweight to China.
President Barack Obama made two highly successful visits to India. He welcomed Indian diplomacy on climate change and its efforts to pressure Iran to limit its nuclear program. The 2008 attack on the Taj Mahal Palace Hotel in Mumbai, in which hundreds were killed, refocused India’s concern about Pakistani capabilities to support Muslim extremists dangerous to India. To improve ties with India, President Obama held a “strategic dialogue” with Indian leaders and backed India’s bid to join the UN Security Council. Washington increased military ties with India and reached agreement on cybersecurity cooperation.
129 PIIE BR 20-2 | SEPTEMBER 2020
On the economic openness front, although Indian businesses were going global for the first time, India’s record of liberalizing trade barriers was disappointing to its trading partners, including the United States. In 2001, the Bush administration had helped organize a global effort to lower trade and investment barriers. The drive began in Doha, so it became known as the Doha Development Round. It was aimed and advertised (probably over-advertised) as an effort to lift up the poorest countries through trade, not aid, in the wake of fears of global instability after the September 11 attacks. But the negotiations failed by the end of the decade, in part because India and other developing countries feared being swamped by imports from China and the poorest developing countries, which might produce goods that cost less than goods India could produce. India lowered some tariffs in this period, albeit by less than many other countries. The government’s attitude toward the World Trade Organization “has wavered between a begrudging participant and a full-scale obstructionist,” according to Chad P. Bown of the Peterson Institute for International Economics (Bown 2019). Europe and the United States also created obstacles to the success of the round because of their resistance to lower farm product import barriers, which would have helped developing countries export more.
The Doha Round was a follow-up to the Uruguay Round of trade talks, which led to the creation of the World Trade Organization in 1995. That round marked a major push by the United States for reciprocity from developing country trading partners. To some extent, that push succeeded. But the Doha Round’s attempt to take that push further was a harbinger of the difficulties to come in the second decade of the 21st century, especially after the election in 2016 of President Trump, who had an entirely different world view toward international trade. Trump was hostile to trade, slapping steep tariffs on imports as a way of pressuring China, India, Japan, South Korea, Canada, Mexico, and the European Union to lower their tariff barriers. In the case of India, his strategy has so far not worked.
PHASE SIX: THE MODI ERA
Capitalizing on his record combating corruption and promoting business as chief minister of the western state of Gujarat from 2001 to 2014, Narendra Modi swept to a historic election victory in 2014. He was reelected in 2019.
In his first term in office, his achievements were impressive. He simplified India’s tax system with a uniform goods and services tax designed to encourage commerce, although its implementation may have suppressed some economic activity. He reformed bankruptcy regulations and took other steps to lure foreign investment. He invested in roads, airports, public transit systems, and sanitation (most famously by building more than 100 million latrines). To reduce black-market activities, he pulled most of India’s hard currency out of circulation in a “demonetization” scheme that disrupted the economy with its botched implementation but still earned him points for attempting to combat corruption.
In his second term, after his landslide reelection, Modi shocked many in India with a drive to delegitimize India’s Muslims, who constitute one-seventh of the population. He unilaterally revoked a special provision in India’s constitution granting special self-governing status to Jammu and Kashmir, India’s only majority Muslim state, which lies on the border with Pakistan and where Muslim

130 PIIE BR 20-2 | SEPTEMBER 2020
protests have helped ignite three wars and decades of mistrust. To suppress dissent from this policy, he arrested Muslim public officials, intellectuals, and business leaders, holding them without charges. In 2019, he instituted fast-track access to citizenship for refugees from neighboring countries (Afghanistan, Bangladesh, and Pakistan), but restricting that benefit to six religions (Hindus, Sikhs, Buddhists, Jains, Christians, and Parsis), but not Muslims, the dominant religious group in these countries. This action stirred anxiety over the possibility of a nationwide national register of citizens that could render stateless, and vulnerable to expulsion, Muslims unable to “prove” their citizenship with official birth certificates. In general, Modi has promoted a Hindu-oriented nationalism long supported by the Indian Peoples Party (the Bharatiya Janata Party [BJP]) and its radical fringe groups, which interpret Indian history as a centuries-long struggle against foreign domination by Muslim invaders.
The pattern was perhaps set early in Modi’s career. As chief minister of Gujarat, he was credibly accused of turning the other way during anti-Muslim riots in his state in which many hundreds of people died over several days. Suspicions of Modi’s involvement, or at least indifference, led to the US State Department denying him a visa to visit until he became prime minister.
President Obama hosted Modi after his election and worked with India to develop low-carbon energy. At their last meeting, in 2016, he elevated India to a “major defense partner.” In the larger foreign policy context, however, India under Modi has not always been in sync with the United States. Its main concerns, besides the desire to play the role of global leader, focus on its unsettled neighborhood, including Chinese ties to Sri Lanka, Pakistan, Nepal, and other countries in South Asia. India helped establish the so-called BRICS collection of countries (Brazil, Russia, India, China, and South Africa), as leaders of the “emerging economy” bloc. As a member of that bloc, India was on the receiving end of blame for helping undermine the possibility of success in global trade negotiations under the Doha Round.
The election of Donald Trump was disquieting for India, as it was for many countries. But the United States had already lost some of its standing in the eyes of New Delhi under President Obama. The global financial crisis, which began in the United States in 2007–08, weakened the US ability to lecture the world about its concerns over nuclear proliferation, not to mention the alleged superiority of its free-market economic model. Having for many years viewed the United States as an imperious “hegemon” in Asia and complaining about the US presence in Afghanistan, India became worried that the Trump administration’s determination to withdraw from Afghanistan would strengthen Muslim jihadists allied with the Taliban.
President Trump’s erratic and unsuccessful on-again, off-again attempts to halt North Korea’s nuclear program and his trade wars with China, Japan, and South Korea did not inspire confidence in New Delhi. Nor did President Trump himself, according to some reports. According to A Very Stable Genius: Donald J. Trump’s Testing of America, when Modi expressed concern about Chinese aggression to President Trump at a meeting in Manila in 2017, Trump replied, “It’s not like you’ve got China on your border.” Modi was said to have been appalled over his ignorance (Rucker and Leonnig 2020).
131 PIIE BR 20-2 | SEPTEMBER 2020
The Trump administration’s ability to work with India in a geostrategic or regional context is hampered by its determination to confront New Delhi over economic issues, especially trade. Since the beginning of 2018, the Trump administration has increased duties on 14 percent of India’s exports to the United States. India retaliated by slapping new tariffs on about 6 percent of US exports to India. Trump’s tariffs on steel and aluminum—imposed under the rationale of national security threats—have hurt India, the world’s third-largest steel producer after China and Japan. The Trump administration also revoked India’s eligibility for trade benefits under the US Generalized System of Preferences (GSP), benefits it enjoyed for 45 years. As of mid-2020, there had been no progress in resolving these disputes.
But India is a wary trade partner with other countries as well. It has rebuffed appeals to join the Comprehensive and Progressive Agreement for Trans-Pacific Partnership (CPTPP), a partnership the United States entered into under President Obama but withdrew from under President Trump.6 India has also declined to join the Regional Comprehensive Economic Partnership (RCEP) trade agreement of 15 countries, including the countries in the Association of Southeast Asian Nations (ASEAN). In both cases, India has feared that joining such trading blocs would precipitate a flood of Chinese imported goods, threatening Indian manufacturers. Minister Jaishankar describes India’s attitude this way: “On the one hand, we should not go back to the old dogmas of economic autarky and import substitution. But at the same time, embracing the new dogma of globalization without a cost–benefit analysis is equally dangerous.”
In another example of its suspicion of foreign domination, including from China, India has announced plans to impose restrictions on how high-tech corporations can collect, store, and use information from India’s citizens. Analysts say the legislation is built on similar measures in Europe, aimed at guarding against what is seen as excessive influence and power by Google, Amazon, Facebook, and other US technology giants. But by insisting on “data localization”—the storage of data on Indians on servers in India—Modi’s government may be contributing to a fracturing of data collection that will impede progress and efficiency.
Another fear is that India, like China, may be tempted to tap into the databases for political purposes.7 India’s decision in June 2020 to cut off nearly 60 Chinese mobile apps, including TikTok, which many young people in India use, sent an additional signal of its determination to establish greater self-sufficiency in the technology and telecom sectors.
Like many countries, India has veered back to emphasizing self-sufficiency in the wake of the COVID-19 epidemic, because of the sudden concern about relying on foreign imports and supply chains of medical goods. In announcing an economic rescue package of more than $260 billion in May, Modi evoked the swadeshi campaign of Gandhi during the freedom movement, explaining that
6 The CPTPP is an agreement between Canada and 10 other countries in the Asia-Pacific region: Australia, Brunei, Chile, Japan, Malaysia, Mexico, New Zealand, Peru, Singapore, and Vietnam.
7 Vindu Goel, “India Charts Own Path on Data Privacy,” New York Times, December 11, 2019.

132 PIIE BR 20-2 | SEPTEMBER 2020
India needed to support this program to emphasize economic independence. “Be vocal about local!” Prime Minister Modi said. “Who can stop us from becoming a self-reliant India?”8
OUTLOOK FOR INDIA, THE UNITED STATES, AND CHINA
In his 2019 speech, Minister Jaishankar cautioned against embracing the idea that China and the United States, the world’s two biggest economies, will divvy up world leadership, replacing the old Group of 7 and Group of 20 with a new Group of 2 (G-2). India, he said, had no choice but to play the big powers off against its own interests, carefully avoiding permanent alliances or hostile relationships in a world not dominated by any single power. “Hedging is a delicate exercise, whether it is the nonalignment and strategic autonomy of earlier periods, or multiple engagements of the future,” he asserted. “But there is no getting away from it in a multipolar world.”
That said, it could be that India’s clash with China in mid-2020 has shaken some of its assumptions about how close to get to the United States. Following the border violence, for example, US Secretary of State Mike Pompeo received widespread credit in the Indian media for endorsing New Delhi’s charge that the People’s Liberation Army of China had, in his words, “escalated border tensions” by expanding its presence in territory claimed by India, just as it was also “illegally claiming” territorial possession of outposts in the South China Sea. News reports out of New Delhi indicated that the Modi government was considering closer military ties with the United States after the United States sided with India on the border issue.
Before President Trump, the United States encouraged economic reforms in China by offering it trade and investment incentives, membership in the World Trade Organization, and praise as a “responsible stakeholder,” in the words of the former World Bank president Robert B. Zoellick.9 Treasury Secretary Henry Paulson established a “strategic economic dialogue” with China during the Bush years; President Obama continued the process and engaged the United States in a “strategic and economic dialogue” involving the secretaries of state and treasury (Ikenberry 2008).
As of mid-2020, the United States and China are observing a truce, with the United States leaving high tariff barriers on Chinese imports and China promising to expand purchase of American goods, especially in the energy and agriculture sectors (Bown 2020a). China pledged to import certain US goods and services in 2020 and 2021 by $200 billion over the two years over the 2017 level. As of mid-2020, however, China was falling far short of the level of commitment that would meet those goals (Bown 2020b). Meanwhile, the United States has tightened restriction on foreign investments and technology sharing, out of concerns that China has become a military and strategic competitor and must be treated as such. All these developments have shifted the power relationships of the South
8 Jeffrey Gettleman and Hari Kumar, “Modi Announces $260 Billion Coronavirus Rescue Package for India,” New York Times, May 12, 2020.
9 Robert B. Zoellick, “Whither China: From Membership to Responsibility?” remarks to the National Committee on US-China Relations, New York, September 21, 2005.

133 PIIE BR 20-2 | SEPTEMBER 2020
Asian and Pacific region as China has laid claim to disputed islands and territorial waters, unsettling Japan, Taiwan, South Korea, Bhutan, and Australia as well as India (Friedberg 2011).
India offers the United States a way to continue or expand its influence in Asia, at least in theory. But the obstacles are daunting. Strategically, India sits in the middle of vital sea lanes and is a major player in global energy markets. In recent years, India has watched with alarm China’s growing influence through its vast network of investments in roads, bridges, harbors, and infrastructure under the rubric of the Belt and Road Initiative. What some call a “string of pearls” of Chinese influence is seen by others as an attempt by the leadership in Beijing to encircle India with strategic outposts. Until the COVID-19 global economic shock, India’s economic growth was strong enough to take advantage of a strategic relationship with the United States that could expand its national power more rapidly than might otherwise have been possible (Malik 2011).
Military cooperation between the United States and India received something of a boost in late 2019, when the two sides conducted the first full-scale land, sea, and air military exercises, called Tiger Triumph. For nine days, 500 US Marines and Navy personnel and 1,200 Indian troops trained on India’s southeast coast on the Bay of Bengal. During the Prime Minister’s visit to Texas, President Trump hailed the “dramatic progress” in the defense relationship. But Trump administration and Congressional leaders were displeased by India’s planned purchase of a Russian missile system, which the administration said could trigger US sanctions. American arms sales to India during Trump’s presidency were $18 billion as of 2019, a more than five-fold increase over the previous five or six years.10
If it increases investment in strengthening the India economy, improved US-India cooperation would help balance Chinese ascendancy while simultaneously strengthening the material foundations of American global leadership. In addition to trade issues, many other obstacles stand in the way of deepening US-India cooperation, however. For example, in withdrawing from the Paris climate change accord, signed by 196 countries, President Trump accused India of making its participation contingent on “billions and billions and billions of dollars in foreign aid,” an accusation that India and fact-checkers disputed.
Another source of tension has been President Trump’s withdrawal from the Joint Comprehensive Plan of Action (JCPOA) with Iran, the accord negotiated by President Obama and the European Union to curb Tehran’s nuclear program. As part of that accord, India resumed oil imports from Iran. Trump’s rejection of the JCPOA meant a renewal of US pressure on India to cease these imports or face financial sanctions. But it will be difficult for India to end its reliance on Iran’s oil. India also seeks a close economic and political relationship with Iran as a counter to Pakistan. In the absence of a secure direct commercial route to Afghanistan that would have to go through Pakistan, India has cooperated with the Tehran government to establish a foothold in Iran’s Chabahar Port in the Gulf of Oman.
10 Montague, Zach “US-India Defense Ties Grow Closer as Concerns in Asia Loom,” New York Times, November 21, 2019.

134 PIIE BR 20-2 | SEPTEMBER 2020
If Trump is reelected, his administration would likely continue or even escalate its economic confrontation with India, while also working to sustain military and diplomatic cooperation. Although former vice president Joseph R. Biden has assailed Trump for what Democrats call an overly confrontational approach to international diplomacy, it is far from clear that the India-United States relationship would change dramatically if Biden is elected. The Democratic platform pledges that “we will continue to invest in our strategic partnership with India—the world’s largest democracy, a nation of great diversity, and a growing Asia-Pacific power,” hinting that a Biden administration will sustain the policy of viewing India as a counterweight to China. The platform makes no reference to improving economic or trade ties, however.
The team of Biden and his vice presidential running mate, Senator Kamala Harris of California, may not find such smooth sailing if they take a more muscular approach on human rights, however—even though Harris’s mother was an immigrant from India, more specifically from Chennai in the south. The Biden-Harris campaign has called on India to “take all necessary steps to restore rights for all the people of Kashmir,” a highly sensitive issue for Modi. Biden has also expressed “disappointment” over the potential of anti-Muslim discrimination from a national citizenship registration scheme pushed by Modi. For her part, Senator Harris stirred considerable negative coverage in India when she criticized Minister Jaishankar for barring Representative Pramila Jayapal from a meeting he held with lawmakers in 2019. “It’s wrong for any foreign government to tell Congress what members are allowed in meetings on Capitol Hill,” she said.11
A closer India-US relationship will no doubt require compromises on both sides. As Ashley J. Tellis and C. Raja Mohan (2015) of the Carnegie Endowment have written: “The United States must be willing to walk difficult roads to enhance economic cooperation with India, given that such integration is essential to its regional and international interests…. India must understand that sustained economic growth hinges on expanding its global trading links, and that its prior policies of trade expansion through shallow free-trade agreements are no longer viable. Partnership with the West, particularly the United States, is critical to achieving India’s twin aspirations for national development and regional primacy.”
In the final analysis, trying to play India off against China, the United States must probably resign itself to India seeking to play China off against the United States. But for all of their ability to play each other off against China, the best hope for improving US-India relations is to base that objective on what is good for both countries, irrespective of what their prosperity should mean for China and the increasingly authoritarian leadership of President Xi. In fact, given the challenges the global crisis has created for all countries—combating the COVID-19 pandemic, avoiding war, including nuclear war; reducing poverty and economic inequality; combating the conditions that breed violence, terrorism, and massive flows of dispossessed immigrants and refugees; and above all cooperating to stave off the disastrous consequences of global warming—all countries must cooperate to achieve a better world in these respects.
11 “Kamala Harris decries Jaishankar’s decision of not meeting Jayapal,” The Hindu, December 21, 2019.
135 PIIE BR 20-2 | SEPTEMBER 2020
The ideal way for India and the United States to work together is not to increase tensions with China or other countries but to increase global cooperation to oppose the common enemies of humankind. As elusive as such a goal might be, the two countries have a tradition of realism and idealism that make them best qualified to lead the way for a better and healthier world.
REFERENCES
Ayres, Alyssa. 2018. Our Time Has Come: India and the World. New York: Oxford University Press for the Council on Foreign Relations.
Ayres, Alyssa, Elizabeth Economy, and Daniel Markey. 2016. Rebalance the Rebalance: China, India, and the United States. Foreign Affairs, July 13.
Bipan, Chandra. 2009. History of Modern India. Hyderabad: Orient Blackswan.
Bown, Chad P. 2019. Trump’s Mini-Trade War with India. Trade and Investment Policy Watch blog, July 8. Washington: Peterson Institute for International Economics. Available at https://www.piie.com/blogs/trade-and-investment-policy-watch/trumps-mini-trade-war-india.
Bown, Chad P. 2020a. Unappreciated Hazards of US-China Phase One Deal. Blog, January 21. Washington: Peterson Institute for International Economics. Available at https://www.piie.com/blogs/trade-and-investment-policy-watch/unappreciated-hazards-us-china-phase-one-deal.
Bown, Chad P. 2020b. US-China Phase One Tracker: China’s Purchases of US Goods. July. Washington: Peterson Institute for International Economics. Available at https://www.piie.com/research/piie-charts/us-china-phase-one-tracker-chinas-purchases-us-goods.
Friedberg, Aaron L. 2011. A Contest for Supremacy: China, America, and the Struggle for Mastery in Asia. New York: W.W. Norton.
Ikenberry, G. John. 2008. The Rise of China and the Future of the West. Foreign Affairs, January/February.
Madan, Tanvi. 2020. Fateful Triangle How China Shaped US-India Relations during the Cold War. Washington: Brookings Institution Press.
Malik, J. Mohan. 2011 China and India: Great Power Rivals. Boulder, CO: FirstForumPress.
Metcalf, Barbara D., and Thomas R. Metcalf. 2012. A Concise History of Modern India, 3rd. ed. Cambridge: Cambridge University Press.
Rucker, Philip, and Carol Leonnig, 2020. A Very Stable Genius: Donald J. Trump’s Testing of America, New York: Penguin Press.
Tellis, Ashley J. 2020. Between Washington and Beijing: India’s New Geopolitical Challenges. May 18. Washington: Carnegie Endowment for International Peace (originally published by Centro Studi Internazionali di Geopolitica, Rome).
Tellis, Ashley J. and C. Raja Mohan. 2015. The Strategic Rationale for Deeper U.S.-India Economic Ties: American and Indian Perspectives. Washington: Carnegie Endowment for International Peace.
Yergin, Daniel, and Joseph Stanislaw. 1998. The Commanding Heights: The Battle Between Government and the Marketplace That Is Remaking the Modern World. New York: Simon & Schuster.

© 2020 Peterson Institute for International Economics. All rights reserved.
This publication has been subjected to a prepublication peer review intended to ensure analytical quality. The views expressed are those of the authors. This publication is part of the overall program of the Peterson Institute for International Economics, as endorsed by its Board of Directors, but it does not necessarily reflect the views of individual members of the Board or of the Institute’s staff or management.
The Peterson Institute for International Economics is a private nonpartisan, nonprofit institution for rigorous, intellectually open, and indepth study and discussion of international economic policy. Its purpose is to identify and analyze important issues to make globalization beneficial and sustainable for the people of the United States and the world, and then to develop and communicate practical new approaches for dealing with them. Its work is funded by a highly diverse group of philanthropic foundations, private corporations, and interested individuals, as well as income on its capital fund. About 35 percent of the Institute’s resources in its latest fiscal year were provided by contributors from outside the United States.
A list of all financial supporters is posted at https://piie.com/sites/default/files/supporters.pdf.

1750 Massachusetts Avenue, NWWashington, DC 20036-1903 USA+1.202.328.9000www.piie.com