Embed Size (px)
Citation preview

109
3Rebalancing China’s GrowthBERT HOFMAN and LOUIS KUIJS
The sustainability of China’s growth has moved center stage. After threedecades of exceptionally rapid growth, the sustainability of this growth interms of the environment, social stability, and even GDP growth itself isbeing widely debated. As a harmonious society—one of the proclaimedgoals of China’s leadership—aims for more equitable and environmen-tally sustainable growth, the quality and efficiency of growth are now asimportant as its speed.1
This chapter argues that more sustainable growth requires greater re-liance on services and less on industry, more reliance on factor productiv-ity growth and less on capital accumulation, and more reliance on domes-tic demand and less on net exports. It reviews China’s growth experienceover the past 30 years, identifies key imbalances in China’s growth pat-tern, and provides two policy scenarios for China’s future, one illustratingthe consequences of continued growth along past trends and the otherspelling out the implications of a set of policies that would rebalance theeconomy in the direction of meeting the goals of a harmonious society.
Bert Hofman is the World Bank’s country director for the Philippines. Louis Kuijs has been a senioreconomist at the World Bank’s China office in Beijing since September 2004. This chapter draws onWorld Bank (2007a) and He and Kuijs (2007). It reflects the authors’ personal opinions and shouldnot be attributed to the organizations they work for or to the executive directors or member countriesof the World Bank. The authors would like to thank the editors of this volume for their extensive inputto this chapter and Professors Barry Bosworth and Kenneth Rogoff for excellent comments.
1. Premier Wen Jiabao in his Report on the Work of Government to the 2007 National People’sCongress announced that China would move from rapid and efficient growth to efficientand rapid growth, emphasizing efficient growth.
03--Ch. 3--109-130 3/26/08 8:53 AM Page 109
Peterson Institute for International Economics | www.petersoninstitute.org

110 DEBATING CHINA’S EXCHANGE RATE POLICY
China’s Past Growth Performance
China’s growth over the last 30 years is in a league of its own. Since the1978 reforms, annual GDP growth has averaged more than 9.5 percent.This rapid growth has lifted hundreds of millions of people out of poverty.The poverty rate, measured as $1 a day of purchasing power parity (PPP)consumption, fell from over 60 percent of the population in the early 1980sto 10.3 percent in 2004 (Ravallion and Chen 2004, World Bank 2006), liftingsome 500 million people out of poverty over that period. However, noteveryone has benefited equally from growth, and income inequality hasrisen after an initial decline in the early years of reform that focused onrural reforms. China’s Gini coefficient2 increased from 0.25 in the mid-1980s to more than 0.45 today.
Using a growth accounting framework, China’s growth can be decom-posed into contributions of employment, capital, human capital, and totalfactor productivity (TFP) growth. The estimates in table 3.1 show that thecontribution of capital accumulation to GDP growth was significantly
2. The Gini coefficient is used as a measure of inequality in income or wealth distribution. 0 corresponds to perfect equality and 1 to perfect inequality.
Table 3.1 Explaining China’s growth, 1978–2005
(average annual increase, percent)
Source 1978–93 1993–2005
GDP growth 9.7 9.6
Total employment growth 2.5 1.1
Labor productivity growth 7.0 8.4
From TFP growth 3.3 2.8
Of which: From reallocation of labor
between sectors 1.3 1.1
From increasing human capital 0.5 0.2
From increasing capital/labor ratio 3.2 5.3
Memorandum item:
Investment/GDP ratio (period average, percent) 29.9 36.8
TFP = total factor productivity
Note: Methodology as in Kuijs and Wang (2006) but adjusted to identify the contribution of human
capital and using revised GDP data. Assuming Cobb-Douglas technology and a capital-output
ratio of 2.4 in 1978 (as in Wang and Yao 2002, Chow 1993, and Hu and Khan 1996), depreciation of
5 percent per year (as in Wang and Yao 2002), and an elasticity of output with respect to labor of
0.5, as in Wang and Yao (2002), and broadly the average of the range. The update presented in this
table further separates out an estimate of the contribution of human capital accumulation, using
Barro and Lee (2000) data and an assumption of the rate of return to education of 10 percent.
Source: He and Kuijs (2007).
03--Ch. 3--109-130 3/26/08 8:53 AM Page 110
Peterson Institute for International Economics | www.petersoninstitute.org

REBALANCING CHINA’S GROWTH 111
larger in the period 1993–2005 than it was in 1978–93, reflecting rapidgrowth in investment over the last decade. Meanwhile, TFP growth de-clined after the first period, and its contribution to GDP per employeedropped from almost 50 percent in 1978–93 to about a third in 1993–2005.3
The contribution of capital accumulation to labor productivity growth in-creased to 5.3 percentage points in 1993–2005, a very high figure com-pared with other countries. High capital accumulation explains more thantwo-thirds of the difference in labor productivity growth between Chinaand other countries or regions. With overall employment growth slowing,the contribution of labor growth has been modest, especially over the lastdecade. Human capital’s contribution to growth is also modest. Chinastarted its reforms with an already fairly high level of human capital—measured as the number of years of schooling in the working popula-tion—but progress since then has been unremarkable. The recent sharpincrease in tertiary school attendance is likely to change that in the future.
An important feature of China’s growth is that much of GDP growthsince the early 1990s has come from rapid growth of industrial production.Industrial value added increased, on average, 12.6 percent per year during1990 and 2006, and the share of industry in GDP rose from 42 percent in1990 to almost 49 percent in 2006 in current prices, among the highest forany country since the 1960s.4 In 2003–06, industry contributed 60 percentof total GDP growth, compared with 6 percent by agriculture and 34 per-cent by the services sector. Industrial growth has largely been in the formof higher labor productivity, much of it in the form of rising within-firmproductivity.
China’s Unbalanced Growth
China’s record growth performance has come at a price. The currentgrowth pattern relies heavily on manufacturing, investment, and externaldemand. The accompanying large and growing current account surpluseshave become an issue in the international arena, whereas domestically,the accumulation of international foreign exchange reserves is not onlybecoming increasingly a macroeconomic issue but also signifies a subop-timal allocation of resources from China’s point of view. China’s relianceon manufacturing, especially heavy industry, has become a growing bur-den on the environment and made the country increasingly dependent onimported energy resources. Finally, China’s rapid growth has been asso-
3. They suggest the difference may be because of a different assumption for the elasticity ofoutput with respect to capital.
4. In fact, the increase would have been larger but for declining relative prices of industry.In constant 1995 prices, the share of industry in GDP rose from 37 percent in 1990 to 53.5 per-cent in 2006.
03--Ch. 3--109-130 3/26/08 8:53 AM Page 111
Peterson Institute for International Economics | www.petersoninstitute.org
112 DEBATING CHINA’S EXCHANGE RATE POLICY
ciated with rising income inequality, which has become a key issue in thepolitical debate in China. Addressing the imbalances in China’s growthhas become the main driver of the policy agenda as included in the 11thFive Year Plan.
China’s Macroeconomic Imbalances
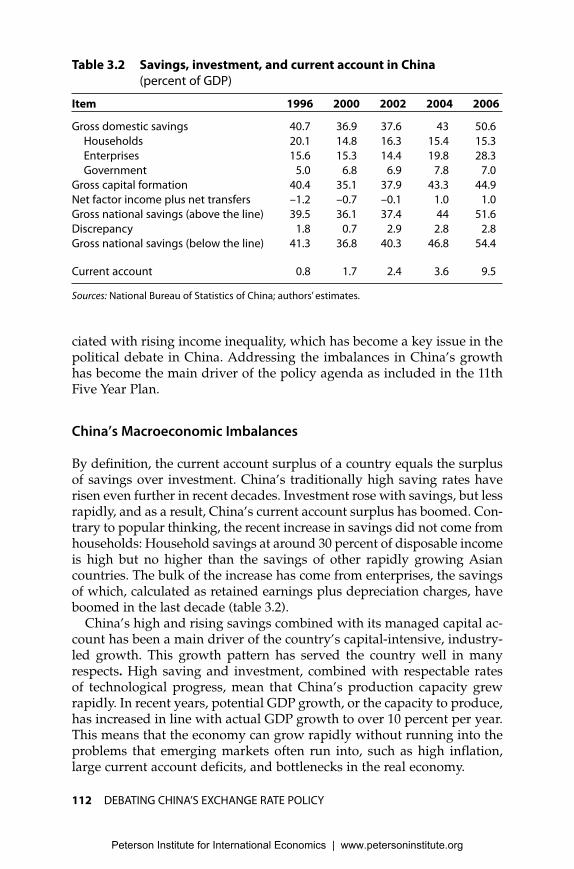
By definition, the current account surplus of a country equals the surplusof savings over investment. China’s traditionally high saving rates haverisen even further in recent decades. Investment rose with savings, but lessrapidly, and as a result, China’s current account surplus has boomed. Con-trary to popular thinking, the recent increase in savings did not come fromhouseholds: Household savings at around 30 percent of disposable incomeis high but no higher than the savings of other rapidly growing Asiancountries. The bulk of the increase has come from enterprises, the savingsof which, calculated as retained earnings plus depreciation charges, haveboomed in the last decade (table 3.2).
China’s high and rising savings combined with its managed capital ac-count has been a main driver of the country’s capital-intensive, industry-led growth. This growth pattern has served the country well in manyrespects. High saving and investment, combined with respectable rates of technological progress, mean that China’s production capacity grewrapidly. In recent years, potential GDP growth, or the capacity to produce,has increased in line with actual GDP growth to over 10 percent per year.This means that the economy can grow rapidly without running into theproblems that emerging markets often run into, such as high inflation,large current account deficits, and bottlenecks in the real economy.
Table 3.2 Savings, investment, and current account in China
(percent of GDP)
Item 1996 2000 2002 2004 2006
Gross domestic savings 40.7 36.9 37.6 43 50.6
Households 20.1 14.8 16.3 15.4 15.3
Enterprises 15.6 15.3 14.4 19.8 28.3
Government 5.0 6.8 6.9 7.8 7.0
Gross capital formation 40.4 35.1 37.9 43.3 44.9
Net factor income plus net transfers –1.2 –0.7 –0.1 1.0 1.0
Gross national savings (above the line) 39.5 36.1 37.4 44 51.6
Discrepancy 1.8 0.7 2.9 2.8 2.8
Gross national savings (below the line) 41.3 36.8 40.3 46.8 54.4
Current account 0.8 1.7 2.4 3.6 9.5
Sources: National Bureau of Statistics of China; authors’ estimates.
03--Ch. 3--109-130 3/26/08 8:53 AM Page 112
Peterson Institute for International Economics | www.petersoninstitute.org

REBALANCING CHINA’S GROWTH 113
At the same time, China’s growth pattern has its macroeconomic down-sides. First, it may not be possible to finance the current capital-intensivemode of growth in the long run. Over time, economic growth has in-creasingly relied on capital accumulation and less from employment andTFP growth. If China’s rapid growth continues in its current mode, the in-vestment rate will need to increase to 50 to 60 percent of GDP in thedecades ahead (table 3.3), which will be difficult to finance given the pres-sures for savings to fall, including from demographics. Moreover, invest-ment as such does not contribute to a population’s standard of living.
A second macroeconomic downside is that this pattern of growth hascreated fewer urban jobs than a more labor-intensive pattern and has inthe process increased urban-rural inequality. Industry creates fewer urbanjobs than services, and in 1993–2005, six-sevenths of the growth in indus-try has come from increased labor productivity instead of new employ-ment, with industrial employment growing 1.6 percent per year in 1993–2005, compared with value-added growth of 11.2 percent.
Third—and most central to the US debate about China—a significantpart of China’s growth stems from increasing production of manufactured
Table 3.3 Growth patterns on past trends (percent)
On past trends
Source 1993–2005 2005–15 2015–25 2025–35 2035–45
GDP growtha 9.6 8.3 6.7 5.6 4.6
Total employment growth 1.1 0.1 –0.5 –0.9 –1.1
Labor productivity growth 8.4 8.1 7.2 6.6 5.7
From TFP growth 2.8 2.5 2.2 1.9 1.6
From higher capital/labor ratio 5.3 5.3 4.7 4.4 3.8
From higher human capital 0.2 0.3 0.3 0.3 0.3
Investment/GDP ratio
(period average, percent) 37 44 49 55 60
Share of industry in GDP
(end of period) 49 50 50 51 n.a.
Share of employment in agriculture
(end of period) 45 38 36 33 n.a.
Urbanization rate (end of period) 43 50 52 55 n.a.
Urban-rural income disparity
(end of period)b 3.8 4 4.4 4.6 n.a.
n.a. = not applicable
TFP = total factor productivity
a. Potential GDP growth. In 2005–07, actual GDP growth is assumed to differ from potential GDP growth.
From 2008 onward, actual growth is assumed to equal potential.
b. 2002 prices.
Sources: National Bureau of Statistics of China; authors’ estimates.
03--Ch. 3--109-130 3/26/08 8:53 AM Page 113
Peterson Institute for International Economics | www.petersoninstitute.org

114 DEBATING CHINA’S EXCHANGE RATE POLICY
goods with a tendency to boost current account surpluses. Although de-mand and supply in China’s economy are growing broadly in line witheach other, a significant share of the demand comes from abroad, not fromChinese households and businesses. Under such an investment-heavy,export-oriented pattern of growth, production in China increasingly out-strips domestic demand. From an external perspective, accelerating man-ufacturing production means continued strong export expansion, whereasimport growth has been more subdued, partly because of increased importsubstitution. As a result, the current account surplus is rising steadily:Having reached 9.5 percent of GDP in 2006, it has become the key sourceof China’s impressive balance-of-payments surpluses. As the People’sBank of China buys the associated foreign exchange, it needs to sterilizethe purchases by issuing central bank paper, which creates tensions andrisks in its balance sheet, keeps domestic interest rates low, and has startedto feed a rapid rise in asset prices. A large difference between productionand domestic demand in China can contribute to global imbalances andtrigger trade tension, which could over time undermine other countries’willingness to further open up, and thus reduce growth prospects forChina to grow.
Environmental Strains
China’s heavy reliance on industry for growth has put increasing strainson the environment.
� The energy intensity (energy use per unit of output) is some 4 to 6times that of advanced countries, measured in current dollars. China’shigh share of industry in the economy, which is 4 or more times thoseof advanced countries, largely explains this discrepancy, but even atthe level of industry it is still some 1.5 to 2 times higher than it is in ad-vanced economies.5 The changing pattern of energy use has resultedin steeply rising consumption of fuels and increasing imports of pe-troleum (Berrah et al. 2007). Reliance on coal for 71 percent of the totalenergy consumed and the rapid spread of motorization has intensifiedair pollution and contributed to greenhouse gas emissions.
� Although the average pollution index for China’s cities has improvedin the past decade, poor air quality is still a very visible issue in China,and costly, especially in large cities: 16 of the 20 cities with the worstair pollution in the world are in China, and according to the State En-vironmental Protection Agency (SEPA), two-thirds of China’s urban
5. If measured in PPP in contrast, China uses as much energy per output as the UnitedStates.
03--Ch. 3--109-130 3/26/08 8:53 AM Page 114
Peterson Institute for International Economics | www.petersoninstitute.org

REBALANCING CHINA’S GROWTH 115
population breathes air of substandard quality. Particle matter, SO2,NOx, and other pollutants are, according to the World Health Organi-zation, the cause of 250,000 premature deaths each year. A recent studyby SEPA and the World Bank (2007b) estimates that the health costs ofair pollution amount to 3.8 percent of GDP. In addition, one-third ofChina’s landmass regularly experiences acid rain according to SEPA,causing an estimated damage of some $13 billion, or 1 percent of (2003)GDP per year.
� Water is becoming increasingly scarce relative to the nation’s require-ments. The country has only one-third of the world average in wateravailability and low efficiency of water usage: China used 537 cubicmeters of water to produce RMB10,000 of output, four times the worldaverage (World Bank 2007a). In individual industries, water usage is 5to 10 times that of advanced countries. The use of recycled water in in-dustry reached barely 50 percent, compared with 75 to 80 percent inadvanced economies.
Thus, despite China’s remarkable progress, it still has a long way to goto make its growth more environmentally sustainable. The route ahead islikely to be more difficult, as the relatively easy gains that were achievedby moving away from the inefficiencies of central planning have been re-alized already. Arguably, as China grows richer, the demand for higher en-vironmental standards will also grow, requiring the country to balance theapparently conflicting goals of economic growth and the environment.
China’s environmental issues also have a global dimension: The Inter-national Energy Agency estimates that the country will become the largestgreenhouse gas emitter in the world by the end of the decade; some saythe country already is.6
Rising Income Inequality
The current growth pattern has contributed to growing inequality. Accu-mulation of capital in urban industry has led to starkly widening produc-tivity differences, which in turn have led to large income inequalities.With an estimated Gini coefficient of more than 0.45, China is now lessequal than the United States and Russia and, given current trends, is akinto Latin American countries in income inequality.
China’s rising inequality resulted in part from the country’s devel-opment strategy. Heavy investment in manufacturing created jobs foronly a limited number of people, and urbanization and decline in low-productivity agricultural unemployment have been less than one wouldexpect based on China’s growth and level of income. China’s coastal
6. Data are from the World Bank, World Development Indicators 2007, and authors’ estimates.
03--Ch. 3--109-130 3/26/08 8:53 AM Page 115
Peterson Institute for International Economics | www.petersoninstitute.org

116 DEBATING CHINA’S EXCHANGE RATE POLICY
development strategy increased interprovincial inequalities, whereas thecountry’s household registration system hampered rural citizens in com-petition for higher-paying urban jobs.7 And China’s heavy reliance on in-vestment and manufacturing meant that urban formal-sector jobs rapidlybecame more productive, and wages rose in line. As a result, agriculturalincomes increasingly lagged behind average income per capita, contribut-ing to inequality. More recently, intraurban and intrarural inequality hasrisen as well.
Future Consequences of the Current Growth Pattern
Based on current trends, China’s three imbalances—investment- andindustry-driven growth, environmental strains, and income inequality—are likely to worsen. To illustrate this, we develop a growth scenario thatbroadly incorporates the features of past growth and extrapolates this tothe year 2035. The scenario is developed with the use of the computablegeneral equilibrium (CGE) model for the Chinese economy from the De-velopment Research Center (DRC).8
In the past-trend scenario, growth remains largely investment-led anddriven by industry. Thus it has high savings and high investment, withcorporate savings playing an important role while household savings alsoremains high. Patterns of employment growth and TFP are expected tocontinue as they have in recent decades, that is, employment grows some-what slower than the working age population and TFP edges downwardover time. This scenario is calibrated as follows. Employment is projectedusing demographic projections. Using a Cobb-Douglas production func-tion, we calculate how much investment is necessary to reach a target rateof growth of GDP, assuming some moderation of TFP growth over time.The target rate of GDP growth is over 8 percent from 2005 to 2015 andunder 7 percent from 2015 to 2025 (table 3.3).
The DRC’s CGE model suggests that with a policy setting on pasttrends, the share of industry in GDP (“secondary industry”) would in-crease another 3.5 percentage points between 2005 and 2035. The share ofservices (“tertiary industry”) would also increase by around 5.5 percent-age points in this period, but the tertiary sector would remain smaller thanthe secondary sector through 2035. The calibration mentioned above re-quires an investment-to-GDP ratio of almost 50 percent, on average, from2015 to 2025 and a higher percentage later. In this scenario, we assume that
7. China’s household registration system, or hukou, has been in place since the 1950s. Thesystem tied most citizens to their place of birth, as health care, education, social security,housing, and previously food grain were only available in a citizen’s locality of registration.
8. For a detailed description of the model, see He and Kuijs (2007).
03--Ch. 3--109-130 3/26/08 8:53 AM Page 116
Peterson Institute for International Economics | www.petersoninstitute.org

REBALANCING CHINA’S GROWTH 117
the policies that affect saving and investment patterns remain unchanged.Consistent with that, we find broadly extrapolated sectoral patterns ofsaving and investment. In particular, with unchanged policies affecting industry and services, dividends, the labor market, and the financial sec-tor, enterprise investment increases further over time in an increasingly industry- and enterprise–led economy, with the increase matched by higherenterprise saving.9 With unchanged policies on health, education, and thesocial safety net, household saving also continues to rise. In all, in line withrecent patterns, the current account surplus remains high despite high andincreasing investment.
In our industry-led scenario, energy and resource intensity would con-tinue to be high, and pollution and emissions would continue to riserapidly. Limited urban job creation would further accentuate urban-ruralincome disparity and overall inequality. Such a scenario would see onlymoderate urban employment growth and a moderate labor flow out ofagriculture, leaving a relatively large share of people employed in agricul-ture. In 2035, 33 percent of total employment would still be in agriculture,a high share for a country with a per capita income projected at $10,000 in2035 (in 2000 international prices). Consequently, urbanization would con-tinue, but at a modest rate, reaching around 55 percent in 2035. The pro-ductivity gap between agriculture and the rest of the economy would risefrom an already high 6 to over 8 times by 2025. The rural-urban incomedisparity would remain high, with urban per capita incomes 4.6 timeshigher than rural ones (in constant prices) in 2035, compared with 3.8times in 2006.10 Income inequality as measured by the Gini coefficient risesfurther, from 0.46 in 2005 to 0.48 in 2035.
The model suggests that it will be increasingly difficult for China tocontinue with its current pattern of growth, economically, environmen-tally, socially, and internationally. China’s government is fully aware ofthese constraints and is seeking to change China’s pattern of growth. Thecurrent 11th Five Year Plan has this new growth pattern as an explicitgoal. The harmonious society is seeking still rapid but more equitable andsustainable economic growth. A host of measures and policies to achievethis have been announced, and explicit targets on pollution and energyuse have been set in the plan and are being used to hold local governmentofficials accountable for results. The questions are whether such goals arefeasible and whether government has the tools to turn around currentgrowth trends. China’s past attempts to change the pattern of growth,
9. In the sectorally disaggregated saving-investment projections, we assume that householdinvestment and government investment are constant as a share of GDP. Much of enterpriseinvestment is saved by the enterprise sector, in line with recent patterns.
10. The urban-rural real income disparity is smaller than the productivity disparity becauseof factors including nonagricultural income of rural people.
03--Ch. 3--109-130 3/26/08 8:53 AM Page 117
Peterson Institute for International Economics | www.petersoninstitute.org
118 DEBATING CHINA’S EXCHANGE RATE POLICY
while modestly successful, have largely relied on administrative means.These means may not work effectively in China’s highly decentralizedenvironment, where local governments face stark conflicts among theemerging objectives of growth, environmental sustainability, and equity.
An Alternative Growth Strategy for China
Rebalancing the economy and striving for a harmonious society have nowfirmly become key economic policy objectives in China. As presented atthe National People’s Congress in March, the government’s 2007 workprograms indicated that, while rapid economic growth remains impor-tant, the government aims to improve the quality of economic growth, re-balance the growth pattern, and strive toward a harmonious society. Thegovernment would like to change China’s growth to be less intensive inresources and capital, cleaner, more knowledge driven, and more equallydistributed. On the macroeconomic side, the government would like tochange the composition of demand to rely more on consumption and lesson exports and investment and reduce the external surplus.11
Broadly, five types of policies would help rebalancing. In many of theseareas, policy plans or proposals are in the pipeline. That does not guaran-tee that they will be introduced soon, as it is difficult to implement poli-cies with short-term costs to certain segments of the population. The typesof policies we use to illustrate a rebalancing scenario are:
� several macroeconomic measures—largely fiscal—to stimulate domes-tic consumption, reduce saving, and stimulate the services sector;
� several price and tax measures to help rebalancing by readjusting therelative attractiveness of manufacturing production (tradables) overproducing services (nontradables);
� relaxed restrictions on the movement of labor and land transactions tofacilitate rural-urban migration and mitigate rural poverty. The fiscalsystem could be improved to provide host cities with more incentivesto deliver social services to incoming migrants;
� institutional reforms to give local decision makers stronger incentivesand better tools to pursue rebalancing. Central here is the performanceevaluation of local officials. The recent measure to include land rev-enues in the local government budget, rather than as part of the ex-trabudgetary funds managed by the land bureau, could improve thegovernance of these funds and reduce the incentive to pursue a land-intensive development pattern; and
11. These objectives are quantified by anticipative benchmarks in Special Column 2 of the11th Five Year Plan.
03--Ch. 3--109-130 3/26/08 8:53 AM Page 118
Peterson Institute for International Economics | www.petersoninstitute.org

REBALANCING CHINA’S GROWTH 119
� policies to help upgrade the production structure and promote the so-called knowledge economy, including well-targeted government sup-port for research and development and improving access to financing(e.g., venture capital) for innovators.
The above policy reforms have been modeled with the DRC’s CGEmodel. The second scenario, with rebalanced policies as discussed above,has more growth coming from services and less from industry (table 3.4).The contribution of the secondary sector to GDP declines by over 10 per-centage points through 2035, while that of the service sector increases by20 percentage points. On the expenditure side, more growth comes fromconsumption and less from investment and exports. In this scenario, con-tinued rapid growth would require significantly less capital accumula-tion. However, the rebalanced policies allow for higher TFP growth, withmuch of the improvement coming from greater reallocation of labor,largely from rural to urban. Thus the scenario has higher TFP growthfrom reallocation of labor, by about 0.6 to 0.8 percentage points, than the“on past trends” scenario, which is the broadly the same as the differencein nonhuman capital–related TFP growth between the two scenarios. Amore employment-friendly setting also allows for somewhat higher over-all employment growth: It is assumed that in this scenario employmentgrows in line with growth in the working-age population. This meansthat, even though saving and investment are significantly lower in thisscenario, GDP growth is the same.12 As a result, it is more balanced inthree aspects.
First, saving and investment decline significantly over time because ofpolicy reform. Saving and investment are significantly lower than in the“on past trends” scenario, with the investment-to-GDP ratio averaging amore sustainable 35 and 32 percent in the periods 2015–25 and 2025–35,respectively, compared with over 44 percent and almost 50 percent in the“on past trends” scenario over the same periods.13 This lower overall in-vestment-to-GDP ratio is more consistent with prospective long-termtrends in demographics and saving. As for sectoral patterns of saving,with policy reforms affecting the industry-services trade-off, dividends,the labor market, and the financial sector, enterprise saving is lower in aless capital-intensive, less industry-based economy.14 Reforms in health,
12. However, with a vintage-type capital stock, less new investment means less embodiedtechnological progress. This may be of particular importance for environmental standards.
13. Specifics about the long-term saving and investment projections and the estimated im-pact of policy reforms are discussed in Kuijs (2006).
14. In the sectorally disaggregated saving-investment projections, we assume that house-hold and government investment are constant as a share of GDP. Much of enterprise invest-ment is saved by the enterprise sector, in line with recent patterns.
03--Ch. 3--109-130 3/26/08 8:53 AM Page 119
Peterson Institute for International Economics | www.petersoninstitute.org

12
0
Table 3.4 Growth patterns in two scenarios (percent)
On past trends With rebalanced policies
Source 2005–15 2015–25 2025–35 2035–45 2005–15 2015–25 2025–35 2035–45
GDP growtha 8.3 6.7 5.6 4.6 8.3 6.7 5.6 4.6
Total employment growth 0.1 –0.5 –0.9 –1.1 0.5 –0.1 –0.5 –0.7
Labor productivity growth 8.1 7.2 6.6 5.7 7.7 6.8 6.2 5.3
From TFP growth 2.5 2.2 1.9 1.6 3.1 2.8 2.5 2.2
From higher capital/labor ratio 5.3 4.7 4.4 3.8 4.0 3.5 3.2 2.6
From higher human capital 0.3 0.3 0.3 0.3 0.5 0.4 0.4 0.4
Investment/GDP ratio (period average,
percent) 44 49 55 60 35 31 29 26
Share of industry in GDP (end of period) 50 50 51 n.a. 44 40 37 n.a.
Share of employment in agriculture
(end of period) 38 36 33 n.a. 29 18 12 n.a.
Urbanization rate (end of period) 50 52 55 n.a. 59 68 72 n.a.
Urban-rural income disparity (end of period)b 4.0 4.4 4.6 n.a. 3.2 2.8 2.8 n.a.
n.a. = not applicable
TFP = total factor productivity
a. Potential GDP growth. In 2005–07, actual GDP growth is assumed to differ from potential GDP growth. From 2008 onward, actual growth is assumed
to equal potential.
b. 2002 prices.
Sources: National Bureau of Statistics of China; authors’ estimates.
03--Ch. 3--109-130 3/26/08 8:53 AM Page 120
Peterson Institute for International Economics | www.petersoninstitute.org

REBALANCING CHINA’S GROWTH 121
education, and the social safety net allow household saving to decline asa share of GDP. In all, the current account surplus gradually declines overtime as a share of GDP.
Second, China uses fewer primary commodities and less energy andproduces less pollution. This is because it has less industry and, within in-dustry, less heavy and dirty industry, in large part because of better pric-ing of energy, commodities, and environmental degradation. The differ-ence in structure within these broader sectors is also quite interesting: Inthe rebalanced scenario, significantly less heavy industry and construc-tion but more education, science, and technology.
Third, the economy creates more urban employment and, as a result,more rural-urban migration, higher rural productivity and incomes, andless urban-rural inequality. Urbanization rises to 72 percent in 2035 com-pared with about 55 percent on past trends. At the same time, more ur-banization stimulates the services industry, including through the spend-ing patterns of urban residents.15 Combined, these factors mean moreurban employment growth and more transfer of labor out of agriculture.The share of employment in agriculture in this scenario falls to 12 percentin 2035.16 As a result, labor productivity in agriculture rises much faster,supporting higher incomes there. The decrease in the productivity gap be-tween agriculture and the other sectors underlies lower urban-rural in-come inequality. The ratio of urban over rural per capita income declinesto 2.7 in 2035, while the Gini coefficient decreases to 0.38 in 2035.
Conclusion
China’s rapid growth faces macroeconomic, environmental, and socialchallenges that have their origin in its pattern of growth. Using simula-tions with a CGE model, this chapter has shown that, on current trends,current account surpluses, environmental stress, and inequality are likelyto remain a feature of China’s growth. A policy package that reduces sav-ings, better prices capital and environmental damage, and allows formore labor movement is likely to produce better outcomes on all threecounts. The exchange rate plays a minor role in this package, and an ad-justment would mainly serve to limit expectations for an exchange rateappreciation and accompanying foreign capital inflows.
15. Urban residents spend 8 percentage points more of their income on services than dorural residents.
16. This may seem fast. However, it is not exceptional compared with experiences in othersoutheast Asian countries. South Korea witnessed a similar pace, from 50 percent in 1973 to10 percent in 2001. Malaysia decreased its agricultural employment from 37 percent in 1980to 18.4 percent in 2001.
03--Ch. 3--109-130 3/26/08 8:53 AM Page 121
Peterson Institute for International Economics | www.petersoninstitute.org

122 DEBATING CHINA’S EXCHANGE RATE POLICY
References
Barro, Robert J., and Jong-Wha Lee. 2000. International Data on Educational Attainment: Up-dates and Implications. CID Working Paper 42 (April). Cambridge MA: Center for Inter-national Development, Harvard University. Available at www.cid.harvard.edu.
Berrah, Noureddine, Fei Fang, Roland Priddle, and Leiping Wang. 2007. Sustainable Energyin China: The Closing Window of Opportunity. Washington: World Bank, Development Re-search Center of China, and Energy Sector Management Assistance Programme.
Chow, Gregory. 1993. How and Why China Succeeded in her Economic Reform. China Eco-nomic Review 4, no. 2: 117–28.
He, Jianwu, and Louis Kuijs. 2007. Rebalancing China’s Economy—Modeling a Policy Package.World Bank China Research Paper 7. Beijing: World Bank (September).
Hu, Zuliu, and Moshin Khan. 1996. Why is China Growing so Fast? IMF Working Paper 96/75(July). Washington: International Monetary Fund.
Kuijs, Louis. 2006. How Would China’s Saving and Investment Evolve? World Bank Policy Re-search Working Paper 3958. Washington: World Bank.
Kuijs, Louis, and Tao Wang. 2006. China’s Pattern of Growth, Moving to Sustainability andReducing Inequality. China and the World Economy 14, no. 1 (January): 1–14.
Ravallion, Martin, and Shaohua Chen. 2004. China’s Uneven Progress in Poverty Alleviation.Policy Research Working Paper Series 3408. Washington: World Bank.
Wang, Yan, and Yudong Yao. 2002. Sources of China’s Economic Growth 1952–1999: Incor-porating Human Capital Accumulation. China Economic Review 14, no. 1: 32–52.
World Bank. 2006. Where Is the Wealth of Nations: Measuring Capital for the 21st Century.Washington.
World Bank. 2007a. China: Towards a Resource Saving Society. Country Economic Memoran-dum for China (forthcoming). Washington.
World Bank. 2007b. Cost of Pollution in China: Economic Estimates of Physical Damages.Washington: Environment and Social Unit, East Asia Region, World Bank. Available athttp://siteresources.worldbank.org.
03--Ch. 3--109-130 3/26/08 8:53 AM Page 122
Peterson Institute for International Economics | www.petersoninstitute.org

COMMENT ON CHAPTER THREE 123
CommentApproaches to RebalancingChina’s Growth
KENNETH ROGOFF
China’s breathtaking economic growth continues to astonish the world.As Hofman and Kuijs illustrate, China is rapidly moving into a league allits own in the modern annals of growth, equaling and surpassing thepeak years of the Korean and Japanese miracles despite being an order ofmagnitude larger. How long can China’s growth be sustained?
The Hofman and Kuijs paper is useful particularly in its first part, inwhich the authors starkly illustrate the unsustainability of China’s currenttrajectory. Table 3.1, which decomposes Chinese growth into productivityimprovements, capital deepening, and labor reallocation, is particularlyimportant. The basic message is that, although productivity growth con-tinues to play a significant role, it accounts for only one-third of China’sgrowth from 1993 to 2005 versus 50 percent from 1978 to 1992. The esti-mated total factor productivity growth of 2.8 percent for the 1993–2005 pe-riod is still quite respectable and probably double that of the likely US ratefor the next decade. But considering how far China still lags behind theUnited States in income today, China will have to sustain ever-higher ratesof capital deepening to keep closing the gap at the rapid pace of recentyears.
Kenneth Rogoff has been a professor of economics at Harvard University since September 1999 andthe Thomas D. Cabot Professor of Public Policy there since January 2004. The author is grateful toAndrew Feltenstein for helpful discussions.
03--Ch. 3--109-130 3/26/08 8:53 AM Page 123
Peterson Institute for International Economics | www.petersoninstitute.org

124 DEBATING CHINA’S EXCHANGE RATE POLICY
Another important fact the authors emphasize is the importance of ris-ing enterprise saving in China’s phenomenally high saving rate. House-hold saving, at roughly 25 percent of disposable income, is actually fairlynormal in Asia. But the corporate sector has been enjoying phenomenalprofits, with wages falling sharply as a share of GDP down to less than 40percent. Low wages combined with high profit rates are at the heart ofChina’s sharply growing income inequality, perhaps even more so than in the developed world. The authors show that by standard measures (theGini coefficient), China’s income inequality is surpassing that of theUnited States and heading toward Latin American levels. Income inequal-ity is exacerbated by the very low returns suffered by China’s savers in fi-nancial markets, despite the country’s high rate of growth. Financial re-pression constitutes an enormous tax on China’s poor, who can expect toearn roughly 2.5 percent on their savings accounts in a country growing at10 to 11 percent per year. That said, most estimates suggest that China’s in-equality is not yet as extreme as Latin America’s though it has surpassedthe United States. The environment section of the paper shows that Chinacontains 16 of the world’s 20 most-polluted cities but observes that inmany cities, objective measures of pollution have not been getting worse.The problem, of course, is that urbanization is sprawling into the country-side, bringing pollution with it.
The paper’s presentation of the above facts is excellent. The model-based exercises in the second section of the paper, however, have some in-teresting ideas but lack sufficient transparency to make them terribly con-vincing. The authors use a computable general equilibrium (CGE) model,a nomenclature that no longer makes sense; with today’s easy access tocomputer simulation methods, virtually all macroeconomists use them tocalibrate their models, so the phrase “computable general equilibriummodel” no longer has any meaningful information or distinction. Eachmodel must be judged on its own merits, and unfortunately, the details ofthe model used here are to be found in other papers.
The first empirical exercise the authors conduct looks to be simply anextrapolation of current trends or something quite similar. It should bethought of as China’s trajectory based on unchanged policies. Even as-suming a fall in China’s growth to 8 percent for the next decade and 7 per-cent thereafter, China will have to invest 60 percent of its GDP to keep upthe pace of growth. Even for China, which has averaged investment of 37percent of GDP over the past decade, this looks nearly impossible. De-creasing returns to capital eventually have to set in, even with China’s stillvast unemployed-labor pool. Presumably, such a trajectory would eventu-ally force China to shift from being a net saver to a huge net borrower, notto mention the pollution implications. If this scenario were realized, onepiece of good news would be that China’s trade balance surplus wouldlikely evaporate. China would need to borrow massively even to maintain
03--Ch. 3--109-130 3/26/08 8:53 AM Page 124
Peterson Institute for International Economics | www.petersoninstitute.org

COMMENT ON CHAPTER THREE 125
a far more modest level of consumption than it currently enjoys. It mighteven need to borrow from the International Monetary Fund some day.
The second empirical exercise is supposed to be loosely grounded in analternative growth strategy that does all sorts of wonderful things, such as“advancing the knowledge economy,” introducing reforms to give localofficials better incentives, and fixing the tax system. How the authors man-age to calibrate these wonderful things within their modest empiricalmodel is hard to fathom. I do not know what to make of the calibration, al-though the numbers the authors crank out seem to be much more satis-factory than the extrapolation exercise. The authors talk about better pric-ing of energy. Does this mean relaxing price controls? This is very hard tohandle in any CGE model I know of; it would be interesting to hear morediscussion of what was actually done. How the authors can argue that ex-change rate adjustment is not important, when their model does not seemto have any meaningful monetary or financial sector, is also unclear.1
Turning Hofman and Kuijs’s analysis on its head, one might note that,to dispense with exchange rate adjustment, China needs to perform pol-icy reform miracles on numerous fronts, and fairly quickly given the po-litical obstacles. The exercise is interesting and the authors have earnedthe right to speculate given their excellent facts section. But the windowdressing of their CGE model does not seem to bring any great light be-yond the authors’ own expert judgments.
Hofman and Kuijs have written a very useful paper, and I learned a lotfrom it, but the final section on what China ought to do to make its growthsustainable would be better treated as a speculative flourish rather than acenterpiece.
References
Feltenstein, Andrew, Celine Rochon, and Maral Shamloo. 2007. High Growth and Low Con-sumption in East Asia: How to Improve Welfare while Avoiding Financial Failures. IMF Work-ing Paper 07/278. Washington: International Monetary Fund.
Lipschitz, Leslie, Celine Rochon, and Genevieve Verdier. 2007. Blessings in Disguise: SurplusLabor and Excess Saving in China. Washington: International Monetary Fund (November).
1. Applying a model with rational expectations and learning to China, Feltenstein, Rochon,and Shamloo (2007) show that current growth trends lead to excessive foreign direct invest-ment as well as increasing domestic investment. The resulting unanticipated fall in the re-turn to capital causes bank failures, higher interest rates, and yet more bank failures. The in-vestment boom collapses and growth declines. This happens after about nine years in adiscrete time simulation. Another approach to the same set of issues, with similar results, isLipschitz, Rochon, and Verdier (2007).
03--Ch. 3--109-130 3/26/08 8:53 AM Page 125
Peterson Institute for International Economics | www.petersoninstitute.org

126 DEBATING CHINA’S EXCHANGE RATE POLICY
CommentDomestic Imbalances and Data Ambiguities
BARRY BOSWORTH
Bert Hofman and Louis Kuijs’s paper summarizes recent research at theWorld Bank on the economic imbalances that have emerged in China inrecent years and simulations of potential policy responses. The imbal-ances are very evident on the external side in the form of a rapidly risingcurrent account surplus, which is likely to reach 12 percent of GDP in 2007and even higher in 2008. However, the imbalances are also evident in thedomestic economy in the form of a rapidly growing gap between domes-tic saving and investment. World Bank researchers have contributed sig-nificantly to efforts to measure the extent of the saving-investment imbal-ance within China as a counterpart to the more obvious worsening of thecountry’s external imbalance.
Two major themes emerge from the paper. First, as foreigners have fo-cused on China’s large external surplus, less attention has been paid to thelarge domestic surplus of saving over investment that Hofman and Kuijsargue is the driving force behind the trade imbalances. The authors assertthat the aggregate saving surplus is due largely to rapid increases is en-terprise saving and that the shares of household and government savingin income have been stable or declining in recent years. Second, the solu-tion to the imbalance is a series of reforms aimed at stimulating domestic
Barry Bosworth is a senior fellow in the Economic Studies Program (the Robert V. Roosa Chair in In-ternational Economics) at the Brookings Institution, where he has been a senior fellow since 1979 andserved as a research associate from 1971 to 1977.
03--Ch. 3--109-130 3/26/08 8:53 AM Page 126
Peterson Institute for International Economics | www.petersoninstitute.org

COMMENT ON CHAPTER THREE 127
demand. The authors outline a package of policy reforms and providesome results from a simulation model.
To begin, I would like to emphasize both how recent the emergence ofthe imbalances has been and how unexpected their magnitudes are. De-spite the common characterization of China as an example of export-ledgrowth, exports were a stable or declining share of GDP between the adop-tion of the fixed exchange rate in 1994 and World Trade Organization(WTO) membership at the end of 2001, and current account surpluseswere consistently small, seldom exceeding 2 percent of GDP. Predictably,China’s export and import growth both accelerated after joining the WTO,but again there was little change in the current account balance. The ex-ternal imbalance emerged only after 2005, when exports continued togrow rapidly while imports slowed and stabilized as a share of GDP. Thisis particularly surprising in that we can identify no significant change inthe exchange rate that would account for this pattern. On a trade-weightedbasis, China’s real exchange rate has remained relatively constant or evenappreciated slightly, while the dollar has experienced significant depreci-ation. The explanation for the break in the correlation of the two countries’exchange rates is that China’s trade is oriented toward Asia while theUnited States has a larger trade relationship with countries outside of theregion, for which the decline in the dollar’s value has been most dramatic.Some commentators question the continued surge of China’s exports, ar-guing that it might reflect overinvoicing as enterprises use the trade chan-nel to move funds into China in anticipation of revaluation. Others focuson the slowing of import growth, suggesting that it results from an em-phasis on import substitution from surging domestic production capacityin the areas of capital goods and basic metals.
The changes in the domestic saving-investment balance raise equivalentquestions. Apparently, national saving has suddenly come to exceed do-mestic investment by a stunning 12 percent of GDP. Many have noted thesmall role of consumption growth in domestic demand, but without gooddata we are unsure of the reason. The authors’ emphasis on enterprise sav-ing suggests that a significant part of the problem is that only a small por-tion of the growth in aggregate income is being passed through to house-holds. This contrasts with the more common explanation that, without asocial safety net, households save an unusually large portion of their in-come because of fears of illness or old age. Rather than focusing only oncreating a Western-style social safety net, the authors also propose a set ofmeasures designed to force the enterprises to pay out a larger portion oftheir profits. There are conflicting estimates of the appropriate distributionof Chinese saving between enterprises and households, yet the issueswould seem fundamental to adopting appropriate remedial measures.1
1. See a recent paper by Marcos Chamon and Eswar Prasad (2007) for a contrary perspec-tive on the relative roles of enterprises and households.
03--Ch. 3--109-130 3/26/08 8:53 AM Page 127
Peterson Institute for International Economics | www.petersoninstitute.org

128 DEBATING CHINA’S EXCHANGE RATE POLICY
The emphasis on enterprise saving suggests a possible role for foreigninvested enterprises, the exports and profits of which have increasedrapidly in recent years. With expectations of exchange rate appreciation,they have a strong incentive to retain their profits in renminbi. Finally, itis very difficult to fully integrate the evidence of external and internal im-balances because of a very large statistical discrepancy in the accountingrelations among saving, investment, and the current account.
It is easy for foreigners to focus on the exchange rate as a central featureof an expenditure-switching policy to reduce the imbalances, but Chinamust also be concerned about adjustments on the domestic side, given therisk that exchange rate changes alone could precipitate a recession. A con-siderable degree of uncertainty and conflicting interpretations of the dataremain, yet recent changes have left China with an unusual degree of ex-posure to developments in both the United States and the global econ-omy. The authors draw greater attention to the domestic side of the im-balance and need for policies to stimulate domestic demand. However, ifthe origins of the problem are on the domestic side, I am surprised at thespeed with which they have spilled over into the external sector with noslowing of domestic economic activity.
Finally, as a background to their rebalancing scenario, the authors use agrowth-accounting framework to assess the opportunities for sustainedgrowth in future years. Their view is that GDP growth will continue at ahigh rate over the next two decades, averaging 7 to 8 percent annually,compared with a rate just short of 10 percent from 1993 to 2005 (I preferto ignore the projections to 2035). While China still has a large reserve ofunderemployed labor and much room for a continued pattern of produc-tivity catch-up, the projection is inconsistent with past patterns, in whichthe growth of high-performing economies inevitably slowed over time.However, China has already become a truly exceptional case, and there isno firm basis other than probability for predicting a significant slow-down. Certainly, I would argue that one can discern no significant evi-dence of an impending slowdown in the available data. Instead, the great-est threat to China’s future growth is the imbalances, both internal andexternal, that have developed since 2005. China is now exposed to and de-pendent upon continued expansion of the global economy in ways that itwas not in the past. This may not bode well for China, as it appears thelong-predicted correction of the US external deficit and overvalued dollarhas now begun.
Hofman and Kuijs contribute to the literature in directing attention tothe domestic side of the economic imbalances that have developed withinChina’s economy since 2005. The global discussion of China’s role in theglobal economy has often focused too narrowly on exchange rate issues. Itis unfortunate, however, that the ambiguities of the data have left us so un-
03--Ch. 3--109-130 3/26/08 8:53 AM Page 128
Peterson Institute for International Economics | www.petersoninstitute.org

COMMENT ON CHAPTER THREE 129
certain about the causes of the growing gap between domestic demandand supply. The suddenness of its emergence and its size are disconcerting.
Reference
Chamon, Marcos, and Eswar Prasad. 2007. The Determinants of Household Savings in China.IMF Working Paper (forthcoming). Washington: International Monetary Fund.
03--Ch. 3--109-130 3/26/08 8:53 AM Page 129
Peterson Institute for International Economics | www.petersoninstitute.org

03--Ch. 3--109-130 3/26/08 8:53 AM Page 130
Peterson Institute for International Economics | www.petersoninstitute.org