Embed Size (px)
Citation preview

Friction in Granular Media
J. C. Santamarina & H. Shin Civil and Environmental Engineering, Georgia Institute of Technology, Atlanta, USA
ABSTRACT: Fine-grained and coarse grained granular materials exhibit normal-stress dependent frictional shear strength. The mineral-to-mineral friction mobilized at interparticle contacts emerges at the macroscale through a complex sequence of competing particle level processes. The observed frictional response of the soil mass varies with strain level; we can distinguish the constant volume friction angle, dilation angle, peak friction angle, residual friction angle after grain alignment, and post-granular-segregation friction angle. Compiled experimental data and particle-level simulations help identify the most relevant soil parameters that affect the frictional response in each case (including interfacial friction at boundaries). Other sediment conditions that affect frictional strength include: grain crushing, inherent anisotropy, intermediate stress, temperature, strain rate, vibration, pore fluid and contact-level adhesive forces. The measurement of soil friction is a boundary-value problem; information-intensive measurement methods may help overcome measurement limitations related to incomplete knowledge of boundary conditions.
1. INTRODUCTION
Friction denotes the normal-stress dependent energy loss when a medium is subjected to shear. The history of friction is briefly reviewed in Table 1, with emphasis on solid-to-solid friction.
The understanding of friction in granular materials remains challenging due to complexities in interparticle solid-to-solid friction, the role of surface topography in granular materials, the participation of multiple coexisting phenomena in upscaling interparticle friction to the macroscale of the granular medium, and the emergence of new phenomena. Specially, the grain size appears as an inherent length scale that prompts us to distinguish the macroscale shear response of fine and coarse grained materials.
In this manuscript we review the nature of friction in granular materials, identify differences in friction between fine and coarse grained sediments, and explore emergent phenomena in the load-deformation response of granular materials.
2. FRICTION BETWEEN TWO LARGE MINERAL SURFACES
Friction between two mineral surfaces involves multiple phenomena that take place at the thin interface between the two solid bodies, hence, it is affected by the physical-chemical characteristics of the external layer on minerals. These processes are explored next.
2.1 Surface Topography Surface topography plays a secondary role when large surfaces come into contact. Consider two rough surfaces approach each other (Fig. 1a). The tallest asperities interact first, deform elastically and the contact area is a non-linear function of the applied load (contact mechanics - e.g., Hertzian contact). Then, if shear resistance is a linear function of the contact area, the

Table 1: History of Friction Reducing Friction <3500 bc Mesopotamia The wheel ~2750 bc Egyptians Recognized differences between sliding on sand and on wet silt Early Theoretical Developments
1452-1519 Leonardo da Vinci The shear force T is independent of the apparent contact area The shear force T doubles when N doubles
1663-1705 G Amontons Re-discovered da Vinci's frictional laws. Suggested that friction is due to roughness and the overriding of asperities
1638-1744 JT Desaguliers More polished surfaces exhibit higher friction Hinted on adhesion
1736-1806 CA Coulomb Referred to Amontons observations. Kinematic friction is independent of sliding velocity. "Cohesion is zero… for newly-turned soils"
1766-1832 J Leslie While some asperities climb, others fall. Wondered about the source of energy dissipation
1885 O Reynolds Demonstrated the concepts of dilatancy (rubber bag filled with sand and water and connected glass tube).
Lubrication and Adhesion >XIX Hydrodynamic Lubrication - μ = f(sliding velocity) 1920's K. Terzaghi Shear strength in soils – Adhesion theory 1922 W Hardy, I Doubleday Boundary Lubrication: Lubricant binds onto surface
1939 IV Kragelsky Molecular-mechanical theory of friction (USSR). It does not necessarily imply adhesion or chemical bonding.
1948 DW Taylor Confining stress dependent dilatancy 1950 P. Bowden, D. Tabor Adhesion theory of friction (UK) Fundamental Understanding 1950's … BJ Alder, TE Wainwright Molecular dynamics (study of μ in the 1990's)
1957 JF Archard Considered the distribution of asperity heights to link Hertz f(N2/3) contact response with Amonton's f(N) observations.
1964 AW Skempton Studied the role of grain characteristics on φ residual 1970's P Cundall Discrete element modeling – BALL
1986 G Binnig, CF Quate, C Gerber Atomic force microscope
1990… Current
Noise-friction interaction Energy coupling Friction control/engineering Strain rate and other effects Measurement
linearity between the shear force T and the normal force N in Amontons' law is satisfied when asperity heights follow an exponential or Gaussian distributions (Archard 1957, Greenwood & Williamson 1966, Chapter 1 in Kragelsky & Alisin 2001). As the normal load increases, asperities deform plastically, the contact area is a linear function of the normal force acting on the asperity, and friction is a linear function of the applied load regardless of surface topography. In both cases, the precise distribution of surface topography has a secondary role on the sliding resistance between the two large surfaces. (Note: elasto-plastic contact response is explored using finite element simulations in Vijaywargiya & Green 2007; topography and elasto-plastic asperity effects are discussed in Kogut & Etsion 2004).
(a) (b)
Figure 1. Effect of surface topography. (a) Large surfaces: the true area of contact is independent of surface topography when contacts deform either elastically (exponential height distribution) or plastically. (b) Grains: the same scale of surface topography may cause interlocking between grains.

2.2 Dry-Friction - Transient Effects The shear resistance T is a function of the true contact area A and the yield strength at contacts σy, in agreement with the adhesion theory of friction: μ=T/N =Aσy/N (Bowden & Tabor 1950). Both components depend on shear velocity (Dieterich 1979 - part I - see constitutive equation in Ruina 1983, Dieterich & Kilgore 1994, Sleep 1997).
The true contact area A increases with duration of the interaction between asperities, A=a1+b1log(t/sec); this behavior is a consequence of creep at contacts, displacement of adsorbed layers, time for the interpenetration of asperities, and/or lower contact oscillations at low sliding velocity among others. The most immediate consequence of contact creep is the increase in mineral-to-mineral friction coefficient at low sliding velocity, ∂μ/∂v<0, reaching the static friction coefficient μo as v→0 (Fig. 2a). A decrease in friction with increasing velocity leads to stick-slip behavior, particularly in media with low stiffness and when the shear velocity is low. On the other hand, the yield stress increases with strain rate έ in most minerals σy=a2+b2log(έ.sec).
Time-dependent true contact area A(t) and strain rate dependent strength σy(έ) combine to cause frictional transients when the sliding velocity changes. Consider a sliding block being displaced at velocity v1 and then at v2 > v1 (Fig. 2b):
• when the velocity is v1, the true contact area is A1, the yield stress is σy1 and the friction coefficient μ1=T1/N =A1σy1/N.
• when the displacement velocity increases to v2>v1, the steady state true contact area decreases A2<A1, the yield stress increases σy2>σy1 (applies to most minerals), and the friction coefficient decreases to μ2=T2/N =A2σy2/N < μ1 because the effect of contact area prevails.
• however, immediately following the transition v1→v2, the contact area is still A1, yet its is now being sheared at a higher velocity and yield stress is σy2. Therefore, there is a transient μtrans=A1σy2/N so that a higher friction is measured immediately following the increase in velocity. The memory of A1 is short term and the friction coefficient soon converges to its steady state value μ2.
Conversely, a negative transient is observed when the velocity decreases. The transient length is about 10 μm in the experimental results shown in Figure 2c; limited data suggest an increase in transient length with asperity height (Dieterich 1979, Ruina 1983).
μ
velocity
μo
v1 v2
μ1 μ2
(a)
(c)
(b)
velocity
true area
yield shear strength
friction coefficient
v1
v2
A1
A2
σy1
σy2
μ1=A1σy1μ2=A2σy2
μtrans=A1σy2
displacement δ
δ
δ
δ
Figure 2. Mineral-to-mineral friction. (a) Velocity dependency. (b) Explanation of friction transient consistent with adhesion theory of friction. (c) Experimental data obtained with glass and acrylic plastic (Dieterich & Kilgore 1994).
velocity
true area
yield shear strength
friction coefficient
v1
v2
A1
A2
σy1
σy2
μ1=A1σy1μ2=A2σy2
μtrans=A1σy2
displacement δ
δ
δ
δ

2.3 Fluids – Shear velocity The presence of fluids adds velocity-dependency to the friction coefficient. If the sliding velocity is sufficiently high, a fluid layer forms at the interface. The fluid layer partially supports the external load through viscous resistance, preventing solid-to-solid contact, and leading to a reduction in rubbing friction. In this regime, resistance to sliding increases with velocity due to the hydrodynamic contribution (Fig. 3).
The fluid layer is squeezed by the normal load, and the thickness decreases at low sliding velocity, allowing for more pronounced solid-to-solid rubbing. In addition, the fluid viscosity increases when the fluid layer becomes thinner than ~10 Å (molecular interactions are discussed in the next section). Both effects contribute to the increase in friction coefficient as the sliding velocity decreases in the boundary lubrication regime (Fig. 3), ∂μ/∂v<0, and stick-slip behavior emerges. Finally, if the fluid does not bind to the mineral surface, the two surfaces may experience solid-solid contact and a marked increase in the friction coefficient follows (Fig. 3). Figure 3. The effect of fluids on friction - Stribeck curve (Taylor & Pollet 2000, Okawara & Mitachi 2003). Typically, the separation between surfaces decreases at low sliding velocities.
2.4 Energy loss Roughness, either geometrical or electrical, cannot explain losses as the energy gained by an asperity going down a peak is utilized by other asperities to climb other peaks (as noted by J. Leslie [1766-1832]). So, how is energy lost when shear takes place between two interacting mineral surfaces? Little energy is stored as strain energy when either smooth or rough mineral surfaces are sheared. Some energy remains as increased surface energy in newly created surfaces. The remaining mechanical energy is converted into some other form of energy through asperity crushing, wear, inelastic indentation, plastic work (deformation, adhesion-and-shear, material transfer from one surface to the other, ploughing), viscous losses and vibration (macroscale and molecular scale), the emission of elastic waves (from acoustic emissions to seismic activity), shear-induced polarization of double layers followed by ohmic losses and the emission of electromagnetic waves (i.e., seismo-electric coupling). All losses eventually end in heat.
3. GRAIN SIZE AS A DETERMINING SCALE
Surface undulations on otherwise planar surfaces determine the contact points between them (Fig. 1a), but have a minor effect on the frictional resistance between the two large surfaces. This is not the case in granular materials: surface topography not only defines contact points, but it may also cause interlocking and hinder grain rotation (Fig. 1b). In this section we recognize grains size as a fundamental length scale.
solid-to-solid rubbing
hydrodynamic friction
Fric
tion
Coe
ffic
ient
displaced fluid – dry friction
boundary layer friction
sliding velocity • viscosity / normal load

3.1 Scales in Granular Materials
Three geometric scales emerge in the study of friction in granular materials: • The grain size d: this is the inherent scale of the medium and it has immediate implications
on particle-level forces and the relevance of surface topography. • The size of interparticle contacts dc: Assuming a Hertzian contact and a normal load
estimated as N=σ'd2 (first order approximation for a simple cubic packing subjected to normal stress σ'):
gc3
3(1 )d 'd 2
− ν σ=
gG (1)
where Gg is the shear stiffness of the mineral that makes the grains. The size of contacts is typically dc/d=20-to-80 (Gg=10-to-50 GPa; σ'=100 kPa to 1 MPa). Then, a convenient definition for the length of roughness is ~d/100.
• The Debye-Hückel length ζ: This is the thickness of the diffuse double layer that forms on mineral surfaces and it depends on fluid permittivity and ionic conductivity; typically, ζ= 20-to-200 Å.
These scales have profound implications in interparticle friction.
3.2 Particle Size and Shape There is a fundamental change in the nature of particle formation and the ensuing particle shape when the particle size varies across the d=10-to-50μm region. Submicron particles (d<10μm) form through chemical synthesis and precipitation, and are often platy and made of phillo-silicates clay minerals (rod and spherical shapes are also found). However, when the particle size exceeds the micron-scale d>50μm, particle tends to be more rotund, and particle shape is a consequence of mechanical actions such as breakage, abrasion, and collisions.
The previous scales allow us to identify intermediate scales that define the particle shape and affect the frictional behavior of granular materials. Consider a sinusoidal oscillation of wavelength λ riding on top of a circular particle of perimeter πd; then (refer to Fig. 4): • Eccentricity λ~πd/2: promotes particle alignment during shear and the development of
residual shear strength • Angularity λ~d/10: promotes interlocking and hinders particle rotation • Roughness λ~d/100 (based on the observation that the size of contacts is dc/d=20-to-80):
involved in the generation surface friction μ, as described in the previous section (large surfaces).
Description sphericity roundness smoothness (as opposed to) (ellipticity or platiness) (angularity) (roughness)
wavelength λ~πd/2 λ~d/10 λ~d/100
alignment interlocking surface μ
Effect on group response
initial geometry
Figure 4. Scales in particle shape: eccentricity, angularity and roughness – Implications in upscaling contact-level particle interaction to the soil mass.

3.3 Size, Forces and Fabric Consider the particle self weight W=πd3ρg/6, the mean skeletal force N=σ'd2, and electrical DLVO forces (van der Walls attraction and double layer repulsion). Skeletal and self weight forces prevail for particles d>10-to-50μm. However, electrical interaction controls behavior for submicron size grains. If the medium is unsaturated (mixed fluid phase), capillary forces emerge and can play a dominant role when particles are smaller than 1 mm (Santamarina 2002).
The 10-to-50μm size boundary –also encountered above in the context of formation and shape- allows us to separate granular materials into coarse grained (larger than ~50μm) and fine-grained (smaller than 10μm). Fabric formation in coarse grained sediments is determined by the relative size of particles (measured by the coefficient of uniformity) and particle shape (Fig. 5a). Well graded sediments made of rounded particles tend to pack at a higher density than poorly graded sediments made of angular particles (Fraser 1935, Youd 1973, Shimobe & Moroto 1995, Miura et al. 1998, Cubrinovski & Ishihara 2002, Cho et al. 2006).
Fabric formation in fine grained sediments is determined by particle shape and interparticle electrical interactions that are a function of pH-dependent surface charge, differences in edge and face charges, electrical interparticle forces, and the ionic concentration in the pore fluid (Fig. 5b). Furthermore, individual grains may form conglomerates that effectively behave as coarser particles. Therefore, a wide range of fabrics can develop in fine grained sediments.
(a) Coarse grained soils:
grain size distribution and shape (b) Fine grained soils:
mineralogy and pore fluid chemistry
coefficient of uniformity, Cu
1 2 3 4 5 6 10
1.4
1.2
1.0
0.8
0.6
min
em
inm
ax
em
ax
0.8
0.6
0.4
0.2
coefficient of uniformity, Cu
1 2 3 4 5 6 10
1.4
1.2
1.0
0.8
0.6
min
em
inm
ax
em
ax
0.8
0.6
0.4
0.2
coefficient of uniformity, Cu
1 2 3 4 5 6 10
1.4
1.2
1.0
0.8
0.6
min
em
inm
ax
em
ax
0.8
0.6
0.4
0.2
pH
Edge IEP, pH≈7.2
Face or Particle IEPpH≈4
log(co)co=0.1-0.15 mol/L
kaolinitepH
Edge IEP, pH≈7.2
Face or Particle IEPpH≈4
log(co)co=0.1-0.15 mol/L
kaolinite
Figure 5. Fabric formation. (a) Coarse grained sediments (after Youd 1973). (b) Fine grained sediments (Palomino & Santamarina 2005)
3.4 Roughness and the Diffuse Counterion Cloud Water hydrates counter ions on mineral surfaces and precipitated salts that rest in the pore space. The interaction between thermal activity and electrical interactions results in the diffuse counterion cloud around mineral surfaces. The relative size between asperity height and adsorbed layer thickness determines different frictional regimes in sediments. (Note: the discussion of roughness in Figure 4 was in terms of the topography wavelength; in this section we address topography height).
Let's consider the Deby-Huckel length ζ as the characteristic distance for the electrical interaction between particles. Surface roughness will exert full control on friction when the asperity height h exceeds the thickness of the diffuse layer h>ζ (Fig. 6a). If the relative scale that defines roughness is established in terms of the particle diameter, say h/d~100, and we assume a nominal value ζ~10nm, then, surface roughness becomes important when particles exceed the micron size: d>100h~1μm. Conversely, the diffuse layer becomes important to sliding resistance when roughness decreases bellow the interaction distance h<ζ (Fig. 6b).

Figure 6. Mineral roughness (gray) and the thickness of adsorbed layers (black). (a) Rough surface h>>ζ: the adsorbed layer has limited effect. (b) Smooth surface h>ζ: the diffuse layer exerts a strong effect on the normal interaction between sliding surfaces and the resulting shear resistance.
3.5 Electrical Roughness - Friction in Fine-Grained Sediments So far, roughness refers to a topographic characteristic of mineral surfaces. "Effective
roughness" is also encountered at the atomic scale in otherwise topographically smooth mineral surfaces, such as in fine-grained clayey sediments: a test charge pulled parallel to the mineral surface experiences the energy wells associated to surface charges (Fig. 7a). The concept of electrical roughness can be extended from the atomic scale of surface charges to the particle scale: a test charge feels the undulating potential energy surface associated to the counter-ion clouds that surround particles (Fig. 7b). Resistance to shear is also caused by the hindered mobility of water molecules and counterions in thin layers (Fig. 7c – the oscillatory nature of the hydration force during normal displacement is a related effect). In fact, when the platy surfaces are displaced relative to each other, molecules go through a sequence of ordered-disordered, solid-fluid islands (Fig. 7d – molecular dynamic simulations reported in Persson, 1998 and references therein).
When two mineral grains are sheared passed each other, molecules and counterions are displaced relative to each other until the energy barrier is overcome, slip occurs and a new equilibrium configuration is reached (Fig. 7e – The schematic representation in Figure 7f is analogous to shear in metals - see Tabor 1992). Acoustic emissions are detected during shear even in fine grained bentonites (Matsui et al. 1980).
Adsorbed water layers become thinner as the effective stress increases. All processes in Figure 7 are accentuated in thinner layers: deeper energy wells, higher concentration of counterions, lower water mobility and higher shear strength of the water film (e.g., data in Israelachvili et al 1988). In other words, the shear resistance between two wet mineral surfaces increases as the effective normal stress increases; hence, the shear resistance at the particle level in wet phillosilicate clay minerals has the characteristics of boundary layer type frictional response, shown in Figure 3.
(a)
(b)
(c)
(d)
(e) (f)
Figure 7. Friction-related phenomena in fine-grained sediments. (a and b) "Electrical roughness" due to atomic-scale surface charges and particle-scale counterion clouds. (c) Bonds in thin counterion clouds and hindered mobility. (d) Solid-fluid islands during shear. (e & f) Evolution of shear displacement.
< 10Å
h ζ h ζ
(a) (b)
3.6 Summary: The Relevance of Grain Size
The previous discussion has identified critical changes in sediment characteristics and behavior between sediments with grain size smaller than 10μm and those larger than 50μm, on the bases of particle formation processes and particle shape, mineralogy, controlling particle level-forces, the development of fabric, and the relevance of roughness at contacts. Differences in the frictional response of fine-grained and coarse-grained sediments are identified in the following sections.
4. FRICTION IN SEDIMENTS
Contact-level shear resistance upscales through multiple particle interactions in the granular structure to eventually convey frictional strength to the granular medium. These mechanisms are explored in this section. First, we start with a particle-level estimation of the macroscale strain required to mobilize friction.
4.1 Strain level for frictional losses
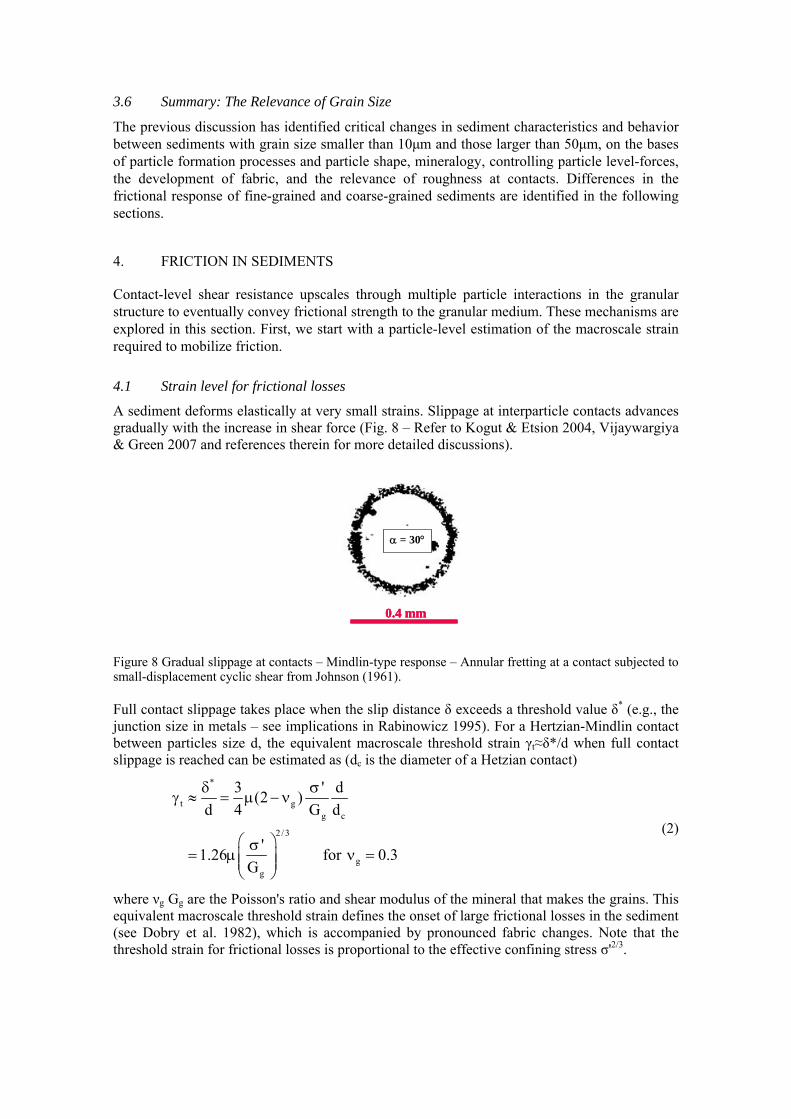
A sediment deforms elastically at very small strains. Slippage at interparticle contacts advances gradually with the increase in shear force (Fig. 8 – Refer to Kogut & Etsion 2004, Vijaywargiya & Green 2007 and references therein for more detailed discussions).
α = 30°
0.4 mm
α = 30°
0.4 mm0.4 mm
Figure 8 Gradual slippage at contacts – Mindlin-type response – Annular fretting at a contact subjected to small-displacement cyclic shear from Johnson (1961). Full contact slippage takes place when the slip distance δ exceeds a threshold value δ* (e.g., the junction size in metals – see implications in Rabinowicz 1995). For a Hertzian-Mindlin contact between particles size d, the equivalent macroscale threshold strain γt≈δ*/d when full contact slippage is reached can be estimated as (dc is the diameter of a Hetzian contact)
*
t gg c
2 /3
gg
3 ' d(2 )d 4 G d
'1.26 for 0.3G
δ σγ ≈ = μ − ν
⎛ ⎞σ= μ ν =⎜ ⎟⎜ ⎟
⎝ ⎠
(2)
where νg Gg are the Poisson's ratio and shear modulus of the mineral that makes the grains. This equivalent macroscale threshold strain defines the onset of large frictional losses in the sediment (see Dobry et al. 1982), which is accompanied by pronounced fabric changes. Note that the threshold strain for frictional losses is proportional to the effective confining stress σ'2/3.

4.2 Evolution of the granular skeleton during loading
The boundary stress applied to a granular medium is not supported uniformly by all grains, and the distribution of interparticle forces can be matched with Weibull or exponential functions (Dantu 1968, Gherbi et al. 1993, Jaeger et al. 1996).
The formation of columnar structures that resist most of the applied boundary stress is a salient feature in granular materials (Fig. 9a – see Drescher & De Josselin De Jong 1972, Oda et al. 1985). The particles that make the columns are primarily loaded in the direction of the applied principal stress. Particles that are not part of the main columns play a secondary yet very important role of preventing the buckling of the main chains; hence, the main forces acting on these secondary particles are normal to columns (Radjai et al. 1998 - see Fig. 9a).
(a)
?
(b) Free (c) Frustrated high e low e
Figure 9. Particle-level mechanisms during normal and shear loading: (a) Formation of granular columns. (b) Free rotation. (c) Rotational frustration (cause dilation or contact slippage).
Shear at contacts causes either rotation or slippage. Rotation is possible when the
coordination number is low and rotational compatibility is satisfied among all neighboring particles (Fig. 9b). However, high inter-particle coordination at low void ratio leads to rotational arrest or frustration (Fig. 9c). Rotational frustration is overcome by either frictional slippage at contacts, or local volume dilation to reduce the number of contacts among particles. The coordination number cannot become too low: the anisotropy in the polar histogram of contacts is limited by the buckling of load carrying columns; following buckling, the local volume contracts and the interparticle coordination increases.
The interplay between slippage-vs-rotation and dilation-vs-contraction explains: (1) the lower coordination number during shear when the interparticle friction is higher (angularity and roughness – Fig. 4 - see Thornton 2000), (2) the higher frictional resistance in well graded sediments as they tend to be denser and with higher coordination number (Fig. 5a), and (3) the continuous rebuilding of granular columns during shear to maintain a low coordination number.
The formation of particle columns highlights the development of marked fabric anisotropy within the sediment. In fact, the mobilized friction angle mobφ is directly related to the evolution of the internal anisotropy in contacts ac, normal force an and shear contact forces at (Rothenburg & Bathurst 1989)
c n tmob
a a asin2
+ +φ = (3)
Within this particle-level perspective, the macroscale friction angle at failure reflects the maximum internal anisotropy a sediment may sustain.
The two competing volume change tendencies of dilation and contraction reach statistical balance at large strains, and the granular mass shears at constant volume. This is the "critical state". Both loose and dense sediments evolve towards critical-state constant-volume shear at large strains. The void ratio at critical state depends on the effective mean confining stress p' as

cs 1kPap 'e e log
kPa⎛ ⎞= − λ ⎜⎝ ⎠
⎟ where ' ' '1 2 3p '
3σ + σ + σ
= (4)
where e1kPa is the critical state void ratio when the mean confining stress is 1 kPa. The critical state line defines two regions in agreement with particle-level mechanisms. (1) Contractive sediments start above the critical state line and contract during drained shear; these are either high void ratio sediments or sediments subjected to high confining stress. And (2) Dilative sediments which start bellow the critical state and experience volume expansion during drained shear; these are dense sediments and sediments that are confined at relatively low effective stress.
4.3 Macroscale frictional response: p cv r, , ,φ ψ φ φ The work to shear a granular material in direction 'x' (τδx) is consumed in frictional slippage at contacts to overcome friction in direction 'x' and in dilation against the normal confining stress σ' in direction 'y', that is y 'x 'x δσ+δμσ=δτ (Taylor 1948). Therefore, the measured peak angle of internal shear strength tanφp =τ/σ' is
p cvytan tan tanx
δφ = μ + = φ + ψ
δ (5)
where φcv is the constant volume angle of shear strength at critical state, and ψ is the dilatancy angle. The constant volume friction angle requires a minimum strain level in the order of γ~100% to attain particle rearrangement into a new fabric that is compatible with constant volume shear, independently of the initial fabric. Bolton (1986) simplified Rowe equations for stress-dilatancy under plane strain conditions to obtain an approximate expression for the peak friction that satisfies experimental data gathered for sands
p cv 0.8φ = φ + ψ (6)
Particle alignment takes place at large strains when eccentric particles are involved (the particle length ratio may be as low as ~1.1 to bring about the effects of particle eccentricity - Rothumberg & Bathurst 1993). The friction angle decreases as particle alignment takes place. The residual friction angle φr is attained when strains exceed of γ>100% and particles become aligned with respect to the failure plane.
4.4 Failure envelope
The constant volume friction angle and the residual friction angle do not change with the normal effective stress, therefore, a linear Coulomb-type model applies in both cases
' tanτ = σ φ applies to constant volume and residual conditions (7)
This is not the case for the peak friction angle, due to the stress-dependent dilatancy ψ. Therefore, the envelope for peak strength is steep at low stress and gradually approaches the constant volume shear (i.e., no dilation) at large confining stress. Then, the peak strength envelope can be piece-wise fitted with a straight line of the form
*p c ' tanτ = + σ φ* piece-wise fit to peak strength (8)
where c* and φ* are stress dependent. This expression conveys the wrong sense of cohesive strength c* when none may be present in the granular material. A better approach is to adopt a curved envelope (e.g., jointed rock mass - Hoek & Brown 1980)
p 'βτ = ασ global fit to peak strength (9)
The effect of the intermediate stress σ2 on shear strength, and alternative failure envelopes are discussed later in this manuscript.

5. EMPIRICAL AND NUMERICAL RESULTS
5.1 Constant Volume Friction Angle Experimental and discrete element numerical studies have been conducted to evaluate the relationship between the interparticle friction coefficient μ and the constant volume friction angle φcv. The group of studies summarized in Figure 10 lacks a clear trend, however, some observations can be extracted by focusing on individual investigations. The increase in inter-particle friction produces a pronounced increase in macroscopic friction φcv for low μ-values, but a minor change at high interparticle friction; this macroscale response reflects the transition from a dominant particle sliding motion at low μ, to dominant rolling motion at high μ (Skinner 1969 – Clearer trends shown for φp in Section 5.3). In terms of tangent values, tanφcv increases by only 7% for a change in interparticle friction from μ=0.2 to μ=0.5 (Kruyt & Rothenberg 2006). Furthermore, numerical results show that constant volume friction angle does not exceed φcv≈ 40° even when the interparticle friction approaches infinite, μ→∞ (see Yimsiri 2001, Rothenburg & Kruyt 2004).
0
10
20
30
40
50
0.0 0.2 0.4 0.6 0.8 1.
Interparticle friction μ
Con
stan
t vol
ume
fric
tion
angl
e
φc
v [de
g]
0
Figure 10: Constant volume friction angle φcv as a function of interparticle friction coefficient μ. Symbols: (⎯)theoretical solution from Horne (1969), ( )experiments from Skinner (1969), ( ) DEM 3D from Thornton (2000), ( ) DEM 2D from Kruyt and Rothenberg (2006), ( ) experiments from Rowe (1969).
The constant volume friction angle φcv is more than just mineral friction: particle eccentricity, angularity and roughness hinder particle rotation, promote looser packing and affect the evolution of anisotropy. This is confirmed by experimental data gathered with natural and crushed sands (φcv increases with particle angularity – Fig. 11a – see also Sukumaran & Ashmawy 2001), and triaxial compression tests run on specimens made of steel ball bearings with different degrees of rust (φcv increases with surface roughness – Fig. 11b). Once again, roughness may be of electrical nature. For example, when the molecular weight of a steric stabilizer increases, the layer around mono-dispersed polystyrene particles conveys higher "electrical roughness", and the viscosity of suspensions increases (Castle et al. 1996).

φcv = 42 -17 R (r2 = 0.84)10
20
30
40
50
0 0.2 0.4 0.6 0.8 1
Roundness, R
Crt
ical
stat
e fr
ictio
n an
gle,
φcv S < 0.7
S > 0.7
φcv = 42 -17 R (r2 = 0.84)10
20
30
40
50
0 0.2 0.4 0.6 0.8 1
Roundness, R
Crt
ical
stat
e fr
ictio
n an
gle,
φcv S < 0.7
S > 0.7
0
10
20
30
0.0 0.5 1.0 1.5 2.0 2.5
Vertical strain [%]
Mob
ilize
d fr
ictio
n an
gle
[deg
]
As receivedMild rustRusted
Rusted
PolishedMild rust
computed size of Hertzian contact
0
10
20
30
0.0 0.5 1.0 1.5 2.0 2.5
Vertical strain [%]
Mob
ilize
d fr
ictio
n an
gle
[deg
]
As receivedMild rustRusted
Rusted
PolishedMild rust
Rusted
Polished
computed size of Hertzian contact
Mild rust
computed size of Hertzian contact
Figure 11: Constant volume friction angle and particle shape. (a) Particle roundness - Natural and crushed sands (Cho et al 2006), (b) Particle roughness (Santamarina & Cascante 1998).
5.2 Dilatancy Angle
The rate of volume change defines the dilatancy angle ψ. The dilatancy angle can be inferred from strain measurements in triaxial compression testing as tanψ=Δεvol/Δεaxial. The maximum rate of dilation coincides with the peak strength in uncemented dense soils. This is not the case in cemented soils, where dilation starts as the peak strength is overcome; often, this is the case in highly OC clays as well (Terzaghi, et al 1996).
Dilatancy is determined by the distance between the initial eo-po' state of the sediment and the critical state line. In clays, the eo-po' state is defined by the stress history: "normally consolidated" clays are contractive, while "heavily overconsolidated" clays are dilative.
The initial void ratio eo in sands depends on the depositional method and ensuing packing density; in general, most natural sands are dilative at shallow depth. Let's define the "state parameter" Ε=eo-ecs as the distance between the initial void ratio eo and the void ratio at critical stress ecs at the initial mean effective stress (Equation 4). Then, the dilatancy angle is inversely related to the state parameter as conformed by experimental data summarized in Figure 12.
Figure 12: Dilatancy in sands as a function of the initial eo-po' state. (a) Definition of the state parameter Ε=eo-ecs. (b) Dilatancy angle ψ as a function of the state parameter E (Been & Jefferies 1985) The following additional observations and special cases are relevant to the understanding of dilatancy: • Particle geometry (eccentricity, angularity and roughness) and grain size distribution affect
dilatancy in two ways: (1) they affect initial fabric formation: the higher μ the higher the values of emin and emax, and (2) they determine the position of the critical state line. For the
-4
0
4
8
12
-0.3 -0.2 -0.1 0.0 0.1
tate parameter E
Dila
tanc
y an
gle
ψ [d
eg] 16
20
24
S
Kogyuk sand(0~10% fines)Beaufort sand A (2~10% fines)Beaufort sand B (5% fines)Banding sand, Hauchipato sand (Castro 1969)Hokksund sand (NGI)Monterey no. 0 sand (Lade 1972)
e
(a) (b)
(a) (b)
contractive
ecs Ε eo λ
dilative
po' p'

same initial packing density, dilatancy increases with interparticle friction μ (Kruyt & Rothenburg 2006, Guo & Su 2007).
• A dense packing of identical spheres exhibits a dilatancy angle as high as ψ=30°. Such a high angle of dilatancy is also observed in dense sands at very low confinement (microgravity study by Sture et al. 1998), and in locked sands (ψ~31° - Dusseault & Morgenstern 1979).
• Lightly cemented soils shear into blocks. This blocky granular material exhibits high dilation during shear (even when the uncemented medium would be contractive at the void ratio).
• Dilatancy is hindered by high confinement, and grains may crush rather than override (discussed later in the text).
• Shear localization limits the dilatancy a soil may exhibit at the macroscale
5.3 Peak Friction Angle
The peak friction angle is a combination of dilatancy and constant volume shear (Equations 5 and 6). Therefore, the peak shear strength can be estimated from data presented in the previous sections. Nevertheless, corroborating information is presented herein, most of it based on DEM simulations that permit testing exactly the same fabric but with different interparticle friction coefficients (Note: it is easier to study peak strength than large-strain constant volume shear in DEM simulations). Results compiled in Figure 13 confirm the early rise in peak friction angle at low interparticle friction coefficient μ, and the asymptotic trend towards strength saturation at large μ. when dominant rotational motion reduces the impact of interparticle friction.
0
10
20
30
40
50
0.0 0.2 0.4 0.6 0.8 1.0
Inter-particle friction coefficient μ
Peak
fric
tion
angl
e φ
peak
[deg
] Rotation
Slippage
Figure 13: Peak friction angle φpeak as a function of interparticle friction coefficient μ. Symbols: Experiments: (Suiker & Fleck 2004). 2D-DEM simulations: (Kruyt & Rothenberg 2006). 3D-DEM simulations: (Thornton 2000); (Suiker & Fleck 2004); the following four groups of 3D-DEM simulations are by Yimsiri (2001): Drained TC , Undrained TC , Drained TE , Undrained TE . Finally, the symbol represents 3D-DEM simulations by the authors.
5.4 Residual Friction Angle - Platy Particles (Clayey Sediments and Micaceous Sands) -
Platy particles align at large strains (in excess of 100%) and cause a decrease in the shear strength of the medium, which is reflected in a low residual friction angle φr. The residual shear strength depends on particle shape, mineralogy and hardness, grain size (indirectly related to shape), and grain size distribution. Eccentric particles do not affect the residual strength when their mass fraction is lower than ~10%, and they fully determine φr when they exceed ~25% (Koerner 1970, Lupini et al. 1981, Skempton 1964, 1985). These observations apply to micaceous soils as well (Lee et al. 2007).
The following clay characteristics are correlated: thin atomically smooth small particles, low skeletal force on each particle, high relevance of electrical interparticle forces, and high

plasticity index. Then, the friction angle can be correlated with the plastic index IP (in this context, IP becomes an indirect measure of geometric characteristics – Fig. 14):
IP250
r 32 e−
φ = (10)
Soils that experienced high biological activity during formation deviate from this trend. Diatoms and foraminifers increase the porosity of the soil (i.e., its ability to retain water and the measured plastic index), contribute roughness and promote interlocking. Therefore, diatomaceous soils exhibit high IP and high φ values. Examples of these soils include (Fig. 14):
• Ariake Clay "AC" (Japan. Ohtsubo et al. 1995, Tanaka et al. 2001). Marine, smectite, clay fraction 50%, diatoms: PI= 60-to-100, φr=46˚-to-57˚.
• Bangkok Clay "BC" (Tanaka et al. 2001). Normally consolidated marine clay, smectite, clay fraction 50%, pellets: PI= 30-70, φr= 37˚.
• Bogota Soil "BS" (Moya & Rodriguez, 1987). Volcanic, lacustrian. Kaolinite, montmorillonite and diatoms: PI= 100-to-170, φr=35˚.
• Cooper Marl "CM" (Charleston, USA. Camp et al. 2002). Marine, soft, very fine grained (≤ 0.002 mm) impure carbonate deposit with fossils (foraminifers): PI= 30-40, φr= 43-46.
• Mexico City Soils "MC" (Diaz-Rodriguez et al. 1992, Diaz-Rodriguez et al. 1998). Volcanic, lacustrine. Montmorillonite and illite, clay fraction 20-55%. Silica polymorphs (e.g., biogenic opal, cristobalite). Microfossils (diatoms and ostracods): PI= 400-to-500, φr= 43˚.
0
10
20
30
40
50
0 50 100 150 200
Plastic Index Ip [%]
Fric
tion
Ang
le [d
eg]
AC
BC
CM
BS
MC
IP250
r 32 e−
φ =
Figure 14. Residual Friction Angle vs Plastic Index - Data digitized from Terzaghi et al. (1996). Blocks show anomalous soil response data discussed in the text (Sections 5.4 and 6.7).
Additional insight is gained from data gathered at very high effective stress levels, typically above σ'>100 MPa. The coefficient of friction measured under dry conditions ranges from μdry=0.2 (graphite) to μdry=0.8 (e.g., montomorillonite, gibbsite and kaolinite), and friction correlates with interlayer bond strength, i.e., shear consists of creating new cleavage surfaces and breaking the interlayer bonds in the minerals (when μdry<0.8; if μdry=0.8, shear involves abrasion, wear, fracture and rolling). The addition of water causes μwet to decrease (e.g., μwet~0.3 in montmorillonite); in this case μwet reflects the shear resistance along structured adsorbed water in thin films (Moore & Lockner 2004). The value of μwet increases as the effective stress increases and adsorbed layers become thinner. In addition, the value of μwet increases with increasing temperature (in the hundreds of degrees Celsius), unless other effects arise such as mineral dissolution (Moore & Lockner 2007).

6. OTHER EFFECTS ON FRICTION
Other material properties and boundary conditions that affect the friction angle in sediments are reviewed in this section
6.1 Grain Crushing
Grain crushing may replace contact shear and dilation as an alternative, lower-energy deformation mechanism at high confining stress (relative to the particle strength). Therefore, the emergence of crushing is accompanied by volume contraction and results in a lower peak friction angle (experimental results in Fig. 15. DEM numerical results with crushable particles show similar trends - Cheng et al. 2004). The decrease in friction angle reaches asymptotic conditions: crushing produces angular particles and an increase in coordination number as smaller particles fill voids and add contacts among pre-existing particles. The large-strain critical state friction angle shows limited sensitivity to crushing (Vesic & Clough 1968, Coop & Atkinson 1993).
25
30
35
40
45
0.1 1.0 10.0 100.0
Normal stress at failure [Mpa]
Peak
fric
tion
angl
e ≅
peak
[deg
]
Axial compression
Axial extension
0.0
0.1
0.2
0.3
0.4
0.1 1.0 10.0 100.0
Normal stress at failure [Mpa]
Har
din'
s re
lativ
e cr
ushi
ng p
aram
eter
Axial compression
Axial extension
(a) (b)
Figure 15. Grain crushing and friction angle. (a) Peak friction angle, (b) Hardin’s relative breakage parameter (Yamamuro & Lade 1996)
6.2 Inherent Fabric Anisotropy
Sedimentation in a gravity field produces inherent fabric anisotropy because eccentric particles tend to align transverse to gravity. Idealized cases in Figure 16 suggest that dilation and peak strength are affected by inherent fabric anisotropy, so that measured parameters depend on the direction of the specimen α with respect to the deposition direction.
Consolidation under zero lateral strain Ko-conditions produces inherent fabric anisotropy as well. The minimum peak strength is measured when the shear plane aligns with the particle orientation in both sands and clays (Ladd 1977, Jamiolkowski et al. 1985, Tatsuoka et al. 1986, Vaid & Sayao 1995, Kurukulasuriya et al. 1999, Lade & Kirkgard 2000, Guo 2008).
Figure 16: Friction angle, inherent anisotropy and stress path. Axial compression AC. Simple shear SS. Axial extension AE. Parameters: b=(σ2-σ3)/ (σ1-σ3); α: angle between the particle normal and σ1.
AC: b=0 α=0 AE: b=1 α=90 SS: b>0 α>0

6.3 Stress Induced Anisotropy – Intermediate Stress
The angle of repose is a simple measurement of the critical state friction angle of sands (Cho et measured using a
or an inside flow cone φint (i.e., by
Figure 17. Friction anisotropy (natural and crushed sands). The angle of repose measured on an internal flow cone is significantly larger than the angle of repose measured on an external cone
al. 2006). However, different values are obtained when the angle of repose is standard cone geometry, φext, a planar sliding surface,removing a central plug beneath a filled cylinder). Data in Figure 17 show that the internal angle of repose φint is significantly greater than the external angle φext. A possible explanation follows: (1) the internal flow cone experiences a gradual reduction in cross section, sliding particles come closer together, and the interparticle coordination in the annular direction increases, while (2) flow on the external slope experiences a gradual increase in cross section, sliding particles move away from each other, and the coordination number decreases.
20
30
40
50
20 30 40 50 60Angle of repose - External slope
Ang
le o
f rep
ose
- Int
erna
l s60
lope
φint=1.5φext φint=φext
Further insight is obtained by exploring discrete element simulations. The evolution of the polar distribution of contacts, average normal contact force N(θ) and average shear contact force T(θ) in direction θ during axial compression AC (b=0) and axial extension AE (b=1) tests are
grees of freedom for particle rotation and for chain buckling in AC (even when the
shown in Figure 18 (3D micro-mechanical simulations - Chantawarangul 1993; see also Rothenburg & Bathurst 1989, Thornton 2000). The following observations can be made: • Contact normals during anisotropic loading become preferentially oriented in the direction
of the main principal stress σ1, in agreement with observations made above (see also Oda 1972).
• The main reduction in inter-particle contacts takes place in the direction of the minor principal stress: σ2 and σ3 directions in AC, and σ3 direction in AE. This situation allows for more detotal coordination number at failure is about the same in both cases).
• These volume-statistics of the particle-scale response provides insight into the observed effective peak friction angle (macroscale - numerical results presented in the lower frame of Fig. 18): higher friction angle is mobilized in AE than in AC. Furthermore, the lack of particle displacement in the direction of plane strain hinders rearrangement and causes an even higher peak friction angle in plane strain loading. The critical state friction angle obtained in numerical simulations follows a similar trend, but with less pronounced differences.
• Results by Chantawarangul (1993 - not presented here) also show that early volume contraction before the peak strength is more pronounced in AE than in AC tests; this observation is relevant to the interpretation of undrained strength.
Experimental and numerical results presented in Figures 17 and 18 show that the shear strength of a soil reflects restrictions to particle motion established at the level of contacts (sliding resistance, frustration, and crush-resistance), but conditioned by the boundaries.

At peak deviatoric load 3D Distribution
of:
(a) Isotropic confinement
(b) Axial Compress. b=0
(c) Axial Extension b=
1
Cont
act n als orm
Average Normal
ontact Force NC (θ)
Average Shear Contact Force T(θ) (magnified 5 times)
riction angle F
peak
critical state
plane strain
AC AE b=(σ2-σ3)/(σ1-σ3)
Figure 18. Numerical sim ion: Evolution of inter-particle contacts (polar histogram) and average normal and shear contact forces (pol plots) during axial compression and axial extension loading. Variation in friction angle with the inte diate stress σ2. d from Cha arangul (1993).
SS, and b=1 in axial extension AE. In both sands and clays (based on data compiled by Mayne and
e compatible with the Coulomb failure criterion
ulatar rme Figure compile ntaw
Experimental data for sands and clays (Fig. 19a,b) corroborate angle of repose measurements
in Figure 17 and DEM simulations results in Figure 18. The intermediate stress is captured in the coefficient b=(σ2-σ3)/(σ1-σ3): b=0 in axial compression AC, b~0.3-0.4 in plane-strain shear D
Holtz, 1985):
DSS AE AC1to1.5φ > φ ≈ φ (11)
Stress-induced strength anisotropy is not captured in the Coulomb failure criterion: the largest Mohr circl ' tanτ = σ φ is defined in terms of σ1- σ3, so there is not effect of σ2.
1 3
1 3 at failure
sin σ − σφ =
σ + σ (12)
Other failure envelopes have been proposed to take into consideration the intermediate stress. These are summarized in Table 2
and plotted in Figure 20.

20 30 40 50
20
30
40
50
60
φC compression
φ E e
xten
sion
φE=φC
φE=1.5φC φ
(a) (b)
Figure 19. The effect of the intermediate stress on friction angle. (a) Sands - data from different authors ompiled by Ladd et al. (1977) – Compare with Figure 18. (b) Clays: friction angle measured in AE b=0 nd AC b=1 loading paths - from Mayne & Holtz (1985 - Most specimens are normally consolidated
ailure Criterion Reference
d by Ladd et al. (1977) – Compare with Figure 18. (b) Clays: friction angle measured in AE b=0 nd AC b=1 loading paths - from Mayne & Holtz (1985 - Most specimens are normally consolidated
ailure Criterion Reference
caaunder Ko conditions). More recent results for peak friction in sands can be found in Lade (2006) and for kaoline in Lin & Penumadu (2005) and references therein. Table 2. Failure Criteria
under Ko conditions). More recent results for peak friction in sands can be found in Lade (2006) and for kaoline in Lin & Penumadu (2005) and references therein. Table 2. Failure Criteria FF
2D1 1J cos( ) sin(⎛ ⎞θ +⎜ 1)sin( ) J sin( ) 0
3φ θ − φ =⎟
⎠
where
3⎝
3D3/ 2
2D
J3 3sin(3 )2 J
θ = − Mohr-Coulomb
1 2I I − η 3I 0= where 2
2
9 sin1 sin
− φη =
− φ Matsuoka & Nakai (1974)
31 3I I− η = 0 where ( )
( )
3
2
3 sin1 sin co
ηs
− φ=
− φ φ Lade & Duncan (1975)
Note: stress invariants are 31 1 2I = σ + σ + σ3 , 3 1 2I = σ σ σ , ' 'ij ij
122DJ = σ σ , ' '
3D ij jk1J3
= σ σ σ'ki .
0
10
20
30
40
0.0 0.2 0.4 0.6 0.8 1.0
b=(σ2-σ3)/(σ1-σ3)
Fric
tion
angl
e [d
eg]
Mohr-Coulomb
Matsuoka and Nakai (1974)
Lade and Duncan (1975)
Figure 20. Failure envelopes. (a) In the σ1-σ2-σ3 space. (b) Friction angle anisotropy predicted for the diff nt failure criteria – values compu using the definition in Equation 12 (Note: a friction angle of φ=30˚ is assigned to triaxial compression b=0)
ere ted
σ1
σ 2 σ3
(a) (b) Mohr Coulomb Matsuoka and Nakai (1974)Lade and Duncan (1975)TC
TE

6.4 Temperature
The increase in temperature -above frozen ground conditions- can cause densification (phenomenon is known as thermosmotic consolidation - Campanella & Mitchell 1968), increase
with the consequent decrease in effective stress and shear strength, and Within the range of common geomechanical applications (T<100ºC), the
, Abuel-l & Baldi 1990 for Pontida
in pore fluid pressureeven mineral melting.effect of temperature on the frictional resistance of soils can be summarized as follows • coarse grained sediments: they experience limited or no effect. • fine grained sediments: (1) no effect on the constant volume friction angle (Fig. 21 – left
pane), and (2) increase in peak friction angle with temperature (Fig. 21 – right pane) probably due to densification by thermal consolidation (Cekerevac & Laloui 2004Naga et al. 2007 – contradictory results are reported in Hueckeclay).
Note that even normally consolidated clays exhibit a peak friction angle at high temperature, even though they are expected to be contractive at room temperature (Fig. 21 – right pane).
0
10
20
30
40
50
e
φc
v [de
g]
10 30 50 70 90 110
Temperature [°C]
Con
stan
t vol
ume
fric
tion
a
db
ef
c
ngl
a
15
20
25
30
20 40 60 80 100
Temperature [°C]
Mob
ilize
d fr
ictio
n an
gle
φ
1
σc=300kPaBangkok clay
2
4
Figure 21. Effect of temperature on friction in clayey soils. Left pane
35
40
p [de
g]8
OCR(a) (b)
: Constant volume friction References: (a) Pontida clay from Hueckel & Pellegrini (1989) and Hueckel & Baldi (1990); (b) illite from Graham et al. (2001); (c) Tody clay from Burghignoli et al. (2000); (d) Pontida clay from Hueckel & Bakli (1990); (e) kaoline from Cekerevac & Laloui (2004); (f) Bangkok clay from Abuel-Naga et al. (2007). Right pane: Peak friction as a function of temperature and overconsolidation (OCR values shown for each line - Abuel-Naga et al. 2007).
6.5 Large strain segregation
Particle alignment at large strains (γ>100%) is followed by granular segregation as the strain increases even further (γ>>100%). Segregation is determined by particle mobility, and leads to
icles according to mass density, eccentricity, roughness, and edium exhibits lower shear resistance than the homogenously
the spatial grouping of alike partsize. In all cases, the segregated mmixed medium. For example, segregation by size results in two zones of low coordination number where coarse particles ride over a surface of low "effective roughness" made by the smaller particles (Fig. 22a); likewise, shape-based segregation creates a smooth surface of platy particles (Fig. 22b). Therefore, the post-segregation friction angle φps is lower or equal to the residual and the constant volume friction angles: φps≤ φres≤ φcv.
(a) (b)
Figure 22. Segregation at very large strains (γ>>100%). Examples: (a) by size (see Savage & Lun 1988) and (b) by shape (see Lee et al. 2007).

6.6 Strain rate
Strain rate effects in friction reflect the time scales of internal processes involved in shear: friction changes with strain rate when the characteristic time for shear is shorter than the time required for the completion of internal processes. Let's estimate the characteristic time for shear
ε
td as the time required to cause a shear displacement equal to the particle diameter, thus td=1/ ε . Inertial effects arise at high strain rates and lead to collisions between grains. The
or inertial effects ti can be estimated as the time required for a particle of distance equal to its diameter d when accelerated due to the skeletal force
characteristic time fmass m to travel a F=σ'd2 (viscous forces are disregarded in this analysis). The travel distance is d=ati
2/2 and the acceleration a=F/m=σ'd2/m; then ti=√(2m/σ'd). The ratio between the time scale for shear and inertial effects defines the dimensionless inertial ratio
i
d
I dt 'd '
= = ε εt 2m ρ
σ σ (13)
where ρ is the mass density of the mineral that makes the grains. We can distinguish three rate-dependent shear regimes: the quasi-static regime I→0, the transition regime 10-2<I<0.2, and the collisional regime I>0.2 (GDR MiDi 2004; da Cruz et al. 2005). 6.6.1 Quasi-static, low strain-rate regime (I→0): The strain-rate dependent frictionalcharacteristics that are similar to those observed when two large surfaces are subjected to shear
response in sediments sheared at low strain rate has
(Sections 2.2 and 2.3). Sketches in Figure 23 show the transients observed for a sudden increase in strain rate from oε -to- 10 oε . The macroscale sediment response can be categorized as follows (Vaid & Campanella 1977, Tatsuoka et al. 2002, Di Benedetto et al. 2005, Tatsuoka et l. 2008b):
with strain rate; this is observed in low
ly
ar tests on poorly-graded, stiff and relatively round particles (Duttine et al. 2008).
nown as TESRA for transient effects of strain rate and strain
a• Isotach response: strength and stiffness increase
plasticity clays, either NC or OC, and soft rocks (Šuklje 1957, Hayano et al. 2001, Leroueil 2006, Sorensen et al. 2007).
• Positive and Negative (P&N): the transient is a positive increase in shear strength, but the response eventual converges to a lower stress-strain trend; this response is observed in triaxial compression of poorly graded, stiff and relatively round particles and in drained direct she
There are two other intermediate behaviors (Fig. 23): • Combined: it runs between Isotach and the original, unaffected stress-strain trend. • Viscous evanescence (also k
acceleration - Di Benedetto et al. 2002): the same stress-strain behavior is observed at all strain rates however a transient is measured when the strain rate changes (either positive or negative). This is a common response in sands; it is also observed in cemented clays at large strains (Sorensen et al. 2007).
0ε
Isotach
010ε
Combined
TESRA
P & N
Dev
iato
ric
stre
ss
Strain Figure 23. Strain rate effects. A step increase in strain rate is assumed (continuous line: response at a constant strain rate ; dashed lines: responses when the strain rate is suddenly increased to 1 . oε 0 oε

The normalized magnitude of the relaxation amplitude is proportional to the change in strain rate; for axial compression AC loading (Fig. 24a),
newz
z p
log εΔσ= β
σ ε ast
(14)
The β-factor is β=0.02-to-0.05 in sands and gravels; it increases with particle size when particles are round, but the effect of particle size vanishes when angular particles are involved (Duttine et al. 2008). The factor ranges between β=0.02-to-0.08 in fine-grained clayey sediments, where higher values correspond to higher degrees of saturation (Di Benedetto et al. 2005).
clay sand gravel
0.30zσ
newε
0.000.001 0.01 0.1 1 10 100
D50 [mm]
0.10
0.20
β
εpastε
zσ
zσΔ
0.000010.001 0.01 0.1 1 10 100 1000
Ratio of strain rate
Figure 24. Strain rate effects – General trends (a) amplitude of the effect in axial compression AC tests (data from Di Benedetto et al. 2005, Enomoto et al. 2009). (b) transition duration (Data co
0.0001
Re
0.001
0.1
lax
mpiled from Matsushita et al. 1999, Tatsuoka et al. 2002, Komoto et al. 2003, Li et al. 2003, Nawir et al. 2003, AnhDan et al. 2006, Kiyota & Tatsuoka 2006, Tatsuoka et al. 2008b, Kawabe et al. 2008)
The duration of the transient or the "relaxation strain" does not seem to depend on the ratio
between the previous and current strain rates (Fig. 24b). Furthermore, we found no correlation with stress level, particle size or shape in the compiled data. Apparently, the relaxation strain is between ε=10-4-to-10-3 (Note: as a reference, the strain at peak strength is typically between ε=0.05 and 0.2). The relative minor effect of grain size on the relaxation strain suggests that shear takes place along planes rather than distributed throughout the soil mass (even in the absence of shear bands). In support of this hypothesis, consider a homogenously distributed relaxation strain of ε=10-4 in a d=100nm size clays: the resulting subatomic particle-to-particle
wedges along inter-wedge planes where
(a) (b) 0.01
atio
n st
rain
displacement δ= εd=10-4x10⁻⁷m=0.1Ǻ contradicts relaxation distances observed in mineral-to-mineral shear (δ~>10μm – discussion in Section 2.2), and threshold strain levels expected for these materials (Section 4.1 and references therein). In fact, individual particles move together in the form of "wedges of correlated displacement" that displace relative to other
the deformation localizes; eventually, the displacement becomes kinematically restricted, wedges break and new inter-wedge planes form (Drescher & De Josselin De Jong 1972). Domains made of fine particles form conglomerates that can move in wedges similarly to coarse grains; this observation can facilitate the interpretation of global similarities between fine and coarse grained soil response.
Following the discussion in Section 2, one is tempted to conclude that transients reflect the combination between (1) the current sediment state that is a consequence of the previous strain rate, and (2) the new strain rate that has been suddenly imposed. In fact, the isotach and combined responses appear to be upscaled manifestations of hydrodynamic friction (Fig. 3), while both P&N and TESRA seem to reflect contact level transients observed in dry friction (Fig. 2). However, other particle-scale mechanisms can contribute to the observed transients in strength. In particular, we seek to identify processes with long time scales that can interfere with the long time td=1/ ε when shear takes place at low strain rate ε . Processes that involve successive interactions between multiple grains have longer time scales than the inertial time ti for a single particle (e.g., a single domino falls much faster than the complete chain):

• Fine-grained soils: contact creep; diffusion of local gradients (chemical, electrical, mechanical or thermal); fabric structuring-destructuring cycles; other particle-level processes involved in soil thixotropy (van Olphen 1977; Díaz-Rodríguez & Santamarina 1999).
• Coarse-grained soils: creep or slippage at contacts "diffuses" in a domino-type propagation throughout the granular skeleton; contact friction coupling with slippage-generated noise (details in Section 7.2)
• Coarse and fine: force redistribution and alteration of load-carrying chains (Kuhn & Mitchell 1993, Rothenburg 1993; Cascante & Santamarina 1996; Hartley & Behringer 2003).
These meso-scale processes affect regions that are much larger than the grain size, tend to follow an exponential evolution in time, and are slow enough to affect the shear response in the quasi-static strain rate regime. 6.6.2 Transitional regime (10-2<I<0.2) and high strain-rate collisional regime (0.2<I): Equation 13 predicts that inertial effects and collisions will arise when shearing large particles at high strain rates in a medium subjected to low effective stress conditions.
There are two immediate consequences of interparticle collisions: (1) the volume dilates and (2) the friction coefficient increases due to the energy loss in shear and collision (i.e., restitution coefficient). Studies with d -2iscs in the transition regime 10 ≤I≤0.2 show approximately linear trends for the increase in porosity n=no+aI, and the increase in friction coefficient μ=μo+bI (GDR MiDi 2004, da Cruz et al. 2005). Both dilation and strengthening saturate as the shear
urg & Bathurst 1989 – discussion applicable to the high strain gime in da Cruz et al. 2005).
Venkatappa Rao 1979, Moore 1991, Di Maio & Fenelli 1994, Wang & Siu 2006): (1) at a given ction increases when permittivity decreases, ionic concentration
nce of the prevailing ion increases. (Note: the void ratio and fabric are not
ee also data in Sridharan 20
rate approaches the high-strain rate collisional regime I>0.2. Even in this regime, the relationship between global friction angle and the internal anisotropy in the granular medium remains (Equation 3 - Rothenbre
6.7 Pore Fluid
The increase in salinity causes a reduction in double layer repulsion. When salinity exceeds ~0.1 molar, van der Waals attraction prevails and the soil fabric tends to adopt parallel aggregation (See Fig. 5b). Fabric effects prevail at low effective stress. As the effective stress increases, and/or as particles become aligned at large strains, the primary effect of salinity is to allow for thinner water films and less effective boundary lubrication. Therefore, an increase in friction with increasing ionic concentration should be expected in most cases.
Data on pore fluid chemical effects on the shear strength of clayey soils are inconclusive in part due to differences in specimen preparation; studies with single-mineral soils show that (Warkentin & Yong 1960, Kenney 1967, Mesri & Olson 1970, Olson 1974, Sridharan &
effective confinement, friincreases or the valathe same for soils with different fluids); and (2) flocculated clays exhibit higher shear strength than dispersed clays at the same void ratio. In general, a linear relation can be identified between soil strength and the number of bonds (Mitchell 1993, and references therein). Fluids that can alter the mineral surface or hinder hydration can also cause pronounced changes in shear strength (bentonite-water "B" has a PI= 416 and φr=7˚ versus organo-bentonite "OB" PI= 7-to-14 and φr=34˚-to-37˚ - Fig. 14; from Soule and Burns, 2001; s
01).
6.8 Internal interparticle forces of adhesion The "effective normal force" at interparticle contacts is a combination of skeletally transmitted forces and contact-level capillary and electrical forces (attraction and repulsion). Therefore, the acting normal contact force may differ from the value imposed by the applied effective stress when fine-grained soils (d<10μm) or even coarse soils with a significant amount of fines (say %fines >10% by mass) are involved.

The consequences of interparticle forces of adhesion on the computed friction angle diminish -but do not cancel- when friction is defined as the slope of the strength envelope in the τσ' space, tan φ= Δτ/Δσ', rather than from the origin. The residual effect interparticle forces of adhesion have on φ reflect differences in force-displacement among the various particle-level forces; for example, water menisci at interparticle contacts may brake and not reform during shear (applies to the pendular regime at low water content).
difficulties. (Note: stress path/anisotropy was addressed in Section 6.3.)
Sc
e particle size (Similar Fig. 25). Specifically, experimental results show that the interfacial peak and φ*
p constant olume φ*
cv friction angles equal the corresponding internal friction angles of the soil mass φp nd φ when the ratio between the average surface roughness R and the mean particle size D
s an be found in Subba Rao et al. 1998, Frost & DeJong 2005, Dietz & Lings 2006).
ed friction. When particles are harder
7. BOUNDARY EFFECTS - MEASUREMENT
The measurement of friction is intimately related to boundary conditions. For example, the angle of repose cannot be measured for smooth spherical particles when a polished base is used because particles roll away; however, the same spherical particles will readily form a pile on a corrugated base (Fig. 25 – data in Kalman et al. 1993, Matuttis et al. 2000, Chik & Vallejo 2005, Li et al. 2005).
This experiment highlights that the measurement of soil friction is inherently a boundary-value problem. In this section we explore boundary conditions and interfacial friction, the effects of vibration, the emergence of localization and close with a brief review of measurement
Figure 25. Boundary conditions and friction. Smooth spherical particles do not form a granular pile on a polished flat surface (a), but readily form the pile on a corrugated surface (b).
7.1 Interfacial Friction: Sediments Against Surfaces
(a) (b)
ales in intergranular friction related to grain size and shape identified in Figure 4 are relevant to interfacial friction between sediments and surfaces as well: the sediment slides along the interface when the surface is planar and polished, however, shear takes place within the soil mass when the surface is rough and undulations approach the scale of thtova cv a 50 exceeds Ra/D50≥0.01 (Fig. 26a). Note that there is an implicit correlation between higher roughness amplitude and longer roughness wavelength. Similar result c
The relative grain-surface hardness affects the mobilizthan the surface, plowing adds energy loss to sliding and the angle of interfacial friction increases as the normal stress increases (Fig. 26b).
0.2
0.4
0.6
0.8
1.0
1.2
Fric
tion
ratio
p
p
φφ *cv
cv
φφ *
0.00.00001 0.0001 0.001 0.01 0.1
Relative roughness Ra/D50
1.0
Peak
fric
tion
coef
ficie
nt
Large diaplacement device: D50=0.7mm, Dr=74-82%Shear Device: D50=0.7mm, Dr=79-83% (wood substrate)Shear Device: (fiber reinforced plastic substrate)O'Rourke
(a) (b) Sliding Sliding+Plowing
et al. (1990): D50=0.5mm, Dr=52-81%
0.11 10 100 1000
Normal stress [kPa]
Sliding (computed from back analysis)
Figure 26. Interfacial friction. (a) Normalized friction versus relative roughness Ra/D50 for sand-metal interaction (data: Subba Rao et al. 1998); relative roughness is defined in terms of the average surface roughness Ra (average absolute value of surface elevation) and the mean particle size D50. (b) Plowing effects on peak interfacial friction coefficient (Dove & Frost 1999 - Geomembrane-Ottawa sand).

7.2 Vibration – Noise – Cyclic Loading
Friction and vibration are interrelated: friction causes vibration, and vibration (or noise) affects friction. In fact, while stick-slip is a clear cause of vibration, vibration can be used to reduce stick-slip (Popp & Rudolph 2003). Salient implications on the vibration-friction coupling are identified next (references include the work by Fridman & Levesque 1959, Eaves et al. 1975, Budanov et al. 1980, Serdyuk & Mikityanskii 1986, Tworzydlo & Becker 1991, Skare & Stahl 1992, Adams 1996, Thomsen 1999, Bengisu & Akay 1999, Bucher & Wertheim 2001, Littmann et al. 2001).
Vibration either normal or parallel to the sliding direction reduces the effective friction angle (Fig. 27). The higher the slope angle, the lower the acceleration required to trigger slippage. Furthermore, the acceleration required to cause slippage increases with frequency. The duration
single "threshold displacement" of 0.1 μm per cycle adequately satisfies all the data in Figure 27.
stochastic resonance may develop in frictional
of the incursion into instability is very short at high frequencies and low vibration amplitudes. Results in Figure 27 show that the displacement in each cycle must exceed a minimum "displacement threshold" to cause block sliding. This length scale can range from the size of asperities in rough surfaces to the angstrom scale for atomically smooth surfaces. A
Nonlinear dynamic coupling effects andgeomaterials. For example, if the granite slider that sits on the substrate is excited with a periodic driving signal in the presence of a background "noise" signal, the noise level required to cause slippage decreases as the amplitude of the periodic signal approaches the static limit; in fact, the peak output signal-to-noise ratio increases, inducing stochastic resonance.
10
[g]
0.01
0.1
1
100 1000 10000
Frequency [Hz]
Lim
iting
acc
eler
atio
n -
10
orm
al [g
] N
Slope = 4 degrees
Slope = 8 degrees
Slope = 12 degrees
β = 4o (a┴= 0.78 g)
β = 8o (a┴= 0.56 g)
β = 12o (a┴= 0.34 g)
0.01
0.1
1
100 1000 10000Frequency [Hz]
Lim
iting
acc
eler
atio
n - P
aral
lel
Slope = 4 degrees
Slope = 9 degrees(a) (b)
Slope = 13 degrees
β = 4o (a//= 0.27 g)
β = 13o (a//= 0.11 g)β = 9o (a//= 0.18 g)
( )a costan tang tan⊥ β
= φ − βφ
( )
atan tan cos
g= φ − β β
Figure 27. Base block acceleration required to bring a frictional block to the verge of slippage for different slope angles and excitation frequencies. Sinusoidal vibration (a) normal to the sliding surface. (b) parallel to the dip vector. Dashed lines correspond to the limit equilibrium prediction – equations shown. Solid lines indicate the acceleration that generates a constant relative displacement of 0.1 μm. (details in Claria & Santamarina 2008)
We do not observe the classical signature of stochastic resonance when we test a granular sand specimen, nonlinear energy coupling effects readily appear: if the sand is simultaneously excited with two sinusoidal signals of different frequencies, the output response at the frequency of the primary driving signal increases as the amplitude of the secondary “noise” signal increases (Wang & Santamarina 2002). In fact, coupling increases as the driving signal brings the specimen to its nonlinear regime.
Repetitive cyclic loading has other manifestations in frictional granular media, including the evolutio etric and shear strains towards minal density and shakedown), or the evol continuous shear de ratcheting (Johnson 1985, Alonso-Marroquin & Herrmann 2004, Werkmeister et al. 2004, Wichtmann et al. 2004, Narsilio &
antamarina 2008).
s is a bifurcation-type response during the shear of granular
n of volumution towards
stable states (terformation or
S
7.3 Strain localization
Positive feedback mechanisms lead to bifurcation when the returned energy exceeds losses. Strain localization along shear band

media (Rudnicki & Rice 1975, Vardoulakis 1979). The development of localization depends on inh
h suction (menisci failure), non-homogeneous specimen sub
global response will reflect a lower peak strength and lower dilation than the local material response. This volume-averaging effect is exacerbated in soft yet brittle
ns. ands is determined by the peak strength friction angle. Therefore,
the
loping experimental methods that attempt to create pure bo
easurements gathered around the whole specimen (Bayoumi 2006).
ined sediments, even though particle interaction is dominated by electrical effects in fine-grained media.
erent material characteristics, drainage during shear, stress and boundary conditions. The following sediment characteristics and drainage conditions favor localization: dilative
sediments during drained shear, dilative sediments during undrained shear (if the pore fluid cavitates), contractive sediments during undrained shear, sediments that reach very low residual strength (e.g., when platy particles exceed ~15%), initially cemented sediments (cement breakage), unsaturated soils under hig
jected to either drained and undrained shear, grain crushing or void collapse (experimental evidence in Cho & Santamarina 2003).
In the absence of perfectly homogeneous initial conditions (i.e., all real specimens), strain localization results in specimen-size dependent stress-strain-volume response due to progressive failure: the measured
materials and large specimeThe orientation of shear b analysis of the constant volume and the residual friction angles must take into consideration
the orientation of the shear plane that formed at peak.
7.4 Measurement
It follows from the previous discussions that the measurement of friction is a boundary value problem that gains additional complexity due to inherent and stress-induced anisotropy, interfacial friction against cell walls, drainage conditions (local and global), particle-level forces (that are not determined at the boundaries), localization, spatial variability within the sediment, strain-rate dependency and vibrations.
Great effort has been devoted to deveundary conditions (e.g., lubricated polished platens) so that the specimen can be considered as
"a point" (lubricated boundaries are discussed in Lade & Duncan 1973, Chu et al. 1996, Frost & Yang 2003). Eventually, all these efforts have been hindered by inherent physical limitations.
More recent developments explore the intensive use of information technology and numerical modeling to perform information-rich tests with complex boundary conditions. This approach explicitly recognizes that each point in the specimen experiences a different stress history: the specimen is discretized into finite elements, boundary conditions are properly represented, and the constitutive parameters of a robust constitutive model are identified by fitting simulation results to the extensive dataset of m
8. CONCLUSIONS
The friction angle is not an inherent property of a soil mass. It depends on grain characteristics (topography, hardness, strength), sediment properties (grain size distribution, packing density, inherent anisotropy), effective confining stress, stress path (stress-induced anisotropy), strain rate, drainage (local and global), temperature, vibration (reduces frictional resistance).
Particle size is the inherent length scale in granular materials. All other particle-level characteristics such as eccentricity, angularity, roughness and double layer thickness must be related to particle size to determine their effect on the macroscale friction angle of a soil. In addition, particle size determines the role that particle-level electrical and capillary forces may exert relative to the boundary-determined skeletal forces.
The region between 1-and-50μm defines a drastic transition in shape, grain formation, mineralogy, governing forces, fabric formation and the role of adsorbed layers relative to surface roughness. Friction in fine-grained media exhibits similar macroscale characteristics to those observed in coarse-gra

Upscaling from grain-to-grain interactions to the whole mass takes place through various competing mechanisms that include contact slippage, grain rotation and rotational frustration,
well as inh
level mechanics (friction between dry mi
strain rates; in this case, inertial effects arise leading to int
le (de
king density and state of stress in relation to the critical sta
dilation against confinement, grain crushing, formation-and-buckling of granular columns. From a particle level perspective, friction is a measure of the medium ability to sustain anisotropy.
The macroscale frictional behavior of the soil mass is a Coulomb-type response, but the Coulomb model must be modified to accommodate stress-dependent dilatancy, as
erent and stress-induced anisotropy. Strain rate effects on friction reflect the time scales of internal processes involved in the
shear of granular materials: friction changes with strain rate when the characteristic time for shear is shorter than the time required for the completion of internal processes. The relevant time scales during quasi-static shear are related to contact-
nerals or hydrodynamic effects) and the diffusion of contact-pore scale processes displacements through the granular medium; available data suggest that strain rate effects are dominated by localized sliding between particle wedges rather than by distributed sliding throughout the soil mass. The high-strain rate regime takes place when large particles subjected to low confinement are sheared at high
erparticle collisions and the increase in friction. A minimum strain is required to cause contact-level slippage; the threshold strain depends on
grain size and effective confinement. As the strain level increases, a sediment reaches the peak friction angle (in dilative soils with respect to critical state), the constant volume friction ang
termined by angularity and roughness), the residual friction angle (if eccentric particles exceed ~10%), and the post-segregation friction angle.
Dilatancy depends on the current pacte line. Cementation increases the dilative tendency of a soil mass. The measurement of soil friction is a boundary value problem and is inherently hindered by
incomplete knowledge of boundary conditions. Information-intensive measurement methods may help overcome current limitations. Progressive failure leading to strain localization affects the interpretation of boundary measurements. Acknowledgments Support was provided by the National Science Foundation, the Georgia Mining Industry, and The Goizueta Foundation. We are grateful to reviewers and colleagues for insightful comments and suggestions.
ffect of temperature on shear strength and
ction coefficient - A simple
esting Journal. 29(4): 330-340. astic deformation and the laws of friction. Proceedings of the Royal Society of
s, M. G. 1985. State parameter for sands. Geotechnique. 35(2): 99-112. engisu, M. T. & Akay, A. 1999. Stick-slip oscillations: Dynamics of friction and surface roughness.
Journal of the Acoustical Society of America. 105(1): 194-205. . Strength and dilatancy of sands. Geotechnique. 36(1) : 65-78. abor, D. 1950. The friction and lubrication of solids. New York: Oxford University
Press.
REFERENCES Abuel-Naga, H. M., Bergado, D. T. & Lim, B. F. 2007. E
yielding behavior of soft Bangkok clay. Soils and Foundations. 47(3): 423-436. Adams, G. G. 1996. Self-excited oscillations in sliding with a constant fri
model. Transactions of the ASME. Journal of Tribology. 118(4): 819-23. Alonso-Marroquin, F. & Herrmann, H. J. 2004. Ratcheting of granular materials. Physical Review Letters.
92(5): 054301-1. AnhDan, L., Tatsuoka, F. & Koseki, J. 2006. Viscous effects on the stress-strain behavior of gravelly soil
in drained triaxial compression. Geotechnical TArchard, J. F. 1957. El
London, Series A (Mathematical and Physical Sciences). 243: 190-205. Bayoumi, A. M. 2006. New laboratory test procedure for the enhanced calibration of constitutive mode,
Georgia Institute of Technology. Been, K. & JefferieB
Bolton, M. D. 1986owden, F. P. & TB

Bucher, I. & Wertheim, O. 2001. Reducing friction forces by means of applied vibration. Proceedings of the ASME Design Engineering Technical Conference 6 C. American Society of Mechanical Engineers,
Bu vibration. Sov. J. Frict.
Bu ideri, A. & Miliziano, S. 2000. A laboratory study on the thermomechanical
Ca lues: Predicted Versus
Ca ns on soil behavior. American
on. Journal of
Ca ace friction on the rheology of hard-
ternational Journal for Numerical and Analytical Methods in Geomechanics. 28(3): 209-228.
Ch 004. Crushing and plastic deformation of soils simulated
Ch L. 2005. Characterization of the angle of repose of binary granular materials.
Ch ing density, stiffness, and
Ch & Lee, I. K. 1996. Strain softening and shear band formation of sand in multi-axial
Cla cial Friction and Vibration. In: Proc. Symposium on
Co The mechanics of cemented carbonate sands. Geotechnique. 43(1):
Cu
da m, S., Prochnow, M., Roux, J.-N. & Chevoir, F. 2005. Rheophysics of dense granular
Di ime-dependent shear deformation characteristics of
Di aterials. In: Deformation Characteristics of Geomaterials, Recent Investigations
4(2): 217-226.
l, chemical, and mineralogical properties of Mexico City sediments: A geotechnical
Día na, J. C. 1999. Thixotropy: The Case of Mexico City Soils. In: XI
Die
Pittsburgh, PA, United states, 2995-3000. danov, V., Kudinov, V. A. & Tolstoi, D. M. 1980. Interaction of friction andWear. 1: 79–89.
rghignoli, A., Desbehaviour of clayey soils. Canadian Geotechnical Journal. 37(4): 764-780.
mp, W. M., Mayne, P. W. & Brown, D. A. 2002. Drilled Shaft Axial Design VaMeasured Response in a Calcareous Clay. In: ASCE's 2002 Deep Foundation Congress.
mpanella, R. G. & Mitchell, J. K. 1968. Influence of temperature variatioSociety of Civil Engineers Proceedings, Journal of the Soil Mechanics and Foundations Division. 94(3): 709-734.
Cascante, G. & Santamarina, J. C. 1996. Interparticle contact behavior and wave propagatiGeotechnical Engineering. 122(10): 831-839.
stle, J., Farid, A. & Woodcock, L. V. 1996. The effect of surfsphere colloids. Berlin: Springer.
Cekerevac, C. & Laloui, L. 2004. Experimental study of thermal effects on the mechanical behaviour of a clay. In
Chantawarangul, K. 1993. Numerical Simulation of Three-Dimensional Granular Assemblies, University of Waterloo.
eng, Y. P., Bolton, M. D. & Nakata, Y. 2using DEM. Geotechnique. 54(2): 131-141.
ik, Z. & Vallejo,Canadian Geotechnical Journal. 42(2): 683-692.
o, G. C., Dodds, J. & Santamarina, J. C. 2006. Particle shape effects on packstrength: Natural and crushed sands. Journal of Geotechnical and Geoenvironmental Engineering. 132(5): 591-602.
Cho, G. C. & Santamarina, J. C. 2003. The Omnipresence of Localization in Geomaterials. In: Proc. 3rd Int. Sym. on Deformation Characteristics of Geomaterials, IS Lyon 03, Lyon, 465-473.
u, J., Lo, S. C. R.testing. Geotechnique. 46(1): 63-82. ria, J. J. & Santamarina, J. C. 2008. InterfaCharacterization and Behavior of Interfaces (edited by Frost, J. D.). Atlanta, USA: Balkema.
op, M. R. & Atkinson, J. H. 1993.53-67.
brinovski, M. & Ishihara, K. 2002. Maximum and minimum void ratio characteristics of sands. Soilsand Foundations. 42(6): 65-78. Cruz, F., Emamaterials: Discrete simulation of plane shear flows. Physical Review E - Statistical, Nonlinear, and Soft Matter Physics. 72(2): 1-17.
Dantu, P. 1968. Statistical study of intergranular forces in powdered medium. Geotechnique. 18(1), 50-55. Benedetto, H., Tatsuoka, F. & Ishihara, M. 2002. Tsand and their constitutive modelling. Soils and Foundations. 42(2): 1-22. Benedetto, H., Tatsuoka, F., Lo Presti, D., Sauzéat, C. & Geoffroy, H. 2005. Time effects on the behaviour of geomand Prospects (edited by Di Benedetto, H., Doanh, T., Geoffroy, H. & Sauzéat, C.). London: Taylor & Francis Group.
Di Maio, C. & Fenelli, G. B. 1994. Residual strength of kaolin and bentonite: The influence of their constituent pore fluid. Geotechnique. 4
Diaz-Rodriguez, J. A., Leroueil, S. & Aleman, J. D. 1992. Yielding of Mexico City clay and other natural clays. Journal of geotechnical engineering. 118(7): 981-995.
Diaz-Rodriguez, J. A., Lozano-Santa Cruz, R., Davila-Alcocer, V. M., Vallejo, E. & Giron, P. 1998. Physicaperspective. Canadian Geotechnical Journal. 35(4): 600-610. z-Rodríguez, J. A. & SantamariPanamerican Conf. on Soil Mech. and Geotech. Eng. 1, Iguazu Falls, Brazil, 441-448. terich, J. H. 1979. Modeling of rock friction. I. Experimental results and constitutive equations. J. Geophys. Res. 84: 2161-8.

Dieterich, J. H. & Kilgore, B. D. 1994. Direct observation of frictional contacts: New insights for sliding memory effects. Pure and Applied Geophysics. 143(1-3): 283-302.
Dietz, M. S. & Lings, M. L. 2006. Postpeak strength of interfaces in a stress-dilatancy framework. Journal of Geotechnical and Geoenvironmental Engineering. 132(11): 1474-1484. bry, R., Ladd, R. S., Yokel, F. Y., Chung, R. M. & Powell, D. 1982. Prediction of pore water pressure buildup and liquefa
Doction of sands during earthquake by the cyclic strain method. In: Building Science
Do r of smooth geomembrane-particle interfaces.
Dre of a mechanical model for the
DuDu s behaviour of unbound granular
Eav pplication of
En suoka, F., Di Benedetto, H., Hayashi, T. & Duttine, A. 2009. Effects of
Fro on interface response.
Fro in dilatant specimens.
GDnular
Gu fied direct shear test for anisotropic strength of sand. Journal of Geotechnical and
Gu strength, interparticle locking, and dilatancy of granular materials.
Ha P. 2003. Logarithmic rate dependence of force networks in sheared
Ha ependent deformation
d Metallurgy,
Hoeries A (Mathematical and Physical Sciences).
Hu - Experimental constitutive study.
Hu erical Models
Isra . 1988. Dynamic properties of molecularly thin
Jae . The physics of granular materials. Physics Today.
Jam Lancellotta, R. 1985. New Developments in Field and Laboratory Testing of Soils. In: Proc. 11th ICSMFE 1, San Francisco, 67-153.
Series 138. US Department of Commerce, National Bureau of Standards, 150. ve, J. E. & Frost, J. D. 1999. Peak friction behavioJournal of Geotechnical and Geoenvironmental Engineering. 125(7): 544-555. scher, A. & De Josselin De Jong, G. 1972. Photoelastic verificationflow of a granular material. Journal of the Mechanics and Physics of Solids. 20(5): 337-51. sseault, M. B. & Morgenstern, N. R. 1979. Locked Sands. Engineering Geology. 12: 117-131. ttine, A., Tatsuoka, F., Kongkitkul, W. & Hirakawa, D. 2008. Viscoumaterials in direct shear. Soils and Foundations. 48(3): 297-318. es, A. E., Smith, A. W., Waterhouse, W. J. & Sansome, D. H. 1975. Review of the aultrasonic vibrations to deforming metals. Ultrasonics. 13(4): 162-70.
omoto, T., Kawabe, S., Tatparticle characteristics on the viscous properties of granular materials in shear. Soils and Foundations. 49(1): 25-49.
Fraser, H. J. 1935. Experimental study of the porosity and permeability of clastic sediments. Journal of Geology. 13(8-1): 910-1010.
Fridman, H. D. & Levesque, P. 1959. Reduction of static friction by sonic vibrations. Journal of Applied Physics. 30(10): 1572-1575. st, J. D. & DeJong, J. T. 2005. In situ assessment of role surface roughnessJournal of Geotechnical and Geoenvironmental Engineering. 131(4): 498-511. st, J. D. & Yang, C.-T. 2003. Effect of end platens on microstructure evolution Soils and Foundations. 43(4): 1-11. R MiDi. 2004. On dense granular flows. European Physical Journal E. 14(4): 341-365.
Gherbi, M., Gourves, R. & Oudjehane, F. 1993. Distribution of the contact forces inside a gramaterial. In: Powders and Grains 93, Prod. 2nd International Conference on Micromechanics of Granular Media. Elsevier, Brimingham, 167-171.
Graham, J., Tanaka, N., Crilly, T. & Alfaro, M. 2001. Modified Cam-Clay modelling of temperature effects in clays. Canadian Geotechnical Journal. 38(3): 608-621.
Greenwood, J. A. & Williamson, J.B.P. 1966. Contact of nominally flat surfaces Proceedings of the Royal Society of London. Series A, Mathematical and Physical Sciences. 295(1442): 300-319. o, P. 2008. ModiGeoenvironmental Engineering. 134(9): 1311-1318. o, P. & Su, X. 2007. ShearCanadian Geotechnical Journal. 44(5): 579-591.
rtley, R. R. & Behringer, R.granular materials. Nature. 421(6926): 928-31.
yano, K., Matsumoto, M., Tatsuoka, F. & Koseki, J. 2001. Evaluation of time-dproperties of sedimentary soft rock and their constitutive modeling. Soils and Foundations. 41(2): 21-38.
Hoek, E. & Brown, E. T. 1980. Underground Excavations in Rock. Institution of Mining anLondon. rne, M. R. 1969. The behaviour of an assembly of rotund, rigid, cohesionless particles. III. Proceedings of the Royal Society of London, S310(1500): 21-34. eckel, T. & Baldi, G. 1990. Thermoplasticity of saturated claysJournal of Geotechnical Engineering. 116(12): 1778-1796. eckel, T. & Pellegrini, R. 1989. Modeling of thermal failure of saturated clays. In: Numin Geomechanics (edited by Pietruszczak, S. & Pande, G. N.). New York: Elsevier. 81-90. elachvili, J. N., McGuiggan, P. M. & Homola, A. Mliquid films. Science. 240(4849): 189-91. ger, H. M., Nagel, S. R. & Behringer, R. P. 199649(4): 32-8. iolkowski, M., Ladd, C. C., Germaine, J. T. &

Johnson, K. L. 1961. Energy dissipation at spherical surfaces in contact transmitting oscillating forces. Journal of Mechanical Engineering Science. 3(4): 362-368. nsonJoh , K. L. 1985. Contact mechanics. Cambridge: Cambridge University Press.
e of repose. Bulk Solids Handling. 13(1): 123-128.
eristics of Geomaterials (edited by Burns, S. E., Mayne, P. W. & Santamarina, J.
Ke on the residual strength of natrual soils.
5): 665-684.
Ko on, I. 2004. A static friction model for elastic-plastic contacting rough surfaces. Journal
Ko ndisturbed Pleistocene
London: Professional
Kru energy and dissipation in quasi-static
Ku
Ku . 1999. Anisotropy of Undrained Shear Strength of an Over-
Lads: State-of-the-art report. In: Proceedings of 9th International Conference on Soil
Lad f 3-D failure criterion for sand. International
l Mechanics and Foundations Division. 99(10): 793-781.
Lad Stress Rotation and Changes of b-Values on Cross-
Lee ntamarina, J. C. 2007. Micaceous sands: Microscale mechanisms and
3th Danube Eur. Conf. on Geotechnical Engineering 1, Ljubljana, 55–58.
ls, IS Lyon
Li, Technology. 160(3): 219-228.
4.
Matsuoka, H. & Nakai, T. 1974. Stress-deformation and strength characteristics under three different principal stresses. In: Proc., Jpn. Soc. Civ. Eng. 232: 59–70.
Kalman, H., Goder, D., Rivkin, M. & Ben-Dor, G. 1993. Effect of the particle-surface friction coefficient on the angl
Kawabe, S., Maeda, Y., Tobisu, Y., Hara, D., Tatsuoka, F. & Ohta, A. 2008. Viscous properties of round granular materials in drained triaxial compression. In: Fourth International Symposium on Deformation CharactC.) 1. ISO press, Atlanta, USA, 503-510.
nney, T. C. 1967. The influence of meneralogical composition In: Proceedings of the geotechnical conference on shear strength properties of natural soils and rocks. 1: 123-129.
Kiyota, T. & Tatsuoka, F. 2006. Viscous property of loose sand in triaxial compression, extension and cyclic loading. Soils and Foundations. 46(
Koerner, R. M. 1970. Limiting density behavior of quartz powders. Powder Technology. 3(4): 208-12. gut, L. & Etsiof Tribology. 126(1): 34-40. moto, N., Tatsuoka, F. & Nishi, T. 2003. Viscous stress-strain properties of uclay and its constitutive modelling. In: Proc. 3rd Int. Sym. on Deformation Characteristics of Geomaterials, IS Lyon 03. Balkema, 579–587.
Kragelsky, I. V. & Alisin, V. V. 2001. Tribology--lubrication, friction, and wear. Engineering Publishing Ltd. yt, N. P. & Rothenburg, L. 2006. Shear strength, dilatancy,deformation of granular materials. Journal of Statistical Mechanics: Theory and Experiment. 7: 1-13. hn, M. R. & Mitchell, J. K. 1993. New oerspectives on soil creep. ASCE J. Geotechnical Engineering. 119(3): 507-524. rukulasuriya, L. C., Oda, M. & Kazama, HConsolidated Soil by Triaxial and Plane Strain Tests. Soils and Foundations. 39(1): 21-29. d, C., Foott, R., Ishihara, K., Schlosser, F. and Poulos, HG. 1977. Stress-deformation and strength characteristicMechanics, Foundation Engineering 2: 421-494. e, P. V. 2006. Assessment of test data for selection oJournal for Numerical and Analytical Methods in Geomechanics. 30(4): 307-333.
Lade, P. V. & Duncan, J. M. 1973. Cubical triaxial tests on cohesionless soil. American Society of Civil Engineers, Journal of the Soi
Lade, P. V. & Duncan, J. M. 1975. Elastoplastic stress-strain theory for cohesionless soil. Journal of the Geotechnical Engineering Division. 101(10): 1037-1053. e, P. V. & Kirkgard, M. M. 2000. Effects ofAnisotropic Behavior of Natural, ko-Consolidated Soft Clay. Soils and Foundations. 40(6): 93-105. , J.-S., Guimaraes, M. & Samacroscale response. Journal of Geotechnical and Geoenvironmental Engineering. 133(9): 1136-1143.
Leroueil, S. 2006. The isotache approach. Where are we 50 years after its development by Professor Suklje? In: Proc. 1
Li, J. Z., Tatsuoka, F., Nishi, T. & Komoto, N. 2003. Viscous stress-strain behaviour of clay under unloaded conditions. In: Proc. 3rd Int. Sym. on Deformation Characteristics of Geomateria03. Balkema, 617–625.
Y., Xu, Y. & Thornton, C. 2005. A comparison of discrete element simulations and experiments for 'sandpiles' composed of spherical particles. Powder
Lin, H. & Penumadu, D. 2005. Experimental investigation on principal stress rotation in Kaolin clay. Journal of Geotechnical and Geoenvironmental Engineering. 131(5): 633-642.
Littmann, W., Storck, H. & Wallaschek, J. 2001. Sliding friction in the presence of ultrasonic oscillations: Superposition of longitudinal oscillations. Archive of Applied Mechanics. 71(8): 549-55
Lupini, J. F., Skinner, A. E. & Vaughan, P. R. 1981. Drained residual strength of cohesive soils. Geotechnique. 31(2): 181-213.
Matsui, T., Ito, T. & Mitchell, J. K. 1980. Microscopic study of mechanisms in soils. American Society of Civil Engineers, Journal of the Geotechnical Engineering Division. 106(2): 137-152.

Matsushita, M., Tatsuoka, F., Koseki, J., Cazacliu, B., Di Benedetto, H. & Yasin, S. J. M. 1999. Time effects on the pre-peak deformation properties of sands. In: Proc. Second Int. Conf. on Pre-Failure Deformation Characteristics of Geomaterials, IS Torino ‘99 (edited by al., J. e.) 1. Balkema, 681–689.
Mi nc.
to the Slab-Mantle Interface in Subduction Zones. International
Mo d natural clays.
Mo oblemas de cimentaciones. In: Proc. 8th
NaNa
Od oils and
Odations. 25(3): 85-97.
its Geotechnique.
Ok ism of the residual strength of clay. In: The
Pal C. 2005. Fabric map for kaolinite: Effects of pH and ionic
Per ction : physical principles and applications. Berlin: Springer.
1): 61.
media. Mechanics of Granular Materials and Powder Systems. 37: 133-
Ro J. 1989. Analytical study of induced anisotropy in idealized granular
Ros. Mechanics of Materials. 16(1-2): 141-152.
Ro n the shear strength of sands in triaxial compression, plane strain
Ru calization of deformation in pressure-sensitive
Ru nal of Geophysical Research.
Matuttis, H. G., Luding, S. & Herrmann, H. J. 2000. Discrete element simulations of dense packings and heaps made of spherical and non-spherical particles. Powder Technology. 109(1-3): 278-292.
Mayne, P. W. & Holtz, R. D. 1985. Effect of Principal Stress Rotation on Clay Strength. In: Proceedings, 11th International Conference on Soil Mechanics and Foundation Engineering 2, San Francisco, 579-582.
Mesri, G. & Olson, R. E. 1970. Shear strength of montmorillonite. Geotechnique. 20(3): 261-270. tchell, J. K. 1993. Fundamentals of Soil Behavior. New York: John Wiley & Sons, I
Miura, K., K., M., Furukawa, M. & Toki, S. 1998. Mechanical characteristics of sands with different primary properties. Soils and Foundations. 38: 159-172.
Moore, D. E. & Lockner, D. A. 2004. Crystallographic controls on the frictional behavior of dry and water-saturated sheet structure minerals. Journal of Geophysical Research. 109(B3): 16.
Moore, D. E. & Lockner, D. A. 2007. Comparative Deformation Behavior of Minerals in Serpentinized Ultramafic Rock: Application Geology Review. 49(5): 401-415. ore, R. 1991. Chemical and mineralogical controls upon the residual strength of pure anGeotechnique. 41(1): 35-47. ya, J. & Rodriguez, J. 1987. El subsuelo de Bogota y los prPanamerican Conf. On Soil Mech. and Found. Engrg., Universidad Nacional de Colombia, 197-264.
rsilio, G. A. & Santamarina, J. C. 2008. Terminal densities. Geotechnique. 58(8): 669-674. wir, H., Tatsuoka, F. & Kuwano, R. 2003. Experimental evaluation of the viscous properties of sand in shear. Soils and Foundations. 43(6): 13-31. a, M. 1972. The mechanism of fabric changes during compressional deformation of sand. SFoundations. 12(2): 1-18. a, M., Nemat-Nasser, S. & Konishi, J. 1985. Stress-induced anisotropy in granular masses. Soils and Found
Ohtsubo, M., Egashira, K. & Kashima, K. 1995. Depositional and post-depositional geochemistry, andcorrelation with the geotechnical properties of marine clays in Ariake Bay, Japan. 45(3): 509-509. awara, M. & Mitachi, T. 2003. Basic research on mechanThird International Symposium on Deformation Characteristics of Geomaterials, (edited by Benedetto, H. D.), IS-Lyon 2003.
Olson, R. E. 1974. Shearing strength of kaolinite, illite, and montmorillonite. Journal of soil mechanics and foundations division, ASCE. 100(11): 1215-1229. omino, A. M. & Santamarina, J.concentration on behavior. Clays and Clay Minerals. 53(3): 211-223. sson, B. N. J. 1998. Sliding fri
Popp, K. & Rudolph, M. 2003. Prevention of stick-slip vibrations by passive normal force control. PAMM 2(1): 68-69.
Rabinowicz, E. 1995. Friction and wear of materials. New York: Wiley. Radjai, F., Wolf, D. E., Jean, M. & Moreau, J.-J. 1998. Bimodal character of stress transmission in
granular packings. Physical Review Letters. 80(Rothenburg, L. 1993. Effects of particle shape and creep in contacts on micromechanical behavior of
simulated sintered granular142.
thenburg, L. & Bathurst, R.materials. Geotechnique. 39(4): 601-614.
thenburg, L. & Bathurst, R. J. 1993. Influence of particle eccentricity on micromechanical behavior of granular material
Rothenburg, L. & Kruyt, N. P. 2004. Critical state and evolution of coordination number in simulated granular materials. International Journal of Solids and Structures. 41(21): 5763-74.
we, P. W. 1969. The relation betweeand direct shear. Gotechnique. 19(1): 75-86.
dnicki, J. W. & Rice, J. R. 1975. Conditions for the lodilatant materials. Journal of the Mechanics and Physics of Solids. 23(6): 371-394.
ina, A. 1983. Slip instability and state variable friction laws. Jour88(B12): 10359-10370.

Santamarina, C. & Cascante, G. 1998. Effect of surface roughness on wave propagation parameters. Geotechnique. 48(1): 129-136.
oil Behavior and Soft Ground
Sav tion in inclined chute flow of dry cohesionless
Serining system vibrations. Soviet Journal of Friction and Wear. 7(2): 58-66.
ara, K.). Balkema, 315-320.
Ske d the laboratory.
Ski terparticle friction on the shearing strength of a random
Sle nics of fault zones
Sor . A. & Simpson, B. 2007. Influence of structure on the time-dependent
Sri haviour of Clays. In: Influence of Mineralogy, in Chemo-Mechanical
Sri the role of the
Stu ibli, K. A., Jeremic, B., Swanson, R. A. &
l Engineering. 131(2): 75-82.
1(3): 350-358. 4th Int. Conf.
Suk A. K. 2001. Quantitative characterisation of the geometry of discrete
Tab amentals of Friction: Macroscopic and
Tan 01. Characterization of
Tat tkul, W. 2008a. Various viscosity
Tat , Y. 2008b.
Tat kamoto, M. 1986. Cyclic undrained biaxial and torsional shear
Tay
): 124-133.
Th n-induced oscillations. Journal of Sound and
Th s of deviatoric shear deformation of granular media.
Tw fficient of friction. Numerical modeling. Wear. 143(1): 175-196.
Santamarina, J. C. 2002. Soil Behavior at the Microscale: Particle Forces, SConstruction - The Ladd Symposium. ASCE Special Publications MIT, Boston, 25-56. age, S. B. & Lun, C. K. K. 1988. Particle size segregagranular solids. Journal of Fluid Mechanics. 189: 311-25. dyuk, L. M. & Mikityanskii, V. V. 1986. Reliability of clamping devices of machine tool fixtures with mach
Shimobe, S. & Moroto, N. 1995. A new classification chart for sand liquefaction. In: Earthquake Geotechnical Engineering (edited by Ishih
Skare, T. & Stahl, J. E. 1992. Static and dynamic friction processes under the influence of external vibrations. Wear. 154(1): 177-92.
Skempton, A. W. 1964. Long-term stability of clay slopes. Geotechnique. 14(2): 77-101. mpton, A. W. 1985. Residual strength of clays in landslides, folded strata anGeotechnique. 35(1): 3-18. nner, A. E. 1969. A note on the influence of inassembly of spherical particles. Geotechnique. 1: 150-177. ep, N. H. 1997. Application of a unified rate and state friction theory to the mechawith strain localization. Journal of Geophysical Research. 102(B2): 2875-95. ensen, K. K., Baudet, Bbehaviour of a stiff sedimentary clay. Geotechnique. 57(9): 783-7.
dharan, A. 2001. Engineering BeCoupling in Clays (edited by Di Maio, C., Hueckel, T. & Loret, B.), Maratea, Italy, 3-28.
dharan, A. & Venkatappa Rao, G. 1979. Shear strength behaviour of saturated clays andeffective stress concept. Geotechnique. 29(2): 177-193. re, S., Costes, N. C., Batiste, S. N., Lankton, M. R., AlShFrank, M. 1998. Mechanics of granular materials at low effective stresses. Journal of Aerospace Engineering. 11(3): 67-72.
Subba Rao, K. S., Allam, M. M. & Robinson, R. G. 1998. Interfacial friction between sands and solid surfaces. Proceedings of the Institution of Civil Engineers, Geotechnica
Suiker, A. S. J. & Fleck, N. A. 2004. Frictional collapse of granular assemblies. Journal of Applied Mechanics, Transactions ASME. 7
Šuklje, L. 1957. The analysis of the consolidation process by the isotache method. In: Proc.on Soil Mech. and Found. Engng. 1, London, 200-206. umaran, B. & Ashmawy, particles. Geotechnique. 51(7): 619-627. or, D. 1992. Friction as a dissipative process. In: FundMicroscopic Processes (edited by Singer, I. L. & M., P. H.). Academic Publishers. aka, H., Locat, J., Shibuya, S., Thiam Soon, T. & Shiwakoti, D. R. 20Singapore, Bangkok, and Ariake clays. Canadian Geotechnical Journal. 38(2): 378-400. suoka, F., Di Benedetto, H., Enomoto, T., Kawabe, S. & Kongkitypes of geomaterials in shear and their mathematical expression. Soils and Foundations. 48(1): 41-60. suoka, F., Di Benedetto, H., Kongkitkul, W., Kongsukprasert, L., Nishi, T. & SanoModelling of ageing effects on the elasto-viscoplastic behaviour of geomaterial. Soils and Foundations. 48(2): 155-174.
Tatsuoka, F., Ishihara, M., Di Benedetto, H. & Kuwano, R. 2002. Time-dependent shear deformation characteristics of geomaterials and their simulation. Soils and Foundations. 42(2): 103-129. suoka, F., Ochi, K., Fujii, S. & Ostrength of sands for different sample preparation methods. Soils and Foundations. 26(3): 23–41. lor, D. W. 1948. Fundamentals of soil mechanics. New York: John Wiley & Sons.
Taylor, P. M. & Pollet, D. M. 2000. A novel technique to measure stick-slip in fabric International Journal of Clothing Science and Technology. 12(2
Terzaghi, K., Peck, R. B. & Mesri, G. 1996. Soil mechanics in engineering practices. New York: Wiley. omsen, J. J. 1999. Using fast vibrations to quench frictioVibration. 228(5): 1079-1102.
ornton, C. 2000. Numerical simulationGeotechnique. 50(1): 43-53. orzydlo, W. W. & Becker, E. 1991. Influence of forced vibrations on the static coe

Vaid, Y. P. & Campanella, G. 1977. Time-dependent behaviour of undisturbed clay. ASCE Journal of the Geotechnical Engineering Division. 103(7): 693-709.
Vaid, Y. P. & Sayao, A. 1995. Proportional Loading Behavior in Sand Under Multiaxial Stresses. Soils and Foundations. 35(3): 23-29.
van Olphen, H. 1977. An introduction to clay colloid chemistry : for clay technologists, geologists, and soil scientists. New York: Wiley.
rdoulakis, I. 1979. Bifurcation anVa alysis of the triaxial test on sand samples. Acta Mechanica. 32(1-3):
Ve n Society
, stress formations,
Wa tructure characteristics and mechanical properties of kaolinite soils. I.
Wa . 1960. Shear Strength of Montmorillonite and Kaolinite Related to
We 2004. Pavement design model for unbound granular
Wi . Strain accumulation in sand due to drained
ng. 122(2): 109-119.
dge.
35-54. sic, A. S. & Clough, G. W. 1968. Behavior of granular materials under high stresses. Americaof Civil Engineers Proceedings, Journal of the Soil Mechanics and Foundations Division. 94(SM3): 661-688.
Vijaywargiya, R. & Green, I. 2007. A finite element study of the deformations, forcesand energy losses in sliding cylindrical contacts. International Journal of Non-Linear Mechanics. 42(7): 914-27.
Wang, Y.-H. & Santamarina, J. C. 2002. Dynamic coupling effects in frictional geomaterials - Stochasticresonance. Journal of Geotechnical and Geoenvironmental Engineering. 128(11): 952-962. ng, Y. H. & Siu, W. K. 2006. SSurface charges and structural characterizations. Canadian Geotechnical Journal. 43(6): 587-600. rkentin, B. P. & Yong, R. NInterparticle Forces. Clays and Clay Minerals. 9: 210-218. rkmeister, S., Dawson, A. R. & Wellner, F.materials. Journal of Transportation Engineering. 130(5): 665-674. chtmann, T., Niemunis, A. & Triantafyllidis, T. 2004uniaxial cyclic loading. In: Int. Conf. on Cyclic Behaviour of Soils and Liquefaction Phenomena. Balkema, Rotterdam, 233-46.
Yamamuro, J. A. & Lade, P. V. 1996. Drained sand behavior in axisymmetric tests at high pressures. Journal of Geotechnical Engineeri
Yimsiri, S. 2001. Pre-failure deformation characteristics of soils: anisotropy and soil fabric, University of Cambri
Youd, T. L. 1973. Factors controlling maximum and minimum densities of sands, Evaluation of Relative Density and Its Role in Geotechnical Projects Involving Cohesionless Soils. In: ASTM STP 523, 98-112.


![[9] shear force n bending moment](https://img.dokumen.tips/doc/110x75/553af101550346f92f8b4613/9-shear-force-n-bending-moment.jpg)


