Embed Size (px)
Citation preview

Doboku Gakkai Ronbunshuu E Vol.64 No.1, 122-141, 2008. 2
THE TRANSFERRED SHEAR FORCE-RELATIVE DISPLACEMENT RELATIONSHIP OF THE SHEAR
CONNECTOR IN STEEL-CONCRETE SANDWICH BEAM AND ITS MODEL
Taufiq SAIDI 1, Hitoshi FURUUCHI 2 and Tamon UEDA 3
1 Dr. Eng., Lecturer, Civil Engineering Department, Syiah Kuala University (Darussalam, Banda Aceh, Indonesia)
E-mail: [email protected] 2 Member of JSCE, Assistant Professor, Div. of Built Environment, Hokkaido University
(Kita 13, Nishi 8, Kita-ku, Sapporo, 060-8628, Japan) E-mail:[email protected]
3 Member of JSCE, Professor, Div. of Built Environment, Hokkaido University (Kita 13, Nishi 8, Kita-ku, Sapporo, 060-8628, Japan)
E-mail:[email protected]
This study investigates the relationship between transferred shear force and relative displacement of the shear connector in steel-concrete sandwich beam. The models, which can consider the effects of the height, thickness and shape of the shear connector, concrete strength, and thickness of the base steel plate where the shear connectors were attached, were proposed. The predicted relationship between transferred shear force and relative displacement as well as the curvature distribution along the vertical part of the shear connector are found to agree with the experimental results. Finite element analysis with the pro-posed model indicates its applicability as a constitutive model for shear connector.
Key Words : shear connector, transferred shear force, relative displacement, equivalent stiffness
1. INTRODUCTION
Steel-concrete sandwich structure is a composite structure in which concrete core is sandwiched be-tween steel skin to act monolithically together with the steel skins and whose behavior is greatly influ-enced by the shearing resistance of the interface between two materials. The shear connectors are required for transfer of shear force between concrete and steel plate in order to develop the composite action. In the analysis of the steel-concrete sandwich beam structures, the composite action between concrete and steel plate should be considered using a transferred shear force-relative displacement relationship of shear connectors. Transferred shear force-relative dis-placement relationships of the shear connector are affected by various factors such as the height, thickness and shape of the shear connector, concrete strength, and the thickness of the base steel plate
where the shear connectors are attached. The transfer capacity of the shear connector has been studied and well understood 1), 2), 3). Researches on shear connector were conducted merely by direct pull-out tests. In actual structures, the shear connec-tor is not only subjected to the transferred shear force but also the compressive force and the local bending deformation of the steel plate. The behavior of the shear connector may be different from those obtained by the direct pull-out test. The study of transferred shear force-relative dis-placement relationship of the shear connector with rather simple assumption of the boundary conditions of the shear connector element in steel-concrete sandwich beam was conducted 4), 5), 6). Even though it could predict the transferred shear force-relative displacement relationship of the shear connector, it could not predict well the curvature distribution along the vertical part of the shear connector. This fact implies that the relationships proposed in the previous studies do not reflect actual mechanical
122
Doboku Gakkai Ronbunshuu E Vol.64 No.1, 122-141, 2008. 2
behavior of shear connector and surrounding con-crete. Therefore, the purpose of this study is to clarify the transferred shear force-relative displacement relationship of the shear connector as well as the curvature distribution along the vertical part of the shear connector, and to develop a rational numerical model which simulates the relationship between the transferred shear force-relative displacement rela-tionship of the shear connector and can predict the curvature distribution along the vertical part as well.
2. STEEL-CONCRETE SANDWICH BEAM TESTS
(1) Specimens and test procedure Experimental program of simply supported sandwich beam with a symmetric loading system was conducted with the aim of studying the me-chanical behavior of the shear connector. Fifteen steel- concrete sandwich beams were built and tested4), 5), 6). All the beams had the same size of 2102 150 250 mm (length width height) as shown in Fig.1. The spacing of the shear connector was 18.15 cm. In order to estimate the vertical com-pressive force in the concrete surrounding the shear connector, a tie plate was welded to flange plates at same location of each shear connector. The surface of the tie plate was not specially treated. The verti-cal compressive force of the concrete is assumed the same as the tensile force of the tie plate. The speci-mens were designed to fail in shear compression failure mode. Details of shear connector dimensions, type of shear connector, thickness of flange plate and con-crete compressive strength, which were the parame-ter of this study, are listed in Table 1, specimen S-1 was taken as a reference specimen for the other specimens. When the height of shear connector was varied, only lower shear connector was changed. Specimen S-NTp which did not have tie plate, and specimen S-OSc which had only one shear connec-tor for each shear span were used to verify the pro-posed model with respect to the effects of the com-
pressive force of the concrete surrounding the shear connector, and the spacing of the shear connector respectively. The load was applied by a hydraulic jack. The measuring system with contact gauges was used to measure relative displacement of shear connector. For specimen that has 40 mm height of shear con-nector, the relative displacement was measured be-tween the top of shear connector and the lower flange plate. While for specimens S-2 and S-3 which have 90 mm and 140 mm height of shear connector, the relative displacement of shear connector to lower flange plate was measured at two points, namely at the height of 90 mm and 40 mm from the lower flange plate. The details of arrangement of contact gauges measuring system are given in Fig.2.The relative displacement can be obtained as a horizontal component of a geometrical deformation of a triangle formed with three contact gauges. Three electrical strain gauges were mounted on
Fig. 1 Detail of specimen S-1
Table 1 Dimensions and type of SC, tf and f ’c
Specimen tf Sizes of SC (mm)*
f ’c
(MPa)Type of
SCS-1 16 40 40 5 24.2 L S-2 16 90 40 5 24.9 L S-3 16 140 40 5 24.9 L S-4 16 40 40 5 33.4 L S-5 16 40 40 5 9.9 L S-6 16 40 40 10 20.2 L S-7 16 40 40 3 17.8 L S-8 12 40 40 5 21.3 L S-9 9 40 40 5 18.7 L S-10 6 40 40 5 22.4 L S-11 16 40 40 5 18.3 L**S-12 16 40 5 21.0 I S-13 16 40 40 5 31.6 T
S-NTp 16 40 40 5 20.2 L S-OSc 16 40 40 5 21.3 L
SC : shear connector (SS400) tf : thickness of flange plate f ’c : compressive strength of concrete
* : the first and last numbers are height and thickness **: in reverse direction of shear connector for specimen S-1
[email protected]=726 [email protected]=726184 18425016 16
1616
25040 40 5
20 20 20 20 20 25 25 25 25 25
The shear connectors that were investigated
6
71 71
1508
123

Doboku Gakkai Ronbunshuu E Vol.64 No.1, 122-141, 2008. 2
both sides of the vertical part of shear connector to measure its deformation. In order to measure the transferred shear force between concrete and flange plate through the shear connector electrical strain gauges were mounted on both sides of flange plate near the shear connector. The strain gauges were also mounted on the both sides of the tie plate to measure the vertical compressive force of the con-crete surrounding the shear connector. Detailed ar-rangement of the electrical strain gauges is shown in Fig.3. During the test, deflection of the specimen, rela-tive displacement of the shear connector and strain of the flange plate, the tie plate and the shear con-nector were measured at every load step. Crack propagation was observed in detail.
(2) Parameter affecting the behavior of shear connector
Generally, the experimental results of the relationship between the transferred shear force and relative displacement are as shown in Fig.4. The transferred shear force was calculated from the dif-ference of tensile forces of the lower flange plate obtained from the measured strains on both sides of the shear connector. The relative displacement of the shear connector linearly increases with increase in transferred shear force until the stiffness of shear
connector, which can be noticed in the measured transferred shear force-relative displacement rela-tionship, suddenly starts to decrease at a certain value of transferred shear force, which was defined as Qc. Then the stiffness of shear connector reduces with an increase in transferred shear force. Qc did not clearly appear for some shear connectors near the supporting point. The first step of the experimental study on the relationship between transferred shear force and relative displacement of the shear connector is to investigate the Qc value for each specimen. The shear connector continues to transfer shear force even after shear cracking in the core con-crete has taken place at the top of the shear connec-tor. It was observed that the Qc of the observed shear connector was affected by crack propagation of the shear connector in front rather than the crack propagation of the observed shear connector itself.
Figure 5 shows the crack pattern in the observed shear span of the specimen S-1. The shear connec-tors SC-1 and SC-2 have a Qc at the applied load of 88 and 216 kN while the shear connector SC-3 did not show the Qc. The thick solid line shows the crack propagation at the moment when the Qcreached at the shear connector behind (cracks start-ing at tip of the shear connectors SC-2 and SC-3 are for the shear connectors SC-1 and SC-2 respec-tively). It can be seen that the shear connector SC-1
Fig. 2 Distance points measured by contact gauges for specimen S-1
Fig. 4 Transferred shear force-relative displacement relationship in specimen S-1
Fig. 3 Location of strain gauges
Fig. 5 Crack pattern in the observed shear span of specimen S-1(number indicating load in tf, 1 tf = 9.81 kN)
60.9 60.1
60.175.0
A
B B’ C C’
hsc=40mm tsc=5mm
Unit: mm
30 30 30 30
31 20 9
55 hsc tsc
Strain gauge
0 0.2 0.4 0.6 0.8 10
50
100
150
Relative Displacement (mm)
Tran
sfer
red
Shea
r For
ce (k
N)
Qc
SC-2 SC-1SC-3 SC-2 SC-1SC-3
reverse side of measuring shear span
124

Doboku Gakkai Ronbunshuu E Vol.64 No.1, 122-141, 2008. 2
reached its Qc even if it did not have any own crack yet (the first crack occurred at load of 127 kN). On the contrary, the shear connector SC-2 did not reach the Qc yet even when its own crack propagated up to the upper flange plate at the applied load of 118 kN.
Figure 6 illustrates what happens at the time of the Qc. After the crack propagates at the shear con-nector in front of the considered shear connector, the concrete block in front of the considered shear con-nector moves and pushes the considered shear con-nector. This movement of the concrete block causes greater relative displacement of the considered shear connector than before the crack propagation, so that the stiffness of the considered shear connector is reduced.
Figure 7 shows the typical stress distribution of the lower flange plate in the observed shear span in specimen S-1. The big local stresses near the shear connector, which were considered to be caused by local bending of the lower flange plate, were meas-ured 4). To avoid the effect of the local bending of the lower flange plate the location of measured strains used to calculate the transferred shear force should be at some distance from a shear connector. In some specimens effects of the local bending were observed at points b, d and f, while hardly observed at points a, c and e in all the specimens. Therefore the difference of measured stresses between points a-c, c-e and e-g was used to calculate the transferred shear force through shear connectors SC-1, SC-2 and SC-3 respectively. Since there are slight differ-ence in stresses between b-c, d-e and f-g, it is con-sidered that there is small shear force transfer due to friction between concrete and flange plate. The cal-culated transferred shear force, therefore, includes this frictional effect. a) Effect of the height of the shear connector, h sc Specimens S-1, S-2 and S-3, whose height of the shear connector was 40 mm, 90 mm and 140 mm, were tested to study the effect of the height of the shear connector. The experimental results of the transferred shear force-relative displacement rela-tionship are shown in Fig.8. Initial stiffness of SC1, SC2 and SC3 in specimens S-1, S-2 and S-3, shown in this figure, are similar except for those of SC-2 in specimen S-1 and SC-3 in specimen 3, the former of
0 0.2 0.4 0.6 0.8 10
50
100
150
Relative Displacement (mm)
Tran
sfer
red
Shea
r For
ce (k
N)
(a) SC-1
S-1 S-2, at 40 mm S-3, at 40 mm
0 0.2 0.4 0.6 0.8 10
50
100
150
Relative Displacement (mm)(b) SC-2
S-1 S-2, at 40 mm S-3, at 40 mm
Tran
sfer
red
Shea
r for
ce (k
N)
0 0.2 0.4 0.6 0.8 10
50
100
150
Relative Displacement (mm)(c) SC-3
S-1 S-2, at 40 mm S-3, at 40 mm
Tran
sfer
red
Shea
r For
ce (k
N)
Fig. 6 What happens at the time of the Qc
Fig. 7 Typical stress distribution of the lower flange plate in specimen S-1
Fig. 8. Transferred shear force-relative displacement relationship in specimen S-1, S-2 and S-3
The movement of the concrete which pushes the shear connector
Compressive force of the surrounding concrete
Qc as a function: - compressive force - compressive strength of the concrete- effective thickness of the concrete - thickness of the shear connector - height of the shear connector
0 100 200 300 400 500 600 7000
60
120
180
240
Distance from support (mm)
Stre
ss (M
Pa)
SC-1
SC-2 SC-3
ab
cd
e f
29.7 kN 59.4 kN 87.8 kN 117.5 kN 148.5 kN 176.3 kN 206.7 kN 235.7 kN 266.1 kN 291.9 kN 303.3 kN
g
125
Doboku Gakkai Ronbunshuu E Vol.64 No.1, 122-141, 2008. 2
which is larger and the latter of which is smaller than the others. Since there is no clear difference among specimens S-1, S-2 and S-3, it is assumed that the height of shear connector has negligible ef-fect on the stiffness of shear connector.
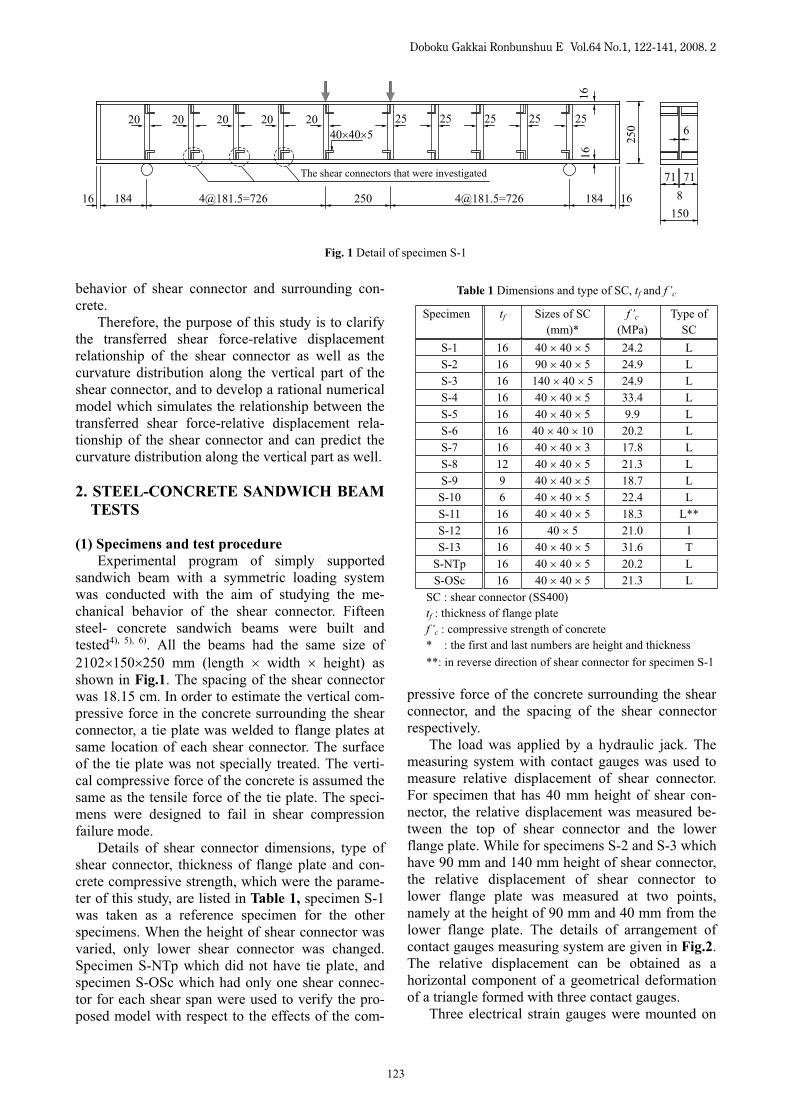
Figure 9 shows the relationship between Qc and height of the shear connector. It can be seen clearly that for the same level of the compressive force, F’com the Qc decreases with increase in height of the shear connector. F’com is defined as reaction force of tensile force in a tie plate which is obtained from its measured strain. Using strains measured by the strain gauges, which were attached on the shear connector, the curvature distribution along the vertical part of the shear connector was investigated. The curvature is calculated by dividing the difference between the strains on both sides of the shear connector by its thickness. Figure 10 shows the experimental results of the curvature distribution of the specimens S-1, S-2 and S-3 at the almost same level of the trans-ferred shear force. It can be seen that similar curva-ture distributions among those specimens which have positive curvature near the flange plate, a peak of negative curvature between 30 to 40 mm and zero
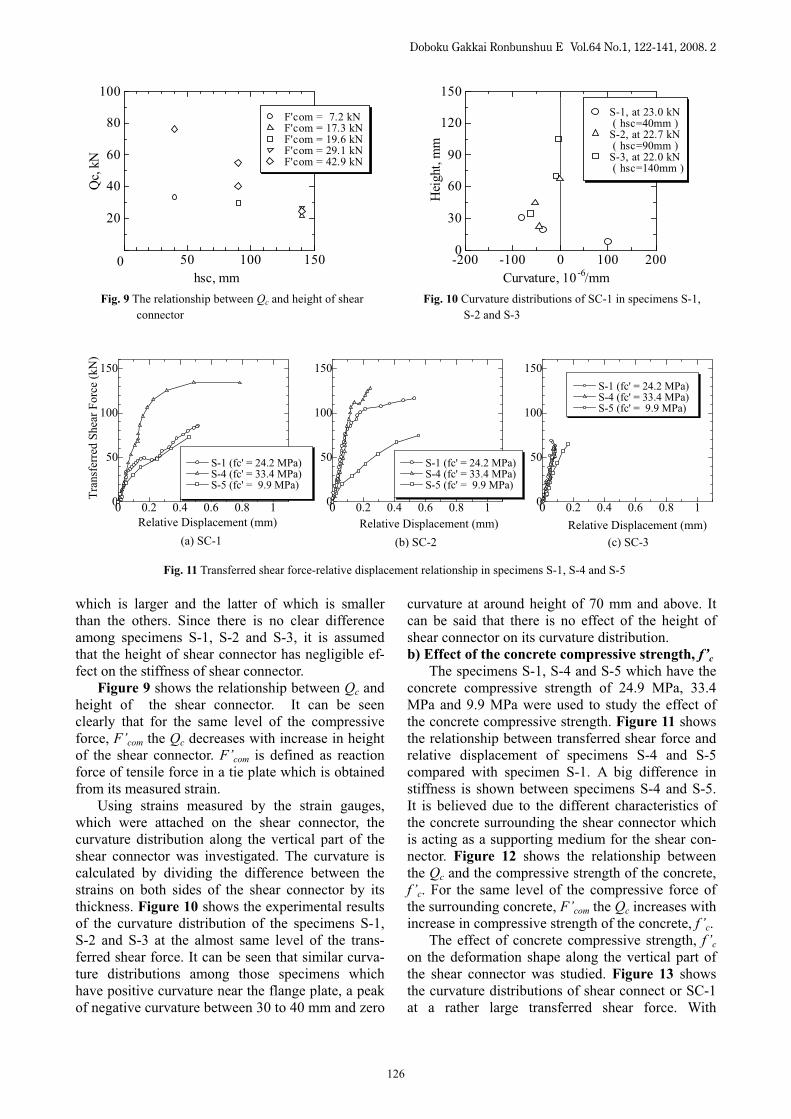
curvature at around height of 70 mm and above. It can be said that there is no effect of the height of shear connector on its curvature distribution.b) Effect of the concrete compressive strength, f’c The specimens S-1, S-4 and S-5 which have the concrete compressive strength of 24.9 MPa, 33.4 MPa and 9.9 MPa were used to study the effect of the concrete compressive strength. Figure 11 shows the relationship between transferred shear force and relative displacement of specimens S-4 and S-5 compared with specimen S-1. A big difference in stiffness is shown between specimens S-4 and S-5. It is believed due to the different characteristics of the concrete surrounding the shear connector which is acting as a supporting medium for the shear con-nector. Figure 12 shows the relationship between the Qc and the compressive strength of the concrete, f ’c. For the same level of the compressive force of the surrounding concrete, F’com the Qc increases with increase in compressive strength of the concrete, f ’c. The effect of concrete compressive strength, f ’con the deformation shape along the vertical part of the shear connector was studied. Figure 13 showsthe curvature distributions of shear connect or SC-1 at a rather large transferred shear force. With
Fig. 9 The relationship between Qc and height of shear Fig. 10 Curvature distributions of SC-1 in specimens S-1, connector S-2 and S-3
Fig. 11 Transferred shear force-relative displacement relationship in specimens S-1, S-4 and S-5
50 100 150
20
40
60
80
100
0hsc, mm
Qc,
kN
F'com = 7.2 kN F'com = 17.3 kN F'com = 19.6 kN F'com = 29.1 kN F'com = 42.9 kN
-200 -100 0 100 2000
30
60
90
120
150
Curvature, 10-6/mm
Hei
ght,
mm
S-1, at 23.0 kN ( hsc=40mm )
S-2, at 22.7 kN ( hsc=90mm )
S-3, at 22.0 kN ( hsc=140mm )
0 0.2 0.4 0.6 0.8 10
50
100
150
Relative Displacement (mm)
Tran
sfer
red
Shea
r For
ce (k
N)
(a) SC-1
S-1 (fc' = 24.2 MPa) S-4 (fc' = 33.4 MPa) S-5 (fc' = 9.9 MPa)
0 0.2 0.4 0.6 0.8 10
50
100
150
Relative Displacement (mm)(b) SC-2
S-1 (fc' = 24.2 MPa) S-4 (fc' = 33.4 MPa) S-5 (fc' = 9.9 MPa)
0 0.2 0.4 0.6 0.8 10
50
100
150
Relative Displacement (mm)(c) SC-3
S-1 (fc' = 24.2 MPa) S-4 (fc' = 33.4 MPa) S-5 (fc' = 9.9 MPa)
126

Doboku Gakkai Ronbunshuu E Vol.64 No.1, 122-141, 2008. 2
increase of transferred shear force the smaller con-crete compressive strength gives a bigger curvature at the height of 20 mm and 31.25 mm from the bot-tom as shown in the figure. An unexpected result was shown for the height of 8.75 mm measured point between specimens S-1 and S-5. The curvature of the specimen S-5 was smaller than that of speci-mens S-1 and S-4 even if its concrete compressive strength was smaller. This kind of scatter in the ex-perimental result was observed in other specimens as well. This may be due to the effect of the rotation of the lower flange plate at the location of the shear connector. The same phenomenon was also ob-served for shear connector SC-3. c) Effect of thickness of the shear connector, tsc Specimens S-6 and S-7 together with specimen S-1 were tested to study the effect of the shear con-nector thickness, tsc. The thickness of the shear con-nector for each specimen was 3 mm, 5 mm and 10 mm for specimens S-7, S-1 and S-6 respectively. Figure 14 shows the experimental result of the rela-tionship between transferred shear force and relative displacement. It can be seen that the thick shear connector gives small relative displacement. The relative displacement for shear connector SC-3 in
specimen S-6 was almost zero. Figure 15 shows the relationship between Qc
and the thickness of shear connector, tsc. At the same level of F’com the thick shear connector has a bigger Qc value. Since the difference in concrete compres-sive strength among specimens S-1, S-6 and S-7 (see Table 1) can not explain fully the increases in Qc, it is believed that Qc increase with shear con-nector thickness.
Figure 16 shows the curvature distributions of the shear connector for the tested specimens. Specimen S-6 with thickness of 10 mm gave a smaller curvature compared with specimen S-1 with thickness of 5 mm. On the contrary, specimen S-7 with thickness of 3 mm gave a smaller curvature compared with specimen S-1. d) Effect of the thickness of lower flange plate, t f Specimens S-8, S-9 and S-10 together with specimen S-1 were investigated to study the effect of thickness of lower flange plate on the transferred shear force-relative displacement relationship of shear connector. The thickness of the lower flange plate was 16 mm, 12 mm, 9 mm and 6 mm for specimens S-1, S-8, S-9 and S-10 respectively. Since the thickness of the lower flange plate
Fig. 12 The relationship between Qc and concrete Fig. 13 Curvature distributions in specimen compressive strength, f ’c S-1( f ’c=24.2 N/mm2) , S-4 ( f ’c=33.4 N/mm2) and S-5 ( f ’c=9.9 N/mm2)
Fig. 14 Transferred shear force-relative displacement relationship in specimen S-1, S-6 and S-7
10 20 30 40
50
100
0
F'com = 7.0 kN F'com = 7.2 kN F'com = 14.5 kN F'com = 42.9 kN
fc', N/mm2
Qc,
kN
-400 -200 0 200 4000
10
20
30
40
Curvature, 10-6/mm
Hei
ght,
mm
S-1 at 48.4 kN S-4 at 44.0 kN S-5 at 48.7 kN
0 0.2 0.4 0.6 0.8 10
50
100
150
Relative Displacement (mm)
Tran
sfer
red
Shea
r For
ce (k
N)
(a) SC-1
S-1 (tsc = 5 mm) S-6 (tsc = 10 mm) S-7 (tsc = 3 mm)
0 0.2 0.4 0.6 0.8 10
50
100
150
Relative Displacement (mm)(b) SC-2
S-1 (tsc = 5 mm) S-6 (tsc = 10 mm) S-7 (tsc = 3 mm)
0 0.2 0.4 0.6 0.8 10
50
100
150
Relative Displacement (mm)(c) SC-3
S-1 (tsc = 5 mm) S-6 (tsc = 10 mm) S-7 (tsc = 3 mm)
127

Doboku Gakkai Ronbunshuu E Vol.64 No.1, 122-141, 2008. 2
does not affect the initial stiffness of the shear con-nector, the difference in relative displacement, which is shown in Fig.17, is probable due to rota-tion of the lower flange plate at the shear connector. The difference in Qc among different shear connec-tors is due to the difference in compressive force of surrounding concrete. Fig.18 shows the curvature distribution of the tested specimens for shear con-nector SC-1. It seems that there is not clear effect of thickness of lower flange plate on the curvature. e) Effect of shape of shear connector The results of specimens S-11, S-12 and S-13 together with specimen S-1 were compared to study the effect of shape of the shear connector. The shape of the shear connector was L-, I- and T-shape for specimens S-11, S-12 and S-13, respectively. It should be noted that the direction of the shear con-nector for specimen S-11 was in reverse direction of the shear connector for specimen S-1.
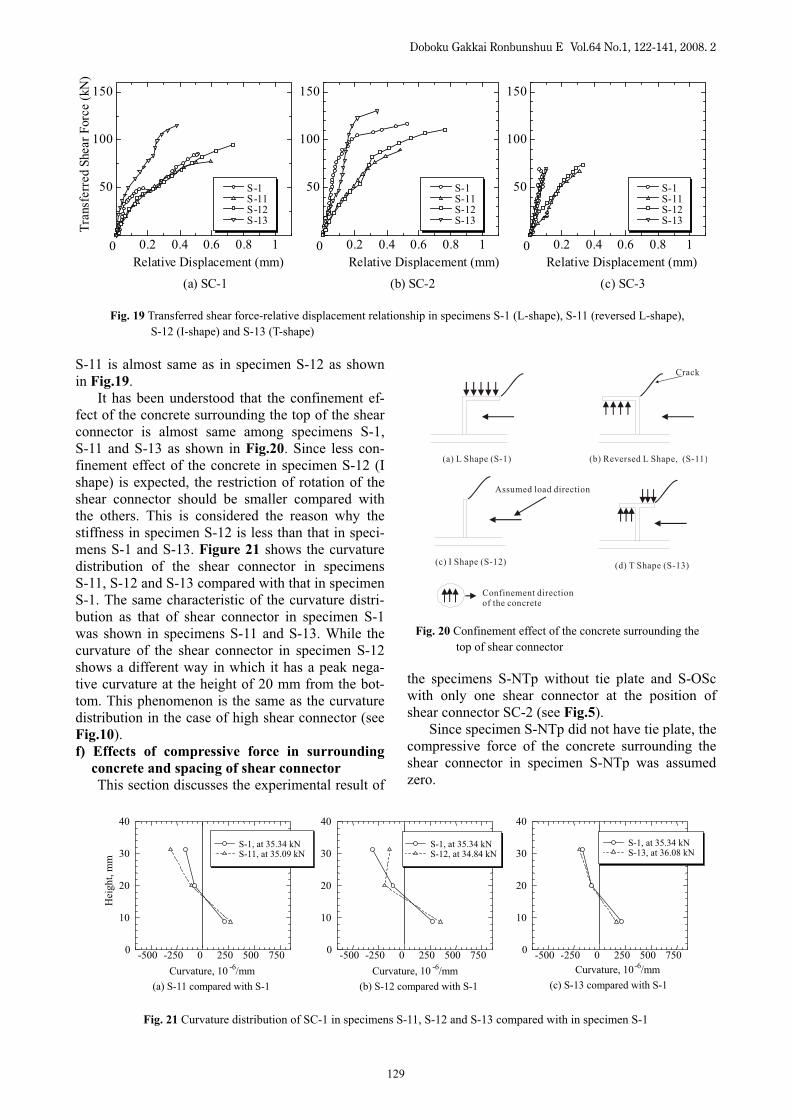
Figure 19 shows the experimental result of the transferred shear force-relative displacement rela-tionship of the tested specimens compared with that of specimen S-1. It was observed that for shear connector SC-1 the stiffness of shear connector in all the specimens was almost same until around 20
kN of transferred shear force. Then the stiffness of shear connector in specimens S-11 and S-12 start to decrease while the stiffness in specimen S-13 was kept constant until the transferred shear force reached Qc which was almost same as in specimen S-1. Stiffness of shear connector SC-2 and SC-3 in specimen S-13 is almost same as the stiffness of shear connector in specimen S-1, and in specimen
Fig. 15 Relationship between Qc and thickness of shear Fig. 16 Curvature distribution of shear connector SC-1 in connector specimens S-1( tsc=5mm), S-6( tsc=10mm) and
S-7( tsc=3mm)
Fig. 17 Transferred shear force-relative displacement relationship in specimens S-1, S-9, S-10and S-11
5 10 15
50
100
0tsc, mm
Qc,
kN
F'com = 7.2 kN F'com = 9.2 kN F'com = 15.8 kN F'com = 31.6 kN F'com = 42.9 kN
-600 -400 -200 0 200 400 6000
10
20
30
40
Curvature, 10-6/mm
Hei
ght,
mm
S-1 , at 71.9 kN S-6 , at 70.2 kN S-7 , at 71.7 kN
0 0.2 0.4 0.6 0.8 10
50
100
150
Relative Displacement (mm)
Tran
sfer
red
Shea
r For
ce (k
N)
(a) SC-1
S-1 (tf = 16 mm) S-8 (tf = 12 mm) S-9 (tf = 9 mm) S-10 (tf = 6 mm)
0 0.2 0.4 0.6 0.8 10
50
100
150
Relative Displacement (mm)(b) SC-2
S-1 (tf = 16 mm) S-8 (tf = 12 mm) S-9 (tf = 9 mm) S-10 (tf = 6 mm)
0 0.2 0.4 0.6 0.8 10
50
100
150
Relative Displacement (mm)(c) SC-3
S-1 (tf = 16 mm) S-8 (tf = 12 mm) S-9 (tf = 9 mm) S-10 (tf = 6 mm)
Fig. 18 Curvature distribution of shear connector SC-1 in specimens S-1 (tf=16mm), S-8 (tf=12mm), S-9 (tf=9mm) and S-10 (tf=6mm)
-400 -200 0 200 4000
10
20
30
40
Curvature, 10-6/mm
Hei
ght.
mm
S-1 , at 22.9 kN S-8 , at 22.2 kN S-9 , at 25.3 kN S-10, at 23.6 kN
128
Doboku Gakkai Ronbunshuu E Vol.64 No.1, 122-141, 2008. 2
S-11 is almost same as in specimen S-12 as shown in Fig.19. It has been understood that the confinement ef-fect of the concrete surrounding the top of the shear connector is almost same among specimens S-1, S-11 and S-13 as shown in Fig.20. Since less con-finement effect of the concrete in specimen S-12 (I shape) is expected, the restriction of rotation of the shear connector should be smaller compared with the others. This is considered the reason why the stiffness in specimen S-12 is less than that in speci-mens S-1 and S-13. Figure 21 shows the curvature distribution of the shear connector in specimens S-11, S-12 and S-13 compared with that in specimen S-1. The same characteristic of the curvature distri-bution as that of shear connector in specimen S-1 was shown in specimens S-11 and S-13. While the curvature of the shear connector in specimen S-12 shows a different way in which it has a peak nega-tive curvature at the height of 20 mm from the bot-tom. This phenomenon is the same as the curvature distribution in the case of high shear connector (see Fig.10).f) Effects of compressive force in surrounding
concrete and spacing of shear connector This section discusses the experimental result of
the specimens S-NTp without tie plate and S-OSc with only one shear connector at the position of shear connector SC-2 (see Fig.5). Since specimen S-NTp did not have tie plate, the compressive force of the concrete surrounding the shear connector in specimen S-NTp was assumed zero.
Fig. 19 Transferred shear force-relative displacement relationship in specimens S-1 (L-shape), S-11 (reversed L-shape), S-12 (I-shape) and S-13 (T-shape)
Fig. 20 Confinement effect of the concrete surrounding the top of shear connector
0.2 0.4 0.6 0.8 1
50
100
150
0Relative Displacement (mm)
Tran
sfer
red
Shea
r For
ce (k
N)
(a) SC-1
S-1 S-11 S-12 S-13
0.2 0.4 0.6 0.8 1
50
100
150
0Relative Displacement (mm)
(b) SC-2
S-1 S-11 S-12 S-13
0.2 0.4 0.6 0.8 1
50
100
150
0Relative Displacement (mm)
(c) SC-3
S-1 S-11 S-12 S-13
Assumed load direction
(b) Reversed L Shape, (S-11)
(c) I Shape (S-12)
(a) L Shape (S-1)
(d) T Shape (S-13)
Crack
Confinement directionof the concrete
Fig. 21 Curvature distribution of SC-1 in specimens S-11, S-12 and S-13 compared with in specimen S-1
Curvature, 10-500 -250 0 250 500 7500
10
20
30
40
Curvature, 10 -6/mm
S-1, at 35.34 kN S-12, at 34.84 kN
(b) S-12 compared with S-1
-500 -250 0 250 500 7500
10
20
30
40
Curvature, 10 -6/mm
Hei
ght,
mm
S-1, at 35.34 kN S-11, at 35.09 kN
(a) S-11 compared with S-1
-500 -250 0 250 500 7500
10
20
30
40
-6/mm
S-1, at 35.34 kN S-13, at 36.08 kN
(c) S-13 compared with S-1
129

Doboku Gakkai Ronbunshuu E Vol.64 No.1, 122-141, 2008. 2
Effect of spacing of shear connector was studied from specimen S-OSc. It was considered that the bigger spacing between the shear connectors gave the smaller confinement of the concrete between shear connectors. Figure 22 shows the experimental result of the relationship between transferred shear force and relative displacement of the shear con-nector in specimen S-NTp compared with shear connector in specimen S-1. It can be seen that the shear connector in specimen S-NTp had relative displacement similar to that of the shear connector in specimen S-1. Values of Qc in specimen S-NTp are smaller than those in specimen S-1. Figure 22(b) shows the experimental relationship between the transferred shear force and relative displacement of shear connector in specimen S-OSc compared with that in specimen S-1. It seems that the stiffness in specimen S-OSc is smaller than that in specimen S-1. The similar value of curvature distribution tothat of shear connector in specimen S-1 can be seenin specimen S-NTp as shown in Fig.23. It can be said that the absence of tie plate at the position of the shear connector does not affect the stiffness or curvature of the shear connector. As its transferred shear force increases differ-ence in curvature distributions between specimens
S-OSc and S-1 can be seen as in Fig.24. Because the relative displacement as well as the curvature distribution of the shear connector in specimen S-OSc are bigger than those in specimen S-1, it can be said that the absence of the shear con-nector behind the observed shear connector will re-duce the stiffness of the observed shear connector.
3. ANALYTICAL MODELING
(1) General In order to explain the experimental result of the transferred shear force-relative displacement rela-tionship as well as the curvature distribution along the vertical part of the shear connector, beam, which is with equivalent stiffness and subjected to distrib-uted load, on the elastic foundation was introduced (see Fig.25).
ykp (1)
This constant of the supporting medium, k is called the modulus of the foundation. The reaction force is assumed to be acting normally to the shear connector axis and opposing the deflection of the shear connector. The differential equation for the deflection curve
Fig. 22 Transferred shear force-relative displacement relationship in specimens S-NTp and S-OSc compared with in specimen S-1
Fig. 23 Curvature distribution of shear connector SC-1 in Fig. 24 Curvature distribution of shear connector in specimen specimen S-NTp compared with in specimen S-1 S-OSc compared with that in specimen S-1
0 0.2 0.4 0.6 0.8 10
50
100
150
Relative Displacement (mm)
Tran
sfer
red
Shea
r For
ce (k
N
(a) SC-1
S-1 S-NTp
0 0.2 0.4 0.6 0.8 10
50
100
150
Relative Displacement (mm)(b) SC-2
S-1 S-NTp S-OSc
0 0.2 0.4 0.6 0.8 10
50
100
150
Relative Displacement (mm)(c) SC-3
S-1 S-NTp
)
-500 -250 0 250 5000
10
20
30
40
Curvature, 10-6/mm
Hei
ght,
mm
S-1, 16.31 kN S-NTp, 16.31 kN
-500 -250 0 250 5000
10
20
30
40
Curvature, 10-6/mm
Hei
ght,
mm
S-1, 16.31 kN S-NTp, 16.31 kN
130

Doboku Gakkai Ronbunshuu E Vol.64 No.1, 122-141, 2008. 2
of a beam supported on an elastic foundation is shown as follows:
qykdx
ydEI 4
4 (2)
where: EI : stiffness of the shear connector with the
concrete surrounding the shear connector y : relative displacement k : modulus of the foundation q : uniformly distributed load
(2) Boundary conditions of the shear connector The L- and T- shaped shear connector element in steel concrete sandwich beam is assumed as shown in Fig.25. EI is assumed as the stiffness of a com-posite beam consisting of the shear connector and the concrete surrounding the shear connector. Andthen it is assumed that a nonlinear behavior of shear connector is brought by decreasing the stiffness of the concrete part as the transferred shear force in-creases. The fixed end at the bottom and no rotation at the top of shear connector but free horizontal movement are assumed as the boundary condition. Although observed stiffness for the reversed L-shaped shear connector is smaller than that of L-shaped shear connector (see Fig.19), the boundary condition for both cases is assumed to be the same for simplicity. The shear force, Q will be equal to 0 at x equal to height of the shear connector, h sc. Based on the above assumptions as well as Eq.(2), the formula for displacement, y, slope, ,moment, M, and shear force, Q can be expressed as follows 7):
xFQEI
xFMEI
yx 40330211
duuxFqEI
x
c43
1 (3.a)
xFQEI
xFMEIdx
dy
x30220
11
duuxFqEI
x
c32
1 (3.b)
xFQxFMdx
ydEIx
30102
2 1
duuxFqx
c2
1 (3.c)
xFQxFMdx
ydEIx
10403
34
duuxFqx
c1 (3.d)
where:
44EI
k
xxxF coscosh1
xxxxxF cossinhsincosh21
2
xxxF sinsinh21
3
xxxxxF cossinhsincosh21
4
Considering the boundary conditions at the both ends of the shear connector (see Fig.25), two un-known boundary conditions at the bottom, M0 and Q0 can be solved as follows:
sc
sc
hF
AqhFQM
2
30
04 (4)
sc
sc
sc
sc
scsc
hFhF
hFhF
qhF
BhF
A
Q
4
1
2
3
42
22
0
4
84 (5)
Fig. 25 L- and T-shaped shear connector element in steel concrete sandwich beam
y’=0, Q=0 y
EI
k
d
c
hsc
y=0, y’=0
Q0
M0
x
q
131

Doboku Gakkai Ronbunshuu E Vol.64 No.1, 122-141, 2008. 2
where:
chchchchdh
dhdhdhA
scsc
scscsc
scscsc
cossinhsincoshcos
sinhsincosh
chchchchdh
dhdhdhB
scsc
scscsc
scscsc
cossinhsincoshcos
sinhsincosh
The free end condition was assumed as the boundary condition at the top of I-shaped shear connector while the condition at the bottom was as-sumed the same as the boundary of L-shape as shown in Fig.26. The two unknown boundary con-ditions, M0 and Q0 for I-shaped shear connector can be solved as follows:
sc
sc
hFQDqhF
M 202
10 2
1 (6)
sc
sc
sc
sc
scsc
hFhF
hFhF
qhF
BhF
D
Q
4
1
1
2
410
4
82 (7)
where:
chchdhdh
Dscsc
scscsinhsinsinhsin
During the process of identifying values for constants, it was found that the predicted relative displacement was smaller than the experimental re-sult when the predicted curvature was the same as the experimental one. It was considered, therefore, that there is rotation at the bottom of the shear con-nector. Hence, the remainder of the relative dis-placement was predicted assuming hinge as a boundary condition at the bottom. Use 0 , which is the slope at the bottom, as substitute for M0 in Eq.(3), the formula for dis-placement, y, slope, , moment, M and shear force, Q with hinge as a boundary condition at the bottom can be expressed as follows:
xFQEI
xFyx 4032011
duuxFqEI
x
c43
1 (8.a)
xFQEI
xFdxdy
x30210
1
duuxFqEI
x
c32
1 (8.b)
xFQxFkdx
ydEIx
304032
2 1
duuxFqx
c2
1 (8.c)
xFQxFkdx
ydEIx
10223
3
duuxFqx
c1 (8.d)
Considering the boundary conditions at the both ends of the shear connector, two unknown boundary conditions, 0 and Q 0 can be solved as Eqs.(9) and (10) for L- or T-shaped shear connector and Eqs.(11) and (12) for I- shaped shear connector, respectively.
scsc
hFQBqhFk 10
3
2
0 2 (9)
sc
sc
sc
sc
scsc
hFkhF
hFEI
hFhFk
BqhFEI
Aq
Q
3
12
12
3
313
024 (10)
Fig. 26 I-shaped shear connector element in steel concrete sandwich beam
M=0, Q=0 y
EI
k
d
c
hsc
y=0, y’=0
Q0
M0
x
q
132

Doboku Gakkai Ronbunshuu E Vol.64 No.1, 122-141, 2008. 2
sc
sc
hFQDqhFk
202
4
3
0 2 (11)
khFhF
hFhF
qhkF
BhkF
D
Q
sc
sc
sc
sc
scsc2
3
1
4
2
340
22 (12)
(3) The location of distributed load, q The location of distributed load, q on shear con-nector affects the curvature distribution along the vertical part of the shear connector. The study of the curvature distribution with various location of q was conducted to select the best location for prediction of the experimental results. It was observed that at the height of around 70 mm and above the curvature is almost zero (see Fig.10). It can be said that at this portion the reac-tion force (p = ky) was balanced with the distributed load, q. In the other word, the portion of the shear connector over 70 mm does not affect the trans-ferred shear force. Hence, in the analysis the maxi-mum height of the shear connector was 70 mm. The effects of the starting point, c of the uni-formly distributed load as well as the end point, d(see Fig.25) on the curvature distribution of the shear connector are shown in Fig.27. The observed curvature distribution indicates that positive curva-ture is found near the flange plate, that a peak of negative curvature is found between 30 and 40 mm, and that zero curvature is found around height of 70 mm. Comparing the nature of the observed curva-ture distribution curve with that of calculated ones, c=20 mm and d = h sc (but not greater than 70 mm) were chosen. Since the same characteristics of the
curvature distribution were observed among L-, T- and reversed L- shaped shear connectors, the above assumption of q range can be used for those cases. As already discussed in Sec. 2 (2) e), although the height of I-shaped shear connector is short (40 mm) the curvature distribution same as that of high shear connector which has a peak negative value of the curvature (see Fig.21(b)). In order to have a peak negative value in the analysis, the end point of distributed load, d should be reduced. It was found that d equal to hsc – 10 mm gives a good agreement with the experimental ones. The reduction of d for I-shaped shear connector may not be explained clearly at present.
(4) Characteristics of initial stiffness in shear connector models and its value
It is believed that the initial modulus of the foundation, ki is affected by the characteristics of the concrete as a supporting medium of the shear connector. The try and error method was used to determine the ki value suitable to the present study. The ki value was chosen, comparing analytical re-sults of curvature distribution along the vertical part of the shear connector as well as the relationship between the transferred shear force and relative dis-placement with the experimental ones. From the analytical study it was understood that the ki extends its influence on the curvature distri-butions rather than the stiffness of the shear con-nector. Table 2 shows the details of the analytical result for small and large ki to be compared with the experimental ones. The stiffness of beam on the foundation was assumed the same as that of shear connector itself. It can be seen that as ki increases around 300 times the stiffness, Q0 / increases only 3.5 times. From these facts, it can be said that the stiffness Q0 / experimentally observed can not be obtained
Fig. 27 Effect of the location of distributed load, q on the curvature distribution of the shear connector in specimens S-1, S-2 and S-3
-200 0 200 400 6000
10
20
30
40
50
60
70
c = 10 mm c = 20 mm c = 30 mm
S-1 S-2 S-3
Curvature (10-6/mm)
Hei
ght (
mm
)
(a) Effect of c on the curvature distribution of the shear connector (d = hsc)
-200 0 200 400 6000
10
20
30
40
50
60
70
S-1 S-2 S-3
Curvature (10-6/mm)
Hei
ght (
mm
)
d = 70 mm d = 50 mm d = 30 mm
(b) Effect of d on the curvature distribution of the shear connector (c = 20 mm)c
d=hscc
d
133

Doboku Gakkai Ronbunshuu E Vol.64 No.1, 122-141, 2008. 2
without providing some additional stiffness to theshear connector stiffness. Therefore it is understood that the concrete surrounding the shear connector is not only acting as supporting medium for the shear connector but also acting as a composite element for the shear connector. Hence the concept of the equivalent stiffness of the shear connector, which has been proposed in a previous study 4), was used as the stiffness of the shear connector. The initial equivalent stiffness of the shear connector, (EI)eq.i is the summation of the stiffness of the shear connec-tor itself, (EI)sc and the effective stiffness of the concrete surrounding the shear connector, (EI)cwhich can be expressed as follows:
cscieq EIEIEI . (13)
Based on the test result and discussion in Sec. 2 (2), the concrete compressive strength and the thickness of the shear connector affects the equiva-lent stiffness of the shear connector. It was also found that the fixed condition at the top of shear connector as well as the spacing between the shear connector influences the equivalent stiffness of the shear connector. Specimens S-1, S-4 and S-5 were used to inves-tigate ki as well as the effective stiffness of the con-crete surrounding the shear connector, (EI)c. It was observed in the experiment that both of ki and (EI)care proportional to the elastic modulus of the con-crete as shown in Fig.28 and Table 3. The relation-ship between ki and elastic modulus of concrete, Eccan be expressed as the following equation:
ci Ek 00818.0 (14)
The elastic modulus of the concrete, Ec can be calculated by Eq.(15) 8).
( 30cf MPa)
4103.06
182.2 cc
fE (15.a)
( 4030 cf MPa)
4103.010
308.2 cc
fE (15.b)
(40 MPa cf )
4102.010
401.3 cc
fE (15.c)
The effective stiffness of the concrete surround-ing the shear connector, (EI)c was obtained from the
experimental result in such a way that the elastic modulus, E in (EI)c was assumed to be the elastic modulus of concrete, while the effective moment of inertial Ic was kept constant. Table 3 shows the effective thickness, tc calculated from Ic, which was used for all the specimens except specimens S-12 and S-OSc. The stiffness of the shear connector it-self for different thickness of the shear connector, tscis shown in Table 4. It was found that the effective stiffness of the surrounding concrete of the I- shaped shear
Table 2 The details of analytical result for small and large ki
ki*kN/mm2
** mm
Q0***kN
0Q
Exp. ---- 0.051 33.4 659 Run no.1 31.4 0.051 1.26 25.0 Run no.2 10,000 0.38 33.2 87.6
* Modulus of the foundation, ** Displacement at the top, *** Transferred shear force
Table 3 The investigated value of ki and (EI)c
Specimen ki*kN/mm2
(EI)c**kN-mm2
Ec***MPa
tc****mm
S-1 211 6.21 106 25000 27.1 S-4 234 7.18 106 29000 27.1 S-5 145 4.46 106 17900 27.1 S-12 211 2.60 106 23600 20.6
S-OSc 211 5.86 106 23600 26.5
* Experimental value, ** (EI)c = EcIc,
*** Calculated from Eq.(15), **** 3 12 cc It
Table 4 Stiffness of the shear connector itself
Specimen tsc
mmEsc
GPa (EI)sc*
kN-mm2
All** 5 213 3.33 105
S-6 10 213 2.67 106
S-7 3 213 7.22 104
* (EI)sc=EscIsc, ** Except S-6 and S-7
Fig. 28 L- and T-shaped shear connector element in steel concrete sandwich beam
0 10000 20000 300000
100
200
300
Ec, MPa
ki, k
N/m
m2
134

Doboku Gakkai Ronbunshuu E Vol.64 No.1, 122-141, 2008. 2
connector, which was obtained from the experimen-tal result, reduces to be less than a half of that of the L- shaped shear connector. While the experimental result of specimen S-OSc, which has only one shear connector, showed the reduction to about 90 % of the effective stiffness of concrete surrounding of the shear connector in specimen S-1 that has three shear connectors in shear span. Values for (EI)c and tc of these cases are given in Table 3.
(5) Transferred shear force-relative displacement relationship in model
The relative displacement of the shear connector linearly increases with increase in transferred shear force until a sudden decrease of the initial value of kiand equivalent stiffness of the shear connector, (EI)eq.i starts at a transferred shear force, Qc. Then the ki as well as (EI)eq.i reduces with an increase in transferred shear force. From the experimental results, it was observed that the Qc increased in proportion to square root of the compressive strength of concrete, f ’c, effec-tive thickness of surrounding concrete, tc and thick-ness of the shear connector, tsc. Regarding the effect of the height of the shear connector, hsc, Qc in-creased in proportion to the inverse of hsc
0.8. Thefollowing equation is proposed to estimate Qc:
8.05.000542.0000216.0
sc
sccscccomc h
ttbfFQ (16)
Figure 29 shows relationship between Qc and the corresponding compressive force of concrete surrounding the shear connector, F’com. For trans-ferred shear force over the Qc both of the initial equivalent stiffness of the shear connector, (EI)eq.iand the modulus of foundation, ki reduce with in-crease in transferred shear force as in the following equation:
sc
n
a
cieq
n
a
creq EI
QQEI
QQEI 1.. (17)
i
n
a
cr k
QQk (18)
where:n = reduction factor, 2 for L or T shape and 1.5
for I shape.
As already discussed in Sec. 2 (2) d), the addi-tional displacement should be considered due to ro-tation of the lower flange plate near the shear con-nector. From the experimental data of specimens S-1, S-8, S-9 and S-10, which have different thick-ness of lower flange plate, the relationship between the rotation stiffness of the lower flange plate and the stiffness of lower flange plate was studied. The difference between the predicted relative displacement and the experimental one is considered as the additional relative displacement due to rota-tion of lower flange plate. At the same time, the moment at the bottom of the shear connector, M0 is considered as the moment that causes rotation of lower flange plate. Considering the hinge end at the bottom as well as the remainder relative dis-placement the rotation ( 0 ) can be predicted. Fig-ure 30 shows the relationship between the rotation stiffness of the lower flange plate, M / and the stiffness of lower flange plate, EI. Although there is a big scatter, the proportional relationship is as-sumed as expressed by the following equation:
EIM3.1
1
0 (19)
(M in kN-m and EI in kN-m2)
Fig. 29 The relationship between Qc and corresponding Fig. 30 The relationship between rotation stiffness and stiffness compressive force of lower flange plate
0 10 20 30 40 500
0.01
0.02
0.03Q
c.(h
sc0.
8 /fc'0.
5 .bsc
.tc.ts
c)
F'com
Eq. 16
Qc (
h sc0.
8 / f c’
0.5 b
sc t c
t sc )
0 3000 6000 9000
-15000
-10000
-5000
0
EI (kN-m2)
M/th
eta
tf = 16 mm tf = 12 mm tf = 9 mm tf = 6 mm
Eq. 19M/
135

Doboku Gakkai Ronbunshuu E Vol.64 No.1, 122-141, 2008. 2
The predicted transferred shear force is the sum-mation of transferred shear force in fixed end at the bottom, Q0.1 and hinge end at the bottom, Q0.2 of the shear connector. The same goes for relative dis-placement as well as curvature distribution of the shear connector as shown in equations below:
2.01.00QQQ x (20)
2.1. schschschx yyy (21)
2.1. scscsc (22)
During the analytical study, it was found that the sign of Q0.1 was different from that of Q0.2 and that the sign of Q0.1 is the same as that of total of Q0.1and Q0.2. This is due to the reaction force of the elas-tic foundation bigger than that of distributed load, q.The ratio of Q0.2 to Q0.1 was found to be rather simi-lar for all the specimens and assumed to be –0.118.
4. VERIFICATION OF PROPOSED MODEL
In order to verify the proposed model, this sec-tion shows the predicted transferred shear force-relative displacement relationship as well as the curvature distribution along the vertical part of the shear connector compared with the experimental ones. The solid and broken lines in Figs. 31 to 35indicate the predicted result with and without the effect of rotation of the lower flange plate, respec-tively.
Figures 31 and 32 show the predicted result of the transferred shear force-relative displacement relationship of the specimens which have different heights of shear connector and thicker lower flange plate respectively. While Fig.33 shows the predicted
Fig. 31 The predicted transferred shear force-relative displacement relationship in specimens S-1, S-2 and S-3 compared with experimental result
Fig. 32 The predicted transferred shear force-relative displacement relationship in specimens S-10 compared with experimental result
Fig. 33 The predicted transferred shear force-relative displacement relationship in specimens S-NTp and S-OSc compared with experimental result
0 0.2 0.4 0.6 0.8 10
50
100
150
Relative Displacement (mm)
SC-1
Experiment Without effect of rotation With effect of rotation
at 90 mm
(c) S-3, hsc = 140 mm
0 0.2 0.4 0.6 0.8 10
50
100
150
Relative Displacement (mm)
SC-1
Experiment Without effect of rotation With effect of rotation
at 90 mm
(b) S-2, hsc = 90 mm
0 0.2 0.4 0.6 0.8 10
50
100
150
Relative Displacement (mm)
Tran
sfer
red
Shea
r For
ce (k
N)
SC-1
Experiment Without effect of rotation With effect of rotation
at 40 mm
(a) S-1, hsc = 40 mm
0 0.2 0.4 0.6 0.8 10
50
100
150
Relative Displacement (mm)
Tran
sfer
red
Shea
r For
ce (k
N)
SC-1
Experiment Without effect of rotation With effect of rotation
0 0.2 0.4 0.6 0.8 10
50
100
150
Relative Displacement (mm)
Experiment Without effect of rotation With effect of rotation
Tran
sfer
red
Shea
r For
ce (k
N)
(b) S-OSc, one shear connector
0 0.2 0.4 0.6 0.8 10
20
40
60
80
Relative Displacement (mm)
Tran
sfer
red
Shea
r For
ce (k
N)
SC-1
Experiment Without effect of rotation With effect of rotation
(a) S-NTp, no tie plate
136

Doboku Gakkai Ronbunshuu E Vol.64 No.1, 122-141, 2008. 2
result in the cases of no compressive force in the surrounding concrete and large spacing of the shear connector. It can be seen that the predicted results are in good agreement with the experimental ones. The good agreement of the predicted results is also found with the experimental ones for the other specimens. The predicted curvature distributions along the vertical part of the shear connector are shown in Fig. 34 for specimens which have different heights of the shear connector, while Fig. 35 shows the case of I-shaped shear connector. It can be seen that the predicted results are in good agreement with the ex-perimental ones. Good agreement with the experi-mental ones is also found for the other specimens.
5. FEM ANALYSIS
This section shows the finite element analysis of steel-concrete sandwich beams with the proposedmodel of the transferred shear force-relative dis-placement relationship of the shear connector. In order to install the proposed model, the same pro-cedures that have been described in a previous study6) were used. The proposed model was installed in the FEM program (a revised WCOMR)9) in which originally a linear bond stress-slip relationship was adopted as a constitutive law for the bond link ele-ment9). The analytical model for concrete prior to crack is constructed based on elasto-plastic and fracture model. The equivalent stress-equivalent strain relation is formulated with the initial elastic modulus, the fracture parameter and equivalent plastic strain. This method is noted for its ability to represent any loading history, including loading and reloading in biaxial stress states, using the unique mathematical expression. The constitutive model for the steel flange plate is based on the simplified stress-strain relationship in which the stress-strain envelop formulates the yield point and strain hard-ening. The FEM predicted results on load-deflection of the sandwich beam and the transferred shear force-relative displacement relationship at shear
connector were compared with the experimental results. The normal stiffness of bond link element in the direction of compression was kept with a big value, which is 300 times of the shear stiffness to avoid the overlap between concrete and steel element. The stiffness in tension was kept with a small value foreasy parting between the elements. In this analysis, only the center Gauss point of the bond link element transfers the shear force by using a weight function (see Fig.36), so that the concentrated shear force transfer at shear connector can be modeled. The normal force was transferred at all the Gauss points. The finite element mesh of the sandwich beam is shown in Fig.36. As stated in the Sec. 2 (2) f), the vertical com-pressive force of concrete surrounding the shear connector affects the Qc value. In the FEM analysis, the normal force at the considered Gauss point of the bond link element, which balances with the ten-sile force of the tie plate, was considered as the ver-tical compressive force of the concrete surrounding the shear connector. It was found that the tensile strength of concrete affects the normal stress of tie plate element. The smaller tensile strength of the concrete gives the bigger normal tensile stress of the tie plate element.
Fig. 34 The predicted curvature distribution of shear connector in specimens S-1, S-2 and S-3 compared with the experimental results
Fig. 35 The predicted curvature distribution of shear connector in specimens S-12 compared with the experimental results
-400 -200 0 200 400 6000
30
60
90
120
Curvature, 10-6/mm
Experiment, 21.99 kN Without effect of rotation With effect of rotation
140 mm
(c) Specimen S-3, hsc = 140 mm
-400 -200 0 200 400 6000
30
60
90
Curvature, 10-6/mm
Experiment, 38.55 kN Without effect of rotation With effect of rotation
90 mm
(b) Specimen S-2, hsc = 90 mm
-400 -200 0 200 400 6000
10
20
30
40 Experiment, 22.98 kN Without effect of rotation With effect of rotation
40 mm
Curvature, 10-6/mm
Hei
ght,
mm
(a) Specimen S-1, hsc = 40 mm
-600 -300 0 300 600 9000
10
20
30
40
Hei
ght,
mm
Curvature, 10-6/mm
Experiment, 20.02 kN Without effect of rotation With effect of rotation
I shape
137

Doboku Gakkai Ronbunshuu E Vol.64 No.1, 122-141, 2008. 2
In this study, the concrete tensile strength of 0.588 MPa, which is 0.2 times the predicted tensile strength gives the normal stress of the tie plate ele-ment agreeing well with the experimental one as shown in Fig.37. The reason for reduction of the tensile strength might be existence of shear connec-tor, which is a trigger of cracking.
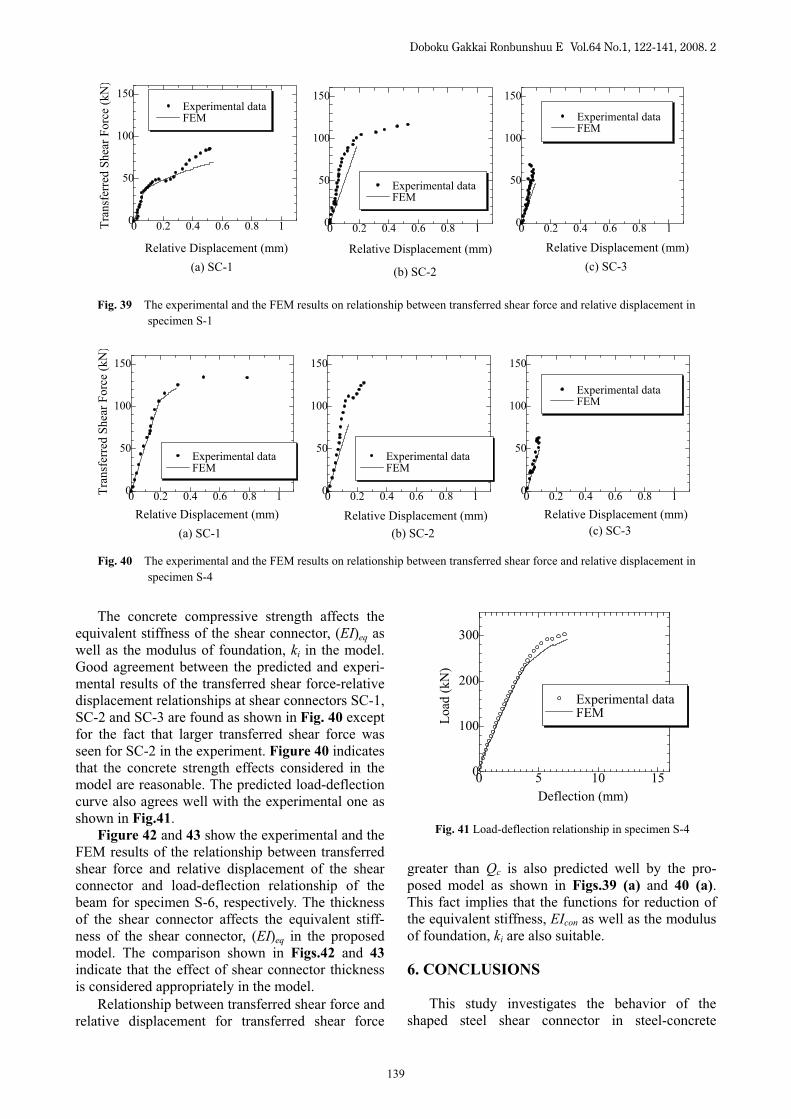
Figure 38 shows the relationship between load and deflection of specimen S-1 while the relation-ship between transferred shear force and relative displacement is shown in Fig.39. Both of them are compared with the experimental data. The FEM re-sult shows that the stiffness of the sandwich beam is rather small compared with the experimental result as shown in Fig.38. Good agreements with the ex-perimental results of the predicted slip at the shear connector at different locations are found as shown in Fig.39. The predicted point for sudden reduction of the stiffness in the relation for shear connector SC-1 also agrees with the experimental results. For shear connector SC-2 the predicted curve did not reach the Qc until the last step of the calculations, however increase in Qc value for SC-2 compared with SC-1 was successfully predicted. For shear
connector SC-3 both predicted and experimental curve did not reach the Qc yet. In order to verify the FEM result in cases of dif-ferent concrete compressive strength as well as different thickness of the shear connector, the FEM analysis on specimens S-4 and S-6, which has the greater concrete compressive strength (33.4 MPa)than S-1 (24.2 MPa) and thicker shear connector (10 mm) than S-1 (5 mm), respectively, were conducted.
Fig. 36 The finite element mesh of the sandwich beam6)
Fig. 37 The normal stress of tie plate
Fig. 38 Load-deflection relationship in specimen S-1
Tie plate elements
Bond link elements
CL
Concrete elements
Steel elements
Gauss point WITHOUT shear connector
Concrete element
Steel element
Bond link element
Shear connector
Gauss point WITH shear connector
0 100 200 3000
100
200
300
400
500
Load (kN)
Experiment FEM
(c) Tie plate at the position SC-3
0 100 200 3000
100
200
300
400
500
Load (kN)
Experiment FEM
0 100 200 3000
100
200
300
400
500
Load (kN)
Stre
ss (M
Pa)
Experiment FEM
(a) Tie plate at the position SC-1 (b) Tie plate at the position SC-2
0 2 4 6 8 100
100
200
300
Deflection (mm)
Laod
(kN
)
Experimental data FEM
138
Doboku Gakkai Ronbunshuu E Vol.64 No.1, 122-141, 2008. 2
The concrete compressive strength affects the equivalent stiffness of the shear connector, (EI)eq as well as the modulus of foundation, ki in the model. Good agreement between the predicted and experi-mental results of the transferred shear force-relative displacement relationships at shear connectors SC-1, SC-2 and SC-3 are found as shown in Fig. 40 exceptfor the fact that larger transferred shear force was seen for SC-2 in the experiment. Figure 40 indicates that the concrete strength effects considered in the model are reasonable. The predicted load-deflection curve also agrees well with the experimental one as shown in Fig.41.
Figure 42 and 43 show the experimental and the FEM results of the relationship between transferred shear force and relative displacement of the shear connector and load-deflection relationship of the beam for specimen S-6, respectively. The thickness of the shear connector affects the equivalent stiff-ness of the shear connector, (EI)eq in the proposed model. The comparison shown in Figs.42 and 43indicate that the effect of shear connector thickness is considered appropriately in the model. Relationship between transferred shear force and relative displacement for transferred shear force
greater than Qc is also predicted well by the pro-posed model as shown in Figs.39 (a) and 40 (a).This fact implies that the functions for reduction of the equivalent stiffness, EIcon as well as the modulus of foundation, ki are also suitable.
6. CONCLUSIONS
This study investigates the behavior of the shaped steel shear connector in steel-concrete
Fig. 39 The experimental and the FEM results on relationship between transferred shear force and relative displacement in specimen S-1
Fig. 40 The experimental and the FEM results on relationship between transferred shear force and relative displacement in specimen S-4
Fig. 41 Load-deflection relationship in specimen S-4
0 0.2 0.4 0.6 0.8 10
50
100
150
Relative Displacement (mm)
Tran
sfer
red
Shea
r For
ce (k
N)
(a) SC-1
Experimental data FEM
0 0.2 0.4 0.6 0.8 10
50
100
150
Relative Displacement (mm)
(b) SC-2
Experimental data FEM
0 0.2 0.4 0.6 0.8 10
50
100
150
Relative Displacement (mm)(c) SC-3
Experimental data FEM
0 0.2 0.4 0.6 0.8 10
50
100
150
Relative Displacement (mm)
Tran
sfer
red
Shea
r For
ce (k
N)
(a) SC-1
Experimental data FEM
0 0.2 0.4 0.6 0.8 10
50
100
150
Relative Displacement (mm)(b) SC-2
Experimental data FEM
0 0.2 0.4 0.6 0.8 10
50
100
150
Relative Displacement (mm)(c) SC-3
Experimental data FEM
0 5 10 150
100
200
300
Deflection (mm)
Load
(kN
)
Experimental data FEM
139

Doboku Gakkai Ronbunshuu E Vol.64 No.1, 122-141, 2008. 2
sandwich beam. The relationship between trans-ferred shear force and relative displacement as well as the curvature distribution along the vertical part of the shear connector was clarified. A rational nu-merical model, which simulates the relationship between the transferred shear force and relative dis-placement of the shear connector, was proposed. The proposed model can predict the curvature dis-tribution along the vertical part as well. The pro-posed model was installed to the bond link element of FEM program (a revised WCOMR). The pre-dicted slips at the shear connector at different loca-tions are found to agree with the experimental re-sults. Based on the experimental and analytical studies the following conclusions could be drawn: 1. The curvature distribution indicates that the
shear connector is deformed in S shape. The curvature distribution is affected by end condi-tion at the top of the shear connector. It was ob-served that at the height around 70 mm and above the curvature is almost zero for the specimen in this study. Therefore, the portion of the shear connector over 70 mm does not affect the transferred shear force.
2. It is considered that there is rotation at the bot-tom of all the shear connector. The rotation stiffness is assumed proportional to the lower flange stiffness for simplicity. No rotation at the top of the shear connector but free horizontal movement is considered as the boundary condi-tions for L-, reversed L- and T-shaped shear connectors. The free end condition is considered as the boundary condition at the top of I-shaped shear connector.
3. From the observed transferred shear force-rela-tive displacement relationship as well as curva-ture distribution of shear connector, the concrete surrounding the shear connector is considered to act as foundation supporting the shear connector
shear connector as beam on it and act as com-posite element supplying additional bending stiffness (effective stiffness) to the shear con-nector. The modulus of the foundation affects the curvature distribution, while the equivalent stiffness of shear connector affects the trans-ferred shear force for given relative slip.
4. Both of the modulus of the foundation and the effective stiffness of the concrete surrounding the shear connector are proportional to elastic modulus of the concrete.
5. The relative displacement of the shear connector linearly increases with increase in transferred shear force until a sudden decrease of the modulus of the foundation and the equivalent stiffness of the shear connector starts at a trans-ferred shear force, Qc. Then the modulus of the foundation as well as the effective stiffness of the concrete surrounding the shear connector reduces with an increase in transferred shear force.
6. The Qc increases with an increase of the compressive force of the surrounding concrete of the shear connector and do not become zero even if the compressive force is zero. The Qcalso increases in proportion to square root of the
Fig. 42 The experimental and the FEM results on relationship between transferred shear force and relative displacement in specimen S-6
Fig. 43 Load-deflection relationship in specimen S-6
0 0.2 0.4 0.6 0.8 10
50
100
150
Relative Displacement (mm)
Tran
sfer
red
Shea
r For
ce (k
N)
(a) SC-1
Experiment data FEM
0 0.2 0.4 0.6 0.8 10
50
100
150
Relative Displacement (mm)(b) SC-2
Experiment data FEM
0 0.2 0.4 0.6 0.8 10
50
100
150
Relative Displacement (mm)(c) SC-3
Experiment FEM
0 5 10 150
100
200
300
Deflection (mm)
Load
(kN
) Experimental data FEM
140

Doboku Gakkai Ronbunshuu E Vol.64 No.1, 122-141, 2008. 2
creases in proportion to square root of the com-pressive strength of concrete, f ’c, effective thickness of surrounding concrete, tc, and thick-ness of the shear connector, tsc. Regarding the effect of the height of the shear connector, hsc Qcincreases in proportion to the inverse of hsc
0.8.
For actual steel-concrete sandwich structure, the conclusions in this study on the characteristics of relationship between transferred shear force and relative displacement of shear connector and the effects of various factors can be applied. Before the model proposed in this study is applied to actual structures, however, effects of size of shear connec-tor itself and sandwich member should be clarified because those sizes in the experiment in this study and those in the actual structure ma be different.
ACKNOWLEDGMENT: The authors would like to express their gratitude to Prof. Yoshio KAKUTA of Hokkaido University for his valuable comments on this study, to Dr. Yasuhiko SATO of Hokkaido University for his advice in FEM analysis, and to Mr. Tsutomu KIMURA of Hokkaido University for his assistance in the experimental works carried out in this study.
REFERENCES1) JSCE Research Subcommittee on Steel-Concrete Sandwich
Structures: Design Code for Steel-Concrete Sandwich Structures – Draft, Concrete Library of JSCE, No. 20, pp.1-21, December 1992.
2) Chin, C.K. and Ueda, T.: A Study of Plate Shape Shear Connector for Composite Member, Research Report, Divi-sion of Structure Engineering and Construction, AIT, Bangkok, March 1990.
3) Chuah, C.L., Shima, H. and Virach, R.: Load-Displacement Relationship of Plate Shear Connector in Steel-Concrete
Composite Structures, Proc. of JSCE, No. 433/V-15, pp.223-229, August 1991.
4) Saidi, T., Furuuchi, H. and Ueda, T.: Relationship Between Transferred Shear Force and Relative Displacement of Shear Connector In Steel-Concrete Sandwich Beam, Jour-nal of Structural Engineering, JSCE, 44 (A), pp. 1537-1545, March 1998.
5) Saidi, T., Furuuchi, H. and Ueda, T.: Effect of Shape and Location of Shear Connector on Its Transferred Shear Force and Relative Displacement Relationship In Steel-Concrete Sandwich Beam, Journal of Structural Engineering, JSCE, 45 (A), pp. 1451-1459, March 1999.
6) Saidi, T., Furuuchi, H. and Ueda, T.: Proposed Model for Transferred Shear Force and Relative Displacement Rela-tionship of Shear Connector In Steel-Concrete Sandwich Beam, Proc. of the Seventh East Asia-Pacific Conference on Structural Engineering & Construction, Kochi, Japan, pp. 943-948, August 1999.
7) Hetenyi, M.: Beams on Elastic Foundation, The University of Michigan Press, 1946.
8) Sato, Y., Ueda, T. and Kakuta, Y.: Quantitative Evaluation of Shear Strength of Concrete Beams Reinforced with FRP Rods, Journal of Materials, Concrete Structures and Pave-ments, JSCE, No. 520, V-28, pp. 157-169, August 1995 (in Japanese).
9) Pantaratorn, N.: Finite Element Analysis on Shear Resisting Mechanism of RC Beams, Dissertation submitted to the University of Tokyo, March 1991.
10) Saidi, T., Furuuchi, H. and Ueda, T.: Constitutive Laws For Transferred Shear Force and Relative Displacement Rela-tionship of Shear Connector in Steel-Concrete Sandwich Beam, Composite and Hybrid Structure, Proc. of the 6th
ASCCS International Conference, Los Angeles, California, USA, pp. 313-320, March 2000.
11) Park, P. and Paulay, T.: Reinforced Concrete Structures,John Wiley and Sons, 1975.
(Received February 20, 2007)
141