Embed Size (px)
Citation preview

Article
pH Dependence of Charge Multipole Moments inProteins
An!ze Lo!sdorfer Bo!zi!c1,* and Rudolf Podgornik1,21Department of Theoretical Physics, Jo!zef Stefan Institute, Ljubljana, Slovenia and 2Department of Physics, Faculty of Mathematics andPhysics, University of Ljubljana, Ljubljana, Slovenia
ABSTRACT Electrostatic interactions play a fundamental role in the structure and function of proteins. Due to ionizable aminoacid residues present on the solvent-exposed surfaces of proteins, the protein charge is not constant but varies with the changesin the environment—most notably, the pH of the surrounding solution. We study the effects of pH on the charge of four globularproteins by expanding their surface charge distributions in terms of multipoles. The detailed representation of the charges on theproteins is in this way replaced by the magnitudes and orientations of the multipole moments of varying order. Focusing on thethree lowest-order multipoles—the total charge, dipole, and quadrupole moment—we show that the value of pH influences notonly their magnitudes, but more notably and importantly also the spatial orientation of their principal axes. Our findings implyimportant consequences for the study of protein-protein interactions and the assembly of both proteinaceous shells and patchycolloids with dissociable charge groups.
INTRODUCTION
Electrostatic interactions are an important part of the long-and short-range interactions in the biological environment.Their understanding is usually based on the framework ofthe generalized Derjaguin-Landau-Verwey-Overbeek the-ory of interactions between colloids in ionic solutions,where the canonical electrostatic and van der Waals compo-nents are supplemented by the solvent structure effects ofeither hydration or hydrophobic type (1). This generaldecomposition of the interactions remains valid also for pro-teins in aqueous solution, where it is in addition augmentedby short-range recognition and docking interactions as wellas specific ion effects (2,3).
Although the van der Waals interactions are a functionalof the dielectric response function (4,5), the electrostaticinteractions within and between the proteins are basedon their charge distributions. The electrostatic interactionsdominate many aspects of protein behavior, and can bemodeled on different levels of detail (6–8). One of thedefining differences between the specific electrostatics ofproteins and the generic electrostatics of colloids thatneeds to be taken into account is the existence of ionizableamino acid residues in proteins. The interactions and ener-getics of these residues enable local charge separation,
implying a protein-specific distribution of charges (7,9)and influencing the protein-protein electrostatic interac-tions (10–12). The mechanism of charge separation inturn creates a distinction between the undissociatedchargeable groups buried inside the proteins on the onehand and the solvent-exposed and dissociable surfacecharges on the other (13). This distinction can be blurred,as internal ionizable groups can be to some extent dielec-trically shielded even in the strongly hydrophobic proteincore (14,15).
Identification of the dissociable, solvent-exposed aminoacid residues is the first step in obtaining the descriptionof charge distributions in proteins. Afterwards, one needsto take into account the proper description of the dissocia-tion mechanism for the deprotonated carboxylate of asparticand glutamic acid, deprotonated hydroxyl of the tyrosinephenyl group, the protonated amine group of arginine andlysine, and the protonated secondary amine of histidine(8,16). Because the dissociation process and the local elec-trostatic field are coupled via the charge regulation mecha-nism (17), the dissociation rate depends on the local pH thatcan be obtained only self-consistently (18,19). In principle,only detailed ab initio simulations can provide a detailedquantification of the partial charges buried inside or exposedon a protein surface. These simulations are, however, usu-ally hampered by the sheer size and number of atoms oneneeds to invoke to achieve a necessary amount of realismfor the calculations (20–22).
Submitted March 30, 2017, and accepted for publication August 11, 2017.
*Correspondence: [email protected]
Editor: Nathan Baker.
1454 Biophysical Journal 113, 1454–1465, October 3, 2017
http://dx.doi.org/10.1016/j.bpj.2017.08.017
! 2017 Biophysical Society.

A proper quantification of the electrostatic interactions inproteins requires the encoding of not only the magnitudes ofthe charges but also of their distribution in space (23,24).The latter can be represented to any desirable accuracy bya multipole expansion of the charge density, where eachterm in the multipole series describes a deviation with a spe-cific symmetry from the zeroth-order, spherically symmetricdistribution (25). There are many variants of the multipoleexpansion, formulated either on the level of amino acidsor on the level of complete proteins (26–28), with themost straightforward being the irreducible spherical repre-sentation of the multipoles (23). This representation is ob-tained by mapping the charge distribution on the originalsolvent-accessible protein surface onto a sphere circum-scribed to the protein (24,29,30).
The multipole expansion provides a bridge between acoarse-grained description of the charge density and itsdetailed microscopic description, the level of detail depend-ing on the multipole order of the expansion used. As such,even multipoles of lower order can provide a signature ofcharge distributions in molecules (23,31–33), and a smallnumber of higher-order multipoles can account for almostall of the electrostatic field in the aqueous solvent (24). Inthe presence of ionic screening this otherwise standardresult is modified, as the effects of charge anisotropy andhigher-order multipole moments then extend to the far-fieldregion. In contrast to the standard multipole expansion, thescreened electrostatic potential retains the full directionaldependence of all multipole moments, an important differ-ence that is often overlooked (34–37).
With a few exceptions (24), the pH dependence of chargedistributions in proteins has been standardly studied mostlyon the level of the spherically symmetric total charge, thatis, the zeroth multipole moment. This approach, however,completely neglects the orientational dependence of the in-teractions. Due to the peculiarity of the multipole expansionfor screened electrostatic interactions, the orientational ef-fects are present even at the lowest multipolar order andcan thus—contrary to the existing analytical models—neverreally be ignored (34–37). In addition, for higher-order mul-tipoles, the two components of the multipole expansion (themagnitude of the multipole moments and their spatial distri-bution) can hardly be separated. We thus investigate not onlythe pH dependence of the magnitudes but also of the direc-tions of the principal axes of the charge dipole and quadru-pole moments in proteins, a phenomenon missed also incases where the higher multipole terms were included(38–41). It is in fact the orientational dependencies that areof particular importance for the local electrostatic interac-tions in numerous contexts, even when the coupling amongpH, protonation states, and protein conformation is not takeninto account. The results of our model should thus be relevantfor the studies of interaction and assembly in ordered proteinassemblies (such as a proteinaceous virus shell (42)), be-tween charged Janus colloids (43), in the general context
of patchy globular proteins, colloids, and polyelectrolytes(44–49), or possibly as a driving mechanism for local pack-ing symmetry transitions in the proteinaceous capsid engi-neering in the presence of supercharged proteins (50).
MATERIALS AND METHODS
Protein dataset
For our study, we chose four protein structures from the RCSB Protein DataBank (PDB) (51): hen egg-white lysozyme (PDB: 2LYZ), human serum al-bumin (PDB: 1E7H), bovine b-lactoglobulin (PDB: 2BLG), and phageMS2 capsid protein (PDB: 2MS2, subunit A). These proteins are biologi-cally well studied, with known structure and role. As such, they are oftenused to examine the role of electrostatic contributions in protein systemsand to study protein assembly and aggregation, where higher-order chargemultipoles play a role (10,19,24,46,52). b-lactoglobulin, for instance, isknown to form dimers or tetramers depending on the pH. The capsid proteinof MS2 also first assembles into trimers and from there into full capsidsmade of 180 proteins, imparting to the capsids a pH-dependent stability.As our interest lies in exploring the pH dependence of multipole momentsand their orientations that could relate to higher-order assembly, we studyhere only the monomer forms of each protein. In addition, the proteins inour dataset have globular geometry, easily approximated by a sphere, andmost of them are fairly small, with lysozyme and MS2 capsid protein beingcomposed of 129 amino acids (AA) and b-lactoglobulin of 162 AA. Humanserum albumin (HSA) is the largest of the four, consisting of 585 AA.Although we will focus on the four proteins in the dataset to study the gen-eral properties of our model, we note that our approach can also be straight-forwardly implemented for any globular protein.
To obtain the surface charges on each protein at a given pH value, we firstdetermine which AA residues are solvent-accessible, and compute thecharge on them by using the canonical static dissociation constant pKa valuepertaining to each AA type. By projecting the positions of the charged res-idues onto a sphere, we obtain the surface charge distribution of each pro-tein, which we then use to compute the electrostatic multipole moments.Details of each of these steps are laid out in the following subsections,and a sketch of the model is shown in Fig. 1.
Relative solvent accessibility of amino acidresidues
Relative solvent accessibility (RSA) of an amino acid indicates its degree ofburial in the 3D protein structure, and is important in determining whichAA residues can contribute to the surface charge of the protein. We obtainthe RSA of each AA in a protein with the help of the UCSF Chimera soft-ware (53,54) by normalizing the solvent-exposed surface area of each res-idue in the protein structure with the surface area of the same type of residuein a reference state (55). The classification of AA residues as buried orexposed is then done on the basis of an RSA cutoff c, which typically rangesbetween 5 and 30% (56–59). We opt for a cutoff of c ¼ 0.25, thus definingas exposed all amino acid residues AAk with an RSA value >25%:
RSAðAAkÞP0 :250AAk ˛ exposed: (1)
The choice of this (arbitrary) cutoff influences the number of charged res-idues that will be taken into account in our calculation of the surface chargeof the protein. How the number of charges varies with the selection of theRSA cutoff is shown in Table S1. Similar variations in the number of sur-face charges could also occur, for instance, due to a different choice of thenormalization values (reference states) in the calculation of the RSA (60).
For consistency, we use the RSA cutoff of c¼ 0.25 throughout the article,unless specified otherwise. However, we also test our predictions for several
pH-Dependent Protein Charge Multipoles
Biophysical Journal 113, 1454–1465, October 3, 2017 1455

other values of the cutoff and show that it bears no influence on the conclu-sions obtained in our work.
pH dependence of charged amino acid residues
Once we know which AAs are solvent-exposed and thus dissociable, we candetermine their charge at a given pH value. The charged residues weconsider are the aspartic acid, glutamic acid, tyrosine, arginine, lysine,and histidine, whereas the case of cysteine (CYS) protonation is consideredseparately in the Discussion and Supporting Material. To obtain the chargeon each of the residues as a function of pH we use the acid-base dissociationconstants pKa from Haynes (61) (and listed in Table S2). The degree ofdissociation of each amino acid AAk as a function of its pKa
(k) and pH isthen given by the Henderson-Hasselbach equation,
q5k ¼ 5 1
1 þ e5 ln 10ðpH% pKðkÞa Þ
(2)
for bases (qkþ > 0) and acids (qk
% < 0), respectively. We note that Eq. 2 canbe expanded to include the local electrostatic potential at the position ofeach charge, j(rk), inducing a pKa shift (62,63):
q5k ¼ 5 1
1 þ e5 ln 10 ðpH% pKðkÞa ÞHbe0 jðrkÞ
; (3)
where b ¼ 1/kBT, T is the room temperature, kB is the Boltzmann constant,and e0 is the elementary charge. The pKa shift due to local electrostatic po-tential is hard to neglect, especially at low salt concentrations. However, re-formulating the Tanford-Kirkwood model (64,65) by using a linearizedDebye-H€uckel (DH) theory on a low dielectric constant sphere with chargeregulation boundary condition, we show that for large (physiological) saltconcentrations the effect of the pKa shift due to the electrostatic potentialis relatively small and Eq. 2 can be used. Details of the DH model are givenin Eqs. S1 and S2 in the Supporting Material and its consequences com-mented on in the Discussion.
Electrostatic effects are not the only possible factor inducing a local pKa
shift of a given amino acid in a protein, as hydrogen bonding and desol-vation effects often play an important role. Numerous methods exist forthe prediction of pKa values on different levels of detail, ranging fromvarious MD models and ab initio quantum mechanical approaches toempirical models, which trade the detailed description of a system for avery fast computational time (66). To further compare our results, obtainedby assigning the same pKa value to each amino acid residue group, with amore realistic model including site-site interactions, we use thePROPKA3.1 software (67) to predict local pKa values of each aminoacid residue. PROPKA is a widely used empirical software that uses 3Dstructure of proteins to estimate desolvation effects and intraprotein inter-actions based on the positions and chemical nature of the groups proxi-mate to the pKa sites. The pKa values predicted by PROPKA do notinclude salt effects as an input parameter, and thus provide another layerof contrast to the pKa values shifted due to electrostatic effects, describedabove. The results obtained in this way are presented in the Discussion andthe Supporting Material, where we show that for the purposes of our study,the simple model that we use fares well even when compared to a morerealistic model.
Surface charge distribution and electrostaticmultipoles
With the approach outlined in the previous subsections we can obtain, atany value of pH, the positions of charged residues for a given protein,rk¼ (xk, yk, zk), and the (fractional) charge they carry, qk. To obtain a surfacecharge distribution, we then project them onto a spherical surface, rk ¼ (R,Uk)¼ (R, qk, 4k), so that their positions are characterized only by their solidangle, Uk. Here, the radius of the projecting sphere, R, can be any charac-teristic dimension of the protein, its circumscribed radius most often beingused for this purpose (24). The circumscribed radii of the studied proteinsare given in Table S3, and fall in the range of R & 1–2 nm.
The surface charge distribution of the discrete charges can then bewrittensimply as
sðUÞ ¼ e0R2
X
k˛AAqkdðU % UkÞ
¼ e0R2
XN
l¼ 0
Xl
m¼% l
slmYlmðUÞ; (4)
if rewritten in the form of an expansion in terms of the irreducible sphericalrepresentation of multipoles; d(x) is the Dirac delta function and Ylm(U) arethe spherical harmonics. From Eq. 4 we can then obtain the multipoleexpansion coefficients slm as
slm ¼X
k˛AAqkY
'lmðUkÞ: (5)
Contrary to the case of an unscreened Coulomb potential, the Debyescreening limits the infinite sum over l in the multipole expansion (Eq. 4)to only the first several terms, leading to a coarse-grained description asthe details of the charge distribution are smeared below the Debyescreening length cutoff. Therefore, even in the presence of higher-ordersymmetries (e.g., octahedral or icosahedral), the lower-order multipolesup to and including the quadrupole provide a good signature of the chargedistributions in various molecules, accounting for most of the electrostaticfield (23,24,31–33).
In view of this, and limiting ourselves to the limit of strong screening, wewill focus on the three lowest-order multipoles—the total charge (mono-pole with rank ‘ ¼ 0), the dipole moment (‘ ¼ 1), and the quadrupolemoment (‘ ¼ 2). The total charge is independent of the choice of coordi-nates and can be obtained simply as
FIGURE 1 Sketch of the model showing a rendering of the surface struc-ture of human serum albumin (PDB: 1E7H), superimposed onto a circum-scribed sphere with projected multipole expansion of the surface chargedistribution (up to ‘max ¼ 12). AA residues that are charged at pH 7 arehighlighted in the structure, with colors pertaining to the red spectrum indi-cating positive charges, and colors in the blue spectrum indicating negativecharges. The same color scheme applies to the projection of the charge dis-tribution onto the sphere. The protein structure was rendered with UCSFChimera (53). To see this figure in color, go online.
Lo!sdorfer Bo!zi!c and Podgornik
1456 Biophysical Journal 113, 1454–1465, October 3, 2017

q ¼X
k˛AAqk; (6)
where k runs over all of the charged amino acids in the protein. The totalcharge as well as the higher-order multipoles will be given in units ofelementary charge, e0, unless noted otherwise.
For simplicity, in dealing with the dipole and quadrupole moment, wewill also rescale all our calculations with the characteristic radius of the pro-tein R, obtaining an orientational distribution on a unit sphere. The positionsof the charges become unit vectors nk, expressed in spherical coordinates asnk ¼ (1, qk, 4k). As we will also be interested in the orientation of the dipolevector and the eigenvectors of the quadrupole tensor, it will be easier for usto deal with them in Cartesian coordinates. The expressions for the dipolevector m and the quadrupole tensor Q are then (68)
m ¼X
k˛AAqknk; (7)
Q ¼ 1
2
X
k˛AAqkð3nknk % 1Þ; (8)
or in an obvious component notation (mi and Qij) that we do not write downexplicitly. The proper units for the multipoles can be obtained by multi-plying the expressions in Eqs. 7 and 8 with the corresponding power ofthe characteristic protein radius R‘ (i.e., ‘ ¼ 1 for the dipole and ‘ ¼ 2for the quadrupole). Cartesian components of both dipole and quadrupolemoments can also be very easily transformed into a spherical form in whichthey might be more suitable for analytical or numerical calculations(compare to (68)).
We choose the center-of-mass of each protein for the origin of the coor-dinate system in which we compute the surface charge distribution and theelectrostatic multipoles. Because the monopole moment (the total charge)of the surface charge distribution is always nonzero except at the isoelectricpoint, the higher multipoles are dependent on the choice of the origin. How-ever, the transformations of the dipole and quadrupole moment to other co-ordinate systems are very simple and given in (68).
Dipole and quadrupole principal axes
Surface charge distributions on the proteins, and therefore their multipole ex-pansions, will change with pH. This will influence not only the magnitudes ofthe individual multipoles but also their orientation in space. Consequently, wewill be interested in the orientations of the dipole and quadrupole distribu-tions with respect to the original (reference) coordinate system. For each pro-tein, this coordinate system is derived from its PDB entry; the exactorientation of the original coordinate system with respect to the protein struc-ture will not be of interest to us, because we will be interested in relativechanges of the dipole and quadrupole orientations with pH. Although themonopole moment is rotationally invariant, we can always find a rotationof the original coordinate system by keeping the protein structure fixed sothat either 1) the dipole vector has a nonzero component only in the z direc-tion, or 2) the quadrupole tensor is diagonal, with the largest eigenvaluealigned along the z axis. We will refer to these two z axes in the rotated co-ordinate systems as the dipole and quadrupole principal z axes, respectively.
The dipole moment, being a vector, has three independent components:in the original coordinate system, they are the mx0, my0, and mz0. Upon rotationinto the dipole coordinate system, the dipole moment has a nonzero compo-nent only along its principal z axis, m¼ (0, 0, mz), where mz¼ (mx0
2 þ my02 þ
mz02)1/2. The two remaining parameters are now the two angles needed to
align the original z0 axis into the new, principal z axis. (Because the onlynonzero component is in the z direction, the position of the new x andy axes is irrelevant.)
The quadrupole moment is a symmetric tensor, thus having five indepen-dent components. In the quadrupole coordinate system specified by its ei-genvectors the tensor becomes diagonal, and we can always order itseigenvalues by value so that the largest one is oriented along the principalz axis,Qxx% Qyy% Qzz. Because the quadrupole tensor is traceless, we canalso express one of its eigenvalues with the other two, e.g., Qyy ¼ % (Qxx þQzz). This leaves us with three more independent components that we canidentify with, for instance, the three Euler angles needed to rotate the orig-inal coordinate system into the one defined by the quadrupole eigenvectors.Due to the symmetry of the quadrupole, we will also restrict the location ofits principal z axis only to the upper hemisphere of the circumscribedsphere.
Quadrupole ratio
In the case of the quadrupole moment we will also be interested in the pro-jections of the surface charge distributions along the y and x axes in thequadrupole coordinate system. Because of our choice of the ordering ofthe eigenvalues, Qzz will always take on the largest positive value andQxx the largest negative value. Thus, a ratio of these two eigenvalues,jQxx/Qzzj, will provide us with information on what proportion of the quad-rupole distribution is aligned with the principal z and x axis, respectively.(The y axis information can be again omitted due to TrQ ¼ 0.)
When the quadrupole ratio is close to 0.5, the quadrupole distribution isaxial and oriented predominantly along the z axis. Likewise, when the ratiois close to 2, the distribution is axial but with an opposite sign and orientedalong the x axis. On the other hand, when this ratio is close to 1, the distri-bution is represented symmetrically in the z and x directions while vanish-ing along the y axis. In this scenario, the distribution is not axial butcorresponds better to a planar one. The ratio of the two quadrupole eigen-values thus gives us an insight into the spatial distribution of the quadru-pole, which can have an impact on, for instance, the interaction andassembly of molecules with a pronounced quadrupole moment. Some ex-amples of the relation between the quadrupole ratio and the spatial distribu-tion of the quadrupole moment are shown in Figs. S1 and S2.
RESULTS
pH dependence of multipole magnitudes
Fig. 2 shows the pH dependence of the first three multipolecomponents in the cases of lysozyme and HSA; similar plotsfor the MS2 capsid protein and b-lactoglobulin are shown inFig. S4. The total charge on the proteins standardly de-creases from positive to negative as the pH increases,crossing the point of zero charge at the isoelectric point,pI. The isoelectric points of the proteins are interestingbecause the monopole moment vanishes and higher-ordermultipoles take on a greater importance. When cysteineacidity is not considered, the predicted isoelectric point oflysozyme is pI ¼ 11.08, an alkaline pI that is in very goodagreement with the values found in the literature (pI >& 11(69,70)), even though we used a fairly simple method toobtain it. The pI values we obtain for other proteins arelisted in Table 1 and also correspond well with the experi-mental values: pI & 4.7–5.6 for HSA (71,72) and pI & 5.1for b-lactoglobulin (73,74). The pI value obtained for thephage MS2 capsid protein at a first glance disagrees withthe very low reported value of the phage MS2, pI & 2.2–3.9 (75,76). The notable discrepancy stems most probably
pH-Dependent Protein Charge Multipoles
Biophysical Journal 113, 1454–1465, October 3, 2017 1457
from the presence of the genome in the interior of the virionand the permeability of the capsid to external flow (77)—instudies where the capsid protein alone was considered, theobtained isoelectric point was at a pI > 8 (78–80). Our re-sults thus match the ones found in the literature, as weconsider only a single capsid protein and not the formedvirion (with or without the genome), even though they donot match the experimental results for the formed phage.
In contrast to the total charge, the dipole moment does notchange its sign, which is expected, as we always orient thedipole coordinate system so that it points in the z direction.The pH dependence of the dipole magnitude is nonethelessnonmonotonic. In a similar fashion, the quadrupole compo-nents vary nonmonotonically across the range of pH values,
with the Qzz and Qxx values always being positive and nega-tive, respectively, due to our definition of their direction.The value of Qyy, as a consequence of TrQ ¼ 0, crosseszero when the Qxx component becomes larger than the Qzz
component, or vice versa.Although we use the normalized multipole moments in
units of [e0/R‘] in the figures to allow for an easier com-
parison, we also provide in Table 1 the multipole magni-tudes in the more intuitive units of [e0 ( nm‘]. We listthe dipole and quadrupole magnitudes at the isoelectricpoint of each protein, as well as the multipole magnitudesat neutral pH 7. We can observe a significant decrease inthe dipole moment of HSA at its isoelectric point whencompared to the dipole moment at neutral pH. A closer in-spection of Fig. 2 indeed shows that the dipole moment ofHSA exhibits a minimum close to its isoelectric point.HSA also attains by far the largest charge and quadrupolemoment of the four proteins at neutral pH; however, itsdipole moment is comparable to that of the others.Another observation we can draw from Table 1 is thatdipole moments seem to play a bigger role in the casesof b-lactoglobulin and phage MS2 capsid protein whencompared to their quadrupole moments, while somethingof the opposite is true for HSA and in a lesser way forlysozyme.
Quadrupole ratio: axial or planar distribution
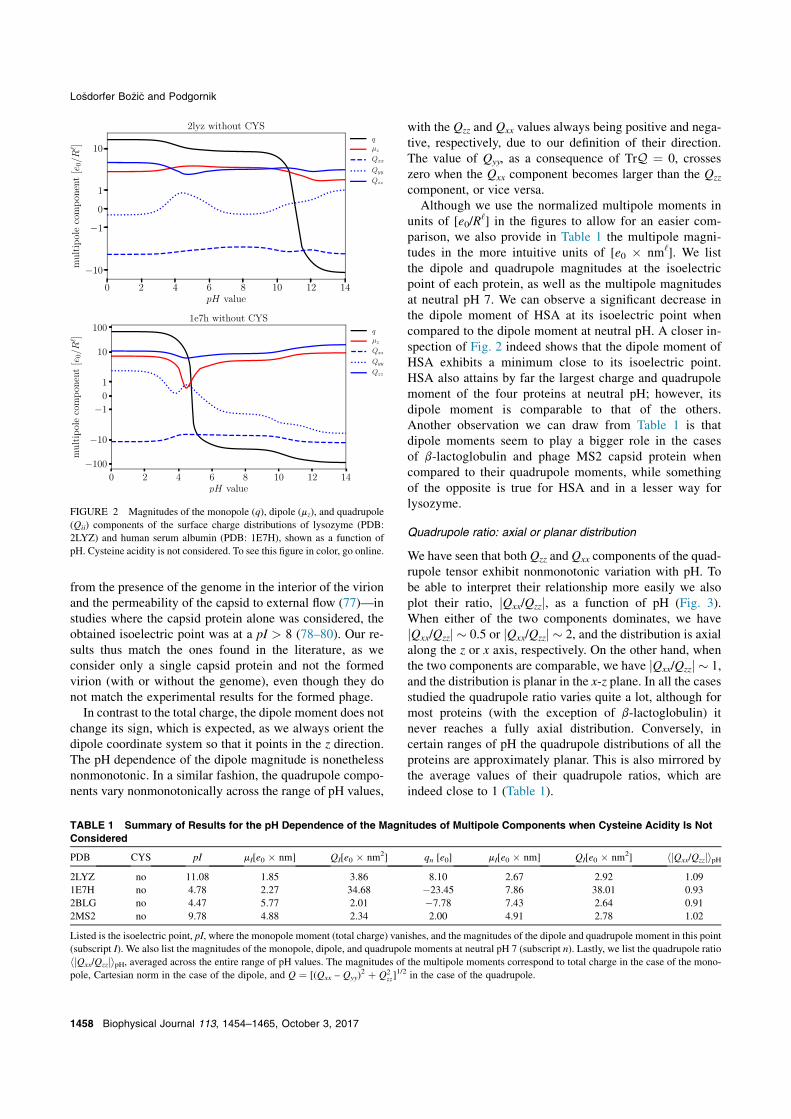
We have seen that both Qzz andQxx components of the quad-rupole tensor exhibit nonmonotonic variation with pH. Tobe able to interpret their relationship more easily we alsoplot their ratio, jQxx/Qzzj, as a function of pH (Fig. 3).When either of the two components dominates, we havejQxx/Qzzj & 0.5 or jQxx/Qzzj & 2, and the distribution is axialalong the z or x axis, respectively. On the other hand, whenthe two components are comparable, we have jQxx/Qzzj & 1,and the distribution is planar in the x-z plane. In all the casesstudied the quadrupole ratio varies quite a lot, although formost proteins (with the exception of b-lactoglobulin) itnever reaches a fully axial distribution. Conversely, incertain ranges of pH the quadrupole distributions of all theproteins are approximately planar. This is also mirrored bythe average values of their quadrupole ratios, which areindeed close to 1 (Table 1).
FIGURE 2 Magnitudes of the monopole (q), dipole (mz), and quadrupole(Qii) components of the surface charge distributions of lysozyme (PDB:2LYZ) and human serum albumin (PDB: 1E7H), shown as a function ofpH. Cysteine acidity is not considered. To see this figure in color, go online.
TABLE 1 Summary of Results for the pH Dependence of the Magnitudes of Multipole Components when Cysteine Acidity Is NotConsidered
PDB CYS pI mI[e0 ( nm] QI[e0 ( nm2] qn [e0] mI[e0 ( nm] QI[e0 ( nm2] hjQxx/QzzjipH2LYZ no 11.08 1.85 3.86 8.10 2.67 2.92 1.091E7H no 4.78 2.27 34.68 % 23.45 7.86 38.01 0.932BLG no 4.47 5.77 2.01 % 7.78 7.43 2.64 0.912MS2 no 9.78 4.88 2.34 2.00 4.91 2.78 1.02
Listed is the isoelectric point, pI, where the monopole moment (total charge) vanishes, and the magnitudes of the dipole and quadrupole moment in this point(subscript I). We also list the magnitudes of the monopole, dipole, and quadrupole moments at neutral pH 7 (subscript n). Lastly, we list the quadrupole ratiohjQxx/QzzjipH, averaged across the entire range of pH values. The magnitudes of the multipole moments correspond to total charge in the case of the mono-pole, Cartesian norm in the case of the dipole, and Q ¼ [(Qxx – Qyy)
2 þ Q2zz]
1/2 in the case of the quadrupole.
Lo!sdorfer Bo!zi!c and Podgornik
1458 Biophysical Journal 113, 1454–1465, October 3, 2017
These results indicate that the nature of quadrupole distri-butions in the proteins used in our work can be influenced bychanging the pH: at certain values of pH, the quadrupole dis-tributions are axial and thus oriented along a single axis
(here, due to our definitions, along the z or x axis). At othervalues of pH, however, the quadrupole distribution becomesplanar and symmetrically distributed in the x-z plane. Thenature of the quadrupole distribution can thus change quitedrastically with pH even without any concomitant changesin the conformation of the protein (81), which should influ-ence, for instance, the interaction properties of theseproteins.
pH dependence of dipole and quadrupoleprincipal axes
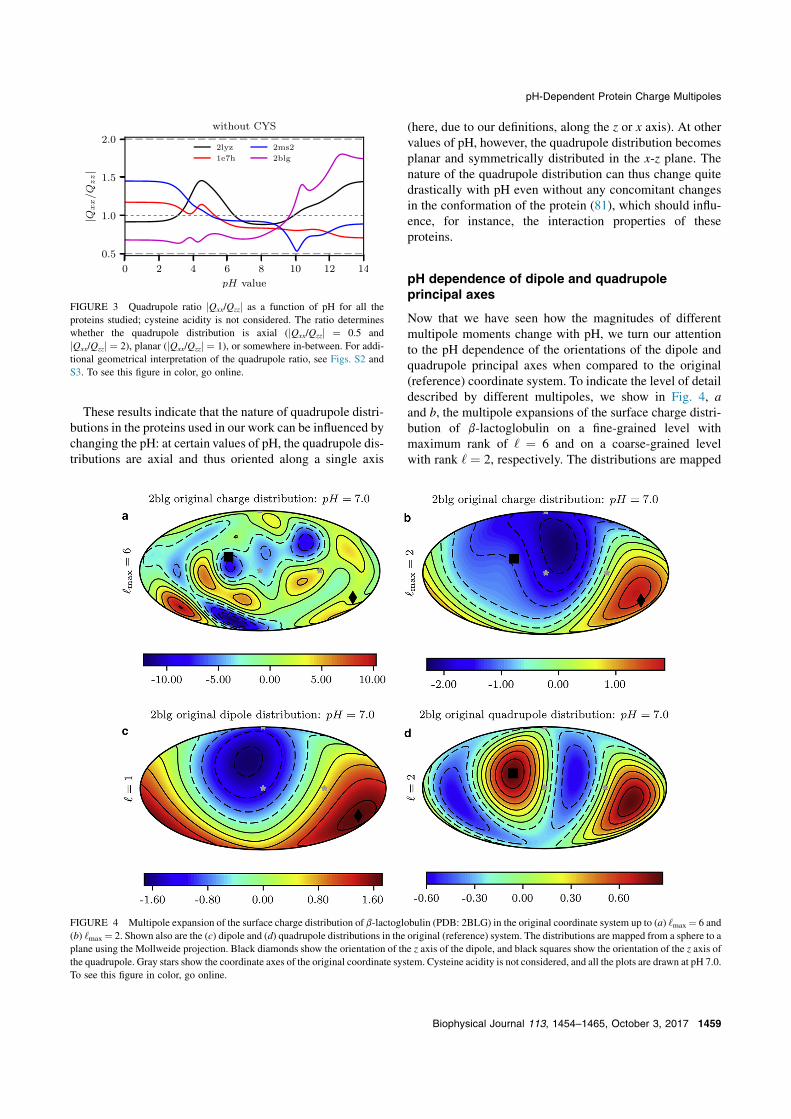
Now that we have seen how the magnitudes of differentmultipole moments change with pH, we turn our attentionto the pH dependence of the orientations of the dipole andquadrupole principal axes when compared to the original(reference) coordinate system. To indicate the level of detaildescribed by different multipoles, we show in Fig. 4, aand b, the multipole expansions of the surface charge distri-bution of b-lactoglobulin on a fine-grained level withmaximum rank of ‘ ¼ 6 and on a coarse-grained levelwith rank ‘ ¼ 2, respectively. The distributions are mapped
FIGURE 3 Quadrupole ratio jQxx/Qzzj as a function of pH for all theproteins studied; cysteine acidity is not considered. The ratio determineswhether the quadrupole distribution is axial (jQxx/Qzzj ¼ 0.5 andjQxx/Qzzj ¼ 2), planar (jQxx/Qzzj ¼ 1), or somewhere in-between. For addi-tional geometrical interpretation of the quadrupole ratio, see Figs. S2 andS3. To see this figure in color, go online.
FIGURE 4 Multipole expansion of the surface charge distribution of b-lactoglobulin (PDB: 2BLG) in the original coordinate system up to (a) ‘max¼ 6 and(b) ‘max¼ 2. Shown also are the (c) dipole and (d) quadrupole distributions in the original (reference) system. The distributions are mapped from a sphere to aplane using the Mollweide projection. Black diamonds show the orientation of the z axis of the dipole, and black squares show the orientation of the z axis ofthe quadrupole. Gray stars show the coordinate axes of the original coordinate system. Cysteine acidity is not considered, and all the plots are drawn at pH 7.0.To see this figure in color, go online.
pH-Dependent Protein Charge Multipoles
Biophysical Journal 113, 1454–1465, October 3, 2017 1459

from a sphere to a plane using the Mollweide projection,which has the polar and azimuthal angles as coordinateaxes (82). Separately, we also show in Fig. 4, c and d,both the dipole and quadrupole distributions in the originalcoordinate system. All the plots are shown at pH 7, and asimilar figure for HSA is shown in Fig. S5.
From the multipole representation of the surface chargedistribution where terms up to the order ‘ ¼ 6 are included(Fig. 4 a), it is not immediately obvious where the dipoleand quadrupole axes are located. However, when we isolateboth terms (Fig. 4, c and d), this becomes more apparent.When the two distributions are combined with the totalcharge (Fig. 4 b), they describe the coarse-grained variationof the surface charge consistent with the Debye screeningcutoff. Similar observations can be drawn also for the otherproteins studied. For example, by comparing Figs. 4 and S5we can observe a noticeable difference between b-lacto-globulin and HSA: in the former, the dipole distribution isdominant among the lower-order multipoles, whereas theexact opposite is true in the case of the latter.
To demonstrate next how the orientations of the principalz axes of the dipole and quadrupole moments change withpH, we show in Fig. 5 snapshots of the multipole represen-tation of the surface charge distribution of lysozyme (with‘max ¼ 6) at three different values of pH. Similar snapshotsfor HSA are shown in Fig. S6. For a complete comparison,Fig. 6 isolates the orientations of the dipole and quadrupoleprincipal z axes of all four proteins studied, and shows theirvariation in space over the entire range of pH values whilekeeping the coordinate system of the protein fixed. (Notethat the apparent jumps in the location of the quadrupoleaxis in the cases of HSA and b-lactoglobulin are a conse-quence of our confinement of the axis to the upper hemi-sphere for reasons of symmetry.)
As pH is increased, the overall charge moves toward morenegative values. At the same time, the positions of the dipoleand quadrupole principal z axes trace quite a path in space.In the case of the lysozyme (Fig. 6 a), most of the variationin the axes’ orientation occurs after pH> 7. On the contrary,in the case of HSA (Fig. 6 b) the majority of the variation,
especially large in the case of the dipole, happens up untilthat point, i.e., when pH < 7. It is worth noting that the iso-electric points of the two proteins are at the opposite sides ofthe spectrum (Table 1). The axes of the MS2 capsid proteinexhibit perhaps the least variation (Fig. 6 c), whereas thequadrupole axis of b-lactoglobulin shifts in space to a largeextent (Fig. 6 d).
Taken together, we see that not only does pH influence themagnitudes of the various multipole moments, it influenceseven more so their orientation in space. The changes in theorientation do not happen uniformly with the changing pH,but are spaced unevenly across the range. Most of the vari-ation seems to usually (but not always) occur in the pHrange near the isoelectric point of each protein.
DISCUSSION
The results of our model clearly show that pH variationcauses significant changes not only in the magnitudes ofcharge multipole moments in various proteins, but also inthe orientations of the principal axes of their multipoles.In obtaining these results, we have, however, resorted tosome necessary simplifications. Firstly, although we haveused the acid-base dissociation constants pKa of aminoacid functional groups in bulk dilute aqueous solutions,the actual pKa values in proteins are site dependent, i.e.,influenced by the local ionic and structural environment(83,84). The deviations range from small to significant, de-pending on the type of site considered (8,78). Secondly,changes in pH often also lead to conformational changesin proteins (81,84–86), whereas we have used fixed struc-tures obtained from PDB to extract the protein charge distri-butions. In the following, we discuss these simplificationsand limitations of our model, and show that our conclusionsshould remain valid even as more details are included in thedescription of charge distributions in proteins.
In our study, we have intentionally decoupled the effectsof conformational changes from the pH-dependent changesin charges of a protein, as this allowed us to clearly observeand study the effects of pH on the charge multipoles. In this
FIGURE 5 Multipole expansion of the surface charge distribution of lysozyme (PDB: 2LYZ) up to ‘¼ 6 in the original coordinate system, shown for threedifferent values of pH¼ 3, 7, 11. The distributions are mapped from a sphere to a plane using the Mollweide projection. Black diamonds show the orientationof the z axis of the dipole, and black squares show the orientation of the z axis of the quadrupole. Gray stars show the coordinate axes of the original co-ordinate system. Cysteine acidity is not considered. To see this figure in color, go online.
Lo!sdorfer Bo!zi!c and Podgornik
1460 Biophysical Journal 113, 1454–1465, October 3, 2017

way, we were also able to treat the electrostatics of the pro-teins using a simple analytical model. Coupling the electro-statics with the conformational changes would, on the otherhand, necessarily demand a different treatment—involving,e.g., studying protein dynamics to predict the changes inconformation. At the same time, joining the two modelswould make it harder to discern which changes in the mag-nitudes and orientations of the charge multipoles are aconsequence of the conformational changes of a protein,and which are a consequence of its pH-dependent fractionalcharges. In the remaining discussion, we will thus not delveany further into the influence of conformational changes, butwill nonetheless examine the results of our model in light ofthe effects of local pKa shifts arising as a consequence ofsite-site interactions or electrostatic potential. We stress,however, that in real systems where both pH-dependentcharge and conformational changes operate in parallel, wecan expect some quantitative changes in the observed pH-dependent behavior of the protein charge multipoles. Thediscrepancy will naturally be larger in those proteins whereconformational changes due to pH are more significant.
To investigate the basic effect of the local pKa shiftsinduced by site-site interactions, we used PROPKA soft-ware for the empirical prediction of pKa values of the ioniz-able amino acids, as described in the Materials andMethods. The results are summarized in Figs. S7, S8, andS9, and in Table S4. Even though the local pKa values ofthe amino acid residues now differ from the bulk pKa values
used in our model (Table S1) upward to 2 units of pH, theeffect this has on the magnitudes of multipole moments isnonetheless small (Fig. S7). The biggest change can beobserved in the case of the phage MS2 capsid protein inthe range around neutral pH; however, the difference inthe predicted isoelectric point is still <1 unit of pH (TableS4). Our model with pKa values derived from PROPKAalso predicts less of a difference between the magnitudesof the dipole and quadrupole moments in the case ofb-lactoglobulin, yet these differences are at most within afactor of 2 from the predictions of the basic model. Similardifferences can be observed with PROPKA-predicted pKa
values in the orientations of the multipole moments, whichcan range from small in the case of lysozyme (Fig. S8) tobigger in the case of b-lactoglobulin (Fig. S9), yet neversignificantly change the qualitative behavior of the pHdependence of the multipole orientations.
Another factor that we have not explicitly considered inour model, and which can nevertheless potentially have asignificant effect on the local pKa values, is the electrostaticpotential. In principle, the local electrostatic potential at theposition of each ionizable amino acids modifies its pKa
value (Eq. 3). Only when the potential is small is the localpKa shift due to it negligible. This holds, for instance, inthe limit of high salt or large screening, relevant in generalfor physiological conditions. To estimate the pKa shift due toelectrostatic potential in this limit we have extended ourmodel by solving the Debye-H€uckel equation for the
FIGURE 6 (a–d) Orientation of dipole and quadrupole principal z axes (denoted by diamonds and squares, respectively) as a function of pH (in steps of0.2 pH unit). The pH increase from 0 to 14 is shown with a color gradient, with blue hues denoting acidic pH < 7 and red hues denoting basic pH > 7. Inaddition, we explicitly indicate the positions at pH values of 0, 7, and 14. The orientations of the axes are mapped from the circumscribed sphere of the proteinonto a plane using the Mollweide projection; the gray stars show the coordinate axes of the original coordinate system of the protein, which is kept fixed. ThepH dependence of the multipoles’ orientation is shown side by side for all four proteins included in our study. Cysteine acidity is not considered. To see thisfigure in color, go online.
pH-Dependent Protein Charge Multipoles
Biophysical Journal 113, 1454–1465, October 3, 2017 1461

electrostatic potential of the protein in the presence ofcharge regulation boundary condition. The details of thismethodology are given in the Materials and Methods andin the Supporting Material. We observe that the averagepKa shift imparted by the electrostatic potential is on thescale of 1 pH unit in the limit of high salt concentration(c0 & 1 M), as shown in Fig. S1; this is comparable withthe pKa shifts predicted by PROPKA. In contrast to thelatter, the shifts caused by local electrostatic potential arealso pH dependent due to the nature of the model. In thelimit of high salt, the electrostatically shifted pKa valueshave only a small effect: the predicted isoelectric pointsare within <1 unit of pH from the predictions of our basicmodel, and the pH dependence of magnitudes and orienta-tions of the multipole moments follow similar patterns asin the case where electrostatics is not included (Table S4and Figs. S7, S8, and S9). Notably, the predictions basedon the inclusion of the electrostatic potential are sometimescloser to those obtained using PROPKA-predicted pKa
values, although in other cases closer to those obtained us-ing our simple model.
It has to be noted that there are also limitations to the elec-trostatic model we have used for the prediction of local pKa
shifts. The DH equation performs well in the limit of highsalt, which was of interest to us. However, it is known tooverpredict the values of the electrostatic potential in thelimit of vanishing salt. More importantly, the DH equationis based on a continuum description of the electrostatics.Although this is in line with the general model used in ourpresent work, any ion-specific binding effects are thus ne-glected. Coupling the local description of charge interactionwith a global multipole expansion of charge distribution is adifficult problem due to the difference of scales involved. Aconsistent inclusion of local and ion-specific effects wouldat this point require a drastically different model, based onan atomic description of the protein and the solvent,although our approach still retains its fundamental validityin the high salt limit.
Although we have not considered detailed structural envi-ronments of proteins in our work, we note that structuralchanges bring about a different configuration of chargeson the surface of a protein. A similar reconfiguration ofcharges can arise by the variation of the RSA cutoff c. Toshow that the choice of the RSA cutoff does not have a largeimpact on the qualitative results of our study, we plot inFig. S10 the pH dependence of the multipole moments ofthe four proteins studied for three different choices of thecutoff, ranging from c ¼ 0.1 to c ¼ 0.5. In each of the casesconsidered, going from c¼ 0.1 to c¼ 0.5 amounts to quite asignificant loss of 24–34% of the total number of surfacecharges (see Table S1). And yet, some apparent differenceswhen the cutoff is increased notwithstanding, the qualitativebehavior of the multipole moments remains much the same.This validates our approach, which fixed the cutoff to c ¼0.25, and the conclusions drawn from it: whereas small var-
iations of the number of charges on the surface of a proteinwill necessarily change the underlying multipole expansionof the surface charge distribution, the qualitative behaviorwe observed when the pH is varied will remain unaltered.
Lastly, we separately examine the possibility of cysteineprotonation, which was not explicitly considered in ourmain model. Due to its pKa value, this should in principlepush the charge distribution toward more negative valuesat pH > 7. To see how the consideration of cysteine acidityinfluences our results, we show in Fig. S11 a comparison ofthe pH dependence of the multipole magnitudes in the caseof HSA and MS2 capsid protein. We can again observe thatthe presence of cysteine protonation has no qualitative effecton the behavior of the system. It does affect the location ofthe isoelectric point to some extent (see Table S4), althoughthe difference is again <1 unit of pH. Other than that, themagnitudes of the multipole components and their pHdependence remain relatively unchanged. Similarly, bycomparing the orientations of the dipole and quadrupoleaxes between the cases where cysteine acidity is or is notconsidered (Figs. S12 and 6, respectively), we see that thepresence of cysteine charges influences the orientationalvariation of the principal axes at pH > 7, as expected,although the changes are usually minor.
CONCLUSIONS
In this work, we have studied the effects of pH on chargemultipole moments in proteins. We first obtained pH-depen-dent surface charge distributions of four globular proteinsand expanded the distributions in terms of electrostatic mul-tipoles. We have limited ourselves to lower-order multipoles(the total charge and the dipole and quadrupole moments),and studied the effect of pH on both their magnitudes andthe orientations of their principal axes in space. The valueof pH was shown to have a significant effect on both, partic-ularly on the orientations of the multipole principal axes,which in some cases exhibited large variation. This variationwas found to be a nonuniform function of pH, spaced ratherunevenly across the solid angle, with most of the changesoccurring in the pH range near the isoelectric point ofeach protein.
We have also pointed out some limitations and necessarysimplifications of our approach. Although the precise deter-mination of the fractional charge of amino acid residues in aprotein due to site-site interactions and local electrostaticpotential is difficult, we have nonetheless been able toexplore the general influence of local pKa shifts. We havedone this by extending our simple model with either empir-ically predicted pKa values or with pKa values shifted by anelectrostatic potential derived from a detailed solution of thecorresponding DH equation. In this way, we have shownwhen and how the qualitative conclusions derived in ourarticle hold even when the surface charges vary due to localpKa shifts, and have demonstrated that the observed
Lo!sdorfer Bo!zi!c and Podgornik
1462 Biophysical Journal 113, 1454–1465, October 3, 2017
behavior of multipoles described by our model shouldpersist even as a more detailed picture becomes attainable.
The highly protein-specific pH-dependent changes incharge distributions are often intertwined with pH-depen-dent conformational changes of proteins and can occurconcomitantly. To elucidate the direct influence of the pHdependence of charge multipoles using a simple analyticalmodel, we have neglected any conformational changes;this is, of course, an oversimplification. However, themain results of our model persisted even as the number ofcharges or their local pKa values were varied. This indicatesthat the pH variation of the charge multipole moments ofproteins can possibly also play a role as a driving forcefor conformational changes, and that the pH variation ofthe direction of the multipole principal axes can affect theelectrostatic part of the deformation energy. In this way, itcan induce an orientational conformational change of theprotein (81,84), in direct analogy to the structural phasetransitions in general condensed matter context.
In addition, the orientational variation of the multipoleprincipal axes remains of fundamental importance for pro-tein-protein interactions also when screened electrostatic in-teractions in the presence of ionic solution are taken intoaccount. There, the multipole moments play a significantlydifferent role compared to the case of pure, unscreenedCoulomb interactions, in the sense that the screened electro-static potential retains the full directional dependence of allmultipole moments even in the far-field limit. Consequently,the usual argument that at large separations, only the mono-pole moment matters, is an untenable one, and althoughthis property of screened multipole electrostatics is notnew (34–37), it has yet to penetrate the community involvedin modeling protein-protein interactions.
Finally, we can speculate that higher-order multipolemoments can provide a specific electrostatic signature ofeach protein, and could potentially be used to classifydifferent protein types (32). This electrostatic signaturecould be further refined by defining and tracking the orien-tations of higher-order multipoles, possibly allowing for aclassification scheme based on a small number of signifi-cant parameters coding for the protein symmetry andinteractions.
The major lesson of our investigation is thus that pH vari-ation has a significant influence on the magnitudes and espe-cially orientations of charge multipole moments in proteins.This finding was derived using a simple analytical model ina form compatible with models of charged patchy proteins,and at the same time amenable to the inclusion of additionaleffects, such as empirically predicted pKa values or pKa
shifts due to local electrostatic potential. The results pre-sented in this work should be of particular significance toprotein assembly engineering, e.g., for viral capsids andenzyme nanocontainers, where pH could drive symmetrytransitions of the entire assembly induced by local, orienta-tionally dependent electrostatic interactions.
SUPPORTING MATERIAL
SupportingMaterials andMethods, twelve figures, and four tables are avail-able at http://www.biophysj.org/biophysj/supplemental/S0006-3495(17)30879-2.
AUTHORS CONTRIBUTIONS
A.L.B. and R.P. designed the research. A.L.B. performed the research.A.L.B. and R.P. analyzed the data and wrote the article.
ACKNOWLEDGMENTS
We thank S. !Copar, G. Posnjak, and I. Rapo!sova for helpful discussions andcomments on the manuscript. We are also grateful to the anonymous re-viewers for their comments and suggestions to improve the quality of themanuscript.
A.L.B. and R.P. acknowledge financial support from the SlovenianResearch Agency (under Research Core Funding grant No. P1-0055).
REFERENCES
1. Leckband, D., and J. Israelachvili. 2001. Intermolecular forces inbiology. Q. Rev. Biophys. 34:105–267.
2. Leckband, D., and S. Sivasankar. 1999. Forces controlling protein in-teractions: theory and experiment. Colloids Surf. B Biointerfaces.14:83–97.
3. Piazza, R. 2004. Protein interactions and association: an open chal-lenge for colloid science. Curr. Opin. Colloid Interface Sci. 8:515–522.
4. Simonson, T. 2003. Electrostatics and dynamics of proteins. Rep. Prog.Phys. 66:737–787.
5. Woods, L., D. Dalvit, ., R. Podgornik. 2016. A materials perspectiveon Casimir and van der Waals interactions. Rev. Mod. Phys. 88:045003.
6. Perutz, M. F. 1978. Electrostatic effects in proteins. Science. 201:1187–1191.
7. Warshel, A., P. K. Sharma, ., W. W. Parson. 2006. Modeling electro-static effects in proteins. Biochim. Biophys. Acta. 1764:1647–1676.
8. Gitlin, I., J. D. Carbeck, and G. M. Whitesides. 2006. Why are proteinscharged? Networks of charge-charge interactions in proteins measuredby charge ladders and capillary electrophoresis. Angew. Chem. Int. Ed.Engl. 45:3022–3060.
9. Nozaki, Y., and C. Tanford. 1967. Examination of titration behavior.Methods Enzymol. 11:715–734.
10. Lund, M., and B. Jonsson. 2005. On the charge regulation of proteins.Biochemistry. 44:5722–5727.
11. da Silva, F. L., M. Lund,., T. Akesson. 2006. On the complexation ofproteins and polyelectrolytes. J. Phys. Chem. B. 110:4459–4464.
12. Barroso da Silva, F. L., and B. Jonsson. 2009. Polyelectrolyte-pro-tein complexation driven by charge regulation. Soft Matter. 5:2862–2868.
13. Finkelstein, A., and O. Ptitsyn. 2016. Protein Physics: ACourse of Lec-tures, 2nd Ed. Academic Press, Cambridge, MA.
14. Gong, H., G. Hocky, and K. F. Freed. 2008. Influence of nonlinear elec-trostatics on transfer energies between liquid phases: charge burial isfar less expensive than the Born model. Proc. Natl. Acad. Sci. USA.105:11146–11151.
15. Isom, D. G., C. A. Castaneda, ., B. Garcıa-Moreno E. 2010. Chargesin the hydrophobic interior of proteins. Proc. Natl. Acad. Sci. USA.107:16096–16100.
16. Jensen, J. H. 2008. Calculating pH and salt dependence of protein-pro-tein binding. Curr. Pharm. Biotechnol. 9:96–102.
pH-Dependent Protein Charge Multipoles
Biophysical Journal 113, 1454–1465, October 3, 2017 1463

17. Markovich, T., D. Andelman, and R. Podgornik. 2016. Charge regula-tion: a generalized boundary condition? Europhys. Lett. 113:26004.
18. Longo, G., M. Olvera de la Cruz, and I. Szleifer. 2012. Molecular the-ory of weak polyelectrolyte thin films. Soft Matter. 8:1344–1354.
19. Nap, R. J., A. L. Bo!zi!c, ., R. Podgornik. 2014. The role of solutionconditions in the bacteriophage PP7 capsid charge regulation.Biophys. J. 107:1970–1979.
20. Lee, L. P., D. J. Cole,., M. C. Payne. 2013. Polarized protein-specificcharges from atoms-in-molecule electron density partitioning. J. Chem.Theory Comput. 9:2981–2991.
21. Adhikari, P., A. M. Wen, ., W.-Y. Ching. 2014. Electronic structure,dielectric response, and surface charge distribution of RGD (1FUV)peptide. Sci. Rep. 4:5605.
22. Eifler, R., R. Podgornik, ., W.-Y. Ching. 2016. Charge distributionand hydrogen bonding of a collagen a2-chain in dry, hydrated andprotonated/deprotonated structural models. Int. J. Quantum Chem.116:681–691.
23. Gramada, A., and P. E. Bourne. 2006. Multipolar representation of pro-tein structure. BMC Bioinformatics. 7:242.
24. Hoppe, T. 2013. A simplified representation of anisotropic charge dis-tributions within proteins. J. Chem. Phys. 138:174110.
25. Paulini, R., K. M€uller, and F. Diederich. 2005. Orthogonal multipolarinteractions in structural chemistry and biology. Angew. Chem. Int.Ed. Engl. 44:1788–1805.
26. Yuan, Y., M. J. Mills, and P. L. Popelier. 2014. Multipolar electrostaticsbased on the Kriging machine learning method: an application toserine. J. Mol. Model. 20:2172.
27. Yuan, Y., M. J. Mills, and P. L. Popelier. 2014. Multipolar electrostaticsfor proteins: atom-atom electrostatic energies in crambin. J. Comput.Chem. 35:343–359.
28. Fletcher, T. L., and P. L. Popelier. 2016. Multipolar electrostatic energyprediction for all 20 natural amino acids using Kriging machinelearning. J. Chem. Theory Comput. 12:2742–2751.
29. Postarnakevich, N., and R. Singh. 2009. Global-to-local representationand visualization of molecular surfaces using deformable models. InProceedings of the 2009 ACM Symposium on Applied Computing.ACM, New York, pp. 782–787.
30. Arzen!sek, D., D. Kuzman, and R. Podgornik. 2015. Hofmeister effectsin monoclonal antibody solution interactions. J. Phys. Chem. B.119:10375–10389.
31. Platt, D. E., and B. D. Silverman. 1996. Registration, orientation, andsimilarity of molecular electrostatic potentials through multipolematching. J. Comput. Chem. 17:358–366.
32. Nakamura, H., and A. Wada. 1985. Nature of the charge distribution inproteins. III. Electric multipole structures. J. Phys. Soc. Jpn. 54:4047–4052.
33. Kim, J. Y., S. H. Ahn, ., B. J. Yoon. 2006. Electrophoretic mobilityequation for protein with molecular shape and charge multipole effects.J. Colloid Interface Sci. 299:486–492.
34. Rowan, D., J.-P. Hansen, and E. Trizac. 2000. Screened electrostatic in-teractions between clay platelets. Mol. Phys. 98:1369–1378.
35. Kjellander, R., and R. Ramirez. 2008. Yukawa multipole electrostaticsand nontrivial coupling between electrostatic and dispersion interac-tions in electrolytes. J. Phys. Condens. Matter. 20:494209.
36. Lo!sdorfer Bo!zi!c, A., and R. Podgornik. 2013. Symmetry effects inelectrostatic interactions between two arbitrarily charged sphericalshells in the Debye-H€uckel approximation. J. Chem. Phys. 138:074902.
37. Kjellander, R. 2016. Nonlocal electrostatics in ionic liquids: the key toan understanding of the screening decay length and screened interac-tions. J. Chem. Phys. 145:124503.
38. Li, W., B. A. Persson, ., M. Zackrisson Oskolkova. 2015. Charge-induced patchy attractions between proteins. J. Phys. Chem. B.119:503–508.
39. McManus, J. J., P. Charbonneau, ., N. Asherie. 2016. The physics ofprotein self-assembly. Curr. Op. Colloid Interf. Sci. 22:73–79.
40. Grant, M. L. 2001. Nonuniform charge effects in protein-protein inter-actions. J. Phys. Chem. B. 105:2858–2863.
41. Matthew, J. B., F. R. Gurd, ., S. J. Shire. 1985. pH-dependent pro-cesses in proteins. CRC Crit. Rev. Biochem. 18:91–197.
42. !Siber, A., A. L. Bo!zi!c, and R. Podgornik. 2012. Energies and pressuresin viruses: contribution of nonspecific electrostatic interactions. Phys.Chem. Chem. Phys. 14:3746–3765.
43. Hieronimus, R., S. Raschke, and A. Heuer. 2016. How to model theinteraction of charged Janus particles. J. Chem. Phys. 145:064303.
44. Yigit, C., J. Heyda, and J. Dzubiella. 2015. Charged patchy particlemodels in explicit salt: ion distributions, electrostatic potentials, andeffective interactions. J. Chem. Phys. 143:064904.
45. Yigit, C., J. Heyda, ., J. Dzubiella. 2015. Like-charged protein-poly-electrolyte complexation driven by charge patches. J. Chem. Phys.143:064905.
46. Yigit, C., M. Kandu!c, ., J. Dzubiella. 2017. Interaction of chargedpatchy protein models with like-charged polyelectrolyte brushes. Lang-muir. 33:417–427.
47. Bianchi, E., R. Blaak, and C. N. Likos. 2011. Patchy colloids: state ofthe art and perspectives. Phys. Chem. Chem. Phys. 13:6397–6410.
48. Bianchi, E., C. N. Likos, and G. Kahl. 2014. Tunable assembly of het-erogeneously charged colloids. Nano Lett. 14:3412–3418.
49. Stipsitz, M., G. Kahl, and E. Bianchi. 2015. Generalized inverse patchycolloid model. J. Chem. Phys. 143:114905.
50. Sasaki, E., and D. Hilvert. 2016. Self-assembly of proteinaceous multi-shell structures mediated by a supercharged protein. J. Phys. Chem. B.120:6089–6095.
51. Berman, H. M., J. Westbrook,., P. E. Bourne. 2000. The Protein DataBank. Nucleic Acids Res. 28:235–242.
52. Cardinaux, F., A. Stradner, ., E. Zaccarelli. 2007. Modeling equilib-rium clusters in lysozyme solutions. Europhys. Lett. 77:48004.
53. Pettersen, E. F., T. D. Goddard, ., T. E. Ferrin. 2004. UCSFChimera—a visualization system for exploratory research and analysis.J. Comput. Chem. 25:1605–1612.
54. Sanner, M. F., A. J. Olson, and J.-C. Spehner. 1996. Reduced surface:an efficient way to compute molecular surfaces. Biopolymers. 38:305–320.
55. Bendell, C. J., S. Liu, ., R. A. Murgita. 2014. Transient protein-pro-tein interface prediction: datasets, features, algorithms, and the RAD-Tpredictor. BMC Bioinformatics. 15:82.
56. Pollastri, G., P. Baldi,., R. Casadio. 2002. Prediction of coordinationnumber and relative solvent accessibility in proteins. Proteins.47:142–153.
57. Yuan, Z., K. Burrage, and J. S. Mattick. 2002. Prediction of proteinsolvent accessibility using support vector machines. Proteins. 48:566–570.
58. Chen, H., and H.-X. Zhou. 2005. Prediction of solvent accessibility andsites of deleterious mutations from protein sequence. Nucleic AcidsRes. 33:3193–3199.
59. Wu, W., Z. Wang, ., T. Li. 2017. Accurate prediction of protein rela-tive solvent accessibility using a balanced model. BioData Min. 10:1.
60. Tien, M. Z., A. G. Meyer, ., C. O. Wilke. 2013. Maximum allowedsolvent accessibilities of residues in proteins. PLoS One. 8:e80635.
61. Haynes, W. M. 2016. CRC Handbook of Chemistry and Physics, 97thEd. CRC Press, Boston, MA.
62. Ninham, B. W., and V. A. Parsegian. 1971. Electrostatic potential be-tween surfaces bearing ionizable groups in ionic equilibrium withphysiologic saline solution. J. Theor. Biol. 31:405–428.
63. Krishnan, M. 2017. A simple model for electrical charge in globularmacromolecules and linear polyelectrolytes in solution. J. Chem.Phys. 146:205101.
64. Tanford, C., and J. G. Kirkwood. 1957. Theory of protein titrationcurves. I. General equations for impenetrable spheres. J. Am. Chem.Soc. 79:5333–5339.
Lo!sdorfer Bo!zi!c and Podgornik
1464 Biophysical Journal 113, 1454–1465, October 3, 2017
65. Da Silva, F. L., B. Jonsson, and R. Penfold. 2001. A critical investiga-tion of the Tanford-Kirkwood scheme by means of Monte Carlo simu-lations. Protein Sci. 10:1415–1425.
66. Alexov, E., E. L. Mehler,., J. M. Word. 2011. Progress in the predic-tion of pKa values in proteins. Proteins. 79:3260–3275.
67. Søndergaard, C. R., M. H. Olsson, ., J. H. Jensen. 2011. Improvedtreatment of ligands and coupling effects in empirical calculation andrationalization of pKa values. J. Chem. Theory Comput. 7:2284–2295.
68. Gray, C. G., and K. E. Gubbins. 1984. Theory of Molecular Fluids:Fundamentals, Vol. 1. International Series of Monographs on Chemis-try, Book 9. Oxford University Press, Oxford, UK.
69. Wetter, L. R., and H. F. Deutsch. 1951. Immunological studies on eggwhite proteins. IV. Immunochemical and physical studies of lysozyme.J. Biol. Chem. 192:237–242.
70. Strang, R. H. C. 1984. Purification of egg-white lysozyme by ion-ex-change chromatography. Biochem. Educ. 12:57–59.
71. Evenson, M. A., and H. F. Deutsch. 1978. Influence of fatty acids on theisoelectric point properties of human serum albumin. Clin. Chim. Acta.89:341–354.
72. Langer, K., S. Balthasar, ., D. Schubert. 2003. Optimization of thepreparation process for human serum albumin (HSA) nanoparticles.Int. J. Pharm. 257:169–180.
73. Majhi, P. R., R. R. Ganta,., P. L. Dubin. 2006. Electrostatically drivenprotein aggregation: b-lactoglobulin at low ionic strength. Langmuir.22:9150–9159.
74. Mercadante, D., L. D. Melton, ., G. B. Jameson. 2012. Bovineb-lactoglobulin is dimeric under imitative physiological conditions:dissociation equilibrium and rate constants over the pH range of2.5–7.5. Biophys. J. 103:303–312.
75. Michen, B., and T. Graule. 2010. Isoelectric points of viruses. J. Appl.Microbiol. 109:388–397.
76. Dika, C., J. F. Duval,., C. Gantzer. 2015. Isoelectric point is an inad-equate descriptor of MS2, fX 174 and PRD1 phages adhesion onabiotic surfaces. J. Colloid Interface Sci. 446:327–334.
77. Dika, C., J. F. L. Duval, ., C. Gantzer. 2011. Impact of internal RNAon aggregation and electrokinetics of viruses: comparison betweenMS2 phage and corresponding virus-like particles. Appl. Environ. Mi-crobiol. 77:4939–4948.
78. Langlet, J., F. Gaboriaud,., J. F. Duval. 2008. Impact of chemical andstructural anisotropy on the electrophoretic mobility of spherical softmultilayer particles: the case of bacteriophage MS2. Biophys. J.94:3293–3312.
79. Penrod, S. L., T. M. Olson, and S. B. Grant. 1996. Deposition kineticsof two viruses in packed beds of quartz granular media. Langmuir.12:5576–5587.
80. Schaldach, C. M., W. L. Bourcier, ., W. D. Wilson. 2006. The influ-ence of ionic strength on the interaction of viruses with chargedsurfaces under environmental conditions. J. Colloid Interface Sci.294:1–10.
81. O’Brien, E. P., B. R. Brooks, and D. Thirumalai. 2012. Effects of pH onproteins: predictions for ensemble and single-molecule pulling experi-ments. J. Am. Chem. Soc. 134:979–987.
82. Snyder, J. P. 1987. Map Projections—A Working Manual, Vol. 1395.US Government Printing Office, Washington, DC.
83. Hass, M. A., and F. A. Mulder. 2015. Contemporary NMR studies ofprotein electrostatics. Annu. Rev. Biophys. 44:53–75.
84. Schaefer, M., M. Sommer, and M. Karplus. 1997. pH-dependence ofprotein stability: absolute electrostatic free energy differences betweenconformations. J. Phys. Chem. B. 101:1663–1683.
85. Harrison, J. S., C. D. Higgins,., J. R. Lai. 2013. Role of electrostaticrepulsion in controlling pH-dependent conformational changes of viralfusion proteins. Structure. 21:1085–1096.
86. Goh, G. B., E. N. Laricheva, and C. L. Brooks, 3rd. 2014. UncoveringpH-dependent transient states of proteins with buried ionizable resi-dues. J. Am. Chem. Soc. 136:8496–8499.
pH-Dependent Protein Charge Multipoles
Biophysical Journal 113, 1454–1465, October 3, 2017 1465