Embed Size (px)
Citation preview

Page: 1
PETROBRAS ANNOUNCES THIRD QUARTER OF 2004 RESULTS (Rio de Janeiro – November 30, 2004) – PETRÓLEO BRASILEIRO S.A. – PETROBRAS today announced its consolidated results stated in U.S. dollars, prepared in accordance with U.S. GAAP.
PETROBRAS reported consolidated net income of U.S.$ 4,483 million and consolidated net operating revenues of U.S.$ 26,751 million for the nine-month period ended September 30, 2004, compared to consolidated net income of U.S.$ 5,665 million and consolidated net operating revenues of U.S.$ 22,648 million for the nine-month period ended September 30, 2003.
COMMENTS FROM THE CEO, MR. JOSĖ EDUARDO DE BARROS DUTRA
I am pleased to present our results for the nine-month period ended September 30, 2004. The company’s noteworthy performance is due to the combination of actions and efforts carried out by our employees and workforce, at both the operational level as well as the administrative level.
During this quarter we continued to fulfill the goals and objectives established in our strategic plan. During the nine-month period ended September 30, 2004, our capital expenditures totaled U.S.$ 4.765 billion and additionally made an acquisition of a 100% stake in Sophia do Brasil S.A.(formerly Agip do Brasil S.A.).
On September 15, 2004 we issued U.S.$ 600 million of Global Notes in the international capital markets. This operation marked our return to the international capital markets since our last issuance in December 2003. The wide bond placement, reaching various categories of investors in numerous geographical locations, reflected the market’s recognition of our credit quality in the international capital markets, as confirmed by our improved foreign currency debt rating from Ba2 to Ba1, just one level away from investment grade according to Moody’s Investor Services.
In recent months, the international petroleum market has experienced extreme price volatility, along with subsequent pressure on the costs of services and materials consumed
by companies in the energy sector. In our efforts to preserve our profitability, we have conducted price adjustments throughout the period, without compromising the loyalty of our clients or our market share.
We also launched Platform P-43 on October 13, 2004. It will operate in the Barracuda field in the Campos Basin, with estimated production capacity of 150,000 barrels per day. Platform P-43 will play a key role in contributing to Brazil’s oil production goals.
On September 17, 2004, our Board of Directors approved a dividend in the form of interest on own capital. The approved amount totals U.S.$ 1,144 million, which corresponds to U.S.$ 1.04 per ordinary and preferred share. The dividend was provisioned in the financial statements for the nine-month period ended September 30, 2004 and will be distributed by February 15, 2005.
Shortly after September 30, 2004, the parent company and 7 subsidiaries began the implementation of an Integrated Management System – SAP/R3 – which will be an important tool for integrating and facilitating our businesses, increasing our competitiveness and placing us on an even playing field with the largest international oil companies.
All of these efforts translate into returns, not just for our shareholders but also for our employees, suppliers, clients, and in the communities where we operate. .
Page: 2
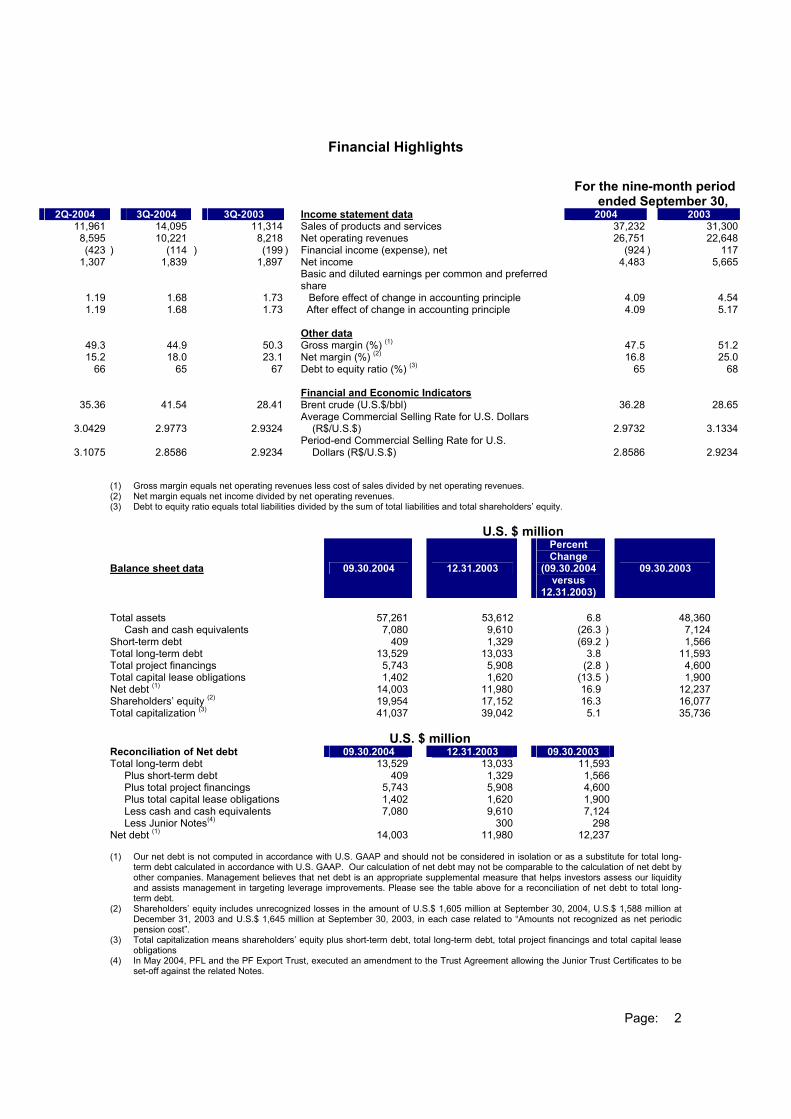
Financial Highlights
For the nine-month period
ended September 30, 2Q-2004 3Q-2004 3Q-2003 Income statement data 2004 2003
11,961 14,095 11,314 Sales of products and services 37,232 31,300 8,595 10,221 8,218 Net operating revenues 26,751 22,648 (423 ) (114 ) (199 ) Financial income (expense), net (924 ) 117
1,307 1,839 1,897 Net income 4,483 5,665
Basic and diluted earnings per common and preferred
share
1.19 1.68 1.73 Before effect of change in accounting principle 4.09 4.54 1.19 1.68 1.73 After effect of change in accounting principle 4.09 5.17
Other data
49.3 44.9 50.3 Gross margin (%) (1) 47.5 51.2 15.2 18.0 23.1 Net margin (%) (2) 16.8 25.0
66 65 67 Debt to equity ratio (%) (3) 65 68 Financial and Economic Indicators
35.36 41.54 28.41 Brent crude (U.S.$/bbl) 36.28 28.65
3.0429
2.9773
2.9324 Average Commercial Selling Rate for U.S. Dollars
(R$/U.S.$)
2.9732 3.1334
3.1075
2.8586
2.9234
Period-end Commercial Selling Rate for U.S. Dollars (R$/U.S.$)
2.8586 2.9234
(1) Gross margin equals net operating revenues less cost of sales divided by net operating revenues. (2) Net margin equals net income divided by net operating revenues. (3) Debt to equity ratio equals total liabilities divided by the sum of total liabilities and total shareholders’ equity.
U.S. $ million
Balance sheet data 09.30.2004 12.31.2003
Percent Change
(09.30.2004 versus
12.31.2003)
09.30.2003
Total assets 57,261 53,612 6.8 48,360 Cash and cash equivalents 7,080 9,610 (26.3 ) 7,124Short-term debt 409 1,329 (69.2 ) 1,566Total long-term debt 13,529 13,033 3.8 11,593Total project financings 5,743 5,908 (2.8 ) 4,600Total capital lease obligations 1,402 1,620 (13.5 ) 1,900Net debt (1) 14,003 11,980 16.9 12,237Shareholders’ equity (2) 19,954 17,152 16.3 16,077Total capitalization (3) 41,037 39,042 5.1 35,736
U.S. $ million
Reconciliation of Net debt 09.30.2004 12.31.2003 09.30.2003 Total long-term debt 13,529 13,033 11,593 Plus short-term debt 409 1,329 1,566 Plus total project financings 5,743 5,908 4,600 Plus total capital lease obligations 1,402 1,620 1,900 Less cash and cash equivalents 7,080 9,610 7,124 Less Junior Notes(4) 300 298 Net debt (1) 14,003 11,980 12,237 (1) Our net debt is not computed in accordance with U.S. GAAP and should not be considered in isolation or as a substitute for total long-
term debt calculated in accordance with U.S. GAAP. Our calculation of net debt may not be comparable to the calculation of net debt by other companies. Management believes that net debt is an appropriate supplemental measure that helps investors assess our liquidity and assists management in targeting leverage improvements. Please see the table above for a reconciliation of net debt to total long-term debt.
(2) Shareholders’ equity includes unrecognized losses in the amount of U.S.$ 1,605 million at September 30, 2004, U.S.$ 1,588 million at December 31, 2003 and U.S.$ 1,645 million at September 30, 2003, in each case related to “Amounts not recognized as net periodic pension cost”.
(3) Total capitalization means shareholders’ equity plus short-term debt, total long-term debt, total project financings and total capital lease obligations
(4) In May 2004, PFL and the PF Export Trust, executed an amendment to the Trust Agreement allowing the Junior Trust Certificates to be set-off against the related Notes.

Page: 3
OPERATING HIGHLIGHTS For the nine-month period
ended September 30, 2Q-2004 3Q-2004 3Q-2003 2004 2003
Average daily crude oil and gas production 1,630 1,692 1,727 Crude oil and NGLs (Mbpd) (1) 1,656 1,708 1,461 1,523 1,562 Brazil 1,487 1,549
169 169 165 International 169 159 2,136 2,208 2,046 Natural gas (Mmcfpd) (2) 2,160 1,992 1,572 1,620 1,524 Brazil 1,590 1,488
564 588 522 International 570 504
Crude oil and NGL average sales price (U.S. dollars
per bbl)
32.88 36.13 26.16 Brazil (3) 32.94 27.09 25.15 28.31 21.29 International 26.30 22.69
Natural gas average sales price (U.S. dollars per Mcf)
1.90 1.77 1.87 Brazil 1.86 1.75 1.14 1.09 1.07 International 1.14 1.31
Lifting costs (U.S. dollars per boe)
Crude oil and natural gas – Brazil 10.09 10.72 8.69 Including government take (4) 10.18 8.44
4.16 4.10 3.61 Excluding government take (4) 4.18 3.30 2.50 2.53 2.43 Crude oil and natural gas – International 2.49 2.36
Refining costs (U.S. dollars per boe)
1.45 1.18 1.07 Brazil 1.27 1.05 1.23 1.22 1.17 International 1.20 1.13
Refining and marketing operations (Mbpd) 2,125 2,125 2,085 Primary Processed Installed Capacity 2,125 2,085
Brazil 1,996 1,996 1,956 Installed capacity 1,996 1,956 1,670 1,659 1,674 Output of oil products 1,685 1,651 84% 86% 84% Utilization 86% 83%
International 129 129 129 Installed capacity 129 129
96 104 96 Output of oil products 100 92 74% 79% 75% Utilization 76% 73%
73 77 80 Domestic crude oil as % of total feedstock processed 76 81
Imports (Mbpd) 493 439 360 Crude oil imports 450 322
62 166 125 Oil product imports 101 121 128 137 91 Import of gas, alcohol and others 123 86
Exports (Mbpd) 189 208 242 Crude oil exports 196 223 266 258 201 Oil product exports 240 215
6 5 13 Fertilizer and other exports 5 9 222 271 120 Net imports 233 82
Sales Volume (thousand bpd) 1,565 1,676 1,542 Oil Products 1,577 1,500
26 38 39 Alcohol and Others 31 32 205 217 194 Natural Gas 205 172
1,796 1,931 1,775 Total 1,813 1,704 450 497 440 Distribution 459 427
(396 ) (469 ) (385) Inter-company sales (417) (382 ) 1,850 1,959 1,830 Total domestic market 1,855 1,749
461 472 469 Exports 441 455 205 190 219 International sales 215 229 247 223 121 Other operations (5) 201 139 913 885 809 Total international market 857 823
2,763 2,844 2,639 Total 2,712 2,572(1) Includes production from shale oil reserves. (2) Does not include liquefied natural gas. Includes reinjected gas. (3) Crude oil and NGL average sales price in Brazil includes intra-company transfers and sales to third parties. (4) Government take includes royalties, special government participation and rental of areas. (5) Includes third-party sales by our international subsidiary, Petrobras International Finance Company (PIFCo).

Page: 4
ANALYSIS OF OPERATING HIGHLIGHTS
Exploration and Production Domestic crude oil and NGL production decreased 4.0% to 1,487 thousand barrels per day for the nine-month period ended September 30, 2004, as compared to 1,549 thousand barrels per day for the nine-month period ended September 30, 2003. This decrease was primarily due to: (1) an interruption in production of DP-Seillean in the Jubarte field for scheduled inspections; (2) the shut-down of wells located in the Marlim Sul and Voador fields due to the high production of water and sand; (3) a temporary shut-down of the P-40 production platform - (Marlim Sul) due to elevated water production and limited oil processing at the platform; (4) a shut-down of some Albacora wells for maintenance on turbo-compressors; and (5) a scheduled stoppage of the Linguado, Pampo and Enchova platforms. International crude oil and NGL production increased 6.3% to 169 thousand barrels per day for the nine-month period ended September 30, 2004, as compared to 159 thousand barrels per day for the nine-month period ended September 30, 2003, principally due to the consolidation of Petrobras Energia Participaciones S.A. (PEPSA) and Petrolera Entre Lomas S.A. (PELSA) as of May 2003, as well as increased production of Bolivian gas, driven by increased demand in the Brazilian market. Lifting Costs Our lifting costs in Brazil, excluding government take, increased 26.8% to U.S.$ 4.18 per barrel of oil equivalent for the nine-month period ended September 30, 2004, from U.S.$ 3.30 per barrel of oil equivalent for the nine-month period ended September 30, 2003. This increase was primarily due to: (1) maintenance and technical services for well restoration, drilling rigs and special ships (these prices are tied to international oil prices); (2) additional maintenance materials and services at ocean terminals, transport lines and installations associated with our health, safety and environmental program; and (3) higher personnel expenses primarily related to: overtime payments as set forth in our collective bargaining agreement; an increase
in our workforce; and a revision in the actuarial calculations relating to future health care and pension benefits. Our lifting costs in Brazil, including government take (comprised of royalties, special government participation and rental of areas), increased 20.6% to U.S.$ 10.18 per barrel of oil equivalent for the nine-month period ended September 30, 2004, from U.S.$ 8.44 per barrel of oil equivalent for the nine-month period ended September 30, 2003, due primarily to the higher operating expenses mentioned above and increased expenses from special governmental participation due to the higher average reference price for domestic oil. The increase in these costs was partially offset by the 4.0% reduction in production from certain fields, principally at the Marlim and Marlim Sul oil fields, which have a higher special participation rate. Our international lifting costs increased 5.5% to U.S.$ 2.49 per barrel of oil equivalent for the nine-month period ended September 30, 2004, as compared to U.S.$ 2.36 per barrel of oil equivalent for the nine-month period ended September 30, 2003. This increase was primarily due to increased expenses for personnel, materials and services contracted at Block 18 in PEPSA-Ecuador and intervention in wells in Argentina Refining costs Domestic unit refining costs increased 20.9% to U.S.$ 1.27 per barrel of oil equivalent for the nine-month period ended September 30, 2004, as compared to U.S.$ 1.05 per barrel of oil equivalent for the nine-month period ended September 30, 2003. This increase was primarily due to: (1) higher personnel expenses primarily related to: overtime payments as set forth in our collective bargaining agreement; an increase in our workforce; and a revision in the actuarial calculations relating to future health care and pension benefits; (2) an increase in costs related to planned stoppages at certain refineries; and (3) third-party services, mainly for corrective maintenance. International unit refining costs increased 6.2% to U.S.$1.20 per barrel of oil equivalent for the nine-month period ended September

Page: 5
30, 2004, as compared to U.S.$ 1.13 per barrel of oil equivalent for the nine-month period ended September 30, 2003. This increase was primarily due to increased expenses for personnel, materials, maintenance and contracted services – which primarily consisted of environmental and quality control consulting, in Argentina. Sales Volume Our domestic sales volume, consisting primarily of sales of diesel oil, gasoline, jet fuel, naphtha, fuel oil and liquefied petroleum gas, increased 6.1% to 1,855 thousand barrels per day for the nine-month period ended September 30, 2004, as compared to
1,749 thousand barrels per day for the nine-month period ended September 30, 2003. The increase in sales volume was primarily due to the rise in the sales of diesel oil, gasoline, jet fuel and LPG as a result of the rebound in 2004 after the contraction of the Brazilian economy during 2003. This increase was partially offset by a reduction in the sales of fuel oil. The decrease in fuel oil consumption during the nine-month period ended September 30, 2004, in relation to the same period in 2003, reflected the increased use of products that serve as substitutes for fuel oil, such as imported coke, coal (domestic and imported), wood, biomass, and natural gas. .
ANALYSIS OF FINANCIAL CONDITION AND RESULTS OF OPERATIONS
Overview We earn income from: • domestic sales, which consist of sales of
oil products (such as diesel oil, gasoline, jet fuel, naphtha, fuel oil and liquefied petroleum gas ), natural gas and petrochemical products;
• export sales, which consist primarily of sales of crude oil and oil products;
• international sales (excluding export sales), which consist of sales of crude oil, natural gas and oil products that are purchased, produced and refined abroad; and
• other sources, including services, investment income and foreign exchange gains.
Our expenses include: • costs of sales (which are comprised
primarily of labor expenses, cost of operating and purchases of crude oil and oil products); maintaining and repairing property, plants and equipment; depreciation and amortization of fixed assets and depletion of oil fields, and costs of exploration; ;
• selling, general and administrative expenses; and
• interest expense, monetary and foreign exchange losses.
Fluctuations in our financial condition and results of operations are driven by a combination of factors, including: • the volume of crude oil, oil products and
natural gas we produce and sell;
• changes in international prices of crude oil and oil products, which are denominated in U.S. dollars;
• related changes in domestic prices of crude oil and oil products, which are denominated in Reais;
• Brazilian political and economic conditions;
• fluctuations in the Real/U.S. dollar exchange rate; and
• the amount of taxes and duties that we are required to pay with respect to our operations, by virtue of our status as a Brazilian company and our involvement in the oil and gas industry.

Page: 6
RESULTS OF OPERATIONS FOR THE NINE-MONTH PERIOD ENDED SEPTEMBER 30, 2004 COMPARED TO THE NINE-MONTH PERIOD ENDED SEPTEMBER 30, 2003 The comparison between our results of operations for the nine-month period ended September 30, 2004 and the nine-month period ended September 30, 2003 has been significantly impacted by the 5.1% decrease in the average Real/U.S. dollar exchange rate in the nine-month period ended September 30, 2004 as compared to the average Real/U.S. dollar exchange rate in the nine-month period ended September 30, 2003. For ease we refer to this change in average exchange rate as the “5.1% increase in the average value of the Real against the U.S. dollar in the nine-month period ended September 30, 2004, as compared to the nine-month period ended September 30, 2003.” We acquired PEPSA and PELSA in May 2003. The results of operations for the nine-month period ended September 30, 2003 only include PEPSA and PELSA’s results from June to September of 2003.
Revenues
Net operating revenues increased 18.1% to U.S.$ 26,751 million for the nine-month period ended September 30, 2004, as compared to U.S.$ 22,648 million for the nine-month period ended September 30, 2003. This increase was primarily attributable to an increase in the prices and in sales volume in both the domestic market and outside Brazil (international sales), which includes sales conducted by PEPSA and PELSA, and to the 5.1% increase in the average value of the Real against the U.S. dollar in the nine-month period ended September 30, 2004, as compared to the nine-month period ended September 30, 2003. Consolidated sales of products and services increased 19.0% to U.S.$ 37,232 million for the nine-month period ended September 30, 2004, as compared to U.S.$ 31,300 million for the nine-month period ended September 30, 2003, primarily due to the increases mentioned above.
Included in sales of products and services are the following amounts which we collected on behalf of the federal or state governments: • Value-added and other taxes on sales of
products and services and social security contributions. These taxes increased 20.9% to U.S.$ 8,533 million for the nine-month period ended September 30, 2004, as compared to U.S.$ 7,059 million for the nine-month period ended September 30, 2003, primarily due to the increase in prices and sales volume of products and services; and
• CIDE, the per-transaction tax due to the
Brazilian government, which increased 22.3% to U.S.$ 1,948 million for the nine-month period ended September 30, 2004, as compared to U.S.$ 1,593 million for the nine-month period ended September 30, 2003. This increase was primarily attributable to the 5.1% increase in the average value of the Real against the U.S. dollar in the nine-month period ended September 30, 2004, as compared to the nine-month period ended September 30, 2003, and to the increase in sales volume of products and services.
Cost of sales Cost of sales for the nine-month period ended September 30, 2004 increased 27.0% to U.S.$ 14,046 million, as compared to U.S.$ 11,058 million for the nine-month period ended September 30, 2003. This increase was principally a result of: • a U.S.$ 1,002 million increase in the cost
of imports due to increases in volume and prices;
• a U.S.$ 516 million increase in costs
associated with a 6.1% increase in our domestic sales volumes;
• a U.S.$ 437 million increase in costs of
certain thermoelectric plants, whose financial statements we have been consolidating line by line since December 2003, as a result of the adoption of FIN 46;

Page: 7
• a U.S.$ 354 million increase in costs associated with the consolidation of PEPSA and PELSA;
• a U.S.$ 184 million increase in cost of
sales as expressed in U.S. dollars as a result of the 5.1% increase in the average value of the Real against the U.S. dollar in the nine-month period ended September 30, 2004, as compared to the nine-month period ended September 30, 2003;
• a U.S.$ 168 million increase in taxes and
charges imposed by the Brazilian government totaling U.S.$ 2,369 million for the nine-month period ended September 30, 2004, as compared to U.S.$ 2,201 million for the nine-month period ended September 30, 2003. These taxes and charges included the special participation charge (an extraordinary charge payable in the event of high production and/or profitability from our fields) that increased to U.S.$ 1,216 million for the nine-month period ended September 30, 2004, as compared to U.S.$ 1,171 million for the nine-month period ended September 30, 2003, as a result of higher international oil prices; and
• a net increase of U.S.$ 120 million
attributable to: (1) maintenance and technical services for well restoration, drilling rigs and special ships (these prices are tied to international oil prices); (2) additional maintenance materials and services at ocean terminals, transport lines and installations associated with our health, safety and environmental program; and (3) higher personnel expenses primarily related to: overtime payments as set forth in our collective bargaining agreement; an increase in our workforce; and a revision in the actuarial calculations relating to future health care and pension benefits.
Depreciation, depletion and amortization We calculate depreciation, depletion and amortization of exploration and production assets on the basis of the units of production method. Depreciation, depletion and amortization expenses increased 37.2% to
U.S.$ 1,814 million for the nine-month period ended September 30, 2004, as compared to U.S.$ 1,322 million for the nine-month period ended September 30, 2003. This increase was primarily attributable to the following: • the 5.1% increase in the average value
of the Real against the U.S. dollar in the nine-month period ended September 30, 2004, as compared to the nine-month period ended September 30, 2003;
• an increase of approximately U.S.$ 241
million resulting from higher depreciation principally associated with the Dourado, Roncador, Marlim Sul and Jubarte Fields as a result of increased property, plant and equipment (PP&E) expenditures; and
• an increase of approximately U.S.$ 156
million resulting from the consolidation of PEPSA and PELSA.
Exploration, including exploratory dry holes Exploration costs, including exploratory dry holes increased 40.5% to U.S.$ 437 million for the nine-month period ended September 30, 2004, as compared to U.S.$ 311 million for nine-month period ended September 30, 2003. This increase was primarily attributable to the following: • the 5.1% increase in the average value of
the Real against the U.S. dollar in the nine-month period ended September 30, 2004, as compared to the nine-month period ended September 30, 2003;
• an increase of U.S.$ 72 million in dry
holes expenses in Angola associated with the write-off of the signature bonuses; and
• the increase of approximately U.S.$ 29
million in exploration costs, including exploratory dry holes in connection with the consolidation of PEPSA and PELSA.

Page: 8
Selling, general and administrative expenses Selling, general and administrative expenses increased 39.9 % to U.S.$ 1,989 million for the nine-month period ended September 30, 2004, as compared to U.S.$ 1,422 million for the nine-month period ended September 30, 2003. Selling expenses increased 53.1% to U.S.$ 1,095 million for the nine-month period ended September 30, 2004, as compared to U.S.$ 715 million for the nine-month period ended September 30, 2003. This increase was primarily attributable to the following: • the 5.1% increase in the average value
of the Real against the U.S. dollar in the nine-month period ended September 30, 2004, as compared to the nine-month period ended September 30, 2003;
• an increase of U.S.$ 235 million in
expenses associated with the transportation costs of oil products. A portion of these expenses were previously classified as “cost of sales” in 2003;
• an increase of approximately U.S.$ 33
million in selling expenses resulting from the consolidation of PEPSA and PELSA; and
• an increase of approximately U.S.$ 31
million in selling expenses resulting from the charge for doubtful accounts.
General and administrative expenses increased 26.4% to U.S.$ 894 million for the nine-month period ended September 30, 2004, as compared to U.S.$ 707 million for the nine-month period ended September 30, 2003. This increase was primarily attributable to the following: • the 5.1% increase in the average value
of the Real against the U.S. dollar in the nine-month period ended September 30,
2004, as compared to the nine-month period ended September 30, 2003;
• an increase of approximately U.S.$ 60
million in expenses related to technical consulting services in connection with our increased outsourcing of selected non-core general activities;
• an increase of approximately U.S.$ 45
million resulting from the consolidation of PEPSA and PELSA; and
• an increase of approximately U.S.$ 43
million in employee expenses due to the increase in our workforce and salaries; and an increase in the actuarial calculations relating to future health care and pension benefits.
Research and development expenses Research and development expenses increased 31.4% to U.S.$ 180 million for the nine-month period ended September 30, 2004, as compared to U.S.$ 137 million for nine-month period ended September 30, 2003. This increase was primarily related to our additional investments in programs for environmental safety, deepwater and refining technologies of approximately U.S.$ 36 million and the 5.1% increase in the average value of the Real against the U.S. dollar in the nine-month period ended September 30, 2004, as compared to the nine-month period ended September 30, 2003. Equity in results of non-consolidated companies Equity in results of non-consolidated companies increased to a gain of U.S.$ 141 million for the nine-month period ended September 30, 2004, as compared to a gain of U.S.$ 103 million for the nine-month period ended September 30, 2003. During 2004 we recognized a gain of U.S.$ 21 million resulting from the full nine months consolidation of PEPSA and PELSA.

Page: 9
Financial income We derive financial income from several sources, including interest on cash and cash equivalents. The majority of our cash equivalents are short-term Brazilian government securities, including securities indexed to the U.S. dollar. We also hold U.S. dollar deposits. Financial income increased to U.S.$ 545 million for the nine-month period ended September 30, 2004 as compared to U.S.$ 493 million for the nine-month period ended September 30, 2003. This increase was primarily attributable to an increase in financial interest income from short-term investments, which amounted U.S.$ 274 million for the nine-month period ended September 30, 2004, as compared to U.S.$ 199 million for the nine-month period ended September 30, 2003, primarily due to the effect of the 1.1% appreciation of the Real against the U.S. dollar in the nine-month period ended September 30, 2004 as compared to the 17.3% appreciation of the Real against the U.S. dollar in the nine-month period ended September 30, 2003. A breakdown of financial income and expenses is shown in Note 8 in our unaudited consolidated financial statements as of September 30, 2004. Financial expense Financial expense increased 55.9% to U.S.$ 1,430 million for the nine-month period ended September 30, 2004, as compared to U.S.$ 917 million for the nine-month period ended September 30, 2003. This increase was primarily attributable to an increase in our debt and an increase of approximately U.S.$ 248 million in financial expenses resulting from PEPSA’s hedge operations; and a loss of U.S.$ 113 million on repurchase of our own securities. Monetary and exchange variation on monetary assets and liabilities, net Monetary and exchange variation on monetary assets and liabilities, net generated a loss of U.S.$ 39 million for the nine-month period ended September 30, 2004, as compared to a gain of U.S.$ 541 million for the nine-month period ended September 30, 2003. The decrease in monetary and
exchange variation on monetary assets and liabilities, net is primarily attributable to the effect of a 1.1% appreciation of the Real against the U.S. dollar during the nine-month period ended September 30, 2004, as compared to a 17.3% appreciation of the Real against the U.S. dollar during the nine-month period ended September 30, 2003. Employee benefit expense Employee benefit expense consists of financial costs associated with expected pension and health care costs. Our employee benefit expense increased 19.7% to U.S.$ 468 million for the nine-month period ended September 30, 2004, as compared to U.S.$ 391 million for the nine-month period ended September 30, 2003. This rise in costs was primarily attributable to the 5.1% increase in the average value of the Real against the U.S. dollar in the nine-month period ended September 30, 2004, as compared to the nine-month period ended September 30, 2003, and an increase of U.S.$ 55 million from the annual actuarial calculation of our pension and health care plan liability. Other taxes Other taxes, consisting of miscellaneous value-added, transaction and sales taxes, increased 54.0% to U.S.$ 345 million for the nine-month period ended September 30, 2004, as compared to U.S.$ 224 million for nine-month period ended September 30, 2003. This increase was primarily attributable to the following: • the 5.1% increase in the average value of
the Real against the U.S. dollar in the nine-month period ended September 30, 2004, as compared to the nine-month period ended September 30, 2003;
• an increase of U.S.$ 58 million in the
PASEP/COFINS taxes on financial income, due to an increase in the COFINS tax rate from 3.0% to 7.6% beginning February 1, 2004; and
• an increase of U.S.$ 18 million in the
CPMF, a tax payable in connection with certain financial transactions.
Page: 10
Other expenses, net Other expenses, net are primarily composed of gains and losses recorded on sales of fixed assets, general advertising and marketing expenses and certain other non-recurring charges. Other expenses, net for the nine-month period ended September 30, 2004 decreased to an expense of U.S.$ 501 million, as compared to an expense of U.S.$ 756 million for the nine-month period ended September 30, 2003. The most significant charges for the nine-month period ended September 30, 2004 were: • a U.S.$ 150 million expense for general
advertising and marketing expenses unrelated to direct revenues;
• a U.S.$ 61 million expense for
unscheduled stoppages of plant and equipment;
• a U.S.$ 57 million expense for legal
liability and contingencies related to pending lawsuits; and
• a U.S.$ 51 million expense related to
ship or pay contracts. The most significant charges for the nine-month period ended September 30, 2003 were: • a U.S.$ 205 million provision for losses
related to our investments in certain thermoelectric power plants as a result of our contractual obligations with certain power plants to cover losses when demand for power and electricity prices are low;
• a U.S.$ 153 million expense for
unscheduled stoppages of plant and equipment;
• a U.S.$114 million expense for a lower of cost or market adjustment with respect to turbines, which we originally expected to use in connection with our thermoelectric projects, but which we no longer intend to use for such projects; and
• a U.S.$ 75 million expense for general
advertising and marketing expenses unrelated to direct revenues.
Income tax (expense) benefit Income before income taxes, minority interest and accounting changes decreased to U.S.$ 6,188 million for the nine-month period ended September 30, 2004, as compared to U.S.$ 7,220 million for the nine-month period ended September 30, 2003. As a result, we recorded an income tax expense of U.S.$ 1,604 million for the nine-month period ended September 30, 2004, as compared to an expense of U.S.$ 2,014 million for the nine-month period ended September 30, 2003. The reconciliation between the tax calculated based upon statutory tax rates to income tax expense and effective rates is shown in Note 4 to our unaudited consolidated financial statements as of September 30, 2004. Cumulative effect of change in accounting principle As of January 1, 2003, we generated a gain of U.S.$ 697 million (net of U.S.$ 359 million of taxes) resulting from the adoption of SFAS No. 143 – Accounting for Asset Retirement Obligations. The adjustment was due to the difference in the method of accruing end of life asset retirement obligations under SFAS 143, as compared with the method required by SFAS 19 – Financial Accounting and Reporting by Oil and Gas Producing Companies.
Page: 11
THE PETROLEUM AND ALCOHOL ACCOUNT
The ANP/STN Integrated Audit Committee submitted, on June 23, 2004, its final report certifying and approving the balance of the Petroleum and Alcohol Accounts for the period from July 1, 1998 to December 31, 2001, together with monetary restatement through present date. The conclusion of this audit process for the Petroleum and Alcohol account and the parties concurrence as to final amount establishes the basis for concluding the settlement process between the Federal Government and us. We and the Federal Government reached an agreement whereby the Federal Government issued National Treasury Bonds - H (NTN-H) into a federal depositary on our behalf to support the balance of the Petroleum and Alcohol account. As of June 30, 2004, there were 138,791 National Treasury Notes – series H (NTN-H), in the amount of US$ 56 million, at which time the balance of the Petroleum and Alcohol account was US$ 241 million. Upon maturity of the NTNs-H, the Federal Government made US$ 3 available to us and the remaining US$ 53 million was deposited in an account in our name, however, such amount is restricted from use by order of STN. The legal, valid, and binding nature of the account
is not affected by any difference between the balance of the account and the value of the outstanding bonds. As defined by Provisional Measure No. 123 dated June 26, 2003, made into Law No. 10.742 dated October 6, 2003, the settlement of accounts should have been completed by June 30, 2004. We have been in contact with the STN with a view to resolving the differences in order to resolve remaining issues between the parties in order to conclude the settlement process as established by Provisional Measure No. 2.181-45, of August 24, 2001. The remaining balance of the Petroleum and Alcohol Accounts may be paid as follows: (1) National Treasury Bonds of the same amount as the final balance determined as a result of the process for the matching of accounts; (2) settlement of the balance of Petroleum and Alcohol Accounts, on the date of the matching of accounts with any other amounts that might be owed by us to the Federal Government, including taxes; or (3) a combination of (1) and (2).
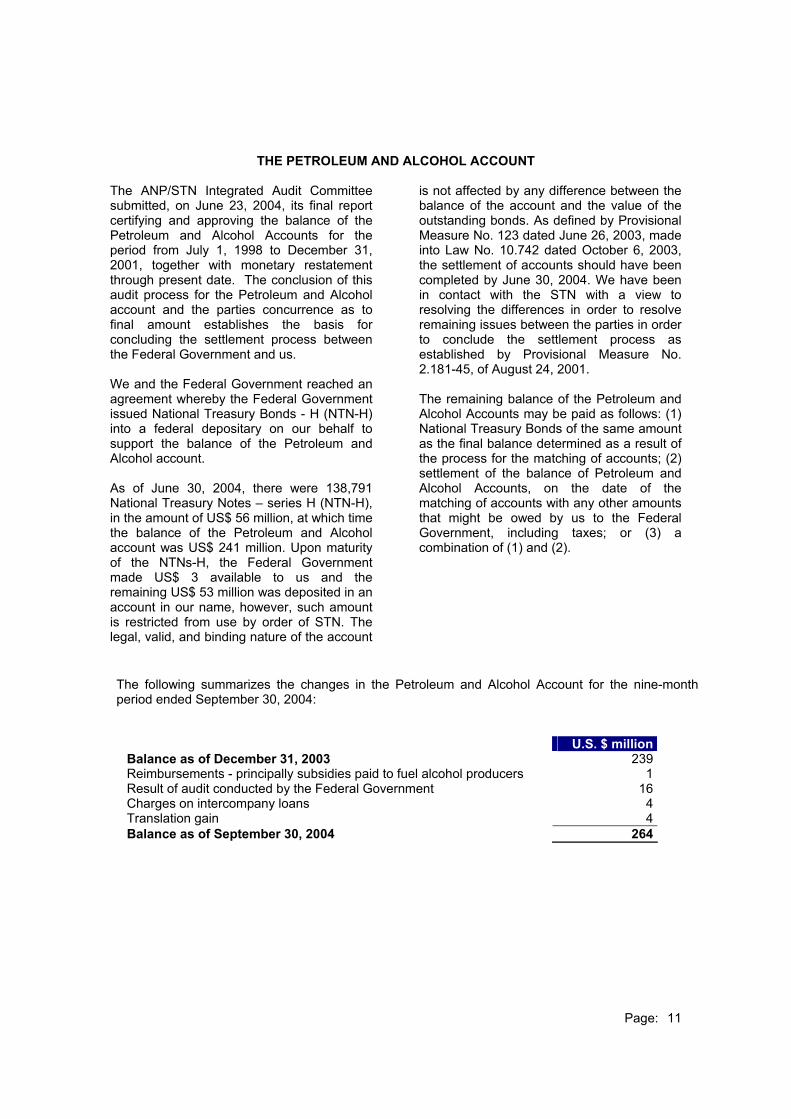
The following summarizes the changes in the Petroleum and Alcohol Account for the nine-month period ended September 30, 2004:
U.S. $ million Balance as of December 31, 2003 239 Reimbursements - principally subsidies paid to fuel alcohol producers 1 Result of audit conducted by the Federal Government 16 Charges on intercompany loans 4 Translation gain 4 Balance as of September 30, 2004 264

Page: 12
BUSINESS SEGMENTS .
NET INCOME BY BUSINESS SEGMENT
U.S. $ million
For the nine-month period
ended September 30,
2004
2003
Exploration and Production 4,402 4,715 Supply (2) 648 1,346 Gas and Energy (176 ) (214 ) International (1) (2) 142 159 Distribution 102 87 Corporate (536 ) (228 ) Eliminations (99 ) (200 ) Net income 4,483 5,665
(1) Since June 1, 2003, the international business segment includes the Argentine operations of PEPSA and PELSA (both
acquired in May 2003). (2) Net operating revenues and the cost of sales relative to the periods prior to 3Q-2004 were reclassified between the
International segment and the Supply segment in relation to offshore operations that were being allocated to the International segment. There was no significant impact on the results reported for these segments.
Exploration and Production Our exploration and production segment includes our exploration, development and production activities in Brazil, as well as sales of crude oil in the domestic and foreign markets and transfers of natural gas to our Gas and Energy segment. Consolidated net income for our exploration and production segment decreased 6.6% to U.S.$ 4,402 million for the nine-month period ended September 30, 2004, as compared to U.S.$ 4,715 million for the nine-month period ended September 30, 2003. This decrease was primarily attributable to: • a U.S.$ 907 million increase in cost of sales as a result of an increase in our production costs, despite the 4.0% decrease in oil and NGL production; • a U.S.$ 245 million increase in depreciation, depletion and amortization expenses, mainly because of an increase of approximately U.S.$ 241 million resulting from higher depreciation associated with the Dourado, Roncador, Marlim Sul and Jubarte Fields due to PP&E addition and because of the 5.1% increase in the average value of the Real against the U.S. dollar in the nine-month period ended September 30, 2004, as
compared to the nine-month period ended September 30, 2003; and • the cumulative effect of a change in accounting principles relating to future liabilities for site restoration costs, which led to an increase in our net income of U.S.$ 697 million, net of taxes, in the nine-month period ended September 30, 2003. These effects were partially offset by a U.S.$ 2,042 million increase in net operating revenues, primarily related to the positive effects of higher international index oil prices on the sales/transfer prices of domestic oil and the 6.9% increase in natural gas production, despite the 4.0% decrease in oil and NGL production and despite the lower price increases of heavy crude in the international market compared to lighter crude. The spread between the average price of domestic oil sold/transferred and the average Brent price rose from U.S.$ 1.56/bbl in the nine-month period ended September 30, 2003, to U.S.$ 3.34/bbl in the nine-month period ended September 30, 2004. Supply Our supply segment includes refining, logistics, transportation and the purchase of crude oil, as well as the purchase and sale of oil products and fuel alcohol. Additionally, this

Page: 13
segment includes the petrochemical and fertilizers division, which includes investments in domestic petrochemical companies and our two domestic fertilizer plants. Our supply segment registered net income of U.S.$ 648 million for the nine-month period ended September 30, 2004, a decrease of 51.9% as compared to net income of U.S.$ 1,346 million for the nine-month period ended September 30, 2003. This decrease was primarily a result of: • an increase of U.S.$ 3,202 million in the cost of sales, mainly attributable to: (1) an increase in the cost to acquire oil and oil products because of higher international prices, despite the increased spread between heavy and light crude and decreased volumes of oil product imports; (2) a lower share of domestic oil in processed throughput (76.0% in the nine-month period ended September 30, 2004 and 81.0% in the nine-month period ended September 30, 2003); (3) increased freight costs; (4) higher unit refining costs; (5) increased depreciation costs due to investments in refining facilities; and (6) an increase in the volume of oil products sold in the domestic and foreign markets of 5% and 8%, respectively; • an increase of U.S.$ 149 million in sales, general and administrative expenses, primarily related to an increase in sales expenses arising from heavier sales volumes sold and additional freight costs; and • financial income, net in the amount of U.S.$ 1 million in the nine-month period ended September 30, 2004, as compared to U.S.$ 149 million in the nine-month period ended September 30, 2003, resulting mainly from the effect of the 1.1% appreciation of the Real against the U.S. dollar in the nine-month period ended September 30, 2004 as compared to the 17.3% appreciation of the Real against the U.S. dollar in the nine-month period ended September 30, 2003. These effects were partially offset by an increase of U.S.$ 2,442 million in net operating revenues, primarily related to the increased volume of sales in the domestic and foreign markets, the increase in the average realization value of oil products sold in the domestic market and the 5.1% increase in the average value of the Real against the U.S. dollar in the nine-month period ended
September 30, 2004, as compared to the nine-month period ended September 30, 2003. Gas and Energy Our gas and energy segment consists principally of the purchase and sale and transportation of natural gas produced in or imported into Brazil. Additionally, this segment includes our domestic electricity production, purchase and sale activities as well as investments in domestic natural gas transportation companies, state owned natural gas distributors and thermoelectric companies. Consolidated net loss for our gas and energy segment decreased 17.8% to U.S.$ 176 million for the nine-month period ended September 30, 2004, as compared to a net loss of U.S.$ 214 million for the nine-month period ended September 30, 2003. This resulting net loss was primarily a result of: • a U.S.$ 418 million increase in net operating revenues primarily due to: (1) the 19.2% increase in the volume of natural gas sold, as a result of the substitution of natural gas for fuel oil by industries and for gasoline for vehicle use, plus increased supply to thermoelectric plants; (2) an increase in revenues as a result of the start of operations of some thermoelectric power plants at the end of 2003; (3) the effects of the 5.1% increase in the average value of the Real against the U.S. dollar in the nine-month period ended September 30, 2004, as compared to the nine-month period ended September 30, 2003 on sales of natural gas and; (4) the adoption of FIN 46, resulting in the consolidation of six thermoelectric power plants for which we recorded losses in equity in 2003. These increases were partially offset by a reduction in the average realization value of natural gas; Net operating revenues for 2004 vs 2003 were positively influenced by: • a U.S.$ 205 million provision for nonreimbursable contractual contingency payments, related to our investments in thermoelectric power plants, taken in the nine-month period ended September 30, 2003; and

Page: 14
• a U.S.$ 179 million decrease in minority interest losses, primarily related to the net income of Transportadora Brasileira Gasoduto Bolivia-Brasil S.A. – TBG. These positive effects on consolidated net loss were partially offset by the following items: • a U.S.$ 628 million increase in cost of sales primarily due to: (1) a 19.2% increase in the volume of natural gas sold; (2) the increase in the share of Bolivian gas in our natural gas sales, from 38.0% in the nine-month period ended September 30, 2003 to 46.3% in the nine-month period ended September 30, 2004; (3) the effects of the 5.1% increase in the average value of the Real against the U.S. dollar in the nine-month period ended September 30, 2004, as compared to the nine-month period ended September 30, 2003; (4) the start of operations of some thermoelectric power plants at the end of 2003; and (5) the adoption of FIN 46, resulting in the consolidation of six thermoelectric power plants for which we recorded losses in equity in 2003; • a loss of U.S.$ 63 million because some thermoelectric power plants remained unexpectedly idle; and • a U.S.$ 24 million increase in depreciation, depletion and amortization, because of the adoption of FIN 46, resulting in the consolidation of six thermoelectric power plants for which we recorded losses in equity in 2003. International The international segment represents our international activities conducted in 13 countries, which include Exploration and Production, Supply, Distribution and Gas and Energy. Consolidated net income for our international segment was U.S.$ 142 million for the nine-month period ended September 30, 2004, as compared to U.S.$ 159 million for the nine-month period ended September 30, 2003. The decrease in net income was primarily attributable to the following effects, most of them associated with the consolidation of PEPSA and PELSA:
• an increase of U.S.$ 1,396 million of net operating revenues, which primarily reflects the effects of increased international oil prices, increased gas sales from Bolivia, and increased sales volumes by PEPSA, primarily in Argentina, Bolivia and Colombia; • an increase of U.S.$ 742 million in cost of sales; • financial expenses, net, of U.S.$ 391 million in the nine-month period ended September 30, 2004 as compared to U.S.$ 45 million for the nine-month period ended September 30, 2003, primarily as a result of the Argentine Peso/U.S. dollar exchange rate as well as from losses associated with PEPSA’s hedge operations that totaled U.S.$ 248 million; • an increase of U.S.$ 141 million in depreciation, depletion and amortization; • an increase of U.S.$ 130 million in exploration, including exploratory dry holes and impairment, which represents a write-off of the signing bonus for Block 34 in Angola relating to identified dry wells (U.S.$ 72 million) and the write-off of exploration expenses in Ecuador and the United States (U.S.$ 45 million); and • an increase of U.S.$ 91 million in selling, general and administrative expenses. Distribution Our distribution segment represents the oil product and fuel alcohol distribution activities conducted by our majority owned subsidiary, Petrobras Distribuidora S.A. - BR in Brazil. In accordance with our strategic objectives to increase market share in the LPG distribution segment and consolidate the automotive fuels distribution market in determined regions of Brazil, our distribution business now includes the operations of the company Sophia do Brasil S.A. (formerly Agip do Brasil S.A), which was acquired in August 2004. Consolidated net income for our distribution segment increased 17.2% to U.S.$ 102 million for the nine-month period ended September 30, 2004, as compared to U.S.$ 87 million for the nine-month period ended September 30, 2003, primarily attributable to the U.S.$ 988 million increase in net operating revenues, mainly reflecting
Page: 15
the 8.0% increase in sales volume, the consolidation of Sophia do Brasil S.A. as of August 2004 and effects of the 5.1% increase in the average value of the Real against the U.S. dollar in the nine-month period ended September 30, 2004, as compared to the nine-month period ended September 30, 2003. These effects were partially offset by the following items: • an increase of U.S.$ 848 million in the cost of sales, mainly attributable to the 8.0% increase in sales volume and the 5.1% increase in the average value of the real against the U.S. dollar in the nine-month period ended September 30, 2004, as compared to the nine-month period ended September 30, 2003; and • an increase of U.S.$ 82 million in selling, general and administrative expenses, mainly due to an increase of the provision for doubtful accounts, increased expenses for marketing and distribution of products and to the effects of the 5.1% increase in the average value of the Real against the U.S. dollar in the nine-month period ended September 30, 2004, as compared to the nine-month period ended September 30, 2003. Our participation in the Brazilian fuel distribution market through the nine-month period ended September 30, 2004 represented 35.5% of all sales, including Sophia do Brasil S.A., which sales were 2.9% of all sales, as opposed to 31.5% in the nine-month period ended September 30, 2003. Corporate Our corporate segment includes those activities not attributable to other segments, including corporate financial management, overhead related to central administration and other expenses, including actuarial expenses related to our pension and health care plans. Consolidated net loss for the units that make up our corporate segment increased to U.S.$ 536 million during the nine-month period ended September 30, 2004, as compared to a net loss of U.S.$ 228 million during the nine-month period ended
September 30, 2003. This increase in net loss was primarily attributable to: • financial expenses, net, of U.S.$ 217 million in the nine-month period ended September 30, 2004 as compared to financial income, net, of U.S.$ 380 million in the nine-month period ended September 30, 2003, resulting mainly from the effect of the 1.1% appreciation of the Real against the U.S. dollar in the nine-month period ended September 30, 2004 as compared to the 17.3% appreciation of the Real against the U.S. dollar in the nine-month period ended September 30, 2003; • an increase of U.S.$ 76 million in employee benefit expense, primarily attributable to the 5.1% increase in the average value of the Real against the U.S. dollar in the nine-month period ended September 30, 2004, as compared to the nine-month period ended September 30, 2003, and to the increase of U.S.$ 55 million from the annual actuarial calculation of our pension and health care plan liability; • an increase of U.S.$ 79 million in other taxes, mainly attributable to the increase in the PASEP/COFINS taxes on financial income, primarily as a result of the change in the COFINS tax rate, from 3.0% to 7.6%, beginning February 1, 2004, and the 5.1% increase in the average value of the Real against the U.S. dollar in the nine-month period ended September 30, 2004, as compared to the nine-month period ended September 30, 2003; and • an increase of U.S.$ 50 million in selling, general and administrative expenses, mainly as a result of the increase in expenses related to personnel, technical consulting services in connection with our increased outsourcing of selected non-core general and administrative activities and of the 5.1% increase in the average value of the Real against the U.S. dollar in the nine-month period ended September 30, 2004, as compared to the nine-month period ended September 30, 2003. These effects were partially offset by a U.S.$ 511 million increase in gains associated with income tax benefits, principally deferred tax.

Page: 16
LIQUIDITY AND CAPITAL RESOURCES
Overview Our principal uses of funds are for capital expenditures, dividend payments and repayment of debt. We have historically met these requirements with internally generated funds, short-term debt, long-term debt, project financings and sale and lease back agreements. We believe these sources of funds, together with our strong cash and cash equivalents on hand, will continue to allow us to meet our currently anticipated capital requirements. Financing Strategy The objective of our financing strategy is to help us achieve the targets set forth in our new Strategic Plan released on May14, 2004, which provides for capital expenditures of U.S.$ 53.6 billion from 2004-2010. We also aim to increase the average life of our debt portfolio and reduce our cost of capital through a variety of medium and long-term financing arrangements, including supplier financing, project financing, bank financing, securitizations and the issuances of debt and equity securities. Government Regulation The Ministry of Planning, Budget and Management controls the total amount of medium and long-term debt that we and our Brazilian subsidiaries are allowed to incur through the annual budget approval process (Plano de Dispêndio Global, or PDG). Before issuing medium and long-term debt, we and our Brazilian subsidiaries must also obtain the approval of the National Treasury shortly before issuance. All of our foreign currency denominated debt, as well as the foreign currency denominated debt of our Brazilian subsidiaries requires registration with the Central Bank. The issuance of debt by our international subsidiaries, however, is not subject to registration with the Central Bank or approval by the National Treasury. In addition, all issuances of medium and long-term notes and debentures require the approval of our board of directors. Borrowings that exceed the approved budget amount for any year
also require approval from the Brazilian Senate. Sources of Funds Our Cash Flow At September 30, 2004, we had cash and cash equivalents of U.S.$ 7,080 million as compared to U.S.$ 7,124 million at September 30, 2003. Operating activities provided net cash flows of U.S.$ 5,032 million for the nine-month period ended September 30, 2004, as compared to U.S.$ 6,241 million for the nine-month period ended September 30, 2003. This decrease was due primarily to the increase in inventories through the imports of crude oil to cover the lower production and higher demand in the domestic market in the nine-month period ended September 30, 2004. Net cash used in investing activities increased to U.S.$ 5,326 million for the nine-month period ended September 30, 2004, as compared to U.S.$ 4,120 million for the nine-month period ended September 30, 2003. This increase was due primarily to our investments in capital expenditures associated with our operating activities and to the acquisition of Sophia do Brasil S.A.. Financing activities used net cash flows of U.S.$ 2,256 million during the nine-month period ended September 30, 2004, as compared to U.S.$ 921 million in net cash provided during the nine-month period ended September 30, 2003. This change in the balance of the cash flows was due primarily to higher dividend and short-term debt payments in the nine-month period ended September 30, 2004, and the decreased amount of Global Notes issued in the international capital markets during the nine-month period ended September 30, 2004 as compared to issuances during the same period in 2003.

Page: 17
Short-Term Debt Our outstanding short-term debt serves mainly to support our imports of crude oil and oil products, and is provided almost completely by international banks and under our commercial paper program. At September 30, 2004, our short-term debt (excluding current portions of long-term obligations) decreased to U.S.$ 409 million as compared to U.S.$ 1,329 million at December 31, 2003. The decreased use of short-term credit facilities was related to our decision to use cash to pay for a portion of our imports. Our short-term debt is denominated principally in U.S. dollars. Long-Term Debt Our total outstanding consolidated long-term debt consists primarily of the issuance of securities in the international capital markets and debentures in the domestic capital markets and amounts outstanding under facilities guaranteed by export credit agencies and multilateral agencies, as well as financing from the Banco Nacional de Desenvolvimento Econômico e Social (the Brazilian National Development Bank, or BNDES) and other financial institutions. Outstanding long-term debt, plus the current portion of our long-term debt, totaled U.S.$ 13,529 million at September 30, 2004, as compared to U.S.$ 13,033 million at December 31, 2003. The increase in our long-term debt was due primarily to the issuance, through our subsidiary Petrobras International Finance Company (PIFCo), of U.S.$ 600 million Global Notes for 98.638% of their face value, with annual coupon of 7.75% due 2014. The issuance reflects our efforts to continue to lengthen our debt profile.
Project Finance Since 1997, we have utilized project financings to provide capital for our large exploration and production and related projects, including some natural gas processing and transportation systems. All of these projects, and their related debt obligations, are on-balance sheet and accounted for under the line item “Project Financings”. Outstanding project financing, plus the current portion of our project financing,
totaled U.S.$ 5,743 million at September 30, 2004, as compared to U.S.$ 5,908 million at December 31, 2003. A financing structure that involves the special purpose company (SPC) Companhia Locadora de Equipamentos Petrolíferos – CLEP, formerly Langstrand Holdings S.A, has been formed as a conduit through which we will sell and subsequently lease back assets related to the production of oil in the Campos Basin. Major Pension funds, including PREVI, PETROS, VALIA, FUNCEF, FAPES and REAL GRANDEZA, are the primary investors in CLEP in equal portions. The project is expected to be operational for 10 years, after which we will have the right to acquire the SPC’s shares or the project’s assets. As of September 30, 2004, CLEP had raised U.S.$ 1,736 million, which together with previous capital of U.S.$ 63 million brought total capitalization to U.S.$1,799 million, which amount was fully transferred to us as advances to fund the intended sale of the assets. U.S.$ 1,700 million of the total amount raised was completed through the issuance of 8.0% Medium Term Notes due 2004. These notes were purchased by the exclusive offshore investment fund and are considered as repurchased securities.
Extinguished securities At September 30, 2004 and December 31, 2003, we had amounts invested abroad in an exclusive investment fund that held debt securities of some of our group companies in the amount of U.S.$ 2,112 million and U.S.$ 920 million, respectively. These securities are considered to be extinguished, and thus the related amounts, together with applicable interest have been removed from the presentation of marketable securities and long-term debt in the amount of U.S.$ 291 million and U.S.$ 207 million and project finance in the amount of U.S.$ 1,821 million and U.S.$ 713 million, at September 30, 2004 and December 31, 2003, respectively. Off Balance Sheet Arrangements At September 30, 2004, we had no off-balance sheet arrangements that have, or are reasonably likely to have, a material effect on our financial condition, revenues or
Page: 18
expenses, results of operations, liquidity, capital expenditures or capital resources. Uses of Funds Capital Expenditures In the pursuit of the goals outlined in our strategic plan we continue to prioritize capital expenditures for the development of crude oil and natural gas production projects through internal investments and through structured undertakings with partners. We invested a total of U.S.$ 4,765 million in the nine-month period ended September 30, 2004, a 15.8% increase from our investments in the nine-month period ended September 30, 2003. Our investments in the nine-month period ended September 30, 2004 were primarily directed towards increasing our production capabilities in the Campos Basin,
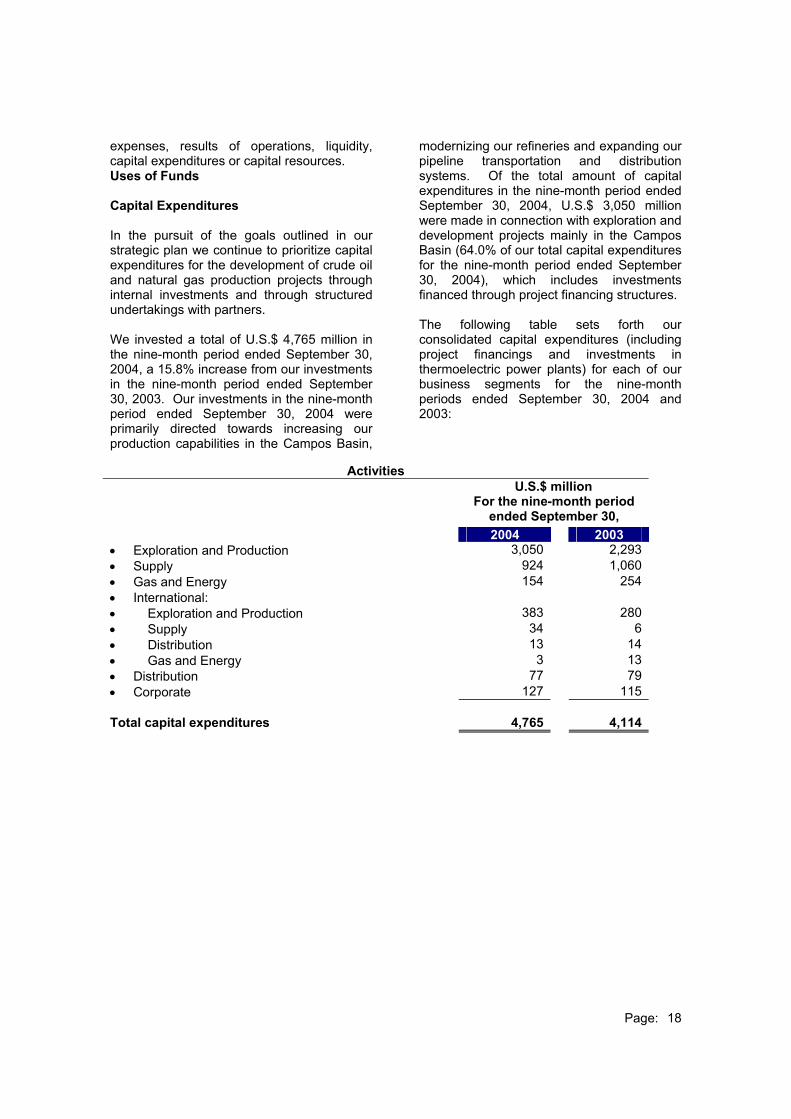
modernizing our refineries and expanding our pipeline transportation and distribution systems. Of the total amount of capital expenditures in the nine-month period ended September 30, 2004, U.S.$ 3,050 million were made in connection with exploration and development projects mainly in the Campos Basin (64.0% of our total capital expenditures for the nine-month period ended September 30, 2004), which includes investments financed through project financing structures. The following table sets forth our consolidated capital expenditures (including project financings and investments in thermoelectric power plants) for each of our business segments for the nine-month periods ended September 30, 2004 and 2003:
Activities U.S.$ million For the nine-month period
ended September 30,
2004 2003 • Exploration and Production 3,050 2,293 • Supply 924 1,060 • Gas and Energy 154 254 • International: • Exploration and Production 383 280 • Supply 34 6 • Distribution 13 14 • Gas and Energy 3 13 • Distribution 77 79 • Corporate 127 115 Total capital expenditures
4,765
4,114

Page: 19
Income Statement (in millions of U.S. dollars, except for share and per share data)
For the nine-month period ended September 30,
2Q-2004 3Q-2004 3Q-2003 2004 2003
11,961 14,095 11,314 Sales of products and services 37,232 31,300 Less:
(2,777 ) (3,149 ) (2,495 ) Value-added and other taxes on sales and services (8,533 ) (7,059 )
(589 ) (725 ) (601 ) CIDE (1,948 ) (1,593 )8,595 10,221 8,218 Net operating revenues 26.751 22,648
(4,358 ) (5,630 ) (4,086 ) Cost of sales (14,046 ) (11,058 )(630 ) (651 ) (564 ) Depreciation, depletion and amortization (1,814 ) (1,322 )(81 ) (233 ) (110 ) Exploration, including exploratory dry holes (437 ) (311 )
Impairment - (27 )(608 ) (810 ) (518 ) Selling, general and administrative expenses (1,989 ) (1,422 )(62 ) (66 ) (46 ) Research and development expenses (180 ) (137 )
(5,739 ) (7,390 ) (5,324 ) Total costs and expenses (18,466 ) (14,277 )
48 39 1 Equity in results of non-consolidated companies 141 103 299 100 280 Financial income 545 493
(428 ) (495 ) (361 ) Financial expense (1,430 ) (917 )
(294 ) 281 (118 )
Monetary and exchange variation on monetary assets and liabilities, net (39 ) 541
(152 ) (156 ) (129 ) Employee benefit expense (468 ) (391 )(169 ) (75 ) (78 ) Other taxes (345 ) (224 )(157 ) (241 ) (176 ) Other expenses, net (501 ) (756 )(853 ) (547 ) (581 ) (2,097 ) (1,151 )
2,003 2,284 2,313
Income before income taxes and minority interests and accounting change 6,188
7,220
Income tax expense: (618 ) (255 ) (741 ) Current (1,467 ) (2,253 )(158 ) (16 ) 371 Deferred (137 ) 239 (776 ) (271 ) (370 ) Total income tax expense (1,604 ) (2,014 )
80 (174 ) (46 ) Minority interest in results of consolidated subsidiaries (101 ) (238 )
1,307 1,839 1,897 Net income before accounting change effect 4,483 4,968
Cumulative effect of accounting change, net of
income tax - 697
1,307 1,839 1,897 Net income for the period 4,483 5,665 Weighted average number of shares outstanding
634,168,418 634,168,418 634,168,418 Common/ADS 634,168,418 634,168,418 462,369,507 462,369,507 462,369,507 Preferred/ADS 462,369,507 461,048,616
Basic and diluted earnings per share Common/ADS and Preferred/ADS
1.19
1.68
1.73 Before effect of change in accounting
principle 4.09 4.54
1.19 1.68 1.73 After effect of change in accounting principle 4.09 5.17

Page: 20
Selected Balance Sheet Data
(in millions of U.S. dollars, except for share data) As of
September 30, 2004
As of December 31, 2003
Assets Current assets Cash and cash equivalents 7,080 9,610 Accounts receivable, net 3,729 2,905 Inventories 4,512 2,947 Other current assets 2,780 2,438 Total current assets 18,101 17,900 Property, plant and equipment, net 33,759 30,805 Investments in non-consolidated companies and other investments 1,437 1,173 Other assets Petroleum and Alcohol Account – Receivable from Federal Government 264 239 Government securities 316 283 Goodwill on PEPSA and PELSA 183 183 Advances to suppliers 526 416 Prepaid Expenses 232 190 Others 2,443 2,423 Total other assets 3,964 3,734 Total assets 57,261 53,612 Liabilities and shareholders' equity Current liabilities Trade accounts payable 2,938 2,261 Short-term debt 409 1,329 Current portion of long-term debt 1,357 1,145 Current portion of project financings 1,017 842 Capital lease obligations 267 378 Other current liabilities 5,142 5,266 Total current liabilities 11,130 11,221
Long-term liabilities Long-term debt 12,172 11,888 Project financings 4,726 5,066 Employee benefits obligation - Pension 2,279 1,895 Employee benefits obligation - Health care 1,878 1,580 Capital lease obligations 1,135 1,242 Thermoelectric liabilities 1,107 1,142 Other liabilities 2,438 2,059 Total long-term liabilities 25,735 24,872
Minority interest 442 367
Shareholders' equity Shares authorized and issued: Preferred stock –2004 and 2003 - 462,369,507 shares 4,772 2,973 Common stock – 2004 and 2003 - 634,168,418 shares 6,929 4,289 Reserves and others 8,253 9,890 Total shareholders' equity 19,954 17,152
Total liabilities and shareholders’ equity 57,261 53,612

Page: 21
Statement of Cash Flows Data (in millions of U.S. dollars)
For the nine-month period
ended September 30, 2Q-2004 3Q-2004 3Q-2003 2004 2003
Cash flows from operating activities 1,307 1,839 1,897 Net income for the period 4,483 5,665
Adjustments to reconcile net income to net cash
provided by operating activities
559 674 599 Depreciation, depletion and amortization 1,839 1,33049 260 144 Loss on property, plant and equipment 420 289
346 (273 ) 93 Foreign exchange and monetary loss 204 (243 )
-
-
- Cumulative effect of accounting change, net of
income tax
- (697 )(24 ) 151 (387 ) Others 97 (104 )
Decrease (increase) in assets
(350 ) (315 ) 133 Accounts receivable, net (848 ) 55 (512 ) (469 ) (14 ) Inventories (1,455 ) (95 )(10 ) 33 199 Advances to suppliers (39 ) 598 (20 ) (63 ) (102 ) Recoverable taxes (272 ) (288 )
(100 ) 138 (216 ) Others (97 ) (207 ) Increase (decrease) in liabilities
61 310 176 Trade accounts payable 635 (218 )174 (135 ) 254 Taxes payable, other than income taxes (40 ) 31 (16 ) (217 ) (120 ) Income taxes (91 ) 104 26 (46 ) (227 ) Contingencies (89 ) (150 )
292 (178 ) 12 Other liabilities 285 171 1,782 1,709 2,441 Net cash provided by operating activities 5,032 6,241
Cash flows from investing activities
(1,632 ) (1,810 ) (1,582 ) Additions to property, plant and equipment (4,765 ) (4,114 )(41 ) (471 ) (2 ) Others (561 ) (6 )
(1,673 ) (2,281 ) (1,584 ) Net cash used in investing activities (5,326 ) (4,120 )
(743 ) 193 715 Cash flows from financing activities (2,256 ) 921
(634 ) (379 ) 1,572 Increase (decrease) in cash and cash equivalents (2,550 ) 3,042
(485 ) 474 (47 ) Effect of exchange rate changes on cash and cash 20 781
8,104 6,985 5,599 Cash and cash equivalents at beginning of period 9,610 3,3016,985 7,080 7,124 Cash and cash equivalents at the end of period 7,080 7,124

Page: 22
Income Statement by Segment
Nine-month period ended September 30, 2004
U.S.$ million
E&P SUPPLY
GAS &
ENERGYINTERN. DISTRIB. CORPOR. ELIMIN. TOTAL
STATEMENT OF INCOME
Net operating revenues to third parties 1,906 14,715 1,154 2,237 6,739 - 26,751Inter-segment net operating revenues 12,022 5,834 293 406 119 - (18,674 ) -
Net operating revenues 13,928 20,549 1,447 2,643 6,858 - (18,674 ) 26,751 Cost of sales (5,176 ) (18,470 ) (1,383) (1,349 ) (6,190 ) 18,522 (14,046 ) Depreciation, depletion and amortization (1,021 ) (344 ) (76) (319 ) (29 ) (25 ) - (1,814 ) Exploration, including exploratory dry holes
and impairment (292 ) - - (145 ) - - - (437 ) Selling, general and administrative
expenses (178 ) (680 ) (119) (229 ) (372 ) (411 ) - (1,989 ) Research and development expenses (85 ) (40 ) (5) (1 ) (3 ) (46 ) - (180 ) Cost and expenses (6,752 ) (19,534 ) (1,583) (2,043 ) (6,594 ) (482 ) 18,522 (18,466 ) Equity in results of non-consolidated
companies - 24 49 67 - 1 - 141Financial income (expenses), net (242 ) 1 (60) (391 ) (15 ) (217 ) - (924 )
Employee benefit expense - (2 ) - - (13 ) (453 ) - (468 ) Other taxes (6 ) (20 ) (20) (26 ) (38 ) (235 ) - (345 ) Other expenses, net (72 ) (54 ) (112) (44 ) (42 ) (177 ) - (501 ) Income (loss) before income taxes and
minority interest and accounting change 6,856 964 (279) 206 156 (1,563 ) (152 ) 6,188
Income tax benefits (expense) (2,449 ) (288 ) 107 (54 ) 1,027 53 (1,604 ) Minority interest (5 ) (28 ) (4) (64 ) - - - (101 ) Net income (loss) 4,402 648 (176) 142 102 (536 ) (99 ) 4,483

Page: 23
Income Statement by Segment
Nine-month period ended September 30, 2003
U.S.$ million
E&P SUPPLY
GAS &
ENERGYINTERN. DISTRIB. CORPOR. ELIMIN. TOTAL
STATEMENT OF INCOME
Net operating revenues to third parties 1,722 13,065 858 1,234 5,769 - - 22,648Inter-segment net operating revenues 10,164 5,042 171 13 101 - (15,491 ) -
Net operating revenues (*) 11,886 18,107 1,029 1,247 5,870 - (15,491 ) 22,648 Cost of sales (*) (4,269 ) (15,268 ) (755) (607 ) (5,342 ) - 15,183 (11,058 ) Depreciation, depletion and amortization (776 ) (280 ) (52) (178 ) (21 ) (15 ) - (1,322 ) Exploration, including exploratory dry holes
and impairment (323 )
-
- (15 )
-
-
- (338 )
Selling, general and administrative expenses
(103 ) (531 ) (58) (138 ) (290 ) (361 ) 59 (1,422 )
Research and development expenses (66 ) (30 ) (8) - - (33 ) - (137 ) Cost and expenses (5,537 ) (16,109 ) (873) (938 ) (5,653 ) (409 ) 15,242 (14,277 ) Equity in results of non-consolidated
companies -
18
54
32
-
(1 ) -
103Financial income (expenses), net (228 ) 149 (41) (45 ) (56 ) 380 (42 ) 117 Employee benefit expense - (1 ) - - (13 ) (377 ) - (391 ) Other taxes - (18 ) (3) (11 ) (36 ) (156 ) - (224 ) Other expenses, net (119 ) (106 ) (358) (16 ) 24 (181 ) - (756 ) Income (loss) before income taxes and
minority interest and accounting change 6,002 2,040 (192) 269 136 (744 ) (291 ) 7,220 Income tax benefits (expense) (1,984 ) (671 ) 161 (79 ) (48 ) 516 91 (2,014 ) Minority interest - (23 ) (183) (31 ) (1 ) - - (238 ) Income before effect of change in
accounting principle 4,018
1,346
(214 ) 159
87
(228 ) (200 ) 4,968
Cumulative effect of change in accounting
principle, net of taxes 697 - - - - - - 697 Net income (loss) 4,715 1,346 (214) 159 87 (228 ) (200 ) 5,665
(*) Net operating revenues and the cost of sales relative to the periods prior to 3Q-2004 were reclassified between the International segment and the Supply segment in relation to offshore operations that were being allocated to the International segment. There was no significant impact on the results reported for these segments.

Page: 24
Other Expenses, Net by Segment
Nine-month period ended September 30, 2004
U.S.$ million
E&P
SUPPLY
GAS &
ENERGYINTERN. DISTRIB.
CORPOR. ELIMIN. TOTAL
Institutional Relations and Culture Projects
(2 ) (20 ) (128 ) (150 )Unscheduled stoppages on installations and production equipment
(32 ) (29 ) (61 )
Contractual losses with transport services (Ship-or-Pay)
(51 ) (51 )
Thermoelectric power plants – idle capacity
(63 ) (63 )Losses resulted from Legal Proceedings (9 ) (6 ) (1 ) (4 ) (5 ) (25 )INSS Contingencies for joint liability (32 ) (32 )Others 1 (17 ) (48 ) 7 (18 ) (44 ) (119 ) (72 ) (54 ) (112 ) (44 ) (42 ) (177 ) (501 )
Nine-month period ended September 30, 2003
U.S.$ million
E&P SUPPLY
GAS &
ENERGYINTERN. DISTRIB.
CORPOR. ELIMIN. TOTAL
Losses on financial exposure -Thermoelectric power plants
(205 ) (205 )Institutional Relations and Culture Projects (2 ) (73 ) (75 )Unscheduled stoppages on installations and production equipment
(104 ) (49 ) (153 )
Losses resulted from Legal Proceedings (8 ) (33 ) (35 ) (76 )Adjustment of Market Value of Turbines for Thermoelectrics Plants
(114 ) (114 )
INSS Contingencies for joint liability (52 ) (2 ) (1 ) (55 )Dividends 9 9Other 45 (29 ) (39 ) (16 ) 24 (72 ) (87 ) (119 ) (106 ) (358 ) (16 ) 24 (181 ) (756 )

Page: 25
Selected Balance Sheet Data by Segment
Nine-month period ended September 30, 2004 U.S.$ million
E&P
SUPPLY GAS
& ENERGY
INTERN. DISTRIB.
CORPOR.
ELIMIN. TOTAL
Current assets 2,614 6,347 1,104 1,941 1,615 6,021 (1,541 ) 18,101Cash and cash equivalents 956 518 195 455 90 4,866 - 7,080Other current assets 1,658 5,829 909 1,486 1,525 1,155 (1,541 ) 11,021
Investments in non-consolidated companies and other investments 7 652 193 481 23 81 - 1,437
Property, plant and equipment, net 18,477 5,621 4,178 4,022 988 494 (21 ) 33,759
Non current assets 1,852 307 708 328 202 5,843 (5,276 ) 3,964Petroleum and Alcohol Account - - - - - 264 - 264 Government securities held-to-maturity - - - - - 316 - 316
Other assets 1,852 307 708 328 202 5,263 (5,276 ) 3,384
Total assets 22,950 12,927 6,183 6,772 2,828 12,439 (6,838 ) 57,261

Page: 26
Year ended December 31, 2003 U.S.$ million
E&P
SUPPLY GAS
& ENERGY
INTERN. DISTRIB. CORPOR.
ELIMIN. TOTAL
Current assets 2,057 4,871 528 1,738 1,208 9,466 (1,968) 17,900 Cash and cash equivalents 1,042 575 109 445 33 7,406 - 9,610 Other current assets 1,015 4,296 419 1,293 1,175 2,060 (1,968) 8,290
Investments in non-consolidated Companies and other investments 6 463 151 449 22 82 - 1,173
Property, plant and equipment, net 16,742 4,980 4,174 4,181 442 336 (50)
30,805
Non current assets 970 285 751 306 208 4,479 (3,265) 3,734 Petroleum and Alcohol Account - - - - - 239 - 239 Government securities held-to-maturity - - - - - 283 - 283 Other assets 970 285 751 306 208 3,957 (3,265) 3,212
Total assets 19,775 10,599 5,604 6,674 1,880 14,363 (5,283) 53,612

Page: 27
Selected Data for International Segment
Nine-month period ended September 30, 2004
U.S.$ million
INTERNATIONAL
E&P SUPPLY
GAS
&
ENERGY
DISTRIB. CORPOR.
ELIMIN. TOTAL
INTERNATIONAL
ASSETS 4,605 1,218 708 182 2,520 (2,461) 6,772
STATEMENT OF INCOME Net Operating Revenues 1,355 1,556 320 638 16 (1,242) 2,643 Net operating revenues to third parties 521 767 300 633 16 2,237 Inter-segment net operating revenues 834 789 20 5 (1,242) 406
Net income 128 120 53 (55 ) (89) (15) 142
U.S.$ million
INTERNATIONAL
E&P SUPPLY
GAS
&
ENERGY
DISTRIB. CORPOR.
ELIMIN. TOTAL
INTERNATIONAL
ASSETS (As of December 31, 2003) 4,401 1,161 568 150 2,384 (1,990) 6,674
STATEMENT OF INCOME (Nine-month period ended September 30, 2003) Net Operating Revenues 671 734 107 448 9 (722) 1,247 Net operating revenues to third parties 335 343 105 442 9 1,234 Inter-segment net operating revenues 336 391 2 6 (722) 13
Net income 160 34 29 7 (75) 4 159
Page: 28
This press release contains statements that constitute forward-looking statements within the meaning of Section 21E of the Securities Exchange Act of 1934, as amended. Such forward-looking statements are necessarily dependent on assumptions, data or methods that may be incorrect or imprecise and that may be incapable of being realized. Prospective investors are cautioned that any such forward looking statements are not guarantees of future performance and involve risks and uncertainties, and that actual results may differ materially from those in the forward-looking statements as a result of various factors. The Company does not undertake, and specifically disclaims, any obligation to update any forward-looking statements, which speak only as of the date made.
http: //www.petrobras.com.br/ri/english
Contacts: Petróleo Brasileiro S.A – PETROBRAS
Investor Relations Department Raul Adalberto de Campos– Executive Manager
E-mail: [email protected] Av. República do Chile, 65 - 4th floor
20031-912 – Rio de Janeiro, RJ (55-21) 2534-1510 / 2534-9947
This document may contain forecasts that merely reflect the expectations of the Company’s management. Such terms as “anticipate”, “believe”, “expect”, “forecast”, “intend”, “plan”, “project”, “seek”, “should”, along with similar or analogous expressions, are used to identify such forecasts. These predictions evidently involve risks and uncertainties, whether foreseen or not by the Company. Therefore, the future results of operations may differ from current expectations, and readers must not base their expectations exclusively on the information presented herein.