Embed Size (px)
Citation preview
ISSN: 0128-7720
P e r t a n i k a J o u r n a l o f
socialscience &Humanities
VOLUME 4 NO. 2 SEPT 19 9 6
A s c i e n t i f i c j o u r n a l p u b l i s h e d by U n i v e r s i t i P e r t a n i a n M a l a y s i a P r e s s
Pertanika Journal of Social Science and Humanities
■ About the JournalPertanika, the poineer journal of UPM, began publication in 1978. Since then, it has established itself as one of the leading multidisciplinary journals in the tropics. In 1992, a decision was made to streamline Pertanika into three journals to meet the need for specialised journals in areas of study aligned with the strengths of the university. These are (i) Pertanika Journal o f Tropical Agricultural Science, (ii) Pertanika Journal of Science and Technology and (iii) Pertanika Journal of Social Science and Humanities.
■ Aims and ScopePertanika Journal of Social Science and Humanities aims to develop as a flagship journal for the Social Sciences with a focus on emerging issues pertaining to the social and behavioural sciences as well as the humanities, particularly in the Asia Pacific region. It will be published twice a year in March and September.
The objective of the journal is to promote advancements in the fields of anthropology, business studies, communications, economics, education, extension studies, psychology, sociology and the humanities. Previously unpublished, original, theoritical or empirical papers, analytical reviews, book
EDITORIAL BOARD
Prof. Dr. Mohd. Ismail bin Sayyid Ahmad - Chief Editor Faculty o f Economics and Management
Assoc. Prof. Dr. Ahmed Zubaidi bin Baharomshah Faculty o f Economics and Management
Assoc. Prof. Dr. Shamsher b. Mohamed Ramadili Faculty o f Economics and Management
Assoc. Prof. Dr. Mohd Ghazali Mohayidin Faculty o f Economics and Management
Assoc. Prof. Dr. Abdul Halin Hamid Faculty o f Human Ecology
Assoc. Prof. Dr. Khor Geok Lin Faculty o f Human Ecology
Assoc. Prof. Dr. Hjh. Aminah bte Ahmad Centre for Extension and Continuing Education
Assoc. Prof. Dr. Abdul Rahman Md ArofT Faculty o f Educational Studies
Dr. Jam ali bin Ismail Faculty o f Modem Language Studies
Sumangala Pillai - Secretary Universiti Pertanian Malaysia Press
Published by Universiti Pertanian Malaysia Press ISSN No: 0128-7702
reviews and readers critical reactions may be submitted for consideration. Articles may be in English or Bahasa Melayu.
■ Submission of ManuscriptThree complete clear copies of the manuscript are to be submitted to
The Chief EditorPertanika Journal o f Social Science and HumanitiesUniversiti Pertanian Malaysia43400 UPM Serdang, Selangor Darul EhsanMALAYSIATel: 9486101 Ext: 1325; Fax (603) 9483745
■ Proofs and OffprintsPage proofs, illustration proofs, the copy-edited manuscript and an offprint order form will be sent to the author. Proofs must be checked very carefully within the specified time as they will not be proofread by the Press editors.
Authors will receive 20 offprints of each article. Additional copies can be ordered from the Secretary of the Editorial Board by filling out the offprint order form.
INTERNATIONAL PANEL MEMBERS
Prof. Jean Louis FloriotInternational Graduate Institute o f Agribusiness
Prof. Bina Agarwal Institute o f Economic Growth University Enclave, India
Prof. V.T. King University o f Hull
Prof. Royal D. Colle Cornell University, Ithaca
Prof. Dr. Linda J . Nelson Michigan State University
Prof. Dr. Yoshiro Hatano Tokyo Gakugei University
Prof. Max Langham University o f Florida
Prof. Mohamed Ariff National University o f Singapore
Prof. Fred Luthans University o f Nebraska
Prof. D.H. Richie University o f Toledo
Prof. Gavin W. Jones Australian National University
Prof. Dr. Lehman B. Fletcher Iowa State University
Prof. Ranee P.L. Lee Chinese University, Hong Kong
Prof. Stephen H.K. Yeh University o f Hawaii at Manoa
Prof. Graham W. Thurgood California State University
PERTANIKA EDITORIAL OFFICE Research Management Centre (RMC)
1st Floor, IDEA Tower II UPM-MTDC, Technology Centre
Universiti Putra Malaysia 43400 Serdang, Selangor, Malaysia
Tel: +603 8947 1622, 8947 1619, 8947 1616
Pertanika Journal of Social Science & Humanities Volume 4 No. 2 September 1996
Contents
Associations of W ork-Family Conflict, Jo b Satisfaction, Family Satisfaction and Life Satisfaction: A Study of M arried Female Secretaries - Aminah Ahmad
The Ability of a C hild’s Self-rating Scale in Estimating Intellectual Ability - Abd Majid Mohd Isa
The Effectiveness of Teacher Ratings in Identifying Potential Intellectually Gifted M alay Children - Abd Majid Mohd Isa
Conflict Resolution through Consensus Building - Experiences from the Dayak Iban Com m unity of Sarawak, East M alaysia - Jayum Anak Jawan
General Problems Experienced by Elem entary Classroom Teachers - £ulkifli A. M anaf
The Use of English by M alaysian Business Executives in the Commercial Sector - Sharon Goh Seng Pang and Chan Swee Heng
Im pact of Tropical Hardwoods Cam paign - Rusli Mohamad Currency Substitution via Expected Exchange R ate and Domestic Money
Demand: An Em pirical Analysis for Jap a n - T . Chotigeat and Sang H. Lee Expenditure Patterns of Singaporean Tourists in M alaysia - Ahmad Shuib
and Dora BulanSampling Size and Auditors’ Judgem ents: A Sim ulation - Mohamad Ali
Abdul-Hamid, Shamser Mohamed and Annuar Md-Nassir
101
109
115
121
129
141
147155
165
175
Pertanika J. Soc. Sci. & Hum. 4(2): 101-108 (1996)ISSN: 0128-7702
© Penerbit Universiti Pertanian Malaysia
Associations of Work-Family Conflict, Job Satisfaction, Family Satisfaction and Life Satisfaction: A Study of Married Female Secretaries
AMINAH AHMAD Women’s Studies Unit
Centre for Extension and Continuing Education Universiti Pertanian Malaysia
43400 UPM Serdang, Selangor Darul Ehsan, Malaysia
Keywords: role conflict, work-family conflict, job satisfaction, fam ily satisfaction, life satisfaction, working women
ABSTRAKPenyelidikan ini mengkaji ak ibat konflik an ta ra peranan kerja dan keluarga bagi w anita yang telah berkahw in melalui analisis laluan bagi konflik tersebut, kepuasaan kerja, kepuasaan keluarga dan kepuasaan hidup. D ata telah diperolehi da rip ad a 120 setiausaha w anita di negeri Selangor, M alaysia. K ajian ini m endapati bahaw a konflik an ta ra peranan kerja dan keluarga secara signifikan m engurangkan kepuasaan kerja serta kepuasaan keluarga. K edua-dua kepuasaan kerja dan keluarga m em punyai perkaitan yang signifikan dengan kepuasaan hidup. Im plikasi d a rip ad a kajian ini adalah konflik a n ta ra peranan kerja dan keluarga m erupakan perkara yang sam a pentingnya bagi individu dan organisasi kerana ak ibatnya yang negatif, iaitu kurangnya kepuasaan kerja serta kepuasaan keluarga dan ini seterusnya m engurangkan kepuasaan hidup.
ABSTRACTThis study exam ined the consequences o f work-family conflict through pa th analytic associations o f work- family conflict, job satisfaction, family satisfaction and life satisfaction. D ata were obtained from 120 m arried female secretaries in the state o f Selangor, M alaysia. W ork-fam ily conflict was shown to significantly lead to lower job satisfaction as well as family satisfaction. In addition, both jo b satisfaction and family satisfaction were significantly related to life satisfaction. T he results of the study im ply th a t work-family conflict is an im portan t concern for individuals and organizations alike because o f its negative consequences leading to reduced jo b satisfaction as well as family satisfaction and hence to reduced life satisfaction.
INTRODUCTION
In M alaysia, the percentage of women in tertiary education and, consequently, in professional roles has been rising steadily. In 1990, 45.7% of women were in tertiary education (D epartm ent of Statistics, M alaysia 1992) com pared with 38.6% in 1980 (D epartm ent of Statistics, M alaysia 1983). O f the economically active population, 10.7% of women were in professional, technical and related occupations in 1992 (D epartm ent of Statistics, M alaysia 1994) com pared with 4.8% in 1970 (D epartm ent of Statistics, M alaysia 1972).
W ith these changing demographics, wom
en have to deal with job-related demands which place limits on the performance of their family role. This trend results in work-family conflict as women try to cope with conflicting dem ands of work and the family (Aminah 1995). The work-family conflict experienced by m arried working women as they try to juggle the m any roles they perform, along with their frustrations while searching for ways to deal with these conflicts, also reduce the level of work, family and life satisfaction women experience (Sekaran 1986).
Although the increased participation of women in paid em ploym ent while m aintaining their traditional roles is a global phenom
Aminah Ahmad
enon, most of the research in work-family interface has been done in Western cultures. As a result, relatively little is known about work-family interface in the non-W estern cultures. Gaining a better understanding of the conflict arising from family life and work life and the satisfaction as outcomes of role conflict is an im portant area of concern with the increase in the participation of women in the work-force. This concern is justified because an individual’s satisfaction, as a component of well-being, may impinge on their functioning as parents and thus have implications for the quality of children’s lives (Dodge 1990; Hock and DeMeis 1990).
The objective of this study was to examine correlational and path analytic associations among work-family conflict, job satisfaction, family satisfaction and life satisfaction among married female secretaries. M arried women were considered an app ro p ria te target population because Hall (1972) noted that women’s multiple roles tend to be salient sim ultaneously. T he im plication is th a t women may experience more role conflict as a result of the simultaneity of their multiple roles. This is because sim ultaneous role demands require setting priorities while sequential role demands set their own priorities.
In this present study the definition of work-family conflict proposed by K ahn et al. (1964) was used. This definition is consistent with that used by many other researchers (Holahan and Gilbert 1979; Kopelman et al. 1983; Greenhaus and Beutell 1985; Green- haus et al. 1987; Bedeian and Mossholder 1989; Duxbury and Higgins 1991). K ahn et al. (1964) defined work-family conflict as a form of interrole conflict in which the role pressures from the work and family domains are mutually incompatible in some respect. Work-family conflict occurs when an individual has to perform multiple roles: worker, spouse and in many cases, parent. Each of these roles imposes demands requiring time, energy and commitment. The cumulative demands of multiple roles can result in role strain of two types: overload and interference (Kelly and Voydanoff 1985). Overload exists when the total demands on time and energy associated with the prescribed activities of
multiple roles are too great for the roles to be performed adequately or comfortably. In te rference occurs when conflicting dem ands make it difficult to fulfil the requirem ents of multiple roles.
The increased interest in understanding the work-family interface stems from the dem onstrated outcomes of work-family conflict on role and life satisfaction. Life satisfaction was conceptualized as deriving from satisfaction through having a good job and family life (Sekaran 1983). Some p rio r evidence supports the relationship between work-family conflict, job and family satisfaction, and life satisfaction. Several studies have found negative relationships between in terrole conflict and job satisfaction (Jones and Butler 1980; Pleck et al. 1980; Staines and O ’C onnor 1980; K opelm an et al. 1983; Sekaran 1985; Greenhaus and Parasuram an 1986; Parasuram an et al. 1989; M oham ed Hashim 1993). Work-family conflict was also found negatively related to family satisfaction (Pleck et al. 1980; Staines and O ’Connor 1980; Greenhaus and Kopelm an 1981; Jones and Butler 1980; Parasuram an et al. 1989; Aryee 1992). Several earlier researchers have found a positive relationship between job satisfaction and life satisfaction (Bamundo and K opelm an 1980; R ice et al. 1980; Sekaran 1985; Burke and M cKeen 1988; R ice et al. 1992), and betw een fam ily satisfaction and life satisfaction (Campbell et al. 1976; Lee 1978; Kopelm an et al. 1983; Rice et al. 1992).
The model of work-family conflict proposed by Kopelm an et al. (1983) was chosen as the theoretical base for this research. This model presents a nomological network among work conflict, family conflict, work-family conflict (which Kopelm an called interrole conflict), and job, family and life satisfaction. The model is illustrated in Fig. 1.
Although this model includes both the antecedents and consequences of work-family conflict, this present study is limited to testing a part of the model, that is the relationship between variables consequential to work- family conflict.
Based on the m odel, the follow ing hypotheses were postulated.
102 Pertanika J. Soc. Sci. & Hum. Vol. 4 No. 2, 1996

Associations of Work-Family Conflict, Job Satisfaction, Family Satisfaction and Life Satisfaction:
Fig 1: A model of work, family and interrole conflict Source: Kopelman et al. 1983, p. 201.
H I : H igh work-fam ily conflict will lead to low jo b satisfaction.
H2 : H igh work-fam ily conflict will lead to low family satisfaction.
H3 : H igh jo b satisfaction will lead to high life satisfaction.
H 4 : H igh family satisfaction will lead to high life satisfaction.
METHODOLOGYSubjects and ProcedureSubjects in the present study were women who (a) were m arried and living with their husbands, (b) had at least one child, and (c) were full-time secretaries by occupation. The secretaries in this study included stenographers doing the work of secretaries. These criteria were established to ensure that the women in the sample had quite sim ilar responsibilities in terms of family and work roles.
The names and addresses of secretaries were ob tained from two selected public organizations, and the Secretaries Society of Malaysia. Questionnaires and return envelopes were mailed to 234 women meeting these criteria from the state of Selangor. O f this num ber, 120 (87 from the public sector and
33 from private organizations) returned the questionnaires within a period of ten weeks.
T he women in the sample averaged 39.3 years of age (SD = 5.09) and had an average of 3.0 (SD =1.31) children. The majority of the women had completed secondary (58.8%) and diploma (31.9%) education. Only 3.4% had an advanced diploma or a bachelor’s degree, and the rem aining respondents had completed pre-university education (14.2%) or secretarial short courses (1.7%). They earned an average gross income of R M 1532 per month.
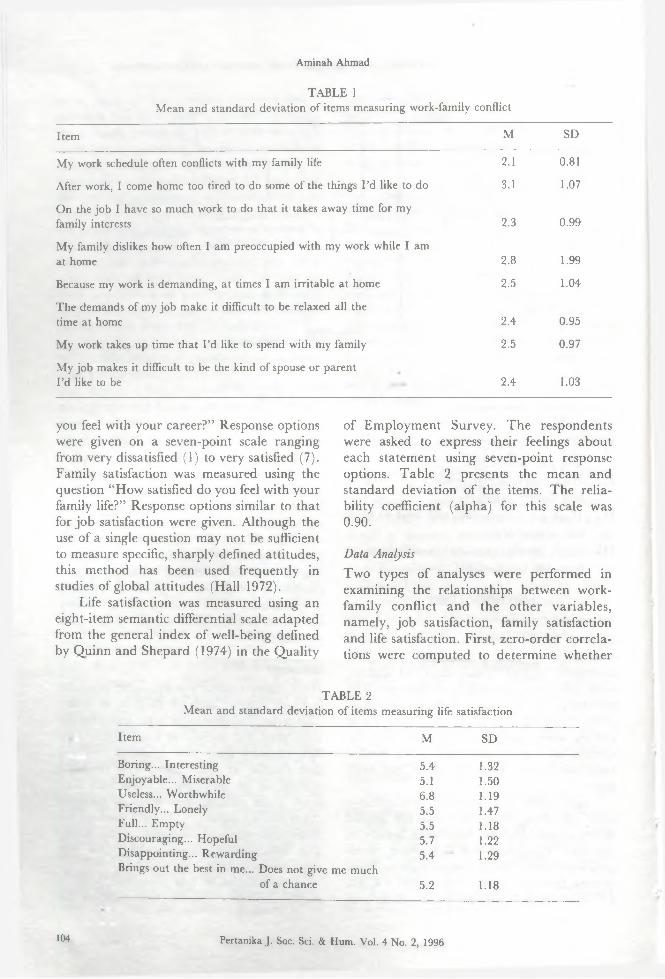
InstrumentsWork-family conflict was measured using the interrole conflict scale of Pleck et al. 1980. This scale consists of eight items based on the most prevalent aspects of work-family conflict: excessive work time, schedule conflicts, and fatigue or irritab ility . T he response options for the questions or items were five- point scales ranging from strongly disagree (1) to strongly agree (5). T able 1 presents the mean and standard deviation of the items. The reliability coefficient (alpha) for this work-family conflict scale was 0.84.
Jo b satisfaction was measured with a single question. “ Overall how satisfied do
Pertanika J. Soc. Sci. & Hum. Vol. 4 No. 2, 1996 103
Aminah Ahmad
TABLE 1Mean and standard deviation of items measuring work-family conflict
Item M SD
My work schedule often conflicts with my family life 2.1 0.81
After work, I come home too tired to do some of the things I’d like to do 3.1 1.07
On the job I have so much work to do that it takes away time for my family interests 2.3 0.99
My family dislikes how often I am preoccupied with my work while I am at home 2.8 1.99
Because my work is demanding, at times I am irritable at home 2.5 1.04
The demands of my job make it difficult to be relaxed all the time at home 2.4 0.95
My work takes up time that I’d like to spend with my family 2.5 0.97
My job makes it difficult to be the kind of spouse or parent I’d like to be 2.4 1.03
you feel with your career?” Response options were given on a seven-point scale ranging from very dissatisfied (1) to very satisfied (7). Family satisfaction was measured using the question “How satisfied do you feel with your family life?” Response options similar to that for job satisfaction were given. Although the use of a single question may not be sufficient to measure specific, sharply defined attitudes, this method has been used frequently in studies of global attitudes (Hall 1972).
Life satisfaction was measured using an eight-item semantic differential scale adapted from the general index of well-being defined by Quinn and Shepard (1974) in the Quality
of Em ploym ent Survey. T he respondents were asked to express their feelings about each statem ent using seven-point response options. T able 2 presents the m ean and standard deviation of the items. T he reliability coefficient (alpha) for this scale was 0.90.
Data AnalysisTwo types of analyses were performed in examining the relationships between work- family conflict and the o th er variables, namely, job satisfaction, family satisfaction and life satisfaction. First, zero-order correlations were computed to determ ine whether
TABLE 2Mean and standard deviation of items measuring life satisfaction
Item M SD
Boring... Interesting 5.4 1.32Enjoyable... Miserable 5.1 1.50Useless... Worthwhile 6.8 1.19Friendly... Lonely 5.5 1.47Full... Empty 5.5 1.18Discouraging... Hopeful 5.7 1.22Disappointing... Rewarding 5.4 1.29Brings out the best in me... Does not give me much
of a chance 5.2 1.18
104 Pertanika J. Soc. Sci. & Hum. Vol. 4 No. 2, 1996
Associations of Work-Family Conflict, Job Satisfaction, Family Satisfaction and Life Satisfaction:
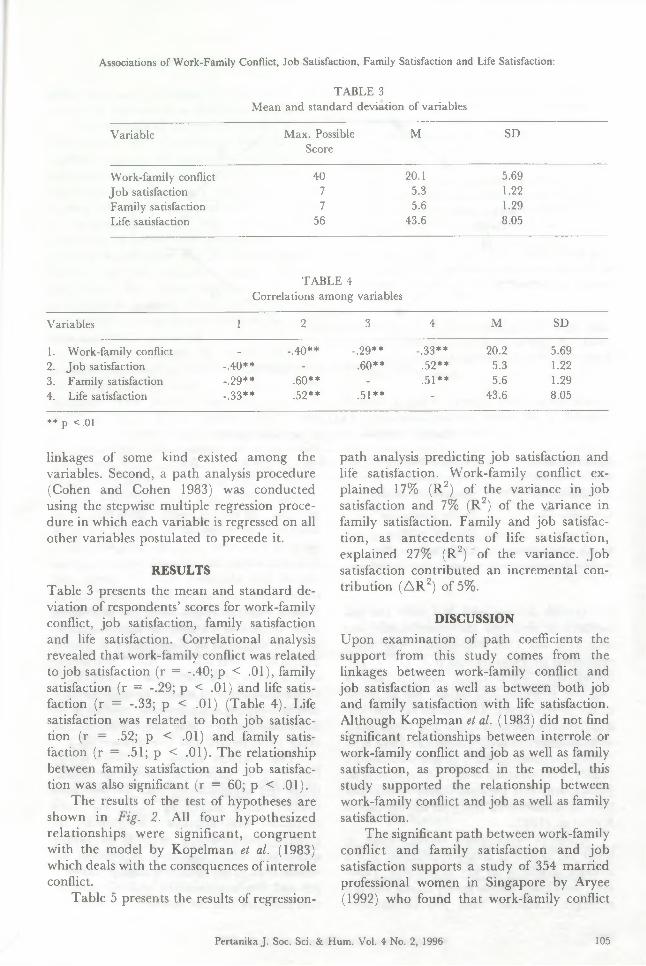
TABLE 3Mean and standard deviation of variables
Variable Max. Possible Score
M SD
Work-family conflict 40 20.1 5.69Job satisfaction 7 5.3 1.22Family satisfaction 7 5.6 1.29Life satisfaction 56 43.6 8.05
TABLE 4 Correlations among variables
Variables 1 2 3 4 M SD
1. Work-family conflict _ -.40** -.29** -.33** 20.2 5.692. Job satisfaction -.40** - .60** .52** 5.3 1.223. Family satisfaction -.29** .60** - .51** 5.6 1.294. Life satisfaction -.33** .52** .51** - 43.6 8.05
** p <.01
linkages of some kind existed among the variables. Second, a path analysis procedure (Cohen and Cohen 1983) was conducted using the stepwise m ultiple regression procedure in which each variable is regressed on all other variables postulated to precede it.
RESULTS
Table 3 presents the mean and standard deviation of respondents5 scores for work-family conflict, job satisfaction, family satisfaction and life satisfaction. Correlational analysis revealed that work-family conflict was related to job satisfaction (r = -.40; p < .01), family satisfaction (r = -.29; p < .01) and life satisfaction (r = -.33; p < .01) (Table 4). Life satisfaction was related to both job satisfaction (r = .52; p < .01) and family satisfaction (r = .51; p < .01). The relationship between family satisfaction and job satisfaction was also significant (r = 60; p < .01).
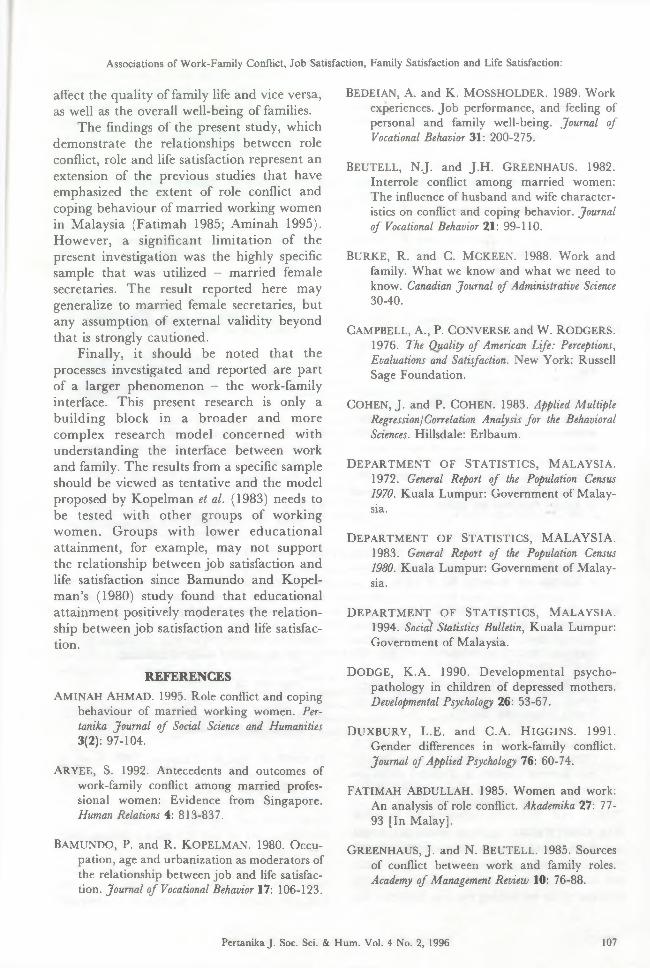
The results of the test of hypotheses are shown in Fig. 2. All four hypothesized relationships were significant, congruen t with the model by Kopelm an et al. (1983) which deals with the consequences of interrole conflict.
Table 5 presents the results of regression-
path analysis predicting job satisfaction and life satisfaction. W ork-fam ily conflict explained 17% (R 2) of the variance in job satisfaction and 7% (R 2) of the variance in family satisfaction. Family and job satisfaction, as an teceden ts o f life satisfaction, explained 27% (R 2) of the variance. Job satisfaction contributed an increm ental contribution (A R 2) of 5%.
DISCUSSION
U pon exam ination of path coefficients the support from this study comes from the linkages between work-family conflict and job satisfaction as well as between both job and family satisfaction with life satisfaction. Although Kopelm an et al. (1983) did not find significant relationships between interrole or work-family conflict and job as well as family satisfaction, as proposed in the model, this study supported the relationship between work-family conflict and job as well as family satisfaction.
The significant path between work-family conflict and family satisfaction and job satisfaction supports a study of 354 m arried professional women in Singapore by Aryee (1992) who found that work-family conflict
Pertanika J. Soc. Sci. & Hum. Vol. 4 No. 2, 1996 105

Aminah Ahmad
Fig 2: Significant path coefficients
TABLE 5Results of stepwise multiple regression analyses
Criterion Variable Predictor Variable Beta Adj. A R 2 F
Job satisfaction Work-family conflict -.41 .17 - 23.84**
Life satisfaction Family satisfaction .31 .22 - 22.66**Job satisfaction .28 .27 .05
Family satisfaction Work-family conflict -.28 .07 - 10.25**
** p <.01
did explain the variance in family and job satisfaction although the contribution was only 11% and 15%, respectively. The study conducted by Parasuram an et al. (1989) also found th a t w ork-fam ily conflict had a negative effect on job satisfaction as found in the present study. The significant relationship between job satisfaction and life satisfaction substantiates earlier studies by Pleck et al. (1980), Sekaran (1985), Jones and Butler (1980), Parasuram an et al. (1989), Rice et al. (1992), and that between family satisfaction and life satisfaction is line with the findings of Rice et al. (1992).
Although work-family conflict leads to lower job as well as family satisfaction, it is a stronger predictor of job satisfaction. However, for life satisfaction family satisfaction is a stronger predictor than job satisfaction.
Future research m ight focus on identifying other sources of variance in family satisfaction. As suggested by K opelm an et al. (1983) coping behaviour m ight m ediate the relationship between work-family conflict and family satisfaction. Several studies have found that effective coping with interrole conflict is an im portant source of role and life satisfaction (Hall 1972; Beutell and Greenhaus 1982).
T he findings im ply th a t work-fam ily conflict is an im portant concern for individuals and organizations alike because such conflict, as a source of stress, has been correlated with negative consequences, inc lud ing reduced jo b as well as fam ily satisfaction which can lead to reduced life satisfaction. T he interrelationship between job and family satisfaction with life satisfaction indicates that the conditions at work can
106 Pertanika J. Soc. Sci. & Hum. Vol. 4 No. 2, 1996
Associations of Work-Family Conflict, Job Satisfaction, Family Satisfaction and Life Satisfaction:
affect the quality of family life and vice versa, as well as the overall well-being of families.
The findings of the present study, which dem onstrate the relationships between role conflict, role and life satisfaction represent an extension of the previous studies that have emphasized the extent of role conflict and coping behaviour of m arried working women in M alaysia (Fatim ah 1985; Am inah 1995). However, a significant lim itation of the present investigation was the highly specific sample that was utilized - m arried female secretaries. T he result reported here may generalize to m arried female secretaries, but any assumption of external validity beyond that is strongly cautioned.
Finally, it should be noted th a t the processes investigated and reported are part of a larger phenom enon - the work-family interface. This present research is only a bu ild ing block in a b ro ad er and m ore com plex research m odel concerned with understanding the interface between work and family. The results from a specific sample should be viewed as tentative and the model proposed by K opelm an et al. (1983) needs to be tested w ith o ther groups of working wom en. G roups w ith lower educational attainm ent, for example, may not support the relationship between job satisfaction and life satisfaction since Bamundo and Kopel- m an’s (1980) study found that educational attainm ent positively moderates the relationship between job satisfaction and life satisfaction.
REFERENCESAMINAH A hm ad . 1995. Role conflict and coping
behaviour of married working women. Pertanika Journal of Social Science and Humanities 3(2): 97-104.
ARYEE, S. 1992. Antecedents and outcomes of work-family conflict among married professional women: Evidence from Singapore. Human Relations 4: 813-837.
BAMUNDO, P. and R. KOPELMAN. 1980. Occupation, age and urbanization as moderators of the relationship between job and life satisfaction. Journal of Vocational Behavior 17: 106-123.
BEDEIAN, A. and K. M O SSH O LD ER . 1989. Work experiences. Job performance, and feeling of personal and family well-being. Journal of Vocational Behavior 31: 200-275.
BEUTELL, N.J. and J.H . GREENHA US. 1982. Interrole conflict among married women: The influence of husband and wife characteristics on conflict and coping behavior. Journal of Vocational Behavior 21: 99-110.
BU RK E, R . and C. M C K EEN . 1988. Work and family. W hat we know and what we need to know. Canadian Journal of Administrative Science 30-40.
CAMPBELL, A., P. CON VERSE and W. R O D G ER S. 1976. The Quality of American Life: Perceptions, Evaluations and Satisfaction. New York: Russell Sage Foundation.
COHEN, J . and P. COHEN. 1983. Applied Multiple Regression!Correlation Analysis for the Behavioral Sciences. Hillsdale: Erlbaum.
D E P A R T M E N T O F S T A T IS T IC S , M A LA Y SIA . 1972. General Report of the Population Census 1970. Kuala Lumpur: Government of Malaysia.
D E PA R TM EN T OF ST A T IST IC S, MALAYSIA. 1983. General Report of the Population Census1980. Kuala Lumpur: Government of M alaysia.
D E P A R T M E N T O F S T A T IS T IC S , M A LA Y SIA . 1994. Social Statistics Bulletin, Kuala Lumpur: Government of Malaysia.
DODGE, K.A. 1990. Developmental psychopathology in children of depressed mothers. Developmental Psychology 26: 53-67.
DUXBURY, L.E. and C.A. HIGGINS. 1991. Gender differences in work-family conflict. Journal of Applied Psychology 76: 60-74.
FATIMAH ABDULLAH. 1985. Women and work: An analysis of role conflict. Akademika 27: 77- 93 [In Malay].
GREENHAUS, J . and N. BEUTELL. 1985. Sources of conflict between work and family roles. Academy of Management Review 10: 76-88.
Pertanika J. Soc. Sci. & Hum. Vol. 4 No. 2, 1996 107
Aminah Ahmad
GREENHAUS, J . and R. KOPELMAN. 1981. Conflict between work and nonwork roles: Implications for the career planning process. Human Resource Planning 4: 1-10.
GREENHAUS, J.H . and S. PARASURAMAN. 1986. A work-nonwork interactive perspective of stress and its consequences. Journal of Organizational Behavior Management 8: 37-60.
GREENHAUS, J., A. BEDEIAN and K. MOSS- HOLDER. 1987. Work experiences, job performance, and feelings of personal and family well-being. Journal of Vocational Behavior 31: 200-215.
HALL, D.T. 1972. A model of coping with role conflict: The role behavior of college educated women. Administrative Science Quarterly 17: 471- 486.
HOCK, E. and D.K. DEMEIS. 1990. Depression in mothers of infants: The role of maternal employment. Developmental Psychology 26: 285- 291.
HOLAHAN, C.K. and L.A. GILBERT. 1979. Interrole conflict for working women. Journal of Applied Psychology 64: 86-90.
JONES, A.P. and M.C. BUTLER. 1980. A role transition approach to the stresses of organi- zationally-induced family disruption. Journal of Marriage and the Family 43: 367-376.
K ah n , R.L., D.M. W o lfe , R.P. Q u in n , J.D . SNOEK and R.A. ROSENTHAL, 1964. Organizational Stress: Studies in Role Conflict and Ambiguity. New York: Wiley.
KELLY, R. and P. VOYDANOFF. 1985. Work- family role strain among employed parents. Family Relations 34: 367-374.
K o p e lm an , R.E., J.H . G re e n h a u s and T.F. CONNOLY. 1983. A model of work, family, and interrole conflict: A construct validation study. Organizational Behavior and Human Performance 34: 198-215.
LEE, G.R. 1978. Marriage and morale in later life. Journal of Marriage and the Family 40: 131-139.
MOHAMED HASHIM MOHD KAMIL. 1993. Overall job satisfaction among managerial employees in the Public Services Department, Malaysia. Ph.D. dissertation, Universiti Pertanian Malaysia.
PARASURAMAN, S., J R. GREENHAUS, S. RABINOWITZ, A.G. BEDEIAN and K.W. MOSSHOLDER. 1989. Work and family variables as mediators of the relationship between wives’ employment and husbands’ well-being. Academy of Management Journal 32: 185-201.
PLECK, J ., G. STAINES and L. LANG. 1980. Conflicts between work and family life. Monthly Labour Review March: 29-32.
Q u in n , R. and L. SHEPARD. 1974. The 1972-73 Quality« o f Employment Survey. Ann Arbor: University of Michigan, Survey Research Center.
RICE, R., J . NEAR and R. HUNT. 1980. The job satisfaction life satisfaction relationship: A review of empirical research. Journal of Applied Social Psychology 1: 37-64.
RICE, R.W., M.R. FRONE and D.B. MCFARLIN. 1992. Work-nonwork conflict and the perceived quality of life. Journal of Organizational Behavior 13: 155-168.
SEKARAN, U. 1983. Factors influencing the quality of life in dual-career families. Journal of Occupational Psychology 6: 161-174.
SEKARAN, U. 1985. The path to mental health: An exploratory study of husbands and wives in dual-career families. Journal of Occupational Psychology 58: 129-138.
SEKARAN, U. 1986. Dual-Career Families. San Francisco: Jossey-Bass.
STAINES, G. and P. O ’Connor. 1980. Conflicts among work, leisure, and family roles. Monthly Labor Review 103(3): 35-39.
(Received 23 May 1996)
108 Pertanika J. Soc. Sci. & Hum. Vol. 4 No. 2, 1996
Pertanika J. Soc. Sci. & Hum. 4(2): 109-113 (1996)ISSN: 0128-7702
© Penerbit Universiti Pertanian Malaysia
The Ability of a Child’s Self-rating Scale in Estimating Intellectual Ability
ABD MAJID MOHD ISA Faculty of Educational Studies Universiti Pertanian Malaysia
43400 UPM Serdang, Selangor, Malaysia
Keywords: intellectual ability, intelligence, self-rating, inventory
ABSTRAKT erd ap at banyak d a p a tan yang m encadangkan supaya faktor bukan intelektual diam bil kira semasa m engukur kebolehan intelektual. Berdasarkan cadangan ini banyak inventori tadb ir sendiri telah d ibena pada dekad yang lalu. Salah satu d a rip ad a inventori tersebut ialah ‘School Feeling and T h ough t (S F T )\ O leh kerana inventori ini dibena di Am erika, ianya perlu d iterjem ahkan ke dalam Bahasa M elayu dan diuji keupayaannya m enilai kebolehan intelek kanak-kanak M elayu. Inventori SFT dalam Bahasa M elayu d itadb ir ke atas 100 m urid darjah enam (53 lelaki dan 47 perem puan) di sebuah sekolah rendah di T am pin . K ebolehan intelektual (IQ ) kanak-kanak tersebut d iten tukan dengan m enggunakan W ISC -R . D apatan kajian ini m endapati kerelasi a n ta ra skor SFT dengan I Q d arip ad a skor W ISC -R adalah sederhana. D ua sub-ujian SFT iaitu ‘A ction’ dan ‘Affect’ d idapati m enjadi peram al I Q yang signifikan. Satu persam aan untuk m eram al IQ b o le h d ibentuk hasil d a rip ad a analisis regressi berganda. Satu kelem ahan persam aan ini ialah I Q yang bakal d iram alkan m engandungi ra la t sebanyak 11 m ata. W alau bagaim anapun , SFT boleh d igunakan untuk m eram al I Q d a n boleh d igunakan sebagai a la t penapis un tuk m engukur kebolehan intelek kanak-kakan M elayu.
ABSTRACTT here is substantial evidence for non-intellectual factors to be considered as an additional criterion in the appraisal o f intellectual ability. Therefore, the developm ent o f a child’s self-rating scale has been intensive in the last decades. O ne of the most widely used self-rating scales is the School Feeling and T hough t (SFT) scale. Bearing in m ind th a t the SFT was developed in Am erica, it is essential to undertake a study to ascertain w hether the M alay versions o f these instrum ents have the ability to assess intellectual ability of M alay children. T he M alay version of SFT was adm inistered to 100 Prim ary Six pupils (53 boys and 47 girls) from a single school in T am pin . T he intellectual ability (IQ ) was m easured using the revised version of W echsler Intelligence Scale for C hildren (W ISC -R ). T he correlations betw een the SFT scores and the W ISC -R full-scale I Q are modest. Tw o subtests o f SFT, nam ely ‘A ction’ and ‘Affect’, are found to be significant predictors of IQ . T he equation derived from m ultiple regression analysis to estim ate IQ u s in g SFT subtest scores is found to be able to predict intellectual ability (IQ ). T he only lim itation is th a t the I Q predicted by this equation has an 11-point error. Therefore, SFT can be used to estim ate I Q and thus can be used as a screening test for intellectual ability of M alay children.
INTRODUCTION
T erm an (1959), in the 30-year follow-up report on his research on intellectually gifted children, suggested implicitly that external or non-intellectual factors had to be considered in the appraisal of intellectual ability. His suggestion is based on his finding that the difference between the most and the least successful men am ong his 1925 study of gifted
children is not in intelligence but in personality factors.
In an intensive study on the characteristics of 64 eminent scientists, Roe (1952) found that despite long working hours and fewer vacations, they would ra ther be doing their work than anything else. O ther researchers suggested that em inent adults are self initiated and are guided by self-generated

Abd Majid Mohd Isa
standards of excellence (Cham bers 1964; Helson 1971; Nicholls 1972; Burden 1979).
Recent research findings also consistently support the view that children’s perception of their own ability m ediates achievem ent behaviour (Blumenfeld et al. 1982). The way children perceive their ability and attributions of success and failure can have consequences on their motivation towards school work and intellectual potential (Dweck 1986; Clifford 1986). Therefore, there is a great potential for non-intellectual ability, which can be self administered, to be developed to appraise intellectual ability among children. Since there is substantial evidence for the non-intellectual factors to be considered as an add itional criterion in the appraisal of intellectual ability, the development of a child’s self-rating scale has been intensive in the last decades. One of the most widely used self-rating scales is the School Feeling and Thought (SFT) scale.
SCHOOL FEELING AND THOUGHT (SFT)Description and Administration of SF T The School Feeling and Thought (SFT) scale developed by Clifford (1988) is in some respects similar to K uhl’s (1985) Action Control subscale. Both are based on R otter’s (1966) Locus of Control scale and attem pt to measure the extent to which an individual responds constructively to failures or misfortunes through self-reporting. C ontrary to K uhn’s Action Control subscale developed for adults, SFT focuses on school failure primarily for 7- to 17-year-old school children.
The SFT consists of 36 items with a 6- point agree disagree Likert scale. It yields three subscale scores: Feeling About Failure (Affect or Afl), Action About Failure (Action or Act) and Preferred Task Difficulty (PD). It takes about 25 minutes to administer the SFT with the researcher reading every item aloud to the children.
Reliability and Validitya. ReliabilityThe standardization of the SFT was conducted using 233 students aged 1 0 -1 2 years old enrolled in two public schools in a
midwestern state of the USA. The alpha coefficient for the original 36 items was .90. For the SFT subscales, the alpha coefficients for Affect, Preferred Difficulty and Action were 0.85, 0.88 and 0.80 respectively.
b. V alid ityResponses to the original 56 items in the SFT scale were analysed using factor analysis with varimax rotation. The analysis resulted in three factors (Affect, Preferred Difficulty and Action). Items with a minimal factor loading of 0.40 were retained. In the final form of SFT, each subscale contained nine items.
T he SFT score was validated using selected items from well-known achievement tests, Iowa Tests of Basics Skills (ITBS) and Iow a Test erf E ducational D evelopm ent (ITED ), which formed an inventory called Academic Risk Taking (A RT) M easure, consisting of m athem atics, spelling and vocabulary. The SFT scale has a modest correlation with the A R T Measure. For the fifth grade (11 years old) the correlation coefficient is 0.48 (p < 0.001) for vocabulary, 0.41 (p < 0.001) for spelling and 0.37 (p < 0.001) for mathematics.
The SFT was translated and administered to 194 fourth grade Taiwanese students (Clifford and Chou 1991). The translated version of the SFT scale had a reliability of 0.87. The reliability for the subtests was: 0.72 for the Affect, 0.82 for the Preferred Difficulty and 0.86 for the Action.
OBJECTIVE OF THE STUDY
The objective of the study was to explore the possibility of using the SFT score to predict intellectual ability (IQ) of M alay children. Bearing in mind that the SFT has been developed in the USA, it is essential to undertake a study to ascertain tha t the M alay version of this instrum ent has the ability to assess the intellectual ability of M alay children. Since the cost of adm inistering intelligence tests is high, psychologists have developed screening measures to gauge in tellectual ability . I f the SFT can be effectively used for screening purposes, an enormous am ount of resources can be saved.
110 Pertanika J. Soc. Sci. & Hum. Vol. 4 No. 2, 1996
The Ability of a Child’s Self-rating Scale in Estimating Intellectual Ability
TRANSLATION PROCEDURETranslation PanelThe SFT was initially translated into M alay by the researcher and then given to a translation panel comprising five local experts: two associate professors of M alay Studies, two E duca tiona l Psychology lecturers and a teacher with 12 years’ experience in teaching M alay children in a rural area.
Item Analysis and Back TranslationAfter receiving separate comments from each translation panel member, the researcher made the necessary changes as suggested by the panel. The SFT was then administered to a class of 25 Primary Six pupils in a school near Universiti Pertanian Malaysia. The respondents were instructed not only to respond to every item but also to m ark items which they did not understand. Four items in the SFT (items 2, 10, 13, and 21) needed re-wording.
The final M alay version of the SFT was given to five final-year Bachelor of Education (Teaching of English as a Second Language) students at Universiti Pertanian M alaysia. They translated each item in the instrum ent back into English. This ‘back translation procedure’ was essential to ensure that the content of the final M alay version of the SFT did not deviate from the original English version. From the back translation , the researcher found that all items had been correctly translated.
RELIABILITY OF THE MALAY VERSION OF SFT
The internal consistency reliability of the translated version of SFT is modest. T he
C ronbach Alpha coefficient for all 27 items is 0.6. A Cronbach Alpha coefficient of 0.75 can be obtained if 3 items are deleted (items 2, 13 and 21). Furtherm ore, the deletion of these items will im prove the reliability of the subscales. The reliability for Affect increases to 0.60 from 0.55, for Preferred Difficulty to 0.67 from 0.59 and for the Action to 0.55 from0.43. As these three items shared a common feature, that they are all negatively worded, the deletion o f these item s for fu rth e r adm in istra tion seems sensible. T he final items for SFT are therefore reduced from 27 to 24.
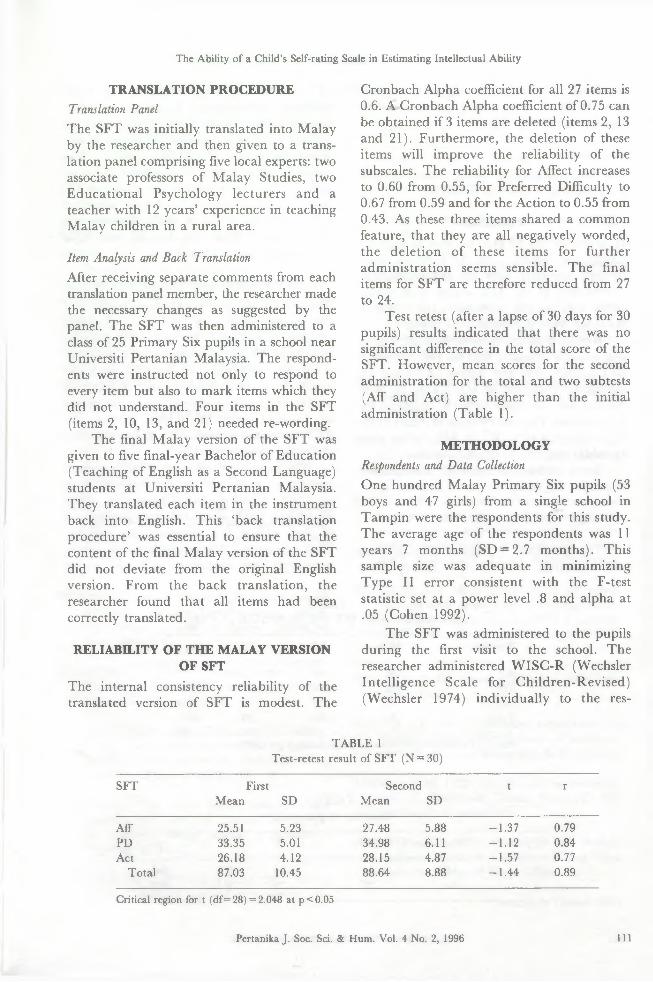
Test retest (after a lapse of 30 days for 30 pupils) results indicated that there was no significant difference in the total score of the SFT. However, mean scores for the second adm inistration for the total and two subtests (Aff and Act) are higher than the initial adm inistration (Table 1).
METHODOLOGYRespondents and Data CollectionO ne hundred M alay Prim ary Six pupils (53 boys and 47 girls) from a single school in T am pin were the respondents for this study. The average age of the respondents was 11 years 7 m onths (SD = 2.7 m onths). This sample size was adequate in m inim izing Type II error consistent w ith the F-test statistic set at a power level .8 and alpha at .05 (Cohen 1992).
T he SFT was adm inistered to the pupils during the first visit to the school. The researcher adm inistered W ISC -R (Wechsler In telligence Scale for C hildren-R evised) (W echsler 1974) individually to the res
TABLE 1 Test-retest result of SFT (N = 30)
SFT FirstMean SD
SecondMean SD
t r
Aff 25.51 5.23 27.48 5.88 -1.37 0.79PD 33.35 5.01 34.98 6.11 -1.12 0.84Act 26.18 4.12 28.15 4.87 -1.57 0.77
Total 87.03 10.45 88.64 8.88 -1.44 0.89
Critical region for t (df= 28) = 2.048 at p< 0 .05
Pertanika J. Soc. Sci. & Hum. Vol. 4 No. 2, 1996 111
Abd Majid Mohd Isa
pondents. The full-scale I Q score derived from W ISC-R is used as a criterion for the intellectual ability (IQ).
Data AnalysisThe data was analysed using a com puter software package known as SPSSPC + .
FINDINGS
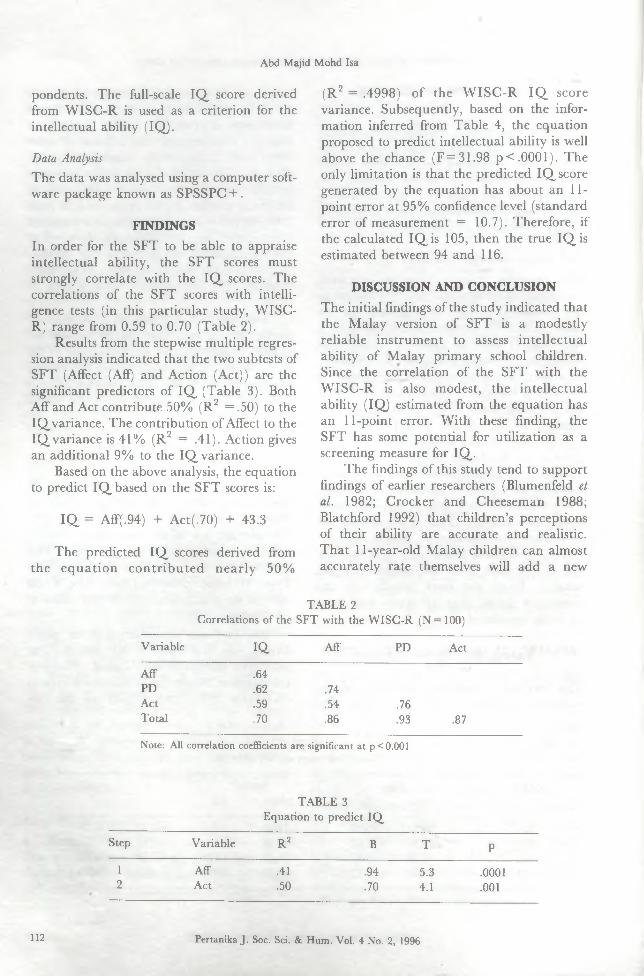
In order for the SFT to be able to appraise intellectual ability, the SFT scores must strongly correlate with the I Q scores. The correlations of the SFT scores with intelligence tests (in this particular study, W ISC- R) range from 0.59 to 0.70 (Table 2).
Results from the stepwise multiple regression analysis indicated that the two subtests of SFT (Affect (Aff) and Action (Act)) are the significant predictors of I Q (Table 3). Both Aff and Act contribute 50% (R 2 = .50) to the IQ variance. The contribution of Affect to the IQ variance is 41% (R 2 = .41). Action gives an additional 9% to the IQ variance.
Based on the above analysis, the equation to predict IQ based on the SFT scores is:
I Q = Aff(.94) + Act(.70) + 43.3
The predicted IQ scores derived from the eq u a tio n c o n tr ib u te d n ea rly 50%
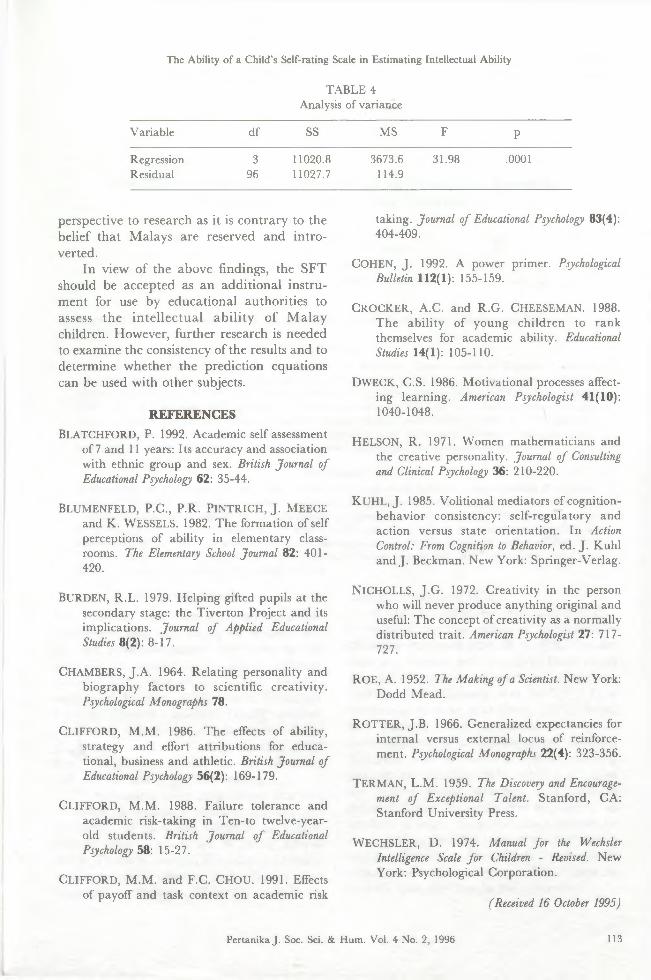
(R 2 = .4998) o f the W ISC -R I Q score variance. Subsequently, based on the information inferred from Table 4, the equation proposed to predict intellectual ability is well above the chance (F = 31.98 p < .0001). The only limitation is that the predicted I Q score generated by the equation has about an 11- point error at 95% confidence level (standard error of measurement = 10.7). Therefore, if the calculated I Q is 105, then the true I Q is estimated between 94 and 116.
DISCUSSION AND CONCLUSION
The initial findings of the study indicated that the M alay version of SFT is a modestly reliable instrum ent to assess in tellectual ability of M alay prim ary school children. Since the correlation of the SFT with the W ISC -R is also modest, the intellectual ability (IQ) estimated from the equation has an 11-point error. W ith these finding, the SFT has some potential for utilization as a screening measure for IQ .
The findings of this study tend to support findings of earlier researchers (Blumenfeld et al. 1982; Crocker and Cheeseman 1988; Blatchford 1992) that children’s perceptions of their ability are accurate and realistic. T hat 11-year-old M alay children can almost accurately rate themselves will add a new
TABLE 2Correlations of the SFT with the WISC-R (N= 100)
Variable IQ. Aff PD Act
Aff .64PD .62 .74Act .59 .54 .76Total .70 .86 .93 .87
Note: All correlation coefficients are significant at p < 0.001
TABLE 3 Equation to predict IQ,
Step Variable R2 B T P
1 Aff .41 .94 5.3 .00012 Act .50 .70 4.1 .001
112 Pertanika J. Soc. Sci. & Hum. Vol. 4 No. 2, 1996
The Ability of a Child’s Self-rating Scale in Estimating Intellectual Ability
TABLE 4Analysis of variance
Variable df SS MS F P
Regression 3 11020.8 3673.6 31.98 .0001Residual 96 11027.7 114.9
perspective to research as it is contrary to the belief that M alays are reserved and in troverted.
In view of the above findings, the SFT should be accepted as an additional instrum ent for use by educational authorities to assess the in te llec tu a l ab ility of M alay children. However, further research is needed to examine the consistency of the results and to determine whether the prediction equations can be used with other subjects.
REFERENCESBLATCHFORD, P. 1992. Academic self assessment
of 7 and 11 years: Its accuracy and association with ethnic group and sex. British Journal of Educational Psychology 62: 35-44.
BLUM ENFELD, P .C ., P .R . P lN T R IC H , J . M EEC E and K. W ESSELS. 1982. The formation of self perceptions of ability in elementary classrooms. The Elementary School Journal 82: 401 - 420.
BURDEN, R.L. 1979. Helping gifted pupils at the secondary stage: the Tiverton Project and its implications. Journal of Applied Educational Studies 8(2): 8-17.
CHAMBERS, J.A. 1964. Relating personality and biography factors to scientific creativity. Psychological Monographs 78.
C L IFFO R D , M.M. 1986. The effects of ability, strategy and effort attributions for educational, business and athletic. British Journal of Educational Psychology 56(2): 169-179.
C LIFFO R D , M.M. 1988. Failure tolerance and academic risk-taking in Ten-to twelve-year- old students. British Journal o f Educational Psychology 58: 15-27.
CLIFFORD, M.M. and F.C. CHOU. 1991. Effects of payoff and task context on academic risk
taking. Journal of Educational Psychology 83(4): 404-409.
COHEN, J . 1992. A power primer. Psychological Bulletin 112(1): 155-159.
C r o c k e r , A.C. and R.G. C h eesem an . 1988. The ability of young children to rank themselves for academic ability. Educational Studies 14(1): 105-110.
DW ECK, C.S. 1986. Motivational processes affecting learning. American Psychologist 41(10): 1040-1048.
HELSO N , R. 1971. Women mathematicians and the creative personality. Journal of Consulting and Clinical Psychology 36: 210-220.
K U H L , J . 1985. Volitional mediators of cognition- behavior consistency: self-regulatory and action versus state orientation. In Action Control: From Cognition to Behavior, ed. J. Kuhl and J . Beckman. New York: Springer-Verlag.
N lC H O LL S, J.G . 1972. Creativity in the person who will never produce anything original and useful: The concept of creativity as a normally distributed trait. American Psychologist 27: 717- 727.
ROE, A. 1952. The Making of a Scientist. New York: Dodd Mead.
R O T T E R , J.B. 1966. Generalized expectancies for internal versus external locus of reinforcement. Psychological Monographs 22(4): 323-356.
TER M A N , L .M . 1959. The Discovery and Encouragement o f Exceptional Talent. Stanford, CA: Stanford University Press.
W EC H SLER , D. 1974. Manual for the Wechsler Intelligence Scale for Children - Revised. New York: Psychological Corporation.
(Received 16 October 1995)
Pertanika J. Soc. Sci. & Hum. Vol. 4 No. 2, 1996 113

Pertanika J. Soc. Sci. & Hum. 4(2): 115-120 (1996)ISSN: 0128-7702
© Penerbit Universiti Pertanian Malaysia
The Effectiveness of Teacher Ratings in Identifying Potential Intellectually Gifted Malay Children
ABD MAJID MOHD ISA Faculty of Educational Studies Universiti Pertanian Malaysia
43400 Serdang, Selangor, Malaysia
Keywords: teacher rating scale, intellectually gifted, intelligence, Malay children
ABSTRAKDalam kajian ini, keberkesanan skala ‘Scale for R ating Behaviour C haracteristics o f Superior C hildren (SRBCSS) diuji sebagai a la t yang berpotensi un tuk m engenalpasti kanak-kanak m elayu yang pintas cerdas. M urid yang m endapat skor 46 ujian ‘R aven’s S tandard Progressive M atrices (R aven’s SPM ) diuji dengan ujian W ISC -R . D aripada 303 responden, 101 m endapat skala I Q 120 a tau lebih dan dikelaskan sebagai pintasn cerdas. G uru dim intas m enilai responden dengan m enggunakan SRBCSS yang diterjem ahkan ke Bahasa M elayu. D ap atan kajian ini m enunjukkan bahaw a guru perlu hanya beberapa sub-ujian yang berkaitan jika m ereka hendak dilibatkan dalam proses m engenalpasti kanak-kanak p in tar cerdas.
ABSTRACTIn this study, the effectiveness of the M alay version o f scale for ra ting behaviour characteristics of superior students (SRBCSS) was tested as a potential tool for the identification of intellectually gifted M alay children. Pupils with a score of at least 46 on R aven’s standard progressive m atrices (R aven’s SPM ) were given the W ISC -R test. O f the 303 respondents, 101 scored a full-scale IQ , of 120 or more and were classified as intellectually gifted. T eachers were asked to ra te the respondents using the translated version of SRBCSS. T he findings of this study suggest that teachers should be given appropria te SRBCSS subtests if they are involved in identifying intellectually gifted children.
INTRODUCTION
A num ber of researchers have reported that intelligence tests and rating by teachers are the two most commonly used tools in the selection o f in tellectually gifted children (Jenkins 1979; Alvino et al. 1981; Y arborough and Johnson 1983). In a landm ark study by Pegnato and Birch (1959), teachers could only effectively identify 50% of the gifted children. T heir finding has stimulated many researchers to validate the efficiency and effectiveness of teachers’ ratings.
In an identification program m e, teachers are asked to nom inate children w ithout any guidelines, or they are asked to rate each student using a given set of rating instruments. Teachers’ ratings, following guidelines, should be more effective and efficient than teachers’ nominations (Renzulli and H a rt
m an 1971; Borland 1978).A study by Solomon (1979) indicated that
by using a checklist, teachers’ identification efficiency increased from 25 to 50%. O n the contrary, Ashman and Vukelich (1983) found that the effectiveness of teachers’ ratings was 20-81% and efficiency was 54-71%. It is interesting to note that Gear (1975) found that teachers could be trained to improve their efficiency in identifying gifted children. Teachers who attended a special training program m e identified 86% , while teachers in the control group identified only 50% of gifted children. Since the cost of training all teachers is high, an initial study should be conducted to find the type of teacher who is highly effective in identifying intellectually gifted children so they can be trained to identify such children in the classroom.

Abd Majid Mohd Isa
Various types of teacher rating are being developed and tested. The most widely used teacher rating is the scale for rating behaviour characteristics of superior students (SRBCSS) developed by Renzulli et al. (1971), who noted that SRBCSS is intended to provide an objective aid to guide teacher judgem ent in identifying gifted children. Rust and Lose (1980) found that the SRBCSS was not successful in aiding teachers if the criterion of giftedness is based on IQ scores. In light of this finding, Burke et al. (1982) suggested that SRBCSS must be extensively studied. T herefore, the effectiveness of SRBCSS, especially the translated version, must be determined before it can be utilized extensively in identifying intellectually gifted M alay children.
METHODOLOGYSelection of Respondents and Data CollectionThe study involved 1047 Primary Six M alay students studying at 16 prim ary schools in Tam pin district. The respondents of this study were those with a score of at least 46 on the Raven’s standard progressive matrices (Raven’s SPM) (Raven 1965). R aven’s SPM has been widely used to screen and identify intellectually gifted children for educational and research purposes (Pegnato and Birch 1959; M artinson and Lessinger 1960; Rust and Lose 1980). For this study, a score of 46 was proposed so that all potential intellectually gifted children would be included (Abd Majid 1994).
The num ber of students with a score of 46 on Raven’s SPM was 303 (149 boys and 154 girls). They were the respondents for this study. The researcher administered W ISC-R (Wechsler intelligence scale for children- revised) to all respondents. The criterion for intellectual giftedness in this study was based on IQ scores generated by W ISC-R; those with an IQ score of 120 or above were categorized as intellectually gifted. There were 101 pupils (56 boys and 45 girls) with an IQ score of 120 or above.
While the researcher administered the W ISC-R, teachers of the respondents were asked to rate the respondents using the SRBCS.S. Each respondent was rated by
four teachers, M alay, English, mathem atics and class teachers.
InstrumentsThere were three instruments used in this study, the W ISC -R , R av en ’s SPM and SRBCSS. The W ISC-R and R aven’s SPM are in telligence tests. The SRBCSS, on the other hand, is a teacher rating scale.
The W ISC-R is an individually adm inistered intelligence test published in 1974. It consists of 10 subtests: information, com prehension, arithmetic, similarities, vocabulary, picture completion, block design, picture arrangem ent, object assembly and coding. The instructions and the items were translated in to M alay using the procedures proposed by the manual. It was then pretested using 100 M alay children of similar age (Abd M ajid and O thm an 1995). The test- retest reliability of the M alay version of W ISC-R ranged from .65 to .89. The full- scale I Q score, the criterion for giftedness in this study, has a reliability of .91. T he criterion for intellectual giftedness is based on the I Q score generated by W ISC-R; those with an I Q score of 120 or above were categorized as intellectually gifted.
R aven’s SPM was first published in 1938 and designed to assess the mental ability of people of all ages and diverse educational and cultural backgrounds. The scale consists of 60 items. The tester is required to com prehend meaningless figures that dem and a systematic method of observation and reasoning. The in ternal consistency and the stability of R aven’s SPM is reported to be .6-.97. For M alay children, the R aven’s SPM had an internal consistency of .76 and the test-retest reliability after 30 days was .77 (Abd M ajid 1994). Since it is a non-verbal test, it does not requ ire any tran s la tio n . In this study , R a v e n ’s SPM was used to screen the respondents.
Currently, the most widely used teacher’s ra ting is the scale for ra ting behaviour c h a r a c te r i s t ic s o f s u p e r io r s tu d e n ts (SRBCSS) developed by Renzulli et al. in 1971 (Rust and Lose 1980). The SRBCSS has four subtests: learning (8 items), m otivation (9 items), creativity (10 items) and leadership
116 Pertanika J. Soc. Sci. & Hum. Vol. 4 No. 2, 1996

The Effectiveness of Teacher Ratings in Identifying Potential Intellectually Gifted Malay Children
(10 items). Renzulli et al. reported tha t SRBCSS significantly discriminated between gifted and average children. It has a promising stability coefficient (r = 0.77-0.91). The construct validity of four subtests was established using factor analysis.
In this study, the English version of SRBCSS was initially translated into M alay by the researcher. It was then given to a translation panel of five academicians in the Faculty of Educational Studies, Universiti Pertanian Malaysia. After receiving separate comments from each m em ber of the panel, the researcher m ade the necessary changes. The final M alay version of SRBCSS was given to five final-year Bachelor of Education (Teaching of English as a Second Language) students in U PM . They translated each item in the SRBCSS back into English. The ‘back translation procedure’ was essential to ensure that the content of the M alay version of SRBCSS had not deviated from the original English version.
RESULTS
In this study, data on teacher ratings were analysed according to the total score for SRBCSS for each teacher and the subtest score of SRBCSS of each teacher.
Total Score of SRBCSSO n the basis of the total score for each teacher, there were four scores that together provided the total SRBCSS score. T he four scores were from the M alay, mathem atics, English and class teachers.
The results from a stepwise procedure of multiple regression indicated tha t ratings from the three subject teachers were significant predictors of intellectual giftedness. The am ount of variance shared by these three teachers is small (around 12%) (Table 1).
The best predictor of giftedness was the M alay teacher ra ting w ith 10% shared variance. The mathem atics teacher and the English teacher only gave an additional shared variance of 1% each to the M alay teacher.
The result from Fisher’s linear discriminant function analysis indicated that all four teachers’ total ratings of SRBCSS can be used to discriminate between intellectually gifted and non-intellectually gifted. The summary of Wilks’ statistics is presented in T able 2. The m anner in which the variable is entered is similar to the multiple regression with M alay teachers the first variable to be entered.
D ata shown in Table 3 indicate that the four teach e rs’ to ta l ra tin g score using SR B C S S c o r re c tly c la ss if ie d 6 4 .6 9 % [(134 + 62)/303]. Nearly 40% of the intellectually gifted were classified as non-intellec- tually gifted (false negatives). Among those who were classified as intellectually gifted, more than half were non-intellectually gifted (false positives).
Teacher Sub test Score of SRBCSSBased on the teach er sub test score o f SRBCSS, there were 16 measures of teacher rating for every respondent (4 teachers x 4 subtests). D ata shown in T able 4 indicate that only five measures were significant predictors of intellectual giftedness: M alay learning, m aths m otivation, English learning, class creativity and class leadership. T he five significant predictors shared 20% of variance with intellectual giftedness, nearly twice the am ount of variance of the total score of SRBCSS for the four teachers.
T he stepwise p rocedure o f m ultip le regression of the teacher subtests of SRBCSS indicated tha t five teacher subtests were significant predictors of intellectual giftedness. How ever, the W ilks’ procedure of
TABLE 1Predictors of intellectual giftedness among the total score of SRBCSS
Step Variable R R2 Adj.R2 B Beta T Sig.T
1 Malay .31 .10 .09 .005 .20 3.06 .00242 Maths .33 .11 .11 .003 .13 3.27 .02403 English .35 .12 .12 .002 .13 .207 .0398
Pertanika J. Soc. Sci. & Hum. Vol. 4 No. 2, 1996 117

Abd Majid Mohd Isa
TABLE 2Discriminant analysis for total score of SRBCSS (N = 303)
Step Teacher Wilks’ Lambda Sig
1 Malay .90 .00012 English .89 .00013 Maths .88 .00014 Class .87 .0000
TABLE 3Predictive classification results for intellectually and non-intellectually gifted (N = 303)
VariablesFisher’s Linear discrimination Function
Non-intellectually Gifted
IntellectuallyGifted
Malay .9328 .1216English .9301 .1085Math .1663 .1860Class .1301 .1195(Constant) -27.8636 -30.2125
Classification ResultsPredicted Group Membership
Group Non-gifted Gifted
Non-gifted 134 (66.3%) 68 (33.7%)Gifted 39 (38.6%) 62 (61.4%)
TABLE 4Predictors of intellectual giftedness among the subtests of SRBCSS
Step VariablesTeacher-subtest
R R2 Adj.R2 B Beta T Sig.T
1 Malay-learning .31 .09 .09 .014 .16 2.32 .02122 Maths-motivation .37 .14 .13 .023 .23 4.29 .00003 English-learning .40 .16 .15 .011 .13 2.11 .03604 Class-creativity .42 .18 .17 -.013 -.19 -3.29 .00115 Class-leadership .44 .20 .19 .015 .16 2.41 .0167
discrim inant analysis identified eight (8) teacher subtests. The summary of the results is shown in Table 5.
The effectiveness of 5 teacher subtests as the result of multiple regression procedure and 8 teacher subtests from Wilks’ discriminant function analysis in classifying intellectual giftedness is shown in Table 6. The difference between using eight teacher subtest
measures and five teacher subtests is that the five teacher subtests failed to identify only one (1) intellectually gifted child. Therefore, five teacher subtests are more feasible than eight teacher subtest measures.
CONCLUSION
Based on the above findings, both procedures resulted in 33% ‘false negatives’ and 50%
118 Pertanika J. Soc. Sci. & Hum. Vol. 4 No. 2, 1996

The Effectiveness of Teacher Ratings in Identifying Potential Intellectually Gifted Malay Children
TABLE 5Discriminant analysis for the subtests of SRBCSS (N = 303)
Step Variable Wilk’s SigLambda
1 Malay-learning .91 .00012 Maths-motivating .86 .00013 English-learning .84 .00014 Class-creativity .82 .00015 Class-leadership .80 .00016 Malay-leadership .80 .00017 English-leadership .80 .00018 Class-motivation .79 .0001
TABLE 6Predicted group membership by discriminant function analysis teacher-subtest of SRBCSS
Teacher-Subtest SRBCSS8 Measures 5 Measures
Actual N Predicted Predicted0 1 0 1
0 202 147 55 141 61(72.8%) (27.2%) (69.8%) (30.2%)
1 101 35 66 34 67(34.7%) (65.3%) (33.7%) (66.3%)
% correct 69.3 68.7
Note: 0 = non-intellectually gifted 1 = intellectually gifted
‘false positives’. However, the five teacher- subtests dem anded less teacher’s time in administering SRBCSS as each subtest had not more than 10 items. O n the contrary, the form er p rocedure (to tal score) required teachers to appraise each student using all 37 items of SRBCSS.
Since both procedures contained a large num ber of ‘false negatives’, there must be some reason why teacher rating did not effectively identify gifted children. Awanbor (1989) found that teachers are more likely to use scholastic achievement as an index to identify gifted children. Burt (1955) alleged that teachers’ gradings are markedly biased in favour of memory or capacity to learn. D ata from a large body of research on ‘self- fulfilling prophecy’ indicated that teachers’ behaviour and a ttitu d e are based upon
physical attractiveness, compliance and active participation. Gifted children are, on the other hand, ‘precocious’ (Keating 1975), with a tendency to exhibit undesirable behaviour to the teachers.
In the M alaysian context, teachers are the most economical personnel to be utilized in identification of intellectual giftedness. Based on the findings of this study, it is essential for the authorities to train teachers to be objective in their evaluations. Even so, one must recognize that there is a great deal of error in the classification of gifted children.
REFERENCESABD MAJID MOHD ISA. 1994. Keberkesanan
Raven SPM dalam mengenal pasti kanak- kanak Melayu pintar cerdas. Pertanika J . Soc. Sci. Hum. 2: 63-68.
Pertanika J. Soc. Sci. & Hum. Vol. 4 No. 2, 1996 119
Abd Majid Mohd Isa
ABD MAJID MOHD ISA an d OTHMAN MOHAMED. 1995. Appraising giftedness usng the Malay version of WISC-R. Pertanika J . Soc. Sci. Hum. 3: 119-124.
ALVINO, J., R.C. MCDONNEL and S. RlCHERT.1981. National survey of identification practises in gifted and talented education. Exceptional Children 48: 124-132.
ASHMAN, S.S. and C. VUKELICH 1983. The effect of different types of nomination forms on teachers’ identification of gifted children. Psychology in the Schools 20: 518-527.
AWANBOR, D. 1989. Characteristics of gifted and talented children and problems of identification by teachers and parents. International Journal of Education Development 9(4): 263-269.
BORLAND, J . 1978. Teacher identification of gifted: A new look. Journal for the Education of the Gifted 2: 22-32.
Bu r k e , J.P., C.E. Ha w o r th and W.B. Wa r e .1982. Scale for rating behavioral characteristics of superior students: An invenstigation of factor structure. Journal of Special Education 8(2): 8-17.
BURT, C. 1955. The evidence for the concept of intelligence. British Journal of Educational Psychology 25: 158-177.
GEAR, H.H. 1975. Effect of training program on the teachers’ accuracy in the identification of the intellectually gifted children. Doctoral dissertation, University of Connecticut.
JENKINS, R.A. 1979. A Resource Guide to Preschool and Primary Programs for the Gifted and Talented. Mansfield Centre, CT: Creative Learning Press.
K EA TIN G , D.P. 1975. Intellectual Talent: Research and Development. Baltimore: Johns Hopkins University.
M A RTIN SON , R .A . and L .M . LESSINGER. 1960. Problems in identification of intellectually gifted pupils. Exceptional Children 26: 227-242.
PEGNATO, C . and J .W . B IR C H . 1959. Locating gifted children in junior schools: A comparison of methods. Exceptional Children 25: 300- 304.
RAVEN, J .C . 1965. Raven's Standard Progressive Matrices. London: H.K. Lewis.
R e n z u l l i , J.S. and R . H a r t m a n . 1971. Scale for rating behavioral characteristics of superior students. Exceptional Children 38: 243-248.
R e n z u l l i , J .S ., R . H a r t m a n and C .M . CALLAHAN. 1971. Teacher of superior children. Exceptional Children 38: 211-214.
R U ST, J.O . and B.D. LOSE. 1980. Screening for giftedness with Slosson and the scale rating behavioral characteristics of superior students. Psychology in the Schools 17: 446-451.
SO LOM ON, R . 1979. Identifying gifted children: A case study - some theoretical considerations. Journal of Application of Educational Studies 8(2): 2-7.
WECHSLER, D. 1974. Manual for the Wechsler Intelligence Scale for Children-Revised. New York: Psychological Corporation.
Y a r b o r o u g h , b . h . and R .A . J o h n s o n . 1983. Identifying the gifted: A theory-practice gap. The Gifted Child Quarterly 27: 135-138.
(Received 13 June 1995)
120 Pertanika J. Soc. Sci. & Hum. Vol. 4 No. 2, 1996
Pertanika J. Soc. Sci. & Hum. 4(2): 121-127 (1996)ISSN: 0128-7702
© Penerbit Universiti Pertanian Malaysia
Conflict Resolution Through Consensus Building: Experiences from the Dayak Iban Community of Sarawak, East Malaysia
JAYUM ANAK JAW AN Department of Social Development Studies
Faculty of Human Ecology Universiti Pertanian Malaysia
43400 Serdang, Selangor, Malaysia
Keywords: conflict, conflict resolution, conflict management, Dayak Iban, adat, rum ah panjai, tuai ru m a h , New Economic Policy, socioeconomic equality, socioeconomic justice
ABSTRAKM akalah ini b ertu juan m engkaji pengurusan dan penyelesaian konflik dengan m erujuk khasnya kepada m asyarakat D ayak Ib an di Saraw ak. Ia cuba m em bina hujah bahaw a konflik d ap a t d ikurangkan sekiranya m anusia d ap a t diasuh supaya m enerim a hakikat terhadap peranan m asing-m asing dalam susunan sosial m asyarakatnya. Konflik di kalangan orang D ayak Ib an adalah p ada paras m inim a kerana nilai sosiobudaya m asyarakat tersebut m enggalakkan saling pe rgan tungan di a n ta ra individual Iban. Seseorang yang m elanggar sebarang p e ra tu ran a tau norm a m asyarakat akan cepat diasing dan d im arah i sehingga w ujud perasaan sangat m alu akan tindakan salah itu. M engikut pengarang, penerim aan m asyarakat D ayak Ib an terhadap kedudukan dan peranan m asing-m asing dalam konteks sosial, ekonomi dan politik telah m em bantu m enjalinkan hubungan sosial yang harm oni, m em astikan keadilan ekonomi dan kestabilan politik. Di peringkat yang lebih tinggi, iaitu di peringkat m asyarakat M alaysia, penerim aan konsep keadilan dalam kontek yang difaham i m asyarakat D ayak Ib an inilah yang telah m enjam in bahaw a D asar Ekonomi Baru (DEB) diterim a um um dan berjaya m engagihkan kekayaan negara “sam a ra ta ” di kalangan m asyarakat pelbagai etnik di negara ini. D alam lain perkataan , pem bahagian faedah pertum buhan ekonomi m engam bilkira keperluan sesuatu etnik sebagaim ana keperluan ini ditaksirkan oleh gulungan pem erintah.
ABSTRACTThis paper examines conflict m anagem ent and resolution, focusing specifically on the D ayak Ib an society of Saraw ak. I t argues th a t conflicts can be substantially reduced if people are socialized to accept their respective roles in the socioeconomic and political structure of society. Conflicts am ong the com m unal I bans are kept to a bare m inim um because their sociocultural values prom ote harm onious in terdependence am ong individuals. Those who transgress the com m unity accepted norm s of behaviour are quickly ostracized, reprim anded and m ade to feel greatly asham ed. Ib an acceptance of their positions and roles w ithin the social, economic and political structure of society has helped to m aintain social harm ony, economic justice and political stability. O n a higher order, th at is in M alaysian society, it is the realization of this sense of justice th a t m ade the N E P acceptable and successful in allocating the benefits of economic grow th am ong the various ethnic groups in the country. In o ther words, each com m unity according to its needs as seen by political leaders.
INTRODUCTION
Conflicts abound in society because people are made to believe that they are equal. Certain religious doctrines argue that people, who are created in the images of his or her creator, are born equal. Building on this notion, m any political, social and economic doctrines are constructed with the view to either sustaining or glorifying this religious
concept of “ total equality” .C onflict arises because people have
unrealistic ambitions. They easily become envious of the successes of others. W hen they fail, they start searching for the faults in others. N aturally, they refuse to acknowledge any shortcomings that they themselves might have and which could have been the main reason for their failure.
Jayum Anak Jawan
The concept of equality is highly relative. This was, and to some extent still is, strongly acknowledged by members of the Dayak Iban community of Sarawak. This acknowledgement has in many ways helped to lessen conflicts and make their resolution much easier to achieve. This case study examines some fundamental values of the Sarawak Dayak Ibans that address conflicts and their resolution.
BACKGROUNDWho Are the Dayak Ibans?
Descendants of the famed headhunters of Borneo, Dayak Ibans were once a seafaring, adventurous, adaptable and highly mobile people. Historical accounts show that it was these spirits that led them to migrate from regions such as the Kapuas in Indonesian K alim antan to various parts of present-day Sarawak. Reasons for this migratory practice included: (1) their thirst for opening up of new land to settle; (2) their need to search for new fertile land on which to practise their shifting cultivation; and (3) their need to satisfy their urge to travel (bejalai)1 (Sandin 1967).
In contemporary Sarawak, Dayak Ibans presently num ber about 450,000, constituting therefore about 30% of the total state population (Annual Statistical Bulletin Sarawak (ASBS) 1988: 13). They are the largest indigenous group, followed by the Malays who constitu te abou t 21% , the D ayak Bidayuhs 8% , the M elanau 6% and the Dayak O rang Ulu 5% . Collectively, the indigenous groups are also referred to as b u m ip u te ra (sons of the soil) (Federal Constitution of M alaysia, Article 161 A). Chinese comprise the remaining 29%.
The majority of the Dayak Ibans live in longhouses in the far-flung rural areas of Sarawak, principally along the Rejang and the Saribas river banks. In 1980, about 95.2% of the Dayak Ibans were reported to be rural dwellers (Saraw ak 1983). T he
Literally “ to walk” . For a more detailed account of this Dayak Iban culture, see, for example, Kedit (1993); and for the review of Kedit’s book and the custom see Jaw an (1995).
majority of them continue to be found in the traditional Dayak Iban enclaves of the Saribas and Rejang river basins. Saribas is presently home to about 25% of the Dayak Ibans, while another 33% live in the Rejang basin (Annual Statistical Bulletin Sarawak 1988: 13).
The majority of the Dayak Ibans continue to rely on shifting cultivation as their principal means of livelihood. In 1960, about 98% of the Dayak Iban labour force were engaged in agriculture and agricu ltural- related activities. By 1970, the percentage of Dayak Ibans engaged in this sector had dropped to 94.8% and in 1980 to 88.2% (Annual Statistical Bulletin Sarawak 1970: 41; 1980: 18-19; 1984: 37-38).
Bilik-Family
The basic socioeconomic and political unit in Iban society is the bilik-family (Freem an 1970). A &z7{A>family usually comprises two or more generations living in the same family unit called a bilik2 (com partm ent). Generally, the Dayak Iban practise an extended family system. This customary practice is further sustained by m arriage tradition; m arried couples are encouraged to stay within the bridegroom ’s bilik-family before they start to form their own bilik-family.
The bilik-family is an im portant social, economic and political institution of the Dayak Ibans (Jawan 1991). First, it provides a Dayak Iban with a sense of identity. A person is not only born into a bilik-farmly from which he/she is descended [purih), but acquires from it an orientation with which to deal with the outside world.
Second, the bilik-family is an economic unit which helps to sustain family self- sufficiency. A high degree o f so lidarity between members of the extended family is only to be expected. Division of labour within the bilik-farmXy based on gender, age and physical ability is an accepted practice. There is nothing derogatory abou t defining or
2 Literally, “a room” ; but in this case, it refers to a family living compartment with sections for such activities as sleeping, dining and cooking.
122 Pertanika J. Soc. Sci. & Hum. Vol. 4 No. 2, 1996

Conflict Resolution Through Consensus Building: Experiences from the Dayak Iban Community of Sarawak
delineating activities based on such dichotomies as gender or age. Its acceptance has contributed to the m aintenance of a harm onious balance in the bilik-family, community and society. For example, the burning and felling of trees to clear land for farming is normally undertaken by men; certain jobs carried out during the farming cycle, such as clearing the shrubs, are usually left to the women and children; and the guarding of the rice fields and orchard farms is generally expected of elder members of the bilik-family.
Third, the bilik-family is a basic political institution in which there are well-ordered relations between its members. In the bilik- family, the elders are synonym ous w ith authority; this is further reinforced by the adat (the proper way of doing things; customs and traditions) which legitimizes relations, grants duties and prescribes obligations between members of the 6z7iA;-family. It is not generally expected that younger members of the bilik-fomily would openly go against the wishes or advice of their elders. O n the whole, younger m em bers o f a Az7z£-family are generally expected to seek and respect the advice and opinions of their elders.
LonghouseA longhouse (rumah panjai) is a series of bilik (family com partm ent) joined together to form a long house. T h e longhouse shares a common roof [perabong), a covered verandah (;ruai) and an open platform (tanju) which runs the length of the longhouse. T he ruai is a focal point of m any activities such as the holding of a harvest festival (gawai Dayak) and other festivities and the entertaining and receiving of visitors.
A longhouse can be as short as four or five doors and as long as forty doors.3 It is headed by a popularly elected4 headm an called a tuai rumah, who is usually m ale.5 In traditional
3 One door corresponds to one bilik or one bilik-family. Taking a modest average of about 7 persons (e.g. grandparents, parents and three children of the latter) per bilik, a longhouse of a modest length of 30 doors can easily comprise about 210 individuals.4 The equivalent term in Dayak Iban is dituduh ka bala maioh.5 However, in recent years (as early as the 1970s), womenhave ascended to the position.
Dayak Iban society, the headm an’s authority was non-formal because it was, unlike today, not backed by legitimate authority to enforce compliance. Nevertheless, a headm an still exercised considerable pow er because of several factors. F irst, he was popu larly elected. Second, his non-formal authority was, and still is, backed by adat which is revered by the Dayak Ibans.6 Thirdly, he always consulted other elders and relied upon precedents before passing judgem ents in any dispute hearing (betugong\baum). Fourth, he may also simultaneously hold other prestigious leadership positions which therefore enhance his standing as a headm an.7 Lastly, he has had the necessary dreams, which is an essential element of leadership in Dayak Iban society (Sandin 1962).
DAYAK IBAN CULTURE
Dayak Iban society has been described as classless and highly egalitarian (Freem an 1970). The com m unity was said to thrive on self-sufficiency through personifying high degrees of com petition, co-operation and individualism. U nderpinning all these values is the adat which justifies and legitimizes interactions based on them (Jawan 1991).
The adat is the single most im portant factor governing in teractions w ithin and between the tem poral and spiritual worlds. The adat deals with the proper ways of m aintaining balance in society. In this sense, it not only prescribes proper conduct between individual Dayak Ibans but also between them and their gods (petaras). Conflict is therefore seen as disturbing the balance, and hence its resolution m ust be swift and amicable to all parties concerned.
Although the longhouse is home to m any individualistic and highly competitive Dayak Ibans, conflicts are not as common as m ight
6 The position of the headman is now recognized by the government, from which he or she draws a specified yearly allowance. The authority of the headman is now backed by legislation, particularly as a result of the adoption of the Iban Adat 1993.7 In the Dayak Iban society, a person ascended to a position of leadership after having proven his worth in certain fields such as head-hunting (warleader [tuai kayau]) and in the opening up of new land (regional chief [tuai mubok menua]).
Pertanika J. Soc. Sci. & Hum. Vol. 4 No. 2, 1996 123
Jayum Anak Jawan
be expected. This is attributed to a num ber of reasons. First, although Dayak Ibans are highly egalitarian, they accept the fact that their society is classless and that people, to some extent, may be born equal. They also acknowledge that in reality people are not equally endowed and that their petaras are not the ju s t biblical God because, as their experiences teaches them, their petaras bestow favours on some and not on others. Thus, those who have received the blessing of the gods and who may have moved on to positions of authority are not to be envied. Instead, they should be listened to and respected.
Second, Dayak Ibans are taught to be respectful of their elders. It is persistently driven into the psyche of the Dayak Ibans that to go against their elders is to invite misfortune by being cursed (tulah). While going against elders may not eventually lead to m isfortune, the fear th a t this belief generates among potential delinquent siblings may be enough to at least prevent a disagreement developing into an open and explosive confrontation.
Lastly, Dayak Ibans detest conflicts, especially between members of the same At/iA-family. Those who engage in conflicts earn the label of “not conforming to the adat ways” (nadai adat). This brings great shame (malu) not only to the individuals involved, but also to their bilik-families, who are then seen as having failed in some way in the social upbringing of their offspring. The shame of not conforming to the adat ways is also a deterrent to conflicts between members of different iz7z£-families because those who engage in conflicts are seen as social outcasts unfit to be m em bers of the longhouse com m unity. A lthough D ayak Ibans are highly individualistic and mobile, there are relatively few recalcitrant members because leaving one longhouse community to join another would still mean having to subject themselves to similar social norms based on the adat.
Among the Dayak Ibans, conflict is seen as pervasive in nature. This is especially so as conflicts disturb the harmonious balance in society - between people and also between
people and nature. Thus, although a conflict may develop between two individuals or bilik -families, the consequences may affect the whole community.
CONFLICT MANAGEMENT
Conflict m anagem ent falls within the scope of the authority of the headm an {tuai rumah). In this respect, the role of a headm an is similar to that of an arb itra tor or a judge. As his authority in traditional Dayak Iban society was not backed by any formal authority to enforce compliance to his verdicts, a headm an’s personal qualities as a leader carried a strong bearing among his subjects. Among the recognized qualities or traits of a headman were an extensive knowledge of adat, im partiality and high morals and integrity.
Notwithstanding the above qualities or traits, adat alone was enough to ensure that the decisions of even the weakest of headmen would be complied with by his subjects. This is even more so now that a corpus of Iban adat (Iban Adat 1993) has been passed by the state legislative assembly, therefore making what was previously “adat law, customs and traditions” enforceable and backed by the authority of the state. However, compliance to a headm an’s informal authority has never been based on the force of the civil sanction. Its effectiveness was, and will continue to be, based on two im portant factors: (1) the element of shame felt by the individuals and their families; and (2) the fear of supernatural retribution that may befall the individuals, their families and their communities.
When disputes are lodged, a headm an first attem pts to give the disputing parties a cooling-off period. This is usually done by fixing a date for the arbitration conference (bertugong or bicara) some days after the complaint is first received. D uring this time, a headm an would make an effort to find out from the disputing parties if their differences could be settled am icably between them, instead of being brought out in an open arbitration conference. The main concern of a headm an is to prevent disputing parties from appearing in an open arbitration conference where all will be exposed and where tempers may flare. This would make future reconcilia
124 Pertanika J. Soc. Sci. & Hum. Vol. 4 No. 2, 1996

Conflict Resolution Through Consensus Building: Experiences from the Dayak Iban Community of Sarawak
tion between the disputing parties almost impossible to achieve. But if this effort fails, the pre-arranged arbitration conference is then held.
An open arbitration court is normally held in the evening immediately after dinner on the headm an’s section of the common or covered verandah (ruai). No prior notice is issued. Residents of the longhouse are only inform ed of, and invited to a ttend , the proposed conference m inutes before it is about to start. There is no restriction as to who can attend the open court.8
W hen all parties involved in the litigation have arrived, the proceedings begin with the headm an explain ing the purpose o f the conference. There are several ways in which a headm an may mediate or arb itra te disputes. As he already knows the nature of the dispute, a headm an may merely relate the facts of the dispute and then pronounce his/ her judgem ent. N either side is called to make or present its case and witnesses. The main argum ent behind this m ethod is to prevent “dirty linen being washed in public” and thereby reducing any chance the disputing parties m ight have to mend their differences. However, the effectiveness of this method depends a great deal on the personality of the headman. This method can be effectively used by a leader who is accomplished and therefore a highly respected and feared figure in the longhouse community.
Alternatively, the headm an may apply the “ fight-it-all-out” m ethod. In this ap proach, a headm an calls upon the plaintiff to present his/her case and to call testimonies of relevant witnesses. T he defendant is then given a chance to make a defence and to ^a ll witnesses. W hen all sides have been heard, the headm an considers the case, asks opinions of elders and other headm en who may be present and then pronounces his judgem ent.
W rongdoings usually fall into two cate
8 This has led a certain Dayak Iban scholar to erroneously conclude that there was absolute equality in the Dayak Iban society; for a critique of this view see Jaw an( 1992).9 In Western tradition, this specific role played by the headman is known as third-party intervention. Its success is highly dependent on the latter’s "... special skills and expertise..” (Hill 1982).
gories: (1) wrongful acts that are injurious to others; and (2) wrongful acts against nature (prohibitions or pemali). Disputes can involve either one or both elements. In respect of the first offence, resolution usually takes the form of a fine intended to be a deterren t to potential adat breakers. A lthough the fine is minimal in m onetary terms, the social stigma of having broken the adat law, customs and tradition is an act heavily frowned upon by members of the community. For the second offence, the fine (meri pemali) is m eant to restore the balance between the tem poral and spiritual worlds (nyelap ka menua [lit.: to cool the world]) that has been disturbed by the act of transgression (ngangat ka menua [lit.: to heat the w orld]). Resolutions of transgression against n a tu re m ay also require th a t a special ceremony be held in order to appease angered spirits and to seek their continued blessing and good fortune.
IMPLICATION AND APPLICATION
The im portant lesson of this Dayak Iban trad ition is th a t “ people m ust learn to acknowledge and appreciate their position in society. They must therefore act accordingly and should only make claims that are within their respective social status or positions. There are usually no less than about a hundred individuals in an average longhouse. H ow ever, co n tra ry to w hat this m ight suggest, conflict is not a common occurrence am ong these ind iv idua listic and highly competitive Dayak Ibans.
Among the egalitarian Dayak Ibans, equality is accepted and highly valued. But their perception of equality differs from the b ib lica l in te rp re ta tio n . In D ayak Ib a n society, it is accepted that people are not born equal. N either are Dayak Iban gods (petaras) just because they pick and choose mortals to be endowed with special abilities. According to the Dayak Iban religion, some are born destined for greatness; others are not. To the Dayak Ibans equality merely implies th a t there is no institutionalized restriction on opportunities within the socioculturally accepted sanctions. All may compete equally , b u t those who m ay have
Pertanika J. Soc. Sci. & Hum. Vol. 4 No. 2, 1996 125
Jayum Anak Jawan
received divine intervention are more likely to succeed than those who have not.
Conflicts em erge when people stake claims that are beyond what is generally perm itted to and expected of them. For example, it is unrealistic for all members of a hunting party to make equal claims to the division of the spoils as each member may have contributed differently to accomplishing the task. In this case, equality means dividing the spoils based on a person’s contribution and position in the activity (pedua badak, mit kelikit besai kelikai). Hence, a leader (and an organizer) of the hunting party may have contributed little to the actual work of catching the fish, but it is not expected that he will be given a smaller share. Instead, his share may be bigger than that of others by virtue of his position.
O n a larger scale, the success of m aintaining harmonious inter-ethnic relations at both the state and federal levels of government in M alaysia can be attributed to the promotion of a similar notion to the Dayak Iban concept of equality and justice. For example, in Sarawak, the practice of involving all major ethnic communities in running the state government has led to political stability and legitim acy. But when this practice is cast aside with the exclusion of the majority Dayak Ibans, the acceptability and popularity of the ruling party is put into question, as events surrounding the removal of Abdul R ahm an Yaakob in 1981 revealed and as shown by the diminishing popularity of the ruling coalition in 1987 when its majority was drastically reduced from the previous two-thirds to a three-seat majority.
In peninsular Malaysia, the exclusion of the Malays from the mainstream economic activities prom pted an ethnic upheaval and rethinking that led to the emergence of the New Economic Policy (NEP) to address this inequality. W ith the NEP came the redefinition of “ e q u a lity ” and socio-econom ic “justice” . U nder this policy, “ju st” distribution of the socioeconomic benefits of economic growth was defined in terms of the proportion of each ethnic group in the national population. Competition and equal access were still m aintained, but confined to each ethnic
quota of the national pie.In general, this policy has contributed
much to M alaysia’s post-1970s success in m aintaining a harmonious balance between its many competing ethnic groups. U ndoubtedly this policy’s success has been heavily dependent upon the ability of the M alaysian economy to expand, thereby ensuring that the allotted pie continued to grow large enough to satisfy all individuals within each ethnic community. In a way, the NEP also worked to reduce ambitious and unrealistic demands and counter-dem ands of one community on the others.
CONCLUSION
Conflicts and tensions can be contained if people are made to realize, accept and respect their respective positions in the social, economic and political structure of society. This is even more attainable in a society where the idea is strongly supported by its sociocultural values such as those of the Dayak Ibans because the acceptance of this hierarchy entails that one knows w hat is reasonably due to oneself and to others within the context of relative equality. To ensure the maintenance of stability and harm ony, any change to this situation must be coupled with, and sanctioned by, the changing sociocultural values of the community.
In Dayak Iban society, the resolution of conflict is not a “win-lose” or zero-sum game consideration, but a “win-win” or a variable sum game circum stance.10 This is where the acumen of a headm an is most needed to bring about fast and acceptable solutions.
In the M alaysian political context, the introduction of the NEP was the defining of the proportion of pie according to the social and political position and prominence of each respective community in the national population. It was the acceptance of this situation which also guaranteed a win-win situation for all ethnic communities that good inter-ethnic relations have flourished.
10 For discussion of zero sum or variable sum game, see Kriesberg (1956).
126 Pertanika J. Soc. Sci. & Hum. Vol. 4 No. 2, 1996
Conflict Resolution Through Consensus Building: Experiences from the Dayak Iban Community of Sarawak
REFERENCESFREEM AN, D. 1970. Iban Agriculture. London: Her
Majesty’s Stationery Office.
H IL L , B a r b a r a . 1982. An analysis of conflict resolution techniques. Journal of Conflict Resolution 26(1): 109-138.
IBAN Adat Law. 1993. Kuching: Government Printing Office.
JA W A N , JA Y U M . 1991. Political change and economic development among the Ibans of Sarawak, East Malaysia. Unpublished Ph.D. thesis, University of Hull.
JAW AN, JA Y U M . 1992. Between tradition and change: A re-examination of some fundamental assumptions about the Ibans. Borneo Research Bulletin 24: 24-32.
JAW AN, JA Y U M . 1995. Bejalai. Journal of the Malaysian Branch of the Royal Asiatic Society [in press].
K E D IT , PETER M U L O K . 1993. Iban Bejalai. Kuala Lumpur: Ampang Press for the Sarawak Literary Society.
KRIESBERG, LOUIS. 1956. Sociology o f Social Conflicts. New Jersey: Prentice-Hall.
Legal Research Board. 1989. Federal Constitution. K uala Lumpur: International Law Book Services.
SA N D IN , B E N E D IC T . 1962. Duabelas Bengkah Mimpin Tuai Dayak-Iban [T he Tw elve Dreams of Dayak Iban Leaders]. Kuching: Borneo Literature Bureau.
SANDIN, BENEDICT. 1967. The Sea Dqyaks of Borneo before White Rajah Rule. London: Macmillan.
SARAWAK. 1983. State Population Report, Sarawak. Kuching: Dept, of Statistics.
SARAW AK, Department of Statistics, (various issues). Annual Statistical Bulletin Sarawak. Kuching: Dept, of Statistics Malaysia (Sarawak Branch).
(Received 26 October 1994)
Pertanika J. Soc. Sci. & Hum. Vol. 4 No. 2, 1996 127
Pertanika J. Soc. Sci. & Hum. 4(2): 129-139 (1996)ISSN: 0128-7702
© Penerbit Universiti Pertanian Malaysia
General Problems Experienced by Elementary Classroom Teachers
ZULKIFLI A. MANAF Department of Pedagogy and Educational Psychology
Faculty of Education Universiti Malaya
50603 Kuala Lumpur, Malaysia
Keywords: teacher problems, elementary school teachers, teacher problem checklist, classroom-related problems
ABSTRAKK ajian ini m em bentangkan m asalah-m asalah um um yang biasa dialam i oleh guru sekolah rendah (n = 439) di salah sebuah negeri dalam d aerah M idwest, USA. M asalah ini d ilaporkan m elalui versi ringkas instrum en ‘T eacher Problem C hecklist’. L im a m asalah u tam a yang d ilaporkan berlaku dalam kajian ini ialah: (1) m asa tidak m encukupi un tuk m em buat persediaan m engajar; (2) m asa tidak m encukupi untuk m engajar dan juga untuk menilai dan m em perbaiki pengajaran; (3) m asa lapang yang sangat terhad; (4) m endapatkan pelajar supaya m enggunakan w aktu santai dengan baik dan; (5) m endapatkan pelajar supaya m ereka seronok belajar un tuk m endapatkan ilmu. L im a m asalah u tam a yang m enggusar jika ia berlaku adalah sam a juga dengan senarai m asalah yang dilaporkan itu.
ABSTRACTThis study presents the frequency and bothersomeness o f some general problem s of a sam ple of elem entary school teachers (n = 439) in a M idwest state, USA. T he problem s are from self-reports of teachers m easured using the abridged version of the teacher problem checklist. T he top five problem s of elem entary school teachers reported in the study are: (1) insufficient p reparation time; (2) insufficient time to teach and also to diagnose and evaluate teaching; (3) insufficient free time; (4) m otivating students to use their leisure time well, and (5) m otivating students to enjoy learning for its own sake. I t was also found th a t the same top five problems bothered all the teachers.
INTRODUCTION
Teacher problems have been studied since the early 1960s (D ropkin and T ay lo r 1963; C ruickshank and L eonard 1967; Cruick- shank et al. 1968; Cruickshank and Broad- bent 1968) and research interest in this area was sustained into the 1970s (Lee 1974; Cruickshank et al. 1974; Cruickshank and Myers 1975; Myers et al. 1975; Kennedy et al. 1976; Jalali 1978; H unter 1979) up to the 1980s (Cruickshank and Associates 1980; B ainer 1986; Zulkifli 1987) an d 1990s (Bainer 1993). T he phenom enon was studied not only in the U nited States, but was also well researched in other parts of the world (Veenman 1984).
Before looking at classroom-related teacher problems let us examine w hat constitutes
a problem in general, i.e. what is a problem? There are several possible definitions, including: (1) a question or situation that presents uncertainty, perplexity or difficulty (2) an expression of unm et need or unfulfilled goal (3) a problem arises when we w ant something and we cannot have it and (4) a problem exists when an organism, e.g. a teacher, is m otivated towards a goal and there is no ready way to achieve it. Some problems are more difficult than others and when we consider a problem to be difficult, or serious it is very likely that more than one element is involved. Teachers, like other people, are confronted by problems at their workplace. Cruickshank et al. (1980) pu t forward strong arguments for wanting to identify teacher problems in the workplace. These included:
/

Zulkifli A. Manaf
(1) trying to lessen the teacher burden and making them more productive and constructive in carrying out their duties; (2) the implications for the teacher training curriculum , i.e. teacher p repara tion should be geared to, or based on, teachers’ needs; and (3) unless classroom teachers are satisfied and happy, the increasing rate of teacher shortage will have detrim ental effects on the education of future generations.
A teacher problem is an example of goal response interference occurring during the course of a school-day. In order to understand teacher problems, it is essential to know teacher goals. Teacher goals come from two sources. First, teachers have the same common goals as all humans, sometimes referred to as general hum an needs. These are subdivided into two categories, physiological needs and socio-psychological needs. Physiological needs refer to the organism’s requirement for water, food and rest and so forth. Socio-psychological needs, on the other hand, are not inborn, but learned. These needs are acquired through the process of specialization. These learned needs - achievements, social approval, status and so forth - exhibit themselves in different forms and in different amounts in different individuals (Cruickshank and Associates 1980).
The second source of goals (Cruickshank and Associates 1980) arises when the individual takes on the role of a teacher and assumes role-derived needs. Here the person- as-teacher is expected, and usually expects, to behave in institutionally sanctioned ways. T hat is, assuming the role of teacher makes one behave toward students in ways demanded by the community or the teaching profession.
Teacher problems result as teachers try to meet both (1) their own hum an needs which are physiological or socio-psychological in nature and (2) role-derived needs that the job of teaching demands. It seems that most classroom-related problems result when persons assume the teacher role and must achieve goals that are completely new or for which they are unprepared or ill-prepared, such as in controlling and managing the classroom and motivating the students.
T heir inability to satisfy these needs makes them feel alienated, discontented and frustrated. If this is allowed to accum ulate over the years there is a tendency for teachers to become dissatisfied with their job and leave the profession in favour of another job, or opt for early retirement.
Classroom-related teacher problems arise when teachers are unable to achieve their goals or fulfil w hat they w ant to do in their workplace. For example, a certain teacher is highly motivated to teach a class in a mid-city school where the students are not interested in learning and other teachers are not en thusiastic to teach this class because of the students’ backgrounds. T he students are apathetic towards their education and nothing will motivate them to learn because most teachers expect them to fail. O ut of special love and concern for the welfare and future of these students, the teacher goes all the way to reach out to these students. He wants them to learn and feel successful not only in school but also in later life. Even though repeated attem pts are made to change their a ttitude to encourage them to com e to school regularly, and behave appropriately in class, the teacher’s effort is futile. W hen he visits their parents he is told to mind his own business. The teacher gets very frustrated because he is unable to let go of this desire to help his students.
In an o th er case, a teach er is very enthusiastic in her work. She holds m any positions in the school and she is also very active in the P arent-T eacher Association besides other community services. Because of these commitments and burgeoning paperwork in the teaching profession she is not able to cope up with her daily routine. She gets very tense and is sometimes unable to relate very well with her colleagues and students. She feels she is not doing a good job and feels unappreciated . She is often seen in the cafeteria eating alone during recess. These are just two vignettes of a ‘slice of life’ from the classroom and some of the re la ted problems experienced by teachers in their workplace.
According to Cruickshank and Associates (1980) teacher problems can be grouped into
130 Pertanika J. Soc. Sci. & Hum. Vol. 4 No. 2, 1996

General Problems Experienced by Elementary Classroom Teachers
five categories: (1) affiliation; (2) control; (3) good parent relationships and understanding home conditions; (4) student success; and (5) time.
These five categories or factors were derived through factor analysis. The factors identified and the various items that load on them were later interpreted and presented as a teacher problem model based on the relationship am ong the items and the factors that underlie the relationship. This model was draw n up using the conventional path diagram and was the basis of the teacher problem validation studies (Zulkifli 1987; Zulkifli and Loadm an [in progress]).
According to Cruickshank and Myers (1975), there is a common assertion that if you can find out w hat teachers’ problems are, you have gained enormously valuable insight into their world and are in a position to help them at some level to consider and thus accept, reduce, or eliminate those problems.
Teacher problems are real and will not go away with the accum ulation of teaching experience. I f these problems are extremely bothersome they will affect teachers’ performance and job satisfaction (Engelking 1986; Leslie 1989). In addition to that, problems in the workplace or ‘environm ental stressors’ and job dissatisfaction contribute to stress and teacher burnout (Gold et al. 1992). Environmental stressors are a collection of stressors inherent in schools over which teachers have very little control. As such, the stage is set for job-related stress when involvement in work is high (as in teaching) but feelings of control or power in the work setting are limited (French1993).
According to W angberg (1984), teacher stress is not a simple issue. A review of the literature on teacher stress and dissatisfaction included m any areas of concern, including poor working conditions, excessive paperwork, poor relationships with others in the workplace setting and loss of control over what happens with one’s classroom. Several items from the ‘affiliation’ category of the original instrum ent used in this study purport to measure this problem. Lack of affiliation or alienation also results from the sense of
isolation that m any teachers seem to experience. In a study of British teachers (Newell 1980) it was concluded that teachers with problems see themselves as different from others and think they alone are having problems. As a result they internalize their difficulties or problems rather than seeking aid or a solution. This is an unhealthy situation and should be looked into by teacher educators and teacher education policy-makers.
In the push for excellence in education, adm inistrators may forget that dissatisfied teachers can weaken the educational programme. Engelking (1986) identified significant dissatisfaction factors am ong teachers as ’relations with student and parents’, ‘lack of achievement by students or teachers’ and ‘communication with adm inistrators’. This aspect is also measured by some items in the instrum ent of the current study. Examples of such items are: ‘establishing good relations with parents and understanding home conditions’, ‘holding worthwhile conferences with p a ren ts’, ‘getting my students to enjoy learn ing for its own sake’, ‘overcom ing anxieties related to being supervised’, ‘understanding and helping the atypical or special child’ and ‘helping my students to know and accept themselves as they are’. Being aware of the exodus of teachers from the teaching profession through early and /o r optional retirem ent and realizing the im portance of keeping teachers happy and satisfied in their workplace, this study seeks to identify some of the m ajor classroom -related problem s of elementary school teachers.
Sometimes a problem may occur frequently but it may not bother the teacher at all. O n the other hand, some problems may occur less frequently but are bothersome.
A bothersom e prob lem is one th a t produces a significant im pact on the teach e r’s em otions and m ay linger in the teacher’s life longer than other problems which are less bothersome. In this study, the researcher will identify not only the most frequent common problems of elementary classroom teachers but also identify the most bothersome ones.
Pertanika J. Soc. Sci. & Hum. Vol. 4 No. 2, 1996 131
Zulkifli A. Manaf
RESEARCH QUESTIONS
The research questions in this investigation are:1. W hat are some common problems of
elementary school teachers?2. Which problems are the most bother
some?3. W hat factors underlie all these pro
blems?
METHOD
A survey of a sample of elementary school teachers in a Midwest state was carried out. A cluster sampling of classroom teachers was done using schools as the cluster. A systematic random sampling of 60 schools in local, city and exempted village school districts were selected to participate in this study. Every tenth school from the list provided by the State Education Directory was selected until 60 schools were selected. A total of 439 teachers from 51 schools participated in this study. This represented a 39% return rate for the teachers and 85% response rate for the schools. The sample was representative of the population of elementary school teachers in the sampling framework in terms of school districts and sex ratio of teachers.
INSTRUMENTATION
In the current study, the teacher problems investigated are self reports of a sample of elementary school teachers surveyed using an abridged version of the teacher problem checklist (T P C ) w hich was developed through exploratory and confirmatory factor analysis (Zulkifli 1987). This instrum ent was adapted from the original version used in the Bainer (1986) teacher problem study. The abridged version with two scales had 40 items. A list of these forty items is presented in Table 1.
Several items in the teacher problem checklist (TPC) specifically m easure the problem related to stress. One such item is, ‘O vercom ing anxieties re la ted to being supervised’. The concern with stress stems from m ounting evidence that stress may significantly im pair teachers’ ability to dis
play effective instructional behaviour and good working relationships with students. A nother item in the T PC , ‘G etting the understanding and sustenance of adm inistrators and other teachers so that I can be efficient and feel professional’ purports to measure problems related to stress. T he two subscales employed in the teacher problem checklist were called ‘Frequency’ and ‘Bothersomeness’. The problem statements or items were listed in a central column with the ^Frequency’ of the problem placed on the left- hand side of the page and ‘Bothersomeness’ of the problem on the right-hand side. The problem statements were rated in terms of frequency of occurrence and degree of bothersomeness. Respondents had to rate each of the problem statements presented on a scale of 1 (lowest-never) to 5 (highest- always) on the frequency of the problems and 1 (lowest-not at all) to 5 (highest-extremely) on the bothersom eness o f each o f the problems presented. The dimensions of the problems are measured in two ways, i.e. in terms of their frequency and bothersomeness. T he frequency of the problem subscale indicates how often the problem occurs to the teacher while the bothersomeness subscale indicates how bothersome the problem is to the teacher. Some problem s m ay occur frequently but do not bother the teacher at all. However, some problems may occur less frequently but bother them tremendously, and different individuals have d ifferent degrees of tolerance of these bothersom e problems. In addition, there were 19 dem ographic questions regarding the teachers’ and schools’ background and the teachers’ level of satisfaction with their teacher preparation program me, teaching in general and the school in which they were currently teaching. This instrum ent was developed through exploratory and confirmatory factor analysis and had both construct and concurren t validity (Zulkifli 1987). The internal consistencies of the items of both scales ranged from 0.71 to 0.90. This indicates an acceptable level of reliability of the abridged version of the TPC used in this study.
132 Pertanika J. Soc. Sci. & Hum. Vol. 4 No. 2, 1996
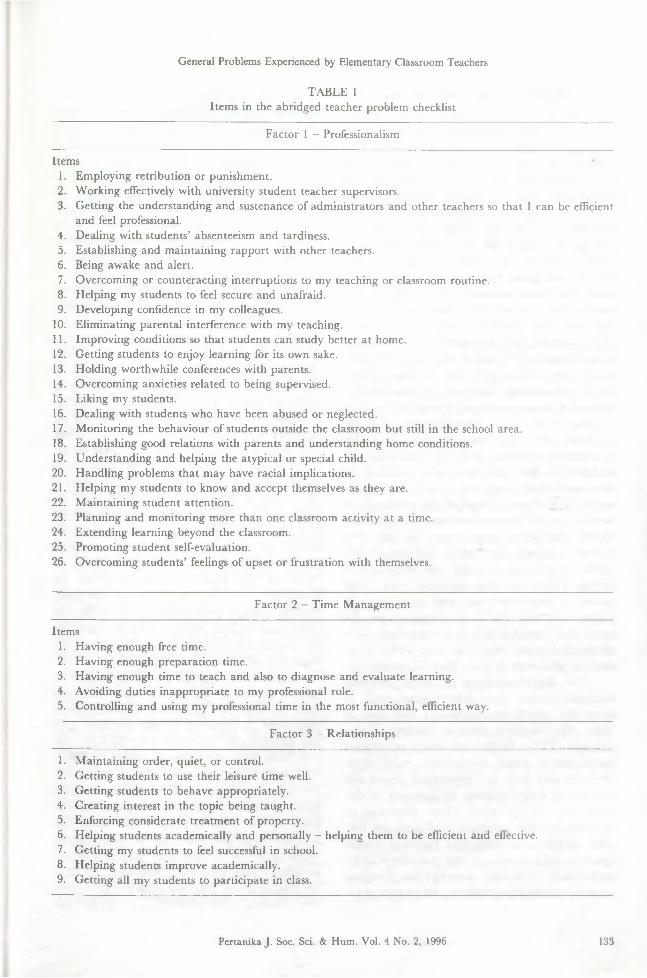
General Problems Experienced by Elementary Classroom Teachers
T A B L E 1Items in the abridged teacher problem checklist
Factor 1 - Professionalism
Items1. Employing retribution or punishment.2. Working effectively with university student teacher supervisors.3. Getting the understanding and sustenance of administrators and other teachers so that I can be efficient
and feel professional.4. Dealing with students’ absenteeism and tardiness.5. Establishing and maintaining rapport with other teachers.6. Being awake and alert.7. Overcoming or counteracting interruptions to my teaching or classroom routine.8. Helping my students to feel secure and unafraid.9. Developing confidence in my colleagues.
10. Eliminating parental interference with my teaching.11. Improving conditions so that students can study better at home.12. Getting students to enjoy learning for its own sake.13. Holding worthwhile conferences with parents.14. Overcoming anxieties related to being supervised.15. Liking my students.16. Dealing with students who have been abused or neglected.17. Monitoring the behaviour of students outside the classroom but still in the school area.18. Establishing good relations with parents and understanding home conditions.19. Understanding and helping the atypical or special child.20. Handling problems that may have racial implications.21. Helping my students to know and accept themselves as they are.22. Maintaining student attention.23. Planning and monitoring more than one classroom activity at a time.24. Extending learning beyond the classroom.25. Promoting student self-evaluation.26. Overcoming students’ feelings of upset or frustration with themselves.
Factor 2 - Time Management
Items1. Having enough free time.2. Having enough preparation time.3. Having enough time to teach and also to diagnose and evaluate learning.4. Avoiding duties inappropriate to my professional role.5. Controlling and using my professional time in the most functional, efficient way.
Factor 3 - Relationships
1. Maintaining order, quiet, or control.2. Getting students to use their leisure time well.3. Getting students to behave appropriately.4. Creating interest in the topic being taught.5. Enforcing considerate treatment of property.6. Helping students academically and personally - helping them to be efficient and effective.7. Getting my students to feel successful in school.8. Helping students improve academically.9. Getting all my students to participate in class.
Pertanika J. Soc. Sci. & Hum. Vol. 4 No. 2, 1996 133
Zulkifli A. Manaf
RESULTS AND DISCUSSION
The results of the data analysis presented an ordered list of the classroom related problems and the problems that were bothersome. In general, the top five problems reported to occur frequently were: (1) having enough preparation time; (2) having enough time to teach and also to diagnose and evaluate teaching; (3) having enough free time; (4) getting students to use their leisure time well; and (5) getting my students to enjoy learning for its own sake. The top three items come from the “ time m anagem ent” factor of the instrument, and were from the ‘time’ factor of the o rig ina l teach er p rob lem checklist (Cruickshank and Associates 1980). Time is a finite commodity and in the classroom time is a major problem with most teachers. There is an increasing am oun t o f paperw ork, clerical and non-teaching duties expected of teachers so they have been deprived of much valuable time that could be used for more productive teaching and the evaluation of learning in the classroom. This problem of time constraint is also mentioned in a recent study in Malaysia regarding the problems of teachers in the implementation of the school- based evaluation program m e in the new prim ary school curriculum (Mohd. Yasin1994). It was reported that the frequency of testing (35 times per academic year) and incessant record-keeping and paperwork is taking too much of their professional time. As a result of this problem many teachers were dissatisfied with their job, especially those with large classes of more than 35 students.
T he fourth-ranking problem ‘getting students to use their leisure time welP is from the ‘relationships’ factor; this item is from the ‘student success’ factor of the original TPC. Dedicated teachers always strive for a good relationship with their students and they are concerned about the welfare of their students in and out of the classroom. They w ant their students to succeed in their academic and personal life. The inability to fulfil this function makes teachjers feel inadequate and perceive it to be problematic. The fifth-ranking item, ‘Getting my students to enjoy learning for its own sake’
comes from the ‘professionalism’ factor identified in the current study. O ne of the virtues of professionals is the desire to provide sincere services to their clients. Getting students to learn something for its own sake is a big problem for many teachers because students perceive learning as preparation only for examinations. Teachers who are successful (no problem) in this aspect tend to have students who learn not only for examination purposes but also to continually seek knowledge for the love of it.
On the whole, the top five problems bothersome to the teachers in the study were the same. The correlations of the scores on the ‘Frequency’ and ‘Bothersomeness’ scales were quite high, ranging from .48 to .77. It was also observed that the mean of the items in the bothersomeness scales was always higher than the means of the frequency scale. W hat it implied is that most problems bothered the teachers very much whenever they occurred. The results of this study were similar to the trend found in the Bainer (1986) study. The means, standard deviations and rank order of the problems that occur frequently and the problems that were bothersome are presented in Table 2. The minimum value recorded for each of the problems was 1 and the m aximum was 5 in both scales of the instrum ent. However, the highest mean value for the frequency scale was recorded for the item, ‘having enough preparation time’ (3.92). As mentioned earlier, the mean for the items on the bothersomeness scale was higher (4.15) than that of the frequency scale.
Separate analyses of the subsamples from urban, suburban and rural areas indicated that the top five problems occurring most frequently as reported by the teachers were not significantly different. This finding concurs with that of Cruickshank et al. (1968). However, the top five problems that bothered the suburban and rural elem entary school teachers were a little different from those of their u rban counterparts. T he suburban teachers reported problems of ‘m aintaining order, quiet, or control’ and ‘getting students to behave appropriately’. However, the fifth- ranking problem that bothered rural teachers was ‘dealing with students who have been
134 Pertanika J. Soc. Sci. & Hum. Vol. 4 No. 2, 1996
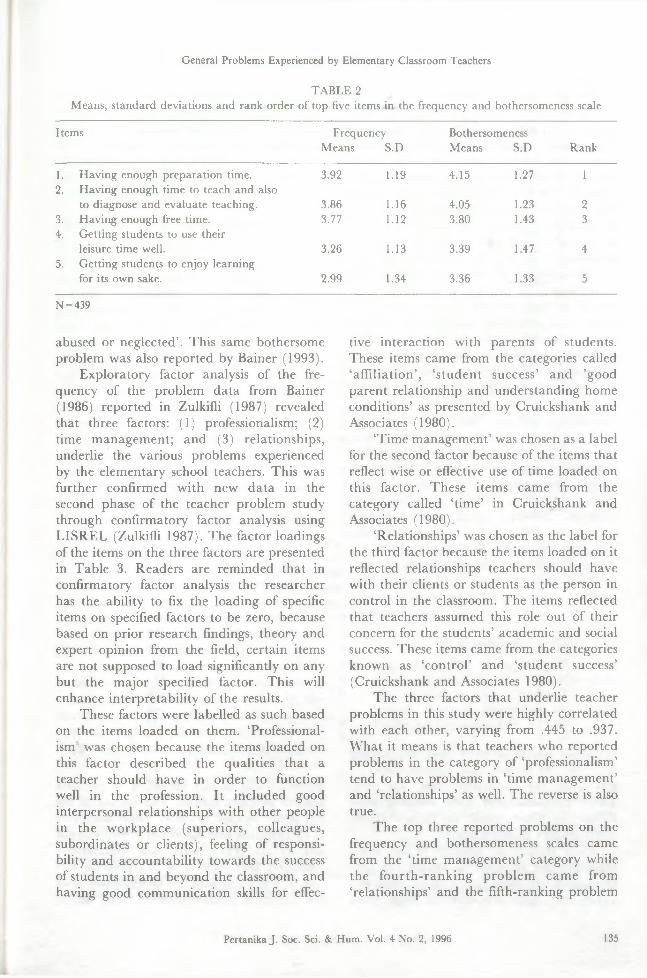
General Problems Experienced by Elementary Classroom Teachers
T A B L E 2Means, standard deviations and rank order of top five items in the frequency and bothersomeness scale
Items Frequency Means S.D
Bothersomeness Means S.D Rank
1. Having enough preparation time. 3.92 1.19 4.15 1.27 12. Having enough time to teach and also
to diagnose and evaluate teaching. 3.86 1.16 4.05 1.23 23. Having enough free time. 3.77 1.12 3.80 1.43 34. Getting students to use their
leisure time well. 3.26 1.13 3.39 1.47 45. Getting students to enjoy learning
for its own sake. 2.99 1.34 3.36 1.33 5
N = 439
abused or neglected’. This same bothersome problem was also reported by Bainer (1993).
Exploratory factor analysis of the frequency of the problem data from Bainer (1986) reported in Zulkifli (1987) revealed that three factors: (1) professionalism; (2) time m anagem ent; and (3) relationships, underlie the various problems experienced by the elem entary school teachers. This was further confirmed w ith new d ata in the second phase of the teacher problem study through confirmatory factor analysis using LISREL (Zulkifli 1987). The factor loadings of the items on the three factors are presented in Table 3. Readers are rem inded that in confirmatory factor analysis the researcher has the ability to fix the loading of specific items on specified factors to be zero, because based on prior research findings, theory and expert opinion from the field, certain items are not supposed to load significantly on any but the m ajor specified factor. This will enhance interpretability of the results.
These factors were labelled as such based on the items loaded on them. ‘Professionalism was chosen because the items loaded on this factor described the qualities that a teacher should have in order to function well in the profession. It included good interpersonal relationships with other people in the w orkplace (superiors, colleagues, subordinates or clients), feeling of responsibility and accountability towards the success of students in and beyond the classroom, and having good com m unication skills for effec
tive interaction with parents of students. These items came from the categories called ‘affilia tion’, ‘s tuden t success’ and ’good parent relationship and understanding home conditions’ as presented by Cruickshank and Associates (1980).
‘Tim e m anagem ent’ was chosen as a label for the second factor because of the items that reflect wise or effective use of time loaded on this factor. These items came from the category called ‘tim e’ in Cruickshank and Associates (1980).
‘Relationships’ was chosen as the label for the third factor because the items loaded on it reflected relationships teachers should have with their clients or students as the person in control in the classroom. The items reflected that teachers assumed this role out of their concern for the students’ academic and social success. These items came from the categories known as ‘control’ and ‘student success’ (Cruickshank and Associates 1980).
The three factors that underlie teacher problems in this study were highly correlated with each other, varying from .445 to .937. W hat it means is that teachers who reported problems in the category of ‘professionalism’ tend to have problems in ‘time m anagem ent’ and ‘relationships’ as well. The reverse is also true.
The top three reported problems on the frequency and bothersomeness scales came from the ‘time m anagem ent’ category while the fo u rth -ran k in g problem cam e from ‘relationships’ and the fifth-ranking problem
Pertanika J. Soc. Sci. & Hum. Vol. 4 No. 2, 1996 135

Zulkifli A. Manaf
TABLE 3Factor loading of items in the instrument
Items Professionalism Time Management Relationship
1. .2662. .4493. .1614. .2945. .5406. .5417. .2458. .2799. .496
10. .51411. .39912. .63413. .39614. .51515. .33316. .61517. .49318. .35319. .45920. .57721. .57922. .50323. .62524. .32425. .60626. .50527. 028. 029. 030. 031. 032. 033. 034. 035. 036. 037. 038. 039. 040. 0
was from the ‘professionalism ’ category. These problems and their ranking were similar to those found in Bainer (1986, 1993) teacher problem studies.
Even though the findings of this study explained the relationship among the problems with only three factors, its meaning and significance were not different from those
0 U0 00 00 00 00 00 00 00 00 00 00 00 00 00 41 00 00 00 00 00 00 00 00 00 00 00 0.679 0.721 0.682 0.413 0.399 00 .4490 .5520 .6350 .5480 .6160 .6060 .6890 .7330 .715
problems and factors identified in previous teacher problem studies. T he essence of the five-factor teacher problem model suggested in Cruickshank and Associates (1980) was not lost a t all. T hey were ju st sum m arized succinctly into three new interpretable factors. If a phenomenon can be explained in as few factors as possible without losing signifi
136 Pertanika J. Soc. Sci. & Hum. Vol. 4 No. 2, 1996
General Problems Experienced by Elementary Classroom Teachers
cant information then it should be the model of choice. Every researcher has his or her idiosyncratic way of labelling factors based on their in terp re ta tions and this should be acceptable as long as it does not deviate too much from the ideas and knowledge already established and known in the field.
SUMMARY AND RECOMMENDATIONS
Teacher problems are real and numerous. However the problem s th a t occur most frequently as reported by teachers in the cu rren t study were: (1) having enough preparation time; (2) having enough time to teach and also to diagnose and evaluate teaching; (3) having enough free time; (4) getting students to use their leisure time well; and (5) getting students to enjoy learning for its own sake. These problems were also the most bothersome. In this study the results showed that there is a strong relationship between the responses on the frequency scale and the responses on the bothersomeness scale. Generally speaking, if the problem occurs frequently, then the problem is more likely to bother the teacher.
Even though there are numerous classroom-related problems experienced by teachers, these problems are interrelated and can be classified into three m ajor underlying factors categories: (1) professionalism; (2) time m anagem ent; and (3) relationships. These problem categories or factors have been identified and confirmed through exploratory and confirmatory factor analysis.
Teacher problems exist, and steps must be taken to look into this phenom enon in order to help teachers stay satisfied in the workplace. Knowing their problems should help curricu lum planners to incorporate courses in future teacher education p rogrammes to help teachers deal with these problems. Courses or workshops for future teachers on topics such as ‘time m anagem ent’, ‘professionalism’ and ‘relationships’ are examples of ways to help them cope in the w orkplace. T each e r education p ro grammes have been criticized for not p reparing teachers based on their needs in the workplace (Smith et al. 1969; Smith 1980)
and that most teacher education programmes were designed to ca te r to teachers in suburban areas (Bainer 1993). Classroom related teacher problems exist and cannot be ignored. They affect teacher performance and job satisfaction and contribute to teacher stress and burnout (Gold et al. 1992). Teacher educators need to be sensitive to this issue and make a conscious effort to try to eliminate or reduce these problem s. R estructu ring or refining the courses in teacher preparation programmes to prepare them realistically for their workplace is one way to help alleviate the p rob lem . As B ainer (1993) no ted , teachers in different school localities have differen t kinds o f p roblem s and unless teachers are trained to prepare themselves for various kinds of work environm ent, new teachers will find themselves struggling to cope with the challenge of the workplace. This is because most teacher preparation programmes prepare teachers for the general and ideal school situation that usually fits the description of a suburban upper-m iddle class neighbourhoods. New teachers will experience problem s if they are placed in a workplace environm ent very different from what they expect.
Teacher trainees should be exposed to at least a sim ulation o f the various work environments they could be faced with to prevent culture shock on the first day of the teaching assignment.
REFERENCESB A IN ER , D.L. 1986. Perceived problems of
elementary school teachers related to grade level, teaching experience, and student background, Doctoral dissertation, Ohio State University, Columbus, OH.
BAINER, D.L. 1993. Problems of rural elementary school teachers. Rural Educator 14: 1-3.
C r u i c k s h a n k , D.R. and F.w. B r o a d b e n t . 1968. The simulation and analysis of problems of beginning teachers. (ERIC Document Reproduction Service No. ED 024 637).
CRU IC K SH A N K , D.R. and J . LEO NARD 1967. The identification and analysis of perceived problems of teachers in inner-city schools.
Pertanika J. Soc. Sci. & Hum. Vol. 4 No. 2, 1996 137

Zulkifli A. Manaf
(ERIC Document Reproduction Service No. ED 026 335).
C R U IC K S H A N K , D R ., J .J . K E N N E D Y , J . LEONARD and R. T H U R M A N . 1968. Perceived problems of teachers in schools serving rural disadvantaged populations: A comparison with problems reported by inner-city teachers. (ERIC Document Reproduction Service No. ED 127 986).
C RUICK SHA NK, D.R. and B. M YERS. 1975. A brief review of studies of problems of teachers conducted by Donald R. Cruickshank with others with particular attention to instrument development. (ERIC Document Reproduction Service No. ED 117 068).
CRUICK SHA NK, D.R. and ASSOCIATES. 1980. Teaching is Tough. Englewood Cliffs, NJ: Prentice Hall.
DROPKIN, S. and M. TAYLOR. 1963. Perceived problems of beginning teachers and related factors. Journal of Teacher Education. 14(4): 384- 390.
ENGELKING, J.L . 1986. Teacher job satisfaction and dissatisfaction. Spectrum 4(1): 33-38.
FRENCH , N.K. 1993. Elementary teacher stress and class size. Journal o f Research and Development 26(2): 66-73.
G o ld , y ., R.A. R o th , C.R. W r ig h t , w .b . MICHAEL and C. CHEN. 1992. The factor validity of a teacher burnout measure (educators survey) administered to a sample of beginning teachers in elementary and secondary schools in California. Educational and Psychological Measurement 52(3): 761-768.
HUNTER, P.I. 1979. A study of the perceived problems of kindergarten and first grade teachers in relation to grade level, educational experience, teaching experience, and age range. Doctoral dissertation, Ohio State University, Columbus, OH.
JA LA LI, A. 1978. An exploration of the relationship between teacher’s attitude and their perception of classroom problems as a possible means for screening and selecting teacher-counselors. Doctoral dissertation, George Peabody College for Teachers.
K EN N ED Y , J ., D.R. C R U IC K SH A N K and B. M YERS. 1976. Problems of beginning secondary teachers with respect to school location. Journal of Educational Research 69: 167-172.
LEE, C.S. 1974. An investigation of the frequency, bothersomeness, and seriousness of classroom problems as perceived by first and fifth year secondary teachers. Doctoral dissertation, University of South Carolina.
LESLIE, K. 1989. Administrators must consider and improve teacher satisfaction. NASSP Bulletin 73(513): 44-48.
M O H D . YASSIN HJ. ISM AIL. 1994. Masalah guru sekolah rendah dalam pelaksanaan penilaian kemajuan berasaskan sekolah (PKBS) bagi m atapelajaran alam dan manusia tahun empat. Laporan praktikum yang tidak diter- bitkan, Universiti Malaya.
M YERS, B .M ., D.R. CRU IC K SH A N K and J.J. KENNEDY. 1975. Problems of teachers graduated from the Ohio State University as teacher education curriculum indicators. Columbus, Ohio: College of Education, Ohio State University.
MYERS, B.M. 1975. An empirical investigation of the relationship of teacher perceived problems to teacher personality variables and social demographic variables. Doctoral dissertation, Ohio State University, Columbus, OH.
NEW ELL, R. 1980. Teacher stress warnings: Teaching may be hazardous to your health. American Teaching 16-17.
SMITH, B.O., S.B. COHEN and A. PEARL. 1969. Teachers for the Real World. Washington, D.C.: American Association of Colleges for Teacher Education.
SMITH, B.O. 1980. A Design for a School of Pedagogy. Washington, D.C: U.S. D epartment of Education.
V EEN M A N , S. 1985. Perceived problems of beginning teachers. Review of Educational Research 54(2): 143-178.
WANGBERG, E.G. 1984. The complex issue of teacher stress and job satisfaction. Contemporary Education 56( 1): 11-15.
138 Pertanika J. Soc. Sci. & Hum. Vol. 4 No. 2, 1996
General Problems Experienced by Elementary Classroom Teachers
ZULKIFLI A. MANAF. 1987. A validation study of classroom related problems of elementary school teachers using a shorter version of the teacher problem checklist. Doctoral dissertation, Ohio State University, Columbus, OH.
ZULKIFLI A. MANAF and W.E. LOADMAN [In progress]. The validation of a teacher problem model.
(Received 29 April 1994)
Pertanika J. Soc. Sci. & Hum. Vol. 4 No. 2, 1996 139
Pertanika J. Soc. Sci. & Hum. 4(2): 141-146 (1996)ISSN: 0128-7702
© Penerbit Universiti Pertanian Malaysia
The Use of English by Malaysian Business Executives in the Commercial Sector
SHARON GOH SENG PANG and CHAN SWEE HENG Department of English Language
Faculty of Moden Language Studies Universiti Pertanian Malaysia
43400 UPM , Serdang, Selangor, Malaysia
Keywords: English for Specific Purposes, needs analysis, business executives, importance and extent o f the use o f English, English skills and sub-skills
ABSTRAKK ajian ini adalah sebahagian d a rip ad a kajian yang luas ten tang isu penting dan penataran penggunaan bahasa Inggeris dalam ekonomi M alaysia. W alaupun bahasa Inggeris sering d iperkatakan sebagai bahasa yang penting, tetapi kajian yang m endalam tidak d iusahakan un tuk m enyokong dan m em beri hura ian ten tang situasi ini. K ajian yang dijalankan ini m eram pilkan m aklum at berdasarkan tanggapan eksekutif perniagaan yang m enggunakan bahasa Inggeris dalam dunia pekerjaan mereka. D ata yang diperolehi m em perm antap hakikat pentingnya penggunaan bahasa Inggeris di tem pat kerja komersial. Secara am, eksekutif peniagaan m enunjukkan keyakinan dalam penggunaan bahasa Inggeris. Ini berm akna bahaw a bakal pekerja-pekerja m estilah ju g a m em punyai penguasaan bahasa Inggeris untuk diterim a m asuk ke dalam pasaran dalam sektor komersial. K ekerapan sub kem ahiran bahasa yang tertinggi yang d igunakan ialah: kem ahiran m endengar perbualan sosial dalam perniagaan, kem ahiran b e rtu tu r yang m elibatkan penggunaan telefon, m em baca dan menulis surat dan m emo pern iagaan yang lazim. D ari segi u ru tan kepentingan, kem ahiran b e rtu tu r m enduduki tangga teratas. K epentingan kem ahiran b e rtu tu r yang d itunjukkan dalam kajian ini m em buktikan bahaw a kejayaan dalam profesional m em punyai kaitan yang rap a t dengan keupayaan b e rtu tu r dengan baik. M atlum at ini m em punyai implikasi yang m endalam kepada program pendidikan dan latihan.
ABSTRACTThis study is p a rt o f a larger survey on the issue of the im portance and extent of the use of the English language in the M alaysian economy. W hile the use of English has often been said to be im portan t, large-scale studies to support and to provide details about the situation are lacking. This present study presents inform ation from the perspective of business executives who use the English language in their jobs. T he da ta obtained confirm the im portance o f the use of the English language in the com m ercial work-place. T he business executives claim to have confidence in the use o f the language. T hus potential employees m ust also achieve a level of proficiency th at would enable them to use the^anguage confidently and efficiently. T he most frequent language sub-skills used are: listening to social conversations in business, speaking on the telephone, reading and w riting routine letters and memos. In term s of order o f im portance, speaking was ranked the highest. This a ttachm en t of im portance to speaking suggests th a t jo b success is very m uch related to the ability to speak well. This inform ation would have deep im plications for education and training program m es.
INTRODUCTION 158 undergraduates from the Faculty ofThis study complements an earlier study Economics and M anagem ent, U PM who did ca rried o u t by the researchers on the their practical training in these companies, importance and extent of the use of English These companies, therefore, represented po- in the commercial sector of the M alaysian tential employers in the commercial sector economy (Goh and C han 1993). In the earlier and the undergraduates, potential employees, study, the focus was on 197 companies and It was felt that another survey was needed on

Sharon Goh Seng Pang and Chan Swee Heng
the use of English by business executives currently employed by those companies. It was deemed im portant to investigate the target situation so as to obtain the necessary information to validate the data on language use of the potential employees. This information would indicate firmly the target requirements and facilitate efforts to prepare the learning of the appropriate dimensions in language use in business situations (Adams- Smith 1986).
Thus, this study provides the link and bridges the gap of prediction and actualization in the tripartite connection of potential employers, potential employees and actual employees in the various commercial enterprises. This survey was funded by Universiti Pertanian M alaysia (UPM ) and assisted by the British Council Language Centre, K uala Lumpur.
METHODOLOGY
The questionnaire survey method was used to obtain the data for the study. Questionnaires were mailed to 197 companies throughout M alaysia (see Appendices A and B ). These companies, which were the practical training centres for UPM undergraduates from the Faculty of Economics and M anagem ent, were requested to return one or more copies of the questionnaire received. The questionnaires were filled in by business executives in the companies and a total of 187 copies were collected. The data yielded information on the use and need for on-job skills of the business executives in the English language. The data contribute to the field of research in English for Specific Purposes (ESP) where needs analysis forms a crucial approach for the collection of information (Robinson 1991) and provides guidelines for ESP syllabus design (Riddell 1993).
An attem pt was made to classify the nature of the business carried out by the companies in order to have a clearer picture of the extent of the industries covered. Five pre-determined categories were used: m anufacturing; trading, shipping and distribution; services and construction; finance; and others.
FINDINGS AND DISCUSSIONBackground InformationIt was found that the nature of business of the companies was very varied with the largest num ber falling under the ‘others’ category. In this category, the nature of the companies’ business was found to include public accounting, auditing, plantations, m arket research, co-operatives and telecommunication. Thus the population was not very clearly involved in the pre-defined categories of finance, m anufacturing, shipping and distribution. Table 1 shows the classification.
TABLE 1 Nature of the companies’ business
Business Percentage
Manufacturing 7.0Trading, shipping and distribution 7.0Services and construction 29.4Finance 7.0Others 49.1
Responses to the Use o f English
The business executives confirm ed their employers’ expectation of the im portance of English in their work. The figure of 98.9% who said that they believed it was im portant to know English was similar to the 97.1% of employers who said likewise in the 1991 study (Goh and Chan 1993).
A large percentage of the respondents (73.8%) reported that English is essential to their job, confirming the findings of the 1991 study, where a large percentage o f the employers (69.3%) felt that it was essential for their employees to know English.
A question on w hether the business executives had attended English language courses was used as a gauge to indicate the desire to improve or to show continued interest in the use of the language. Only 12.3% replied in the affirmative, and of this figure, 65% said they had to pay for their courses themselves. Tw enty-six per cent reported that they were sponsored by their company. This reaffirms the low figure in the 1991 study which found that 18.2% of the
142 Pertanika J. Soc. Sci. & Hum. Vol. 4 No. 2, 1996
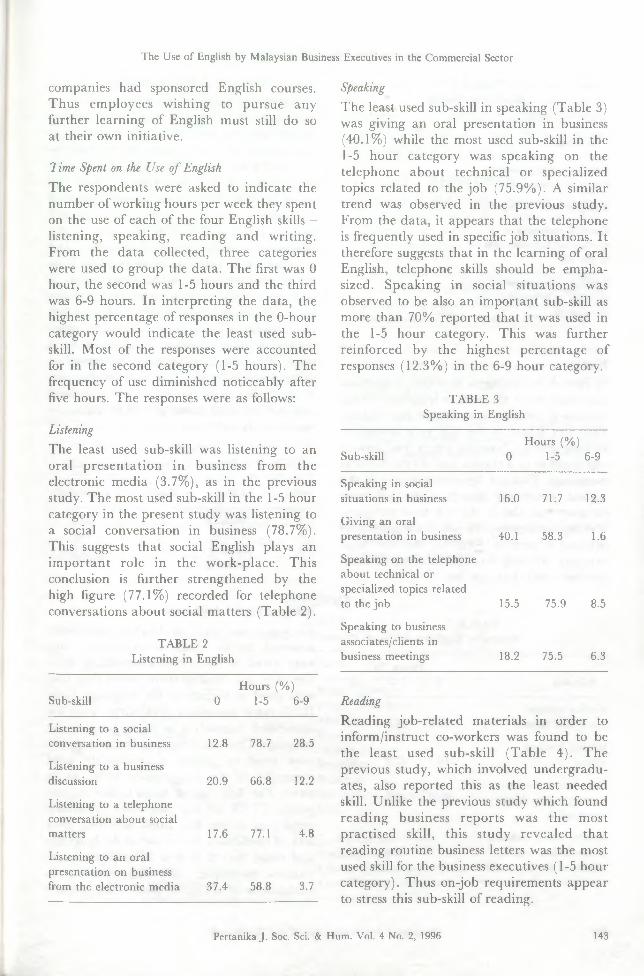
The Use of English by Malaysian Business Executives in the Commercial Sector
companies had sponsored English courses. Thus employees w ishing to pursue any further learning of English must still do so at their own initiative.
Time Spent on the Use o f English
The respondents were asked to indicate the num ber of working hours per week they spent on the use of each of the four English skills - listening, speaking, reading and writing. From the data collected, three categories were used to group the data. T he first was 0 hour, the second was 1-5 hours and the third was 6-9 hours. In interpreting the data, the highest percentage of responses in the 0-hour category would indicate the least used subskill. Most of the responses were accounted for in the second category (1-5 hours). The frequency of use diminished noticeably after five hours. T he responses were as follows:
Listening
The least used sub-skill was listening to an oral p re sen ta tio n in business from the electronic media (3.7%), as in the previous study. T he most used sub-skill in the 1-5 hour category in the present study was listening to a social conversation in business (78.7%). This suggests that social English plays an im p o rtan t role in the w ork-place. This conclusion is further strengthened by the high figure (77.1%) recorded for telephone conversations about social m atters (Table 2).
TABLE 2 Listening in English
Sub-skill 0Hours (%)
1-5 6-9
Listening to a social conversation in business 12.8 78.7 28.5
Listening to a business discussion 20.9 66.8 12.2
Listening to a telephone conversation about social matters 17.6 77.1 4.8
Listening to an oral presentation on business from the electronic media 37.4 58.8 3.7
Speaking
The least used sub-skill in speaking (Table 3) was giving an oral presentation in business (40.1%) while the most used sub-skill in the 1-5 hour category was speaking on the telephone abou t technical or specialized topics related to the job (75.9%). A similar trend was observed in the previous study. From the data, it appears that the telephone is frequently used in specific job situations. It therefore suggests that in the learning of oral English, telephone skills should be em phasized. Speaking in social situations was observed to be also an im portant sub-skill as more than 70% reported that it was used in the 1-5 hour category. This was further reinforced by the highest percentage of responses (12.3%) in the 6-9 hour category.
TABLE 3 Speaking in English
Hours (%)Sub-skill 0 1-5 6-9
Speaking in socialsituations in business 16.0
Giving an oralpresentation in business 40.1
Speaking on the telephone about technical or specialized topics related to the job 15.5
Speaking to businessassociates/clients inbusiness meetings 18.2
ReadingReading job-related m aterials in order to inform /instruct co-workers was found to be the least used sub-skill (T able 4). T he previous study, which involved undergraduates, also reported this as the least needed skill. Unlike the previous study which found read in g business reports was the m ost practised skill, this study revealed th a t reading routine business letters was the most used skill for the business executives (1-5 hour category). Thus on-job requirements appear to stress this sub-skill of reading.
71:7 12.3
58.3 1.6
75.9 8.5
75.5 6.3
Pertanika J. Soc. Sci. & Hum. Vol. 4 No. 2, 1996 143

Sharon Goh Seng Pang and Chan Swee Heng
TABLE 4 Reading in English
Sub-skill 0Hours (%)
1-5 6-9Reading routine business letters and memos 12.3 78.1 9.6Reading business reports 18.7 76.7 3.7Reading technical or specialized materials related to the job 19.8 73.7 6.4Reading job-related materials in order to inform/instruct co-workers 26.2 71.7 2.1
W ritingIn view of our bilingual situation, a question was asked about the need to translate written business documents from English into Malay. This was found to be not very necessary. Writing routine business letters and memos was found to be a regular task for the business executives. This can be seen not only in the highest percentage found in the 1-5 hour category but also in the 6-9 hour category. Writing business reports was the second most frequently used sub-skill in the 1-5 hour category. Writing was generally was a lesser practised skill than reading.
TABLE 5 Writing in English
Sub-skill 0Hours (%)
1-5 6-9Writing routine letters and memos 21.9 66.8 11.2Writing business reports 33.7 60.9 5.3Translation of other languages (e.g. Malay) into English
51.9 48.0 0
Writing about technical or specialized topics related to the job
41.7 52.4 5.9
Order o f Importance o f English Language SkillsSpeaking was found to be the most im portant skill (Table 6). This skill was also deemed to be the most im portant in the study which investigated the perceptions of undergraduates and employers. Therefore, the present study confirms the importance placed on speaking skills. In all three sample groups of respondents (employers, undergraduates, and business executives) writing was rated as the second most important skill. Reading and listening were ranked as third and fourth by the business executives in the present study as well as by the employers in the previous study. However, the undergraduates (potential employees) rated listening as more important than reading. This could be a result of the undergraduates seeing themselves as ‘apprentices’ in their practical training stint in which they probably took on a more passive role and practised listening skills to derive the maximum benefit from their situation.
TABLE 6Order of importance of English language skills
Order Skill Rank Percentage1 Speaking 1 26.32 Writing 1 17.53 Reading 1 6.64 Listening 1 5.1
Rating o f English ProficiencyTo assess the level of English proficiency achieved by the business executives, they were asked to carry out a self-rating exercise. About a third of them stated that they were good or average in the language. Only 12.3% rated themselves as excellent. Very few considered themselves as being poor in the language. One can infer that business executives need to possess a reasonably good command of the language in order to be hired. The ‘fair - good’ band in fact encompasses 87.7% of the responses. Potential employees in the first study admitted their lack of confidence in the use of the language and noted that if they were to aspire to be business executives, they must achieve an adequate level of English proficiency in order
144 Pertanika J. Soc. Sci. & Hum. Vol. 4 No. 2, 1996
The Use of English by Malaysian Business Executives in the Commercial Sector
to meet on-job demands.It was also noted in the first study that
English proficiency was an important consideration in job interviews and promotion exercises for business executives. The importance of English as an entry requirement as well as for further career advancement for business executives is clearly supported.
CONCLUSIONBoth studies involving the same 197 companies confirmed the importance of English as a job requirement for business executives. As for how much time is spent on the use of English in their work life per week, it was revealed that the range of one to five hours encompasses the highest concentration of the percentage of responses.
Research related to ESP invariably leads to pedagogical implications (Swales 1990). From the evidence given by this study, it is suggested that course design in business English should give attention to listening and speaking on the telephone about technical and social matters. Reading and writing routine business letters and memos are definitely other important aspects that need to be taught in business English courses. Students must be prepared adequately in the use of the English language to meet the challenges of their intended career in the
business world. The need is all the more cogent with the English language widely acclaimed as the international language used in science, technology and trade dealings (Johns and Dudley-Evans 1991).
REFERENCESADAMS-SMITH, D.E. 1986. ESP and the local
situation. In E SP in Practice, ed. P.W. Peterson, p. 64-72. Washington: United States Information Agency.
GOH, S. and S.H. CHAN. 1993. The use of English in the commercial sector of the Malaysian economy: Perspectives from potential employers and employees. ESP Malaysia 1(2): 128-146.
JOHNS, M.A. and T. DUDLEY-EVANS. 1991. English for specific purposes: International in scope, specific in purpose. TESOL Quarterly 25(2): 297-314.
RIDDELL, P.G. 1993. Analyzing student needs in designing specific purposes language syllabuses. Language Learning Journal 3: 73-77.
ROBINSON, P. 1991. ESP Today: A Practitioner's Guide. London: Prentice-Hall.
SW ALES, J.M . 1990. Genre Analysis: English in Academic and Research Settings. New York: Cambridge University Press.
APPENDIX ATable A
Distribution of accounting companies according to state/town No. State Town
1. Federal Territory Kuala Lumpur2. Johor Muar, Johor Baru3. Kedah Alor Setar4. Kelantan Kota Bharu5. Melaka Melaka6. Negri Sembilan Seremban7. Pahang Kuantan8. Pulau Pinang Butterworth, Pulau Pinang9. Perak Ipoh
10. Perlis -11. Sabah Kota Kinabalu12. Sarawak Kuching, Sibu13. Selangor Kelang, Petaling Jaya, Tanjung Karang14. Terengganu Kuala Terengganu, Marang
Pertanika J. Soc. Sci. & Hum. Vol. 4 No. 2, 1996 145
Sharon Goh Seng Pang and Chan Swee Heng
APPENDIX BTable B
Distribution of “other” companies according to state/townNo. State Town
1. Federal Territory2. Johor3. Kedah4. Kelantan
9.
MelakaNegeri Sembilan PahangPulau Pinang Perak
10. Perlis11. Sabah12. Sarawak13. Selangor14. Terengganu
Kuala LumpurBatu Pahat, Bruas, Johor Baru, Kluang, Muar, Pontian,
Segamut, Senai Alor Setar, Baling, Jitra, Kota Setar, Kulim, Langkawi,
Pendang, Sungai Petani Bachok, Kota Bharu, Machang, Pasir Mas, Pasir Puteh,
Tanah Merah MelakaJohol, Port Dickson, Seremban, TampinBenta, Bentong, Genting Highlands, Jerantut, Kuantan,
Pekan, Temerloh Bukit Mertajam, Butterworth, Pulau Pinang Hutan Melintang, Ipoh, Kuala Kangsar, Langkap,
Lenggeng, Selama, Slim Village, Sungai Teluk Intan, Taiping, Tapah
KangarBintulu, KuchingBanting, Kajang, Kelang, Petaling Jaya, Semenyih, Sepang,
Shah AlamDungun, Jerteh, Kuala Terengganu, Kemaman, Kuala Berang,
Marang
(Received 4 August 1995)
146 Pertanika J. Soc. Sci. & Hum. Vol. 4 No. 2, 1996
Pertanika J. Soc. Sci. & Hum. 4(2): 147-154 (1996)ISSN: 0128-7702
© Penerbit Universiti Pertanian Malaysia
Im pact o f Tropical H ardwoods Cam paignRUSLI MOHAMAD
Department of Forest Management Faculty of Forestry
Universiti Pertanian Malaysia 43400 Serdang, Selangor, Malaysia
Keywords: tim ber exporters, tropical hardw oods cam paign, boycotts, certificationABSTRAK
Satu survei telah dibuat untuk menilai kesedaran serta kesan terhadap ekspot hasil kayu Semenanjung Malaysia akibat dari kempen kayu keras tropika. Maklumat diperolehi dari jawapan kepada soalselidik yang dihantar oleh tiga puluh dua pengekspot hasil kayu, daripada seratus yang dihubungi. Kesedaran terhadap kempen kayu keras tropika dikalangan pengekspot adalah tinggi. Kesedaran yang sama tinggi tidak didapati untuk kempen pemulauan dan pensijilan hasil kayu tropika. Tidak ujud perbezaan kesedaran tentang pensijilan hasil kayu tropika dikalangan pengekspot. Walau bagaimanapun, pengekspot ke negara Eropah, khususnya ke Belanda, lebih menyedari kempen pemulauan kayu keras tropika. Berbanding dengan pengekspot ke negara lain, pengekspot ke negara Belanda lebih cenderung untuk mengatakan yang kempen kayu keras tropika menjejaskan ekspot mereka ke negara tersebut. Majoriti pengekspot merasakan yang kempen kayu keras tropika tidak seburuk masalah kekurangan bekalan kayu balak yang sedang dihadapi pad a masa ini.
ABSTRACTA survey was conducted to assess the awareness of the tropical hardwoods campaign and its impact on exports of timber products from Peninsular Malaysia. Information was obtained from the questionnaire answers of thirty-two exporters, from one hundred contacted. There is a high degree of awareness of the tropical hardwoods campaign among the exporters. The same level of awareness is not shown for boycott and certification of tropical timber products. There is no difference in awareness of certification of tropical timber products among the exporters. However, exporters to Europe and in particular to the Netherlands are more aware of the campaign to boycott tropical timber products than exporters to other destinations. Exporters to the Netherlands are more likely to report that their exports are adversely affected by the tropical hardwoods campaign. A majority of exporters feel that the tropical hardwoods campaign is less serious than the problem of diminishing log supply that they are currently facing.
IN TRO DUCTIO NTimber trade policy initiatives, such as the tropical hardwoods boycott and tropical timber certification, embodied in the tropical hardwood products campaign orchestrated by many Western environmental non-govern- mental organizations (NGOs) could have short-term as well as long-term impacts. These initiatives are essentially non-tariff trade barriers and could theoretically restrict the trade in tropical hardwood products.
It is expected that, in the short term, the volume of imports of tropical hardwood products will be reduced as a result of the
campaign to ban the import of tropical hardwood products or boycott their use. This effect will be greater in countries where the boycott policy is more regulated. A survey conducted in G hana found that tim ber industry managers were reluctant to invest further in the wood processing industry because they perceived that the boycott campaign in Europe has reduced demand for their timber products (Eastin et al. 1992).
In principle, timber certification can discriminate against the use of tropical hardwood products as those which do not come from sustainably managed tropical forests will

Rusli Mohamad
no longer be purchased by consumers who traditionally use these products (Baer 1992). This is particularly true for countries which strongly urge the certification of tropical hardwood products based on some type of sustainability criteria. As a result of discrimination against their use, tropical hardwood product imports into the relevant countries will be adversely affected.
According to proponents, boycott and certification initiatives should promote sustainable management of tropical forests in the long run. Those who support boycott initiatives believe that commercial logging is one of the major causes of tropical deforestation, and that restricting the trade in tropical timber will improve the situation (Vincent 1990). They also feel strongly that individual consumers have a moral imperative not to participate in a market that contributes to the destruction of tropical forests (Willie 1991). Supporters of timber certification, on the other hand, see certification as an economic incentive to encourage tropical producer countries to practise sustainable forest management. Environmental organizations assure producing countries that certified timber will have a competitive edge in the marketplace (Williams 1992).
While the call for a boycott on tropical hardwood products has moderated recently, heated debate continues regarding the issue of tropical timber certification. There appears to be consensus that after the year 2000 all tropical hardwood exports should come from sustainably managed forests. In order to assess the short-term impact of the tropical hardwood campaign, the perceptions of timber exporters in Malaysia were obtained. To date very few reports of such studies have been published.
This paper describes an exploratory survey of the impact of the tropical hardwood products cam paign on Peninsular Malaysia’s wood-based industry. The main objectives of the survey were to assess the awareness of mill managers about the tropical hardwood campaign as well its impact on their wood products exports.
TROPICAL TIMBER CERTIFICATION INITIATIVE
Certification is carried out to inform consumers that a product meets a set of quality standards or criteria established by a specific certifying organization (Salzhauser 1991). In the case of tropical wood products, the main intention of certification is to enable consumers to distinguish wood products sourced from sustainably managed forests from those that are not. Certified wood products are guaranteed by the certifiers to have been manufactured from wood grown in a sustainable manner. Producers perceive that there is a demand for certified tropical wood products in consuming countries, particu larly in Europe. Certified tropical timber products are presumably assured of a ready market and, therefore, have a competitive advantage over non-certified products. In this context, certification also serves as an incentive for producers to practise sustainable forest m anagement.
There are several tropical timber certification initiatives. One of these, which is called “country certification” proposes that tropical wood products be labelled with the country of origin. The main argument underlying this initiative is that consumers, particularly those in the importing countries, should be given the power of choice about which tropical woods to buy.
Another type of certification, which has been more aggressively promoted, proposes that tropical wood products be labelled to indicate the ecological sustainability of the forests from which the wood was harvested. Usually referred to as “concession” labelling, this strategy would certify that the timber produced within a specific concession is sustainably harvested. Concession certification requires the formulation of ecological standards against which sustainability is measured. In this manner, certification is intended to indicate to consumers that these forests are sustainably managed.
Several international and national level NGOs have designed their own certification schemes. In addition to the certification
148 Pertanika J. Soc. Sci. & Hum. Vol. 4 No. 2, 1996
Impact of Tropical Hardwoods Campaign
programme currently being developed by the Forest Stewardship Council (FSC), which is an international NGO, at least four other certification programmes are operational while three are in the planning phase (Ghazali and Mikula 1994: 30-32). Almost all of these programmes are being developed by NGOs either in the United Kingdom or the United States.
The FSC has developed its Principles and Criteria of Forest Management to act as a common standard for sustainable forest management practices in all forested regions of the world. The main objective of the principles and criteria is to provide a consistent framework and mechanism for measuring, monitoring, and evaluating continual improvement in forest practices. The FSC will evaluate requests from certifiers before giving its accreditation and certifiers must demonstrate that they satisfactorily adhere to the Principles and Criteria as well as to the FSC Guidelines for Certifiers (Ghazali and Mikula 1994: 121-123).
In USA, an environmental NGO, the Rainforest Alliance, has im plem ented a certification scheme called the Smart Wood Certification Program (SWCP), focused on the sellers of tropical wood products. Its main objective is to “ identify and promote the use of tropical woods whose harvesting does not contribute to the destruction of tropical forests” (Rainforest Alliance 1991). By implementing certification, the Rainforest Alliance “hopes to increase harvesters’ incentives to adopt sustainable forestry practices that meet long term environmental and social needs” .
Under the programme, a Smart Wood certification is given to companies using woods from tropical forests that are sustainably managed, based on criteria set by the Alliance, which conducts the necessary evaluation, including an audit of all pertinent records and facilities it deems necessary to verify the source of the company’s tropical wood products. The costs of this evaluation are paid by the companies seeking certification.
Ghazali and Mikula (1994: 32) estimated that about 1.5 million mJ of timber and
timber products were certified in 1993 and about 35 suppliers were certified. Most of the certified timber originated from tropical countries and was sold in the US market.
TROPICAL HARDW OODS BOYCOTTThe campaign to ban the import or boycott the use of tropical wood products was aggressively launched in the early 1990s, particu larly in Europe and USA. The campaign has since lost its momentum, but not without leaving a lasting impact by convincing some im porting countries to regulate or even prohibit the use of tropical wood products.
A strong advocate of boycotting tropical timber products in USA is the Rainforest Action Network (RAN), an environmental NGO based in San Francisco. RAN chose to implement a tropical timber ban resolution passed by the World Rainforest Movement in 1989 (Roselle and Katelman 1989: 7-8). Partly as a result of RAN’s efforts, certain state and local governments (including New York, Arizona, Baltimore, San Francisco, Santa Monica, and Bellingham) have passed regulations prohibiting the use of tropical hardwood products in state or local projects (Adams 1991: 14).
A network of NGOs in Europe has also been actively involved in campaigning for the boycott of tropical wood products (Ghazali 1990). About 400 communities in Germany and 20 communities in Belgium have instituted regulations and administrative action banning or restricting the use of tropical timber in public works and buildings. In the Netherlands, some provincial authorities are banning the use of tropical tim ber and replacing it with temperate wood and other materials (Lim 1994: 5).
Several arguments are levelled at boycotts as being counter-productive. Boycotting tropical timber products restricts tropical timber markets, depresses their prices, and reduces the value of standing forests (Vincent 1990; Hamilton 1991). The end result could be further destruction of tropical forests as these forests experience pressure to be converted to non-forest use. M oreover,
Pertanika J. Soc. Sci. & Hum. Vol. 4 No. 2, 1996 149

Rusli Mohamad
because the strategy imposes trade restrictions it runs contrary to the philosophy that industrialized countries should aid developing countries by providing a market for their products (Laarman and Sedjo 1992: 186). In addition, some experts believe that restricting trade through boycotts runs foul of the principles of free trade espoused by the General Agreement on Tariffs and Trade (Shrybman 1990: 30-34).
SURVEY M ETHOD AND ANALYSISIn order to assess the impact of the tropical hardwood campaign, a survey was directed at wood products exporters based in Peninsular M alaysia. One hundred exporters were randomly selected from the list of wood product exporters in the “ Directory of Tim ber Trade, 1993” of the Malaysian Timber Industry Board. This number of exporters represents about 10% of the registered wood products exporters in Peninsular Malaysia. A survey questionnaire was developed and mailed to the respondents in November 1994. The questionnaire was developed based on pre-survey discussions with several mill managers in the state of Negri Sembilan. At the end of January 1995, thirty-two mills responded to the survey, representing a response rate of 32%.
For purposes of analysis, the exporters were differentiated on the basis of whether or not they export to Europe. Those who do export to Europe were asked to indicate whether or not the Netherlands is one of their export destinations. This categorization was done in order to determine the impact of the relatively more strict policy on the use of tropical hardwood products being developed in the Netherlands than in other European
countries. Wherever applicable, chi-square analysis was employed to compare the impact of the campaign on the various categories of exporters.
RESULTSAwareness of Tropical Hardwoods CampaignThe respondents indicated that they were fully aw are of the tropical hardw oods campaign. Almost every respondent in the survey (97%) had heard about the tropical hardwoods campaign (Table 1). There is no significant difference in the awareness of the various groups of exporters of the tropical hardwoods campaign (p = 0.75). In other words, awareness is independent of the type of exporter. Exporters as well as non-exporters to Europe indicated a high degree of awareness of the tropical hardwoods campaign. Less than 10% of the respondents have not heard about the campaign; all of them do not export their products to Europe.Awareness of Policy Initiatives In order to enquire further about the respondents’ awareness, they were asked to indicate whether or not they have heard about two of the policy initiatives embodied in the tropical hardwoods campaign. These policy initiatives are tropical timber certification and tropical hardwood products boycott.
Nearly four out of every five respondents are aware of the certification initiative. Awareness is particularly high among respondents who export their products to Europe and, in particular, among those who export to the Netherlands. Seventy-five per cent of the former and about 90% of the latter indicated that they have heard about the initiative
TABLE 1Percentage of exporters who have heard about the tropical hardwood campaign
Non-exporters to Europe
Exporters to Europe*
Exporters to the Netherlands
Total
Yes 92.8 100.00 100.00 96.9No 7.2 0.00 0.00 3.1•other than the Netherlandschi-square = 1.4, p * 0.75
150 Pertanika J. Soc. Sci. & Hum. Vol. 4 No. 2, 1996

Impact of Tropical Hardwoods Campaign
TABLE 2Percentage of respondents indicating awareness of certification initiativeNon-exporters
to EuropeExporters to
Europe*Exporter to the
NetherlandsTotal
Yes 69.2 75.0 90.9 78.1No 23.0 12.5 9.1 15.6No answer 7.6 12.5 0.0 5.3* other than the Netherlands chi-square = 1.083, p = 0.58
TABLE 3Percentage of respondents indicating awareness of the boycott initiativeNon-exporters
to EuropeExporters to
Europe*Exporters to the
NetherlandsTotal
Yes 46.1 100.0 100.0 78.1No 46.1 0.0 0.0 19.3No Answer 7.8 0.0 0.0 6.0•other than the Netherlands chi-square = 11.78, p = 0.002
(Table 2). Similarly, almost 70% of those respondents who do not export to Europe have heard about the certification initiative. Thus there does not appear to be a difference in awareness of certification between those who export and those who do not export their products to Europe. This is supported by the statistical analysis that indicates these differences are not significant (p = 0.58). Awareness of certification initiative is statistically independent of the type of exporter.
The percentage of respondents who indicated awareness of the tropical timber products boycott initiative is equally high. Nearly 80% of the respondents have heard about the initiative (Table 3). There is greater awareness of tropical timber boycotts among those respondents who export their products to Europe, including the Netherlands, than those who export their products elsewhere. All who export to Europe and the N etherlands have heard about tropical timber boycotts. In comparison, less than half of those who export to non-European countries are aware of the boycott initiative. Awareness of tropical timber boycotts is dependent of the type of exporter (p = 0.002).
Sources o f Campaign InformationHow do the respondents get to know about the tropical hardwood products campaign? As shown in Table 4, there are many sources from which the respondents receive campaign information. Newspapers, timber trade magazines and fellow exporters are among the more important ones. Importing agents in various countries do play a small role in channeelling information about the campaign.Impact on Volume o f ExportsThe tropical hardwoods campaign started in the mid-1980s. If really effective, it should
TABLE 4 Sources of campaign information
Source of information Percentage of ExportersNewspapers 84.8Magazines 75.7Fellow exporters 60.6Television 54.5Radio 36.3Importing agents 21.2
Pertanika J. Soc. Sci. & Hum. Vol. 4 No. 2, 1996 151
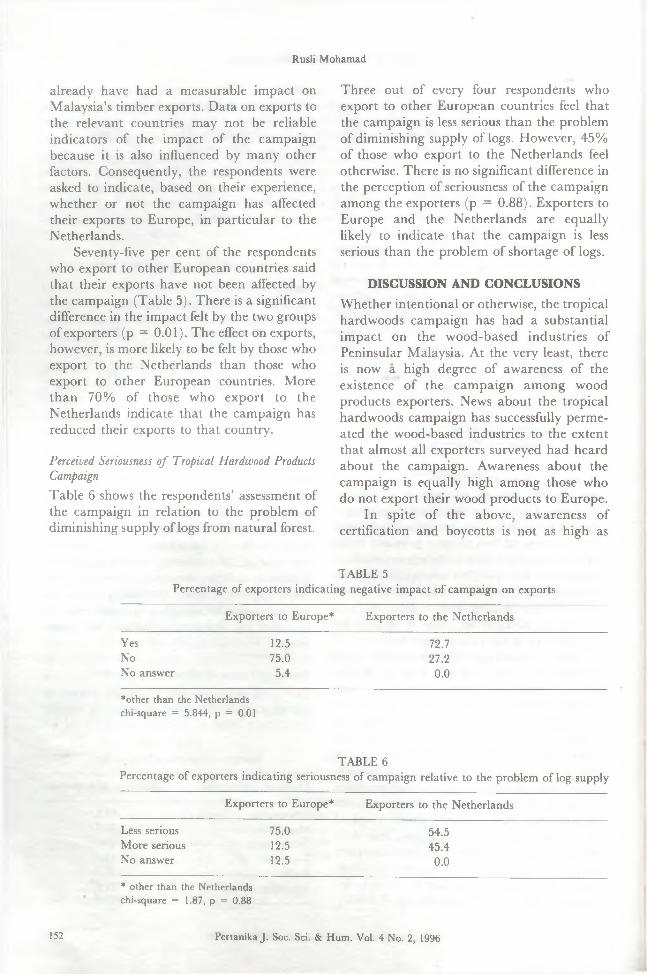
Rusli Mohamad
already have had a measurable impact on Malaysia’s timber exports. Data on exports to the relevant countries may not be reliable indicators of the impact of the campaign because it is also influenced by many other factors. Consequently, the respondents were asked to indicate, based on their experience, whether or not the campaign has affected their exports to Europe, in particular to the Netherlands.
Seventy-five per cent of the respondents who export to other European countries said that their exports have not been affected by the campaign (Table 5). There is a significant difference in the impact felt by the two groups of exporters (p = 0.01). The effect on exports, however, is more likely to be felt by those who export to the Netherlands than those who export to other European countries. More than 70% of those who export to the Netherlands indicate that the campaign has reduced their exports to that country.Perceived Seriousness o f Tropical Hardwood Products CampaignTable 6 shows the respondents’ assessment of the campaign in relation to the problem of diminishing supply of logs from natural forest.
Three out of every four respondents who export to other European countries feel that the campaign is less serious than the problem of diminishing supply of logs. However, 45% of those who export to the Netherlands feel otherwise. There is no significant difference in the perception of seriousness of the campaign among the exporters (p = 0.88). Exporters to Europe and the Netherlands are equally likely to indicate that the campaign is less serious than the problem of shortage of logs.
DISCUSSION AND CONCLUSIONSWhether intentional or otherwise, the tropical hardwoods campaign has had a substantial impact on the wood-based industries of Peninsular Malaysia. At the very least, there is now a high degree of awareness of the existence of the campaign among wood products exporters. News about the tropical hardwoods campaign has successfully permeated the wood-based industries to the extent that almost all exporters surveyed had heard about the campaign. Awareness about the campaign is equally high among those who do not export their wood products to Europe.
In spite of the above, awareness of certification and boycotts is not as high as
TABLE 5Percentage of exporters indicating negative impact of campaign on exports
Exporters to Europe* Exporters to the NetherlandsYes 12.5 72.7No 75.0 27.2No answer 5.4 0.0♦other than the Netherlands chi-square = 5.844, p = 0.01
TABLE 6Percentage of exporters indicating seriousness of campaign relative to the problem of log supply
Exporters to Europe* Exporters to the NetherlandsLess serious 75.0 54.5More serious 12.5 45.4No answer 12.5 0.0* other than the Netherlands chi-square = 1.87, p = 0.88
152 Pertanika J. Soc. Sci. & Hum. Vol. 4 No. 2, 1996
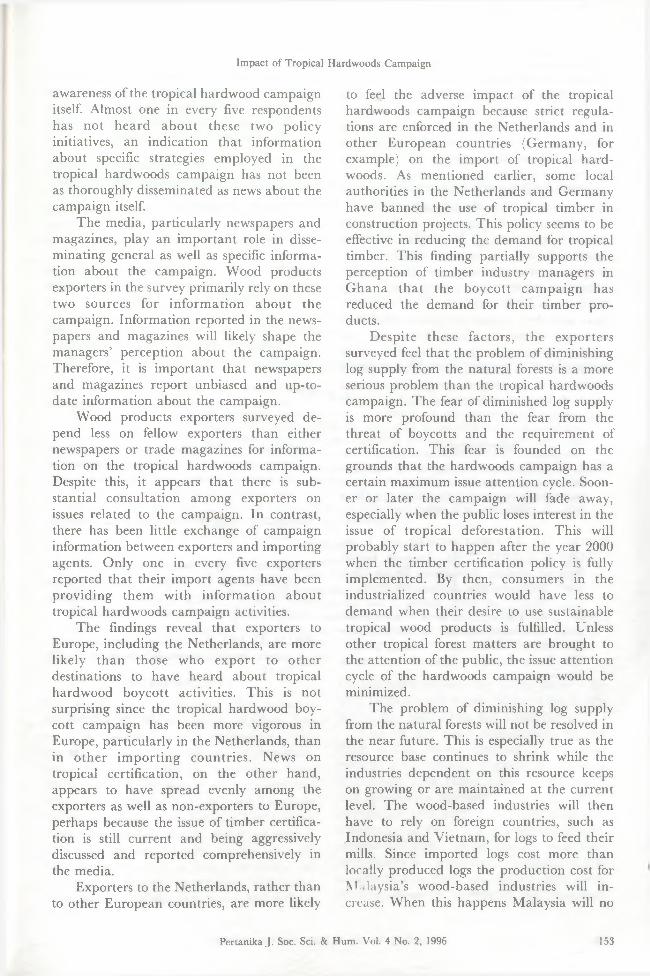
Impact of Tropical Hardwoods Campaign
awareness of the tropical hardwood campaign itself Almost one in every five respondents has not heard about these two policy initiatives, an indication that information about specific strategies employed in the tropical hardwoods campaign has not been as thoroughly disseminated as news about the campaign itself.
The media, particularly newspapers and magazines, play an im portant role in disseminating general as well as specific information about the campaign. Wood products exporters in the survey primarily rely on these two sources for inform ation about the campaign. Information reported in the newspapers and magazines will likely shape the managers’ perception about the campaign. Therefore, it is im portant that newspapers and magazines report unbiased and up-to- date information about the campaign.
Wood products exporters surveyed depend less on fellow exporters than either newspapers or trade magazines for information on the tropical hardwoods campaign. Despite this, it appears that there is substantial consultation among exporters on issues related to the campaign. In contrast, there has been little exchange of campaign information between exporters and importing agents. Only one in every five exporters reported that their import agents have been providing them with inform ation about tropical hardwoods campaign activities.
The findings reveal that exporters to Europe, including the Netherlands, are more likely than those who export to o ther destinations to have heard about tropical hardwood boycott activities. This is not surprising since the tropical hardwood boycott campaign has been more vigorous in Europe, particularly in the Netherlands, than in o ther im porting countries. News on tropical certification, on the other hand, appears to have spread evenly among the exporters as well as non-exporters to Europe, perhaps because the issue of timber certification is still current and being aggressively discussed and reported comprehensively in the media.
Exporters to the Netherlands, rather than to other European countries, are more likely
to feel the adverse impact of the tropical hardwoods campaign because strict regulations are enforced in the Netherlands and in other European countries (Germany, for example) on the import of tropical hardwoods. As mentioned earlier, some local authorities in the Netherlands and Germany have banned the use of tropical timber in construction projects. This policy seems to be effective in reducing the demand for tropical timber. This finding partially supports the perception of timber industry managers in G hana tha t the boycott cam paign has reduced the demand for their timber products.
Despite these factors, the exporters surveyed feel that the problem of diminishing log supply from the natural forests is a more serious problem than the tropical hardwoods campaign. The fear of diminished log supply is more profound than the fear from the threat of boycotts and the requirement of certification. This fear is founded on the grounds that the hardwoods campaign has a certain maximum issue attention cycle. Sooner or later the campaign will fade away, especially when the public loses interest in the issue of tropical deforestation. This will probably start to happen after the year 2000 when the timber certification policy is fully implemented. By then, consumers in the industrialized countries would have less to demand when their desire to use sustainable tropical wood products is fulfilled. Unless other tropical forest matters are brought to the attention of the public, the issue attention cycle of the hardwoods campaign would be minimized.
The problem of diminishing log supply from the natural forests will not be resolved in the near future. This is especially true as the resource base continues to shrink while the industries dependent on this resource keeps on growing or are maintained at the current level. The wood-based industries will then have to rely on foreign countries, such as Indonesia and Vietnam, for logs to feed their mills. Since imported logs cost more than locally produced logs the production cost for Malaysia’s wood-based industries will increase. When this happens Malaysia will no
Pertanika J. Soc. Sci. & Hum. Vol. 4 No. 2, 1996 153
Rusli Mohamad
longer have the comparative advantage that it currently enjoys in the wood products market. The implications of diminishing log supply seem to be more serious than those of tropical hardwoods campaign. The exporters in the survey have valid reasons to be more worried about the log supply problem than the tropical hardwoods campaign.
Only a small segment of the wood products exporters of Peninsular Malaysia apparently feel the adverse impact of the tropical hardwoods campaign. This segment comprises those who export their wood products to the Netherlands. These exporters have seen their volume of exports reduced as a result of the campaign. Otherwise the hardwoods campaign has managed to create awareness of its presence as well as its policy initiatives in the form of a tropical hardwood products boycott and tropical timber certification.
REFERENCESBAER, W. 1992. Statement before the Subcom
mittee on Commerce, Consumer Protection and Competitiveness, United States House of Representatives, 13 May 1992.
EASTIN, I.L., A. ADDAE-MENSAH and J. de- GRAFT YARTEY. 1992. Tropical timber boycotts: strategic implications for the Ghanaian timber industry. Unasylva 43: 39-44.
GHAZALI, B. 1990. Anti-tropical timber campaign: Issues and response. In The Malaysian Economy in Transition, ed. A. Buang, p. 187- 196. Kuala Lumpur: National Institute of Administration.
GHAZALI, B. and M. SIMULA. 1994. Certification schemes for all timber and timber products. A report for the International Tropical Timber Organization, Yokohama, Japan.
HAMILTON, L.S. 1990. Tropical forests: Identifying and clarifying issues. Unasylva 42: 19-27.
LAARMAN, J.G. and R.A. SEDJO. 1992. Global Forests: Issues for Six Billion People. New York: McGraw-Hill.
LlM, K.Y. 1994. Address delivered at the Seminar on Trade o f Timber from Sustainably Managed Forests, Kuala Lumpur, 5-6 April.
R a i n f o r e s t A l l i a n c e . 1991. Smart wood certification program. Program description (Feb. 91).
4
SALZHAUSER, A.L. 1991. Obstacles and opportunities for a consumer ecolabel. Environment 33: 10-15, 33-37.
SHRYBMAN, S. 1990. International trade and the environment: An environmental assessment of the General Agreement on Tariffs and Trade. The Ecologist 20: 30-34.
VINCENT, J. 1990. Don’t boycott tropical timber. Journal o f Forestry 88: 56.
WILLIAMS, L. 1992. Statement before the Subcommittee on Commerce, Consumer Protection and Competitiveness, United States House of Representatives, 13 May 1992.
WILLIE, C. 1991. Buy or boycott tropical hardwoods? American Forests July/A ug: 26-27, 60, 66-67.
( Received 2 M ay 1995)
154 Pertanika J. Soc. Sci. & Hum. Vol. 4 No. 2, 1996
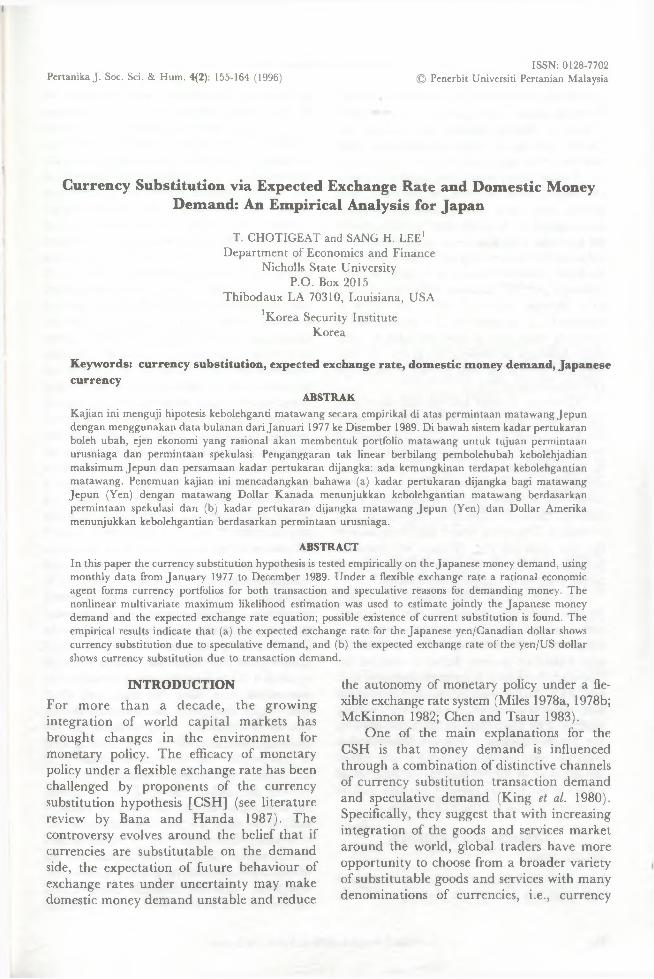
I
ISSN: 0128-7702Pertanika J. Soc. Sci. & Hum. 4(2): 155-164 (1996) © Penerbit Universiti Pertanian Malaysia
Currency Substitution via Expected Exchange Rate and D om estic M oney Demand: An Em pirical Analysis for Japan
T. CHOTIGEAT and SANG H. LEE1 Department of Economics and Finance
Nicholls State University P.O. Box 2015
Thibodaux LA 70310, Louisiana, USA1 Korea Security Institute
Korea
Keywords: currency substitution, expected exchange rate, dom estic m oney dem and, Japanese currency
ABSTRAKKajian ini menguji hipotesis kebolehganti matawang secara empirikal di atas permintaan matawang Jepun dengan menggunakan data bulanan dari Januari 1977 ke Disember 1989. Di bawah sistem kadar pertukaran boleh ubah, ejen ekonomi yang rasional akan membentuk portfolio matawang untuk tujuan permintaan urusniaga dan permintaan spekulasi. Penganggaran tak linear berbilang pembolehubah kebolehjadian maksimum Jepun dan persamaan kadar pertukaran dijangka: ada kemungkinan terdapat kebolehgantian matawang. Penemuan kajian ini mencadangkan bahawa (a) kadar pertukaran dijangka bagi matawang Jepun (Yen) dengan matawang Dollar Kanada menunjukkan kebolehgantian matawang berdasarkan permintaan spekulasi dan (b) kadar pertukaran dijangka matawang Jepun (Yen) dan Dollar Amerika menunjukkan kebolehgantian berdasarkan permintaan urusniaga.
ABSTRACTIn this paper the currency substitution hypothesis is tested empirically on the Japanese money demand, using monthly data from January 1977 to December 1989. Under a flexible exchange rate a rational economic agent forms currency portfolios for both transaction and speculative reasons for demanding money. The nonlinear multivariate maximum likelihood estimation was used to estimate jointiy the Japanese money demand and the expected exchange rate equation; possible existence of current substitution is found. The empirical results indicate that (a) the expected exchange rate for the Japanese yen/Canadian dollar shows currency substitution due to speculative demand, and (b) the expected exchange rate of the yen/US dollar shows currency substitution due to transaction demand.
INTRO DUCTIO NFor more than a decade, the growing integration of world capital markets has brought changes in the environment for monetary policy. The efficacy of monetary policy under a flexible exchange rate has been challenged by proponents of the currency substitution hypothesis [CSH] (see literature review by Bana and H anda 1987). The controversy evolves around the belief that if currencies are substitutable on the demand side, the expectation of future behaviour of exchange rates under uncertainty may make domestic money demand unstable and reduce
the autonomy of monetary policy under a flexible exchange rate system (Miles 1978a, 1978b; McKinnon 1982; Chen and Tsaur 1983).
One of the main explanations for the CSH is that money demand is influenced through a combination of distinctive channels of currency substitution-transaction demand and speculative demand (King et al. 1980). Specifically, they suggest that with increasing integration of the goods and services market around the world, global traders have more opportunity to choose from a broader variety of substitutable goods and services with many denominations of currencies, i.e., currency

T. Chotigeat and Sang H. Lee
substitution in transaction demand [CSTD]. Foreign money dem and is thus directly related to foreign goods and services demands which, in turn, depend on their relative price expectations.
Furthermore, as capital markets around the world have become increasingly integrated, risk-averse investors have had more opportunity to diversify their wealth among all available currencies, i.e. through currency substitution in speculative demand [CSSD]. Basically, traders attempting to optimize their currency portfolio balances will demand more of a foreign currency when its value is expected to appreciate. In particular, a currency that has a low correlation with their holdings is preferable, given the uncertainty associated with the set of exchange rate expectations.1
However, a usual analysis can show that the optimizing shifts in demand for currency stocks through these two different channels tend to offset each other with a given change in expected exchange rates. Therefore, an attempt to prove empirically the existence of these two demand channels, including each demand channel’s direction and magnitude, is needed. The result would indirectly answer the question of the efficacy of domestic monetary policy in the new environment of world trade and capital liberalization.
In this paper, the Japanese money demand function is empirically estimated and analysed for the possible existence of substitution effects between the yen and US and Canadian dollars. Japan is selected for this study because it is an open economy with relatively large trading volume in world markets and a currency widely held among traders. The Canadian dollar is included in the analysis because it has a low correlation with the yen in their exchange rate movements; thus it could provide a channel of CSSD when traders prefer Canadian dollars to diversify their currency portfolios.
THEORY AND EVIDENCEPrevious StudiesStandard monetary theory which assumes that residents of a single country hold only
the national money has been criticized by Miles (1978a), noting that when economic agents hold both domestic and foreign currencies, the composition of these cash balance portfolios will vary with the relevant opportunity cost of holding real balances of the various types of currencies. Therefore, a change of monetary policy in a foreign country will change the relative costs of holding currencies and thus induce offsetting inflows or outflows of money. An excess supply of foreign currency flows to a domestic country by the distribution effect and changes in price levels that are not consistent with the traditional flexible exchange rate model. McKinnon (1982) argues that high substitutability among industrial countries’ currencies destabilizes the demand for individual national currencies so that one cannot make much sense out of year-to-year changes in purely national monetary aggregates in explaining cycles in purely national rates of inflation. Therefore, the growth in the world supply is a better predictor of American inflation than the US money growth rate. Lapan and Enders (1983) conclude that in the absence of government control, if the private sector views the currencies as perfect substitutes for each other, then the exchange rate must be invarian t over time and indeterminate. Calvo and Rodriguez (1977) incorporate currency substitution in their exchange rate determ ination model and explain exchange rate overshooting. In Daniel (1981), currency substitution is a channel for international transmission of monetary disturbances under flexible exchange rates in both the long and short term. In the short term, currency substitution can be responsible for overshooting the exchange rate and affects the national level of real wealth and consumption because of the unexpected change in money supply.
On the other hand, Thom as (1985) explains that the monetary service model is more likely than the portfolio balance model to explain the interactions of domestic and foreign money demand. This implies that the demand for alternative monies is from the real rather than the financial channel, and the transaction services that money produces
156 Pertanika J. Soc. Sci. & Hum. Vol. 4 No. 2, 1996

Currency Substitution via Expected Exchange Rate and Domestic Money
are the main reason for the money demand rather than its expected real return or risk when complete bond markets exist.
Both H am berger (1977) and Britain (1981) support the currency substitution hypothesis by employing an alternative empirical procedure which examines the cross-correlations of the residuals from regressing a velocity variable on the time variable. Studies on this issue for developing countries include Ramirez-Rojas (1985) for Argentina, Mexico, and Uruguay, Fasano-Filho (1986) for Argentina, Marquez (1987) for Venezuela, and Arize (1991) for South Korea. All their findings support the evidence of CSH. To a varying degree, it is an im portant feature of these developing countries.
Bordo and Choudhri (1982) note that the differential cost of holding foreign instead of domestic money is the expected change in the exchange rate, but it does empirically exist in the C anadian money dem and function. Darby et al. (1983) maintain the view that foreign bonds are generally more important substitutes for domestic money than foreign money. They include a foreign interest rate plus expected depreciation term in estimating the domestic money demand function and conclude that foreign-asset substitution for domestic money is not an important channel of economic transmission among countries. Batten and Hafer (1986) raise some empirical issues about choosing economic variables to explain the CSH and propose a testing framework that avoids the problems associated with previous works. By employing the distributed lag model and the GNP deflator as the dependent variable, they found that adding the rest of the world money growth to the explanatory power of domestic money growth alone did not offer more explanation to US inflation.
The evidence indicates that the role of currency substitution in domestic money demand is mixed at best in both empirical and theoretical studies. Most em pirical studies, however, do not explicitly differentiate the two different channel-of-substitution effects and have contributed much to the debate about the existence and the significance of the effects.
Empirical M odelUnder the rational expectation assumption, an economic agent could optimally expect a future exchange rate one period ahead of the realized exchange rate, using all available relevant information (Mishkin 1983). The forecasting equation that can be used to generate the anticipation of the growth rate of a basket of current spot exchange rates expressed in domestic currency per unit of foreign currency, St, is.
St = Zt-i • ol + ut (1)where
Zt_i = a vector of regressors available at time t-1 to forecast St (variables like interest rate, money supply, and trade balance, etc. known at t-1, t-2, t-3,..., t-n),
a ’ = a vector of coefficients to be estimated,
ut = an error term which is assumed to be uncorrelated with any information available at t-1 (which includes any variable in Z t_i or ut_i for all i > 1).
An optimal forecast for St then simply involves taking expectations of equation (1) conditional on information available at t-1 as
E[St] = Zt_! • a ' (2)where E[.] is an expectation operator.
The hypothesis for CSTD and CSSD suggests that the domestic money demand is a function not only of domestic factors like income and the interest rate, but also of international influences through future expectations of exchange rates. Therefore, the money demand equation can be specified as
mt = mt + E[St] i + et (3)where
mt = the growth rate of real money demand,
mt = an equilibrium money demand based only on the domestic fac-
Pertanika J. Soc. Sci. & Hum. Vol. 4 No. 2, 1996 157
T. Chotigeat and Sang H. Lee
tors, i.e. the interest rate and income variables (however, in this study the interest rate variable was not selected as an independent variable to estim ate Japanese money demand function),
y’ = vector of coefficients for forecasted (expected) exchange rates as independent variables, i.e. the expected exchange rates for yen/C$ and yen/US$ from previous two equations,
et = a serially uncorrelated disturb- ance-term.
The CSTD hypothesis proposes that the parameter y’ is positive and that the expected depreciation of the exchange rate will induce the substitution of foreign goods and services for domestic ones in the world market and force both domestic and foreign traders to dem and more of domestic than foreign currency. On the other hand, the CSSD hypothesis suggests a negative parameter; the expected depreciation of exchange rates reduces domestic money demand for the utility-maximizing currency traders. These substitution effects will create a problem of monetary dependency if the coefficients are significantly different from zero, although the substitution effects tend to offset each other.
Since equations(l) and (3) share information by using common variables in the system, it is likely that the disturbances from the two are correlated. The technique of joint nonlinear estimation of (1) and (3) will be used for the efficient estimation of parameters.2
To test the hypotheses of CSTD and CSSD, a constrained system of equations restricting the parameters for the expected exchange rates to zero is estimated. Then, a likelihood ratio test is performed to compare the constrained and unconstrained systems. The likelihood ratio is computed as
LR = 2(Lu-Lc) which is distributed as chi-square with q degrees of freedom,where
Lu = log likelihood value of unconstrained system,
Lc = log likelihood value of constrained system,
q = number of coefficients being restricted.
Furtherm ore, the Aaike Inform ation Criterion (AIC) (Amemiya 1980) is used to select the lag length of relevant variable in the exchange rate and money demand equations.3DataFrom Citibase, the monthly data for the money supply, the short-term interest rate, and the industrial production and consumer price indices are collected for Japan , USA and Canada from January 1977 to December1989 (total 156 months). In addition, the monthly data for the exchange rates and import and export volume vis-a-vis USA are collected for Japan and Canada. The Canadian exchange rates are then converted into a series expressed as the number of Japanese yen per Canadian dollar. The real industrial production is used for the real income measure as a proxy. For the stationarity of each of these data, the first difference of interest rate and the first difference of growth rate for exchange rate, real income, money supply, import, and export are used. The tests of stationarity for these series using regressions of each of these series against time trend and the square of time trend show no evidence of the rejections against stationarity. Note that, in this study, no attempt is made to test whether systems of equations are cointegrated since expected values of exchange rates are used rather than actual exchange rates in the Ja p a nese money demand function (equation 3).
EMPIRICAL RESULTSTable 1 shows the contemporaneous correlation coefficients of five major currencies on their growth rates of the spot exchange rate per US dollar. It also shows the average merchandise trading volume of these countries with USA. The lowest correlation between the Canadian dollar and Japanese yen suggests that the yen per Canadian dollar exchange rate would be a good candidate to
158 Pertanika J. Soc. Sci. & Hum. Vol. 4 No. 2, 1996

Currency Substitution via Expected Exchange Rate and Domestic Money
TABLE 1Correlation matrix of five major currencies*
(January 1977 - December 1989)£ c$ FR GM ¥
£ 1.00cs 0.25 1.00FR 0.66 0.23 1.00GM 0.69 0.19 0.94 1.00¥ 0.56 0.09 0.68 0.66 1.00
* Growth rates of spot exchange rate (each currency per US dollar)
£c$FRGM¥
British pound Canadian dollar French franc German mark Japanese yen
Average Monthly Volume and Growth Rate of Merchandise Trade with USA** (Million US dollars, January 1977 - December 1989)
UK Canada France Germany JapanExports to USA: 1,067 4,691 633 1,393 4,442
(0.9%) (0.8%) (1.0%) (0.9%) (1.1%)Imports from USA: 1,011 3,740 576 848 1,987
(0.9%) (0.7%) (0.8%) (0.7%) (0.9%)** Average growth rates in parenthesis
test the CSSD hypothesis on the Japan money demand function. Although it is not shown in the table, these two countries have lowest correlation coefficient of monthly growth rate of trade volume with USA. On the other hand, the highest growth rate and the relatively large volume of trade between USA and Japan suggest a high degree of CSTD between yen and the US dollar.
For these reasons, the unconstrained system of two different exchange rates (¥/C $ and ¥ / US$) and Japanese money demand equations were estimated with the nonlinear maximum likelihood estimation technique. However, the final specifications of each equation were first determined by the AIC technique for their appropriate variables and lag lengths and reported in Table 2; the equation is repeatedly estimated with various lag lengths, and then the appropriate order of lag length is determined by selecting the order with the lowest AIC value. Some usual
tests are run for robustness of these specifications. Since each equation contains lagged dependent variables, Breusch and Pagan’s (1980) Lagrange multiplier test was applied to analyse the possibility of serial correlations of a higher order.4 No evidence of significant serial correlations was found in error terms up to the 6th lag at the 5% significance level. For the test of heteroscedasticity, Breusch and Pagan’s (1979) chi-square test method was used, and no significant evidence of violations of homoscedasticity at the 5% significance level was found.5 Based on the homoscedastic error terms, it was possible to perform Chow tests for the exchange rate equations by dividing the samples into two equally sized sub-groups because each equation is estimated first with the OLS procedure before substituting in the system of equations. The resulting F-statistics show that the stability of the param eters was not rejected at 5% significance level for all equations.
Pertanika J. Soc. Sci. & Hum. Vol. 4 No. 2, 1996 159
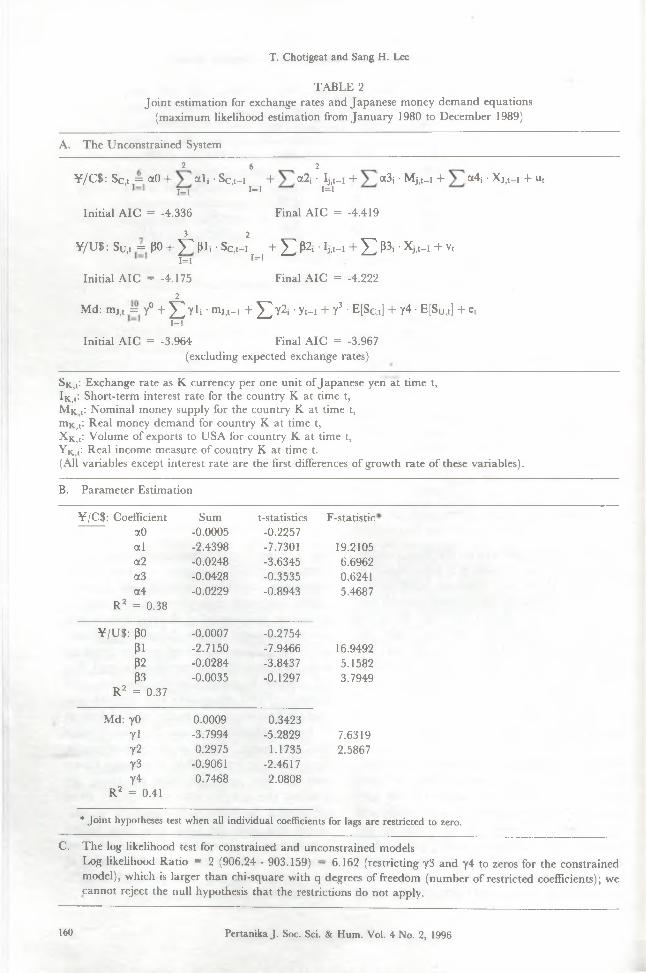
T. Chotigeat and Sang H. Lee
TABLE 2Joint estimation for exchange rates and Japanese money demand equations
(maximum likelihood estimation from January 1980 to December 1989)A. The Unconstrained System
2 6 2 ¥ /C $ : Sc,t = a0 4- alj • Sc,t-i + a2j • Ij)t-i + a3j * Mj,t-i + a i * Xj?t-i 4- ut
j _ j i= i i= i
Initial AIC = -4.336 Final AIC = -4.4193 2
¥/U S: SUit = pO + ^Tpl,- Sc,,-i + ^ P2, ■ IJit_, + £ p3j • Xjit_i + vt 1=1 1=1
Initial AIC = -4.175 Final AIC = -4.2222
Md: mj,, = y° + ^ y l i • mj,t_i + ^ y 2 j • yt_i + y3 • E[Sc ,t] + y4 • E[Su,t] + e,1=1
Initial AIC = -3.964 Final AIC = -3.967(excluding expected exchange rates)
Sic(t: Exchange rate as K currency per one unit of Japanese yen at time t,IK,t: Short-term interest rate for the country K at time t,MK t: Nominal money supply for the country K at time t, mK)t: Real money demand for country K at time t,X K)t: Volume of exports to USA for country K at time t,YK t: Real income measure of country K at time t.(All variables except interest rate are the first differences of growth rate of these variables).B. Parameter Estimation
¥/C$: Coefficient Sum t-statistics F-statistic3a0 -0.0005 -0.2257al -2.4398 -7.7301 19.2105a2 -0.0248 -3.6345 6.6962oc3 -0.0428 -0.3535 0.6241a4 -0.0229 -0.8943 5.4687
R2 = 0.38¥/U$: P0 -0.0007 -0.2754
PI -2.7150 -7.9466 16.9492P2 -0.0284 -3.8437 5.1582P3 -0.0035 -0.1297 3.7949
R2 = 0.37Md: y0 0.0009 0.3423
y \ -3.7994 -5.2829 7.631972 0.2975 1.1735 2.586773 -0.9061 -2.4617y4 0.7468 2.0808
R2 = 0.41* Joint hypotheses test when all individual coefficients for lags are restricted to zero.
C. The log likelihood test for constrained and unconstrained modelsLog likelihood Ratio = 2 (906.24 - 903.159) — 6.162 (restricting y3 and y4 to zeros for the constrained model), which is larger than chi-square with q degrees of freedom (number of restricted coefficients); we cannot reject the null hypothesis that the restrictions do not apply.
160 Pertanika J. Soc. Sci. & Hum. Vol. 4 No. 2, 1996
Currency Substitution via Expected Exchange Rate and Domestic Money
The estimated parameters of the unconstrained system are presented in part B of Table 2; both exchange rate equations have significant negative effects of Japanese interest rate on the exchange rate in the long term.6 When the Japanese interest rate increases, both the ¥ /C $ and ¥ /U S $ exchange rates decrease, implying the appreciation of the yen vis-a-vis the Canadian and US dollars. This result follows the balance of paym ents approach to exchange rate determination where a rising domestic interest rate should lower the exchange rate either by attracting capital from abroad or by reducing domestic expenditure for imports (and thereby improve the trade balance). Although the sum coefficients are not significant, the Japanese export variables have significant F-statistics for all lags of zero. Investigating individual coefficients of the export variable shows partial support of the fact that an increase in Japanese exports causes the appreciation of the yen in the short term. Based on these observations, both CSTD and CSSD can be expected in the Japanese money demand function. Note that interest rate variable was omitted in the Japanese money demand equation because of a technical reason (the AIC value of the equation is higher if it is included); no attem pt is made here to explain why it does not have any effect on the Japanese money demand.
In fact, the coefficients of the expected exchange rates in the Japanese money demand equation show negative and positive signs in their param eters for ¥ /C $ and ¥ /U S $ exchange rates, respectively (see Table 2, p a rt B). The significant and negative coefficient for the ¥ /C $ rate (y3 = -0.9061) can be interpreted as the expected depreciation of the yen inducing currency traders to reduce their holdings of Japanese money in an attem pt to avoid the associated capital loss, while the expected appreciation of the yen encourages them to demand more Japanese money. This result, combined with the negative effect of the Japanese interest rate or exchange rate, is consistent with the CSSD hypothesis that a change in either interest rate or exchange rate expectation exerts an influence on the composition of
optimal money holdings for a currency trader and provides corresponding capital flows which affect the domestic money holdings.
On the other hand, the coefficient for the ¥ /U S$ rate (y4 = 0.7468) has a significantly positive sign in the money demand equation. This result combined with the negative effect of the Japanese interest rate on the exchange rate shows that CSTD dominates CSSD in the Japanese money demand with respect to the ¥ /U S$ exchange rate, given the fact that USA is Jap an ’s largest trading partner, and the growth rate of trading volume is the highest among the major US trading partners. Therefore, when the yen is expected to depreciate, US im porters dem and more Japanese goods, and thus demand more yen balance to finance the increased trade.
A constrained system .of equations (with the restrictions of the parameters for the expected exchange rates at zero in the money demand equation) is also estimated (see Table 2, part C). The log likelihood ratio test on these constrained and unconstrained systems shows the rejection of the null hypothesis that the constrained system is present at the 5% significance level. This result and the offsetting influences of different foreign exchange rates on money demand may provide a possible explanation for the conflicting results of previous studies on the significance of currency substitution effects in other countries. However, by differentiating the two different channels of substitution effects using the ¥ /C $ and ¥ /U S $ exchange rates, the results identify the direction and magnitude of the currency substitution effect of the two different channels. W ithout including these two channels of substitution, the domestic money demand function may mot be stable over time as shown in the log likelihood test.
CONCLUSIONThis paper analyses the Japanese money demand function and tests the currency substitution hypothesis (CSH) in which the expected exchange rates for yen per Canadian dollar ( ¥ /C$) and yen per US dollar (¥ / US$) affect the Japanese money demand in
Pertanika J. Soc. Sci. & Hum. Vol. 4 No. 2, 1996 161

T. Chotigeat and Sang H. Lee
two different ways, depending on the magnitude of two different channels of substitutions: the currency substitution in transaction demand and the currency substitution in speculative demand for money. The rationale for including these two exchange rates in the Japanese money demand arises from the following: (1) this approach may reconcile the previous controversies over the significance of the CSH between the portfolio and money-service approaches of money demand;(2) the transaction demand could be the dominant channel with ¥ /U S$ because of the high trade volume between USA and Japan; and finally (3) speculative demand could be the dominant channel with ¥ /C $ because of their low correlation in the exchange rate changes.
The results of m axim um likelihood estimations on the system of equations show that the current expectation of ¥ /C $ has a significant negative effect on the Japanese money demand, implying currency substitution in the speculative demand for money. On the contrary, the currency expectation of ¥/U S$ shows a significant positive effect on the Japanese money demand function, implying currency substitution in the transaction demand for money. The offsetting effects of these two different substitutions could be the reason for the previous controversies over the existence and significance of currency substitution effects. By identifying these two different channels explicitly, the Japanese money demand function is found to be dependent on foreign exchange rate expectations, thus providing support for the CSH, at least in the period analysed here. However, although these expected exchange rates are significant in determining equilibrium money demand for Japan, the effects tend to offset each other and the net effect of foreign exchange rates may be negligible.
In comparison with previous studies, tests based on combined rather than separate channels of currency of substitution show some doubt about the existence of the CSH, but in this paper findings confirm the existence of the CSH with the opposite signs for the coefficients of expected exchange rate variables in the money demand equations
and give more information that may explain the previous controversy over the existence and significance of currency substitution effect. An individual country’s monetary authority must now recognize that its policy can affect foreign exchange rates differently depending on what money demand channel is dominant in that currency. In essence, the rapidly integrating capital market seems to diminish an individual country’s ability to conduct the monetary policy, e.g. the disaster in Mexico’s emerging capital market in 1994; hence a coordinating monetary policies or a newly designed exchange rate system may be needed.Footnotes1. The portfolio optimization decision here assumes the constant covariances of returns on all other assets and considers only the behaviour of the exchange rate returns of one currency vis-a-vis other currencies.2. The estimation procedures can be described step by step as follows: (1) Estimate exchange rate equations with OLS. (2) Get fitted values (expected values) of Yen/C$ and Yen/US$ exchange rates. (3) Use these values as independent variables in the memory demand equation and estimate the three equations (two exchange rate and one money demand equations) jointly with maximum likelihood method. (4) Use coefficients estimated from the procedure (3). (5) Again re-estimate the three equations jointly, and get estimated coefficients to get fitted values of exchange rates. (6) Re-estimate the three equations jointly with newly estimated values of exchange rates to replace the old independent variables in the money demand equation. (7) Continue these procedures until the highest possible R2 value for the joint estimation is obtained.3. In the forecasting of exchange rates, the Granger (1969) causality concept was used for a specification of the model. A variable Z is said to Granger-cause another variable S if S can be predicted better from the past values of S alone. The forecasting equation ofS should include lagged values of S to eliminate any serial correlation in the residuals. If Z Granger-causes S, then it should also be used in an optimal forecast ofS. To get the relevant variables Z and their optimum lag length, AICs are calculated up to the 10th lag of both domestic and foreign variables including the first differences of interest rate, first difference of the real growth rate of income, the first difference of the growth rate of nominal money supply, and the first differences of the growth rate of trade volume figures. The variable and its lag with minimum AIC are selected.
162 Pertanika J. Soc. Sci. & Hum. Vol. 4 No. 2, 1996
Currency Substitution via Expected Exchange Rate and Domestic Money
4. Breusch and Pagan’s Lagrange multiplier test for assumption of no serial correlations of higher order in error terms was performed as follows. First, the residual were obtained from OLS estimation, then a series of regressions with current residual as dependent variable was run with lags of different order, p, of residual and independent variables of original equation as regressors. The resulting R2 of each regression multiplied by its number of observations, NR2, is distributed as chi-square with p degrees of freedom when the null hypothesis of no pth order serial correlation is true.5. Breusch and Pagan’s (1979) test for heterosce- dasticty can be performed as follows. Assume error terms are normally distributed. First, get the residuals (e) and variance(a2) from original equation. Then make a new series, gl = (e2/a 2), and run another regression with g as a dependent variable. It can be shown that half the difference between the total sum of squares and the residual sum of square from the second regression is distributed asymptotically as chi-square distribution with k degrees of freedom when the null hypothesis of homoscedasticity is true.6. The sum coefficients of Japanese interest rate changes have significant long-term negative effects on the exchange rates, and the negative coefficients are consistent for all lags considered in the equations.
REFERENCESAMEMIYA, T. 1980. Selection of regressors. Inter
national Economic Review 21: 331-354.ARIZE, A.C. 1991. Currency substitution in
Korea. American Economist 35(2): 67-72.BANA, I.M. and J. HANDA. 1987. Currency sub
stitution: A multicurrency study of Canada. International Economic Journal Autum n: 71-86.
BATTEN, D.S. and R.W. HAFER. 1986. The im pact o f international factors on U .S. inflation: An empirical test of the currency substitution hypothesis. Southern Economic Journal 53(2): 400-412.
BORDO, M .D. and E.U. CHOUDHRI. 1982. Currency substitution and the demand for money: Some evidence for Canada. Journal o f Money, Credit, and Banking 14: 48-57.
B r e u sc h , T.S. and A.R. P agan . 1980. The Lagrange multiplier test and its applications of model specification in economics. Review o f Economic Studies 47: 239-253.
BRITAIN, B. 1981. International currency substitution and the apparent instability of velocity in some Western European economies and the United States. Journal o f Money, Credit, and Banking 13(2): 135-155.
CALVO, G.A. and C.A. RODRIQUEZ. 1977. A model of exchange rate determination under currency substitution and rational expectations. Journal o f Political Economy 85(3): 617- 625.
CHEN, CHAU-NAN and T.W. TSAUR. 1983. Currency substitution and foreign inflation. Quarterly Journal o f Economics Feb: 177-184.
DANIEL, BETTY C. 1984. Monetary autonomy and exchange rate dynamics under currency substitution. Journal o f International Economics 19: 119-139.
D a r b y , M .R., J.R . L o t h i a n , A.E. G a n d o l f i , A.J. S c h w a r t z and A.C. S t o c k m a n . 1983. The International Transmission o f Inflation. Chicago: University of Chicago Press.
FASANO-FlLHO, U. 1986. Currency substitution and the demand for money: the Argentine case 1960-1976. Weltwirtschaftliches Archiv 122(2): 327-339.
GRANGER, C.W.J. 1969. Investigating causal relations by econometric models and cross- spectral methods. Econometrica 37: 424-438.
H A M BER G ER, M.J. 1977. The demand for money in an open economy: German and United Kingdom. Journal o f Monetary Economics 3: 25-40.
K in g , D.T., B.H. P u t n a m and D.S. W i l f o r d . 1980. A currency portfolio approach to exchange rate determination: Exchange rate stability and the independence of monetary policy. In The Monetary Approach to International Adjustm ent, ed. B.H. Putnam and D .S. Wilford, p. 183-184. New York: Praeger.
LAPAN, H.E. and W. ENDERS. 1983. Rational expectations, endogenous currency substitutions, and exchange rate determination. Quarterly Journal o f Economics August: 427- 439.
MARQUEZ, J. 1987. Money demand in open economies; a currency substitution model for
Pertanika J. Soc. Sci. & Hum. Vol. 4 No. 2, 1996 163
T. Chotigeat and Sang H. Lee
Venezuela. Journal o f International Money and Finance 6: 167-178.
M cKINNON, RONALD I. 1982. Currency substitution and instability in the world dollar standard. American Economic Review June: 320-333.
MILES, M a r c A. 1978a. Currency substitution, flexible exchange rates and monetary independence. American Economic Review 68: 428- 436.
M IL E S, M A RC A. 1978b. Currency substitution: perspective, implication, and empirical evidence. In The Monetary Approach to International Adjustment, ed. B.H. Putnam and D.S. Wil- ford, p. 170-198. New York: Praeger.
M ISH K IN , FR ED ER IC S. 1983. A Rational Expectations Approach to Macroeconometrics. Chicago: University of Chicago Press.
RA M IR EZ-R O JA Sj C.L. 1985. Currency substitution in Argentina, Mexico, and Uruguay. IM F S taff Paper 32: 629-667.
THOM AS, L e e R . 1985. Portfolio theory and currency substitution. Journal o f Money, Credit, and Banking 17(3): 347-357.
(Received 13 March 1995)
164 Pertanika J. Soc. Sci. & Hum. Vol. 4 No. 2, 1996
Pertanika J. Soc. Sci. & Hum. 4(2): 165-173 (1996) ISSN: 0128-7702© Penerbit Universiti Pertanian Malaysia
Expenditure Patterns o f Singaporean T ourists in M alaysiaAHMAD SHUIB and DORA BULAN
Department of Natural Resource Economics Faculty of Economics and Management
Universiti Pertanian Malaysia 43400 Serdang, Selangor, Malaysia
Keywords: expenditure, tourism products, dem ographic variables, expenditure coefficients, e lastic ities o f expenditure
ABSTRAKCorak perbelanjaan pelancong Singapura ke atas produk pelancongan dikaji. Jumlah perbelajaan isi keluarga didapati mempunyai pengaruh yang besar ke atas perbelanjaan pengangkutan, makanan, tempat tinggal, khidmat rekreasi dan cenderamata. Keanjalaan perbelanjaan bernilai 0.84 untuk barang makanan,0.63 untuk pengangkutan, 0.79 untuk kemudahan tempat tinggal, 1.32 untuk perkhidmatan rekreasi dan 1.49 untuk barang cenderamata. Berdasarkan koefisien perbelanjaan pula makanan, pengangkutan dan kemudahan tempat tinggal dikategorikan sebagai barang perlu, manakala perkhidmatan rekreasi dan cenderamata sebagai barang atasan.
ABSTRACTThe patterns of expenditure on major tourist products by Singaporean tourists are analysed. The total household expenditure of the tourists is highly significant in influencing expenditure on transport, food, accommodation, recreational services and souvenirs. The elasticities of expenditure for the tourist products are 0.84 for food items, 0.63 for transport, 0.79 for accommodation, 1.32 for recreational services and 1.49 for souvenirs. Based on the expenditure coefficient, food, transport and accommodation are classified as necessities, while services and souvenirs tend to be considered as luxuries by tourists.
INTRO DUCTIO NIn recent years tourism has been identified as an economic activity that contributes to the economic growth of tourist-receiving countries. In Malaysia, the position of the tourism industry as the third major foreign exchange earner in 1990 has made it one of the most important economic activities in the overall development of the Malaysian economy.
The estimation of tourism-related expenditure provides a basis for determining the economic consequences of tourism (Fritz et al. 1984). Therefore, the economic impact of tourism on a country’s economy is often estimated through the expenditure behaviour of tourists (Henderson 1975).
A study by Abdul Aziz et al. (1990) examined the economic impact of tourism in terms of direct, indirect and induced income
and employment multipliers and technological linkages. It was established that the tourism sector has the potential to generate income in the national economy, especially through household expenditure, in addition to the induced-generating capacity of the manufacturing sector.
The study also pointed out that the implementation of tourism policies would generate a comparatively high level of employment in the following sectors: fishing, beverages, petroleum products and coal, air transport, business services and cultural services. Total employment multipliers in these sectors were greater than the national average. Consequently, any tourist expenditure in these sectors would eventually have a significant impact on employment generation in the national economy (Abdul Aziz et al. 1990).
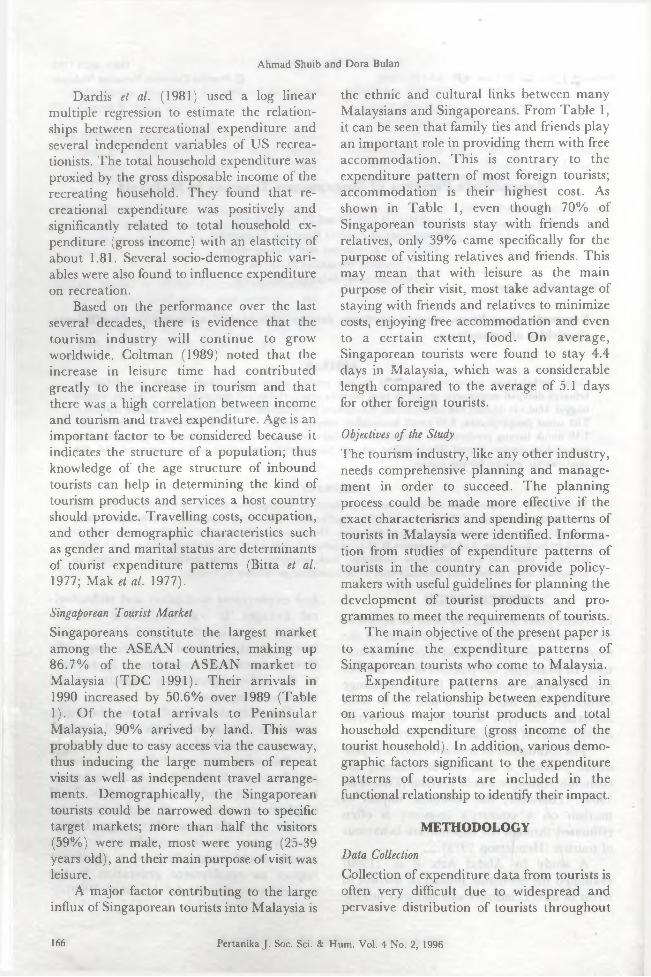
Ahmad Shuib and Dora Bulan
Dardis et al. (1981) used a log linear multiple regression to estimate the relationships between recreational expenditure and several independent variables of US recreationists. The total household expenditure was proxied by the gross disposable income of the recreating household. They found that recreational expenditure was positively and significantly related to total household expenditure (gross income) with an elasticity of about 1.81. Several socio-demographic variables were also found to influence expenditure on recreation.
Based on the performance over the last several decades, there is evidence that the tourism industry will continue to grow worldwide. Coltman (1989) noted that the increase in leisure time had contributed greatly to the increase in tourism and that there was a high correlation between income and tourism and travel expenditure. Age is an important factor to be considered because it indicates the structure of a population; thus knowledge of the age structure of inbound tourists can help in determining the kind of tourism products and services a host country should provide. Travelling costs, occupation, and other demographic characteristics such as gender and marital status are determinants of tourist expenditure patterns (Bitta et al. 1977; Mak et al. 1977).Singaporean Tourist M arket Singaporeans constitute the largest market among the ASEAN countries, making up 86.7% of the total ASEAN m arket to Malaysia (TDC 1991). Their arrivals in1990 increased by 50.6% over 1989 (Table 1). O f the total arrivals to Peninsular Malaysia, 90% arrived by land. This was probably due to easy access via the causeway, thus inducing the large numbers of repeat visits as well as independent travel arrangements. Demographically, the Singaporean tourists could be narrowed down to specific target markets; more than half the visitors (59%) were male, most were young (25-39 years old), and their main purpose of visit was leisure.
A major factor contributing to the large influx of Singaporean tourists into Malaysia is
the ethnic and cultural links between many Malaysians and Singaporeans. From Table 1, it can be seen that family ties and friends play an im portant role in providing them with free accommodation. This is contrary to the expenditure pattern of most foreign tourists; accommodation is their highest cost. As shown in Table 1, even though 70% of Singaporean tourists stay with friends and relatives, only 39% came specifically for the purpose of visiting relatives and friends. This may mean that with leisure as the main purpose of their visit, most take advantage of staying with friends and relatives to minimize costs, enjoying free accommodation and even to a certain extent, food. On average, Singaporean tourists were found to stay 4.4 days in Malaysia, which was a considerable length compared to the average of 5.1 days for other foreign tourists.Objectives o f the StudyThe tourism industry, like any other industry, needs comprehensive planning and management in order to succeed. The planning process could be made more effective if the exact characterisrics and spending patterns of tourists in Malaysia were identified. Information from studies of expenditure patterns of tourists in the country can provide policymakers with useful guidelines for planning the development of tourist products and programmes to meet the requirements of tourists.
The main objective of the present paper is to examine the expenditure patterns of Singaporean tourists who come to Malaysia.
Expenditure patterns are analysed in terms of the relationship between expenditure on various major tourist products and total household expenditure (gross income of the tourist household). In addition, various demographic factors significant to the expenditure patterns of tourists are included in the functional relationship to identify their impact.
METHODOLOGYD ata CollectionCollection of expenditure data from tourists is often very difficult due to widespread and pervasive distribution of tourists throughout
166 Pertanika J. Soc. Sci. & Hum. Vol. 4 No. 2, 1996
Expenditure Patterns of Singaporean Tourists in Malaysia
TABLE 1Characteristics of Singaporean visitors to Peninsular Malaysia
Item 1988 1989 1990No. of visitors 2,305,898 2,432,720 3,663,679Mode of travel
Air 156,801 165,425 249,130Land 2,068,391 2,182,152 3,286,320Sea 20,706 85,143 128,229
GenderMale 1,360,480 1,435,306 2,161,571Female 945,418 997,414 1,502,108
Major age groupsBelow 24 597,228 630,075 948,8932 4 -3 1 9 1,023,819 1,080,129 1,626,6734 0 - 5 9 555,721 586,286 882,94760 & above 129,130 138,230 205,166
Purpose of visitLeisure 1,219,820 1,286,910 1,938,086Business 184,472 194,616 292,619Family visit 901,606 951,194 1,432,974
AccommodationHotels 769,499 783,334 1,179,705Family/friends 1,536,399 1,649,386 2,483,974
Frequency of visitFirst visit 69,177 72,980 109,910Repeat visit 2,236,721 2,359,740 3,553,769
Travel arrangementsTour package 219,060 231,107 348,050Independent 2,086,838 2,201,613 3,315,629Average length of stay 4.0 4.4 4.4Note: 1 estimates based on 1985 pattern Source: TDC (1991)
the country. Most studies on expenditure patterns use sample surveys. It is important, however, to ensure that proper sampling techniques are used to select the samples as well as to use different weighing procedures because of the varied characteristics of tourists.
In this study, primary data was used to obtain the latest information on the expenditure patterns of Singaporean tourists. The primary data needed included information about spending and general characteristics of Singaporean tourists.Tourist SurveyA modified mail survey was used to obtain information from a sample of the Singaporean tourists in selected hotels (including chalets,
rest-houses, and private boarding houses). For convenience, Malaysia was divided into five geographical regions. The northern region included Perlis, Kedah, Penang and Perak. The central region was made up of Selangor and Kuala Lumpur. Negeri Sembi- lan, Melaka and Johor made up the southern region. The east coast region covered Kelan- tan, Terengganu and Pahang, while East Malaysia comprised Sabah and Sarawak. The hotels were selected based on class and number of rooms in the individual geographical region. The list of hotels were obtained from TD C ’s publication “Supply of Hotel Rooms in M alaysia” (TDC 1991b). The hotels were classified thus: large hotels, those with more than 100 rooms; medium hotels, those with 50 - 99 rooms; small hotels, those
Pertanika J. Soc. Sci. & Hum. Vol. 4 No. 2, 1996 167
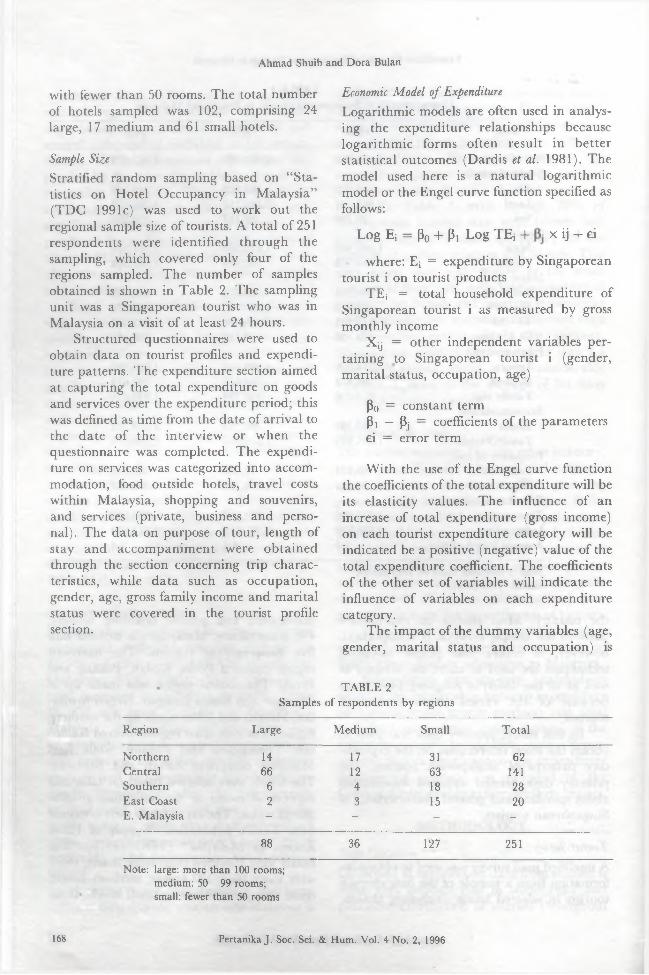
Ahmad Shuib and Dora Bulan
with fewer than 50 rooms. The total number of hotels sampled was 102, comprising 24 large, 17 medium and 61 small hotels.Sample SizeStratified random sampling based on “Statistics on Hotel Occupancy in Malaysia” (TDC 1991c) was used to work out the regional sample size of tourists. A total of 251 respondents were identified through the sampling, which covered only four of the regions sampled. The number of samples obtained is shown in Table 2. The sampling unit was a Singaporean tourist who was in Malaysia on a visit of at least 24 hours.
Structured questionnaires were used to obtain data on tourist profiles and expenditure patterns. The expenditure section aimed at capturing the total expenditure on goods and services over the expenditure period; this was defined as time from the date of arrival to the date of the interview or when the questionnaire was completed. The expenditure on services was categorized into accommodation, food outside hotels, travel costs within Malaysia, shopping and souvenirs, and services (private, business and personal). The data on purpose of tour, length of stay and accom panim ent were obtained through the section concerning trip characteristics, while data such as occupation, gender, age, gross family income and marital status were covered in the tourist profile section.
Economic Model of Expenditure Logarithmic models are often used in analysing the expenditure relationships because logarithm ic forms often result in better statistical outcomes (Dardis et al. 1981). The model used here is a natural logarithmic model or the Engel curve function specified as follows:
Log Ei = p0 4- Pi Log TEi + x ij + eiwhere: Ei = expenditure by Singaporean
tourist i on tourist productsTEi = to ta l household expenditure of
Singaporean tourist i as measured by gross monthly income
X jj = other independent variables pertaining to Singaporean tourist i (gender, marital status, occupation, age)
Po = constant termP! — Pj = coefficients of the parametersei = error termWith the use of the Engel curve function
the coefficients of the total expenditure will be its elasticity values. The influence of an increase of total expenditure (gross income) on each tourist expenditure category will be indicated be a positive (negative) value of the total expenditure coefficient. The coefficients of the other set of variables will indicate the influence of variables on each expenditure category.
The impact of the dummy variables (age, gender, marital status and occupation) is
TABLE 2 Samples of respondents by regions
Region Large Medium Small TotalNorthern 14 17 31 62Central 66 12 63 141Southern 6 4 18 28East Coast 2 3 15 20E. Malaysia - - - -
88 36 127 251Note: large: more than 100 rooms;
medium: 50 - 99 rooms; small: fewer than 50 rooms
168 Pertanika J. Soc. Sci. & Hum. Vol. 4 No. 2, 1996
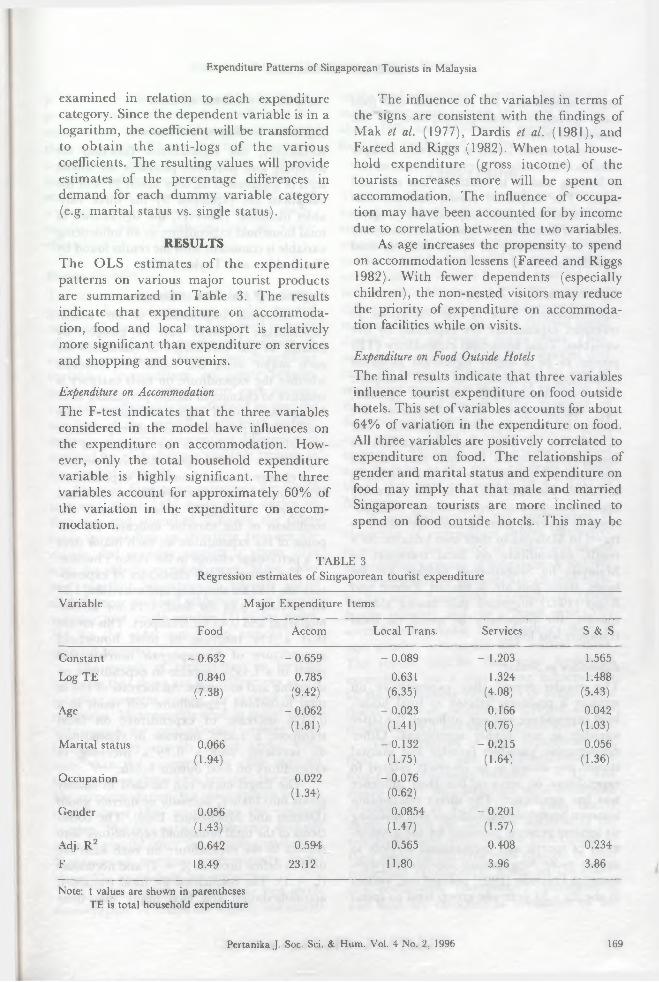
Expenditure Patterns of Singaporean Tourists in Malaysia
examined in relation to each expenditure category. Since the dependent variable is in a logarithm, the coefficient will be transformed to ob tain the anti-logs of the various coefficients. The resulting values will provide estimates of the percentage differences in demand for each dummy variable category (e.g. marital status vs. single status).
RESULTSThe OLS estim ates of the expenditure patterns on various major tourist products are summarized in Table 3. The results indicate that expenditure on accommodation, food and local transport is relatively more significant than expenditure on services and shopping and souvenirs.Expenditure on AccommodationThe F-test indicates that the three variables considered in the model have influences on the expenditure on accommodation. However, only the total household expenditure variable is highly significant. The three variables account for approximately 60% of the variation in the expenditure on accommodation.
The influence of the variables in terms of the signs are consistent with the findings of Mak et al. (1977), Dardis et al. (1981), and Fareed and Riggs (1982). When total household expenditure (gross income) of the tourists increases more will be spent on accommodation. The influence of occupation may have been accounted for by income due to correlation between the two variables.
As age increases the propensity to spend on accommodation lessens (Fareed and Riggs 1982). With fewer dependents (especially children), the non-nested visitors may reduce the priority of expenditure on accommodation facilities while on visits.Expenditure on Food Outside HotelsThe final results indicate that three variables influence tourist expenditure on food outside hotels. This set of variables accounts for about 64% of variation in the expenditure on food. All three variables are positively correlated to expenditure on food. The relationships of gender and marital status and expenditure on food may imply that that male and married Singaporean tourists are more inclined to spend on food outside hotels. This may be
TABLE 3Regression estimates of Singaporean tourist expenditure
Variable Major Expenditure ItemsFood Accom Local Trans. Services S & S
Constant - 0.632 - 0.659 - 0.089 - 1.203 1.565Log TE 0.840 0.785 0.631 1.324 1.488
(7.38) (9.42) (6.35) (4.08) (5.43)Age - 0.062 - 0.023 0.166 0.042
(1.81) (1.41) (0.76) (1.03)Marital status 0.066 -0 .1 3 2 -0 .2 1 5 0.056
(1.94) (1.75) (1.64) (1.36)Occupation 0.022 - 0.076
(1.34) (0.62)Gender 0.056 0.0854 - 0.201
(1.43) (1.47) (1.57)Adj. R2 0.642 0.594. 0.565 0.408 0.234F 18.49 23.12 11.80 3.96 3.86Note: t values are shown in parentheses
TE is total household expenditure
Pertanika J. Soc. Sci. & Hum. Vol. 4 No. 2, 1996 169

Ahmad Shuib and Dora Bulan
useful information for restaurant and food stall operators running businesses in the vicinity of hotels.
Food outside hotels is relatively cheaper than food in hotels. However, personal service is lacking and it is relatively less safe and clean. The estimated results indicate that when total household expenditure or gross income of Singaporean tourists increases, they have the tendency to spend less on food outside their hotel.Expenditure on Local Transport Approximately 57% of the variations in transport expenditure are explained by five variables. Total household expenditure (TE) proved to be a highly significant factor in influencing expenditure on local transport. However, demographic variables (gender, age, m arital status and occupation) are shown to be marginally influential. The accessibility of Malaysian destinations to Singaporean tourists by road may explain the lack of significance of the variables included. Furthermore, with the relatively higher standard of living among Singaporeans in general, most of them can afford to travel to Malaysia in their own vehicles. As a result, expenditure on local transport in Malaysia by Singaporean tourists, i.e. for buses, trains and air, is limited. Fareed and Riggs (1982) suggested that among elderly tourists, the propensity to spend on local transport was lower.Expenditure on ServicesThe results reveal tha t expenditure on services is positively related to total household expenditure and age, although the latter variable is not highly significant. O ther demographic variables (gender and marital status) are shown to be inversely related to expenditure on services, but their influence was less significant. The direct relationship between household expenditure and spending on services presents potential for the development of tourist and recreational services to attract more Singaporean tourists. Furthermore, as Coltman (1989) pointed out, visitors in the 25 - 39 year age group tend to spend
more on recreational services.Expenditure on Shopping and Souvenirs Relatively, the expenditure function for shopping and souvenirs produces the lowest level of goodness of fit; only about 24% of the variations are explained by the three variables included. However, the significance of total household expenditure as an influencing variable is consistent with the results found by Houthakker and Taylor (1970).Coefficients o f Elasticities o f Expenditure The economic implications of the tourist expenditure patterns can be gauged by looking at the coefficients of elasticities for each major item; the coefficient indicates whether the expenditure on each category is sensitive to changes in factors pertaining to it. Using the natural logarithm function, the coefficient of the total household expenditure (the elasticity value) is the response of the expenditure on a category due to a percentage change in total household expenditure. When total household expenditure is assumed to equal the family gross income, the coefficient of the variable indicates the response of the expenditure on each major item as a percentage change in the visitor’s income.
The values of the elasticities of expenditure are 1.49 for shopping and souvenirs, 1.32 for services, 0.84 for food, 0.79 for accommodation and 0.63 for transport. This means that a 1 % increase in to tal household expenditure of Singaporean tourists will result in a 1.49% increase in expenditure on shopping and souvenirs. An increase of 1 % in total household expenditure will result in a 0.63% increase in expenditure on local transport; a 1.32% increase in expenditure on services; and a 0.79% increase in expenditure on food outside hotels.
The Engel curve can be used to classify goods into luxury, necessity or inferior goods (Deaton and M uellbauer 1980). The coefficients of the total household expenditure with respect to the expenditure on each item are used to define luxuries (£ > 1) and necessities (£ < 1). The coefficients for local transport, accommodation and food imply that these
170 Pertanika J. Soc. Sci. & Hum. Vol. 4 No. 2, 1996

Expenditure Patterns of Singaporean Tourists in Malaysia
p iucts are considered necessities by Singa- pc *an tourists whereas the coefficients for recreational services and souvenirs classify them as luxuries. The result is fairly consistent a priori since relative to transport, food and accommodation, souvenirs and recreational services can be viewed as luxuries. (The use of a single equation model, as in this study, results in loss of inform ation on crosselasticity) .Dummy VariablesThe dummy variables used for the demographic characteristics (age, gender, marital status and occupation) are examined in terms of their significance to the expenditure on each m ajor item. Since the dependent variables (expenditure on major tourism items) are in logarithmic form, each dummy variable coefficient is transformed so that the anti-logs of the various coefficients provide the estimates of the percentage differences in demand for each dummy variable relative to the omitted variable.
M arried Singaporean tourists are found to spend about 14% more than singles on shopping and souvenirs. Further, the difer- rence in spending on this item between the elderly and younger tourists is about 10% with the elderly spending more. Male, older and m arried Singaporean tourists spend slightly more on local transport than female, younger and single tourists (21% for males, 5% for the older age group and 35% for married tourists).
The survey of expenditure on services indicates that there are big differences in the spending patterns among the various tourist categories. Male tourists tend to spend about 59% more for recreational services than females, older tourists spend about 47% more than the younger ones while married tourists spend about 64% less than the singles. For accommodation, the older tourists tend to spend about 15% more than the younger tourists. The occupational difference does not seem to greatly affect the spending pattern of Singaporean tourists; wage-earners spend about 5% more than non-earners.
As shown in the results, only two sociodemographic variables are slightly influential
on the food expenditure pattern. Married and male Singaporean tourists are found to spend about 16% and 14% more respectively on food than singles and females.
CONCLUSIONThe analysis of tourist expenditure patterns has significant implications for marketing strategy as well as for public policy on tourism promotion. The Singaporean tourist market is highly dominated by male tourists, with a fair distribution between married and non-married. Although there is no significant difference between the expenditure pattern of male and female tourists, the married spend slightly more on certain major items. Thus, supplying tourist products and services that cater for family vacations should be able to encourage more visits as well as spending by these groups of people. The majority of Singaporean tourists are in the 25-39 year age group. T heir average annual gross income is S$62,000. With leisure, vacation and business as the main purposes of their visits, they stay an average of 4.7 days in Malaysia.
A com parison of the coefficients of elasticities of expenditure proves instructive in revealing the sources of differences in the expenditure patterns of Singaporean tourists. Their expenditure patterns are affected highly by total household expenditure (gross family income) and, to a lesser extent, by several demographic characteristics such as age, gender, occupation and marital status. The results indicate that total household expenditure has a very strong influence on all the expenditure categories or major items (local transport, recreational services, accommodation, food and shopping and souvenirs).
The elasticities of total expenditure for food, transport and accom m odation are found to be relatively inelastic (^ < 1). The results imply that although total household expenditure as a proxy for gross family income affects the spending patterns of the tourists for these items, there is little change in their spending patterns with changes in total household expenditure. Based on the elasticity coefficients, transport, accommodation and food are classified as necessities by the
Pertanika J. Soc. Sci. & Hum. Vol. 4 No. 2, 1996 171

Ahmad Shuib and Dora Bulan
Singaporean tourists. Thus, in terms of pricing policy, a lowering of prices of these items may not increase demand for them; on the other hand, improvement and increased availability will help create more revenues by shifting the demand for them. Recreational services and souvenirs are expenditure elastic
> 1), making them luxuries; thus it may be implied that adjusting prices of these items can increase revenue.
The inform ation obtained from the survey can be used as guidelines in formulating programmes to encourage more spending on various major items by various groups of Singaporean tourists. For instance, improvement and increased availability of transport, accommodation and food outside hotel facilities would be more beneficial for the lower income Singaporean tourists. Providing upmarket accommodation facilities would be more attractive to higher income Singaporean tourists since they prefer the accompanying in-house food and recreational services.
Because the study is confined to the analysis of total household expenditure and certain demographic variables, it is assumed implicitly that all Singaporean tourists spend on all the major items. It would be interesting to examine the impacts of other characteristics such as party size, length of stay and per capita daily expenditure on the expenditure of each of the major item. Such information would provide additional insights about changing patterns of expenditure on these major items, especially in relation to expenditure on souvenirs and recreational services.
It is noted that the scope of the study is limited to the data made available from questionnaires distributed only in hotels. This may have resulted in biases in the estimated coefficients since expenditures of other segments of Singaporean tourists are excluded, in particular, Singaporean tourists who are staying with friends and relatives. Additional research is needed to establish the competitiveness of particular products and services to be offered to Singaporean tourists as well as the way they should be organized in the market. Using functional relationships that take into account effects of changes of
tourist products on other items, that is, use of simultaneous techniques, will allow estimation of cross-price elasticities that may be useful to policy-makers.
REFERENCESABDUL AZIZ A. RAHMAN, ^ H M A D SHUIB,
Z a k a r ia h R a s h id and M. S h a h w a h idH. OTHMAN. 1990. The economic impact of tourism in Malaysia. A report submitted to the Economic and Social Commission for Asia and the Pacific (ESCAP), Bangkok and the M inistry o f Arts, Culture and Tourism Malaysia, Kuala Lumpur.
BITTA, A.J.D., D.L. LONDON, G.G. BOOTH and R.R. WEEKS. 1977. Estimating the economic impact of short term tourist events. Journal o f Travel Research 16(2): 46-54.
CO LTM AN, M.M. 1989. Tourism Marketing. New York: Van Nostrand Reinhold.
D a r d is , R., F. D e r r i c k , A. L e h f e l d and K E . WOLFE. 1981. Cross-section studies o f recreation expenditure in the U n ited States. Journal o f Leisure Research 13(3): 181-194.
D e a t o n , A. and J. M u e l l b a u e r . 1980. Economic and Consumer Behaviour. Cambridge: Cambridge University Press.
F a r e e d , A.E. and G.D. RIGGS. 1982. Old-young differences in consumer expenditure patterns. Journal o f Consumer Affairs 16(1): 32-38.
F R I T Z , R .G ., M . K O N E C N Y and P .D . STO UCHES. 1984. Tourism expenditure model - a functional planning and policy making tool. Tourism Management 5(2): 110-117.
HENDERSON, D.M. 1975. The economic impact of tourism: A case study in Greater Tayside (Edinburgh). T T R U Research Report No. 13, University of Edinburgh.
H O U T H A K K ER , H.S. and L.D. T A Y LO R . 1970. Consumer Demand in the United States. Cambridge: Harvard University Press.
M A K , J., J. M O N C U R and D. YO N A M IN E. 1977. Determinants of visitor expenditure and visitor length of stay: A cross-section analysis of U.S. visitors to Hawaii. Journal o f Travel Research 15(3): 5-8.
172 Pertanika J. Soc. Sci. & Hum. Vol. 4 No. 2, 1996
Expenditure Patterns of Singaporean Tourists in Malaysia
TDC. 1991a. Travel business analyst. Kuala TDC. 1991c. Statistics on hotel occupancy inLumpur: Ministry of Arts, Culture and Malaysia. Kuala Lumpur: Ministry of Arts,Tourism Malaysia. Culture and Tourism Malaysia.
TDC. 1991b. Supply of hotel rooms in Malaysia.Kuala Lumpur: Ministry of Arts, Culture and (Received 2 February 1994) Tourism Malaysia.
Pertanika J. Soc. Sci. & Hum. Vol. 4 No. 2, 1996 173

Pertanika J. Soc. Sci. & Hum. 4(2): 175-184 (1996)ISSN: 0128-7702
© Penerbit Universiti Pertanian Malaysia
Sam pling Size and A uditors’ Judgem ents: A Sim ulationMOHAMAD ALI ABDUL-HAMID, SHAMSER MOHAMED and ANNUAR MD-NASSIR
Department of Accounting and Finance Faculty of Economics and Management
Universiti Pertanian Malaysia 43400 UPM Serdang, Selangor, Malaysia
K eywords: audit sam pling, audit assurance, error tainting, sim ulationABSTRAK
Auditor gunapakai teknik-teknik kos efektif dan efisyen untuk mendapatkan bukti-bukti yang membantu mereka didalam memberi pendapat keatas penyata kewangan. Salah satu teknik audit yang lazim digunakan ialah persampelan dan di UK auditor menggunakan saiz sampel sekecil 25 item. Kajian ini menggunakan teknik simulasi Monte Carlo untuk menentukan samada pendapat auditor berdasarkan pelbagai saiz sampel dan aras ralat adalah dibawah paras ketepatan bolehterima. Keputusan kajian mendapati firma-firma yang menggunakan saiz sampel yang kurang daripada 25 item tidak cukup besar untuk memberi pelan persampelan yang berjaya kecuali pada tahap nilai ralat yang rendah. Untuk memperbaiki pelan persampelan dan kualiti audit, adalah dicadangkan saiz sampel minimum hendaklah melebihi 50 item.
ABSTRACTAuditors usually seek cost-effective and efficient techniques to accumulate evidence in an effort to express their opinions on financial statements. One such technique is audit sampling, and in the United Kingdom auditors use sample sizes as small as 25 items. This study uses the Monte Carlo simulation technique to determine whether an auditor’s opinion using both different sample size and error levels is within an acceptable degree of accuracy. The results suggest that samples of fewer than 50 items are not large enough to provide a successful sampling plan unless the error value is very low. To improve the sampling plan and the quality of the audit, the sample size should, therefore, be increased to more than 50 items.
IN TR O DU C T IO NThe high cost of audit sampling in recent years has forced auditors to reduce the size of audit samples. To be cost-effective, audit samples have been reduced significantly, as reported in the literature (M ohamad-Ali 1993), where a sample of 25 items was used to test accounting populations of several thousand items. However, a small audit sample is subject to the possibility of a lack of credibility and accuracy, in terms of giving a true and fair view of the accounts being audited. This study tests w hether small samples do provide the auditor with the degree of assurance he needs to state the accounts under audit give a “ true and fair” view of the financial condition of the company.
An auditor faces the challenge of two conflicting objectives in gathering evidential m atter. First, the collection of excessive evidence at the expense of the client may lead him to seek the services of a more cost- efficient auditor. Second, the auditor is subject to litigation if the client perceives that the auditor had the means, but did not give the most reasonable opinion. Therefore, an auditor needs to maintain a balance between controlling the cost of evidence gathering and the possible consequences of expressing an opinion based on inadequate data.
One way of determining an optimal size of audit sample is to use a well-tested statistical form ula. In a recent survey
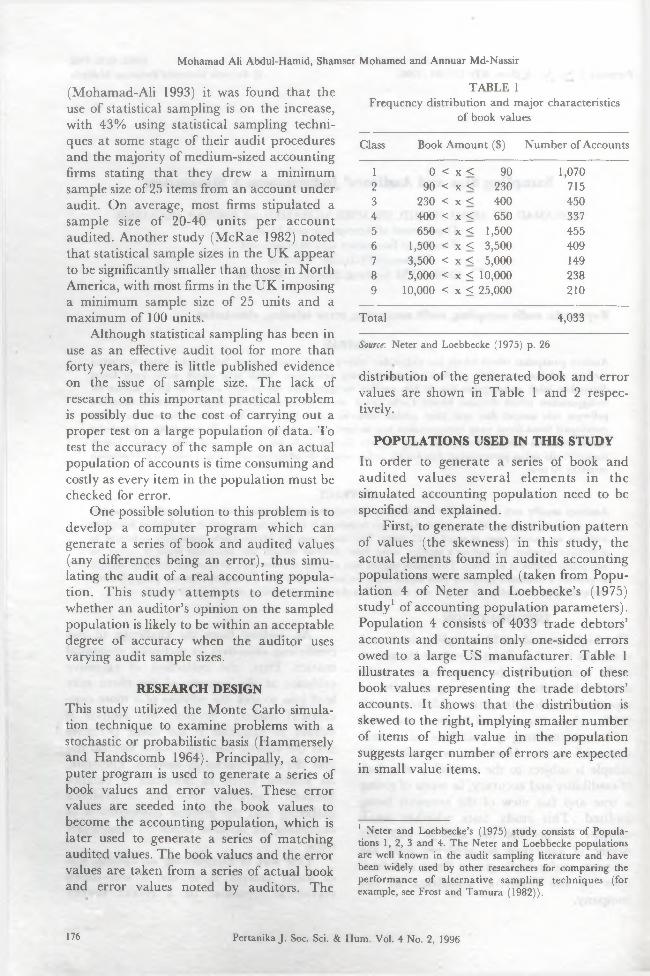
Mohamad Ali Abdul-Hamid, Shamser Mohamed and Annuar Md-Nassir
(Mohamad-Ali 1993) it was found that the use of statistical sampling is on the increase, with 43% using statistical sampling techniques at some stage of their audit procedures and the majority of medium-sized accounting firms stating that they drew a minimum sample size of 25 items from an account under audit. On average, most firms stipulated a sample size of 20-40 units per account audited. Another study (McRae 1982) noted that statistical sample sizes in the UK appear to be significantly smaller than those in North America, with most firms in the UK imposing a minimum sample size of 25 units and a maximum of 100 units.
Although statistical sampling has been in use as an effective audit tool for more than forty years, there is little published evidence on the issue of sample size. The lack of research on this important practical problem is possibly due to the cost of carrying out a proper test on a large population of data. To test the accuracy of the sample on an actual population of accounts is time consuming and costly as every item in the population must be checked for error.
One possible solution to this problem is to develop a computer program which can generate a series of book and audited values (any differences being an error), thus simulating the audit of a real accounting population. This study attem pts to determ ine whether an auditor’s opinion on the sampled population is likely to be within an acceptable degree of accuracy when the auditor uses varying audit sample sizes.
RESEARCH DESIGNThis study utilized the Monte Carlo simulation technique to examine problems with a stochastic or probabilistic basis (Hammersely and Handscomb 1964). Principally, a computer program is used to generate a series of book values and error values. These error values are seeded into the book values to become the accounting population, which is later used to generate a series of matching audited values. The book values and the error values are taken from a series of actual book and error values noted by auditors. The
TABLE 1Frequency distribution and major characteristics
of book valuesClass Book Amount ($) Number of Accounts
1 0 < x < 90 1,0702 90 < x < 230 7153 230 < x < 400 4504 400 < x < 650 3375 650 < x < 1,500 4556 1,500 < x < 3,500 4097 3,500 < x < 5,000 1498 5,000 < x < 10,000 2389 10,000 < x < 25,000 210
Total 4,033Source: Neter and Loebbecke (1975) p. 26
distribution of the generated book and error values are shown in Table 1 and 2 respectively.
PO PULATIO NS USED IN THIS STUDYIn order to generate a series of book and audited values several elements in the simulated accounting population need to be specified and explained.
First, to generate the distribution pattern of values (the skewness) in this study, the actual elements found in audited accounting populations were sampled (taken from Population 4 of Neter and Loebbecke’s (1975) study1 of accounting population parameters). Population 4 consists of 4033 trade debtors’ accounts and contains only one-sided errors owed to a large US manufacturer. Table 1 illustrates a frequency distribution of these book values representing the trade debtors’ accounts. It shows that the distribution is skewed to the right, implying smaller number of items of high value in the population suggests larger number of errors are expected in small value items.
1 Neter and Loebbecke’s (1975) study consists of Populations 1, 2, 3 and 4. The Neter and Loebbecke populations are well known in the audit sampling literature and have been widely used by other researchers for comparing the performance of alternative sampling techniques (for example, see Frost and Tamura (1982)).
176 Pertanika J. Soc. Sci. & Hum. Vol. 4 No. 2, 1996

Sampling Size and Auditors’ Judgements: A Simulation
TABLE 2Tainting percentages: a classification by relative size of the item in error
Audited ItemsTainting Exceeding $10,000 $2,000-$ 10,00 Less than $2,000
0 - 1% 35% 19.0% 3%> 1 - 10% 33% 25.0% 17%> 10 - 20% 5% 12.0% 19%> 20 - 99% 17% 19.0% 21%
100% 10% 23.5% 37%> 100% 0% 1.5% 3%
100% 100.0% 100%Source: McRae (1982)
Second, there are errors of principle and operational errors (Taylor 1974). O perational errors can be classified further, into procedural errors and errors of value. This study is concerned with measuring accidental errors of value, which are also referred to as substantive errors; most are monetary errors (McRae 1982). We have ignored deliberate or fraudulent errors in our simulation because the pattern and incidence of such errors are likely to be very different from those of accidental errors and therefore require a separate research study.
The error rate is defined as the proportion of errors in a population. Thus an error rate of 20% means that out of a total population of 100 items, 20 items are in error. The error rate in most accounting populations is very low; however, the acceptable level of error varies from sample to sample. For example, Jones (1947) suggests that error rates below 0.3% are “acceptable” and below 0.9% are considered to be “fair” in clerical work. Vance (1950) used 0.5% as an acceptable rate and 3% as an unacceptable error rate in clerical work. The National Audit Office in the U K applies an unacceptable upper error rate of 2.5% to their audit work on government accounts.
In this study we use three error rates, 1, 2.5 and 5% and define these errors as low, medium and high, and seed them into the population via our simulation program.2
Third, the value of the errors and the pattern of distribution of the errors are
summarized in Table 2. The term “ tainting” used in audit sampling describes the ratio between the value of an error and the value of the item in error. For example, an item of $60 containing a $15 error is said to be 25% “ ta in ted ” . In actual practice the probability of finding a given tainted percentage appears to be influenced by the relative size of the items in error (McRae 1982). This study classifies the tainting percentage into three groups following M cRae’s study, that is, audited items exceeding $10,000, those less than $2,000 and those between $2,000 and $10,000.
THE SIM ULATIONThe simulation program consists of two in terrelated BASIC programs. The first program generates 4033 random numbers and stores them on data files. The numbers between 0 and n are generated by using the formula IN T[TH ETA *LO G (RN D )], where IN T and RND are BASIC functions standing for integer and random number respectively. The second program uses the data inserted into the data file by the first program. Table 3 describes the simulation in detail.
2 According to Neter and Loebbecke’s study the number of items in the population is 4033. Thus to make the process simpler, the error items are set to be 50, 100 and 200 errors respectively, that is, for example 2.5% of 4033 is 100 (rounded to ten). This approach creates three populations to be tested.
Pertanika J. Soc. Sci. & Hum. Vol. 4 No. 2, 1996 177
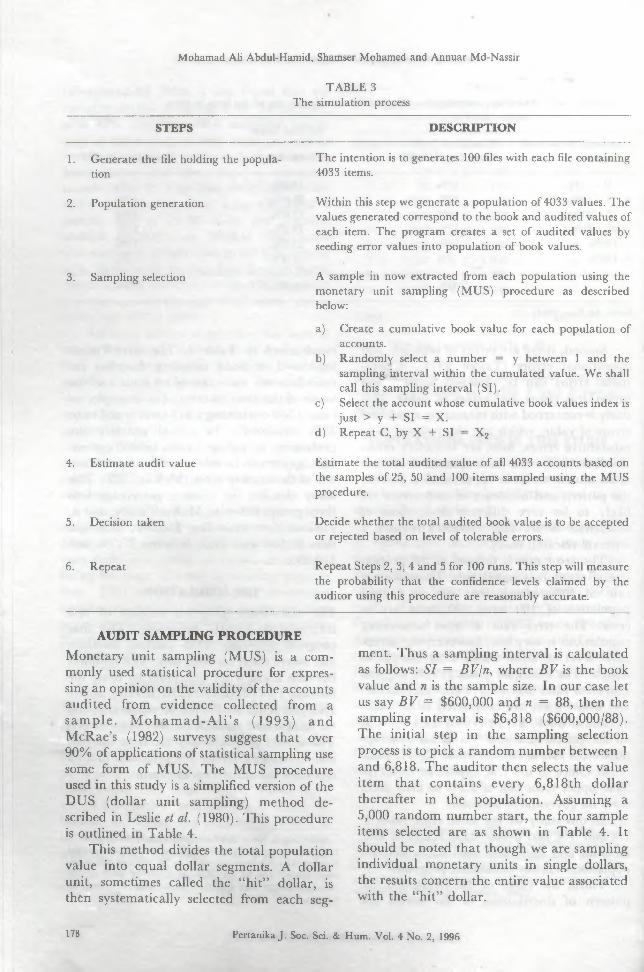
Mohamad Ali Abdul-Hamid, Shamser Mohamed and Annuar Md-Nassir
TABLE 3 The simulation process
STEPS DESCRIPTION
1. Generate the file holding the population
The intention is to generates 100 files with each file containing 4033 items.
2. Population generation
3. Sampling selection
4. Estimate audit value
5. Decision taken
6. Repeat
Within this step we generate a population of 4033 values. The values generated correspond to the book and audited values of each item. The program creates a set of audited values by seeding error values into population of book values.A sample in now extracted from each population using the monetary unit sampling (MUS) procedure as described below:a) Create a cumulative book value for each population of
accounts.b) Randomly select a number = y between 1 and the
sampling interval within the cumulated value. We shall call this sampling interval (SI).
c) Select the account whose cumulative book values index is just > y + SI = X.
d) Repeat C, by X + SI = X 2Estimate the total audited value of all 4033 accounts based on the samples of 25, 50 and 100 items sampled using the MUS procedure.Decide whether the total audited book value is to be accepted or rejected based on level of tolerable errors.Repeat Steps 2, 3, 4 and 5 for 100 runs. This step will measure the probability that the confidence- levels claimed by the auditor using this procedure are reasonably accurate.
AUDIT SAMPLING PROCEDUREMonetary unit sampling (MUS) is a commonly used statistical procedure for expressing an opinion on the validity of the accounts audited from evidence collected from a sam p le . M o h a m a d -A li’s (1993) an d M cRae’s (1982) surveys suggest that over 90% of applications of statistical sampling use some form of MUS. The MUS procedure used in this study is a simplified version of the DUS (dollar unit sampling) method described in Leslie et al. (1980). This procedure is outlined in Table 4.
This method divides the total population value into equal dollar segments. A dollar unit, sometimes called the “hit” dollar, is then systematically selected from each seg
ment. Thus a sampling interval is calculated as follows: S I = B V /n , where B V is the book value and n is the sample size. In our case let us say B V = $600,000 and n = 88, then the sampling interval is $6,818 ($600,000/88). The initial step in the sampling selection process is to pick a random number between 1 and 6,818. The auditor then selects the value item that contains every 6,818th dollar thereafter in the population. Assuming a5,000 random number start, the four sample items selected are as shown in Table 4. It should be noted that though we are sampling individual monetary units in single dollars, the results concern the entire value associated with the “ hit” dollar.
178 Pertanika J. Soc. Sci. & Hum. Vol. 4 No. 2, 1996
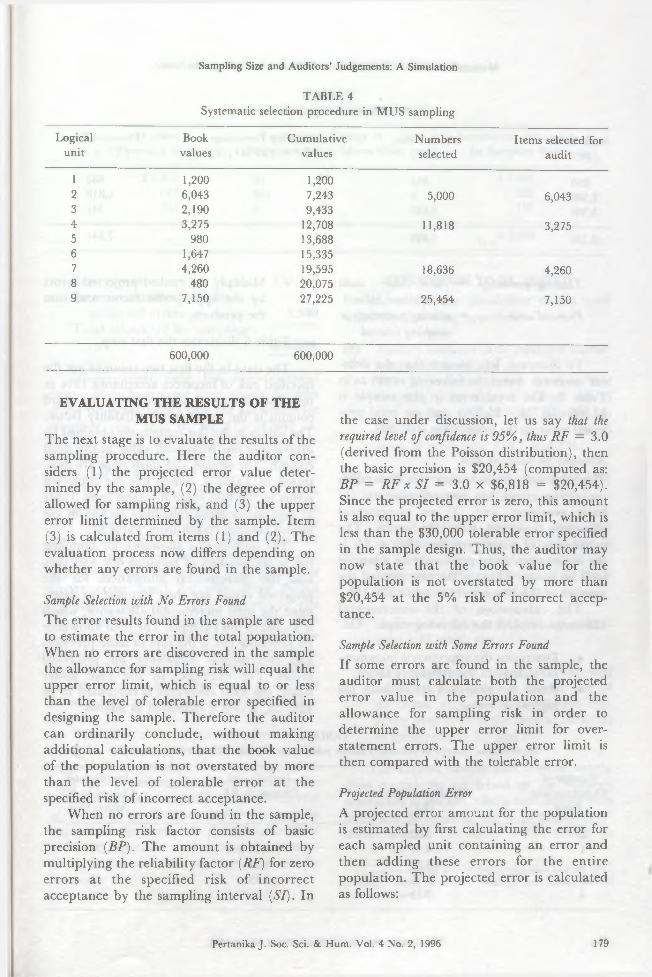
Sampling Size and Auditors’ Judgements: A Simulation
TABLE 4Systematic selection procedure in MUS sampling
Logical Book Cumulative Numbers Items selected forunit values values selected audit
1 1,200 1,2002 6,043 7,243 5,000 6,0433 2,190 9,4334 3,275 12,708 11,818 3,2755 980 13,6886 1,647 15,3357 4,260 19,595 18,636 4,2608 480 20,0759 7,150 27,225 25,454 7,150
600,000 600,000
EVALUATING THE RESULTS OF THE M US SAMPLE
The next stage is to evaluate the results of the sampling procedure. Here the auditor considers (1) the projected error value determined by the sample, (2) the degree of error allowed for sampling risk, and (3) the upper error limit determined by the sample. Item(3) is calculated from items (1) and (2). The evaluation process now differs depending on whether any errors are found in the sample.Sample Selection with No Errors FoundThe error results found in the sample are used to estimate the error in the total population. When no errors are discovered in the sample the allowance for sampling risk will equal the upper error limit, which is equal to or less than the level of tolerable error specified in designing the sample. Therefore the auditor can ordinarily conclude, without making additional calculations, that the book value of the population is not overstated by more than the level of tolerable error at the specified risk of incorrect acceptance.
When no errors are found in the sample, the sampling risk factor consists of basic precision (B P). The amount is obtained by multiplying the reliability factor (RF) for zero errors at the specified risk of incorrect acceptance by the sampling interval (SI). In
the case under discussion, let us say that the required level o f confidence is 95% , thus R F = 3.0 (derived from the Poisson distribution), then the basic precision is $20,454 (computed as: B P = R F x S I = 3.0 x $6,818 = $20,454). Since the projected error is zero, this amount is also equal to the upper error limit, which is less than the $30,000 tolerable error specified in the sample design. Thus, the auditor may now state that the book value for the population is not overstated by more than $20,454 at the 5% risk of incorrect acceptance.Sample Selection with Some Errors FoundIf some errors are found in the sample, the auditor must calculate both the projected error value in the population and the allowance for sampling risk in order to determine the upper error limit for overstatement errors. The upper error limit is then compared with the tolerable error.Projected Population ErrorA projected error amount for the population is estimated by first calculating the error for each sampled unit containing an error and then adding these errors for the entire population. The projected error is calculated as follows:
Pertanika J. Soc. Sci. & Hum. Vol. 4 No. 2, 1996 179
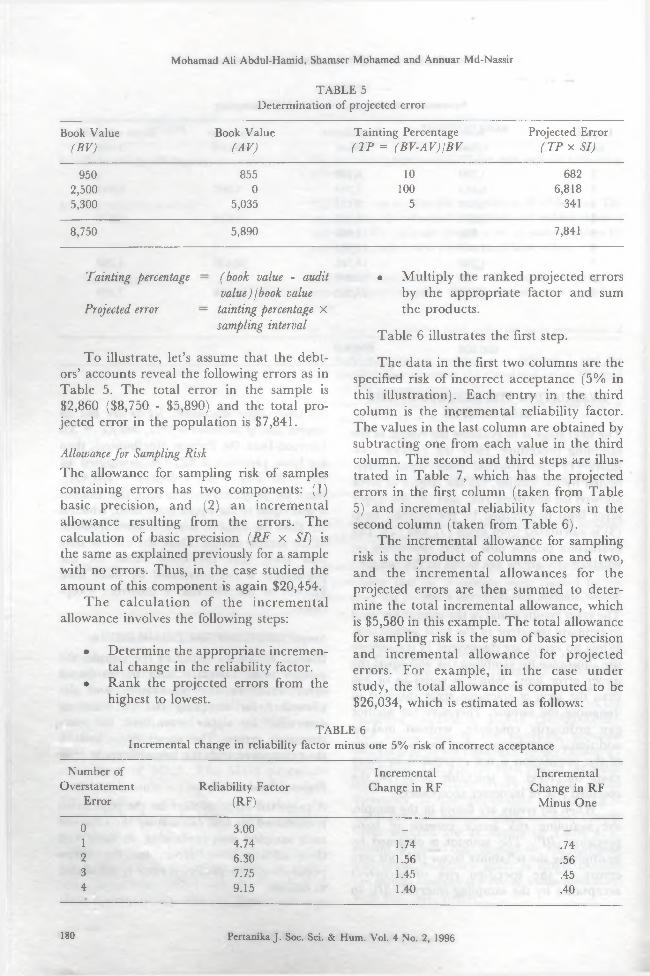
Mohamad Ali Abdul-Hamid, Shamser Mohamed and Annuar Md-Nassir
TABLE 5 Determination of projected error
Book Value(B V )
Book Value(A V )
Tainting Percentage (T P = (B V -A V )jB V
Projected Error (T P x SI)
950 855 10 6822,500 0 100 6,8185,300 5,035 5 3418,750 5,890 7,841
Tainting percentage
Projected error
(book value - audit value) I book value
tainting percentage x sampling interval
To illustrate, let’s assume that the debtors’ accounts reveal the following errors as in Table 5. The total error in the sample is $2,860 ($8,750 - $5,890) and the total projected error in the population is $7,841.Allowance for Sampling Risk The allowance for sampling risk of samples containing errors has two components: (1) basic precision, and (2) an increm ental allowance resulting from the errors. The calculation of basic precision (R F x SI) is the same as explained previously for a sample with no errors. Thus, in the case studied the amount of this component is again $20,454.
T he calculation of the increm ental allowance involves the following steps:
• Determine the appropriate incremental change in the reliability factor.
• Rank the projected errors from the highest to lowest.
• Multiply the ranked projected errors by the appropriate factor and sum the products.
Table 6 illustrates the first step.The data in the first two columns are the
specified risk of incorrect acceptance (5% in this illustration). Each entry in the third column is the incremental reliability factor. The values in the last column are obtained by subtracting one from each value in the third column. The second and third steps are illustrated in Table 7, which has the projected errors in the first column (taken from Table 5) and incremental reliability factors in the second column (taken from Table 6).
The incremental allowance for sampling risk is the product of columns one and two, and the increm ental allowances for the projected errors are then summed to determine the total incremental allowance, which is $5,580 in this example. The total allowance for sampling risk is the sum of basic precision and incremental allowance for projected errors. For example, in the case under study, the total allowance is computed to be $26,034, which is estimated as follows:
TABLE 6Incremental change in reliability factor minus one 5% risk of incorrect acceptance
Number of Overstatement
ErrorReliability Factor
(RF)Incremental
Change in RFIncremental
Change in RF Minus One
0 3.00 _ _1 4.74 1.74 .742 6.30 1.56 .563 7.75 1.45 .454 9.15 1.40 .40
180 Pertanika J. Soc. Sci. & Hum. Vol. 4 No. 2, 1996
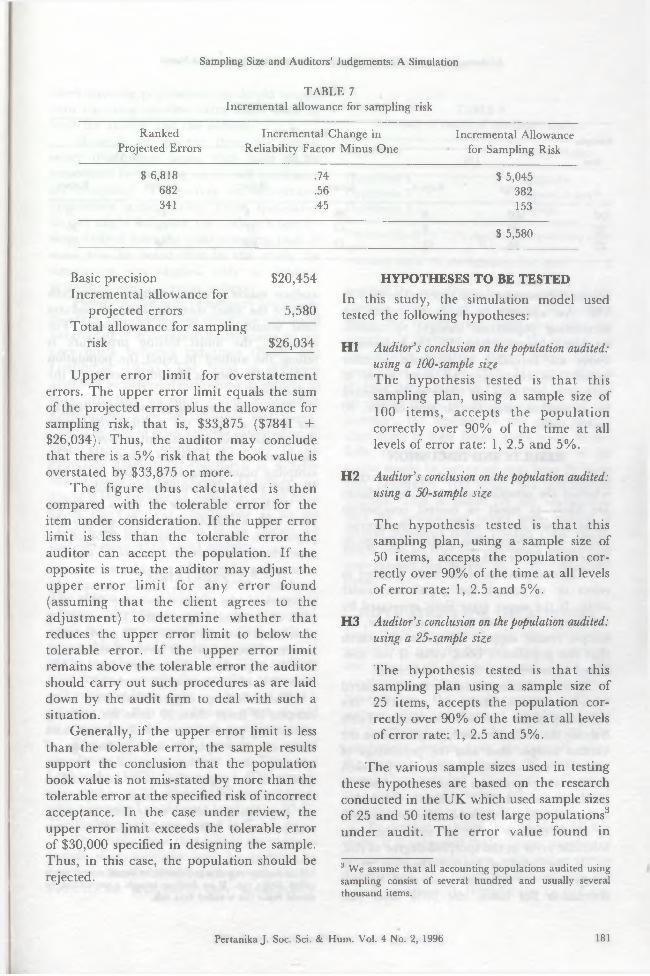
Sampling Size and Auditors’ Judgements: A Simulation
TABLE 7Incremental allowance for sampling risk
Ranked Incremental Change in Incremental AllowanceProjected Errors Reliability Factor Minus One for Sampling Risk
$ 6,818 .74 $ 5,045682 .56 382341 .45 153
Basic precision $20,454Incremental allowance for
projected errors 5,580Total allowance for sampling
risk $26,034U pper error lim it for overstatem ent
errors. The upper error limit equals the sum of the projected errors plus the allowance for sampling risk, that is, $33,875 ($7841 + $26,034). Thus, the auditor may conclude that there is a 5% risk that the book value is overstated by $33,875 or more.
T he figure thus ca lcu lated is then compared with the tolerable error for the item under consideration. If the upper error limit is less than the tolerable error the auditor can accept the population. If the opposite is true, the auditor may adjust the upper erro r lim it for any error found (assuming tha t the client agrees to the adjustm ent) to determ ine w hether tha t reduces the upper error limit to below the tolerable error. If the upper error limit remains above the tolerable error the auditor should carry out such procedures as are laid down by the audit firm to deal with such a situation.
Generally, if the upper error limit is less than the tolerable error, the sample results support the conclusion that the population book value is not mis-stated by more than the tolerable error at the specified risk of incorrect acceptance. In the case under review, the upper error limit exceeds the tolerable error of $30,000 specified in designing the sample. Thus, in this case, the population should be rejected.
$ 5,580
HYPOTHESES TO BE TESTEDIn this study, the simulation model used tested the following hypotheses:H I Auditor’s conclusion on the population audited:
using a 100-sample size The hypothesis tested is th a t this sampling plan, using a sample size of 100 items, accepts the population correctly over 90% of the time at all levels of error rate: 1, 2.5 and 5%.
H2 Auditor’s conclusion on the population audited: using a 50-sample size
The hypothesis tested is th a t this sampling plan, using a sample size of 50 items, accepts the population correctly over 90% of the time at all levels of error rate: 1, 2.5 and 5%.
H3 Auditor’s conclusion on the population audited: using a 25-sample size
The hypothesis tested is th a t this sampling plan using a sample size of 25 items, accepts the population correctly over 90% of the time at all levels of error rate: 1, 2.5 and 5%.
The various sample sizes used in testing these hypotheses are based on the research conducted in the UK which used sample sizes of 25 and 50 items to test large populations3 under audit. The error value found in
3 We assume that all accounting populations audited using sampling consist of several hundred and usually several thousand items.
Pertanika J. Soc. Sci. & Hum. Vol. 4 No. 2, 1996 181

TABLE 8Auditor’s conclusion on the population
Mohamad Ali Abdul-Hamid, Shamser Mohamed and Annuar Md-Nassir
Sample Error RateSize 1% 2.5% 5%
Accept Reject Accept Reject Accept Reject100 100 0 96 4 95 550 92 8 63 37 64 3625 55 45 19 81 18 82
accounting populations is reported to be 0.5- 5% . An aud ito r is likely to reject an accounting population thought to contain an error value exceeding 1%. The hypotheses above are intended to ascertain whether populations containing an error value of various magnitudes are likely to be rejected by an auditor using sample sizes of 100, 50 and 25 units.
RESULTS AND DISCUSSIONA simulation test was carried out to ascertain whether the sampling sizes used by auditors are likely to result in correct conclusions being drawn by the auditor on the acceptability of the population under audit, given three error levels and sample sizes.
The end product of the audit is either to reject or to accept the population under audit. If the upper error limit generated by the sample is less than the tolerable error, the sample results support the prior hypothesis that the population book value is not misstated by more than the tolerable error.
The simulation results are then compared with the actual d a ta to ascertain the reliability of the auditor’s conclusions. Table8 shows the auditor’s conclusions based on the various sample sizes and the percentage of times the auditor would accept or reject each particular population under the various conditions stated. The auditor’s conclusion is that the population book value under audit is, or is not, in error by more than the tolerable error at the specified degree of risk.
If the level of correct decision as to acceptance or rejection generated by our simulation lies below the 90% level (the
auditor makes a wrong decision more than 10% of the time) then the audit procedures used would seem to be inadequate. For example, the audit testing procedure is telling the auditor to reject the population under audit when he should be accepting the population.4
The audit sampling plans using a sample size of 100 accepted the audited populations that should have been accepted over 90% of the time at all levels of error rate. The sampling plans using sample sizes of 25 and 50 units provided very different results.
With the error rate at 1% a sampling plan with a sample size of 50 accepts the population correctly more than 90% of the time. However, at an error rate of 2.5 and 5% a sampling plan of 50 provides acceptances far below 90% that is, it only accepts the population (the correct decision) 63% and 64% of the time respectively. The sampling plan based on a sample size of 25 produces an incorrect decision at all levels of error rate, that is, it produces the correct decision less than 90% of the time at all levels.
These findings suggest that firms using samples of fewer than 50 units for auditing accounting populations with low error rates have an unacceptably low probability of arriving at a correct conclusion on the quality of the population under audit and so should increase their minimum sample size per population audited to at least 50 units, and preferably 100 units. The auditor is too
4 If an Auditor rejects a population he should accept this is called Alpha risk. If an Auditor accepts a population he should reject this is called Beta risk.
182 Pertanika J. Soc. Sci. & Hum. Vol. 4 No. 2, 1996
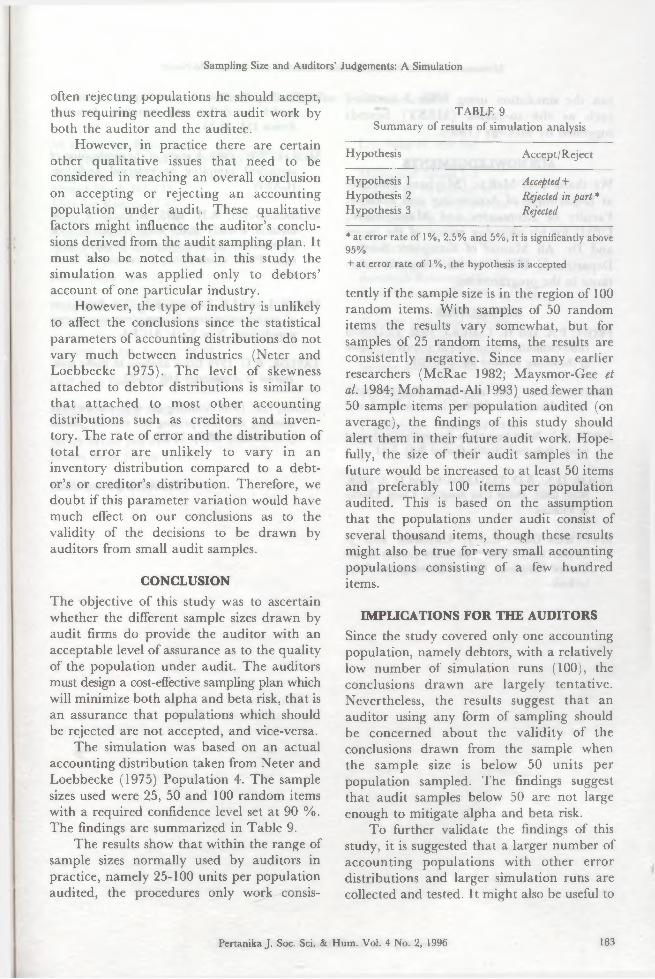
Sampling Size and Auditors’ Judgements: A Simulation
often rejecting populations he should accept, thus requiring needless extra audit work by both the auditor and the auditee.
However, in practice there are certain other qualitative issues that need to be considered in reaching an overall conclusion on accepting or rejecting an accounting population under audit. These qualitative factors might influence the auditor’s conclusions derived from the audit sampling plan. It must also be noted that in this study the simulation was applied only to debtors’ account of one particular industry.
However, the type of industry is unlikely to affect the conclusions since the statistical parameters of accounting distributions do not vary much between industries (Neter and Loebbecke 1975). The level of skewness attached to debtor distributions is similar to that attached to most other accounting distributions such as creditors and inventory. The rate of error and the distribution of to tal error are unlikely to vary in an inventory distribution compared to a debtor’s or creditor’s distribution. Therefore, we doubt if this param eter variation would have much effect on our conclusions as to the validity of the decisions to be drawn by auditors from small audit samples.
CONCLUSIONThe objective of this study was to ascertain whether the different sample sizes drawn by audit firms do provide the auditor with an acceptable level of assurance as to the quality of the population under audit. The auditors must design a cost-effective sampling plan which will minimize both alpha and beta risk, that is an assurance that populations which should be rejected are not accepted, and vice-versa.
The simulation was based on an actual accounting distribution taken from Neter and Loebbecke (1975) Population 4. The sample sizes used were 25, 50 and 100 random items with a required confidence level set at 90 %. The findings are summarized in Table 9.
The results show that within the range of sample sizes normally used by auditors in practice, namely 25-100 units per population audited, the procedures only work consis-
TABLE 9Summary of results of simulation analysis
Hypothesis Accept/RejectHypothesis 1 Accepted+Hypothesis 2 Rejected in part *Hypothesis 3 Rejected* at error rate of 1%, 2.5% and 5%, it is significantly above95%+ at error rate of 1%, the hypothesis is acceptedtently if the sample size is in the region of 100 random items. With samples of 50 random items the results vary somewhat, but for samples of 25 random items, the results are consistently negative. Since many earlier researchers (McRae 1982; Maysmor-Gee et al. 1984; Mohamad-Ali 1993) used fewer than 50 sample items per population audited (on average), the findings of this study should alert them in their future audit work. Hopefully, the size of their audit samples in the future would be increased to at least 50 items and preferably 100 items per population audited. This is based on the assumption that the populations under audit consist of several thousand items, though these results might also be true for very small accounting populations consisting of a few hundred items.
IM PLICATIONS FOR THE AUDITORSSince the study covered only one accounting population, namely debtors, with a relatively low number of simulation runs (100), the conclusions drawn are largely tentative. Nevertheless, the results suggest that an auditor using any form of sampling should be concerned about the validity of the conclusions drawn from the sample when the sample size is below 50 units per population sampled. The findings suggest that audit samples below 50 are not large enough to mitigate alpha and beta risk.
To further validate the findings of this study, it is suggested that a larger number of accounting populations with other error distributions and larger simulation runs are collected and tested. It might also be useful to
Pertanika J. Soc. Sci. & Hum. Vol. 4 No. 2, 1996 183

Mohamad Ali Abdul-Hamid, Shamser Mohamed and Annuar Md-Nassir
run the simulation using other estimators, such as the so-called (M EST) bounds suggested by McCray (1980).
ACKNOW LEDGEM ENTSWe thank Prof McRae (Maybank Professor at Department of Accounting and Finance, Faculty of Economics and M anagement, UPM) for his objective review of the paper and Dr. Ali M am at of Computer Science Department, UPM for his computer assistance in the programming.
REFERENCESFR O ST, P.A. and H. TA M U RA . 1982. Jackknifed
ratio estimation in statistical auditing. Journal of Accounting Research 20: 103-120.
H A M M ER SELY, J.M . and D.C. HANDSCOMB. 1964. Monte Carlo Method. London: Methuen.
JO N ES, H.L. Sampling plans for verifying clerical work. Industrial Quality Control 3(4): 5-11.
L e s l ie , D.A., A.D. T e i t l e b a u m and D. A n d e r s o n . 1980. Dollar Unit Sampling. Coop, Clarke& Pitman.
M A Y S M O R -G E E , C . , J . C R A M E R and J . STANTOCKI. 1984. The audit process in the United Kingdom. City of Birmingham Polytechnic.
MCCRAY, J.H . 1980. A quasi-bayesian audit risk model for dollar unit sampling Accounting Review 151: 35-51.
MCRAE, T.W. 1982. A study of the application of statistical sampling to external auditing. ICAEW.
MOHAMAD-ALI, A.H. 1993. A study of audit method: a study of the audit technique used by medium sized accounting firms in England. Ph.D. dissertation, University of Bradford.
NETER, J. and J.K . LOEBBECKE. 1975. Behaviour of major estimators in sampling accounting populations. New York: AICPA.
TAYLOR, R.G. 1974 Error analysis in audit tests. Journal o f Accountancy 148: 78-82.
VANCE, L.L. 1950. Auditing use of probabilities in selecting and interpreting test checks. Journal o f Accountancy 88(3): 21-25.
(Received 11 January 1995)
184 Pertanika J. Soc. Sci. & Hum. Vol. 4 No. 2, 1996
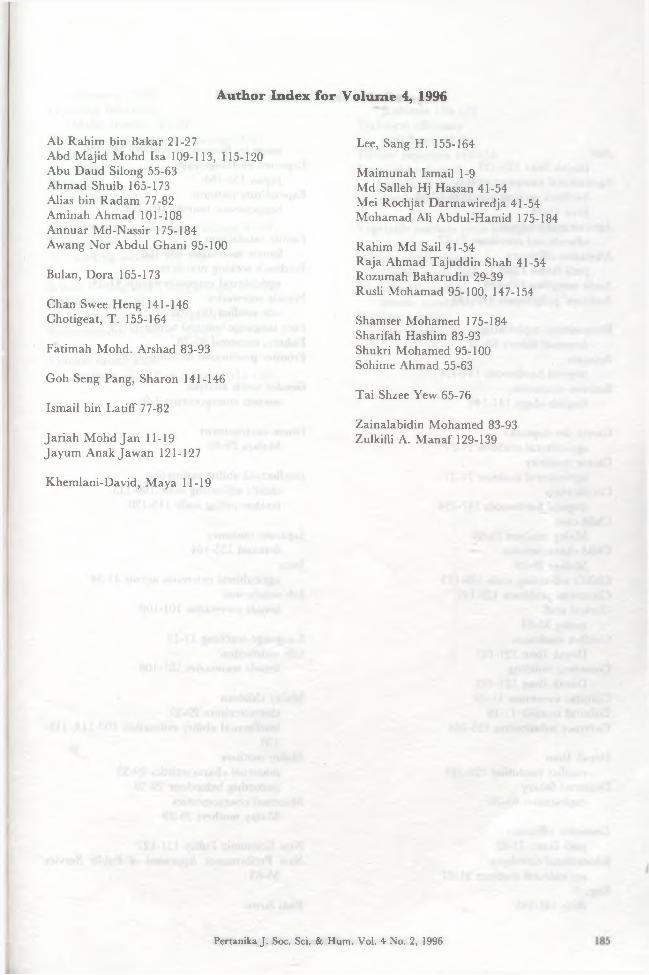
Author Index for V olum e 4, 1996
Ab Rahim bin Bakar 21-27Abd Majid Mohd Isa 109-113, 115-120Abu Daud Silong 55-63Ahmad Shuib 165-173Alias bin Radam 77-82Aminah Ahmad 101-108Annuar Md-Nassir 175-184Awang Nor Abdul Ghani 95-100Bulan, Dora 165-173Chan Swee Heng 141-146 Chotigeat, T. 155-164Fatimah Mohd. Arshad 83-93Goh Seng Pang, Sharon 141-146Ismail bin Latiff 77-82Jariah Mohd Jan 11-19 Jayum A nakjaw an 121-127Khemlani-David, Maya 11-19
Lee, Sang H. 155-164Maimunah Ismail 1-9 Md Salleh Hj Hassan 41-54 Mei Rochjat Darmawiredja 41-54 Mohamad Ali Abdul-Hamid 175-184Rahim Md Sail 41-54 Raja Ahmad Tajuddin Shah 41-54 Rozumah Baharudin 29-39 Rusli Mohamad 95-100, 147-154Shamser Mohamed 175-184 Sharifah Hashim 83-93 Shukri Mohamed 95-100 Sohime Ahmad 55-63Tai Shzee Yew 65-76Zainalabidin Mohamed 83-93 Zulkifli A. M anaf 129-139
Pertanika J. Soc. Sci. & Hum. Vol. 4 No. 2, 1996
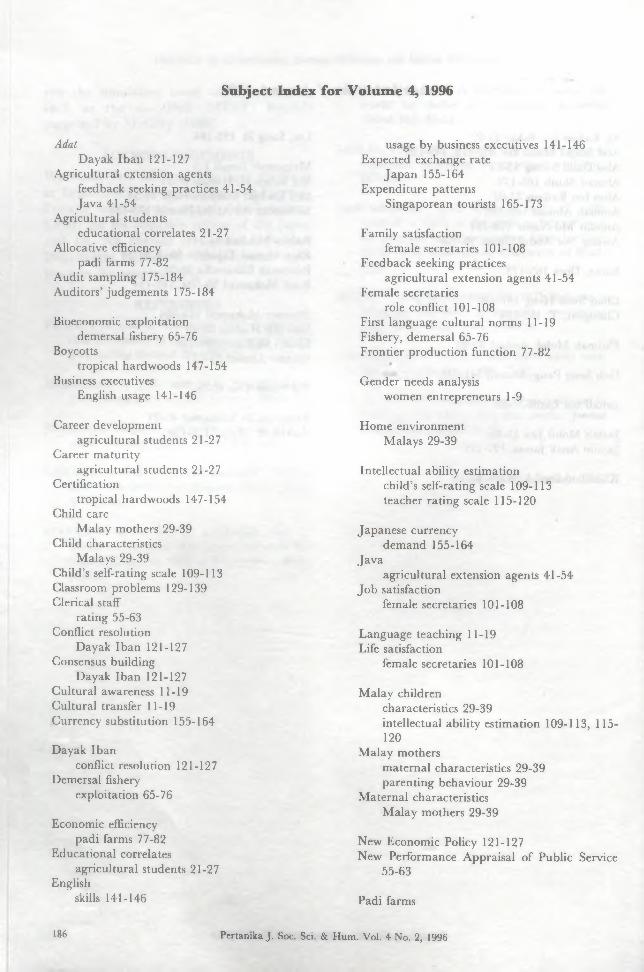
Subject Index for V olum e 4, 1996
AdatDayak Iban 121-127
Agricultural extension agentsfeedback seeking practices 41-54 Java 41-54
Agricultural studentseducational correlates 21-27
Allocative efficiency padi farms 77-82
Audit sampling 175-184 Auditors’ judgements 175-184Bioeconomic exploitation
demersal fishery 65-76 Boycotts
tropical hardwoods 147-154 Business executives
English usage 141-146Career development
agricultural students 21-27 Career maturity
agricultural students 21-27 Certification
tropical hardwoods 147-154 Child care
Malay mothers 29-39 Child characteristics
Malays 29-39 Child’s self-rating scale 109-113 Classroom problems 129-139 Clerical staff
rating 55-63 Conflict resolution
Dayak Iban 121-127 Consensus building
Dayak Iban 121-127 Cultural awareness 11-19 Cultural transfer 11-19 Currency substitution 155-164Dayak Iban
conflict resolution 121-127 Demersal fishery
exploitation 65-76Economic efficiency
padi farms 77-82 Educational correlates
agricultural students 21-27 English
skills 141-146
usage by business executives 141-146 Expected exchange rate
Japan 155-164 Expenditure patterns
Singaporean tourists 165-173Family satisfaction
female secretaries 101-108 Feedback seeking practices
agricultural extension agents 41-54 Female secretaries
role conflict 101-108 First language cultural norms 11-19 Fishery, demersal 65-76 Frontier production function 77-82Gender needs analysis
women entrepreneurs 1-9Home environment
Malays 29-39Intellectual ability estimation
child’s self-rating scale 109-113 teacher rating scale 115-120
Japanese currency demand 155-164
Javaagricultural extension agents 41-54
Job satisfactionfemale secretaries 101-108
Language teaching 11-19 Life satisfaction
female secretaries 101-108Malay children
characteristics 29-39intellectual ability estimation 109-113, 115- 120
Malay mothersmaternal characteristics 29-39 parenting behaviour 29-39
Maternal characteristics Malay mothers 29-39
New Economic Policy 121-127 New Performance Appraisal of Public Service
55-63Padi farms
186 Pertanika J. Soc. Sci. & Hum. Vol. 4 No. 2, 1996

efficiency 77-82 Parenting behaviour
Malay mothers 29-39 Performance measurement rating 55-63 Price linkages
vegetable markets 83-93 Public service
rating 55-63Research-extension-farmers linkage 41-54 Role conflict
working women 101-108School Feeling and Thought scale 109-113 Singaporean tourists
expenditure patterns 165-173 Socioeconomic equality 121-127Teacher rating scale
intellectually gifted children 115-120
Teachersproblems 129-139
Technical efficiency padi farms 77-82
Timber exporters 147-154 Tropical hardwoods
campaign impact 147-154 consumer attitude 95-100
Vegetable markets price linkages 83-93Women entrepreneurs
gender needs analysis 1-9 Work-family conflict
female secretaries 101-108 Working women
role conflict 101-108
Pertanika J. Soc. Sci. & Hum. Vol. 4 No. 2, 1996
AcknowledgementThe Editorial Board acknowledges the assistance of the following
reviewers in the preparation of Volume Four of this journal
Dr. Abd. Majid KontingAssoc. Prof Dr. Ahmad Zubaidi BaharomshahAssoc. Prof. Dr. Aminudin HusinProf. Dr. Ivan L. EastinProf. Dr. Lehman B. FletcherDr. Habibah EliasAssoc. Prof. Dr. Harriet WongDr. Hashim KamilAssoc. Prof. Dr. Jamali IsmailDr. Jamilah Mohd. AliDr. Jariah MasudProf. Dr. Johan S. AbdullahAssoc. Prof. Dr. Juriah LongAssoc. Prof. Dr. Kamariah Abu BakarAssoc. Prof. Dr. Khor Geok LinKusairi Mohd. Noh
Assoc. Prof. Dr. Adeline F. LouisDr. Maznah MohamadProf. Dr. J. D. McCrackenAssoc. Prof. Dr. Mohamad Adam BakarDr. Mohamad Hj. AliasProf. Dr. Mohd. Ismail Sayyed AhmadDr. Mohd. Zain NordinDr. Muhamad AriffDr. Nik Hashim MustapaAssoc. Prof. Dr. Nik Mustapha Raja AbdullahDr. Normah Hj. OsmanDr. Quek Ai HwaAssoc. Prof. Dr. Shamsudin A Rahim Assoc. Prof. Dr. Suradi Salim Assoc. Prof. Dr. Tan Chee Beng Dr. Zakaria Kasa Dr. Zulkifli Omar
188 Pertanika J. Soc. Sci. & Hum. Vol. 4 No. 2, 1996

Preparation o f M anuscriptTyping and PaperThe manuscript should be typed double spaced on A4 paper with 4cm margins on all sides. It should be limited to 25 pages including tables, illustrations and references.
Title PageThe title of the paper, name of author and full address of the institution where the work Was carried out should appear on the title page. A short title not exceeding 60 characters should be provided for the running headlines.
AbstractEnglish and Bahasa Melayu abstracts of 200 words each should follow the title page. Papers from outside Malaysia may be submitted with an English abstract only.
KeywordsAbout six to ten keywords are required and these should be placed directly above the abstract.
TablesTables should be typed on separate pages and numbered using Arabic numerals. Each table should be referred to in the text, have a brief title and include explanatory notes, if necessary, below it. Vertical rules should not be used. Footnotes in tables shoulds be designated by symbols or superscript small italic letters. Tables should conform to page size.
EquationsThese must be clearly typed triple-spaced. They should be identified by numbers in square brackets placed flush with the right margin.
Ilustrations and PhotographsIllustrations including diagrams and graphs are to be referred to in the text as ‘figures’ and photographs as ‘plates’ and numbered consecutively in Arabic numerals. All photographs (glossy black and white prints) should be supplied with appropriate scales.
Illustrations should be of print quality; output from dotm atrix printers is not acceptable. Illustrations should be on separate sheets, about twice the size in print. All letters, numbers and legends must be included on the illustration with the author’s name, short tide of the paper and figure number written on the verso. A list of captions should be provided on a separate sheet.
Spelling & MeasurementsThe Oxford English Dictionary should be consulted for spelling. M etric units must be used for empirical measurements.
Citations and ReferencesCitations to the literature in the text are to be indicated by the author’s name and year of publication in parentheses, e.g. (Barnett and Lewis 1982). If an author is quoted in the text, the year of publication should immediately follow in «parentheses, e.g. Barnett and
Lewis (1982) state that “ ......... ” Citation of a particularpage follows the date and is preceded by a comma, e.g. Humphrey 1990, p. 26-27.
For works with multiple authors, the first author’s surname is used followed by et al. The full form of citation is used for two authors.
If two or more works by the same author are cited together, the author’s name is followed by the various years of publication arranged in chronological order e.g. (Sulaiman 1979, 1980, 1981). In the case of citing an author with several works published in the same year, the works should be distinguished by the addition of a small letter e.g. Choa (1979a); Choa (1979b).
When several authors are cited, they are to be arranged in chronological order and separated by semicolons, e.g. Zaharah 1960; Yong 1980; Lewis 1990.
Serials are to be abbreviated as in the World List of Scientific Periodicals. The abbreviation for Pertanika Journal of Social Science and Humanities is Pertanika J. Soc. Sci. Hum.The following reference style is to be observed:
BookShamsher Mohamed, Shamsuddin Ismail & Annuar M ohd. Nassir. 1989. Asas Belanjawan Modal. 197p. Serdang: Universiti Pertanian Malaysia Press.
Chapter in Edited BookZahid Emby. 1990. The Orang Asli Regrouping Scheme - converting swiddeners to com m erical farmers. In Margins and Minorities - The Peripheral Areas and Peoples of Malaysia, ed. V. T King & M .J.G . Parnwell, p. 94- 109. Hull: Hull University Press.
Unpublished Materials (e.g. theses, reports, documents) Shahwahid, H .O . 1989. Price competitiveness and demand behaviour of Malaysia Meranti lumber and hardwood plywood in the United States’ import market. Ph.D. Dissertation, State University of New York, Syracuse.
Ministry of National Unity. 1973. A socio-economic survey on the new villages in Perak and Melaka. 67p. Malaysia.
SerialsNoran Fauziah Yaakub. 1990. A multivariate analysis of attitude towards teaching. Pertanika 13(2): 267-273.
Conference ProceedingsAmir Awang. 1992. Counselling, human resources development and counseling services. In Proceeding of Asia Pacific Conference on Human Resource Development, ed. Sulaiman M. Yassin, Yahya M at Hassan Kam ariah Abu Bakar, Esah Munji and Sabariah Mohd Rashid, p. 243- 246. Serdang: Universiti Pertanian Malaysia.
Pertanika Journal o f Social Science & H um anities V olum e 4 No, 2 Septem ber 1996
C onten ts
Associations of Work-Family Conflict, Job Satisfaction, Family 101Satisfaction and Life Satisfaction: A Study of M arried Female Secretaries - Aminah Ahmad
The Ability of a Child’s Self-rating Scale in Estimating Intellectual Ability - 109 Abd M ajid M ohd Isa
The Effectiveness of Teacher Ratings in Identifying Potential Intellectually 115 Gifted Malay Children - Abd M ajid M ohd Isa
Conflict Resolution through Consensus Building - Experiences from the 121Dayak Iban Community of Sarawak, East Malaysia - Jayum Anak Jawan
General Problems Experienced by Elementary Classroom Teachers - J^ulkifli 129 A. M an af
The Use of English by Malaysian Business Executives in the Commercial 141Sector - Sharon Goh Seng Pang and Chan Swee Heng
Im pact of Tropical Hardwoods Campaign - Rusli Mohamad 147Currency Substitution via Expected Exchange Rate and Domestic Money 155
Demand : An Empirical Analysis for Japan - T. Chotigeat and Sang H. Lee Expenditure Patterns of Singaporean Tourists in Malaysia - Ahmad Shuib 165
and Dora BulanSampling Size and Auditors’ Judgements: A Simulation - Mohamad A li 175
Abdul-Hamid, Shamser Mohamed and Annuar M d-N assir
ISSN 012A- 772D0 9
770128 772042