Embed Size (px)
Citation preview

Pertanika J. Sci. & Technol. 25 (2): 631 - 648 (2017)
SCIENCE & TECHNOLOGYJournal homepage: http://www.pertanika.upm.edu.my/
ISSN: 0128-7680 © 2017 Universiti Putra Malaysia Press.
Article history:Received: 27 May 2016Accepted: 14 November 2016
E-mail addresses: [email protected] (Shakila, S.),[email protected] (Noryati, A.),[email protected] (Maheran, M. J.)*Corresponding Author
Assessing Stock Market Volatility for Different Sectors in Malaysia
Shakila, S. 1,2*, Noryati, A.3 and Maheran, M. J.1
1,2Faculty of Computer and Mathematical Sciences, Universiti Teknologi MARA, 40450 UiTM, Shah alam, Selangor, Malaysia
2 Institute of Engineering Mathematics, Universiti Malaysia Perlis, 02600 UMP, Arau, Perlis, Malaysia
3Arshad Ayub Graduate Business School, Universiti Teknologi MARA, 40450 UiTM, Shah alam, Selangor, Malaysia
ABSTRACT
The study of stock market volatility has been the focus of market participants primarily because most of the applications in financial economics are concerned with volatility. The economic structure in Malaysia is divided into three sectors: primary, secondary and tertiary. As the stability of the stock market is important for businesses, this paper carefully reviews the concept of volatility and analyses how different business sectors in Malaysia are affected by stock market volatility.
Keywords: Historical volatility, stock market volatility, business sector, Malaysia
INTRODUCTION
Volatility estimation is important for financial practitioners, researchers and market participants for several reasons. The unexpected conditions such as changes in economic policy, political shocks, competitors and business rivals affect stock prices resulting in stock market volatility. Greater changes in stock prices indicate a high level of volatility. Commonly, higher volatility means more uncertainty in the stock market and this phenomenon has an impact on the financial stability of businesses.
According to Sill (1993), stock market volatility may affect the economy in terms of how people spend and save money, stock and option price and how investors may hedge against
investment risks.There are variety of methods that
can be used to measure volatility such as equally weighted average, an exponentially weighted moving average (EWMA), and sophisticated models such as ARCH and GARCH (Cuthbertson & Nitzsche, 2001; Chang, 2014).

Shakila, S., Noryati, A. and Maheran, M. J.
632 Pertanika J. Sci. & Technol. 25 (2): 631 - 648 (2017)
Volatility is commonly used in estimating market risks (Ladokhin, 2009) in addition to valuing financial derivatives. Another important application can be seen in pricing the option since volatility is one of the parameters involved in estimating the option value.
Given the important role of volatility forecasting in the context of finance, this paper analyses volatility on different sectors of business in Malaysia. Economic theories divide= economic sectors based on their activity. The main sector, primary sector, refers to industries engaged in the extraction of raw materials. Secondary or manufacturing sector uses raw materials sourced from the primary sector, processes them and produce finished goods. The tertiary sector offers or provides services to customers.
The remaining sections of this paper are organised as follows: Section 2 discusses historical and implied volatility. Definition of preliminary concepts related to volatility and their application in finance are also discussed in this section. Section 3 presents the methodology including data and steps used in measuring volatility. Section 4 provides the result on different sectors’ volatility. Section 5 discusses and summarises the paper.
LITERATURE REVIEW
This section provides a brief discussion of approaches involved in estimating volatility which are historical and implied volatility. It also discusses the application of volatility estimation in the finance sector.
Measuring volatility
In most cases, the volatility value cannot be observed directly, thus the estimation of its value depends on the judgment by the analyst. There are two approaches in estimating the volatility value. Volatility value extracted from stock market returns is called historical volatility while the volatility value derived from option pricing model is called implied volatility (Koopman, Jungbacker & Hol, 2005). The difference between historical and implied volatility is discussed below.
Historical volatility
Historical volatility is usually referred to as backward looking volatility and uses past data over some period to estimate the volatility value. The standard and easiest way is by taking the standard deviation σ of the stock price return as below (Chang, 2014):
( )2
1
1
nii
R R
nσ =
−=
−∑ (1)
where iR is a continuous return at time i , R equals to mean daily return and n is the number of observations. iR and R are computed using formula

Assessing Stock Market Volatility for Different Sectors in Malaysia
633Pertanika J. Sci. & Technol. 25 (2): 631 - 648 (2017)
1
ln ii
i
SRS −
=
(2)
and
1 .n
iiR
Rn== ∑ (3)
The variable iS in (2) denotes the stock price at time .i
Using historical standard deviation, the only important information is past returns and other information is ignored although it might move the markets (Ederington & Guan, 2006). One may predict the movement of stock in the future since its value is based on how fast it has been moving in recent past.
Implied volatility
Implied volatility or forward looking volatility shows what the market “implies” about the future stock’s volatility. It is derived by solving the option pricing model e.g. Black Scholes formula for a call option as the equation below (Anoniemi, 2006):
( )1 2( ) ( )r T tC SN d Ke N d− −= − (4)
where
2
1
ln2
S r TK
dT t
σ
σ
+ + =
−
and
2 1 .d d T tσ= − −
In the equation above, C is defined as call option value, S is underlying asset, ( ).N is cumulative standard normal distribution, K is strike price, r equals to risk-free interest rate, T t− is the time to maturity where T is the date at maturity and t is the current time, and σ is volatility. In order to compute the volatility value, all other inputs required by Black Scholes formula are known except the volatility value.
Shakila, S., Noryati, A. and Maheran, M. J.
634 Pertanika J. Sci. & Technol. 25 (2): 631 - 648 (2017)
The implication of volatility in finance
In the field of finance, volatility is referred to as risk and can be measured as standard deviation (Poon & Granger, 2003). Essentially, standard deviation is used to measure the amount of dispersion of a set of data values. The data points tend to be very close to the expected value or mean if the value of standard deviation approaches zero. The large value of standard deviation means that the data points are far from mean. Another way to measure volatility is by using variance since variance and standard deviation are connected by a simple relationship (Ladokhin, 2009). However, this approach is less common compared with estimation using standard deviation.
Groud, Levy and Lubochinsky (2003) state that the most widely used concept for representing risk is the volatility of returns. However, Poon and Granger (2003) and Ladokhin (2009) do not agree. They believe that volatility is not the same as risk although it is related to it. This is because risk refers to negative outcomes of some event and volatility is about the spread of outcomes which can be positive or negative.
An important factor in valuing the option value using Black Scholes Merton model is volatility of stock prices (Rotkowski, 2011). Modelling volatility is crucial to option pricing model since it is the only variable that is unobservable (Mitra, 2011). The option value relates to the asset’s volatility value. Higher volatility leads to higher option value as the probability of the option to be valuable is higher.
METHODOLOGY
This section provides a detailed analysis of stock market volatility of 867 companies from different business sub-sectors in Malaysia. Data was taken from Datastream. The companies are grouped together based on their main business activity. There are 40 different sub-sectors which are furthered categorised into three main sectors - primary, secondary and tertiary. Table 1 shows the distribution of sub-sectors according to the main sector.
Data
Stock market prices are the source of volatility forecasts. The most common used price for estimating volatility is closing price. In this paper, the closing price is observed every day for 246 trading days. Data used in this paper was taken from the UiTM Datastream for the period of January 2014 to December 2014.

Assessing Stock Market Volatility for Different Sectors in Malaysia
635Pertanika J. Sci. & Technol. 25 (2): 631 - 648 (2017)
Table 1Distribution of the sub-sector
Primary sector Secondary sector Tertiary sector
Mining & quarrying Chemicals Water, gas & multiutilitiesOil equipment & services
Tobacco Non-life insurance
Pharmaceuticals & biotechnology Industrial transportationTechnology hardware & equipment Healthcare equipment & servicesPersonal goods Real estate investment & servicesBeverages Financial servicesFood producers Software & computer servicesLeisure goods Real estate investment trustsGeneral industrials Life insuranceForestry & papers Travel & leisureConstruction & material Food & drug retailersElectronic & electrical equipment Fixed line telecommunicationGeneral industrials BanksAutomobiles & parts Mobile telecommunicationHousehold goods & home construction
Media
Aerospace & defence General retailersIndustrial metal & mining Non-equity investment instrumentIndustrial engineeringSupport services
Measuring Stock Market Volatility from Historical Data
This sub-section briefly explains in detail the procedure involved in the calculation of stock market volatility. The steps are as follows:
● Calculate the stock market return of each company involved by using the standard logarithmic method as in (2).
● Compute the standard deviation σ of the continuously stock market return by using formula in (1).
● Calculate the annualised volatility σ̂ by:
τσσ =ˆ (5)
where τ represents the trading days per year. For this study τ is assumed equal to 246 days. Compute the volatility of each sub-sector by taking the average standard deviation of the companies with similar business activities.
The following section discusses the results based on the calculation above.

Shakila, S., Noryati, A. and Maheran, M. J.
636 Pertanika J. Sci. & Technol. 25 (2): 631 - 648 (2017)
RESULT AND DISCUSSION
This section presents the result and discusses the volatility estimation for each sector, starting with the primary sector followed by secondary and tertiary sectors.
For the primary sector, there are only 2 sub-sectors with 24 companies (see Table 2).
Table 2Distribution of the companies in primary sector
Sub-sector Number of CompaniesMining & quarrying 2Oil equipment & services 22Total 24
Figure 1 shows the volatility in primary sector by sub-sectors.
Figure 1. Volatility in primary sector by sub-sector
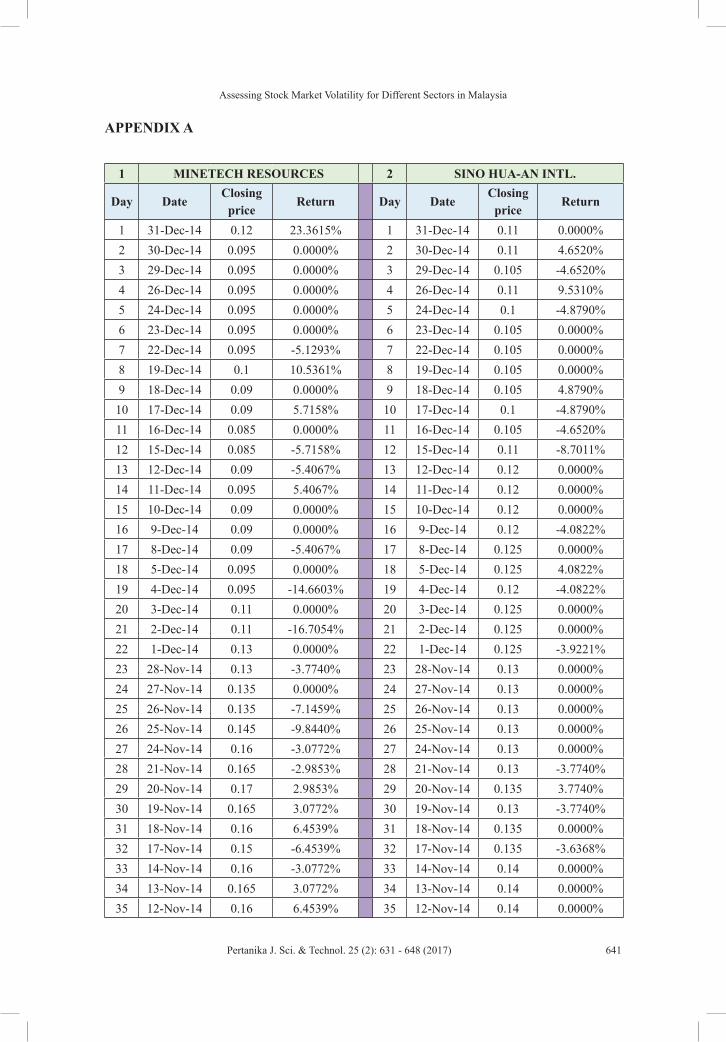
The volatility of mining and quarrying is 63.20% which is higher than oil equipment and services which is 52.29%. This means the mining and quarrying sub sector is more volatile compared with oil equipment and services. Appendix A presents the volatility value for mining and quarrying sector.
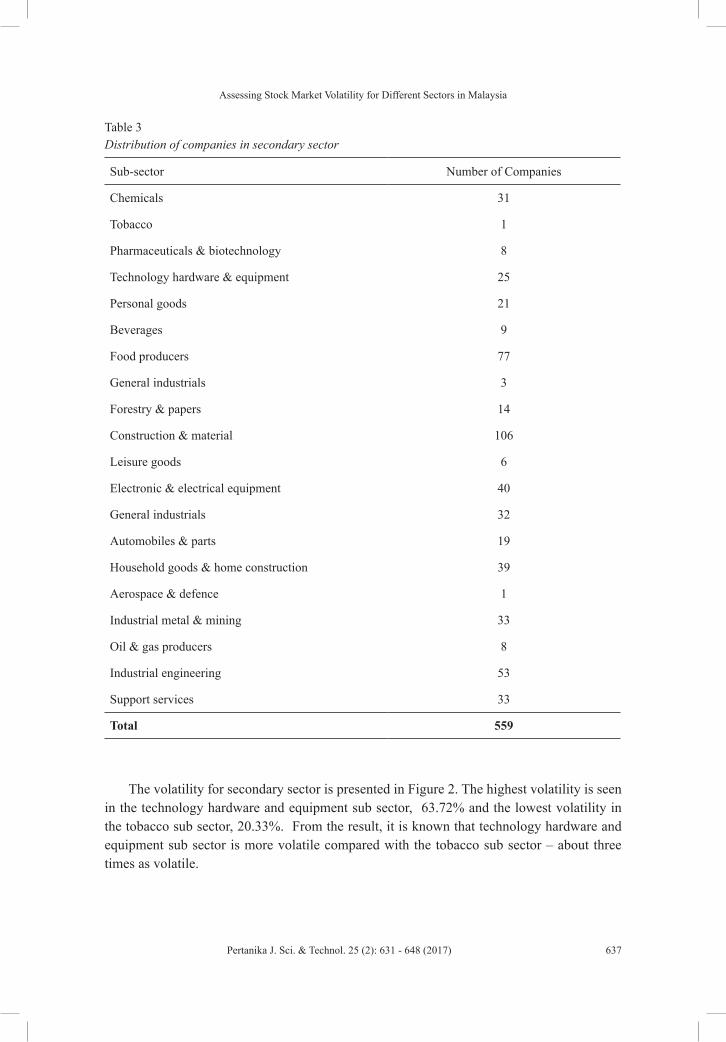
Table 3 shows the distribution of companies based on their sub-sectors. There are 20 sub-sectors with 559 companies.
Assessing Stock Market Volatility for Different Sectors in Malaysia
637Pertanika J. Sci. & Technol. 25 (2): 631 - 648 (2017)
Table 3Distribution of companies in secondary sector
Sub-sector Number of Companies
Chemicals 31
Tobacco 1
Pharmaceuticals & biotechnology 8
Technology hardware & equipment 25
Personal goods 21
Beverages 9
Food producers 77
General industrials 3
Forestry & papers 14
Construction & material 106
Leisure goods 6
Electronic & electrical equipment 40
General industrials 32
Automobiles & parts 19
Household goods & home construction 39
Aerospace & defence 1
Industrial metal & mining 33
Oil & gas producers 8
Industrial engineering 53
Support services 33
Total 559
The volatility for secondary sector is presented in Figure 2. The highest volatility is seen in the technology hardware and equipment sub sector, 63.72% and the lowest volatility in the tobacco sub sector, 20.33%. From the result, it is known that technology hardware and equipment sub sector is more volatile compared with the tobacco sub sector – about three times as volatile.

Shakila, S., Noryati, A. and Maheran, M. J.
638 Pertanika J. Sci. & Technol. 25 (2): 631 - 648 (2017)
Figure 2. Volatility in secondary sector by sub-sector
The last sector is tertiary which has 18 sub-sectors with 324 companies. Table 4 shows the distribution of companies according to their sub-sectors.
Table 4Distribution of companies in tertiary sector
Sub-sector Number of CompaniesWater, gas & multiutilities 9Non-life insurance 8Industrial transportation 32Healthcare equipment & services 13Real estate invest & services 79Financial services 16Software & computer services 57Real estate investment trusts 15Life insurance 1Travel & leisure 29Food & drug retailers 2Fixed line telecommunication 4Banks 10Mobile telecommunication 8Media 11General retailers 23Non-equity investment instrument 6Equity investment instrument 1Total 324

Assessing Stock Market Volatility for Different Sectors in Malaysia
639Pertanika J. Sci. & Technol. 25 (2): 631 - 648 (2017)
Volatility for the tertiary sector is shown in Figure 3. The fixed line telecommunications industry has the highest volatility, 86.49%, which is about 10 times more volatile than the lowest volatility which is non-equity investment instrument, 8.90%.
Figure 3. Volatility in tertiary sector by sub-sector
Based on the results, five sectors - mining and quarrying, support services, technology hardware and equipment, fixed line telecommunication, and software and computer services - have a volatility value of more than 60%. Sectors such as equity investment instrument, non-equity investment instrument, banks and real estate investment trusts have a volatility value of less than 20%. The annualised volatility of stocks normally lies between 20% and 60% (Hull, 2006).
The 35 sub-sector have more than 3 companies operating in similar industries except tobacco, aerospace and defence, life insurance, food and drug retailers, and equity investment instrument.
RESULT AND DISCUSSION
According to the results, the volatility values in different sub-sectors vary substantially. This implies the riskiness of individual company in each sub-sector. The greater the risk, the greater the potential for profits. Thus, investors with different risk portfolios can use these findings in re-creating their portfolio. Researchers may access the volatility of their countries’ stock market by using the formula and methods used in this study.
The number of companies in each sub-sector should also be considered. For a meaningful comparison, the number of companies should be between 3 and 10 (Rotkowski, 2011). Future research may examine company returns in each sector.
Shakila, S., Noryati, A. and Maheran, M. J.
640 Pertanika J. Sci. & Technol. 25 (2): 631 - 648 (2017)
ACKNOWLEDGEMENTS
The authors would like to acknowledge the financial support received from the Tabung Amanah Pembangunan akademik Pelajar and the Fundamental Research Grant Scheme (FRGS) managed by Universiti Teknologi MARA, Ministry Higher Education of Malaysia and Universiti Malaysia Perlis.
REFERENCESAhoniemi, K. (2006). Modeling and forecasting implied volatility: An econometric analysis of the VIX
index. Helsinki Center for Economic Research Discussion Paper, 129, 1-32.
Chang, V. (2014). The business intelligence as a service in the cloud. Future Generation Computer Systems, 37, 512-534.
Cuthbertson, K., & Nitzsche, D. (2001). Financial engineering: derivatives and risk management. New Jersey, NJ: John Wiley & Sons, Inc.
Ederington, L. H., & Guan, W. (2006). Measuring historical volatility. Journal of Applied Finance, 16(1), 1-10.
Grouard, M. H., Lévy, S., & Lubochinsky, C. (2003). Stock market volatility: from empirical data to their interpretation. FSR, Banque de France, 2003(2), 57-74.
Hull, J. C. (2006). Options, futures, and other derivatives. India: Pearson Education India.
Koopman, S. J., Jungbacker, B., & Hol, E. (2005). Forecasting daily variability of the S&P 100 stock index using historical, realised and implied volatility measurements. Journal of Empirical Finance, 12(3), 445-475.
Ladokhin, S. (2009). Forecasting Volatility in the Stock Market. (Unpublished Thesis). VU University Amsterdam, Faculty of Science.
Mitra, S. (2011). A review of volatility and option pricing. International Journal of Financial Markets and Derivatives, 2(3), 149-179.
Rotkowski, A. M. (2011). Estimating Stock Price Volatility in the Black-Scholes-Merton Model. A Professional Development Journal for the Consulting Disciplines, 12-19.
Sill, D. K. (1993). Predicting stock-market volatility. Business Review, (Jan), 15-28.
Assessing Stock Market Volatility for Different Sectors in Malaysia
641Pertanika J. Sci. & Technol. 25 (2): 631 - 648 (2017)
APPENDIX A
1 MINETECH RESOURCES 2 SINO HUA-AN INTL.
Day DateClosing
priceReturn
Day Date
Closing price
Return
1 31-Dec-14 0.12 23.3615% 1 31-Dec-14 0.11 0.0000%2 30-Dec-14 0.095 0.0000% 2 30-Dec-14 0.11 4.6520%3 29-Dec-14 0.095 0.0000% 3 29-Dec-14 0.105 -4.6520%4 26-Dec-14 0.095 0.0000% 4 26-Dec-14 0.11 9.5310%5 24-Dec-14 0.095 0.0000% 5 24-Dec-14 0.1 -4.8790%6 23-Dec-14 0.095 0.0000% 6 23-Dec-14 0.105 0.0000%7 22-Dec-14 0.095 -5.1293% 7 22-Dec-14 0.105 0.0000%8 19-Dec-14 0.1 10.5361% 8 19-Dec-14 0.105 0.0000%9 18-Dec-14 0.09 0.0000% 9 18-Dec-14 0.105 4.8790%10 17-Dec-14 0.09 5.7158% 10 17-Dec-14 0.1 -4.8790%11 16-Dec-14 0.085 0.0000% 11 16-Dec-14 0.105 -4.6520%12 15-Dec-14 0.085 -5.7158% 12 15-Dec-14 0.11 -8.7011%13 12-Dec-14 0.09 -5.4067% 13 12-Dec-14 0.12 0.0000%14 11-Dec-14 0.095 5.4067% 14 11-Dec-14 0.12 0.0000%15 10-Dec-14 0.09 0.0000% 15 10-Dec-14 0.12 0.0000%16 9-Dec-14 0.09 0.0000% 16 9-Dec-14 0.12 -4.0822%17 8-Dec-14 0.09 -5.4067% 17 8-Dec-14 0.125 0.0000%18 5-Dec-14 0.095 0.0000% 18 5-Dec-14 0.125 4.0822%19 4-Dec-14 0.095 -14.6603% 19 4-Dec-14 0.12 -4.0822%20 3-Dec-14 0.11 0.0000% 20 3-Dec-14 0.125 0.0000%21 2-Dec-14 0.11 -16.7054% 21 2-Dec-14 0.125 0.0000%22 1-Dec-14 0.13 0.0000% 22 1-Dec-14 0.125 -3.9221%23 28-Nov-14 0.13 -3.7740% 23 28-Nov-14 0.13 0.0000%24 27-Nov-14 0.135 0.0000% 24 27-Nov-14 0.13 0.0000%25 26-Nov-14 0.135 -7.1459% 25 26-Nov-14 0.13 0.0000%26 25-Nov-14 0.145 -9.8440% 26 25-Nov-14 0.13 0.0000%27 24-Nov-14 0.16 -3.0772% 27 24-Nov-14 0.13 0.0000%28 21-Nov-14 0.165 -2.9853% 28 21-Nov-14 0.13 -3.7740%29 20-Nov-14 0.17 2.9853% 29 20-Nov-14 0.135 3.7740%30 19-Nov-14 0.165 3.0772% 30 19-Nov-14 0.13 -3.7740%31 18-Nov-14 0.16 6.4539% 31 18-Nov-14 0.135 0.0000%32 17-Nov-14 0.15 -6.4539% 32 17-Nov-14 0.135 -3.6368%33 14-Nov-14 0.16 -3.0772% 33 14-Nov-14 0.14 0.0000%34 13-Nov-14 0.165 3.0772% 34 13-Nov-14 0.14 0.0000%35 12-Nov-14 0.16 6.4539% 35 12-Nov-14 0.14 0.0000%

Shakila, S., Noryati, A. and Maheran, M. J.
642 Pertanika J. Sci. & Technol. 25 (2): 631 - 648 (2017)
36 11-Nov-14 0.15 6.8993% 36 11-Nov-14 0.14 0.0000%37 10-Nov-14 0.14 0.0000% 37 10-Nov-14 0.14 0.0000%38 7-Nov-14 0.14 3.6368% 38 7-Nov-14 0.14 3.6368%39 6-Nov-14 0.135 3.7740% 39 6-Nov-14 0.135 0.0000%40 5-Nov-14 0.13 -20.7639% 40 5-Nov-14 0.135 0.0000%41 4-Nov-14 0.16 6.4539% 41 4-Nov-14 0.135 0.0000%42 3-Nov-14 0.15 0.0000% 42 3-Nov-14 0.135 0.0000%43 31-Oct-14 0.15 3.3902% 43 31-Oct-14 0.135 0.0000%44 30-Oct-14 0.145 -3.3902% 44 30-Oct-14 0.135 0.0000%45 29-Oct-14 0.15 0.0000% 45 29-Oct-14 0.135 0.0000%46 28-Oct-14 0.15 3.3902% 46 28-Oct-14 0.135 0.0000%47 27-Oct-14 0.145 0.0000% 47 27-Oct-14 0.135 0.0000%48 24-Oct-14 0.145 0.0000% 48 24-Oct-14 0.135 -3.6368%49 23-Oct-14 0.145 0.0000% 49 23-Oct-14 0.14 3.6368%50 21-Oct-14 0.145 3.5091% 50 21-Oct-14 0.135 0.0000%51 20-Oct-14 0.14 -3.5091% 51 20-Oct-14 0.135 0.0000%52 17-Oct-14 0.145 0.0000% 52 17-Oct-14 0.135 3.7740%53 16-Oct-14 0.145 0.0000% 53 16-Oct-14 0.13 -3.7740%54 15-Oct-14 0.145 -3.3902% 54 15-Oct-14 0.135 0.0000%55 14-Oct-14 0.15 3.3902% 55 14-Oct-14 0.135 -3.6368%56 13-Oct-14 0.145 0.0000% 56 13-Oct-14 0.14 0.0000%57 10-Oct-14 0.145 -3.3902% 57 10-Oct-14 0.14 -3.5091%58 9-Oct-14 0.15 3.3902% 58 9-Oct-14 0.145 0.0000%59 8-Oct-14 0.145 0.0000% 59 8-Oct-14 0.145 -3.3902%60 7-Oct-14 0.145 0.0000% 60 7-Oct-14 0.15 0.0000%61 3-Oct-14 0.145 0.0000% 61 3-Oct-14 0.15 0.0000%62 2-Oct-14 0.145 0.0000% 62 2-Oct-14 0.15 0.0000%63 1-Oct-14 0.145 0.0000% 63 1-Oct-14 0.15 -3.2790%64 30-Sep-14 0.145 0.0000% 64 30-Sep-14 0.155 0.0000%65 29-Sep-14 0.145 0.0000% 65 29-Sep-14 0.155 3.2790%66 26-Sep-14 0.145 0.0000% 66 26-Sep-14 0.15 -3.2790%67 25-Sep-14 0.145 -3.3902% 67 25-Sep-14 0.155 3.2790%68 24-Sep-14 0.15 0.0000% 68 24-Sep-14 0.15 0.0000%69 23-Sep-14 0.15 0.0000% 69 23-Sep-14 0.15 0.0000%70 22-Sep-14 0.15 3.3902% 70 22-Sep-14 0.15 -3.2790%71 19-Sep-14 0.145 -3.3902% 71 19-Sep-14 0.155 3.2790%72 18-Sep-14 0.15 3.3902% 72 18-Sep-14 0.15 -3.2790%73 17-Sep-14 0.145 0.0000% 73 17-Sep-14 0.155 3.2790%74 15-Sep-14 0.145 0.0000% 74 15-Sep-14 0.15 0.0000%

Assessing Stock Market Volatility for Different Sectors in Malaysia
643Pertanika J. Sci. & Technol. 25 (2): 631 - 648 (2017)
75 12-Sep-14 0.145 -3.3902% 75 12-Sep-14 0.15 -3.2790%76 11-Sep-14 0.15 3.3902% 76 11-Sep-14 0.155 3.2790%77 10-Sep-14 0.145 -3.3902% 77 10-Sep-14 0.15 0.0000%78 9-Sep-14 0.15 0.0000% 78 9-Sep-14 0.15 0.0000%79 8-Sep-14 0.15 0.0000% 79 8-Sep-14 0.15 0.0000%80 5-Sep-14 0.15 3.3902% 80 5-Sep-14 0.15 0.0000%81 4-Sep-14 0.145 0.0000% 81 4-Sep-14 0.15 -3.2790%82 3-Sep-14 0.145 0.0000% 82 3-Sep-14 0.155 0.0000%83 2-Sep-14 0.145 0.0000% 83 2-Sep-14 0.155 3.2790%84 29-Aug-14 0.145 -3.3902% 84 29-Aug-14 0.15 -6.4539%85 28-Aug-14 0.15 3.3902% 85 28-Aug-14 0.16 3.1749%86 27-Aug-14 0.145 0.0000% 86 27-Aug-14 0.155 3.2790%87 26-Aug-14 0.145 0.0000% 87 26-Aug-14 0.15 0.0000%88 25-Aug-14 0.145 0.0000% 88 25-Aug-14 0.15 -6.4539%89 22-Aug-14 0.145 0.0000% 89 22-Aug-14 0.16 0.0000%90 21-Aug-14 0.145 3.5091% 90 21-Aug-14 0.16 3.1749%91 20-Aug-14 0.14 -6.8993% 91 20-Aug-14 0.155 0.0000%92 19-Aug-14 0.15 6.8993% 92 19-Aug-14 0.155 0.0000%93 18-Aug-14 0.14 0.0000% 93 18-Aug-14 0.155 0.0000%94 15-Aug-14 0.14 0.0000% 94 15-Aug-14 0.155 0.0000%95 14-Aug-14 0.14 -3.5091% 95 14-Aug-14 0.155 0.0000%96 13-Aug-14 0.145 3.5091% 96 13-Aug-14 0.155 3.2790%97 12-Aug-14 0.14 0.0000% 97 12-Aug-14 0.15 -3.2790%98 11-Aug-14 0.14 0.0000% 98 11-Aug-14 0.155 3.2790%99 8-Aug-14 0.14 -6.8993% 99 8-Aug-14 0.15 -3.2790%100 7-Aug-14 0.15 0.0000% 100 7-Aug-14 0.155 -3.1749%101 6-Aug-14 0.15 6.8993% 101 6-Aug-14 0.16 3.1749%102 5-Aug-14 0.14 0.0000% 102 5-Aug-14 0.155 0.0000%103 4-Aug-14 0.14 -3.5091% 103 4-Aug-14 0.155 3.2790%104 1-Aug-14 0.145 0.0000% 104 1-Aug-14 0.15 0.0000%105 31-Jul-14 0.145 -3.3902% 105 31-Jul-14 0.15 0.0000%106 30-Jul-14 0.15 3.3902% 106 30-Jul-14 0.15 0.0000%107 25-Jul-14 0.145 3.5091% 107 25-Jul-14 0.15 3.3902%108 24-Jul-14 0.14 -3.5091% 108 24-Jul-14 0.145 -3.3902%109 23-Jul-14 0.145 -3.3902% 109 23-Jul-14 0.15 3.3902%110 22-Jul-14 0.15 0.0000% 110 22-Jul-14 0.145 0.0000%111 21-Jul-14 0.15 0.0000% 111 21-Jul-14 0.145 0.0000%112 18-Jul-14 0.15 14.3101% 112 18-Jul-14 0.145 0.0000%113 17-Jul-14 0.13 0.0000% 113 17-Jul-14 0.145 0.0000%

Shakila, S., Noryati, A. and Maheran, M. J.
644 Pertanika J. Sci. & Technol. 25 (2): 631 - 648 (2017)
114 16-Jul-14 0.13 -3.7740% 114 16-Jul-14 0.145 0.0000%115 14-Jul-14 0.135 0.0000% 115 14-Jul-14 0.145 0.0000%116 11-Jul-14 0.135 0.0000% 116 11-Jul-14 0.145 -3.3902%117 10-Jul-14 0.135 3.7740% 117 10-Jul-14 0.15 0.0000%118 9-Jul-14 0.13 0.0000% 118 9-Jul-14 0.15 3.3902%119 8-Jul-14 0.13 -7.4108% 119 8-Jul-14 0.145 -6.6691%120 7-Jul-14 0.14 3.6368% 120 7-Jul-14 0.155 3.2790%121 4-Jul-14 0.135 -10.5361% 121 4-Jul-14 0.15 0.0000%122 3-Jul-14 0.15 0.0000% 122 3-Jul-14 0.15 0.0000%123 2-Jul-14 0.15 0.0000% 123 2-Jul-14 0.15 0.0000%124 1-Jul-14 0.15 0.0000% 124 1-Jul-14 0.15 3.3902%125 30-Jun-14 0.15 -3.2790% 125 30-Jun-14 0.145 0.0000%126 27-Jun-14 0.155 0.0000% 126 27-Jun-14 0.145 -3.3902%127 26-Jun-14 0.155 0.0000% 127 26-Jun-14 0.15 0.0000%128 25-Jun-14 0.155 3.2790% 128 25-Jun-14 0.15 0.0000%129 24-Jun-14 0.15 6.8993% 129 24-Jun-14 0.15 0.0000%130 23-Jun-14 0.14 0.0000% 130 23-Jun-14 0.15 0.0000%131 20-Jun-14 0.14 -3.5091% 131 20-Jun-14 0.15 0.0000%132 19-Jun-14 0.145 -3.3902% 132 19-Jun-14 0.15 0.0000%133 18-Jun-14 0.15 0.0000% 133 18-Jun-14 0.15 0.0000%134 17-Jun-14 0.15 0.0000% 134 17-Jun-14 0.15 3.3902%135 16-Jun-14 0.15 14.3101% 135 16-Jun-14 0.145 0.0000%136 13-Jun-14 0.13 0.0000% 136 13-Jun-14 0.145 0.0000%137 12-Jun-14 0.13 -3.7740% 137 12-Jun-14 0.145 0.0000%138 11-Jun-14 0.135 0.0000% 138 11-Jun-14 0.145 0.0000%139 10-Jun-14 0.135 7.6961% 139 10-Jun-14 0.145 0.0000%140 9-Jun-14 0.125 -3.9221% 140 9-Jun-14 0.145 0.0000%141 6-Jun-14 0.13 3.9221% 141 6-Jun-14 0.145 0.0000%142 5-Jun-14 0.125 -3.9221% 142 5-Jun-14 0.145 -3.3902%143 4-Jun-14 0.13 3.9221% 143 4-Jun-14 0.15 0.0000%144 3-Jun-14 0.125 0.0000% 144 3-Jun-14 0.15 3.3902%145 2-Jun-14 0.125 -3.9221% 145 2-Jun-14 0.145 0.0000%146 30-May-14 0.13 0.0000% 146 30-May-14 0.145 0.0000%147 29-May-14 0.13 3.9221% 147 29-May-14 0.145 0.0000%148 28-May-14 0.125 -3.9221% 148 28-May-14 0.145 -3.3902%149 27-May-14 0.13 3.9221% 149 27-May-14 0.15 6.8993%150 26-May-14 0.125 -3.9221% 150 26-May-14 0.14 0.0000%151 23-May-14 0.13 0.0000% 151 23-May-14 0.14 -3.5091%152 22-May-14 0.13 -3.7740% 152 22-May-14 0.145 0.0000%

Assessing Stock Market Volatility for Different Sectors in Malaysia
645Pertanika J. Sci. & Technol. 25 (2): 631 - 648 (2017)
153 21-May-14 0.135 0.0000% 153 21-May-14 0.145 0.0000%154 20-May-14 0.135 0.0000% 154 20-May-14 0.145 0.0000%155 19-May-14 0.135 0.0000% 155 19-May-14 0.145 3.5091%156 16-May-14 0.135 0.0000% 156 16-May-14 0.14 -3.5091%157 15-May-14 0.135 -3.6368% 157 15-May-14 0.145 -3.3902%158 14-May-14 0.14 0.0000% 158 14-May-14 0.15 6.8993%159 12-May-14 0.14 0.0000% 159 12-May-14 0.14 0.0000%160 9-May-14 0.14 -3.5091% 160 9-May-14 0.14 -3.5091%161 8-May-14 0.145 0.0000% 161 8-May-14 0.145 3.5091%162 7-May-14 0.145 7.1459% 162 7-May-14 0.14 -6.8993%163 6-May-14 0.135 0.0000% 163 6-May-14 0.15 3.3902%164 5-May-14 0.135 -3.6368% 164 5-May-14 0.145 -3.3902%165 2-May-14 0.14 -3.5091% 165 2-May-14 0.15 0.0000%166 30-Apr-14 0.145 3.5091% 166 30-Apr-14 0.15 0.0000%167 29-Apr-14 0.14 -3.5091% 167 29-Apr-14 0.15 -3.2790%168 28-Apr-14 0.145 -3.3902% 168 28-Apr-14 0.155 -3.1749%169 25-Apr-14 0.15 0.0000% 169 25-Apr-14 0.16 6.4539%170 24-Apr-14 0.15 0.0000% 170 24-Apr-14 0.15 -6.4539%171 23-Apr-14 0.15 3.3902% 171 23-Apr-14 0.16 9.8440%172 22-Apr-14 0.145 -3.3902% 172 22-Apr-14 0.145 0.0000%173 21-Apr-14 0.15 0.0000% 173 21-Apr-14 0.145 -3.3902%174 18-Apr-14 0.15 0.0000% 174 18-Apr-14 0.15 3.3902%175 17-Apr-14 0.15 6.8993% 175 17-Apr-14 0.145 0.0000%176 16-Apr-14 0.14 -6.8993% 176 16-Apr-14 0.145 -3.3902%177 15-Apr-14 0.15 -3.2790% 177 15-Apr-14 0.15 3.3902%178 14-Apr-14 0.155 0.0000% 178 14-Apr-14 0.145 0.0000%179 11-Apr-14 0.155 3.2790% 179 11-Apr-14 0.145 0.0000%180 10-Apr-14 0.15 6.8993% 180 10-Apr-14 0.145 -3.3902%181 9-Apr-14 0.14 7.4108% 181 9-Apr-14 0.15 6.8993%182 8-Apr-14 0.13 0.0000% 182 8-Apr-14 0.14 -3.5091%183 7-Apr-14 0.13 -3.7740% 183 7-Apr-14 0.145 0.0000%184 4-Apr-14 0.135 -3.6368% 184 4-Apr-14 0.145 0.0000%185 3-Apr-14 0.14 0.0000% 185 3-Apr-14 0.145 -3.3902%186 2-Apr-14 0.14 0.0000% 186 2-Apr-14 0.15 3.3902%187 1-Apr-14 0.14 0.0000% 187 1-Apr-14 0.145 0.0000%188 31-Mar-14 0.14 -3.5091% 188 31-Mar-14 0.145 0.0000%189 28-Mar-14 0.145 -3.3902% 189 28-Mar-14 0.145 0.0000%190 27-Mar-14 0.15 3.3902% 190 27-Mar-14 0.145 0.0000%191 26-Mar-14 0.145 -3.3902% 191 26-Mar-14 0.145 0.0000%

Shakila, S., Noryati, A. and Maheran, M. J.
646 Pertanika J. Sci. & Technol. 25 (2): 631 - 648 (2017)
192 25-Mar-14 0.15 0.0000% 192 25-Mar-14 0.145 -3.3902%193 24-Mar-14 0.15 -3.2790% 193 24-Mar-14 0.15 3.3902%194 21-Mar-14 0.155 3.2790% 194 21-Mar-14 0.145 0.0000%195 20-Mar-14 0.15 0.0000% 195 20-Mar-14 0.145 0.0000%196 19-Mar-14 0.15 3.3902% 196 19-Mar-14 0.145 0.0000%197 18-Mar-14 0.145 0.0000% 197 18-Mar-14 0.145 3.5091%198 17-Mar-14 0.145 0.0000% 198 17-Mar-14 0.14 -3.5091%199 14-Mar-14 0.145 -3.3902% 199 14-Mar-14 0.145 0.0000%200 13-Mar-14 0.15 0.0000% 200 13-Mar-14 0.145 0.0000%201 12-Mar-14 0.15 -6.4539% 201 12-Mar-14 0.145 -6.6691%202 11-Mar-14 0.16 -3.0772% 202 11-Mar-14 0.155 3.2790%203 10-Mar-14 0.165 0.0000% 203 10-Mar-14 0.15 3.3902%204 7-Mar-14 0.165 -2.9853% 204 7-Mar-14 0.145 -3.3902%205 6-Mar-14 0.17 -2.8988% 205 6-Mar-14 0.15 3.3902%206 5-Mar-14 0.175 2.8988% 206 5-Mar-14 0.145 3.5091%207 4-Mar-14 0.17 -5.7158% 207 4-Mar-14 0.14 0.0000%208 3-Mar-14 0.18 0.0000% 208 3-Mar-14 0.14 0.0000%209 28-Feb-14 0.18 -2.7399% 209 28-Feb-14 0.14 -6.8993%210 27-Feb-14 0.185 -2.6668% 210 27-Feb-14 0.15 3.3902%211 26-Feb-14 0.19 -7.5986% 211 26-Feb-14 0.145 0.0000%212 25-Feb-14 0.205 0.0000% 212 25-Feb-14 0.145 3.5091%213 24-Feb-14 0.205 2.4693% 213 24-Feb-14 0.14 -6.8993%214 21-Feb-14 0.2 -7.2321% 214 21-Feb-14 0.15 0.0000%215 20-Feb-14 0.215 -24.6133% 215 20-Feb-14 0.15 0.0000%216 19-Feb-14 0.275 -5.3110% 216 19-Feb-14 0.15 3.3902%217 18-Feb-14 0.29 -8.2692% 217 18-Feb-14 0.145 -3.3902%218 17-Feb-14 0.315 3.2261% 218 17-Feb-14 0.15 0.0000%219 14-Feb-14 0.305 5.0431% 219 14-Feb-14 0.15 3.3902%220 13-Feb-14 0.29 -5.0431% 220 13-Feb-14 0.145 -3.3902%221 12-Feb-14 0.305 -3.2261% 221 12-Feb-14 0.15 3.3902%222 11-Feb-14 0.315 6.5597% 222 11-Feb-14 0.145 3.5091%223 10-Feb-14 0.295 14.5712% 223 10-Feb-14 0.14 0.0000%224 7-Feb-14 0.255 0.0000% 224 7-Feb-14 0.14 7.4108%225 6-Feb-14 0.255 10.3184% 225 6-Feb-14 0.13 0.0000%226 5-Feb-14 0.23 6.7441% 226 5-Feb-14 0.13 0.0000%227 4-Feb-14 0.215 17.7681% 227 4-Feb-14 0.13 -3.7740%228 30-Jan-14 0.18 0.0000% 228 30-Jan-14 0.135 0.0000%229 29-Jan-14 0.18 0.0000% 229 29-Jan-14 0.135 0.0000%230 28-Jan-14 0.18 2.8171% 230 28-Jan-14 0.135 -3.6368%

Assessing Stock Market Volatility for Different Sectors in Malaysia
647Pertanika J. Sci. & Technol. 25 (2): 631 - 648 (2017)
231 27-Jan-14 0.175 -2.8171% 231 27-Jan-14 0.14 0.0000%232 24-Jan-14 0.18 5.7158% 232 24-Jan-14 0.14 3.6368%233 23-Jan-14 0.17 -5.7158% 233 23-Jan-14 0.135 -3.6368%234 22-Jan-14 0.18 -8.0043% 234 22-Jan-14 0.14 3.6368%235 21-Jan-14 0.195 8.0043% 235 21-Jan-14 0.135 -3.6368%236 20-Jan-14 0.18 -8.0043% 236 20-Jan-14 0.14 0.0000%237 16-Jan-14 0.195 -2.5318% 237 16-Jan-14 0.14 0.0000%238 15-Jan-14 0.2 -9.5310% 238 15-Jan-14 0.14 0.0000%239 13-Jan-14 0.22 4.6520% 239 13-Jan-14 0.14 -3.5091%240 10-Jan-14 0.21 10.0083% 240 10-Jan-14 0.145 3.5091%241 9-Jan-14 0.19 0.0000% 241 9-Jan-14 0.14 0.0000%242 8-Jan-14 0.19 2.6668% 242 8-Jan-14 0.14 0.0000%243 7-Jan-14 0.185 0.0000% 243 7-Jan-14 0.14 3.6368%244 6-Jan-14 0.185 -2.6668% 244 6-Jan-14 0.135 0.0000%245 3-Jan-14 0.19 2.6668% 245 3-Jan-14 0.135 0.0000%246 2-Jan-14 0.185 246 2-Jan-14 0.135
Volatility (day) 5.12% Volatility (day) 2.94%Volatility (annually) 80.28% Volatility (annually) 46.12%
Average (volatility) 63.20%