Embed Size (px)
Citation preview
PERSONALITY AND COG, IT DIFFERENCES 3ETWEEN ONLINE AND CONVENTIONAL UNIVERSITY STUDENTS
by
Karel J. Stanz
Thesis
Submitted in fulfilment of the requirements for the degree
DOCTOR OF PHILOSOPHIA
LEADERSHIP IN PERFORMANCE AND CHANGE
in the
FACULTY OF MANAGEMENT
at the
UNIVERSITY OF
JOHANNESBURG
Promoter: Prof Christa Fouche
JANUARY 2005

STATEMENT
I certify that the dissertation submitted by me far the degree of DOCTOR of
PHILOSOPIA (Leadership in Performance and Change) at the University of
Johannesburg has not been submitted by me for a degree at another
faculty/university.
Karel J Stanz
DECEMBER 2004
ii

ACKNOWLEDGEMENTS
I would like to express my sincere gratitude and appreciation to the following
persons who greatly contributed to the successful completion of my studies:
Prof Christa Fouche, my promoter, for her skilful guidance. Her commitment,
professionalism, focus, optimism and sense of humour as well as her dedication
were a permanent source of encouragement, especially in the last two years from
New Zealand.
My deepest appreciation goes to my fellow students who became friends and
colleagues, allowed me to assist them (30 Doctoral and 22 Master's candidates) to
complete their studies and made this thesis a rich learning experience. Most of
them offered me support, encouragement, and were interested in this project.
Prof Johan Schepers, who supported, encouraged, showed interest and helped.
What a privilege to sit in the office next door to him!
Deo Strumpfer, former colleague and friend, for providing the initial inspiration for
my studies.
Ms Riette Eiselen, Head of Statcon (RAU), for effectively conducting the statistical
analyses.
My employer, RAU and the Department of Human Resource Management, for
supporting my studies. A special word of thanks to Prof Jos Coetzee!
To Charles Lutwidge Dodgson, alias Lewis Carroll, for the very appropriate
comments of his characters in Alice's Adventures in Wonderland (1865) and
Through the Looking Glass (1872).
Marietjie, my wife, for believing in me. Thank you for being there while I was
completing these chapters of my life. Madri, Carli, Danien "Cool, nou is daai boek-
ding klaar"!
Most important, my gratitude to God for His grace, companionship and
faithful guidance throughout the most difficult of times.
Karel J Stanz
December 2004
iii

I WANT TO DEDICATE THIS RESEARCH TO
MY FRIEND...
MY LOVE..
MY LIFE...
MY WIFE MARIETJIE
I KNOW I AM NOT THE BEST
BUT I TRY HARDER...
iv

ABSTRACT
PERSONALITY AND COGNITIVE DIFFERENCES BETWEEN ONLINE UNIVERSITY
STUDENTS AND CONVENTIONAL STUDENTS
By
Karel J Stanz
PROMOTER: Prof Christa Fouclgie
DEPARTMENT: Department of Human Resource Management
Faculty of Management
University of Johannesburg
DEGREE: D. Phil
DATE: January 2005
Background
The advances in information technologies have created an array of possibilities
for today's learners in institutions of higher education. Kaye (1989) predicted that
online education would ultimately emerge as a new educational paradigm, taking
its place alongside conventional (face to face) education as well as distance
education, and even changing the face of education in general.
Although online education is becoming a common component of higher
education, Wang & Newlin, (2000) confirm that relatively little is known about the
characteristics of learners who choose to enroll for courses in an online learning
environment. Schlosser and Anderson (1997) published a report entitled
Distance education: Review of the literature in which they did not cite a single
study on the characteristics of online learners.
v

What seem to remain unanswered out of the literature are the questions:
Who are the students who undertake and succeed in online learning? Are these
students different from students who take and succeed in traditional, face-to-face
classes?
The answers to these questions are critical for the future of higher education.
Literature Research
The primary objective of a literature oversew is to create a theoretical frame of
reference for the concept of online education. The two secondary objectives of
the literature overview are:
to discuss the role of online education in Higher Education. Such a
discussion will provide a background for understanding online education and,
specifically, distance education and how it impacts on higher education. A brief
overview of the history of distance education from the correspondence phase to
the current use of computer-mediated communication will be outlined. Also
briefly reviewed will be the theories underlying distance education, focusing on
those that have an impact on online education.
to review the research on distance- and conventional education.
Currently, research on distance education is relatively narrow and many studies
highlight a need for research to be conducted in the various areas of online
education (Russell, 2002; Charp, 1999). Merisotis and Olsen confirm this view
by concluding "...while a plethora of literature on the distance education
phenomenon is available, original research on distance education is limited."
(2000, p. 62).
Empirical Research Objective
The primary objective was to determine whether there are:
vi

Differences between online university students and conventional university
students as a function of personality factors;
Differences between online university students and conventional university
students as a function of cognitive factors, and
Differences between online university students and conventional university
students as a function of biographical factors.
The following secondary objectives were formulated:
Personality Differences
To determine personality differences for the two groups in respect of
(a) personality factors, (b) personality types, (c) locus of control, and
(d) interest.
Cognitive Differences
To determine cognitive differences for the two groups in respect of (a)
aptitude, (b) previous academic performance at school, (c)
matriculation achievement, (d) first-semester academic performance at
university, and (e) academic performance on the HRM course.
Biographical Differences
To determine biographical differences for the two groups in respect of
(a) gender, (b) age, (c) language, and (d) computer literacy.
Participants
The sample from which the primary and secondary data were obtained consisted
of first-year students at a large University in South Africa. The study population
consisted of first-year students enrolled for a compulsory Business Science
course, tested in 2001. Based on self-selection, 242 students voluntarily made
use of the online course while 323 students used the conventional course
offered. The ages of the students varied from 18 to 21 years, 91% of them 18
vii

years and younger. As far as gender was concerned, 51,9% were female; and
69,1% preferred English as the language of instruction.
The Measuring Instrument
In order to identify the personality and cognitive differences between online and
conventional students, the following measuring instruments were selected for use
in the current study:
Personality Differences
The 16 Personality Factor Questionnaire (16PF),
Jung's Personality Types ,
The Locus of Control Inventory (LCI), and
The 19 Field Interest Inventory (19 FII).
Cognitive Differences
The Senior Aptitude Tests (SAT),
Academic Performance at School,
General Average Matriculation Achievement,
The First Semester Academic Performance, and
Academic Performance on the HRM Course.
Biographical Questionnaire
Gender, Age, Computer Literacy, and Language.
The Research Procedure
The prescribed battery of psychometric tests was administered to the full intake
of first-year university students by the Career Counselling Division during their
first month at the university. Testing was compulsory for all first-year students
and took place over four days under strict supervision. A course was designed
for conventional classes supplemented with an online version of the same course
and students were allowed to choose freely to enrol either in online or in
•
viii

conventional sections of the course. Performances of the students in the first
semester as well as during the course being presented were collected as primary
data.
Statistical analysis
The primary and secondary data sets were subject to one-way multivariate
analyses of variance (MANOVAs using Hotellings' T2), followed by students' t-
tests. Estimated effect sizes were also calculated using coefficient eta. In order to
test hypotheses relating to biographical differences, cross tabulations were
calculated using the chi-square test. Cramer's V was also calculated as an index
of the strength of the association between • the biographical variables. All
calculations were done by means of the SPSS- Windows program of SPSS -
International. The analysis was conducted with the assistance of a Statistical
Consultation Service.
Conclusions and Recommendations
Very little empirical research has been conducted, certainly in the South African
context, but also internationally, in assessing differences between online and
conventional students. It is, however, reasonable to conclude that there is
insufficient evidence to support the expectation that there are significant
personality and cognitive differences between online and conventional students.
This is supported by studies done by Schlosser & Anderson (1997) and Moore
and Kearsley (1996). What makes any course good or poor is a consequence of
how well it is designed, delivered, and conducted, not whether the students are
face-to-face or at a distance (Moore & Kearsley, 1996).
This study focussed on one of the burning 'people' issues in South Africa, and
contributed to a better understanding of the kind of person who takes online
learning by assessing personality and cognitive differences between online and
conventional students. Insight into personality and cognitive differences enables
the effective management thereof, which in turn contributes to the success of
ix

educational institutions, by providing a framework for institutions of higher
education to understand, manage and facilitate online and conventional students.
Aided by this study, educators and course designers will be able to match the
needs and expectations of their online students more effectively. This will ensure
that, from a pedagogical perspective, the design of a flexible learning
environment within a technology-rich medium is not hampered by a lack of
understanding of the needs of learners. This information will allow institutions of
higher learning to increase the overall satisfaction of the learner in the online
environment. Lastly, it will make a contribution to ensuring that course design
does not become technology driven but, rather, allows technology to serve as a
resource in support of student needs.
Within the framework of this study the following suggestions for potential
research opportunities are made:
A comparative analysis should be carried out between students from different
South African Universities, from different faculties and registered for different
courses to give generalised findings.
Further research should include a comparison between students within the
context of South African higher education and other institutions that might
provide online education.
Given the findings of this study, there is still a large amount of effect size to be
explained. Individual characteristics such as learning styles and commitment
could be included.

"...and what is the use of a book," thought Alice, "without pictures or
conversation?
xi

TABLE OF CONTENTS
STATEMENT II
ACKNOWLEDGEMENTS III
ABSTRACT IV
TABLE OF CONTENTS XI
LIST OF TABLES XV
LIST OF FIGURES XVIII
CHAPTER 1: 2
PROBLEM STATEMENT, PURPOSE AND METHOD 2
1.1 INTRODUCTION 2
1. 1.1 Background to the problem 2
1.2 PROBLEM STATEMENT 7
1.3 PURPOSE OF STUDY 8
1.4 OBJECTIVES OF RESEARCH 8
1.4.1 Literature Review 9
1.4.2 Empirical Research Objectives 10
1.5 RESEARCH HYPOTHESES 1 1
1.5.1 Personality Differences 12
1.5.2 Cognitive Differences 1 2
1.5.3 Biographical Differences 13
I.6 SIGNIFICANCE OF THE STUDY 14
1.6.1 Theoretical Significance. 15
1.6.2 Methodological Significance 15
1.6.3 Practical Significance 15
1.7 NATURE OF THE STUDY 16
ix

1.8 DELIMITATIONS 18
1.9 LIMITATIONS 19
1.10 DEFINITION OF KEY TERMS USED 20
1.11 CHAPTER LAYOUT 23
1.12 CONCLUSION 25
CHAPTER 2: 28
LITERATURE RESEARCH 28
2.1 INTRODUCTION 28
2.2 THE ROLE OF ONLINE EDUCATION IN HIGHER EDUCATION 29
2.2.1 Distance Education 29
2.2.2 Distance Education vs Online Education 38
2.2.3 Online education compared to conventional classroom education 42
2.3 RESEARCH ON DISTANCE EDUCATION AND CONVENTIONAL EDUCATION 43
2.3.1 Course completion and dropout rate 44
2.3.2 Student outcomes, such as grades and test scores; 48
2.3.3 Attitudes and perceptions about learning through distance education 54
2.3.4 Who undertakes online courses? 55
2.3.5 Summary of literature findings 62
2.4 CONCLUSION 63
CHAPTER 3: 66
RESEARCH METHODOLOGY AND PROCEDURES 66
3.1 INTRODUCTION 66
3.2 RESEARCH HYPOTHESES 68
3. 2.1 Personality Differences 68
3. 2.2 Cognitive Differences 70
3.2.3 Biographical Differences 73
3.3 RESEARCH DESIGN 75
3.3.1 Quantitative Research vs Qualitative Research 77
3.3.2 Classifying the Research Design 79
3.3.3 Secondary data versus primary data 81
3.3.4 Choice of Research Design 82
3.4 SAMPLE 83
3.4.1 Sample Statistics 83
X
3.4.2 Descriptive Statistics for the Two Groups (Online and Conventional Students) 86
3.5 THE MEASUREMENT INSTRUMENTS 90
3.5.1 Personality Measures 91
3.5.2 Cognitive ability measures 93
3.5.3 Biographical Information 95
3.6 RESEARCH PROCESS 95
3.7 PROCEDURE OF DATA COLLECTION 96
3.8 STATISTICAL ANALYSES APPLIED [N THE RESEARCH 97
3.9 CONCLUSION 98
CHAPTER 4: 100
RESEARCH RESULTS 100
4.1 INTRODUCTION 100
4.2 STATISTICAL ANALYSIS 101
4.2.1 Differences in means between the two groups with regard to objective 1: Personality
Differences 102
4.2.2 Differences in means between the two groups with respect to objective 2: Cognitive
factors 118
4.2.3 Differences in means between the two groups with respect to objective 3" Biographical
Differences 135
4.3 SUMMARY OF MAIN FINDINGS 141
4.3.1 Personality Differences 142
4.3.2 Cognitive Differences 143
4.3.3 Biographical Differences 144
4.4 CONCLUSION 145
CHAPTER 5: 147
DISCUSSION OF RESULTS, CONCLUSION AND RELATED RECOMMENDATIONS 147
5.1 INTRODUCTION 147
5.2 PRESENTATION OF THIS RESEARCH 148
5.3 A SUMMARY OF METHODOLOGY 149
5.3.1 The Research Participants 149
5.3.2 The Measuring Instruments 150
5.3.3 The Research Procedure 151
5.3.4 Statistical Analysis 151
xi

5.4 DISCUSSION OF FINDINGS 152
5.4.1 Literature Research Objectives 152
5.4.2 Empirical Research Objectives 155
5.5 SIGNIFICANCE OF THE STUDY 164
5.5.1 Theoretical Significance 164
5.5.2 Methodological Significance 165
5.5.3 Practical Significance 165
5.6 THE MAIN CONTRIBUTION OF THE STUDY 166
5.6.1 Theoretical Value 166
5.6.2 Methodological Value 167
5.6.3 Practical Value 169
5.7 LIMITATIONS OF STUDY 169
5.7.1 Delimitations 170
5.7.2 Limitations 170
5.8 RECOMMENDATIONS 171
5.8.1 Recommendations from a Theoretical Perspective 172
5.8.2 Recommendations from a Methodological Perspective 172
5.8.3 Recommendations from a Practical Perspective /73
5.9 SUGGESTIONS FOR POTENTIAL RESEARCH OPPORTUNITIES 174
5.10 CONCLUSION 174
xii

LIST OF TABLES
TABLE 3. 1 AGE GROUP DISTRIBUTIONS FOR THE OBTAINED SAMPLE 84
TABLE 3.2 GENDER DISTRIBUTIONS FOR THE OBTAINED SAMPLE 84
TABLE 3.3 PREFERRED LANGUAGE FOR THE OBTAINED SAMPLE 85
TABLE 3.4 HOME LANGUAGE FOR THE OBTAINED SAMPLE 85
TABLE 3. 5 CROSS TABULATION : AGE GROUP FOR
ONLINE AND CONVENTIONAL STUDENTS 87
TABLE 3.6 GENDER CROSS-TABULATION FOR ONLINE AND CONVENTIONAL STUDENTS 87
TABLE 3.7 PREFERRED LANGUAGE CROSS-TABULATION FOR ONLINE AND
CONVENTIONAL STUDENTS 88
TABLE 3.8 HOME LANGUAGE CROSS-TABULATION FOR
ONLINE AND CONVENTIONAL STUDENTS 89
TABLE 3.9 CALCULATION OF MATRICULATION SCORES 94
TABLE 4.1 MULTIVARIATE TESTS OF SIGNIFICANCE FOR THE 16PF 103
TABLE 4.2 DESCRIPTIVE STATISTICS FOR THE I6PF 104
TABLE 4.3 T-TEST: INDEPENDENT COMPARISONS OF THE MEAN DIFFERENCE SCORES ON
THE I6PF 105
TABLE 4.4 MULTIVARIATE TESTS OF SIGNIFICANCE FOR THE JPT 107
TABLE 4.5 DESCRIPTIVE STATISTICS FOR THE JPT 108
TABLE 4.6 T-TEST: INDEPENDENT COMPARISONS OF THE MEAN DIFFERENCE SCORES ON
THE JPT 109
TABLE 4.7 MULTIVARIATE TESTS OF SIGNIFICANCE FOR THE LCI 110
TABLE 4.8 DESCRIPTIVE STATISTICS FOR THE LCI 111
TABLE 4.9 T-TEST: INDEPENDENT COMPARISONS OF THE MEAN DIFFERENCE SCORES
ON LCI 112
TABLE 4.10 MULTIVARIATE TESTS OF SIGNIFICANCE FOR THE 19FII 113
TABLE 4.11 DESCRIPTIVE STATISTICS ON THE 19FII 115
TABLE 4.12T-TEST: INDEPENDENT COMPARISONS OF THE MEAN DIFFERENCE
SCORES ON THE 19FII 116
TABLE 4.13 MULTIVARIATE TESTS OF SIGNIFICANCE FOR THE SAT 119
TABLE 4.14 DESCRIPTIVE STATISTICS ON THE SAT 120

TABLE 4.15 T-TEST: INDEPENDENT COMPARISONS OF THE MEAN DIFFERENCE SCORES ON
THE SAT 122
TABLE 4.16 MULTIVARIATE TESTS OF SIGNIFICANCE FOR ACADEMIC PERFORMANCE AT
SCHOOL 123
TABLE 4.17 DESCRIPTIVE STATISTICS ON ACADEMIC PERFORMANCE AT SCHOOL 124
TABLE 4.18T-TEST: INDEPENDENT COMPARISONS OF THE MEAN DIFFERENCE SCORES FOR
ACADEMIC PERFORMANCE AT SCHOOL 125
TABLE 4.19 DESCRIPTIVE STATISTICS ON GENERAL AVERAGE MATRICULATION
ACHIEVEMENT 127
TABLE 4.20T-TEST: INDEPENDENT COMPARISONS OF THE MEAN DIFFERENCE SCORES ON
GENERAL AVERAGE MATRICULATION ACHIEVEMENT 128
TABLE 4.21MULTIVARIATE TESTS OF SIGNIFICANCE FOR ACADEMIC PERFORMANCE IN THE
FIRST SEMESTER 129
TABLE 4.22 DESCRIPTIVE STATISTICS ON ACADEMIC PERFORMANCE IN THE FIRST
SEMESTER 130
TABLE 4.23 T-TEST: INDEPENDENT COMPARISONS OF THE MEAN DIFFERENCE SCORES ON
ACADEMIC PERFORMANCE IN THE FIRST SEMESTER 132
TABLE 4.24 DESCRIPTIVE STATISTICS ON ACADEMIC PERFORMANCE ON THE HRM
COURSE 133
TABLE 4.25 T-TEST: INDEPENDENT COMPARISONS OF THE MEAN DIFFERENCE SCORES ON
ACADEMIC PERFORMANCE ON THE HRM COURSE 134
TABLE 4.26 CROSS-TABULATION: DESCRIPTIVE STATISTICS ON GENDER 136
TABLE 4.27 CHI-SQUARE TEST: GENDER VS TYPE OF LEARNER
(ONLINE VS CONVENTIONAL) 136
TABLE 4.28 CROSSTABULATION: DESCRIPTIVE STATISTICS ON AGE 137
TABLE 4.29 CHI-SQUARE TEST: AGE GROUP VS TYPE OF LEARNER(ONLINE VS
CONVENTIONAL) 138
TABLE 4.30 CROSSTABULATION: DESCRIPTIVE STATISTICS
ON COMPUTER LITERACY 139
TABLE 4.31CHI-SQUARE TEST: COMPUTER LITERACY VS TYPE OF LEARNER (ONLINE VS
CONVENTIONAL) 139
TABLE 4.32 CROSS-TABULATION: DESCRIPTIVE STATISTICS ON PREFERRED LANGUAGE .140
TABLE 4.33CHI-SQUARE TEST: PREFERRED LANGUAGE VS TYPE OF LEARNER (ONLINE VS
CONVENTIONAL) 141
xiv

LIST OF FIGURES
FIG 1.1: RELATIONSHIP BETWEEN CHAPTERS 24
FIG 2.1 : CHAPTER 2 IN CONTEXT 28
FIG 2.2 : RELATIONSHIP BETWEEN THE THREE DOMAINS 42
FIG 3.1 : CHAPTER 3 IN CONTEXT 66
FIG 3.2 : THE REACH OBJECTIVES AND HYPOTHESES 67
FIG 3.3: RESEARCH PARADIGMS IN CONTEXT 766
FIG 3.4: STATISTICAL PROCESS FLOW CHART 98
FIG 4.1: CHAPTER 4 IN CONTEXT ... 1002
FIG 5.1: CHAPTER 5 IN CONTEXT 1003
XV

Chapter 1
Introduction
"Speak English!" said the Eaglet. "I don't know the meaning of half
these long words, and what's more, I don't believe you either!"
1

CHAPTER 1:
PROBLEM STATEMENT, PURPOSE AND METHOD
1.1 Introduction
The aim of this chapter is to serve as the introduction to this research and to
place the total investigation in context by providing a framework for the problem
being studied. A brief description of the subject of the study as well as the
research problem and specific questions generated by the problem are being
offered. The purpose, objectives and hypotheses are given as well as an
overview of the methodology (including e.g. design, the sampling strategy
selected, data gathering instruments and techniques of analysis). The value of
the research as well as the delimitations and limitations of the study are
discussed. Definitions of key concepts central to the study are also included.
1.1.1 Background to the problem
Advances in information technology have created an array of possibilities for
today's learners in institutions of higher education. Kaye (1989, p. 3) predicted
that online education would ultimately emerge as a new educational paradigm,
taking its place alongside conventional (face-to-face) education as well as
distance education, and even changing the face of education in general.
According to Van der Westhuizen (1999) these prophetic words are increasingly
reverberating through the halls of higher education institutions on the bandwagon
of online education, seemingly unstoppable since the introduction of the World
Wide Web (WWW) in 1993.
2

This impetus for institutional leaders to reassess their traditional methods of
educational delivery is highlighted by the statement by Samuel Smith, former
President of the Washington State University that: "We are in the midst of
another cultural and educational revolution that will shake our institutions to their
very foundations if we are not prepared for what lies ahead. The key to success
will be using new technologies to expand access to quality education and
enhance instruction" (Smith, 1999, p. 4).
This should be seen against the background of a worldwide and local increase in
the need for education and continuous education. This resulted in an explosion of
higher education institutions and programmes available throughout the world.
(Fehnel, 2002). According to Fehnel (2002) many countries, including South
Africa, have opened up their educational market places as a way of responding
to these growing pressures for access to higher education.
In reviewing the literature, it is clear that, to address this need, the use of online
learning is transforming the education industry and business educational
establishments (McFadzean, 2001b).
Horton (2000) confirms this by arguing that online education is part of the biggest
change in the way our species learns since the invention of the chalkboard, or
perhaps even of the alphabet. It is therefore not surprising that universities are
experiencing a huge demand for courses taught online and do not wish to be
swept aside by competitors in the commercial sector. According to Smith,
Ferguson and Caris (2001), providing online learning programmes for the large
number of learners who are unable to attend lectures on a daily basis is
becoming imperative, as the demand for such courses and the competition for
learners are huge. Hence institutions of higher education are putting pressure on
their faculties to provide opportunities for online learning (Smith, et al., 2001).
3

Smith et al. (2001) come to the conclusion that now is the time for tertiary
institutions in South Africa to harness the power of online learning. Follows
(1999) goes so far as to state that the online learning environment is the ideal
learning environment.
Many studies highlight the need for research to be conducted in the various
areas of online education (Russell, 2002 1; Charp, 1999). Past studies have
tended to compare outcomes in distance education with traditional face-to-face
courses (Schlosser and Anderson, 1994). Moore and Kearsley (1996) reviewed
distance education research over the previous 50 years and found no significant
differences between learning in the two environments.
1 Russell compiled a website of the significant difference phenomenon, citing more than 300
studies comparing distance education with conventional education.
4
Schlosser and Anderson's review of distance education research (1997)
indicates that learners learn equally well from courses presented through various
media and concluded that there is no inherent significant difference in the
educational effectiveness of the various media (Schlosser and Anderson, 1997).
These studies concluded that other factors might be more important than or
interact with the media in affecting educational outcomes for students. These
conclusions beg the question: "What other factors are pertinent?"
Studies examining the students themselves have been limited, and only largely
tentative conclusions can be drawn (Handson, Maushak, Schlosser, Anderson,
Sorenson and Simonson, 1997). Although online education is becoming a
common component of higher education, Wang and Newlin, (2000) confirm that
relatively little is known about the characteristics of learners who choose to enrol
for courses in an online learning environment. Schlosser and Anderson (1997)
published a report entitled Distance education: Review of the Literature in which
they did not cite a single study on the characteristics of online learners.
The questions that seem to remain unanswered out of the literature are:
Who are the students who undertake and succeed in online learning? Are
these students different from students who undertake and succeed in
traditional, face-to-face classes?
The answer to these questions is critical for the future of higher education.
Universities are prey to continual reductions in funding and are being forced to
contend with attracting learners in an increasingly competitive environment
(Littlejohn and Sclater, 1999; Fehnel, 2002). Online learning offers much promise
5

for attracting students to higher educational institutions in a modern and novel
way. This promise often comes with a high price tag. Although, according to
Horton (2000), the increasing cost of bricks and mortar is minimized, the virtual
classroom also carries costs in regular maintenance and upgrading of computer
hardware and infrastructure, and the development of instructional materials can
be very expensive. Should universities invest in online delivery systems?
According to Greene and Meek (1998), the amount of time spent by higher
educational professionals on technology and related issues will continue to
increase steadily. There is also an increasing need to raise awareness among
educators and course designers about the critical issues that impact on online
learning (Morgan, 1996). Educators and course designers will be able to match
the needs and expectations of their online students when they have answers to
the first of the two questions posed above, namely "Who are the students who
undertake and succeed in online courses?" According to Smith (1997), this will
ensure, from a pedagogical perspective, that the design of a flexible learning
environment within this technology-rich medium is not hampered by a lack of
understanding of the needs of learners. It will also ensure that course design
does not become technology-driven but allows technology to serve as a resource
in support of students' needs (Trapp, Hammond and Bray, 1996).
Various studies have shown that matching the teaching strategy to the needs of
students can contribute to more effective learning. (Rainey and Kolb, 1995; Hsu,
1996; Hartman, 1995; Galbraith, 1994). According to Galbraith (1994) by
recognising these unique characteristics, educators can utilise the information to
plan learning opportunities and strategies in such a way as to reach a more
diverse student population. This is confirmed by Westbrook (1999) who states
that such an approach will allow institutions of higher education to increase the
overall satisfaction of the adult learner in the online environment.
6

This study is therefore an attempt to investigate whether there are any
differences in personality and cognitive profiles between online and conventional
students.
1.2 Problem Statement
It has been shown in the previous section that online education is used in both
international and South African institutions of higher education. Many studies
indicate the need for research to be conducted in the various areas of online
education (Russell, 2002, Charp, 1999). There is also an increasing need to raise
the awareness of educators and course designers about critical issues
influencing online learning (Morgan 1996). As demands for lifelong learning
increase, so the demands on higher education to become more accessible and
more learner-driven will increase (Higher education's Role in the digital Age,
1999).
According to Mouton (2001), most of the methodological research has been
conducted in the United States. One obvious limitation, therefore, is the
applicability of these results to other contexts and especially to developing
countries. Methodological research in the area of online education has been
done in most countries, including some developing countries although its
relevance for current research practice is not obvious. It seems from the
literature that very little empirical research has been done in developing countries
and specifically in South Africa
However the question is not whether online education is an acceptable
alternative for teaching but who undertakes and succeeds in online courses.
7

Personality and cognitive differences between online and conventional students
in other countries may not be applicable in the South African context. Hence a
critical need exists to do research in this field in the South African context, within
which the research question is formulated as follows:
Are there personality and cognitive differences between online and
conventional students?
Emanating from the above problem statement, this study has the following
purpose:
1.3 Purpose of study
The purpose of this study is to provide information for the current deficit in
knowledge about possible differences between online university students and
conventional university students. This study is subdivided into a primary objective
and secondary objectives.
In the next section the research objectives for the study will be formulated.
1.4 Objectives of Research
The objective of this research can be visualized in terms of literary and empirical
objectives. Both the literary objective and the empirical objective, in turn, consist
of a primary objective and secondary objectives.
8

1.4.1 Literature Review
The literature review is divided into a primary research objective and secondary
research objectives.
1.4.1.1 Primary Objective of the Literature Review
The primary objective of the literature review is to create a theoretical frame of
reference for the concept of online education.
1.4.1.2 Secondary Objectives of the Literature Review
The secondary objectives of the literature review are:
1.4.1.2.1 To discuss the role of online education in Higher Education
This discussion will provide a background for understanding online education and
specifically distance education and how it impacts on higher education. A brief
overview of the history of distance education from the correspondence phase to
the current use of computer-mediated communication will be outlined. Also
briefly reviewed will be the theories underlying distance education, focusing on
those impacting on online education.
9

1.4.1.2.2 To review the research on distance education and conventional
education
Currently, research on distance education is relatively narrow and many studies
highlight the need for research to be conducted in the various areas of online
education (Russell, 2002; Charp, 1999). Merisotis and Olsen (2000, p. 42)
confirm this view by concluding "while a plethora of literature on the distance
education phenomenon is available, original research on distance education is
limited".
1.4.2 Empirical Research Objectives
The empirical research is also visualized in terms of a primary research objective
and secondary research objectives.
1.4.2.1 Primary Objective of the Empirical Research
The primary objective is to determine whether there are:
Differences between online university students and conventional
university students as a function of personality factors;
Differences between online university students and conventional
university students as a function of cognitive factors; and
Differences between online university students and conventional
university students as a function of biographical factors.
10

1.4.2.2 Secondary Objectives
The following secondary objectives are formulated:
1.4.2.2.1 Personality Differences
To determine personality differences for the two groups in respect of (a)
personality factors; (b) personality types; (c) locus of control; and (d) interest.
1.4.2.2.2 Cognitive Differences
To determine cognitive differences for the two groups in respect of (a) aptitude;
(b) previous academic performance at school; (c) matriculation achievement; (d)
first-semester academic performance at university; and (e) academic
performance on the HRM course.
1.4.2.2.3 Biographical Differences
To determine biographical differences for the two groups in respect of (a) gender;
(b) age; (c) language; and (d) computer literacy.
1.5 Research Hypotheses
The parameters of this study were formulated by hypotheses related to the
primary and secondary objectives. The detailed hypotheses will be outlined in
chapter 3.
11

1.5.1 Personality Differences
Four hypotheses are postulated relating to personality differences in the two
groups in respect of (a) the 16 Personality Factors Questionnaire (16PF); (b)
Jung's Personality Types' (JPT); (c) the Locus of Control Inventory (LCI); and (d)
the 19 Field Interest Inventory (19 FII).
Hypothesis, H1 1 : there is a statistically significant difference between the vectors
of means of the two groups in respect of the 16PF.
Hypothesis, H 2,: there is a statistically significant difference between the vectors
of means of the two groups in respect of the JPT.
Hypothesis, H3 1 : there is a statistically significant difference between the vectors
of means of the two groups in respect of the LCI.
Hypothesis, H4 ,: there is no statistically significant difference between the
vectors of means of the two groups in respect of the 19FII.
1.5.2 Cognitive Differences
Five hypotheses were postulated relating to cognitive differences in the two
groups in respect of (a) the Senior Aptitude Tests (SAT); (b) the academic
performance at school; (c) general average matriculation achievement (GAMA);
(d) first-semester academic performance at university; and (e) the academic
performance on the HRM Course.
12

Hypothesis, H 5,: there is a statistically significant difference between the vectors
of means of the two groups in respect of the SAT.
Hypothesis, H6,: there is a statistically significant difference between the vectors
of means of the two groups in respect of the academic performance at school.
Hypothesis, H7,:there is a statistically significant difference between the vectors
of means of the two groups in respect of GAMA (M-score).
Hypothesis, H8,: there is no statistically significant difference between the
vectors of means of the two groups in respect of academic performance in the
first semester.
Hypothesis, Hg,: there is no statistically significant difference between the
vectors of means of the two groups in respect of academic performance on the
HRM course.
1.5.3 Biographical Differences
Four hypotheses are postulated relating to biographical differences in the two
groups in respect of (a) gender, (b) age, (c) language, and (d) computer literacy.
Hypothesis H10 : there is a statistically significant association between gender
and online vs conventional students.
13

Hypothesis H11: there is a statistically significant association between age and
online vs conventional students.
Hypothesis H12: there is a statistically significant association between computer
literacy and online vs conventional students.
Hypotheses H13: there is a statistically significant association between preferred
language and online vs conventional students.
The a priori assumption of this study is that differences can be expected between
online and conventional students with respect to personality and cognitive
differences.
The next paragraph will highlight the significance of this study.
1.6 Significance of the study
In addressing the problem "Who undertakes and succeeds in online
courses?" the anticipated significance of this study will be threefold, namely
theoretical, practical and methodological. The current deficit in empirical data is
unfortunate because online learning and its inherent multimedia environment are
increasingly prevalent in the higher education environment. (Bentley, Appelt,
Busbach and Hinrichs (1997); Locatis and Wiesberg (1997); Porter (1997))
14

1.6.1 Theoretical Significance
The research will more comprehensively shed light on differences between
online and conventional students with respect to personality and cognitive
differences, and will serve as a benchmark and building blocks for future
research on the kind of person who undertakes online courses.
1.6.2 Methodological Significance
The methodological significance will support the value of quantitative methods in
assessing differences between online and conventional students with respect to
personality and cognitive differences. It ill furthermore provide a benchmark for
future research designs on differences between online and conventional courses.
1.6.3 Practical Significance
This study will contribute to one of the burning 'people' issues in South Africa. It
will lend support to the important role differences between online and
conventional students with respect to personality and cognitive differences plays
will provide a framework for institutions of higher education to understand
manage and facilitate differences between online and conventional students.
Educators and course designers will be able to match the needs and
expectations of their online students. This will ensure that, from a pedagogical
perspective, the design of a flexible learning environment within this technology-
rich medium is not hampered by a lack of understanding of the needs of learners.
(Smith,1997). This information will allow institutions of higher education to
increase the overall satisfaction of the adult learner in the online environment
15

(Westbrook, 1999). Lastly, this study will ensure that course design does not
become technology driven, but allows technology to serve as a resource in
support of the needs of students (Trapp, Hammond and Bray, 1996).
The next paragraph will briefly outline the nature of this study.
1.7 Nature of the study
Following is a brief outline of the research design, research process and
statistical procedures employed in this study. A more detailed discussion will
follow in Chapter 3.
1.7.1.1 Research Design
The study is quantitative in nature and aims to test hypotheses. The study
population consisted of first-year students enrolled for a compulsory business
science course at a large SA university. A non-probability sampling technique,
more specifically convenience sampling, was the method of sampling used in the
study. Based on self-selection, 242 students voluntarily made use of online
course while 323 students remained in the conventional class.
1.7.1.2 Research Process
With a view to reaching the objectives of the research, the process consisted of
the following steps:
16

Step 1: The prescribed battery of psychometric tests was
administered to the full intake of first-year university students by the
Career Counselling Division during their first month at the university.
Testing was compulsory for all first-year students and took place over
four days under strict supervision. The measuring instruments
selected for use in the current study will be discussed in detail in
Chapter 3. Performances of students in the first semester as well as
during the course being presented will be collected as primary data.
Step 2: A course was designed for conventional classes
supplemented with an online version of the same course and students
were allowed to freely choose to enrol in either online or conventional
sections of the course. Performances of the students in the first
semester as well as during the course being presented were collected.
Step 3: The data set was compiled consisting of all the data
collected in step one and two and were verified to ensure that it was
error free.
Step 4: The data were statistically analysed by the Statistical
Consultation Service (STATCON) with the SPSS programme. The aim
was to determine statistically the differences between the two groups
with respect to the stated hypotheses.
Step 5: The analysed information was interpreted and
recommendations were made for potential research opportunities.
17

1.7.1.3 Statistical Analyses
The primary and secondary data sets were subject to one-way multivariate
analyses of variance (MANOVAs using Hotellings's T 2), followed by Students' t-
tests. Estimated effect sizes were also calculated using coefficient eta. In order to
test Hypotheses relating to biographical differences, cross tabulations were
calculated and the chi-square test was used. Cramer's V was also calculated as
an index of the strength of the association between the biographical variables.
All calculations were done by means of the SPSS- Windows programme of
SPSS - International. The analysis was conducted with the assistance of a
Statistical Consultation Service.
The next paragraph will set the foreseen limits of the study.
1.8 Delimitations
The following delimitations of the study were imposed:
Only students from one large South African university, one faculty and registered
for a compulsory first-year course were used. The sample was chosen because
the researcher was familiar with the online environment and was assisted by the
lectures presenting this specific course. Since a limited sample was used, the
results should be generalised to the population with caution.
The research focused on an online course in a specific South African higher
education context. Other institutions that might have provided online education
were not included or represented. The lecturer contracted for the presentation of
the course had taught and designed various other online courses.
18
The next paragraph will set the limitations of the study.
1.9 Limitations
The limitations of the study lay in its design, subjects and the nature of the online
course being presented. Each of the limitations will be elaborated on in the
following paragraphs.
The limitations in the design of this research were imposed by the quasi-
experimental nature of the study. Even if a random selection of students'
completed assignments had been possible, it would not have been possible to
separate those students who preferred online courses from those who preferred
conventional courses.
The second limitation relates to the subjects used for this research. Although a
relatively large sample of subjects was used, the course was compulsory. The
two student populations were not distinctly separate from each other. The online
students were a subset of the populations of students in the conventional face-to-
face environment. The relatively large sample did not allow control in terms of
limited interaction between the two groups. An additional concern was the rate of
participation of online students in the research. These could have biased the
results achieved in different unknown ways.
The third limitation relates to the nature of the online course. This was the first
time students were exposed to online education. The effectiveness of the
computer and software technology on a student's decision to opt for the online
course was also not included in this study.
19

For clarity of interpretation, the next paragraph will define relevant key concepts.
1.10 Definition of key terms used
It is acknowledged that a number of definitions for each of the following concepts
exists in the literature. However, there is a lack of agreement on the fundamental
definitions and because most definitions are determined by the purpose of the
author, the following concepts will be operationally defined and extensive
terminological discourse avoided. 2 (http://www.learningcircuits.orq/glossary.htm)
2 These definitions are available on the ASTD website and are used to promote consistency in
the online environment see http://www.learninqcircuits.orq/glossarv.htm
20

"Asynchronous learning: Learning in which interaction between instructors and
students occurs intermittently with a time delay. Examples are self-paced
courses taken via the Internet or CD-ROM, Q&A mentoring, online discussion
groups, and email.
Blended learning: Learning events that combine aspects of online and face-to-
face instruction.
Cyberspace: The nebulous "place" where humans interact over computer
networks; term coined by William Gibson in Neuromancer.
CAI (computer-assisted instruction): The use of a computer as a medium of
instruction for tutorial, drill and practice, simulation or games. CAI is used for both
initial and remedial training, and typically does not require that a computer be
connected to a network or provide links to learning resources outside of the
course.
Digital Divide: The gap that exists between those who can afford technology
and those who cannot.
E-learning (electronic learning): A term covering a wide set of applications
and processes such as Web-based learning, computer-based learning, virtual
classrooms and digital collaboration. It includes the delivery of content via
Internet, intranet/Extranet (LAN/WAN), audio- and videotape, satellite broadcast,
interactive TV, CD-ROM, and more.
Email (electronic mail): Messages sent from one computer user to another.
21

F2F (face-to-face): Term used to describe the traditional classroom
environment.
ILT (instructor-led training): Usually refers to traditional classroom training in
which an instructor teaches a course to a room of learners. The term is used
synonymously with on-site training and classroom training (c-learning).
Internet: An international network first used to connect education and research
networks, begun by the US government. The Internet now provides
communication and application services to an international base of businesses,
consumers, educational institutions, governments and research organizations.
Internet-based training: Training delivered primarily by TCP/IP network
technologies such as email, newsgroups, proprietary applications and so forth.
Although the term is often used synonymously with Web-based training, Internet-
based training is not necessarily delivered over the World Wide Web, and may
not use the HTTP and HTML technologies that make Web-based training
possible.
Synchronous learning: A real-time, instructor-led online learning event in which
all participants are logged on at the same time and communicate directly with
each other. In this virtual classroom setting, the instructor maintains control of
the class, with the ability to "call on" participants. In most platforms, students and
teachers can use a whiteboard to see work in progress and share knowledge.
Traditional classroom: The physical learning space where students and
instructors interact.
22

24/7: Twenty-four hours a day, seven days a week. In e-learning, used to
describe the hours of operation of a virtual classroom or how often technical
support should be available for online students and instructors.
Virtual classroom: The online learning space where students and instructors
interact.
WBT (Web-based training): Delivery of educational content via a Web browser
over the public Internet, a private intranet, or an extranet. Web-based training
often provides links to other learning resources such as references, email,
bulletin boards and discussion groups. WBT may also include a facilitator who
can provide course guidelines, manage discussion boards, deliver lectures, and
so forth. When used with a facilitator, WBT offers some advantages over
instructor-led training while also retaining the advantages of computer-based
training.
WWW (World Wide Web): A graphical hypertext-based Internet tool that
provides access to Web pages created by individuals, businesses and other
organizations". (http://www.learningcircuits.org/glossary.htm)
The next paragraph will outline the chapters of the study.
1.11 Chapter Layout
This dissertation consists of five chapters. Fig 1.1 depicts the relationship
between the various chapters. The same figure will be used at the beginning of
each chapter to indicate the role of the chapter in the context of the thesis. This
23

Chapter 2 Literature Researc
Chapter 5 Discussion and Conclusion
Chapter 4 Reporting of Empirical Results
Chapter 3 Research Design
ti
.......... • ..
Chapter 1 Introduction to the Research
thesis will conclude with a list of references and appendices. Each of the five
chapters will now be discussed briefly.
The first chapter serves as the introduction to this research and places the total
investigation in context by providing a framework for the problem being studied.
A brief description of the subject of the study as well as the research problem
and specific questions generated by the problem are given. The purpose,
objectives and hypotheses are given, as well as an overview of the methodology
(including e.g. design, the sampling strategy selected, data-gathering instruments
and techniques of analysis). The value of the research as well as the
delimitations and limitations of the study are discussed. Definitions of key
concepts central to the study are also included.
4..
i7(
Fig 1.1: Relationship Between Chapters
24

The second chapter is the literature research. The literature research maps out
the main issues in the field being studied. As such, an overview of previous
research on the topic and a summary of the status quo are also included.
The third chapter outlines the research methodology and procedures. The
research methodology is described comprehensively. The context in which and
purpose for which the collection of data took place, as well as the steps
according to which the data were gathered are clearly spelled out. This will be
followed by a detailed discussion on the descriptions of the participants, the
research design, the sampling plan, data collection procedures and measuring
instruments.
The fourth chapter outlines the results and includes the processing, analysis
and interpretation of the data in figures and tables.
The fifth chapter is entitled 'Conclusions and recommendations'. The review
of literature and the findings from the empirical methods are compared with each
other. In this chapter, all the conclusions and recommendations as well as further
interpretation and a summary of the study are presented. The discussion also
focuses on the future directions that research might take.
1.12 Conclusion
In this chapter a brief description of the subject of the study as well as the
research problem and specific questions generated by the problem are
presented. The purpose, objectives and hypotheses are given as well as an
overview of the methodology (including e.g. design, the sampling strategy
selected, data gathering instruments and techniques of analysis). The value of
25

the research as well as the delimitations and limitations of the study are
discussed. Definitions of key concepts central to the study are also included. In
the next chapter, Chapter two, based on a review of the literature the current
knowledge relating to online learning is discussed.
26

Chapter 2
LITERATURE RESEARCH
" What do you know about this business?" the King said to Alice.
"Nothing," said Alice.
"Nothing whatever?" persisted the King.
"Nothing whatever," said Alice.
"That's very important", the King said.
"Why," said the Dodo, "the best way to explain it is to do it."
"Curiouser and curiouser," cried Alice.
27

Chapter 4 Reporting of Empirical Results
-4
Chapter 1 Introduction to the Study
/
Chapter 5 Discussion and Conclusion
Chapter 3 Research Design
CHAPTER 2:
LITERATURE RESEARCH
2.1 Introduction
The previous chapter presented a general background and orientation to the
study. The aim of this chapter is to review the literature relating to online
education. Figure 2.1 portrays the relationship of this chapter within the context
of this research. The literature review maps out the main issues in the field being
studied. As such, an overview of previous research on the topic and a summary
of the status quo are also included.
Chapter 2 Literature Research
✓ \
Fig 2.1 : CHAPTER 2 IN CONTEXT
28

Firstly an attempt will be made to create a theoretical frame of reference for the
concept of online education. It will necessitate the inclusion of the concept of
distance education because online education has, to a large extent, developed
from distance education.
An examination of the research on distance education and conventional
education follows. Finally, the need for assessing personality and cognitive
differences in online education is pointed out.
2.2 The role of online education in Higher Education
This section will provide a background for understanding online education, and
specifically distance education, and how it impacts on higher education. A brief
overview of the history of distance education from the correspondence phase to
the current use of computer-mediated communication is provided. Also
addressed in this section are the theories underlying distance education,
focusing on those impacting on online education.
2.2.1 Distance Education
2.2.1.1 History of distance education
According to Richards (1992) the history of distance education includes various
methods of instruction starting with correspondence, home study, televised
courses, extension classes, video conferencing and online learning. What, then,
is distance education?
29

Distance education can be defined as any planned educational activity that
"takes place when a teacher and student are separated by physical distance, and
technology is used to bridge the instructional gap". (Willis, 1994) By 'technology'
in this context is meant audio, video data and print.
Ehrmann (1999) states that the first transformation in higher education started
when learners and scholars began to rely more and more on reading and writing
and less on oral exchange. By writing information down, teachers could reach
more students and the learner could access more teachers. The oral tradition of
lecturing was gradually replaced by reading and writing. Steward (1995) argues
that the printed word became the most obvious and dominant medium used to
transmit information, whatever the context.
Cantelon (1995) contends that by correspondence in higher education, distance
education can be traced back to the Chautauqua movement of the early
nineteenth century. The Chautauqua literary and scientific circle has enrolled at
least half a million readers and sponsored ten thousand reading articles
throughout the United States. According to Cantelon (1995) the Chautauqua
movement introduced learning by correspondence even before the School of
Technology. The Chautauqua University was responsible for the development of
correspondence courses (Chantau, 2000).
Cantelon's (1995) studies indicate that these early courses focused on the social
sciences in business and public administration and the humanities.
30

According to Richards (1992) the roots of distance education can be traced back
to at least the 1700s when advertisements were used to offer instruction by mail.
Holmberg (1986) quotes an advertisement in a Swedish newspaper (1833) that
offered instruction on composition. According to Schlosser and Anderson (1994),
Germany established correspondence study in the 1800s, while a Boston-based
programme was also emerging.
Ehrmann (1999) contends that the transition to the printed word as a means of
transmitting information was the first educational revolution and was followed by
the second revolution when students and scholars gathered together to share
facilities and resources. This 'campus revolution' (Ehrmann, 1999, p. 42) brought
significant changes to the learning process. Students become more a "mass of
learners waiting for experts to tell them what was important" (Ehrmann, 1999, p.
43). The need for teaching at a distance increased, as students could not afford
to move to campuses and gain access to the education provided there.
Increasingly more sophisticated technology was used to breach the instructional
gap. According to Schlosser and Anderson (1994) the first experimental
television teaching programmes were produced in the American Midwest in the
1930s. This phenomenon rapidly spread to various universities and colleges.
The proliferation was further facilitated by the emergence of satellite technology
in the 1960s, reaching a high in the 1980s with further cost-effective
improvements.
Steward (1995) describes variations in the use of television-based education.
The most basic variation used VHS tapes that allowed a synchronous delivery of
the classroom experience to students in the remote classroom. More
31

sophisticated variations are a single camera on the teacher, (multiple cameras)
with synchronous conference calls between classroom(s) electronically linked.
The emergence of computer-mediated education offered alternative ways of
connecting teachers and students. A new distance education frontier emerged.
Ehrmann (1999) describes this frontier as the third significant transformation of
education. The nature of this revolution involves the technologically altered
transmission of the printed word.
2.2.1.2 Distance Education Theories
According to Garrison (2000) theoretical enquiry is central to the vitality and
development of a field of practice because the theoretical foundations of a field
describe and inform the practice and provide the primary means to guide future
developments. Therefore theory is not limited to describing what is, but should
also help predict what will be or what could be.
Moore and Kearsley (1996, p. 197) define a theory as "a representation of
everything that we know about something". Expanding on this definition,
Garrison (2000, p. 3) argues that theory is a coherent and systematic ordering of
ideas, concepts and models with the purpose of constructing meaning to explain,
interpret and shape practice. This purpose is a particular challenge to distance
education as the technology and delivery methods have evolved rapidly in the
last decade of the 20 th century. To understand the challenges facing distance
education, it is essential to do a selected review of the most influential distance
education theories that also impact on online education.
32
Schlosser and Anderson's (1994) review of distance education research
indicates that distance education theory was largely undeveloped until the 1970s.
Since that time several theories have begun to emerge.
A more detailed description of these perspectives will be provided in the next
section.
2.2.1.2.1 Independent Study
The first influential theoretical contribution to distance education is that of pioneer
Charles Wedemeyer. Based on the philosophy of teaching and learning it
focused on independent study and learning. According to Garrison (2000) this
was not merely a change in terminology but also a shift from the correspondence
practice dominated by organisational and administrative concerns. The focus
clearly was on educational issues concerned with learning at a distance
(Wedemeyer 1971). Although the focus was on the individual rather than the
group, Wedemeyer (1971, p. 549) identifies characteristics and advantages of
independent learning based on "a democratic social idea!' of not denying anyone
the opportunity to learn. Garrison (2000, p. 5) argues that "consistent with the
principles of equity and access, independent study was also related to self-
directed learning and self regulation".
Wedemeyer (1971) made a distinction between teaching and learning tasks and
identified characteristics such as communication, pacing, convenience and self-
determination of goals and activities.
33
Wedemeyer's work is surprisingly relevant to the new era of distance education,
and is of particular importance to this study. He was an advocate of freedom of
choice for the learner, criticising reluctance to individualise and personalise
independent study courses. In this regard Wedemeyer questioned the "seeming
rigidity of the format and materials apparently deterring teachers and students
from more completely exercising their respective options". (Wedemeyer 1971, p.
551).
In fact it designated a new era in the development of distance education. It
helped to shape the structure of many distance education universities all over the
world. His "contribution to the establishment of the British Open University"
(Sherow and Wedemeyer 1990, p18) resulted in the BOU influencing "more than
30 open universities all over the world" (Peters 2002, p. 42).
2.2.1.2.2 Industrial Production Model
Otto Peters, another person linked to the historical development of the BOU,
postulated his theory of Industrial Production Model in 1967 in a study entitled
"Distance Teaching and Industrial Production: a comparative interpretation in
outline" (Peters, 1994). Garrison (2000) contends that his theory is the "most
coherent, rigorous and pervasive example of distance education theory to date".
In analysing the structure of distance education, Peters (1994) adopted the
processes of division of labour, mass production, formalisation and
standardisation, concentration and centralisation, economies of scale and
reduction of unit costs.
34

Peters (1994) describes the industrial approach as "rationalization ...(and)
objectification of the teaching process" (p. 111). Criticising this form of distance
education, the limitation is in "reducing the forms of shared learning, and keeps
learners away from personal interactions and critical discourse" (p. 16). This may
be the reason why Peters (1994) did not recommend this approach for all of
distance education: "it is a special way of conceiving distance education — and
nothing more" (p. 17).
2.2.1.2.3 Theory of Guided Didactic Conversation
Holmberg's theory of distance education is a type of communication theory and
helps to explain the effectiveness of teaching at a distance as it relates to the
sense of belonging and cooperation amongst learners (Holmberg, 1988). At the
core of this theory is the concept of "guided didactic conversation" (Holmberg,
1988, p. 115). This "conversation—like interaction" is based on both "real" and
"simulated' two-way communication (Holmberg, 1988, p. 116).
The seven background assumptions for this theory are centred on the philosophy
that distance teaching should "support student motivation, promote learning
pleasure and make the study relevant to the individual learner and his/her needs"
(Holmberg, 1988, p. 116).
Although conversation is the defining characteristic of this theory, Garrison
(2000) contends that it is still directed to the pre-produced course packages and
clearly originates from the industrial perspective. According to Keegan (1996, p.
98), the major part of the communication was envisaged to be "by postal
correspondence".
35

Holmberg made a substantial contribution to the field of distance education and
also contributed to making distance education materials recognisably different
from conventional textbooks (Van Der Westhuizen, 1999).
2.2.1.2.4 The Theory of Transactional Distance
Michael Moore "combines both Peters' perspective of distance education" and
"Wedemeyer's perspective of a more learner —centred interactive relationship" in
what has been known since 1986 as the "theory of transactional distance"
(Moore and Kearsley, 1996, p. 199). According to Moore and Kearsley (1996),
transactional distance is a pedagogical phenomenon caused by geographical
distance. To overcome it necessitates special arrangements being made based
on interaction and design.
'Interaction' refers to the dialogue (D) between the teacher and the learner and is
associated with the medium of communication. Dialogue may include either two-
way communication or Holmberg's internal didactic conversation. 'Design' refers
to all the elements of the course design (Structure S) that will address the needs
of the learners. Transactional distance therefore is a function of dialogue and
structure. The most distant programme has low dialogue and low structure (-D-
S), while the least distant programme has high dialogue and low structure (+D-
S). (Moore and Kearsley, 1996).
The greater the transactional distance the more responsibility the learner has to
assume. To accommodate this Moore adds another dimension — the concept of
'learner autonomy'. This personality characteristic seems to be associated with
different "capacities" and "abilities" of the learner. Moore seeks learner
36

autonomy in setting objectives, methods of study and evaluation (Moore and
Kearsley, 1996, p. 205).
Moore (Keegan, 1996) combined these results in a typology of educational
programmes of most independent study (with high distance and high autonomy)
to least independent study (with low distance and low autonomy). The challenge
is to match the programmes to the learners so that each learner exercises the
maximum autonomy and grows (Keegan, 1996).
From the above discussion it seems that there are several different viewpoints
regarding distance education. Keegan (1986) classified theories of distance
education into three main groups: theories of 1. independence and autonomy; 2.
industrialisation of teaching and 3. interaction and communication. According to
Keegan (1986), theories of independence and autonomy include theories of
independent study by Charles Wedemeyer and the theory of independent study
by Michael Moore. The theory of industrialisation of teaching was developed by
Otto Peters. Borge Holmberg's guided didactic conversation theory (1986) is of
particular relevance to online instruction and falls into the third category, that of
theories of interaction and communication.
Because of the interactive nature of the online classes included in this research,
it seems that the theories that are most relevant are those of Holmberg as well as
Keegan's theoretical framework.
Peters (2002, p. 13) concludes that there is "clearly a structural relationship
between distance education and online learning". The author warns that, "as we
enter the digital age of learning and teaching, this relationship should not be
forgotten and that the experiences gained in the past should be kept in mind'.
37

2.2.2 Distance Education vs Online Education
Online education is changing the landscape of learning like a tornado sweeping
through a wheat field (Galagan, 2000). It is no longer necessary to convince
anyone to make the transition from conventional to online education. John Cone,
Vice-President of Dell Learning at Dell Computer Corporation said, "Our
conversations today are not about 'Shall we do this?' They're about 'How shall
we do it?' (Galagan, 2000, p. 62). Farrington (1999, p. 47) confirms this
viewpoint with the observation: "Traditional institutions can be leaders or
spectators. The smart ones will choose the forme".
We know that we want to move online to make learning more scalable, flexible,
and focused on learners' needs. Now, the question is 'How do we reap the
benefits?" (Galagan, 2000).
It seems that learners no longer have a choice as to whether to get involved in
online education or not; they have to engage in it if they want to survive in the
ever-changing workplace of the information age which is increasing the demand
for self-directed adults (Hengstler, 2001) who can learn effectively in an online
education environment.
The following sub-sections will provide a detailed discussion on the role of the
Internet in education, followed by a comprehensive discussion on online
education. A comparison between online education and conventional classroom
education will also be made.
38

2.2.2.1 The role of the Internet in education
Technically the Internet can be defined as a wide area network that links one
computer to another. It can also be described as a collection of different
communication media including e-mail, newsgroups and the World Wide Web.
(Behrens, Olen and Machet 1999, pp. 181-182)
The development of the Internet evolved from technologies designed to fight
World War III. The basic protocols that allowed one computer to send an e-mail
to another originated in research intended to create a communication network
that could survive a nuclear attack. Universities doing defence research on this
network began finding more and more uses for it. The result was that the system
was opened to the public — the Internet.
Dysan (1997) contends that the Internet doesn't actually do much but is a
powerful tool for people. Horton (2000) goes further and states that now millions
can enjoy and profit from the internet's bounty and millions can contribute to it.
Training has obvious applications. Star (1998) predicts that institutions, long
involved in building "communities" on campus, will see themselves actively
building "virtual or electronic communities".
Today individuals can access thousands of databases, articles, books, research
and courses right from their own desks, whether at home, at work or while
travelling. This resource did not exist a mere ten years ago and one can well
imagine what the next ten years will bring.
39

2.2.2.2 Online Education
Several terms are used in the literature to refer to education that takes place via
the Internet. (Tennyson, 1980; Piskurich, 1993; Williams and Zahed, 1996; Hall,
1997; Davies, 1998; Driscoll, 1998; Follows, 1999; Santo, 1999; Berry, 2000;
Galagan, 2000; Garten, 2000; Horton, 2000; Lee and Owens, 2000; Kruse and
Keil, 2000; Wang and Newlin, 2000; Brown, 2001; Smith, Ferguson and Caris,
2001; Goldschmidt, 2001; Goldsmith, 2001; Van Tonder, 2001; Burrows, 2002;
McFadzean, 2001a; McFadzean, 2001b.)
Some writers call it Web-Based Training (WBT) (Hall, 1997; Driscoll, 1998;
Horton, 2000; Lee and Owens, 2000). Others call it computer-based training
(CBT) (Williams and Zahed, 1996; Brown, 2001). Tennyson (1980) calls it
"computer-based instruction (CBI)", Wang and Newlin (2000) refer to "web-based
classes", Berry (2000), Galagan (2000), Goldschmidt (2001), Van Tonder (2001)
and Burrows (2002) call it "e-learning", and Davies (1998), Follows (1999), Santo
(1999), Garten (2000) and McFadzean (2001a, 2001b) use the term "virtual
learning". "Online learning" (Goldsmith, 2001; Smith et al., 2001), "technology-
based training" (Kruse and Keil, 2000) and even "self-directed learning" (SDL)
(Piskurich, 1993) are other terms in use.
According to Horton (2000), computer-conveyed education today exists in
several forms and takes various names, the most common being computer-aided
instruction (CAI), computer-based education (CBE), computer-based instruction
and computer-based training (CBT). Generally it seems that the term CAI is
used in the educational institution context while CBT is used in the industrial
context.
40

The root of computer conveyed education can be traced back to World War II
when audiovisual education was used to train soldiers. The first widespread use
of computers occurred in the 1950s when Stanford University provided CAI to
elementary schools. The University of Illinois took this further and assisted in
developing the Plato system (Programmed Logic for Automated Teaching
Operations). Since then according to Horton (2000), a steady development and
refinement of technologies for delivering training has taken place. Although each
advance has made training easier and less expensive to develop and deliver, the
training has been limited to a single computer system.
Although there are some technical distinctions among these types of learning,
they all involve the use of computers as the dominant medium for delivering
instruction to learners. This study opts for "online education".
According to Van Der Westhuizen (1999), online education in South Africa is still
in its infancy and it appears that only a few universities have policies regarding
online education. According to Broere, Geyser and Kruger (2002), the current
policy drive in South Africa - to establish a single dedicated distance education
institution by merging UNISA and Technicon SA - seems to be against the
international trend towards online education. On the other hand, it appears that
South African universities are quickly catching up with world trends. At a recent
World Wide Web conference held at the University of Stellenbosch Business
School, more than 20 papers were presented dealing with e-learning.
Representatives of eight universities delivered 15 papers on e-learning.
41

One to Many One to One
Many to Many (One to One One to Many
Time/Place Independent
Time/Place Dependent
Mediated
Many to Many
Time/Place Independent
2.2.3 Online education compared to conventional classroom
education
Harisim (1989) argues that online education is a new domain although it overlaps
with distance education and face-to-face education. In figure 2.2 the relationship
between the attributes of the three domains are represented
Interactive
FIG 2.2 : RELATIONSHIP BETWEEN THE THREE DOMAINS
In Schlosser and Anderson's review of distance education, research indicates
that "students learn equally well from lessons delivered with any medium, face-
to-face or at a distance." Hundreds of media comparison studies have indicated,
unequivocally, that there is no inherent significant difference in the educational
effectiveness of media. Schlosser and Anderson go on to say that further
comparisons of the effectiveness of distance education methods were not
needed. The research indicates that students learning at a distance have the
42

potential to learn just as much and just as well as students taught traditionally
(Schlosser and Anderson, 1997).
Moore and Kearsley (1996) have reviewed distance education research that
goes back more than 50 years. The studies have compared grades, test scores,
retention and job performance of students who are taught at a distance with
those taught face-to-face. Moore and Kearsley reported that the usual finding in
these comparison studies is that there are no significant differences between
learning in the two different environments, regardless of the nature of the
content, the educational level of the students or the media involved. It is
reasonable to conclude that (1) there is insufficient evidence to support the idea
that classroom instruction is the optimum delivery method; (2) instruction at a
distance can be as effective in bringing about learning as classroom instruction;
(3) the absence of face-to-face contact is not in itself detrimental to the learning
process; and (4) what makes any course good or poor is a consequence of how
well it is designed, delivered, and conducted, not whether the students are face-
to-face or at a distance (Moore and Kearsley, 1996).
2.3 Research on distance education and conventional education
Currently, research on distance education is relatively narrow and many studies
highlight a need for research to be conducted in the various areas of online
education (Russell, 2002; Charp, 1999). Merisotis and Olsen (2000 p. 62),
confirm this view by concluding "While a plethora of literature on the distance
education phenomenon is available, original research on distance education is
limited'. As this chapter will indicate, there is a good deal of research dealing
with distance education. From the literature it seems that most of the research
43

being done has focused on the effectiveness of online education compared to
traditional face-to-face education and has addressed a variety of issues. Three
broad measures of the effectiveness of distance education are usually examined
in research. These include:
Course completion and dropout rate
Student outcomes, such as grades and test scores; and
Attitudes and perceptions about learning through distance education.
However, as stated in Chapter 1, the question is not whether online education is
an acceptable alternative for teaching but one of Who undertakes online courses.
Relatively little is known about the characteristics of learners who choose to enrol
for courses in an online learning environment. This section will also provide a
review of research literature with specific reference to personality characteristics.
2.3.1 Course completion and dropout rate
Many of the studies that focus on students were typically looking at course
completion and dropout rate in distance education courses. Kembler (1995,
p.258) defined dropout as "anyone who enrols in a programme and does not
eventually complete it".
In a number of studies there was evidence that a higher percentage of students
participating in a distance-learning course tended to drop out before the course
was completed, compared with students in a conventional classroom. Knowles
44

(1999) confirms this viewpoint by concluding that the dropout rate for online
students is inexplicably high.
This is supported by studies done by McIntosh, Calder, and Swift(1977), Ostman,
Wagner and Barrowclogh (1988), Wu (1995), Jewett (1997), Hammond (1997),
Phelps, Wells, Ashworth, Hahn (1991), Cheng, Lehman, & Armstrong (1991),
Ostman, Carnavale (1999), Maki, Maki Patterson, and Whittaker (2000), White
and Weight (2000), Stinson and Claus (2000) and Terry (2001).
Ostman, Wagner and Barrowclogh (1988), investigated the reasons why
students drop out or remain in online course. The study was based on a survey
done on 942 distance education students in New Zealand in 1980 -1981.
Ostman el al. (1988) concluded that personal factors, social interaction, job
satisfaction and lastly institutional issues determined the reasons for students
either dropping out of or remaining in online courses.
Phelps, Wells, Ashworth, Hahn. (1991) investigated the effectiveness and costs
of distance education using computer-mediated communication, The study
compared an engineering course taught in a conventional classroom with one
taught through computer-mediated learning. Ninety five percent of the resident
students finished the course, compared to 64 percent of the computer-mediated
learning students.
Cheng, Lehman and Armstrong (1991) compared the performance and attitudes
prevalent in traditional vs computer-mediated conferencing classes. The study
found that students participating in computer-mediated learning had significantly
higher incompletion rates (32 percent) than the on-campus students (4 percent).
45

Wu's (1995) research focused on constructing predictive scales and formulas for
dropouts in open universities and colleges. Carnavale (1999) also confirmed that
students in online education had a higher dropout rate than those in face-to-face
courses. The research recommends various techniques to reduce the dropout
rate in online courses.
Hammond's (1997) study focused on a comparison of the learning experience of
Tele-course students in community and day sections. Students who registered
for a Sociology 101 course on campus were told that the course would, instead,
be taught by means of a one-way televised broadcast. The group's performance
with respect to attrition and grades was then compared with another group of
students from the community who took the same course, also via one-way
televised broadcast, but in their homes, not in a classroom on campus. Both
sections experienced a high percentage of students who did not complete the
course. (44% of the on-campus students, and 33% of the "off-campus" students).
Although both groups rated the course as good or excellent, a higher proportion
of on-campus students reported that they would not recommend the Tele course
to a friend.
Jewett, (1997) utilized students on the human computer interaction certificate
programme at Rensselaer Polytechnic Institute as participants in a case study.
The case study was on the benefits and costs of a joint industry/university-
designed programme featuring integrated delivery systems. In the study, one-
third of the students in a video-conferencing class received the grade of "I"
(incomplete), compared with only 15 percent in an on-campus course.
46

Maki, Maki and Patterson and Whittaker (2000) did research on learning and
satisfaction in online versus lectured courses of an Introductory Psychology
course. The authors found that the dropout rate for the online sections (13.9%)
was significantly higher than the dropout rate of the lecture section (3.8%).
Terry (2001) did research on the enrolment and attrition rate of online MBA
students. 200 students were given the option to complete all courses on campus
or online. Of the fifteen graduate courses offered the online courses averaged
higher enrolments than the campus-based courses. The average for online
courses was 34 students compared to 25 students in the campus-based courses.
Terry (2001) found that the attrition rate of students in online courses was higher
compared to that of campus-based students. The highest attrition rate (43%)
was found amongst the advanced course, Quantitative Analysis in Business.
Terry (2001) concluded that the higher attrition rate could be explained by
students not adjusting to the self-paced approach, the rigor of the study
(specifically the mathematics-based courses) and the lack of student and faculty
experience with online education.
Only in one study found in the literature was there evidence that a lower
percentage of students participating in a distance learning course tended to drop
out before the course was completed compared with students in a conventional
classroom. In studying the effects of electronic classrooms on learning English
composition, Stinson and Claus (2000) found that dropouts were non-existent
after the first two class sessions in the electronic rooms. In the traditional
classroom setting, dropout rates averaged 10%. According to Stinson and Claus,
(2000) with rare exceptions, students in the electronic rooms always handed in
papers on time. In the other classrooms, 20% of papers were habitually turned in
late.
47

Although this research does not adequately explain why the dropout rates of
distance learners are higher, White and Weight (2000) contributed to
understanding it by developing "The online teaching guide: a handbook of
attitudes, strategies and techniques for the virtual classroom". The authors argue
that the following reasons might explain why students leave the online courses:
Isolation, accelerated pace, competing responsibilities and technical issues.
2.3.2 Student outcomes, such as grades and test scores;
A substantial portion of research on distance learning seems to focus on student
outcomes such as grades and test scores. Schlosser and Anderson (1994)
emphasise this viewpoint by concluding that most studies have tended to
compare outcomes in distance education with traditional face-to-face courses. A
myriad such studies conclude that, regardless of the technology used, there is
no significant difference in the learning outcomes of online students and face-to-
face students (Russell (1999), Navarro, & Shoemaker, (1999), Hammond (1997),
Cheng, Lehman, & Armstrong (1991), Martin, & Rainey (1993), Johnson (2002),
Shachar (2002), Brown, & Liedholm (2002), Thomas (2001), Efendioglo & Murray
(2000), Redding (2000), Stinson and Claus (2000), Navarro & Shoemaker
(1999), LaRose, Gregg, & Eastin (2001), Gagne & Shepherd (2001), Johnson,
Aragon, Shaik, & Palma-Rivas (2000) and Souder (1993). Moore and Kearsley
(1996) reviewed distance education research over the previous 50 years and
found no significant differences between learning in the two environments.
Several examples illustrate this point.
A study done by Souder (1993) on the effectiveness of traditional versus satellite
delivery in three Management of Technology master's degree programmes,
48

compared the results of a take-home essay exam for students who participated
in a live broadcast televised graduate course in management of technology with
the results for students in the on-campus classroom. The students participating in
distance learning performed better than students in the conventional classroom
and had less inter-student variation. Term papers for the groups were also
compared, and no significant difference was found. With respect to homework,
the distance-learning students performed at a higher level.
In the study done by Hammond (1997) that focused on the comparison of the
learning experience of tele-course students in community and day sections, the
two groups' performance with respect to grades was compared. The off-campus
students had much higher grades than the on-campus students. Although both
groups rated the course as good or excellent, a higher proportion of on-campus
students reported that they would not recommend the Tele-course to a friend.
Cheng, Lehman, & Armstrong (1991) compared the performance and attitudes in
traditional and computer conferencing classes: one group was taught by
computer-mediated learning, another group of teachers was taught on campus,
and yet another group was taught through correspondence. The outcomes
measured included scores on achievement tests, time-on-task, student attitudes,
and dropout rates. The study found that students participating in the
correspondence course had significantly higher scores on achievement tests
than the on-campus students while scores were lowest for the students
participating in computer-mediated learning. The computer-mediated learning
and correspondence students spent more time-on-task than the on-campus
students
49

At high school level, a study done by Martin and Rainey (1993) compared the
attitude and achievement scores of students participating in an anatomy and
physiology course taught in a regular classroom with one delivered through
interactive satellite. The group taught via satellite had higher mean scores on an
achievement test than students in the classroom. However no significant
differences were found between the attitudes of either group toward the courses.
Johnson (2002) assessed the outcomes of two student populations in an
introductory biology course. ANOVA results indicated no significant difference in
means for reasoning post-test scores between online (M = 9.66) and on-campus
(M = 8.56) classes. Johnson (2002) categorized the students as concrete (zero to
three correct answers), transitional (four to seven correct answers), or formal
resonators (more than seven correct answers) and, by means of the Chi square
analysis, found a statistically significant difference between online and on-
campus students.
In a meta-analytic study Shachar (2002) investigated the differences between
traditional and distance learning outcomes. Eighty-six experimental and quasi-
experimental studies met the established inclusion criteria for the meta-analysis
(including data from over 15,000 participating students), and provided effect
sizes. This meta analysis clearly demonstrated that: (1) In 2/3rds of cases,
students taking courses by distance education outperformed their student
counterparts in the traditionally instructed courses; (2) The overall effect size d+
was calculated as 0.37 standard deviation units (0.33 <95% Confidence Interval
<0.40); and (3) This effect on 0.37 indicated that the mean percentile standing of
the DE group is at the 65th percentile on the traditional group (mean defined as
the 50th percentile).
50

Brown and Liedholm (2002) investigated online versus on-campus students in a
Principles of Microeconomics course. The study found that the virtual course
represented an inferior technology compared to the on-campus live
presentations. The on-campus students did significantly better than the virtual
students on the most complex material. The students in the virtual classes
performed significantly worse on the examinations than the on-campus students.
In a Master's of Education study, Thomas (2001) investigated the effect of
computer-based instruction on performance in physics. Students were assigned
to either the experimental group (computer-based/traditional instruction Web
course) or to a control (traditional face-to-face instruction) group. An analysis of
covariance (ANCOVA) revealed a significantly higher performance for the
experimental group than for the control group.
In another study looking at the differences between on-campus MBA students
and MBA students receiving tutored video instruction (TVI) in China, Efendioglo
and Murray (2000) found that TVI students scored slightly lower grades than did
the average on-campus MBA student. However, comparing each of the TVI
student classes directly against the on-campus class that was taped, the TVI
students did not perform as well.
Redding (2000) did a comparative analysis of online learning with traditional
classroom learning. The online group typically achieved the higher GPA mean in
each topic, and the higher cumulative GPA average mean. The standard
deviation and variance for this group indicate a consistently high-quality learning
51
of content. The online group was the more successful at cognitive learning as
measured by the end-of-course examinations.
In studying the effects of electronic classrooms on learning English composition,
Stinson and Claus (2000) found that students enrolled in the electronic rooms
had an average one-half grade higher than the students in the traditional
settings. According to Stinson and Claus (2000), with rare exceptions, students
in the electronic rooms always handed in papers on time. In the other
classrooms, 20% of papers were habitually turned in late.
In a comparison study between "Cyber learners" and "Traditional learners" in
Economics, Navarro and Shoemaker (1999) found that cyber learners performed
significantly better than traditional learners. The final exam mean score for the
Cyber learners was 11.3, while the mean score for the Traditional Learners was
9.8. With a t-test statistic of 3.70, this result was statistically significant at the
99% level.
In experimental research done by LaRose, Gregg, & Eastin, (2001) on an
audiographic tele-course, forty-nine subjects were recruited from a live lecture
class and randomly assigned to either the experimental (Web course) group or to
a control group that took the class in a traditional lecture section. Analysis of
covariance (ANCOVA) showed that the experimental group had test scores equal
to those of the control group after controlling for student gender, class level,
grade point average and attendance.
Gagne and Shepherd (2001) did a comparison between a distance and
traditional graduate Accounting class and found that the performance of students
52

in the distance course was similar to the performance of students in the on-
campus course. The students' evaluations of the course were similar, although
students in the online course indicated that they were less satisfied with the
instructor availability than the in-class students. According to Gagne and
Shepherd (2001), they did not find a difference between the multiple choice exam
format and the complex problem-solving exam format.
Johnson, Aragon, Shaik and Palma-Rivas (2000) did a comparative analysis of
learner satisfaction and learning outcomes in graduate online and face-to-face
learning environments. The researchers did not find a difference between the two
course formats in several measures of learning outcomes. The overall mean
rating of the face-to-face class projects was 3.47 (SD= .60) and the mean rating
for the online class projects was 3.40 (SD= .61). The difference in the project
ratings for the two groups was not significant. The student satisfaction with their
learning experience was slightly more positive for students in a traditional course
format, although there was no significant difference in the quality of the learning
that took place. Using a blind review process to judge the quality of the major
course projects, the ratings of the three independent reviewers showed no
difference in the quality of the projects across the two course formats. In
addition, the distributions of course grades for both the online and face-to-face
classes were, to a large extent, equally distributed.
In another study comparing cyber learning and traditional classroom learning,
Navarro and Shoemaker (1999) did not find a significant difference between the
two groups. Results from t-tests indicated that there were no significant
differences on six of the eight academic variables. The two groups achieved at
approximately the same level as measured by test scores for student learning. In
general, no significant differences were found in academic outcomes when cyber
53

learners were compared with traditional learners. Ninety per cent of the Cyber
learners believed that they had learned as much or more as they would have
done in a traditional classroom.
2.3.3 Attitudes and perceptions about learning through distance
education
There is a body of descriptive analysis and case studies that focuses on student
and faculty attitudes and perceptions of distance learning. The purpose of many
of these types of research is to develop recommendations to improve distance
learning.
One such study, Goodwin, Miklich, and Overall (1993), examined the perceptions
and attitudes of students and faculty toward computer-mediated learning and
courses broadcast over a local television channel. A majority of faculty observed
that the distance learning students were "more serious, accomplished and
articulate" compared to on-campus students. The distance-learning students also
had stronger analytical skills and written communication skills, and were more
"self-directed" than their on-campus counterparts. The students reported that
they chose distance education because of the flexible schedule, and nearly half
of the students noted that the instructional method also influenced their decision.
Students preferred not to commute and "enjoyed the luxury of not having to
commit to a specific class meeting time." Forty percent of the students reported
missing the face-to-face interactions and twenty-five percent missed the group
dynamics. One of the major recommendations of this study was "to explore
alternative ways to meet students' interaction needs" on a continuous basis.
54

In another descriptive study involving two-way interactive video Larson (1994),
graduate nursing students were surveyed about their satisfaction regarding the
technology. The majority of the respondents were very positive concerning
distance education and requested more distance learning opportunities. There
was, however, considerable dissatisfaction with the accessibility of the library.
Graduate education students participated in another study done by Bland,
Morrison and Ross (1992) to determine their perceptions of two-way interactive
video courses. Using written surveys, interviews and class observations, the
authors reported very mixed reactions from the students, which resulted in
several specific recommendations. In addition to recommending that the audio
quality needed to be improved, it was suggested that future training programmes
include information on successful strategies for instruction and use more
graphics. A toll-free phone number was proposed to contact the instructor.
2.3.4 Who undertakes online courses?
However, as stated in Chapter 1, the question is not whether online education is
an acceptable alternative for teaching but rather Who undertakes online
courses? Relatively little is known about the characteristics of learners who
choose to enrol for courses in an online learning environment, since web-based
technology and courseware are fairly new (Wang and Newlin, 2000). Schlosser
and Anderson (1994) published a report entitled Distance education: Review of
the literature, in which they did not cite a single study on the characteristics of
online learners.
55
Hanson et al. (1997), in a review of the distance education literature, called for
research to focus on the factors that contribute to differences in achievement.
The need is of the students themselves, particularly the psychological and social
attributes of the learner (Hanson, 1997, p. 31) and not the mode of delivery.
The next part of the literature research will focus on the paucity of research
currently being done.
Though relatively few studies have examined the personality characteristics of
students in online courses, there is pertinent literature on which to base the
expectation of personality and cognitive differences in online students. The
literature dealing with personality and cognitive differences is based on four focus
areas of inquiry to examine the experiences of students receiving some form of
online education: (1) student interest; (2) attitudes and learning behaviour of
students; (3) cognitive ability; and (4) personality measures such as the MBTI,
16PF and other demographic information.
The first focus area is a popular area of personality research and identifies typical
profiles of individuals in various professions. The study of interests has probably
received its strongest inputs from vocational and educational counselling
(Anastasi, 1961). According to Todd and Raubenheimer (1991), it seems only
logical that interest plays a major role. The more interested one is the more
motivated and enthusiastic one becomes. If a student's subject does not match
his interest or his course of study, the chance that he will not achieve success in
it is much higher than it would be if it did match. Although interest is not a
guarantee for academic success, it is essential for motivation and general
adjustment in a course.
56

These typical profiles are usually compared to the general population. These
research results are used in career counselling to provide guidance for selecting
a career that best suits the personality of the subject in terms of interest. With
respect to the differences between traditional and distance learning regarding
interest, there seems to be a definite lack of literature in this regard.
The second focus area seems to be a popular one, i.e. looking at the attitude and
learning behaviour of students. Gouws, Plug, Louw and Meyer (1993) define an
attitude as a relatively stable tendency to react in a certain manner towards
certain people, object or abstract causes. According to Van der Berg (1987), an
attitude towards study, therefore, is the student's orientation towards studying. It
also reflects the student's inclination and propensity for study.
There are a few studies, such as Westbrook (1999), which have looked at
student attitudes about Web-based or online delivery of instruction and students'
perceived level of learning. Westbrook found that students believed they learned
the same amount in the Web-based class as they typically did in a traditional
class. Students perceived that the Web-based class was more time-consuming
than was a traditional class. The students experienced significant increases in
the anticipated to actual level of student—to-instructor and student-to-student
amount of online interaction. In other words, the students interacted with each
other and with other students far more than they anticipated they would. Overall,
students in the Web-based classes reported that they learned as much in a
traditional class but had spent more time working on the course content than they
had expected when starting the course. They also spent more time interacting
with other students and the instructor than they had expected when starting the
course.
57
The study by Goodwin, Miklich, and Overall (1993) already reported in 2.3.3 par
two should also be seen in this context
The third focus area also seems to be a popular area of research, specifically
with regard to the traditional face-to-face students. Cognitive ability for the
current study represents the construct that traditional intelligence tests aim to
measure. Yen (2002) defines cognitive ability as a developed, general mental
ability to learn, to perform abstract thinking and to adapt to the environment.
Historically the interest in cognitive ability was based on the need of higher
education institutions to select students with academic potential. According to
Keogh and Becker (1973) this need is also enhanced by the diagnostic need to
early identify students likely to fail or underachieve. Cognitive ability (Intelligence
measurement) is well documented as one of the best predictors of academic
achievement, though most of the research being done focuses on on-campus
students. This is confirmed by a study on prediction of academic achievement:
the roles of cognitive ability and learning behaviour done by Yen (2002) who
found that the proportion of variation in academic achievement accounted for by
cognitive ability was 54%. According to Yen (2002), this was consistent with
past research (done by Ting and Robinson (1998).
Only one study found, (Correlates of Learning in the Virtual Classroom, Hiltz
(1993)), explored the relationship between academic ability and outcomes in the
virtual classroom compared to the traditional classroom. Using the Scholastic
Aptitude Test (SAT), the researchers found moderate to strong relationships in
overall outcomes. Students with high SAT scores signed on significantly more
often, spent more time online and sent more private messages, earned higher
final course grades online and were more likely to rate virtual classroom as better
than the traditional classroom.
58

The fourth focus area, personality, is also a popular area of research in the
traditional, face-to-face, environment. According to Roos (1984) researchers
found that non-intellectual factors can contribute up to 50% of academic success
and that personality contributes as much as 25% of the success. According to
Todd and Raubenheimer (1991), personality and its prediction is a complex
phenomenon, though it refers to the characteristic structure, combination, and
organization of behaviour patterns, thoughts and emotions that make each
individual unique. Personality, as defined by Herr (2001, p. 4), can be described
as 'the integrated and dynamic organisation of an individual's psyche, social,
moral and physical characteristics in interaction with the environment'. In a
literature review on traditional students, Todd and Raubenheimer (1991)
concluded that personality characteristics such as introversion and extroversion
seem to contribute to much of the research done on personality and achievement
and success. The question could be asked, then, whether personality factors
differ between online and traditional students. There seems to be no basis for
predicting that online students differ in the same ways as traditional students.
However, the study by Biner, Bink, Huffman, and Dean (1995) and Macgregor
and Donaldson (2000) support the prediction that there would be differences.
Both these studies support the prediction that there will be a relationship between
personality characteristics and achievement.
Biner et al (1995) identify personality correlates of student achievement by using
the 16PF as assessment instrument as a means of comparing students in a tele-
course with those in traditional courses. There were 164 tele-course students
and 271 traditional campus students included in the study. An analysis of
variance (2X16) and post hoc comparison t-tests was conducted. These tests
revealed significant differences in that tele-course students scored significantly
59

higher than traditional students on abstract thinking (Factor B+), emotional
stability (Factor C+), trusting (Factor L-), and controlling (Factor Q3+). The five
second-order factors were also calculated and the analysis of variance (2X5) and
post hoc comparison t-tests were conducted, revealing that tele-course students
were more dependent and conforming than traditional students. The result may
have been influenced by the difference in the average age 36.16 for the tele-
course group and 22.37 for the traditional students. Additional statistical analysis
of age had no significant effect on the results. (Biner et al., 1995)
According to Biner et al (1995), successful tele-course students tend to be
"resourceful and prefer to make their own decisions (p.57). In addition, "they are
not overtly concerned about following social rules or conventions, and may
actually disregard them all together in some circumstances" (p.57). Tele-course
students are also "introverted, self indulgent... and tend to meet their
responsibilities in an efficient, expedient manner, i.e. without being overtly
compulsive about completing tasks" (p.57). A negative relationship was found
between the introvert/extrovert dimension and course performance. This
indicated that the more introverted a student was, the better he or she performed
in a distance-education setting. Higher levels of expedience were associated with
higher grades in the tele-course group. This was in contrast to higher levels of
conscientiousness associated with higher grades in the traditional course group.
These results seem to indicate that different types of students thrive in different
types of academic environments.
As part of a doctoral study, Macgregor and Donaldson (2000) utilised the Biner
study in the online education environment as a base for answering the question:
60
Does personality matter when comparing students who complete traditional and
online courses? Macgregor and Donaldson (2000) concluded that the two
groups were very different and that "personality does matter" (p. 114).
Successful online students seem to be "more worrisome, serious, shy and non-
experimenting than students in traditional classrooms." (p. 114). Online students
tend to be "more introverted, accommodating and self-controlling" (p. 114)
compared to students in the traditional classroom. Online students also tend to
be more "cooperative, trusting and tough-minded' than students in the traditional
setting. Macgregor and Donaldson (2000) concluded that the study provides
enough justification for future research on personality characteristics of online
students.
One final example from the original research is a study by Powell, Conway and
Ross (1990) that attempted to identify specific student attributes associated with
student success in computer-mediated learning. 'Student success' was defined
by whether or not newly-enrolled students passed their first course using
computer-mediated learning. The following student characteristics were identified
as being correlated with success:
Students who rated themselves highly on various measures of
persistence;
Related to taking on new projects;
Married students;
Students who rated the consequences of not passing as serious;
Students who rated their chances of succeeding in their studies
higher than non-completers;
61

Students who did not need support from others to complete difficult
tasks and did not find it important to discuss course work with other
students;
Students with high literacy levels;
Students who rated themselves as well organized in terms of time
management skills and who said they generally had the time to do
what they intended to do;
Students who rated their formal and informal learning as high in
terms of preparing themselves for university studies; and
Female students.
2.3.5 Summary of literature findings
From the literature it seems that most of the research being done has focused on
the effectiveness of online education compared to traditional face-to-face
education and has addressed a variety of issues. Distance education research is
concentrated primarily on three areas which include:
•
Course completion and dropout rate;
Student outcomes, such as grades and test scores; and
Attitudes and perceptions about learning through distance
education.
Most of these studies conclude that, regardless of the technology used, distance
learning courses compare favourably with classroom-based instruction. For
example, many experimental studies indicate that students participating in
distance learning courses perform as well as their counterparts in a traditional
62

classroom setting. These studies suggest that the distance learning students
have similar grades or test scores, or have the same attitudes toward the course.
The descriptive analysis and case studies focus on student and faculty attitudes
and perceptions of distance learning. These studies typically conclude that
students and faculty have a positive view of distance learning. These examples
of experimental research are consistent with many other studies that indicate
students participating in distance learning courses perform as well as their
counterparts in a traditional classroom setting. In other words, distance is not a
predictor of learning.
Yet, despite the fact that there is an impressive amount of writing that concludes
that distance learning is viable and effective, the literature research revealed that
studies that examine the effect of individual differences in online education have
been grossly neglected. A review of the studies conducted indicates that several
learner characteristics have some effect on the success of the learner in a
distance education environment. Based on these studies the assumption can be
made that individuals differ in terms of personality, which in turn will influence
their respective choice of learning environment.
Hence, clearly there is a need to assess personality and cognitive differences in
online education.
2.4 Conclusion
In this chapter the current knowledge about online education according to the
secondary objectives of the literature research stated in Chapter 1, was
63

discussed. Emphasis was placed on creating a theoretical frame of reference for
the concept of online education.
This discussion provided a background for understanding online education and
specifically distance education and how it influences higher education. A brief
overview of the history of distance education from the correspondence phase to
the current use of computer-mediated communication was outlined. Also briefly
reviewed were the theories underlying distance education focusing on those
impacting online education. From the review it is evident that there are several
different viewpoints regarding distance education.
This was followed by an examination of the research on distance education and
conventional education. Finally, the need for assessing personality and cognitive
differences in online education was highlighted.
64

Chapter 3
RESEARCH METHODOLOGY
AND PROCEDURES
"it sounded an excellent plan, no doubt, and very neatly and simply arranged.
The only difficulty was that she had not the smallest idea how to set about it ..."
65

-4
Chapter 2 Literature Research
A
Chapter 1 Introduction to the Research
Chapter 4 Reporting of Empirical Results
V
Chapter 5 Discussion and Conclusion
CHAPTER 3:
RESEARCH METHODOLOGY AND PROCEDURES
3.1 Introduction
This chapter outlines the research methodology and procedures. In the previous
chapter a review of the literature on online education was provided. From the
literature review it became clear that research into the effect of individual
differences on online education has been grossly neglected. Against this
background, the research reported in this thesis aims at testing the hypotheses
formulated in Chapter 1 in order to reach the overall goal of the study. Figure 3.1
portrays the relationship of this chapter to the context of this research.
N
17
Chapter 3 Research Design
FIG 3.1 : CHAPTER 3 IN CONTEXT

AP:
M School
(H6) (H7)
AP: 1st
Semester
(H8)
Gender Age Language Computer
Literacy
(H13)
The focus of the study is on possible differences between online university
students and conventional students. The research methodology is
comprehensively described. The rationale for the research design, the context in
which and purpose for which the data were collected, as well as the steps in
which the data were gathered are clearly spelled out.
Objective 1
Personality
Differences
Objective 2
Cognitive
Differences
AP: HRM
Course
(H9 )
Objective 3
Biographical
Differences
AP= Academic Performance M = general average matriculation achievement
FIG 3.2 : THE REACH OBJECTIVES AND HYPOTHESES
This will be followed by a detailed discussion of the descriptions of participants,
data collection procedures and measuring instruments.
-a

This research endeavours to reach the objectives of the study by testing the
hypotheses below as defined in Chapter 1 and depicted in Figure 3.2.
3.2 Research Hypotheses
A hypothesis is a statement used in research to help operationalise the research
question (Bailey, 1994; Mouton and Marais, 1994). It is presented as a
declarative statement of prediction. Bailey (1994, p.43) states that a hypothesis is
a proposition stated in a testable form which predicts a particular relationship
between two variables. It is an assumption made in order to draw out and test
empirical consequences. The two basic formats used are the null hypothesis and
the directional hypothesis. The null hypothesis is a statistical statement in which
it is postulated that no relationship or difference exists between the variables
being studied, while the directional hypothesis postulates that a relationship does
exists. Directional hypotheses will only be formulated if clear theoretical
evidence exists. Non-directional hypotheses will only be formulated where
theoretical evidence is contradictory or where theoretical evidence is not
available.
Based on the literature research, the following hypotheses were formulated for
purposes of this research.
3.2.1 Personality Differences
Four hypotheses are postulated relating to personality differences for the two
groups in respect of (a) the 16 Personality Factor Questionnaire; (16PF), (b)

Jung's Personality Types (c) the Locus of Control Inventory (LCI); and (d) the19
Field Interest Inventory (19 Fl I).
Hypothesis, H1,: There is a statistically significant difference between the
vectors of means of the two groups in respect of the 16PF.
Rationale:
The directional hypothesis postulated is based on the findings of Biner et al
(1995) and Macgregor and Donaldson (2000) that online and conventional
students differ with respect to the 16PF.
Hypothesis, H2: There is a statistically significant difference between the vectors
of means of the two groups in respect of the JPT.
Rationale:
The directional hypothesis postulated is based on the findings of Biner et al.
(1995) and Macgregor and Donaldson (2000) who found that online students
tend to be more introverted than conventional students. The research of Todd
and Raubenheimer (1991) on traditional students should also be considered in
this context.
Hypothesis, H 3 : There is a statistically significant difference between the vectors
of means of the two groups in respect of the LCI.
Rationale:
The directional hypothesis postulated is based on the findings of Wang and
Newlin (2000) who indicated that online students exhibited a greater external
locus of control than their counterparts in conventional courses; and the findings
of Dille and Mezack (1991a, 1991b) that learners with an internal locus of control

are more likely to persist in distance education than those with an external locus
of control.
Hypothesis, H4: There is no statistically significant difference between the
vectors of means of the two groups in respect of the 19FII.
Rationale:
The non-directional hypothesis is based on a definite lack of literature in this
regard.
3.2.2 Cognitive Differences
Five Hypotheses were postulated relating to cognitive differences for the two
groups in respect of (a) the Senior Aptitude Tests (SAT); (b) academic
performance at school; (c) General Average Matriculation Achievement; (d) first-
semester academic performance; and (e) academic performance on the HRM
course.
Hypothesis, H5 , there is a statistically significant difference between the vectors
of means of the two groups in respect of the SAT.
Rationale:
Cognitive ability (Intelligence measures) is well documented as one of the best
predictors of academic achievement, though most of the research being done
focuses on on-campus students. There seems to be no basis for predicting that
online students differ in the same way as traditional students. Only one study,
Hiltz (1993), used the Scholastic Aptitude Test (SAT) and found moderate to

strong relationships between academic ability and outcomes in the virtual
classroom compared to the traditional classroom.
Hypothesis, Hs; There is a statistically significant difference between the vectors
of means of the two groups in respect of the academic performance at school.
Rationale:
The directional hypothesis is based on well-documented research that high
school achievement is one of the best predictors of academic achievement,
though most of the research being done focuses on on-campus students. The
research of Todd and Raubenheimer (1991) on traditional students should also
be considered in this context.
Hypothesis, H7 : There is a statistically significant difference between the vectors
of mean of the two groups in respect of GAMA (M-score).
Rationale:
The directional hypothesis is based on well-documented research that high
school achievement is one of the best predictors of academic achievement,
though most of the research being done focuses on on-campus students. The
research of Todd and Raubenheimer (1991) on traditional students should also
be considered in this context

Hypothesis, H8: There is no statistically significant difference between the
vectors of means of the two groups in respect of Academic Performance in the
first semester.
Rationale:
The non-directional hypothesis is based on contradictory findings in the literature
in this regard. Russell (1999); Navarro, & Shoemaker, (1999); Hammond (1997);
Cheng, Lehman, & Armstrong, (1991); Martin, & Rainey (1993); Johnson (2002);
Shachar (2002); Thomas (2001); Redding (2000); Stinson and Claus (2000);
LaRose, Gregg, & Eastin (2001); Gagne & Shepherd (2001) and Souder (1993)
found that there is no statistically significant difference. Brown, & Liedholm
(2002); Efendioglo, & Murray (2000); Johnson, Aragon, Shaik, & Palma-Rivas
(2000) and Navarro and Shoemaker (1999) found a statistically significant
difference in academic performance.
Hypothesis, Hg: There is no statistically significant difference between the
vectors of means of the two groups in respect of academic performance on the
HRM course.
The non-directional hypothesis is based on contradictory findings in the literature
in this regard. Russell (1999); Navarro, & Shoemaker, (1999); Hammond (1997);
Cheng, Lehman, & Armstrong, (1991); Martin, & Rainey (1993); Johnson (2002);
Shachar (2002); Thomas (2001); Redding (2000); Stinson and Claus (2000);
LaRose, Gregg, & Eastin (2001); Gagne & Shepherd (2001) and Souder (1993)
found that there is no statistically significant difference. Brown, & Liedholm
(2002); Efendioglo, & Murray (2000); Johnson, Aragon, Shaik, & Palma-Rivas

(2000) and Navarro and Shoemaker (1999) found a statistically significant
difference in academic performance
3.2.3 Biographical Differences
Four Hypotheses relating to biographical differences in the two groups in respect
of (a) gender; (b) age; (c) language; and (d) computer literacy are postulated.
Hypothesis H 10 : There is a statistically significant association between gender
and online vs conventional students.
Rationale:
The directional hypothesis postulated is based on the findings of Powell,
Conway, and Ross (1990).
Hypothesis H 1 ,: There is a statistically significant association between age and
online vs conventional students.
Rationale:
The directional hypothesis postulated is based on the findings of Navarro, &
Shoemaker, (1999); Hammond (1997); Cheng, Lehman, & Armstrong, (1991);
Martin, & Rainey (1993); Johnson (2002); Shachar (2002); Thomas (2001);
Redding (2000); Stinson and Claus (2000); LaRose, Gregg, & Eastin (2001);
Gagne & Shepherd (2001); Souder (1993) and Powell, Conway, and Ross,

(1990) who did found significant associations between age and online vs
conventional students. Older students tend to choose online learning.
Hypothesis H12: There is a statistically significant association between computer
literacy and online vs conventional students.
Rationale:
The directional hypothesis postulated is based on the findings of Navarro, &
Shoemaker, (1999); Hammond (1997); Cheng, Lehman, & Armstrong, who found
that online students tend to be more computer literate
Hypotheses H1 3 : There is a statistically significant association between preferred
language and online vs conventional students.
Rationale:
The directional hypothesis postulated is based on the findings of Navarro, &
Shoemaker, (1999); Hammond (1997); Cheng, Lehman, & Armstrong.
The a priori assumption of this study is that differences can be expected between
online and conventional students with respect to personality and cognitive
profiles.
The remainder of this chapter provides the rationale for the research design. It
also documents the research instruments, the research process and the
statistical procedures applied to the data captured in this research.

In the next section the research design and supporting rationale will be
described.
3.3 Research Design
According to Creswell (2003), research approaches have multiplied to the point
that researchers have many choices in designing a framework for investigation.
Huysamen (1993) defines research design as "the plan or blueprint according to
which data are collected to investigate the research hypothesis or question in the
most economical manner". The research design defines what type of study will
be undertaken to provide acceptable answers to the research problem (Mouton,
2001). More simply stated, the research design is the plan, structure and
strategy of the researcher who seeks to obtain the answers to various questions
(Mouton and Marais, 1994).
Kerlinger (1986) postulates that a research design has two basic purposes, i.e. to
provide answers to research questions and to control variance. Research
designs are invented to enable the researcher to answer research questions as
validly, objectively, accurately and economically as possible. The reliability of
observations and inferences made during the empirical study is significantly
enhanced if the research design is meticulously planned and executed.

i OBJECTIVE ---...z....---
\ ,...... . .
DEDUCTIVE
CONTEXTUAL
I INDUCTIVE
Epistemology
DETACHED INTERACTIVE
Methodology
EMPIRICAL
INTERPRETATIVE
Fig 3.3: Research Paradigms In Context
In designing the research for this study the aim was to select a design that would
meet the goals of the research question. In this particular study the focus is on
possible differences between online university students and conventional
students. Thus the research questions dictate the research design.

The fundamental choices leading to the final research design are shown in
Figure 3.3. Following is a brief discussion on each of the characteristics in order
to put the study into perspective.
3.3.1 Quantitative Research vs Qualitative Research
There are two well-known and recognised approaches to research, namely the
quantitative paradigm and the qualitative paradigm (Schurink and Schurink,
2001).
According to de Vos (2001), there is a subtle difference in the way in which
qualitatively- and quantitatively-oriented researchers view the nature of research
designs. Quantitative researchers consult their list of possible designs and select
one while qualitative researchers develop their own designs as they go along,
using one or more of the available strategies or tools as a guide. According to
Schurink and Schurink (2001) the quantitative paradigm is based on positivism,
which takes scientific explanation to be nomothetic (i.e. based on universal laws).
Its main aims are to objectively measure the social world and to test hypotheses.
In contrast, the qualitative paradigm stems from an anti-positivistic, interpretative
approach, is holistic in nature and aims at understanding social life and the
meaning that people attach to everyday life.
Schurink and Schurink (2001) point out that qualitative and quantitative
researchers have different approaches to questions concerning ontology,
epistemology and methodology. In terms of ontology, the quantitative researcher
believes in an objective reality which can be explained, controlled and predicted
by means of natural (cause-effect) laws. Human behaviour can be explained in

causal deterministic ways, and people can be manipulated and controlled.
Qualitative researchers discard the notion of an external, objective reality. They
aim to understand reality by discovering the meanings that people in a specific
setting attach to it. To these researchers behaviour is intentional and creative
and can be explained but not predicted.
Quantitative researchers use deductive reasoning. In contrast, qualitative
researchers use inductive reasoning (Neuman, 1994). Quantitative research
takes universal propositions and generalisations as points of departure, whereas
qualitative research aims to understand phenomena within a particular context.
In terms of epistemology, the quantitative researcher sees him/herself as
detached from, not as part of, the object that s/he studies. The researcher can
therefore be objective, i.e. neither influence nor be influenced by study object.
By contrast, the qualitative researcher is subjective because of personal
interaction with the subject (the object of investigation).
In terms of methodology, the quantitative paradigm emulates the physical
sciences in that questions or hypotheses are stated and subjected to empirical
testing for verification. According to De Vos (2001), data analysis in the
quantitative paradigm involves the analyst breaking down the data into their
constituent parts in order to obtain answers to research questions, as well as to
test research hypotheses. De Vos goes on to state that the analysis of research
data does not in itself provide the answers to research questions. Therefore
interpretation of the data is necessary. Interpretation in this sense is defined as
the explanation or the quest for meaning. Kerlinger (1986), goes further by
stating that analysis means the categorisation, ordering, manipulating and

summarising of data to obtain answers to research questions. The purpose of
analysis therefore is to reduce data to an intelligible and interpretable form so
that the relations of research problems can be studied, tested and conclusions
drawn.
In contrast, qualitative methodology is dialectical and interpretative. During the
interaction between researcher and subject, the subject's world is discovered and
interpreted by means of qualitative methods.
Figure 3.3 summarises the crux of the distinction between qualitative and
quantitative research paradigms.
From the above it is clear that this study falls predominantly within the
quantitative paradigm, which best serves the purpose of this study.
3.3.2 Classifying the Research Design
The research design of the study can be classified as non-experimental and ex
post facto in nature. According to Kerlinger and Lee (2000, p. 558) "Non-
experimental research is systematic empirical inquiry in which the scientist does
not have direct control of the independent variable because the manifestations
have already occurred or because they are inherently not manipulable.
Inferences about relations among the variables are made, without direct
intervention, from concomitant variation of independent and dependent
variables."

In contrast Kerlinger (1986, p. 293) sees experimental research as the "ideal" of
science. In his words "an experimental design is one in which the investigator
manipulates at least one independent variable" and adds "In ex facto research
one cannot manipulate or assign subjects or treatments because the
independent variable or variables have already occurred, so to speak". He points
out that "the main reason for the pre-eminence of the controlled experiment is
that the researcher can have more confidence that the relations he discovers are
the relations he thinks they are, since he discovers them under the most carefully
controlled conditions of inquiry. The unique virtue of experimental inquiry, then,
is control".
Kerlinger (1986) contrasts ex post facto research with experimental research and
concludes that it would be unwarranted to infer that ex post facto research is
inferior to experimental research, especially in the social sciences context. It is
easy to say that ex post facto research is merely correlational. However, such a
statement would be an oversimplification. It is more important to get a balanced
understanding of the strengths and weaknesses of both kinds of research.
Kerlinger (1986) asserts that ex post facto research has three major
weaknesses:
The inability to manipulate independent variables;
The lack of power to randomise; and
The risk of improper interpretation.
In other words, compared to experimental research, ex post facto research lacks
control; this lack is the basis of the third weakness: the risk of improper
interpretation. The danger of improper and erroneous interpretations in ex post
facto research stems in part from the plausibility of many explanations of

complex events. However, when guided by proper hypotheses, the results of
such studies are more valid.
According to Kerlinger (1986), despite its weaknesses, much ex post facto
research must be done in the social sciences because many research problems
therein do not lend themselves to experimental inquiry. Many of the research
problems in social sciences lend themselves to controlled inquiry of the ex post
facto kind, which is also true for this study.
3.3.3 Secondary data versus primary data
3.3.3.1 Primary data
Primary data are obtained from a direct observation of the phenomenon under
investigation or are collected personally by the researcher (Struwig and Stead,
2001; Welman and Kruger, 2001, p. 142). To ensure that primary data are
collected, personal or telephonic interviews, self-administered questionnaires and
direct observation methods may be used (Struwig and Stead, 2001). The data
are collected by a researcher for a particular purpose (Welman and Kruger, 2001
p. 142).
3.3.3.2 Secondary data
Secondary data is information collected by individuals or organisations other than
the researcher (Struwig and Stead, 2001; Welman and Kruger, 2001). Data are

collected by someone else for another project and purpose (Struwig and Stead,
2001).
Ex post facto research, by its nature, relies on secondary data. Mouton (2001)
defines secondary data analysis as: "Using existing data (mostly quantitative),
secondary data analysis aims at re-analysing such data in order to test
hypothesis or to validate models " (p. 164).
Mouton (2001) points out that secondary data are amenable to statistical
analysis. The value of using secondary data is that it saves time and provides the
opportunity to re-analyse existing data and arrive at new conclusions. When
doing secondary data analysis, there is an opportunity to save on the cost of
doing research. However, the limitation is the inability to control errors inherent
in the data collected. Finally, the analysis is constrained by the original purpose
for collecting the data.
The nature of non-experimental design requires secondary data to be analysed.
The data collected in the current study had a common purpose which was to
measure the cognitive and personality profiles of students. In the context of the
present research, the data were considered to be secondary data.
3.3.4 Choice of Research Design
For the purpose of the present non-experimental research, ex post facto
research design is regarded as being appropriate to answer the research
problem. With the above in mind, research design was constructed to reflect the
following characteristics:

Quantitative research paradigm;
Ex post facto characteristics; and
Primary and secondary data will be used.
In the next section the Sample will be described.
3.4 Sample
The unit of analysis consisted of first-year students at a large University in South
Africa. As mentioned in Chapter 1, the sampling strategy was, in essence, non-
probability. The study population consisted of first-year students enrolled for a
compulsory Business Science course, tested in 2001. Based on self-selection,
242 students voluntarily made use of the online course while 323 students used
the conventional course offered.
3.4.1 Sample Statistics
The frequency distributions calculated for the sample are provided in the next
tables.
The age group is depicted in Table 3.1. The ages of the students varied from 18
to 21 years, with 91% 18 years and younger.

TABLE 3. 1
AGE GROUP DISTRIBUTIONS FOR THE OBTAINED SAMPLE
Frequency Percent Cumulative Percent
<18 101 19,8 19,8
18 362 71,1 91,0
19 36 7,1 98,0
20 6 1,2 99,2
20> 4 ,8 100,0
509
The gender is depicted in Table 3. 2. As far as gender is concerned, 54% were
female and 46% were male. Missing information accounted for 3,9%.
TABLE 3.2
GENDER DISTRIBUTIONS FOR THE OBTAINED SAMPLE
Frequency Percent Cumulative
Percent
Female 304 54,0 54,0
Male 259 46,0 100,0
The language preference is depicted in Table 3.3. The majority of students, 405
(71,9%) preferred English as the language of tuition.

TABLE 3.3
PREFERRED LANGUAGE FOR THE OBTAINED SAMPLE
Frequency
Percent Cumulative Percent
Alternate 158 28,1 28,1
English 405 71,9 100.0
The home language is depicted in Table 3.4. The majority of students were
English-speaking (314). One hundred and forty nine were Afrikaans-speaking,
and 24 spoke both English and Afrikaans. Only 43 had an African language as
lingua franca. Twelve spoke other languages, and 23 did not indicate their home
language.
TABLE 3.4
HOME LANGUAGE FOR THE OBTAINED SAMPLE
Frequency Percent Cumulative Percent
AFRIKAANS 149 26,5 26,5
AFRIKAANS/ENGLISH 24 4,3 30,7
Other African Language 2 ,4 31,1
Other Euro Language 1 ,2 31,3
CHINESE 1 ,2 31,4
German 3 ,5 32,0
ENGLISH 314 55,8 87,7
Any other language 2 ,4 88,1
FRENCH 1 ,2 88,3
GREEKS 3 ,5 88,8
ITALIANS 1 ,2 89,0

NAMA 1 ,2 89,2
NORTH SOTHO 7 1,2 90,4
PORTUGUESE 3 ,5 90,9
SOUTH SOTHO 8 1,4 92,4
SWATI / SWAZI 1 ,2 92,5
TSONGA 6 1,1 93,6
TSWANA/SETSWANA 12 2,1 95,7
VENDA 3 ,5 96,3
XHOSA 5 ,9 97,2
ZULU 16 2,8 100,0
3.4.2 Descriptive Statistics for the Two Groups (Online and
Conventional Students)
Cross tabulations were employed to compare the type of learners (online and
conventional) in terms of the four biographical variables: age group, gender,
preferred language and home language (see Tables 3.5 - 3.8).
The cross-tabulation of age against type of learner (online versus conventional)
is depicted in Table 3.5 and indicates that the respondents consisted of 99
learners who were younger than 18 years, 347 who were 18 years old and 46
who were older than 18 years.
The online group consisted of 39 (39.4%) of the 99 learners who were younger
than 18 years, 149 (42,9%) of the 347 learners who were 18 years old and 18
(50%) of the 36 learners who were 19 years old. The majority of students were
18 years and younger for both the online and conventional groups.

TABLE 3. 5
CROSS TABULATION : AGE GROUP FOR
ONLINE AND CONVENTIONAL STUDENTS
Age Online Conventional Total
<18 39 60 99
18 149 198 347
19 18 18 36
20 1 5 6
20> 1 3 4
Total 208 284 492
The cross-tabulation of gender against type of learner in Table 3.6 shows that
123 (42,1%) of women out of 292 formed part of the online group, as opposed to
110 (44%) men out of 250.
TABLE 3.6
GENDER CROSS-TABULATION FOR
ONLINE AND CONVENTIONAL STUDENTS
Gender Total
F M
Online 123 110 233
Conventional 169 140 309
Total 292 250 542
The cross-tabulation of preferred language against type of learner (online versus
conventional) is depicted in Table 3.7 and indicates that the respondents

consisted of 233 and 309 learners in the online and conventional groups
respectively.
In the online group 158 (67.8%) of the 233 learners indicated that English was
their preferred language, while 75 (32,2%) indicated that they would prefer
another language. In the conventional group 234 (75,7%) of the 309 learners
indicated that English was their preferred language, while 75 (24,3%) indicated
that they would prefer another language.
The majority of the students, 392 (72.3%), indicated that English was their
preferred language, while 150 (27,7%) indicated that they would prefer another
language.
TABLE 3.7
PREFERRED LANGUAGE CROSS-TABULATION FOR ONLINE AND
CONVENTIONAL STUDENTS
Preferred Language Total
Alternate English
Online 75 158 233
Conventional 75 234 309
Total 150 392 542
When comparing the demographic variables, it is clear that the obtained
frequencies correspond closely across the two groups. This implies that the two
groups were relatively homogeneous.

The following brief discussion of the measurement instruments puts the study
into perspective.
TABLE 3.8
HOME LANGUAGE CROSS-TABULATION FOR ONLINE AND
CONVENTIONAL STUDENTS
Frequency Percent Cumulative Percent
AFRIKAANS 149 26,5 26,5
AFRIKAANS/ENGLISH 24 4,3 30,7
Other African Language 2 ,4 31,1
Other Euro Language 1 ,2 31,3
CHINESE 1 ,2 31,4
German 3 ,5 32,0
ENGLISH 314 55,8 87,7
Any other language 2 ,4 88,1
FRENCH 1 ,2 88,3
GREEKS 3 ,5 88,8
ITALIANS 1 ,2 89,0
NAMA 1 ,2 89,2
NORTH SOTHO 7 1,2 90,4
PORTUGUESE 3 ,5 90,9
SOUTH SOTHO 8 1,4 92,4
SWATI / SWAZI 1 ,2 92,5
TSONGA 6 1,1 93,6
TSWANA/SETSWANA 12 2,1 95,7
VENDA 3 ,5 96,3
XHOSA 5 ,9 97,2
ZULU 16 2,8 100,0

3.5 The Measurement Instruments
Because the constructs of human behavioural science often involve human
attributes, actions and artifacts, it may appear to the lay person that these can be
appropriately measured by merely asking research participants about them
directly. However, for several reasons the reliability and validity of the
measurements obtained in this fashion would be questionable. Two of the most
important of these reasons include: (a) participants may have insufficient
knowledge about themselves or they may be unable to verbalize their innermost
feelings; (b) participants may deliberately provide incorrect answers with a view
to portraying themselves in a positive or negative light (Welman and Kruger,
2001).
Thus in order to collect both reliable and valid data, some form of measuring
instrument must be used. In the human sciences, 'measuring instrument' refers
to instruments such as questionnaires, observation schedules, interview
schedules and psychological tests (Mouton, 2001).
In terms of the measuring instruments referred to above, the researcher basically
has one of two options, either the use of existing instrumentation or the
development of new instruments designed specifically for the purpose of a
particular study. For the purpose of this study, the test scores of students tested
with a prescribed psychometric battery of tests for use by the Career Counselling
Division of the university are used. In order to identify the personality and
cognitive differences between online university students and conventional
students, the following tests were selected for use in the current study.

3.5.1 Personality Measures
3.5.1.1 16 Personality Factor Questionnaire (16PF)
The 16PF was originally developed by Raymond B. Cattell as a set of primary
and elementary factor scales whereby several other personality characteristics
and behavioural patterns could be predicted. The questionnaire contains 16
bipolar scales (called primary factors), five global factor scales and several
validity scales. Fifteen of the primary factors and five of the global factors
measure personality traits and the remaining factor measures cognitive ability or
reasoning ability. It is one of the most widely used tests of personality in the
world. The instrument not only allows the respondent's interests and abilities to
be examined, but also allows his or her personality to be taken into consideration
during occupational decision making (Conn and Rieke, 1994). Numerous validity
coefficients have been reported in respect of all 16 of the scales. Reliability
coefficients between 0,45 and 0,92 have been reported for the different scales by
means of the test-retest method (Conn and Rieke, 1994). The internal
consistency of the primary factors and validity scales range from 0,66 to 0,87.
3.5.1.2 Jung's Personality Types Questionnaire
Jung's Personality Types Questionnaire was constructed for the measurement of
personality in terms of Jung's personality theory. The questionnaire consists of
75 items and four scales: Introversion-Extroversion, Sensing-Intuition, Thinking-
Feeling and Judging-Perceiving. Numerous validity coefficients have been
reported in respect of Jung's Personality Types. Cronbach alpha coefficients
between 0,814 and 0,886 have been reported for the different scales (Du Toit,
1983).

3.5.1.3 Locus of Control Inventory
The Locus of Control Inventory (LCI), as designed by Schepers (1995), is based
on attribution theory and social learning theory. The LCI can be used for inter-
individual comparisons, as it is a normative instrument. A factor analysis of the
LCI Schepers (1995) identified the following sub-scales:
External control
The individual believes that outcomes are independent of his/her own
behaviour.
Internal control
The individual believes that outcomes are a consequence of his/her own
behaviour.
Autonomy
The individual practises an internal locus of control and prefers working
alone.
The questionnaire consists of 80 items, each in the form of a seven-point scale.
The Cronbach alpha coefficients for internal control, external control and
autonomy are 0,832; 0,841 and 0,866 respectively. Various South African studies
(De Kock & Roodt, 1995; Rieger & Blignaut, 1996; Le Roux et al., 1997; Bothma

& Schepers, 1997; Van Staden, Schepers & Rieger, 2000; Rothmann &
Agathagelou, 2000) have confirmed the validity coefficients.
3.5.1.4 19 Field Interest Inventory (19 FII)
The 19 Fll was constructed for the measurement of vocational interests of high
school pupils in Standards 8, 9 and 10 students and of adults in 19 broad fields
of interest. The 19FII also measures the extent to which a person is actively or
passively interested in the 19 fields and whether these interests are work- or
hobby-orientated. The results can be used for counselling and selection
purposes. Numerous validity coefficients have been reported in respect of all 19
fields. Reliability coefficients between 0,68 and 0,97 have been reported for the
different scales by means of the split half method (Fouche and Alberts, 1986).
3.5.2 Cognitive ability measures
3.5.2.1 Senior Aptitude Tests (SAT)
The SAT was constructed for the measurement of a number of aptitudes of
pupils in Standards 8, 9 and 10 (Grades 10, 11 and 12) and of adults. The
results can be used for counselling and selection purposes. It has also been
established that a fairly reliable IQ estimate can be obtained from the SAT scores
for pupils between 14 and 18 years of age. The reliability coefficients ranged
from 0,71 to 0,93 for standard 10 pupils. Numerous factor analyses of the SAT
together with other variables confirmed the construct validity of these tests. High
validity coefficients were obtained (Fouche and Verwey, 1991).

3.5.2.2 Academic Performance at School
Scholastic achievement has proved to be one of the best predictors of academic
performance. For the purpose of this study scholastic achievement refers to the
level that a matriculation learner attains in his/her subjects individually.
3.5.2.3 General Average Matriculation Achievement
TABLE 3.9
CALCULATION OF MATRICULATION SCORES
Academic symbol Numeric value per Numeric value per achieved in matric Higher Grade subject Standard Grade subject
A 5 4
4 3
C 3 2
2 1
1 0
F 0 0
(RADEMEYER and SCHEPERS, 1998)
The matriculation scores were calculated by assigning a numerical value to the
obtained matriculation symbols. The table 3.9 indicates the conversion of
matriculation symbols to numerical values.
3.5.2.4 Academic Performance in the first semester

First-semester academic performance at university was based on the average of
the first semester aggregate of each learner. The percentage of subjects passed
and the percentage of subjects failed for the two groups were also calculated.
3.5.2.5 Academic Performance on the HRM Course
Academic performance on the course was based on the semester marks, exam
and final marks of each learner.
3.5.3 Biographical Information
The biographical questionnaire included items requesting the respondents'
gender, age, computer literacy, and preferred language.
In the next section the statistical process will be described.
3.6 Research Process
With a view to reaching the objectives of the research, the process depicted in
the flow chart will be followed (See Figure 3.4).
The data collection procedure will be discussed in more depth in the next
sections.

STATISTICAL PROCESS FLOW CHART FOR COGNITIVE AND PERSONALITY DIFFERENCES
3.7 Procedure of Data Collection
DATA
COLLEC-
TION
DEVELOP
DATA SET
VERIFY DA TASET
STATIS-
TICAL
ANALYSIS
INTERPRET INFORMA-
TION
Data collected as survey information, collected as secondary data from the prescribed psychometric battery of tests administered for first year students and primary data collecting aditional biografical information based on the two groups
The dataset developed consisting of only the items from each measuring instrument
The dataset verified to ensure that it is correct.
The data in the dataset statistically analysed with the SPSS program with the aim to determine statistical differences between the two groups.
The analysed information interpreted and recommen-dations made for future research in online education.
Figure 3.4: Statistical Process Flow Chart
The prescribed psychometric battery of tests was administered to the full intake
of first-year university students at a South African University by the Career
Counselling Division during their first month at the university. Testing was

compulsory for all first-year students and took place over four days under strict
supervision. Due to incompleteness of some records, only 586 records could be
used in the sample. Absenteeism caused some of the records to be incomplete.
3.8 Statistical Analyses Applied in the Research
This section deals briefly with the statistical analyses employed in the study. In
order to test for differences between the means of the two groups (online and
conventional students) with regard to the personality and cognitive measures,
one-way multivariate analyses of variance (MANOVAs) followed by Students' t-
tests were conducted. A MANOVA determines whether mean differences
between groups on a combination of dependent variables are likely to have
occurred by chance (Tabachnick and Fidel!, 1996).
According to Cooper and Schindler (2001), MANOVA follows the model of
ANOVA where variance is partitioned into variance attributable to differences
among scores within groups and to differences of scores between groups.
Squared differences between scores and various means are then summed.
These sums of squares, when divided by the appropriate degrees of freedom,
provide estimates of the variance attributable to different sources. Cooper and
Schindler (2001) argue that Hotelling's T 2 test is analogous to a t-test or F test for
multivariate data. Sum of squares and cross-products (SSCP) matrices were
used. Significance levels of 0,05 were set for all the hypotheses tested.
Cohen (1988) argued that multivariate tests usually have lower power than
univariate tests. Therefore it was decided to proceed with Students' t-tests to
determine whether there are statistically significant differences between the
means of the two groups.

Estimated effect sizes were also calculated using coefficient eta. Effect sizes
indicate something different from significance levels (Rosenthal, Rosnow and
Rubin, 2000). Results that are statistically significant at conventional levels are
not necessarily 'practically significant' as judged by the magnitude of the effect
size.
3.9 Conclusion
In this chapter the research part of the study was discussed. This chapter
documented the research design, the instruments used, the research process
and the statistical procedures employed in the study. It was pointed out that the
research was designed in such a way that it could adequately answer the
research question in order to reach the objectives of the study. In the next
chapter the results of the statistical analyses will be discussed.

Chapter 4
RESEARCH RESULTS
" I'm glad they've begun asking riddles — I believe I can guess that," she added
aloud.
"Do you mean that you think you can find out the answer to it?" said the March
Hare.
"Exactly so," said Alice.
"Then you say what you mean," the March Hare went on.
"I do," Alice hastily replied; "at least — at least I mean what I say — that's the same
thing, you know."

Chapter 5 Discussion and Conclusion
Chapter 3 Research Design
N
Chapter 1 Introduction to the Research
A
4.
■ Chapter 4
Reporting of Empirical Results
CHAPTER 4:
RESEARCH RESULTS
4.1 Introduction
In Chapter two, various personality and cognitive characteristics influencing
online learning were described from both a theoretical and research point of
view. In order to investigate the personality and cognitive differences between
online and conventional students, Chapter Three focused on the design to
perform a successful empirical research experiment. Figure 4.1 portrays the
relationship of this chapter to the context of this research.
FIG 4.1: CHAPTER 5 IN CONTEXT
It led to the conclusion that this research design reflects:
a quantitative research paradigm,
with ex post facto characteristics, and
primary and secondary data will be used.
Several hypotheses were stated based on the psychometric battery completed
by all first year students as a point of departure. In order to understand the nature
of the findings, the sample and its characteristics were also discussed in Chapter
Three.
In this chapter the research results of the statistical analysis will be outlined in
terms of the design explained in Chapter Three. Each category of the findings
begins with a summarised description of what it focuses on. Tables describing
the findings follow, and the findings are then presented.
This chapter will be concluded by an interpretation of the results in terms of the
problem statement discussed in Chapter One, i.e. the personality and cognitive
differences between online and conventional students.
Following is a description of the statistical analysis.
4.2 Statistical Analysis
In order to test for differences between the means of the two groups (online and
conventional students) with regard to the personality and cognitive measures,

one-way multivariate analyses of variance (MANOVAs) followed by Students' t-
tests were conducted. Estimated effect sizes were also calculated using
coefficient eta. In order to test hypotheses relating to biographical differences,
cross-tabulations were calculated and the chi-square test was used. Cramer's V
was also calculated as an index of the strength of the association between the
biographical variables
Hotelling's T 2, descriptive statistics as well as the results of the t-tests, in respect
of (a) personality differences and (b) cognitive differences, are reported in Tables
4.1 to 4.25. Cross-tabulations and chi-square test in respect of biographical
differences are given in Tables 4.26 to 4.33.
In the following section one-way multivariate analyses of variance (MANOVAs)
followed by Students' t-tests with respect to personality differences are
discussed.
4.2.1 Differences in means between the two groups with regard to
objective 1: Personality Differences
In order to test Hypotheses H1 to H4 relating to personality differences, one-way
multivariate analyses of variance (MANOVAs) followed by Student's t-tests were
conducted on the two groups in respect of (a) the 16 Personality Factor
Questionnaire (16PF); (b) Jung's personality types; (c) the Locus of Control
Inventory (LCI); and (d) the 19 Field Interest Inventory (19 FII).
In the following section the results of the tests with respect to personality
differences are given in Tables 4.1 to 4.12.

4.2.1.1 Differences in means between the two groups with respect
to 16PF (Hi)
In order to test Hypothesis H1, which states that there is a statistically significant
difference between the vectors of means of the two groups in respect of the
16PF, one-way multivariate analyses of variance (MANOVAs using Hotelling's
T2) followed by Students' t-tests were conducted. The results of these analyses
are reported in Tables 4.1 — 4.3.
TABLE 4.1
MULTIVARIATE TESTS OF SIGNIFICANCE FOR THE 16PF
Value F Hypothesis Error df P Partial Eta
Df Squared
Hotelling's
Trace 0,045 1,306 16,000 464,000 0,189 0,043
Hotelling's V=0,045
F (16, 464) = 1,306; p = 0,189
The multivariate tests of significance presented in Table 4.1 show Hotelling's T 2
test F (16,464) = 1,306; p = 0,189. This test was compared to the F distribution
for interpretation. Since the observed significance levels were greater than p =
0,05 (p = 0,189) for the T 2 test, the null hypothesis was not rejected and the
alternative hypothesis HA was therefore not supported. This means that the
vectors of means of the two groups with respect to the 16PF did not differ
statistically significantly from one another.
Based on Cohen's argument (1988) that multivariate tests usually have lower
power than univariate tests, it was therefore decided to proceed with students' t-

tests to determine whether there are statistically significant differences between
the means of the two groups.
TABLE 4.2
DESCRIPTIVE STATISTICS FOR THE 16PF
N Mean Std. Deviation Std. Error Mean
Online Conventional Online Conventional Online Conventional Online Conventional
Sociability 209 277 5,20 5,11 2,063 1,799 ,143 ,108
Intelligence 208 275 4,54 4,17 1,801 1,716 ,125 ,103
Emotional stability 209 277 5,18 5,04 1,897 1,941 ,131 ,117
Dominance 208 275 5,44 5,67 2,035 1,936 ,141 ,117
Enthusiasm 207 275 6.22 6.17 2.105 2.112 .146 .127
Conscientiousness 207 275 5.70 5.30 1.694 1.687 .118 .102
Adventurous 209 276 5.83 5.77 2.040 1.931 .141 .116
Emotional
sensitivity
209 276 3.72 3.74 1.665 1.631 .115 .098
Aloof 209 277 4.55 4.83 1.776 1.636 .123 .098
Practical 209 275 4.39 4.24 1.852 1.869 .128 .113
Astute 209 277 5.40 5.26 1.746 1.835 .121 .110
Guilt feelings 209 275 4.80 4.81 1.873 2.026 .130 .122
Conservatism 209 275 5.41 5.57 1.848 1.773 .128 .107
Self-sufficient 209 277 4.60 4.64 1.990 2.000 .138 .120
Self-sentiment 209 274 5.52 5.63 1.952 1.722 .135 .104
Tense 209 275 5.22 5.34 1.819 1.878 .126 .113
The descriptive statistics for the 16PF are reported in Table 4.2. As can be seen
from Table 4.2, the two samples sizes differ, but the mean scores do not differ
statistically significantly for the online and conventional groups. Results indicate

that the lowest mean score difference (0.01), was obtained for Guilt feelings
(Online M=4,80 SD =1,873; conventional M=4,81 SD =2,026), while the highest
TABLE 4.3
T-TEST: INDEPENDENT COMPARISONS OF THE MEAN DIFFERENCE
SCORES ON THE 16PF
Levene's Test
for Equality of
Variances
t-test for Equality of Means
Dependent
variables
Equal
variances
F-
ratio p(F) t-value df p(t)
Mean
Differe
nce
Eta
Sociability Not 4,553 0,033 0,497
412,75 0,619 0,089 0,026
Assumed 0
Intelligence Assumed 2,254 0,134 2,281 481 0,023 0,368 0,125
Emotional stability Assumed 0,003 0,960 0,800 484 0,424 0,141 0,077
Dominance Assumed 0,531 0,467 -1,227 481 0,220 -0,223 0,039
Enthusiasm Assumed 0,357 0,551 0,221 480 0,825 0,043 0,124
Conscientiousness Assumed 0,015 0,901 2,563 480 0,011 0,399 0,052
Adventurous Assumed 0,043 0,837 0,329 483 0,743 0,060 0,07
Emotional sensitivity Assumed 0,153 0,696 -0,142 483 0,887 -0,021 0,089
Aloof Assumed 2,959 0,086 -1,801 484 0,072 -0,280 0,023
Practical Assumed 0,004 0,948 0,885 482 0,377 0,151 0,058
Astute Assumed 0,400 0,528 0,833 484 0,405 0,137 0,003
Guilt feelings Assumed 1,425 0,233 -0,066 482 0,947 -0,012 0,072
Conservatism Assumed 0,206 0,650 -0,984 482 0,326 -0,163 0,157
Self-sufficient Assumed 0,061 0,806 -0,178 484 0,859 -0,033 0,044
Self-sentiment Assumed 2,935 0,087 -0,684 481 0,494 -0,115 0,088
Tense Assumed 0,601 0,438 -0,716 482 0,474 -0,122 0,023

mean scores difference obtained for Conscientiousness was 0.3 (Online M=5,7
SD =1,694; conventional M=5,3 SD =1,687). A mean score difference of 0.37
(Online M=4.54 SD =1,801; conventional M=4,17 SD =1,716) was obtained for
intelligence.
The independent t-tests statistics for the 16PF are reported in Table 4.3 and
includes Levene's test of homogeneity of variance and eta.
As can be seen from Table 4.3, Levene's F-ratio is significant only for
"Sociability" F(ratio) = 4,553, p(F) = 0,033, indicating that the null hypothesis
cannot be rejected for the rest of the dependent variables, that is the variances
are homogeneous. The homogeneity assumption has therefore been met for all
the dependent variables except for Sociability.
The last five columns of Table 4.3 contain the t-test results and eta for the
dependent variables. The results indicate that except for Intelligence and
Conscientiousness, the group means of online and conventional students did not
differ statistically significantly.
The observed t-value for Intelligence was 2.281 (p= 0,023) and for
Conscientiousness 2.563 (p=,011). Therefore the null hypothesis of no
differences between the groups with respect to these two dependent variables is
rejected. This implies that the alternative hypothesis, H1, which states that there
is a statistically significant difference between the vectors of means of the two
groups in respect of the 16PF (Intelligence and Conscientiousness) is accepted.
This also implies that the alternative hypothesis, H1, for the other 16PF
dependent variables is not accepted.

The results were further explored by determining the effect sizes (see Table 4.3:
last column labeled "eta"). The estimated effect sizes were calculated using eta
and yielded very small effect sizes for Intelligence (eta = 0.125) and also for
Conscientiousness (eta = 0.052), because the values were smaller than 0.1
(Cohen 1988). A small effect is indicated if eta is 0.1, a medium effect equals
0.3, whereas a large effect is obtained if eta is 0.5 (Cohen 1988).
4.2.1.2 Differences in means between the two groups with respect
to Jung's Personality Types (JPT) (H2).
TABLE 4.4
MULTIVARIATE TESTS OF SIGNIFICANCE FOR THE JPT
Value
F Hypothesis Df Error df
Hotelling's
Trace 0,007 0,779 4,000 469,000 0,540
Hotelling's T2 =0,007
F (4, 469) = 0,779; p = 0,540
In order to test hypothesis H2, which states that there is a statistically significant
difference between the vectors of means of the two groups in respect of the JPT,
Hotelling's T2 followed by Student's t-tests were conducted. The results of these
analyses are reported in Tables 4.4 — 4.6.
The multivariate tests of significance presented in Table 4.4 show Hotelling's T 2
test F (4, 469) = 0,779; p = 0,540. This test was compared with the F distribution
for interpretation. Since the observed significance levels were greater than p =
0,05 (p = 0,540) for the T2 test, the null hypothesis was not rejected and the
alternative hypothesis HA was therefore not supported. This means that the
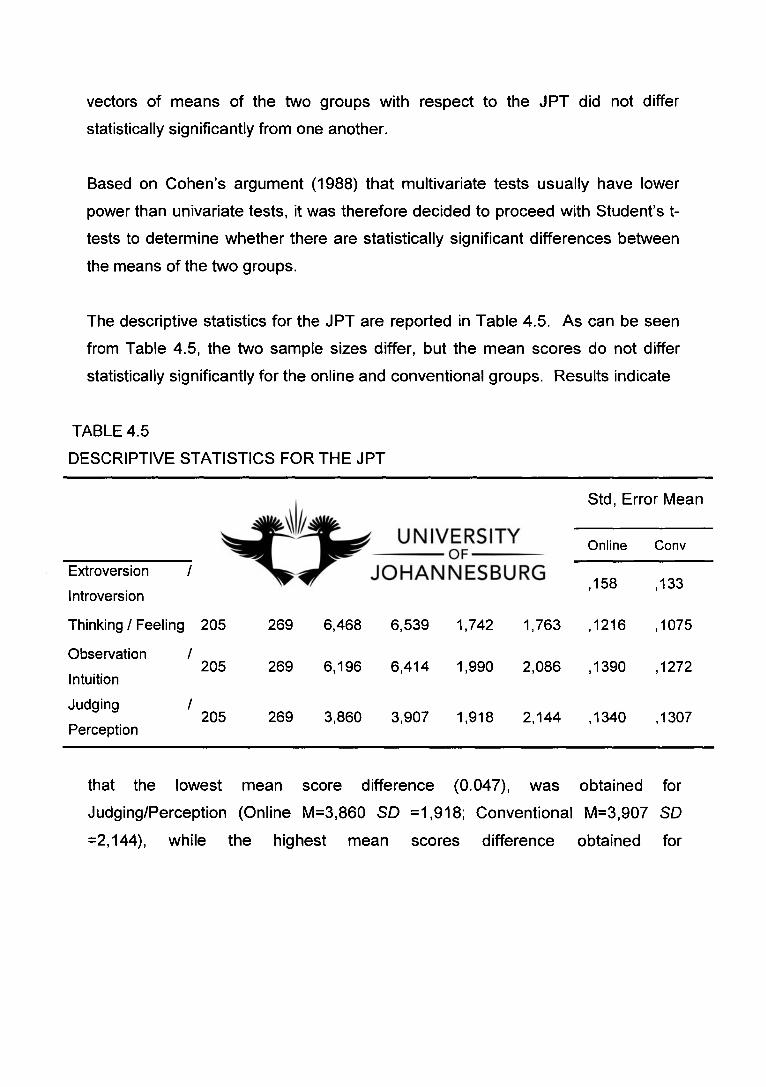
vectors of means of the two groups with respect to the JPT did not differ
statistically significantly from one another.
Based on Cohen's argument (1988) that multivariate tests usually have lower
power than univariate tests, it was therefore decided to proceed with Student's t-
tests to determine whether there are statistically significant differences between
the means of the two groups.
The descriptive statistics for the JPT are reported in Table 4.5. As can be seen
from Table 4.5, the two sample sizes differ, but the mean scores do not differ
statistically significantly for the online and conventional groups. Results indicate
TABLE 4.5
DESCRIPTIVE STATISTICS FOR THE JPT
N Mean Std, Deviation Std, Error Mean
Online Cony Online Cony Online Cony Online Cony
Extroversion / 205 269 5,19 5,03 2,264 2,184 ,158 ,133
Introversion
Thinking / Feeling 205 269 6,468 6,539 1,742 1,763 ,1216 ,1075
Observation / 205 269 6,196 6,414 1,990 2,086 ,1390 ,1272
Intuition
Judging / 205 269 3,860 3,907 1,918 2,144 ,1340 ,1307
Perception
that the lowest mean score difference (0.047), was obtained for
Judging/Perception (Online M=3,860 SD =1,918; Conventional M=3,907 SD
=2,144), while the highest mean scores difference obtained for

Observation/Intuition was 0.218 (Online M=6,196, SD =1,990; Conventional
M=6,414 SD =2,086).
A mean score difference of 0,071 (Online M=6,478 SD =1,742; Conventional
M=6,539 SD =1,763) was obtained for Thinking/Feeling and of 0,160 (Online
M=5,19 SD =2,264; Conventional M=5,03 SD =2,184) was obtained for
Extroversion/Introversion.
The independent t-tests statistics for the JPT are reported in Table 4.6 and
include Levene's test of homogeneity of variance and eta.
As can be seen from Table 4.6, Levene's F-ratio does not differ statistically
significantly for the dependent variables, indicating that the null hypothesis
cannot be rejected, that is, the variances are homogeneous. The homogeneity
assumption has therefore been met for all the dependent variables.
TABLE 4.6
T-TEST: INDEPENDENT COMPARISONS OF THE MEAN DIFFERENCE SCORES
ON THE JPT
Levene's Test for Equality
of Variances t-test for Equality of Means
Equal t- Mean Eta
variances F-ratio p(F) value df p(t) Difference
Extroversion / Introversion Assumed 0,568 0,451 0,796 472 0,426 0,164 0,01
Thinking / Feeling Assumed 0,077 0,781 -0,435 472 0,664 -0,071 0,141
Observation / Intuition Assumed 0,331 0,565 -1,154 472 0,249 -,2189 0,056
Judging / Perception Assumed 2,364 0,125 -0,250 472 0,803 -0,048 0,034

The last five columns of Table 4.6 contain the t-test results and eta for the
dependent variables. The results indicate that the group means of online and
conventional students did not differ statistically significantly. The lowest observed
t-value obtained for Observation/Intuition was -1,154 (p= 0,249). Therefore the
null hypothesis of no differences between the groups with respect to the
dependent variables is accepted. This implies that the alternative hypothesis, H2,
which states that there is a statistically significant difference between the vectors
of means of the two groups in respect of the JPT, is not accepted.
Effect sizes, using eta, were also calculated for the four JPT subcategories. Very
small effect sizes were obtained ranging from 0,01 to a small effect size of 0,141,
thereby confirming the MANOVA results.
4.2.1.3 Differences in means between the two groups with respect
to the Locus of Control Inventory (LCI) (H 3)
In order to test Hypothesis H3, which states that there is a statistically significant
difference between the vectors of means of the two groups in respect of the LCI,
Hotelling's T 2 followed by Student's t-tests were conducted. The results of these
analyses are reported in Tables 4.7 — 4.9.
TABLE 4.7
MULTIVARIATE TESTS OF SIGNIFICANCE FOR THE LCI
Value F Hypothesis Df Error df
P
Hotelling's 0,010 0,588 3,000 181 0,624
Trace
Hotelling's V= 0,010
F (3, 181) = 0,588; p = 0,624
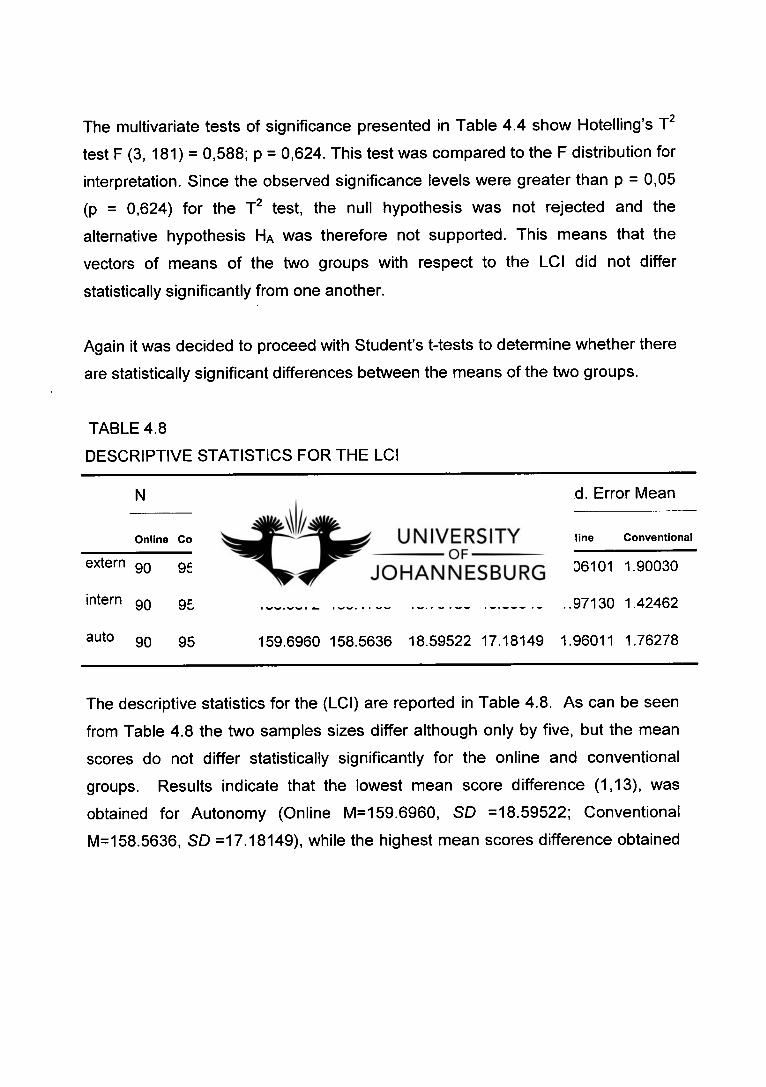
The multivariate tests of significance presented in Table 4.4 show Hotelling's T 2
test F (3, 181) = 0,588; p = 0,624. This test was compared to the F distribution for
interpretation. Since the observed significance levels were greater than p = 0,05
(p = 0,624) for the T 2 test, the null hypothesis was not rejected and the
alternative hypothesis HA was therefore not supported. This means that the
vectors of means of the two groups with respect to the LCI did not differ
statistically significantly from one another.
Again it was decided to proceed with Student's t-tests to determine whether there
are statistically significant differences between the means of the two groups.
TABLE 4.8
DESCRIPTIVE STATISTICS FOR THE LCI
N Mean Std. Deviation Std. Error Mean
Online Conventional Online Conventional Online Conventional Online Conventional
extern 90 95 90.1298 91.3357 19.55249 18.52179 2.06101 1.90030
intern 90 95 158.3372 160.1799 18.70138 13.88546 1.97130 1.42462
auto 90 95 159.6960 158.5636 18.59522 17.18149 1.96011 1.76278
The descriptive statistics for the (LCI) are reported in Table 4.8. As can be seen
from Table 4.8 the two samples sizes differ although only by five, but the mean
scores do not differ statistically significantly for the online and conventional
groups. Results indicate that the lowest mean score difference (1,13), was
obtained for Autonomy (Online M=159.6960, SD =18.59522; Conventional
M=158.5636, SD =17.18149), while the highest mean scores difference obtained

for Internal was 1,84 (Online M=158.3372, SD =18,70138; Conventional
M=160.1799 SD =13.88546).
The independent t-tests statistics for the (LCI) are reported in Table 4.9. and
include Levene's test of homogeneity of variance and eta.
TABLE 4.9
T-TEST: INDEPENDENT COMPARISONS OF THE MEAN DIFFERENCE
SCORES ON LCI
Levene's Test for
Equality of
variances t-test for Equality of Means
Mean
F-ratio p(F) t-value df p(t) Difference Eta
external .262 .609 -.431 183 .667 -1.20583 0.00
internal 2.351 .127 -.764 183 .446 -1.84267 0.03
autonomy .092 .762 .430 183 .667 1.13242 0.03
As can be seen from Table 4.9, Levene's F-ratio does not differ statistically
significantly for the dependent variables, indicating that the null hypothesis
cannot be rejected, that is, the variances are homogeneous. The homogeneity
assumption has therefore been met for all the dependent variables.
The last five columns of Table 4.9 contain the t-test results and eta for the
dependent variables. The results indicate that the group means of online and
conventional students did not differ statistically significantly. The lowest observed
t-value obtained for "internal control" was -0,764 (p= 0,446). Therefore the null
hypothesis of no differences between the groups with respect to the dependent

Hotelling's
Trace
Hotelling's T2 = 0,036
F (21, 469) = 0,794; p = 0,729
0,036 0,794 21,000 469,000 0,729 0,034
variables is not rejected. This implies that the alternative hypothesis, H3, which
states that there is a statistically significant difference between the vectors of
means of the two groups in respect of the LCI, is not accepted.
Effect sizes, using eta, were also calculated for the three LCI subcategories.
Very small effect sizes were obtained for (eta = 0,00), (eta = 0,03) and (eta =
0,03), thereby confirming the MANOVA results.
4.2.1.4 Differences in means between the two groups with respect
to 19 Field Interest Inventory (H4)
TABLE 4.10
MULTIVARIATE TESTS OF SIGNIFICANCE FOR THE 19FII
Hypothesis Partial Eta
Value F df Error df Sig, Squared
In order to test Hypothesis H4, which states that there is no statistically significant
difference between the vectors of means of the two groups in respect of the
19FII, Hotelling's T 2 followed by Student's t-tests were conducted. The results of
these analyses are reported in Tables 4.10 — 4.12.
The multivariate tests of significance presented in Table 4.10 show Hotelling's T 2
test F (21, 469) = 0,794; p = 0,729. This test was compared to the F distribution
for interpretation. Since the observed significance levels were greater than p =
0,05 (p = 0,729) for the T 2 test, the null hypothesis was rejected and the

alternative hypothesis HA was therefore supported. This means that the vectors
of means of the two groups with respect to the 19FII did not differ statistically
significantly from one another.
Again it was decided to proceed with Student's t-tests to determine whether there
are statistically significant differences between the means of the two groups.
The descriptive statistics for the 19FII are reported in Table 4.11. As can be
seen from Table 4.11, the two sample sizes differ, but the mean scores do not
differ statistically significantly for the online and conventional groups. Results
indicate that the lowest mean score difference (0.000) was obtained for Travel
(Online M=3,95 SD =2,062; Conventional M=3,95 SD =2,236), while the highest
mean scores difference obtained for Observation/Intuition was 0.58 (Online
M=4,15,SD =2,150; Conventional M=3,61 SD =1,997).
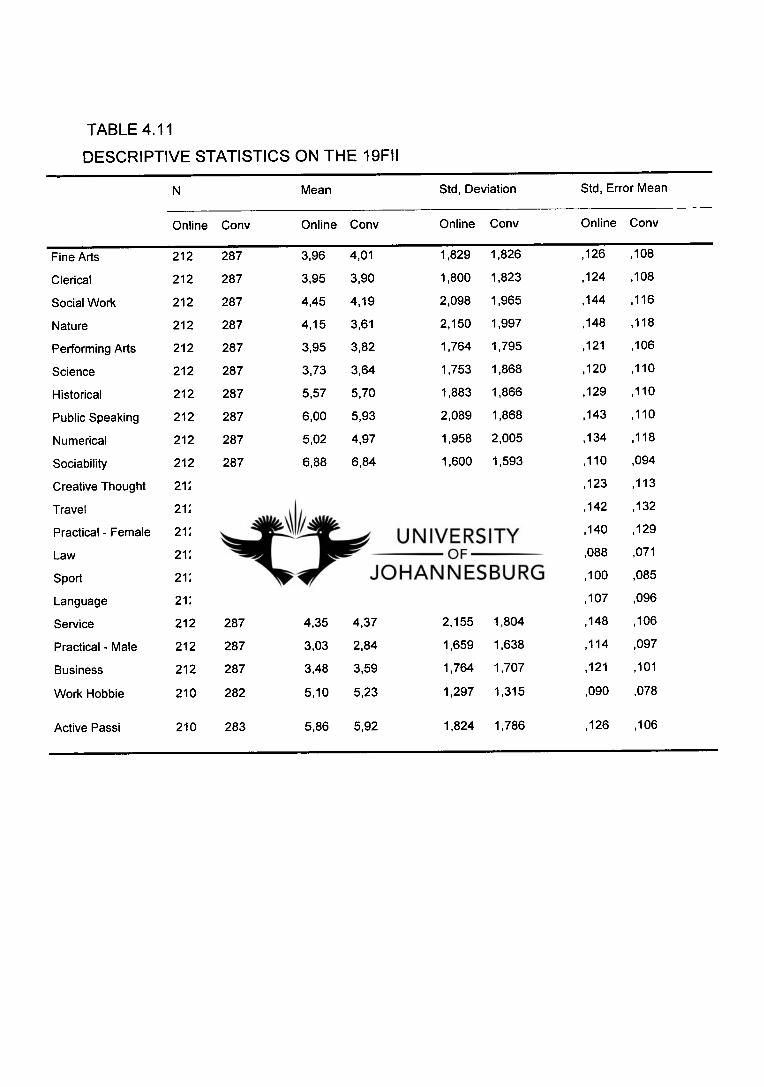
TABLE 4.11
DESCRIPTIVE STATISTICS ON THE 19FII
N Mean Std, Deviation Std, Error Mean
Online Cony Online Cony Online Cony Online Cony
Fine Arts 212 287 3,96 4,01 1,829 1,826 ,126 ,108
Clerical 212 287 3,95 3,90 1,800 1,823 ,124 ,108
Social Work 212 287 4,45 4,19 2,098 1,965 ,144 ,116
Nature 212 287 4,15 3,61 2,150 1,997 ,148 ,118
Performing Arts 212 287 3,95 3,82 1,764 1,795 ,121 ,106
Science 212 287 3,73 3,64 1,753 1,868 ,120 ,110
Historical 212 287 5,57 5,70 1,883 1,866 ,129 ,110
Public Speaking 212 287 6,00 5,93 2,089 1,868 ,143 ,110
Numerical 212 287 5,02 4,97 1,958 2,005 ,134 ,118
Sociability 212 287 6,88 6,84 1,600 1,593 ,110 ,094
Creative Thought 212 287 4,58 4,29 1,795 1,907 ,123 ,113
Travel 212 287 3,95 3,95 2,062 2,236 ,142 ,132
Practical - Female 212 287 3,53 3,56 2,041 2,192 ,140 ,129
Law 212 287 7,78 7,78 1,278 1,204 ,088 ,071
Sport 212 287 7,39 7,52 1,455 1,433 ,100 ,085
Language 212 287 5,94 5,86 1,555 1,627 ,107 ,096
Service 212 287 4,35 4,37 2,155 1,804 ,148 ,106
Practical - Male 212 287 3,03 2,84 1,659 1,638 ,114 ,097
Business 212 287 3,48 3,59 1,764 1,707 ,121 ,101
Work Hobbie 210 282 5,10 5,23 1,297 1,315 ,090 ,078
Active Passi 210 283 5,86 5,92 1,824 1,786 ,126 ,106

TABLE 4.12
T-TEST: INDEPENDENT COMPARISONS OF THE MEAN DIFFERENCE
SCORES ON THE 19FII
Levene's Test for Equality of t-test for Equality of Means
Variances
F-ratio p(F) t-value df p(t)
Mean
Difference Eta
Fine arts Assumed ,135 ,714 -,270 497 ,787 -,045 0,107
Clerical Assumed ,197 ,658 ,349 497 ,727 ,057 0,036
Social work Assumed 1,771 ,184 1,400 497 ,162 ,256 0,123
Nature Assumed 2,463 ,117 2,915 497 ,004 ,545 0,237
Performing arts Assumed ,205 ,651 ,823 497 ,411 ,133 0,054
Science Assumed 1,371 ,242 ,539 497 ,590 ,089 0,025
Historical Assumed ,100 ,751 -,785 497 ,433 -,133 0,032
Public speaking Assumed 3,585 ,059 ,399 497 ,690 ,071 0,114
Numerical Assumed ,956 ,329 ,325 497 ,745 ,058 0,077
Sociability Assumed ,495 ,482 ,269 497 ,788 ,039 0,133
Creative thought Assumed 1,493 ,222 1,748 497 ,081 ,294 0,144
Travel Assumed 1,161 ,282 -,010 497 ,992 -,002 0,05
Practical - female Assumed 1,907 ,168 -,151 497 ,880 -,029 0,004
Law Assumed ,627 ,429 -,051 497 ,960 -,006 0,028
Sport Assumed ,264 ,607 -,951 497 ,342 -,124 0,02
Language Assumed ,802 ,371 ,564 497 ,573 ,082 0,077
Service Not 12,551 ,000 -,092
405,70 ,927 -,017 0.027
assumed 1
Practical - male Assumed ,111 ,739 1,319 497 ,188 ,197 0,066
Business Assumed ,685 ,408 -,687 497 ,492 -,108 0,038
Work hobbies Assumed 1,575 ,210 -1,055 490 ,292 -,126 0,065
Active passive Assumed ,049 ,826 -,375 491 ,708 -,062 0,006

The independent t-tests statistics for the 19FII are reported in Table 4.12. and
include Levene's test of homogeneity of variance and eta.
As can be seen from Table 4.12, Levene's F-ratio is significant only for "service"
F(ratio) = 12,551, p(F) = 0,000, indicating that the null hypothesis cannot be
rejected for the rest of the dependent variables; that is, the variances are
homogeneous. The homogeneity assumption has therefore been met for all the
dependant variables except for "service".
The last five columns of Table 4.12 contain the t-test results and eta for the
dependent variables. The results indicate that, except for Nature, the group
means of online and conventional students did not differ statistically significantly.
The observed t-value for Nature was 2,915 (p= 0,004). Therefore the null
hypothesis that there is a difference between the groups with respect to Nature is
accepted. This implies that the alternative hypothesis, H4, which states that there
is no statistically significant difference between the vectors of means of the two
groups in respect of the 19FII (Nature) is rejected This also implies that the
alternative hypothesis, H4, for the other 19FII dependent variables is accepted.
Effect sizes, using eta, were also calculated for the 19FII subcategories. Very
small effect sizes were obtained ranging from eta = 0,006 to small effect size of
eta = 0,237.
It is clear from the above statistical analysis that statistically significant
differences between the two groups with respect to only a few personality factors
do exist although very small effect sizes were obtained.

In the following section, one-way multivariate analyses of variance (MANOVAs)
followed by Student's t-tests with respect to cognitive differences are discussed.
4.2.2 Differences in means between the two groups with respect
to objective 2: Cognitive factors
In order to test Hypotheses H5 to Hg relating to cognitive differences, one-way
multivariate analyses of variance (MANOVAs) followed by Student's t-tests were
conducted on the two groups in respect of (a) the Senior Aptitude Tests (SAT);
(b) the academic performance at school; (c) general average matriculation
achievement (GAMA (M-score)); (d) first-semester academic performance at
university; and (e) the academic performance on the HRM Course.
In the following section, the results of the statistical tests with respect to cognitive
differences are given in Tables 4.13 to 4.25.
4.2.2.1 Differences in means between the two groups with respect
to Senior Aptitude Tests (SAT) (H 5)
In order to test Hypothesis H5, which states that there is a statistically significant
difference between the vectors of means of the two groups in respect of the SAT,
one-way multivariate analyses of variance (MANOVAs using Hotelling's T 2)
followed by Student's t-tests were conducted. The results of these analyses are
reported in Tables 4.13 — 4.15.
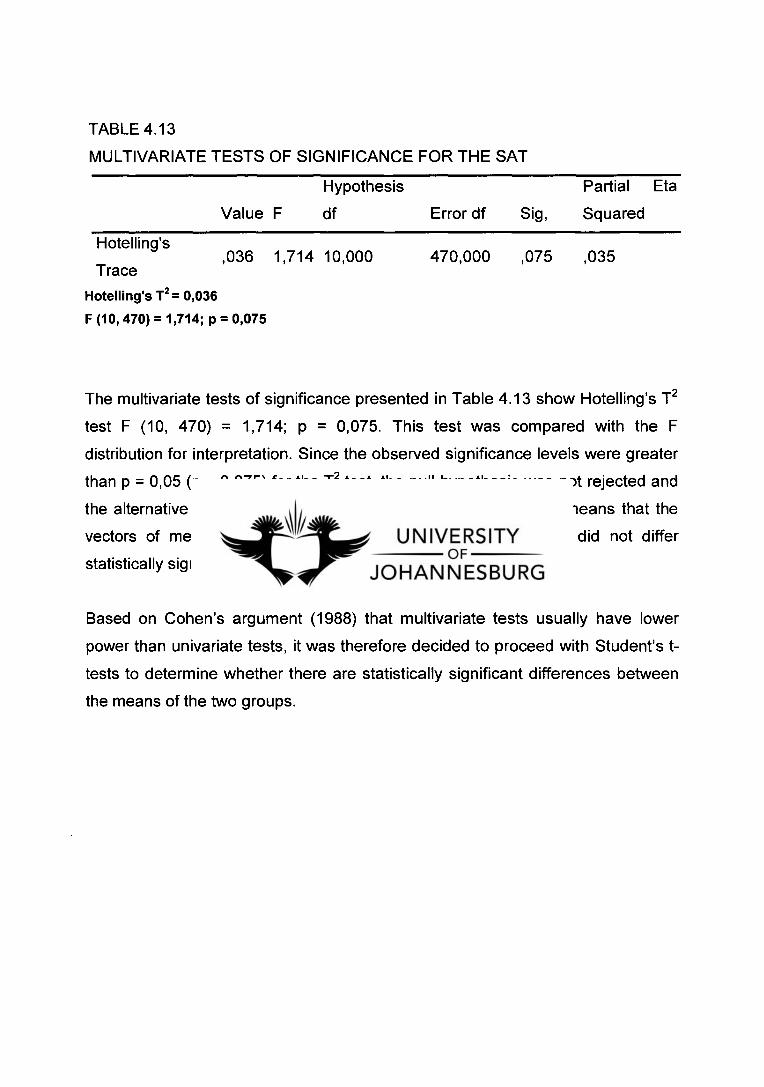
TABLE 4.13
MULTIVARIATE TESTS OF SIGNIFICANCE FOR THE SAT
Hypothesis Partial Eta
Value F df Error df Sig, Squared
Hotelling's ,036 1,714 10,000 470,000 ,075 ,035
Trace
Hotelling's T 2 = 0,036
F (10, 470) = 1,714; p = 0,075
The multivariate tests of significance presented in Table 4.13 show Hotelling's T 2
test F (10, 470) = 1,714; p = 0,075. This test was compared with the F
distribution for interpretation. Since the observed significance levels were greater
than p = 0,05 (p = 0,075) for the T 2 test, the null hypothesis was not rejected and
the alternative hypothesis HA was therefore not supported. This means that the
vectors of means of the two groups with respect to the SAT did not differ
statistically significantly from one another.
Based on Cohen's argument (1988) that multivariate tests usually have lower
power than univariate tests, it was therefore decided to proceed with Student's t-
tests to determine whether there are statistically significant differences between
the means of the two groups.

TABLE 4.14
DESCRIPTIVE STATISTICS ON THE SAT
N Mean Std, Deviation Std, Error Mean
Online Cony Online Cony Online Cony Online Cony
Word analogy 206 276 20,24 19,55 2,915 3,570 ,203 ,215
Number
series 206 276 21,01 20,80 3,149 3,489 ,219 ,210
Verbal
reasoning 206 276 20,80 19,91 2,957 3,522 ,206 ,212
Pattern
completion 205 276 19,84 19,22 3,214 3,719 ,224 ,224
Word pairs 205 276 21,38 20,36 2,861 3,722 ,200 ,224
Figure
analogy 205 276 19,72 19,29 3,143 3,570 ,220 ,215
Non VERBAL 206 276 112,93 111,49 13,349 14,289 ,930 ,860
IQ
Verbal IQ 206 276 108,79 105,18 11,812 12,313 ,823 ,741
Total IQ 206 276 111,77 108,98 12,328 13,057 ,859 ,786
Descriptive statistics for the SAT are reported in Table 4.14. As can be seen
from Table 4.14 the two samples sizes differ, but it seems that some of the mean
scores do not differ statistically significantly for the online and conventional
groups. Results indicate that the lowest mean score difference (0.21), was
obtained for Number Series (Online M=21,01 SD =3,149; conventional M=20,80
SD =3,489), while the highest mean scores difference obtained for Verbal IQ
was 3.61 (Online M=108,79 SD =11,812; conventional M=105,18 SD =12,313).
A mean score difference of 2.79 (Online M=111,77 SD =12,328 conventional
M=108,98 SD =13,057) was obtained for Total IQ. A mean score difference of
1.44 (Online M=112,93 SD =13,349 conventional M=111,49 SD =14,289) was
obtained for Non-verbal IQ.
The independent t-tests statistics for the SAT are reported in Table 4.15. and
include Levene's test of homogeneity of variance and eta.
As can be seen from Table 4.15, Levene's F-ratio is significant only for "Word
Pairs" F(ratio) = 6,334, p(F) = 0„012, and "Verbal Reasoning" F(ratio) = 4,571,
p(F) = 0,033 indicating that the null hypothesis cannot be rejected for the rest of
the dependent variables; that is, the variances are homogeneous. The
homogeneity assumption has therefore been met for all the dependent variables
except for "Word Pairs" and "Verbal Reasoning".

TABLE 4.15
T-TEST: INDEPENDENT COMPARISONS OF THE MEAN DIFFERENCE
SCORES ON THE SAT
Levene's Test for
Equality
Variances
of t-test for Equality of Means
F-ratio p(F)
t-
value df p(t)
Mean
Difference Eta
Word Analogy Assumed 1,857 ,174 2,285 480 ,023 ,696 0,073
Number Series Assumed ,734 ,392 ,682 480 ,496 ,210 0,088
Verbal
Reasoning
Not
assumed
4,571 ,033 3,028 473,345 ,003* ,895 0,072
Pattern Assumed 2,523 ,113 1,919 479 ,056 ,622 0,015
Completion
Word Pairs Not
assumed
6,334 ,012 3,416 478,416 ,001* 1,025 0,145
Figure Analogy assumed ,665 ,415 1,381 479 ,168 ,432 0,01
Non Verbal IQ assumed ,363 ,547 1,121 480 ,263 1,434 0,055
Verbal IQ assumed ,371 ,543 3,243 480 ,001* 3,614 0,126
Total IQ assumed ,214 ,644 2,377 480 ,018* 2,790 0,033
The last five columns of Table 4.15 contain the t-test results and eta for the
dependent variables. The results indicate that for Word Analogy, Verbal
Reasoning, Word Pairs, Verbal IQ and Total IQ, the group means of online and
conventional students differ statistically significantly.
The observed t-value for Word Analogy was 2,285 (p= 0,023) Verbal Reasoning
3,028 (p= 0,003), Word Pairs 3,416 (p= 0,001), Verbal IQ 3,243 (p= 0,001) and
for Total IQ 2,377 (p=,018). Therefore the null hypothesis of no differences
between the groups with respect to these dependent variables is rejected. This

implies that the alternative hypothesis, H5, which states that there is a statistically
significant difference between the vectors of means of the two groups in respect
of the SAT (Word Analogy, Verbal Reasoning, Word Pairs, Verbal IQ and Total
IQ), is accepted. This also implies that the alternative hypothesis, H5, for the
other SAT dependent variables is not accepted.
The results were further explored by determining the effect sizes (see Table 4.15:
last column labelled "eta"). The estimated effect sizes were calculated using eta
and yielded very small effect sizes for Figure Analogy (eta = 0,01) while for Word
Pairs (eta = 0,145) and Verbal IQ (eta = 0,126) a small effect size was obtained.
4.2.2.2 Differences in means between the two groups with respect
to academic performance at school (H 6)
In order to test Hypothesis H6, which states that there is a statistically significant
difference between the vectors of means of the two groups in respect of
academic performance at school (H6), one-way multivariate analyses of variance
(MANOVAs using Hotelling's T 2) followed by Student's t-tests were conducted.
The results of these analyses are reported in Tables 4.16 — 4.18.
TABLE 4.16
MULTIVARIATE TESTS OF SIGNIFICANCE FOR ACADEMIC
PERFORMANCE AT SCHOOL
Hypothesis
Partial Eta
Value F df
Error df Sig, Squared
Hotelling's 0,041 0,972 6,000 141,000 0,447 ,040
Trace
Hotelling's T2 = 0,041
F (6, 141) = 0,972; p = 0,447

The multivariate tests of significance presented in Table 4.16 show Hotelling's T 2
test F (6, 141) = 0,972; p = 0,447. This test was compared to the F distribution for
interpretation. Since the observed significance levels were greater than p = 0,05
(p = 0,447) for the T 2 test, the null hypothesis was not rejected and the
alternative hypothesis HA was therefore not supported. This means that the
vectors of means of the two groups with respect to the academic performance at
school did not differ statistically significantly from one another.
Based on Cohen (1988) argument that multivariate tests usually have lower
power than univariate tests, it was therefore decided to proceed with Student's t-
tests to determine whether there are statistically significant differences between
the means of the two groups.
TABLE 4.17
DESCRIPTIVE STATISTICS ON ACADEMIC PERFORMANCE AT SCHOOL
N Mean Std, Deviation Std, Error Mean
Online Cony Online Cony Online Cony Online Cony
Afrikaans 236 305 3,8517 3,6787 1,10667 1,22811 ,07204 ,07032
Biology 98 147 3,3724 2,9184 1,33415 1,28484 ,13477 ,10597
English 237 319 3,8861 3,6144 ,90414 ,95343 ,05873 ,05338
Mathematics 237 319 3,1245 2,8448 1,47949 1,43581 ,09610 ,08039
Science 179 233 3,1006 2,7961 1,40563 1,33272 ,10506 ,08731
Accountancy 204 277 3,8824 3,4982 1,28879 1,39129 ,09023 ,08359
The descriptive statistics for the academic performance at school are reported in
Table 4.17. As can be seen from Table 4.17, the two sample sizes differ, but it
seems that the mean scores do differ statistically significantly foi . the online and
conventional groups. Results indicate that the lowest mean score difference
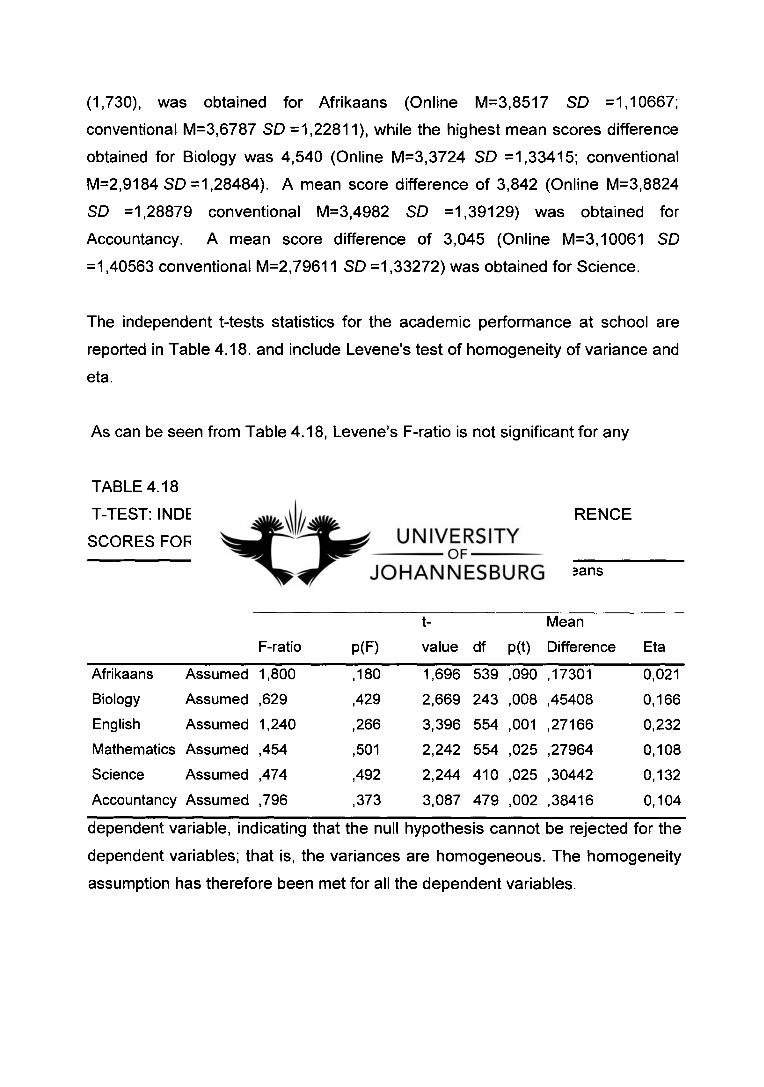
(1,730), was obtained for Afrikaans (Online M=3,8517 SD =1,10667;
conventional M=3,6787 SD =1,22811), while the highest mean scores difference
obtained for Biology was 4,540 (Online M=3,3724 SD =1,33415; conventional
M=2,9184 SD =1,28484). A mean score difference of 3,842 (Online M=3,8824
SD =1,28879 conventional M=3,4982 SD =1,39129) was obtained for
Accountancy. A mean score difference of 3,045 (Online M=3,10061 SD
=1,40563 conventional M=2,79611 SD =1,33272) was obtained for Science.
The independent t-tests statistics for the academic performance at school are
reported in Table 4.18. and include Levene's test of homogeneity of variance and
eta.
As can be seen from Table 4.18, Levene's F-ratio is not significant for any
TABLE 4.18
T-TEST: INDEPENDENT COMPARISONS OF THE MEAN DIFFERENCE
SCORES FOR ACADEMIC PERFORMANCE AT SCHOOL
Levene's Test for West for Equality of Means
Equality of Variances
F-ratio p(F)
t-
value df p(t)
Mean
Difference Eta
Afrikaans Assumed 1,800 ,180 1,696 539 ,090 ,17301 0,021
Biology Assumed ,629 ,429 2,669 243 ,008 ,45408 0,166
English Assumed 1,240 ,266 3,396 554 ,001 ,27166 0,232
Mathematics Assumed ,454 ,501 2,242 554 ,025 ,27964 0,108
Science Assumed ,474 ,492 2,244 410 ,025 ,30442 0,132
Accountancy Assumed ,796 ,373 3,087 479 ,002 ,38416 0,104
dependent variable, indicating that the null hypothesis cannot be rejected for the
dependent variables; that is, the variances are homogeneous. The homogeneity
assumption has therefore been met for all the dependent variables.

The last five columns of Table 4.18 contain the t-test results and eta for the
dependent variables. The results indicate that for Biology, English, Mathematics,
Science and Accountancy, the group means of online and conventional students
differ statistically significantly. The observed t-value for Biology was 2,669 (p= 0,
,008), English 3,396 (p= 0„001), Mathematics 2,242 (p= 0„025), Science 2,244
(p= 0„025) and Accountancy 3,087 (p=,002).
Therefore the null hypothesis of no differences between the groups with respect
to these dependent variables are rejected. This implies that the alternative
hypothesis, H6, which states that there is a statistically significant difference
between the vectors of means of the two groups in respect of the Academic
Performance at School (Biology, English, Mathematics, Science and
Accountancy), is accepted. This also implies that the alternative hypothesis, H6,
for the dependent variables Afrikaans is not accepted.
The results were further explored by determining the effect sizes (see Table 4.18:
last column labelled "eta"). The estimated effect sizes were calculated using eta
and yielded small effect sizes ranging from (eta = 0,104) for Accountancy to (eta
= 0,232) for English, because the values were smaller than 0.3 (Cohen 1988). A
small effect is indicated if eta is 0.1, a medium effect equals 0.3, whereas a large
effect is obtained if eta is 0.5 (Cohen 1988).

4.2.2.3 Differences in means between the two groups with respect
to General Average Matriculation Achievement (GAMA). (H7)
In order to test Hypothesis H7, which states that there is a statistically significant
difference between the vectors of means of the two groups in respect of GAMA
(H7), Student's t-tests were conducted. The results of these analyses are
reported in Tables 4.19 — 4.20.
TABLE 4.19
DESCRIPTIVE STATISTICS ON GENERAL AVERAGE MATRICULATION
ACHIEVEMENT
N Mean Std, Deviation Std, Error Mean
Online Conventional Online Conventional Online Conventional Online Conventional
M- 240 320
22,5125 20,4781 7,38098 6,20934 0,47644 0,34711 score
The descriptive statistics for GAMA are reported in Table 4.19. As can be seen
from Table 4.19 the two sample sizes as well as the mean scores do differ
statistically significantly for the online and conventional groups. Results indicate
that the mean score difference (2,034), was obtained for the M-score (online,
M=22,5125 SD =7,38098; conventional M=20,4781 SD = 6,20934),
The independent t-tests statistics for GAMA are reported in Table 4.20, and
include Levene's test of homogeneity of variance and eta.

As can be seen from Table 4.20 Levene's F-ratio is significant for the dependent
variable, indicating that the null hypothesis can be rejected for the dependent
variables; that is, the variances are not homogeneous. The homogeneity
assumption has therefore not been met for the dependent variables.
The last five columns of Table 4.20 contain the t-test results and eta for the
dependent variable "M-score". The results indicate that the group means of
online and conventional students differ statistically significantly.
TABLE 4.20
T-TEST: INDEPENDENT COMPARISONS OF THE MEAN DIFFERENCE
SCORES ON GENERAL AVERAGE MATRICULATION ACHIEVEMENT
Levene's Test for
t-test for Equality of Means
Equality of
Variances
t- Mean
F-ratio p(F) value df p(t) Difference Eta
Not 6,287 ,012 3,451 462,440 ,001 2,03438 0,092
MSCORE assumed
The observed t-value is 3,451 (p=,001). Therefore the null hypothesis of no
differences between the groups with respect to these dependent variables is
rejected. This implies that the alternative hypothesis, H7, which states that there
is a statistically significant difference between the vectors of mean of the two
groups in respect of GAMA (M-score), is accepted.
The results were further explored by determining the effect sizes (see Table 4.20,
last column labelled "eta"). The estimated effect sizes were calculated using eta
and yielded very small effect sizes for (eta = 0,092).
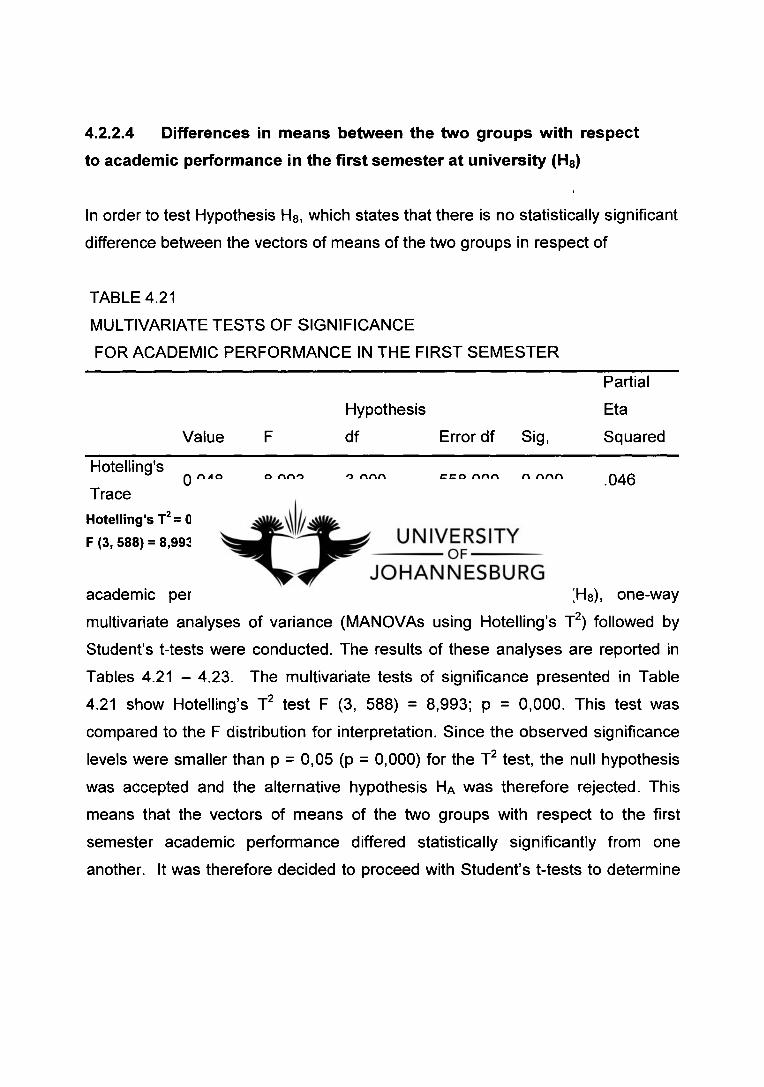
4.2.2.4 Differences in means between the two groups with respect
to academic performance in the first semester at university (H8)
In order to test Hypothesis H8, which states that there is no statistically significant
difference between the vectors of means of the two groups in respect of
TABLE 4.21
MULTIVARIATE TESTS OF SIGNIFICANCE
FOR ACADEMIC PERFORMANCE IN THE FIRST SEMESTER
Partial
Hypothesis Eta
Value F df Error df Sig, Squared
Hotelling's 0.048 8.993 3.000 558.000 0.000 .046
Trace
Hotelling's T2 = 0,048
F (3, 588) = 8,993; p = 0,000
academic performance in the first semester at university (H 8), one-way
multivariate analyses of variance (MANOVAs using Hotelling's T 2) followed by
Student's t-tests were conducted. The results of these analyses are reported in
Tables 4.21 — 4.23. The multivariate tests of significance presented in Table
4.21 show Hotelling's T 2 test F (3, 588) = 8,993; p = 0,000. This test was
compared to the F distribution for interpretation. Since the observed significance
levels were smaller than p = 0,05 (p = 0,000) for the T2 test, the null hypothesis
was accepted and the alternative hypothesis HA was therefore rejected. This
means that the vectors of means of the two groups with respect to the first
semester academic performance differed statistically significantly from one
another. It was therefore decided to proceed with Student's t-tests to determine
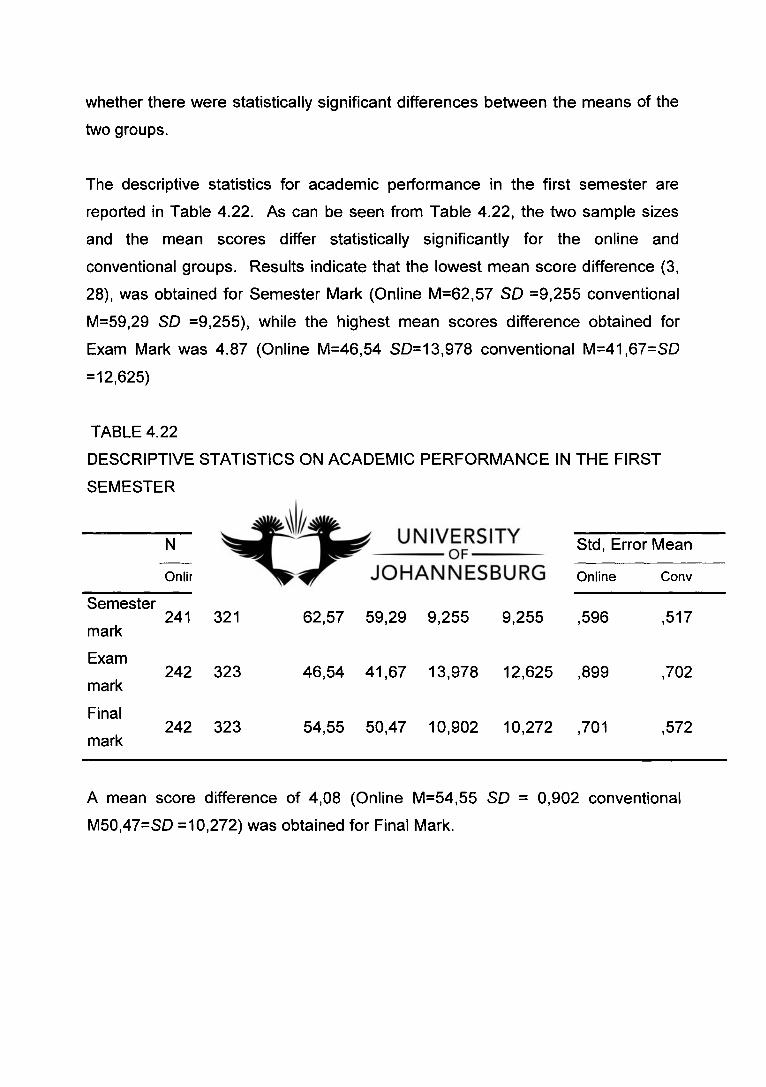
whether there were statistically significant differences between the means of the
two groups.
The descriptive statistics for academic performance in the first semester are
reported in Table 4.22. As can be seen from Table 4.22, the two sample sizes
and the mean scores differ statistically significantly for the online and
conventional groups. Results indicate that the lowest mean score difference (3,
28), was obtained for Semester Mark (Online M=62,57 SD =9,255 conventional
M=59,29 SD =9,255), while the highest mean scores difference obtained for
Exam Mark was 4.87 (Online M=46,54 SD=13,978 conventional M=41,67=SD
=12,625)
TABLE 4.22
DESCRIPTIVE STATISTICS ON ACADEMIC PERFORMANCE IN THE FIRST
SEMESTER
N Mean Std, Deviation Std, Error Mean
Online Cony
Online Cony Online Cony Online Cony
Semester
mark 241 321 62,57 59,29 9,255 9,255 ,596 ,517
Exam
mark 242 323 46,54 41,67 13,978 12,625 ,899 ,702
Final
mark 242 323 54,55 50,47 10,902 10,272 ,701 ,572
A mean score difference of 4,08 (Online M=54,55 SD = 0,902 conventional
M50,47=SD =10,272) was obtained for Final Mark.
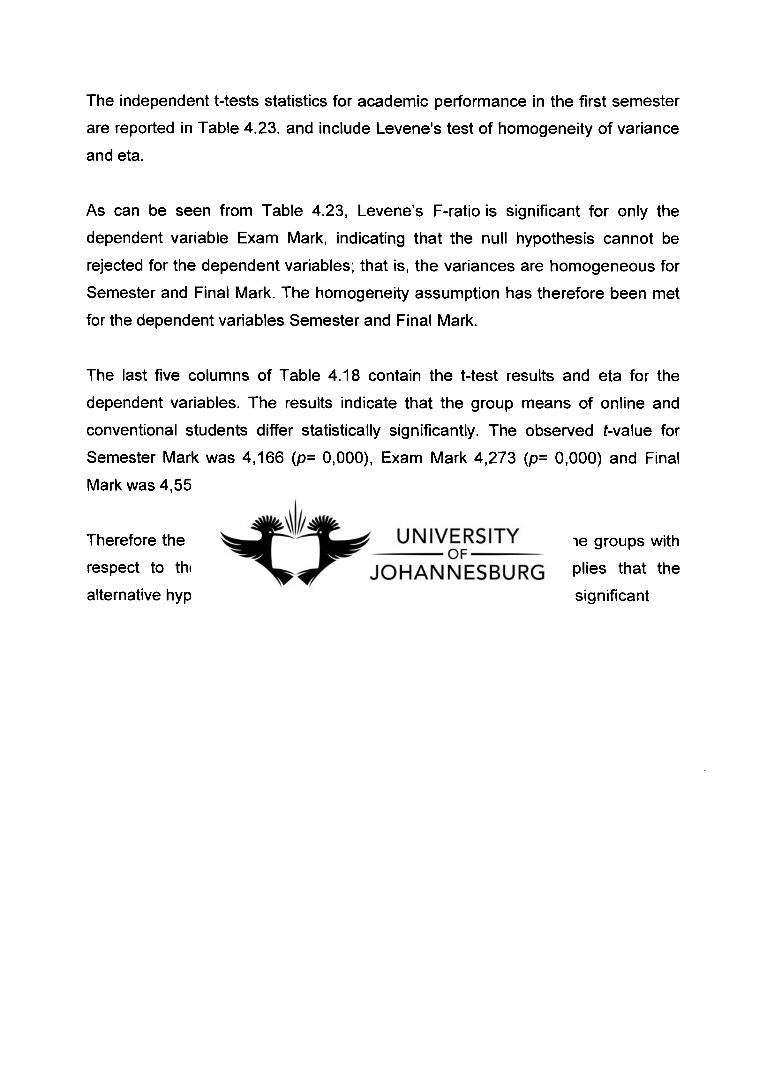
The independent t-tests statistics for academic performance in the first semester
are reported in Table 4.23. and include Levene's test of homogeneity of variance
and eta.
As can be seen from Table 4.23, Levene's F-ratio is significant for only the
dependent variable Exam Mark, indicating that the null hypothesis cannot be
rejected for the dependent variables; that is, the variances are homogeneous for
Semester and Final Mark. The homogeneity assumption has therefore been met
for the dependent variables Semester and Final Mark.
The last five columns of Table 4.18 contain the West results and eta for the
dependent variables. The results indicate that the group means of online and
conventional students differ statistically significantly. The observed t-value for
Semester Mark was 4,166 (p= 0,000), Exam Mark 4,273 (p= 0,000) and Final
Mark was 4,553 (p= 0,000).
Therefore the null hypothesis that there is a difference between the groups with
respect to these dependent variables is accepted. This implies that the
alternative hypothesis, H8, which states that there is no statistically significant
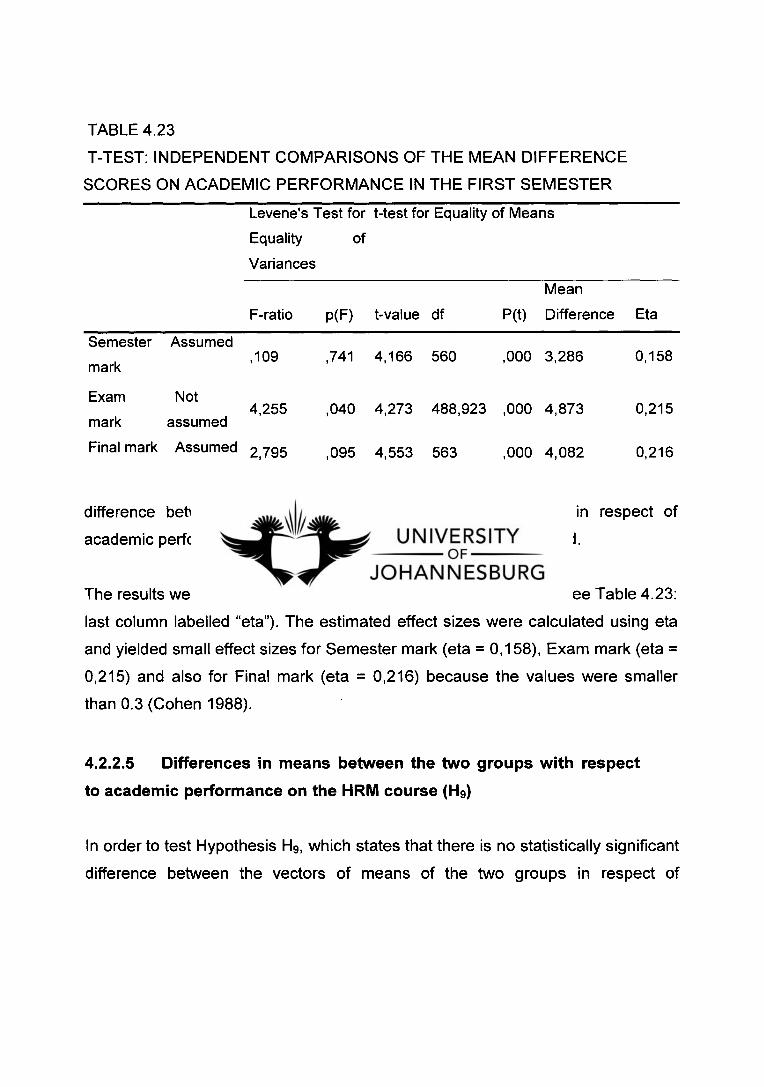
TABLE 4.23
T-TEST: INDEPENDENT COMPARISONS OF THE MEAN DIFFERENCE
SCORES ON ACADEMIC PERFORMANCE IN THE FIRST SEMESTER
Levene's Test for t-test for Equality of Means
Equality of
Variances
Mean
F-ratio p(F) t-value df P(t) Difference Eta
Semester Assumed
mark ,109 ,741 4,166 560 ,000 3,286 0,158
Exam Not
mark assumed 4,255 ,040 4,273 488,923 ,000 4,873 0,215
Final mark Assumed 2,795 ,095 4,553 563 ,000 4,082 0,216
difference between the vectors of means of the two groups in respect of
academic performance in the first semester at university, is rejected.
The results were further explored by determining the effect sizes (see Table 4.23:
last column labelled "eta"). The estimated effect sizes were calculated using eta
and yielded small effect sizes for Semester mark (eta = 0,158), Exam mark (eta =
0,215) and also for Final mark (eta = 0,216) because the values were smaller
than 0.3 (Cohen 1988).
4.2.2.5 Differences in means between the two groups with respect
to academic performance on the HRM course (H9)
In order to test Hypothesis H9, which states that there is no statistically significant
difference between the vectors of means of the two groups in respect of

academic performance on the HRM course (HO, Student's t-tests were
conducted. The results are reported in Tables 4.24-4.25.
TABLE 4.24
DESCRIPTIVE STATISTICS
ON ACADEMIC PERFORMANCE ON THE HRM COURSE
N
Mean Std, Deviation Std, Error Mean
Online Cony Online Cony Online Cony Online Cony
Course Mark 241 322 21,77 18,86 9,352 7,984 ,602 ,445
The descriptive statistics for academic performance on the HRM course are
reported in Table 4.24. As can be seen from Table 4.24, the two sample sizes as
well as the mean scores differ statistically significantly for the online and
conventional groups. Results indicate that a mean score difference of 2,91 was
obtained for Course Mark (Online M=21,77 SD=9,352; conventional M=18,86 SD
= 7,984). This indicates that online students achieved higher mean scores for
Academic Performance on the HRM course.
The independent t-tests statistics for academic performance on the HRM course
are reported in Table 4.25, and include Levene's test of homogeneity of variance
and eta. As can be seen from Table 4.25, Levene's F-ratio is significant for the
dependent variable, indicating that the null hypothesis can be rejected for the
dependent variables; that is, the variances are not homogeneous. The
homogeneity assumption has therefore not been met for the dependant
variables.
The last five columns of Table 4.25 contain the t-test results and eta for the
dependent variable "Course Mark". The observed t-value for Course Mark was
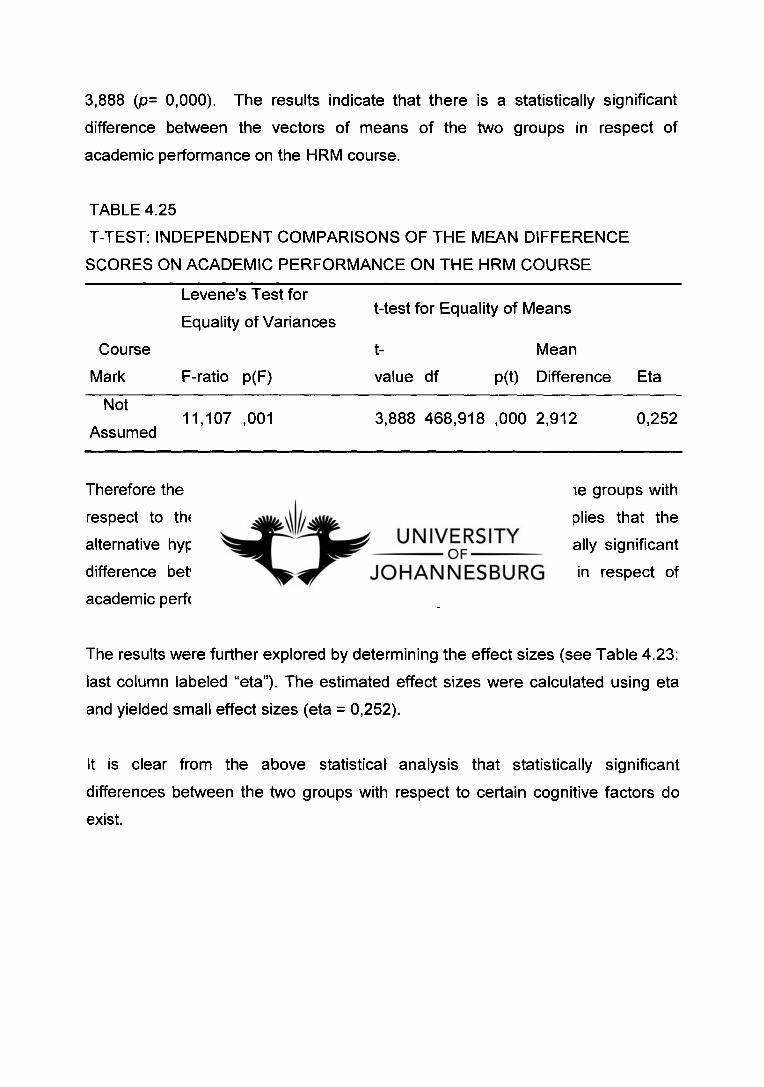
3,888 (p= 0,000). The results indicate that there is a statistically significant
difference between the vectors of means of the two groups in respect of
academic performance on the HRM course.
TABLE 4.25
T-TEST: INDEPENDENT COMPARISONS OF THE MEAN DIFFERENCE
SCORES ON ACADEMIC PERFORMANCE ON THE HRM COURSE
Levene's Test for
Equality of Variances t-test for Equality of Means
Course t- Mean
Mark F-ratio p(F) value df p(t) Difference Eta
Not
Assumed 11,107 ,001
3,888 468,918 ,000 2,912 0,252
Therefore the null hypothesis that there is a difference between the groups with
respect to these dependent variables is accepted. This implies that the
alternative hypothesis, Hg, which states that there is no statistically significant
difference between the vectors of means of the two groups in respect of
academic performance on the HRM course, is rejected.
The results were further explored by determining the effect sizes (see Table 4.23:
last column labeled "eta"). The estimated effect sizes were calculated using eta
and yielded small effect sizes (eta = 0,252).
It is clear from the above statistical analysis that statistically significant
differences between the two groups with respect to certain cognitive factors do
exist.

4.2.3 Differences in means between the two groups with respect
to objective 3" Biographical Differences
In order to test Hypothesis H 10 to H13 relating to Biographical differences, cross-
tabulations were calculated and the chi-square test was used to determine
whether relationships existed between the two groups in respect of (a) gender,
(b) age, (c) language, and (d) computer literacy. The null hypothesis for the chi-
square test applied to two-way designs states that the two variables are
independent, whereas the alternative hypothesis states that the two variables are
associated.
Cramer's V was also calculated as an index of the strength of the association
between the categorical variables (Field, 2000). Siegel and Castellan (1988)
argued that Cramer's V is a useful measure of association due to its wide
applicability. Cramer's V was calculated, because p is affected by a large
sample size and will therefore yield significant X2 value in almost all cases,
whereas Cramer's V is independent of large sample sizes. Rules of thumb for
correlation coefficients such as Cramer's V are (a) a value of 0 to +0,3 indicates
no association and are indicative of small effect sizes; (b) a value of +0,31 to
+0,6 equals a weak positive association; whereas (c) a value of +0,61 to +1,0
reflects a strong positive association.
In the following section the results of the statistical tests with respect to
biographical differences are given in Tables 4.26 to 4.33
4.2.3.1 Gender
Hypothesis H10 states that there is a statistically significant association between
gender and online vs conventional students. In order to test Hypothesis Hlo

cross-tabulations were calculated and the chi-square test was used to determine
whether relationships existed between the two groups. Cramer's V was also
calculated to confirm the strength of the association. The results are reported in
Tables 4.26 and 4.27.
TABLE 4.26
CROSS-TABULATION: DESCRIPTIVE STATISTICS ON GENDER
Gender Group
Total
Female
Male
Online 123 (22,7%) 110 (20,3%) 233 (43,0%)
Conventional 169 (31,2%) 140 (25,8%) 309 (57,0%)
Total 292 (53,9%) 250 (46,1%) 542
The cross-tabulation of gender against type of learner in Table 0.26 shows that
the majority of the participants were female (53.9%), compared to 46.1% male.
The online group also reflected that more females (22,7%) chose to participate in
online learning compared to 20,3% of males.
The null hypothesis for the chi-square test stated that there is no association
between gender and online vs conventional students.
TABLE 4.27
CHI-SQUARE TEST: GENDER VS TYPE OF LEARNER
(ONLINE VS CONVENTIONAL)
X2 df p Cramer's V
Pearson chi-square
0,194 1 0,660 0,019
N of valid cases
542

The alternative hypothesis stated that there is an association. No support was
found to reject the null hypothesis (see Table 4.27) and therefore gender was not
associated with the type of learning (online vs conventional students), x2 =
0,194, p = 0,660. This suggests that online learning was not dependent on
gender. A small effect size was obtained, because Cramer's V was 0,019.
4.2.3.2 Age
Hypothesis H11 states that there is a statistically significant association between
age and online vs conventional students. Cross-tabulations were calculated and
the chi-square test was used to determine whether relationships existed between
the two groups. Cramer's V was also calculated to confirm the strength of the
association. The results are reported in Tables 4.28 and 4.29.
TABLE 4.28 CROSSTABULATION: DESCRIPTIVE STATISTICS ON AGE
Age Group Total
518 ?.19
Online
Conventional
Total
188
258
446
(38,2%)
(52,4%)
(90,7%)
20
26
46
(4,1%)
(5,3%)
(9,4%)
208
284
492
(42,3%)
(57,7%)
The cross-tabulation of age group against type of learner (online vs conventional)
in Table 4.28 shows that 90,7% of the participants were from the age group 518.
38,2% in this age group participated in online learning as opposed to 4,1% from
the ?.19 age group.
The results in table 4.29 show that the Pearson chi-square was not statistically
significant De (1) = 0,03 with p < 0,0862]. The null hypothesis stating that there

TABLE 4.29
CHI-SQUARE TEST: AGE GROUP VS TYPE OF LEARNER
(ONLINE VS CONVENTIONAL)
X2 df p Cramer's V
Pearson chi-square
0, 030 1 0,862 0,008
N of valid cases
492
is no association between age group and online vs conventional students is
therefore accepted.
This implies that the alternative hypothesis, H11, which states that there is a
statistically significant association, is thus rejected. The age group of students
who participated was not associated with the type of learning (online vs
conventional students). This suggests that differences between online and
conventional students were not dependent on age group. The very small effect
size (Cramer's V was 0,008) confirm this conclusion.
4.2.3.3 Computer literacy
Hypothesis H12 states that there is a statistically significant association between
computer literacy and online vs conventional students. In order to test
Hypothesis H12, cross-tabulations were calculated and the chi-square test was
used to determine whether associations existed between the two groups.
Cramer's V was also calculated to confirm the strength of the association. The
results are reported in Tables 4.30 and 4.31.

TABLE 4.30
CROSSTABULATION: DESCRIPTIVE STATISTICS
ON COMPUTER LITERACY
Computer literate Group Total
Not Literate Literate
Online 53 (9,4%) 188 (33,3%) 241 (42,7%)
Conventional 108 (19,2%) 215 (38,1%) 323 (57,3%)
Total 161 (28,6%) 403 (71,4%) 564
The cross-tabulation of computer literacy against online vs conventional students
in Table 0.30 indicates that 71,4% of participants described themselves as
computer literate while 28,6% of participants described themselves as not
computer literate. Most of the participants (38,1%) who described themselves as
computer literate did not join the online group, while 9,4% of the online group did
not describe themselves as computer literate.
TABLE 4.31
CHI-SQUARE TEST: COMPUTER LITERACY VS TYPE OF LEARNER
(ONLINE VS CONVENTIONAL)
X2 Df p
Cramer'sV
Pearson chi-square 8,863 1 0,003 0,125
N of valid cases 564
The results in Table 4.31 indicate that the Pearson chi-square was statistically
significant [x2 (1) = 8,863 with p < 0,003]. The null hypothesis stating that there
is no association between computer literacy and online vs conventional students
is therefore rejected. This implies that the alternative Hypothesis, H12, which
states that there is a statistically significant association, is thus accepted.

The differences in frequencies between computer literacy and online vs
conventional students were thus greater than would be expected by chance. It is
therefore concluded that there is an association between computer literacy and
type of learning. Nevertheless, the estimated effect size was small, because
Cramer's V was only 0,125.
4.2.3.4 Preferred Language
Hypothesis H13 states that there is a statistically significant association between
preferred language and online vs conventional students. In order to test
Hypothesis H13, cross-tabulations were calculated and the chi-square test was
used to determine whether relationships existed between the two groups.
Cramer's V was also calculated to confirm the strength of the association. The
results are reported in Tables 4.32 and 4.33.
TABLE 4.32
CROSS-TABULATION: DESCRIPTIVE STATISTICS ON PREFERRED
LANGUAGE
Preferred Language Group Total
Other Language English
Online 75 (13,8%) 158 (29,2%) 233 (43,0%)
Conventional 75 (13,8%) 234 (43,2%) 309 (57,0%)
Total 150 (27,6%) 392 (72,4%) 542
The cross-tabulation of preferred language against online vs conventional
students in Table 4.32 indicates that the majority, 72,4% of the participants
preferred English while 27,6% of the participants preferred another language
(mostly Afrikaans). The majority of participants (43,2%) who preferred English
did not join the online group while 29,2% of the online group preferred English.
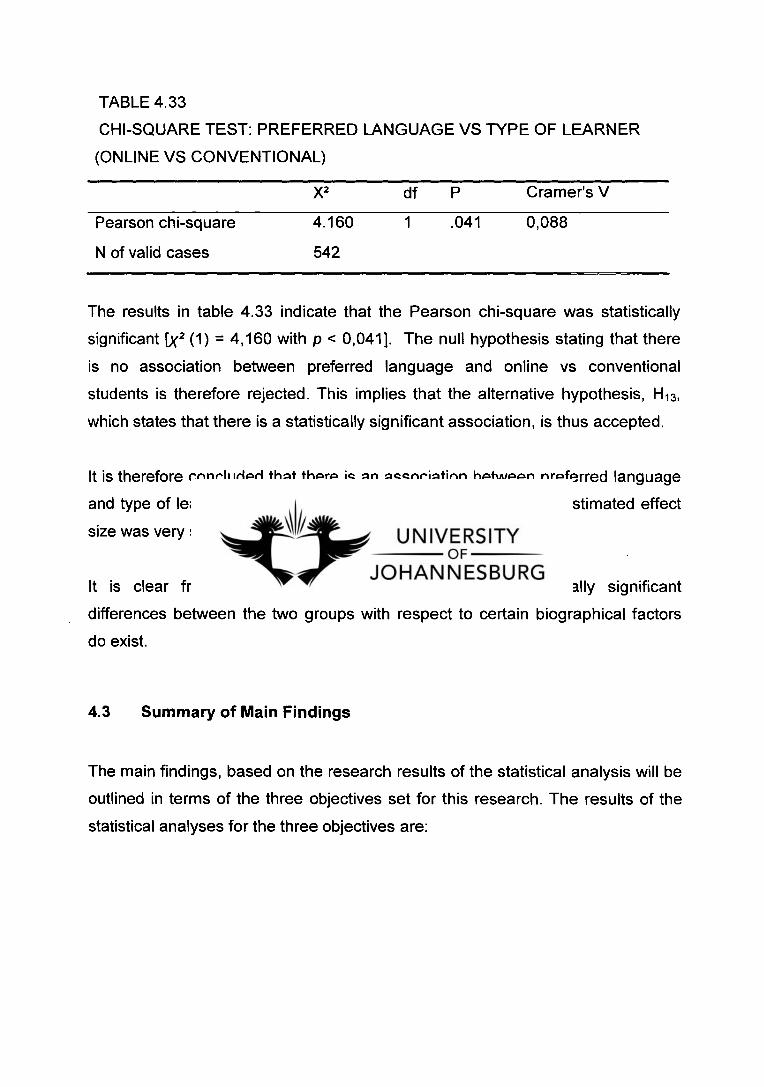
TABLE 4.33
CHI-SQUARE TEST: PREFERRED LANGUAGE VS TYPE OF LEARNER
(ONLINE VS CONVENTIONAL)
X2 df P Cramer's V
Pearson chi-square 4.160 1 .041 0,088
N of valid cases 542
The results in table 4.33 indicate that the Pearson chi-square was statistically
significant [X2 (1) = 4,160 with p < 0,041]. The null hypothesis stating that there
is no association between preferred language and online vs conventional
students is therefore rejected. This implies that the alternative hypothesis, H13,
which states that there is a statistically significant association, is thus accepted.
It is therefore concluded that there is an association between preferred language
and type of learning. Cramer's V was 0,088 and therefore the estimated effect
size was very small.
It is clear from the above statistical analysis that statistically significant
differences between the two groups with respect to certain biographical factors
do exist.
4.3 Summary of Main Findings
The main findings, based on the research results of the statistical analysis will be
outlined in terms of the three objectives set for this research. The results of the
statistical analyses for the three objectives are:
4.3.1 Personality Differences
Four Hypotheses relating to personality differences for the two groups in respect
of (a) the 16 Personality Factor Questionnaire (16PF); (b) Jung's Personality
Types; (c) the Locus of Control Inventory (LCI); and (d) the19 Field Interest
Inventory (19 FII) were formulated and tested, yielding the following results:
Hypothesis, H1, which states that there is a statistically significant difference
between the vectors of means of the two groups in respect of the 16PF
(Intelligence and Conscientiousness) is accepted.
Hypothesis, H2, which states that there is a statistically significant difference
between the vectors of means of the two groups in respect of the JPT is not
accepted.
Hypothesis, H3, which states that there is a statistically significant difference
between the vectors of means of the two groups in respect of the LCI, is not
accepted.
Hypothesis, H4, which states that there is no statistically significant difference
between the vectors of means of the two groups in respect of the 19FII (Nature)
is accepted.
It must be borne in mind that the above findings are based on the significance of
differences in group means, while further analyses carried out revealed that there
were very small to small effect sizes obtained. All hypotheses are rejected on
these grounds and imply that there are no statistically significant personality
differences between online and conventional students.

4.3.2 Cognitive Differences
Five Hypotheses relating to cognitive differences for the two groups in respect of
(a) the Senior Aptitude Tests (SAT); (b) the academic performance at school; (c)
general average matriculation achievement (GAMA); (d) first-semester academic
performance at university; and (e) the academic performance on the HRM course
were formulated and tested, yielding the following results:
Hypothesis, H5, which states that there is a statistically significant difference
between the vectors of means of the two groups in respect of the SAT (Word
Analogy, Verbal Reasoning, Word Pairs, Verbal IQ and Total IQ), is accepted.
Hypothesis, H6, which states that there is a statistically significant difference
between the vectors of means of the two groups in respect of the academic
performance at school (Biology, English, Mathematics, Science and
Accountancy), is accepted.
Hypothesis, H7, which states that there is a statistically significant difference
between the vectors of means of the two groups in respect of GAMA (M-score),
is accepted.
Hypothesis, H8, which states that there is no statistically significant difference
between the vectors of means of the two groups in respect of academic
performance in the first semester, is rejected.
Hypothesis, Hg, which states that there is no statistically significant difference
between the vectors of means of the two groups in respect of academic
performance on the HRM course, is rejected.

However, again it must be borne in mind that the above findings are based on
the significance of differences in group means, while further analyses carried out
revealed that very small to small effect sizes were obtained. All hypotheses are
rejected on these grounds and imply that there are no statistically significant
cognitive differences between online and conventional students.
4.3.3 Biographical Differences
Four Hypotheses relating to biographical differences for the two groups in
respect of (a) gender, (b) age, (c) language, and (d) computer literacy were
formulated and tested, yielding the following results:
Hypothesis, H10, which states that there is a statistically significant association
between gender and online vs conventional students, is rejected.
Hypothesis, H11, which states that there is a statistically significant association
between age and online vs conventional students, is rejected.
Hypothesis, H12, which states that there is a statistically significant association
between computer literacy and online vs conventional students, is accepted.
Hypothesis, H13, which states that there is a statistically significant association
between preferred language and online vs conventional students, is rejected.
Once again it must be borne in mind that the above findings are based on the
significance of associations, while further analyses carried out revealed that very
small to small effect sizes were obtained. All hypotheses are rejected on these
grounds and imply that there is no statistically significant biographical
difference between online and conventional students.

4.4 Conclusion
In this chapter the results of the various statistical procedures were analysed,
reported and various observations were made. The results of descriptive
statistics, one-way multivariate analyses of variance (MANOVA's using
Hotelling's T2), Student's t-tests, cross-tabulations and chi-square test were
revealed.
At first glance it would appear that there are significant differences between
online and conventional students. However, further analyses carried out
revealed that very small to small effect sizes were obtained. Therefore the main
findings, based on the research results of the statistical analysis, concluded that
no statistical significant differences existed between online and conventional
students.
In the next chapter, the results will be interpreted, discussed and integrated with
existing information, to form a synthesis of cutting-edge knowledge concerning
the personality and cognitive differences between online and conventional
students. The next chapter will also focus on reviewing the study and making
recommendations for future research.

Chapter 5
DISCUSSION OF RESULTS,
CONCLUSION AND RELATED
RECOMMENDATIONS
"Would you tell me please which way I ought to go from here?"
"That depends a good deal on where you want to go to," said the Cat.
"I don't much care where-" said Alice
Then it doesn't matter which way you go," said the Cat.
"- So long as I get somewhere," said Alice as an explanation.

Chapter 1 Introduction to the Study Chapter 4
Reporting of Empirical Results
Chapter 2 Literature Research
Chapter 3 Research Design
Chapter 5 Discussion and Conclusion
CHAPTER 5:
DISCUSSION OF RESULTS, CONCLUSION AND RELATED
RECOMMENDATIONS
5.1 Introduction
Are there significant personality and cognitive differences between online and
conventional students? This final chapter not only integrates all the various
aspects of the study as envisaged in Chapter One but it also seeks to draw
specific conclusions based on the findings of the study. Figure 5.1 portrays the
relationship of this chapter to the context of this research.
FIG 5.1 : CHAPTER 5 IN CONTEXT
Before presenting the significance, main contributions and limitations of this
research, it is necessary to provide a brief overview of the study itself. This
summary will include the presentation of the research and the methodology and
procedures.
5.2 Presentation of this Research
The first chapter served as the introduction to this research and placed the total
investigation in context by providing a framework for the problem that was being
studied. The research problem, the purpose, objectives and hypotheses as well
as an overview of the methodology of the study were discussed. The value of
the research as well as the delimitations and limitations of the study were
indicated.
The second chapter reviewed an extensive literature study, which encapsulated
the current knowledge of online learning. The literature review mapped out the
main issues in the field being studied and various personality and cognitive
differences influencing online learning were described from both a theoretical and
research point of view. As such, an overview of previous research on the topic
and a summary of the status quo were also included
The third chapter outlined the research methodology and procedures. The
research methodology was described comprehensively. A detailed discussion on
the research design, the descriptions of the participants, the sampling plan, data
collection procedures and measuring instruments were portrayed. The research
was designed in such a way that it could adequately address the research
question in order to reach the objectives of the study.
The fourth chapter outlined the results and included the processing, analysis
and interpretation of the data in figures and tables. Thirteen hypotheses relating
to personality, cognitive and biographical differences for the two groups were

formulated and tested. The results of the various statistical procedures were
portrayed and the main findings, based on the statistical analyses, were given.
The results of descriptive statistics, one-way multivariate analyses of variance
(MANOVAs using Hotelling's T 2), Student's t-tests, cross-tabulations and chi-
square test were revealed. The main findings, based on the research results of
the statistical analysis, revealed that no statistically significant differences existed
between online and conventional students.
The current chapter will depict the findings of the study. The focus is on how the
theoretical and empirical objectives of the study were reached. Conclusions will
draw from both the literature research and the empirical research. The value, as
well as the limitations of the study will be pointed out. Recommendations will be
made, based on the findings of the study and suggestions for potential research
opportunities will be made.
In the following section a summary of the methodology employed is given.
5.3 A Summary of Methodology
A summary of the methodology of the study includes the basic characteristics of
the sample, the measuring instruments, the research procedure and the
statistical analyses.
5.3.1 The Research Participants
The sample, from which the primary and secondary data were obtained,
consisted of first-year students at a large University in South Africa. The study
population consisted of first-year students enrolled for a compulsory Business

Science Course, tested in 2001. Based on self-selection, 242 students voluntarily
made use of the online course, while 323 students used the conventional course
offered. The ages of the students varied from 18 to 21 years, 91% of them 18
years and younger. As far as gender is concerned 51,9% were female and
69,1% preferred English as the language of tuition.
5.3.2 The Measuring Instruments
In order to identify the personality and cognitive differences between online and
conventional students, the following measuring instruments were selected for use
in the current study:
5.3.2.1 Personality Differences
5.3.2.1.1 The 16 Personality Factors Questionnaire (16PF),
5.3.2.1.2 Jung's Personality Types,
5.3.2.1.3 The Locus of Control Inventory (LCI), and
5.3.2.1.4 The 19 Field Interest Inventory (19 FII).
5.3.2.2 Cognitive Differences
5.3.2.2.1 The Senior Aptitude Tests (SAT),
5.3.2.2.2 The Academic Performance at School,
5.3.2.2.3 General Average Matriculation Achievement,
5.3.2.2.4 The First-Semester Academic Performance at University, and

5.3.2.2.5 The Academic Performance on the HRM Course.
5.3.2.3 Biographical Differences
The biographical questionnaire included items requesting the respondents'
gender, age, computer literacy, and preferred language.
5.3.3 The Research Procedure
The prescribed psychometric battery of tests was administered to the full intake
of first-year university students by the Career Counselling Division during their
first month at the university. Testing was compulsory for all first-year students
and took place over four days under strict supervision. A course was designed
for conventional classes supplemented with an online version of the same course
and students were allowed to freely choose to enrol either in online or
conventional sections of the course. Performances of the students in the first
semester as well as during the course being presented were collected as primary
data. Due to incompleteness of some records, only 586 records could be used in
the sample.
5.3.4 Statistical Analysis
The primary and secondary data sets were subject to one-way multivariate
analyses of variance (MANOVAs using Hotelling's T2), followed by Student's t-
tests. Estimated effect sizes were also calculated using coefficient eta. In order to
test hypotheses relating to biographical differences, cross-tabulations were
calculated and the chi-square test was used. Cramer's V was also calculated as

an index of the strength of the association between the biographical variables. All
calculations were done by means of the SPSS- Windows programme of SPSS -
International. The analysis was conducted with the assistance of a Statistical
Consultation Service.
5.4 Discussion of Findings
This section discusses the key findings and indicates how the theoretical and
empirical objectives of the study were reached.
5.4.1 Literature Research Objectives
Following is a summary of the key findings of the study in respect of the primary
and secondary objectives of the literature research.
5.4.1.1 Findings Regarding the Primary Objective of the Literature
Research
The primary objective of the literature research was to create a theoretical frame
of reference for the concept of online education.
Yet, despite the fact that there is an impressive amount of writing that concludes
that distance learning is viable and effective, the literature review revealed that
studies that examine the effect of individual differences in the online education
are grossly neglected. A review of the few studies being conducted indicates that
several learner characteristics have some effect on the success of the learner in
a distance education environment. Goldsmith (2001) claims that distance
learning studies since 1990 have only examined the use of technology and

learning, but studies focused on online education are lacking, as well as
"research into what makes online courses and online students successful'.
(p.108)
Hence, a need was clearly identified to assess personality and cognitive
differences in online education.
5.4.1.2 Findings regarding the Secondary Objectives of the
Literature Research
The secondary objectives of the literature review yielded the following:
5.4.1.2.1 To discuss the role of online education in Higher Education
This discussion provided a background for understanding online education and,
specifically, distance education and how it influences higher education. A brief
overview of the history of distance education from the correspondence phase to
the current use of computer-mediated communication was outlined. Also briefly
reviewed were the theories underlying distance education, focusing on those
influencing online education. From the review it is evident that there are several
different viewpoints regarding distance education. Nevertheless Peters (2002, p.
13) concludes that there is clearly a structural relationship between distance
education and online-learning.

5.4.1.2.2 To Review the Research on distance- and conventional
education
Currently, research on distance education is relatively narrow and many studies
highlight a need for research to be conducted in the various areas of online
education (Russell (2002); Charp (1999)). As indicated, there is a good deal of
research dealing with distance education. From the literature it seems that most
of the research being done focuses on the effectiveness of online education
compared to traditional face-to-face education and addresses a variety of issues.
Distance education research is concentrated primarily on three areas and
includes:
Course completion and dropout rate;
Student outcomes, such as grades and test scores;
Attitudes and perceptions about learning through distance education; and
Most of these studies conclude that, regardless of the technology used, distance
learning courses compare favourably with classroom-based instruction. Many
experimental studies indicate that students participating in distance learning
courses perform as well as their counterparts in a traditional classroom setting.
These studies suggest that distance-learning students have similar grades or test
scores, or have the same attitudes toward the course. The descriptive analysis
and case studies focus on student and faculty attitudes and perceptions of
distance learning. These studies typically conclude that students and faculty
have a positive view about distance learning. These examples of experimental
research are consistent with many other studies that indicate students
participating in distance learning courses perform as well as their counterparts in
a traditional classroom setting. In other words, distance is not a predictor of
learning.

5.4.2 Empirical Research Objectives
Following is a discussion on the findings in respect of the primary and secondary
objectives of the empirical research.
5.4.2.1 Findings regarding the Primary Objective of the Empirical
Research
The primary objective was formulated as to whether there is personality,
cognitive and biographical differences between online and conventional students.
The empirical findings did not support the expectations of the study. It was
expected that the study would identify significant personality and cognitive
differences between online and conventional students. The results of the
empirical research suggested that, in some instances, there are significant
personality and cognitive differences between online and conventional students.
However, further analyses carried out revealed that very small to small effect
sizes were obtained.
5.4.2.2 Findings regarding the Secondary Objectives of the
Empirical Research
The findings, based on the statistical analysis in respect of the secondary
objectives of the research, are discussed in more detail next.
5.4.2.2.1 Personality Differences
Four hypotheses relating to personality differences for the two groups in respect
of (a) the 16 Personality Factor Questionnaire (16PF); (b) Jung's Personality
Types; (c) the Locus of Control Inventory (LCI) ; and (d) the19 Field Interest
Inventory (19 FII) were formulated and tested.
The knowledge available in the literature was evidently not sufficient to predict or
confirm the results. The limited use of these personality measures in
international research (and as far as can be determined, non-existent for any
research in the South African environment) with regard to online students, makes
this research stand out as providing cutting-edge knowledge in this area.
Nevertheless, some discussion of the results in the broader context of the
literature is possible.
Hypothesis, H1, postulated a statistically significant difference between the
vectors of means of the two groups in respect of the 16PF.
The results of the study indicated that, except for Intelligence and
Conscientiousness, the group means of online and conventional students did not
differ statistically significantly. The findings do not support the above hypotheses
in full. The results are contradictory to the findings of Biner et al (1995) and
Macgregor and Donaldson (2000). Macgregor and Donaldson (2000) found that
the two groups were very different and concluded that "personality does matter"
(p. 114). Successful online students seem to be "more worrisome, serious, shy
and non-experimental than students in traditional classrooms.." (p. 114). Online
students tend to be "more introverted, accommodating and self-controlling" (p.
114) compared to students in the traditional classroom. Online students tend to
be more "cooperative, trusting and tough minded' than students in the traditional
setting. The current research therefore only seems to indicate that online
students tend to be more intelligent and more conscientious. The former is also
confirmed by the results of cognitive differences (par 5.5.4).
This clearly is an area in which further research is needed.

Hypothesis, H2, postulated a statistically significant difference between the
vectors of means of the two groups in respect of the JPT.
The results indicate that the vectors of means of online and conventional
students did not differ statistically significantly. The findings do not support the
above hypotheses. The results are contradictory to the findings of Biner et al
(1995) and Macgregor and Donaldson (2000) who found that online students
tend to be more introverted than conventional students. The research of Todd
and Raubenheimer (1991) on traditional students should also be considered in
this context.
Hypothesis, H3, postulated a statistically significant difference between the
vectors of means of the two groups in respect of the LCI.
The results indicate that the vectors of means of online and conventional
students did not differ statistically significantly. The findings do not support the
above hypotheses. The results are contradictory to the findings of Wang and
Newlin (2000) who indicated that online students exhibited a greater external
locus of control than their counterparts in conventional courses. The results are
also contradictory to the findings of Dille and Mezack (1991a, 1991b) that
learners with an internal locus of control are more likely to persist in distance
education than those with an external locus of control.
Hypothesis, H 4 , postulated no statistically significant difference between the
vectors of means of the two groups in respect of the 19FII.

The results indicate that the vectors of means of online and conventional
students did not differ statistically significantly. The findings do support the above
hypotheses. With respect to the differences between traditional and distance
learning regarding interest, there seems to be a definite lack of literature in this
regard. According to Todd and Raubenheimer (1991) it seems only logical that
interest plays a major role; the more interested one is the more motivated and
enthusiastic one becomes.
Based on above findings the four Hypotheses relating to personality differences
for the two groups in respect of (a) the 16 Personality Factor Questionnaire
(16PF); (b) Jung's Personality Types; (c) the Locus of Control Inventory (LCI);
and (d) the19 Field Interest Inventory (19 FII) are rejected: there are no
statistically significant personality differences between online and
conventional students.
5.4.2.2.2 Cognitive Differences
Five Hypotheses relating to cognitive differences for the two groups in respect of
(a) the Senior Aptitude Tests (SAT), (b) Academic Performance at School, (c)
General Average Matriculation Achievement, (d) First-Semester Academic
Performance at University and (e) Academic Performance on the HRM Course
were formulated and tested. The results regarding these hypotheses will be
discussed in the following paragraphs.
A substantial portion of research on distance learning however seems to focus
on student outcomes, such as grades and test scores. A myriad such studies
conclude that, regardless of the technology used, there is no significant
difference in the learning outcomes of online students and face-to-face students

(Russell 1999; Navarro, & Shoemaker, (1999) Hammond (1997) Cheng,
Lehman, & Armstrong, (1991) Martin, & Rainey, (1993) Johnson (2002,
Shachar (2002) Brown, & Liedholm, (2002) Thomas (2001) Efendioglo, &
Murray (2000) Redding (2000) Stinson and Claus (2000) Navarro & Shoemaker
(1999) LaRose, Gregg, & Eastin, (2001) Gagne and Shepherd (2001) Johnson,
Aragon, Shaik, & Palma-Rivas (2000) Souder, (1993).
Hypothesis, H 5 , postulated a statistically significant difference between the
vectors of means of the two groups in respect of the SAT.
The results indicate that the vectors of means of online and conventional
students did not differ statistically significantly. (Based on further analyses
carried out which revealed that very small to small effect sizes obtained).
Therefore the findings do not support the above hypotheses. Cognitive ability
(Intelligence measures) is well documented as one of the best predictors of
academic achievement, though most of the research being done focuses on on-
campus students. There seems to be no basis for predicting that online students
differ in the same ways as traditional students. Only in one study, Hiltz (1993),
used the Scholastic Aptitude Test (SAT) and found moderate to strong
relationships between academic ability and outcomes in the virtual classroom
compared to the traditional classroom.
Hypothesis, H6, postulated a statistically significant difference between the
vectors of means of the two groups in respect of the academic performance at
school.
The results indicate that the vectors of means of online and conventional
students did not differ statistically significantly. (Based on further analyses

carried out which revealed very small to small effect sizes obtained). Therefore
the findings do not support the above hypotheses.
Hypothesis, H7, postulated a statistically significant difference between the
vectors of mean of the two groups in respect of GAMA (M-score).
The results indicate that the vectors of means of online and conventional
students did not differ statistically significantly. (Based on further analyses
carried out which revealed that very small to small effect sizes obtained).
Therefore the findings do not support the above hypotheses.
Hypothesis, H8, postulated no statistically significant difference between the
vectors of means of the two groups in respect of academic performance in the
first semester.
The results indicate that the vectors of means of online and conventional
students did not differ statistically significantly. (Based on further analyses
carried out which revealed that very small to small effect sizes obtained).
Therefore the findings support the above hypothesis. The results are also
contradictory to the findings of Russell (1999); Navarro, & Shoemaker, (1999);
Hammond (1997); Cheng, Lehman, & Armstrong, (1991); Martin, & Rainey
(1993); Johnson (2002); Shachar (2002); Thomas (2001); Redding (2000);
Stinson and Claus (2000); LaRose, Gregg, & Eastin (2001); Gagne & Shepherd
(2001) and Souder (1993). The results confirm the findings of Brown, & Liedholm
(2002); Efendioglo, & Murray (2000); Johnson, Aragon, Shaik, & Palma-Rivas
(2000) and Navarro & Shoemaker (1999).

Hypothesis, H9, postulated no statistically significant difference between the
vectors of means of the two groups in respect of Academic Performance on the
HRM course.
The results indicate that the vectors of means of online and conventional
students did not differ statistically significantly. (Based on further analyses
carried out which revealed that small effect sizes obtained). Therefore the
findings support the above hypothesis. The results are also contradictory to the
findings of Russell (1999); Navarro, & Shoemaker, (1999); Hammond (1997);
Cheng, Lehman, & Armstrong, (1991); Martin, & Rainey (1993); Johnson (2002);
Shachar (2002); Thomas (2001); Redding (2000); Stinson and Claus (2000);
LaRose, Gregg, & Eastin (2001); Gagne & Shepherd (2001) and Souder (1993).
The results confirm the findings of Brown, & Liedholm (2002); Efendioglo, &
Murray (2000); Johnson, Aragon, Shaik, & Palma-Rivas (2000) and Navarro &
Shoemaker (1999).
Based on above findings all five Hypotheses relating to cognitive differences for
the two groups in respect of (a) the Senior Aptitude Tests (SAT); (b) the
academic performance at school; (c) general average matriculation achievement
(GAMA); (d) first-semester academic performance at university; and (e) the
academic performance on the HRM course are rejected: there are no
statistically significant cognitive differences between online and
conventional students.
5.4.2.2.3 Biographical Differences
Four Hypotheses relating to biographical differences for the two groups in
respect of (a) gender, (b) age, (c) language, and (d) computer literacy were
formulated and tested.
Hypothesis H10, postulated a statistically significant association between gender
and online vs conventional students.
The results indicate that the vectors of means of online and conventional
students did not differ statistically significantly. (Based on further analyses
carried out which revealed that a very small effect size obtained). Therefore the
findings do not support the above hypothesis. This suggests that online learning
was not dependent on gender. The results are also contradictory to the findings
of Powell, Conway and Ross, (1990).
Hypothesis H11, postulated a statistically significant association between age
and online vs conventional students.
The results indicate that the vectors of means of online and conventional
students did not differ statistically significantly. (Based on further analyses
carried out which revealed that a very small effect size obtained). Therefore the
findings do not support the above hypothesis. This suggests that online learning
was not dependent on gender. The results are contradictory to the findings of
Navarro, & Shoemaker, (1999); Hammond (1997); Cheng, Lehman, &
Armstrong, (1991); Martin, & Rainey (1993); Johnson (2002); Shachar (2002);
Thomas (2001); Redding (2000); Stinson and Claus (2000); LaRose, Gregg, &
Eastin (2001); Gagne & Shepherd (2001); Souder (1993) and Powell, Conway
and Ross, (1990).

Hypothesis H12, postulated a statistically significant association between
computer literacy and online vs conventional students.
The results indicate that the vectors of means of online and conventional
students did not differ statistically significantly. (Based on further analyses
carried out which revealed that a very small effect size obtained). Therefore the
findings do not support the above hypothesis. This suggests that online learning
was not dependent on computer literacy.
Hypothesis H13, postulated a statistically significant association between
preferred language and online vs conventional students.
The results indicate that the vectors of means of online and conventional
students did not differ statistically significantly. (Based on further analyses
carried out which revealed that a very small effect size obtained). Therefore the
findings do not support the above hypothesis. This suggests that online learning
was not dependent on preferred language. The results are also contradictory to
the findings of Navarro, & Shoemaker, (1999); Hammond (1997); Cheng,
Lehman, & Armstrong.
Based on above findings all four hypotheses relating to biographical differences
for the two groups in respect of (a) gender, (b) age, (c) language, and (d)
computer literacy are rejected: there is no statistically significant
biographical difference between online and conventional students.
It is reasonable to conclude that there is insufficient evidence to support the
expectation that there is significant personality, cognitive and biographical
differences between online and conventional students. This is supported by
studies done by Schlosser & Anderson (1997) and Moore and Kearsley (1996).

What makes any course good or poor is a consequence of how well it is
designed, delivered, and conducted, not whether the students are face-to-face or
at a distance (Moore and Kearsley, 1996).
This concludes the discussion of key findings. In the following sections the
significance, contribution and limitations as well as suggestions for potential
research opportunities will be reflected upon. The intention is not to focus on
"what went well" or "what went badly", but, rather, on the questions: What was
learned?, and Why was there progress?
5.5 Significance of the study
In addressing the problem "Who undertakes and succeeds in online courses?"
the significance of this study was three-fold, namely theoretical, practical and
methodological. The current deficit in empirical data is unfortunate because
online learning and its inherent multimedia environment are increasingly
prevalent in the higher education environment.
5.5.1 Theoretical Significance
The research has more comprehensively shed light on expected differences
between online and conventional students with respect to personality and
cognitive differences than any other research carried out. The research provides
justification for future research into the question of who undertakes online
courses? Insights into the various aspects of online learning will contribute to
theory building, while the results of this research can be considered to be a
catalyst for additional research.

5.5.2 Methodological Significance
This study comprehensively contributes to the value of quantitative methods in
assessing differences between online and conventional students with respect to
personality, cognitive and biographical differences based on nationally accepted
and validated measuring instruments. It serves as a benchmark for future
research designs on differences between online and conventional courses. A
concerted effort has been made to ensure that the online course is as nearly
identical to the conventional course as possible, to control for extraneous
variables, which in turn limit the ability to demonstrate cause and effect.
5.5.3 Practical Significance
This study focussed on one of the burning 'people' issues in South Africa and
contributes to a better understanding of who undertakes online learning by
assessing personality and cognitive differences between online and conventional
students. Insight into personality and cognitive differences enables the effective
management thereof, which in turn contributes to the success of educational
institutions. It also contributes to providing a framework for institutions of higher
education to understand, manage and facilitate online and conventional students.
Educators and course designers will be able to match the needs and
expectations of their online students more effectively. This will ensure that, from
a pedagogical perspective, the design of a flexible learning environment within a
technology -rich medium is not hampered by a lack of understanding of the
needs of learners. This information will allow institutions of higher education to
increase the overall satisfaction of the learner in the online environment. Lastly,
it will make a contribution to ensure that course design does not become
technology driven but allows technology to serve as a resource in support of
student needs.

5.6 The main contribution of the study
According to Dubin (1976), theories represent a conceptual simplification of
complex, real world situations that enhance our understanding about a
phenomenon. Researchers (Christensen and Raynor, 2003; Dubin, 1976;
Mouton, 2001; Whetton, 1989) are adamant that in general, outstanding theories
have the following characteristics:
It is providing a basis for predictions ;
Providing a framework for the current reality to understand the what
and the why;
Creating a firm base of reference to a domain of study; and
Simplifies our understanding the world.
Specific theoretical, methodological and practical contributions of this study are
as follows:
5.6.1 Theoretical Value
The methodology was based on a well-constructed research design with
regard to such factors as the populations being compared; the treatments
being given, the validity and reliability of the measuring instruments; the
statistical techniques being applied, and the validity, reliability, and
generalisability of data on which the conclusions are based.
The research did not support the proposition that online and conventional
students are different in terms of personality, cognitive and biographical
variables;

The research created a theoretical frame of reference for the concept of
online education;
The research provided a background for understanding online education
and specifically distance education and how it impacts on higher
education;
The research used several means to try to take individual student
differences into account;
The research served as a catalyst for future research in online learning.
As can be seen from the above points, these theoretical contributions are
a first in the South African research context!
5.6.2 Methodological Value
The well-constructed research design contributes comprehensively to the
limited body of original research studies.
This study made lengthy use of inferential statistical procedures going
beyond bi-variate analysis, using one-way multivariate analyses of
variance and Student's t-tests while further analyses included estimated
effect sizes based on coefficient eta.

Very little empirical research has been conducted, certainly in the South
African context, but also internationally, in assessing differences between
online and conventional students;
The research provides guidelines for a quantitative assessment of
differences between online and conventional students with respect to
personality, cognitive and biographical differences;

5.6.3 Practical Value
The research contributes to a very important "burning people issue" of
human capital in South Africa, namely education, training and
development;
The research provides a framework for assessing differences between
online and conventional students with respect to personality, cognitive
and biographical differences;
The research enables institutions of higher education to better understand
and manage their online and conventional students and to see these
findings as support for offering asynchronous courses to diverse students;
The research provides evidence that should encourage educational
institutions to offer online education to all types of students.
The next section outlines the limits of the research.
5.7 Limitations of Study
Although this study has provided insights into personality and cognitive
differences between online and conventional students, especially within the
South African context, it is important to recognize limitations associated with this
study:

5.7.1 Delimitations
The following delimitations of the study were identified:
Firstly, only students from one large South African University, from one faculty
and registered for a compulsory first-year course were used. The sample was
chosen because the researcher was familiar with the online environment and
was assisted by the lecturers presenting this specific course. Since a limited
sample was used, the results should only be generalised to the population and to
other institutions with caution and not without additional empirical tests.
The research focuses on an online course in a specific South African Higher
Education context. Other institutions that might provide online education were not
included or represented. The lecturer contracted for the presentation of the
course had taught and designed various other online courses.
5.7.2 Limitations
The limitations of the study lay in the design, subjects and the nature of the
online course being presented. Each of the limitations will be elaborated on in
the following paragraphs.
The limitations inherent in the design of this research include the quasi-
experimental nature of the study. A completed random assignment of students
was not possible, but even if it had been, it would not have been possible to
identify certain types of students who preferred online courses versus
conventional courses.

The second limitation relates to the subjects being used for this research.
Although a relatively large sample of subjects was used it was, however, a
compulsory course. The two student populations were not distinctly separate
from each other. The online students were a subset of the populations of
students in the conventional face-to-face environment. The sizes of the two
student populations differ, which has an influence on both the statistical analyses
as well as on the findings based on the analyses, despite statistical measures to
counteract these effects. The relatively large sample did not allow control in
terms of limited interaction between the two groups. An additional concern was
the rate of participation of online students in the research. These could have
biased the results achieved in different unknown ways.
The third limitation relates to the nature of the online course. This was the first
time students were exposed to online education. The effectiveness of the
computer and software technology on students' decision to opt for the online
course was also not included in this study.
Lastly it must be borne in mind that the study suffers from the usual limitations of
survey research.
5.8 Recommendations
It is clear from the above that a number of recommendations can be made, but
with caution, taking into account what Christensen and Raynor (2003, p. 72)
proclaimed: "in business ..., no single prescription cures all ills".
Following are recommendations made regarding the theoretical, methodological
and the practical perspective:

5.8.1 Recommendations from a Theoretical Perspective
Currently, research on distance education is relatively narrow and many studies
highlight a need for research to be conducted into the various areas of online
education (Russell, 2002; Charp, 1999). Merisotis and Olsen (2000), confirm this
view by concluding that "while a plethora of literature on the distance education
phenomenon is available, original research on distance education is limited".
From a theoretical perspective it is recommended that:
A meta-analysis of existing research may help to explain differences
between online and conventional students.
From the literature review it is evident that there are several different
viewpoints regarding distance education. Efforts should be made to
integrate these theoretical perspectives.
A more integrated, coherent, and sophisticated programme of research on
online learning based on theory needs to be developed.
5.8.2 Recommendations from a Methodological Perspective
The following suggestions may improve the methodology used:
Multivariate analyses should be used in future.
The benchmark that this research provides should be employed in
different institutions of higher education.

Virtually all of the research focuses upon individual courses and not on
a full programme, which would be recommended for a future project.
A concerted effort should be made to ensure that the online course is
as nearly identical to the conventional course as possible to control for
extraneous variables which, in turn, will ensure the ability to
demonstrate cause and effect.
A qualitative research paradigm should be employed to supplement
the quantitative surveys.
5.8.3 Recommendations from a Practical Perspective
To add value from a practical perspective the following recommendations are
suggested:
The framework provided for assessing differences between online and
conventional students should be employed in different institutions of higher
education;
Educational institutions should offer online education to all types of students.
The results should be used by institutions of higher education to understand,
manage and facilitate online and conventional students.

The effectiveness of the computer and software technology on a student's
decision to opt for the online course should be included.
5.9 Suggestions for Potential Research Opportunities
Edvinsson (2002, p. 202) refers to potential research opportunities by stating
"there is no end, just another question, another curious leap into the dark'. This
is supported by Christensen and Raynor (2003, p. 71) indicating, "The work of
building ever-better theory is never finished". Within the framework of this study
the following suggestions for potential research opportunities are made:
A comparison between students from different South African Universities, from
different faculties and registered for different courses to generalise the findings
should be made.
Further research should be undertaken to include a comparison between
students from the South African Higher Education context and other institutions
that might provide online education.
Given the findings of this study, there is still a large amount of effect size to be
explained. Individual characteristics such as learning styles and commitment
could be included.
5.10 Conclusion
In this chapter a summary of the methodology, the key findings in respect of the
objectives of the study, both the literature objectives and the empirical objectives;

the significance and main contributions as well as limitations of this research
were described. Suggestions were made as to where future research efforts
could contribute to the body of knowledge related to differences between online
and conventional students
The study of online education is a relatively new field of study and many gaps still
exist in the body of knowledge. The advances in information technologies have
created an array of possibilities for today's learners in institutions of higher
education. The findings of this study not only provide valuable insights into the
theory of online education, thereby contributing to the body of knowledge, but
also serve as a guide to educators and course designers to match the needs and
expectations of their online students more effectively.
At the end of this study the words of Jane M. Carey, Professor of Information
Systems, Arizona State University West School of Management, seems an
appropriate reminder of the area in which this research can make a small
contribution:
"However, we will never be able to halt the increasing rate at which we are
delivering online courses. These courses will be offered more and more,
regardless of outcomes. It is imperative that we begin to understand how to
measure and improve learning outcomes for online courses. If we don't begin, we
may end up with a generation of learners who have failed to grasp and
understand the skills and knowledge they need to succeed in their work and,
indeed, in their lives".

UNIVERSITY OF JOHANNESBURG UNIVERSITEIT VAN - .4.
JOHANNESBURG KINGSWAY CAMPUS / 'CAMPUS
—POSBUS 524 BOX 524 AUCKLAND PARK
2006 Tel: (011) 489-2165
2006-Q- 1 1
2011 -05- 1 9
--- L,N,V7,-VrTv
--- OF
oa'ilANNiii-3123 1LiRG
This item must be returned on or before the last date stamped. A renewal for a further period may be granted provided the book is not in demand. Fines are charged on overdue items.