Embed Size (px)
Citation preview

PERFORMANCE-BASED PLASTIC DESIGN
OF EARTHQUAKE RESISTANT
CONCENTRICALLY BRACED STEEL FRAMES
by
M. Reza Bayat
Subhash C. Goel
Shih-Ho Chao
Department of Civil and Environmental Engineering
The University of Michigan
College of Engineering
Ann Arbor, MI 48109-2125

PERFORMANCE-BASED PLASTIC DESIGN
OF EARTHQUAKE RESISTANT
CONCENTRICALLY BRACED STEEL FRAMES
by
M. Reza Bayat
Subhash C. Goel
Shih-Ho Chao
A report on research sponsored by
American Institute of Steel Construction
and
NUCOR Research & Development
Department of Civil and Environmental Engineering
The University of Michigan
College of Engineering
Ann Arbor, MI 48109-2125
Research Report UMCEE 10-02 September 2010

i
ii
ACKNOWLEDGEMENT
The authors gratefully acknowledge financial support provided by the American
Institute of Steel Construction (AISC), and NUCOR Research and Development
(NUCOR R&D) for this study. Constant encouragement received from Tom Schlafly at
AISC and Dave Samuelson and Walt Schultz at NUCOR R&D is also greatly
appreciated. The opinions and views expressed in the report are solely those of the
authors and do not necessarily reflect those of the sponsors.

iii
TABLE OF CONTENTS
CHAPTER 1 Introduction ........................................................................... 2
1.1 General ................................................................................................................. 2
1.2 Scope and Organization of the Report ................................................................. 4
CHAPTER 2 PBPD Procedure for Design of CBF ................................... 7
2.1 AISC Seismic Design Criteria for CBF ............................................................... 7
2.2 Overall PBPD Procedure for CBFs ..................................................................... 8
2.2.1 Design Base Shear ........................................................................................ 11
2.2.2 Target Yield Mechanism .............................................................................. 12
2.2.3 Recommended Brace and Beam-to-Column Connection Configurations .... 13
2.2.4 Design of Bracing Members ......................................................................... 16
2.2.5 Design of Non-Yielding Members ............................................................... 18
2.3 Design Examples ............................................................................................... 25
2.3.1 Design of 3-story CBF .................................................................................. 29
2.3.2 Design of 6-story CBF .................................................................................. 37
2.4 Verification by Nonlinear Analysis ................................................................... 44
2.4.1 Frames Designed by Elastic Method ............................................................ 44
2.4.2 Nonlinear Analysis Results ........................................................................... 47
CHAPTER 3 Further Development of PBPD Method for Design of CBF .............................................................................................. 66
3.1 General ............................................................................................................... 66
3.2 Proposed Gusset Plate Configuration ................................................................ 68
3.3 Capacity Design of Columns in CBFs ............................................................... 70
3.3.1 Re-Design of Columns in CBF Based on Combined Axial Forces and Moments Obtained from Pushover Analysis (3-Story and 6-Story) ...... 78
3.4 Proposed λ-Factor Method to Account for Pinched Hysteretic Behavior .......... 83
3.5 Yield Drift .......................................................................................................... 91
3.6 Selection of Proper Target Drift for CBFs....................................................... 100
3.7 PBPD Design of a Mid-Rise CBF (9-Story SAC Building) ............................ 105
3.7.1 PBPD Design of 9-Story CBF Using k = 0.75 as the Lateral Load Distribution Parameter ............................................................................ 107
iv
3.7.2 Evaluation of 9-Story CBF Designed by the Lateral Load Distribution Parameter k = 0.75 .................................................................................... 113
3.7.3 PBPD Design of 9-Story CBF Using k = 0.50 as the Lateral Load Distribution Parameter ............................................................................ 116
3.7.4 Evaluation of 9-Story CBF Designed By the Lateral Load Distribution Parameter k = 0.50 .................................................................................... 121
3.8 Performance Comparison Between Beam Shear Splice vs. Conventional Connection ....................................................................................................... 127
CHAPTER 4 Evaluation of Confidence Level against Collapse .......... 143
4.1 Performance-Based Evaluation of CBF ........................................................... 143
4.1.1 Determination of Site-Specific Hazard Parameters ............................... 149
4.1.2 Assessment of Structural Demand .......................................................... 151
4.1.3 Determination of Drift Capacity.............................................................. 153
4.1.4 Confidence Level Assessment .................................................................. 154
4.2 Summary and Concluding Remarks ................................................................ 156
CHAPTER 5 Confidence Level Enhancement of the 9-Story CBF Designed by PBPD ............................................................ 163
5.1 Introduction ..................................................................................................... 163
5.2 New λ-Factor ................................................................................................... 164
5.3 Re-Design of the 9-Story CBF (9V-PBPD-B) ................................................. 170
5.4 Design of the 9-Story CBF with Split-X Configuration (9X-PBPD-B) .......... 174
5.5 Evaluation of Seismic Performance ................................................................. 181
5.5.1 Performance Comparison of 9V-PBPD-B and 9X-PBPD-B1 vs. 9V-PBPD-A ...................................................................................................... 182
5.5.2 Confidence Level Evaluation of 9V-PBPD-B and 9X-PBPD-B1 Frames .. .................................................................................................................... 191
5.5.3 The Effect of Increasing Nf on the Confidence Level ............................ 192
5.6 Summary and Conclusions .............................................................................. 194
CHAPTER 6 Summary and Conclusions ............................................... 201
6.1 Summary .......................................................................................................... 201
6.2 Major Conclusions and Findings ..................................................................... 203
REFERENCES .......................................................................................... 209

v

1
2
CHAPTER 1
Introduction
1.1 General
Concentrically braced frames (CBF) are very efficient and commonly used steel
structures to resist forces due to wind or earthquakes because they provide complete truss
action. Based on research performed during the last thirty years or so (for example, Goel,
1992a), current seismic codes (ANSI/AISC 341-05, 2005) include provisions for design
of ductile concentric braced frames called Special Concentric Braced Frames (SCBF).
Since the seismic forces are assumed to be entirely resisted by means of truss action, the
columns are designed based on axial load demand only and simple shear connections are
used to join the beams and columns (Tremblay and Robert, 2000; MacRae et al., 2004;
ANSI/AISC 360-05, 2005). It has been estimated that CBF comprised about 40% of the
newly built commercial construction in the last decade in California (Uriz, 2005). This is
attributed to simpler design and high efficiency of CBF compared to other systems such
as moment frames, especially after the 1994 Northridge Earthquake.
However, CBF are generally considered less ductile seismic resistant structures
than other systems due to buckling or fracture of the bracing members under large cyclic
displacements. These structures can undergo large story drifts after buckling of bracing
3
members, which in turn may lead to early fractures of the bracing members, especially in
those made of popular rectangular tube sections (HSS). Recent analytical studies have
shown that SCBF designed by conventional elastic design method can suffer severe
damage or even collapse under design level ground motions (Sabelli, 2000).
This report presents the application of the newly developed Performance-Based
Plastic Design (PBPD) method to design of CBF with buckling type braces which exhibit
somewhat “pinched” hysteretic loops. Pre-selected target drift and yield mechanism are
used as performance limit states. In the PBPD method, design lateral forces are derived
by using an energy equation where the energy needed to push the structure up to the
target drift is calculated as a fraction of elastic input energy which is obtained from the
selected elastic design spectra. Plastic design is then performed to detail the frame
members in order to achieve the intended yield mechanism and behavior (Goel and Chao,
2008). In addition, modified brace and beam-to-column connection configurations are
also suggested to further enhance the overall performance. Also, a fracture life criterion is
employed for the HSS braces to prevent premature fracture. Results from nonlinear time
history analyses carried out on example frames designed by the PBPD approach showed
that the frames met all the desired performance objectives, including the intended yield
mechanisms and story drifts while preventing brace fractures under varied hazard levels
(Chao and Goel, 2006b).
Two alternative approaches are suggested for considering the pinched hysteretic
behavior of CBF in the PBPD method. The first approach uses an energy modification
factor, called η-factor and applied in the work-energy equation, to account for the
4
reduced hysteretic energy due to pinching (Chao and Goel, 2006b; Goel and Chao, 2008).
In this approach, the basic work-energy equation for elastic-perfectly plastic hysteretic
systems is modified to account for the pinched hysteretic behavior of CBF (Goel and
Chao, 2008). This method is presented in detail in Chapter 2.
Based on further research on the subject, a second approach to account for the
pinched hysteretic behavior of CBF in calculation of the PBPD design base shear is
proposed (Bayat, Chao, and Goel, 2010; Bayat, 2010). In this method, a modification
factor, called λ-factor, is directly applied on the target drift to account for the effect of
pinching. The λ-factor can be considered as ratio between the maximum displacement of
a pinched SDOF system (representing CBF) to that of an equivalent elastic-plastic SDOF.
By dividing the design target drift for the CBF by this factor, an effective target drift is
obtained which is then used to calculate the PBPD design base shear. Pending further
research on more accurate estimation of λ-factor for CBF, an estimation based on the C2-
factor values as proposed in FEMA-356 (FEMA, 2000a) and FEMA440 (FEMA, 2004)
for stiffness and strength degrading systems in general are used herein. The application of
this approach for design of CBF systems is presented in Chapter 3.
1.2 Scope and Organization of the Report
The scope of this report includes: (1) Development of the PBPD method for CBF;
(2) Redesign of previously studied NEHRP SCBF by the PBPD method and comparison
of their seismic performances; (3) Presentation of some new findings and modifications
5
in the PBPD method for taller CBF; and (4) Reliability-based confidence level evaluation
of the NEHRP and PBPD frames. The organization of the report is as follows:
Chapter 1 introduces the background, scope and organization of the report.
Chapter 2 presents in detail the application of PBPD method for design of CBF
and also redesign of the 3 and 6-story NEHRP frames by using the PBPD
method. The η-factor approach is utilized in this part of the study.
Chapter 3 presents some new findings in further development of PBPD method
in design of taller CBF such as: column design in CBF, λ-factor method to
account for pinched hysteretic behavior in design base shear calculation,
modification of yield drift to include column axial deformation, etc. Those
findings and necessary modifications are incorporated in the method and used to
design a mid-rise 9-story CBF.
Chapter 4 presents the results of confidence level analysis of the previously
studied 3, 6, and 9-story CBF structures, including NEHRP and PBPD designs.
It should be mentioned that evaluation of confidence level against collapse in
this study was performed by following the SAC methodology as used by Uriz
(2005) for code designed frames, instead of the one currently suggested in
FEMA P695 (2009). That was done for reasons of consistency and direct
comparisons of the confidence levels for code designed (Uriz, 2005) versus
corresponding PBPD frames.
Chapter 5 presents the modifications applied for the 9-story CBF in order to
improve its confidence level against collapse. These include modification in the

6
PBPD design base shear (DBS) calculations for taller CBF, and considering a
different brace configuration of two story X-brace (Split-X). Also, the effect of
increasing the brace fracture life, Nf , on the confidence level was studied.
Chapter 6 presents the summary and conclusions of this study.
7
CHAPTER 2
PBPD Procedure for Design of CBF
2.1 AISC Seismic Design Criteria for CBF
Some key points for design of CBF in the AISC Seismic Provisions (ANSI/AISC
341-05, 2005) are also followed in the PBPD approach and summarized in the following:
Bracing members should have / 4 yKL r E F , where K and L are the
effective length factor and the unbraced length for the member, respectively,
and r is the governing radius of gyration.
HSS bracing members should have /b t or 0.64w yh t E F/ . Columns in
CBF are required to have adequate compactness as specified by Table I-8-1 in
the AISC Seismic Provisions (ANSI/AISC 341-05, 2005), because they could
undergo inelastic bending after buckling or fracture of the braces.
For V-Type or Inverted-V (Chevron) bracing, the beams intersected by the
braces should be designed assuming that braces do not provide support for
gravity loads. The beam should be designed to support vertical and horizontal
unbalanced forces resulting from the difference in the tension and compression
brace forces after buckling. For this purpose, the tension and compression
8
forces in the braces are assumed to be equal to y y gR F A and 0.3 crP , respectively.
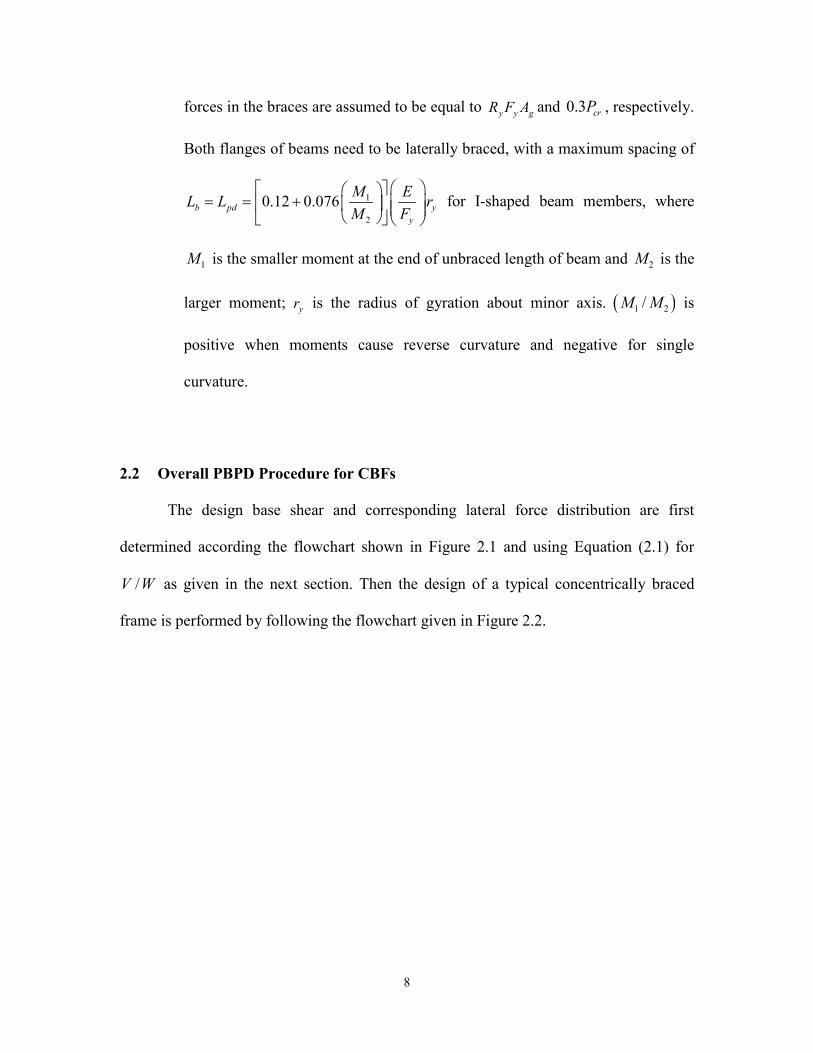
Both flanges of beams need to be laterally braced, with a maximum spacing of
1
2
0.12 0.076b pd yy
M EL L r
M F
for I-shaped beam members, where
1M is the smaller moment at the end of unbraced length of beam and 2M is the
larger moment; yr is the radius of gyration about minor axis. 1 2/M M is
positive when moments cause reverse curvature and negative for single
curvature.
2.2 Overall PBPD Procedure for CBFs
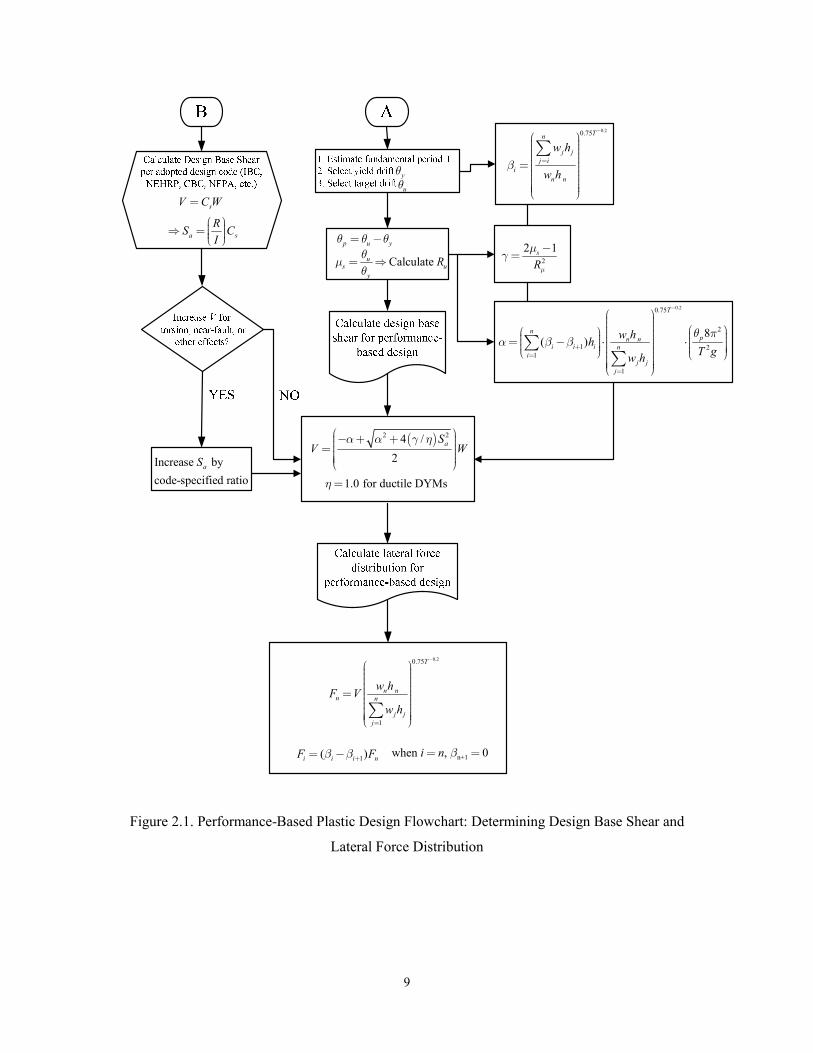
The design base shear and corresponding lateral force distribution are first
determined according the flowchart shown in Figure 2.1 and using Equation (2.1) for
/V W as given in the next section. Then the design of a typical concentrically braced
frame is performed by following the flowchart given in Figure 2.2.
9
uqyq
p u yq q q= -
Calculate us u
y
Rqmq
=
0.20.75Tn
j jj i
in n
w h
w hb
-
=
æ ö÷ç ÷ç ÷ç ÷ç ÷ç ÷=ç ÷ç ÷÷ç ÷ç ÷ç ÷çè ø
å
2
2 1s
Rm
mg -=
Increase by
code-specified ratioaS
0.20.75
2
1 21
1
8( )
T
npn n
i i i ni
j jj
w hh
T gw h
q pa b b
-
+=
=
æ ö÷ç ÷ç ÷ æ öçæ ö ÷ç ÷ç÷ ÷ç ÷ç ç= - ⋅ ⋅÷ ÷ç ÷ç÷ ÷ çç ÷ ÷÷ç ÷ çè ø è ø÷ç ÷ç ÷ç ÷çè ø
åå
( )2 24 /
2aS
V Wa a g hæ ö- + + ÷ç ÷ç ÷=ç ÷ç ÷ç ÷çè ø
0.20.75
1
T
n nn n
j jj
w hF V
w h
-
=
æ ö÷ç ÷ç ÷ç ÷ç ÷ç= ÷ç ÷ç ÷÷ç ÷ç ÷ç ÷çè øå
1( )i i i nF Fb b += - n+1when , 0i n b= =
sV C W=
a s
RS C
I
æ ö÷ç = ÷ç ÷çè ø
1.0 for ductile DYMs h=
Figure 2.1. Performance-Based Plastic Design Flowchart: Determining Design Base Shear and
Lateral Force Distribution
10
( ) ( )story shear 0.5 cost y c cr ii iV P Pf f a£ +
2
2
( / )( / )262 for 60
2 /
( / )60262 for 60
2 /
f
b d KL rKL/r
b t tN
b dKL/r
b t t
0.5 cosh y y crF R P P
0.5 sinv y y crF R P P ( ) ( ) ( )
1sinu transverse beam cri i i
P P P P a+
= + +å ( ) ( ) ( )1
10.5 sin
2u transverse beam cr vi i iP P P P Fa += + + +å
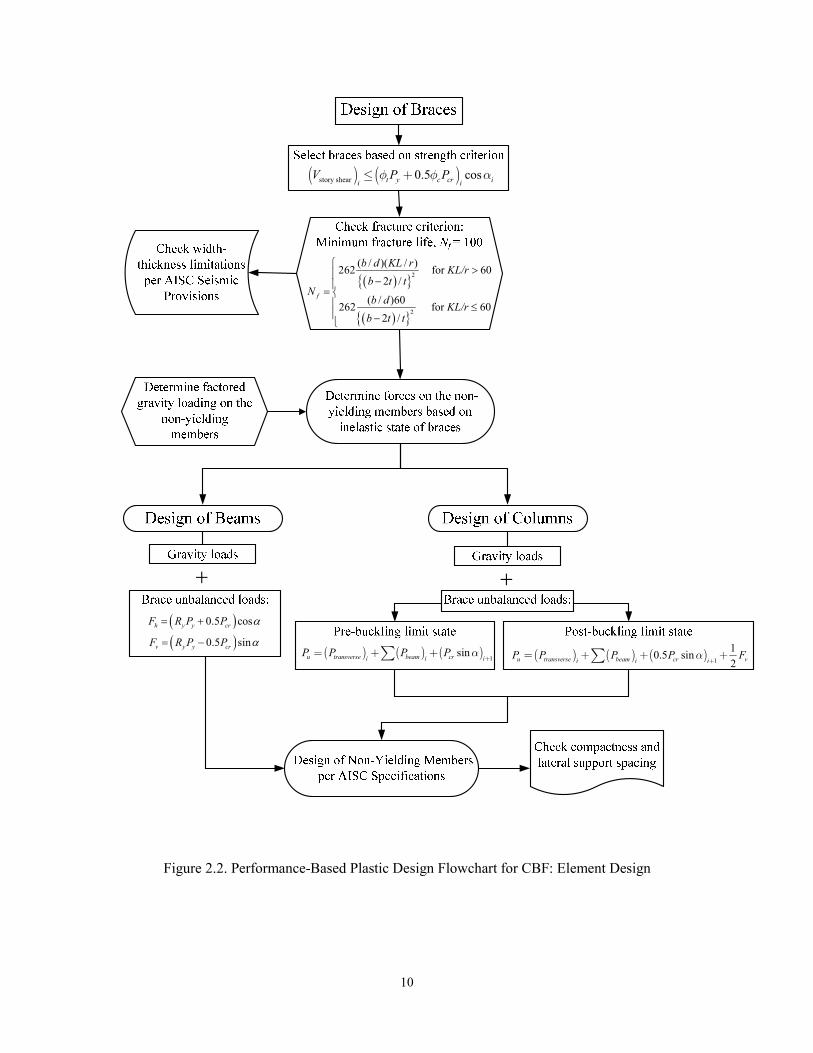
Figure 2.2. Performance-Based Plastic Design Flowchart for CBF: Element Design
11
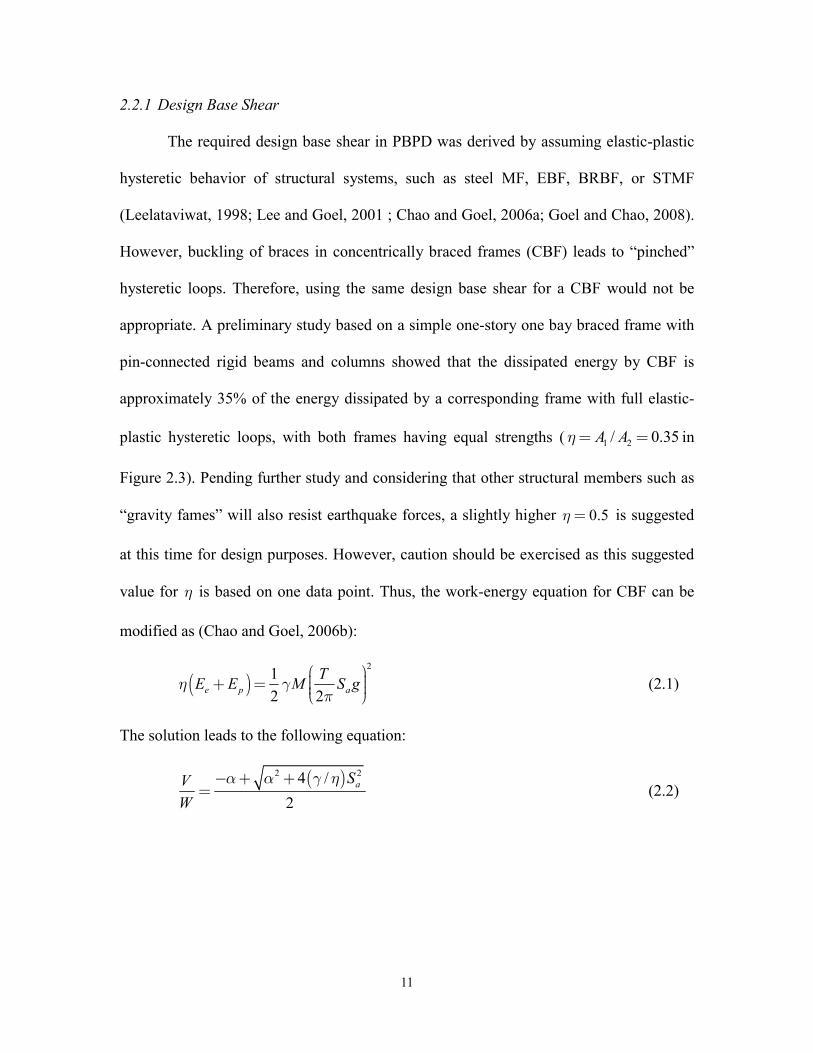
2.2.1 Design Base Shear
The required design base shear in PBPD was derived by assuming elastic-plastic
hysteretic behavior of structural systems, such as steel MF, EBF, BRBF, or STMF
(Leelataviwat, 1998; Lee and Goel, 2001 ; Chao and Goel, 2006a; Goel and Chao, 2008).
However, buckling of braces in concentrically braced frames (CBF) leads to “pinched”
hysteretic loops. Therefore, using the same design base shear for a CBF would not be
appropriate. A preliminary study based on a simple one-story one bay braced frame with
pin-connected rigid beams and columns showed that the dissipated energy by CBF is
approximately 35% of the energy dissipated by a corresponding frame with full elastic-
plastic hysteretic loops, with both frames having equal strengths ( 1 2/ 0.35A Ah= = in
Figure 2.3). Pending further study and considering that other structural members such as
“gravity fames” will also resist earthquake forces, a slightly higher 0.5h = is suggested
at this time for design purposes. However, caution should be exercised as this suggested
value for h is based on one data point. Thus, the work-energy equation for CBF can be
modified as (Chao and Goel, 2006b):
( )2
1
2 2e p a
TE E M S gh g
pæ ö÷ç+ = ÷ç ÷çè ø
(2.1)
The solution leads to the following equation:
( )2 24 /
2aSV
W
a a g h- + += (2.2)
12
1 2A Ah=
Figure 2.3. Typical Full EP and “Pinched” Hysteretic Loops
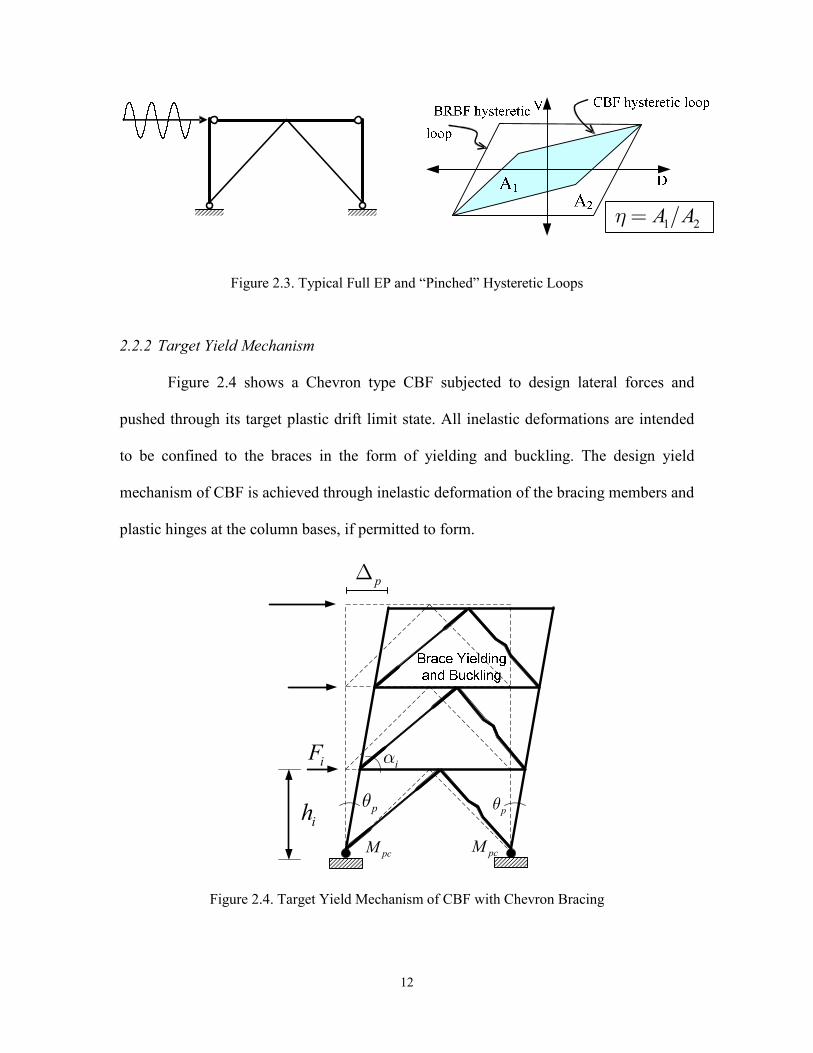
2.2.2 Target Yield Mechanism
Figure 2.4 shows a Chevron type CBF subjected to design lateral forces and
pushed through its target plastic drift limit state. All inelastic deformations are intended
to be confined to the braces in the form of yielding and buckling. The design yield
mechanism of CBF is achieved through inelastic deformation of the bracing members and
plastic hinges at the column bases, if permitted to form.
pq pq
iF
ih
pD
pcM pcM
ia
Figure 2.4. Target Yield Mechanism of CBF with Chevron Bracing

13
2.2.3 Recommended Brace and Beam-to-Column Connection Configurations
Rectangular tube (HSS) sections are very popular sections for bracing members
because of their efficiency to carry axial compressive forces. Single tube sections with
slots at the ends for welding to the gusset plate are most commonly used. Braces in this
configuration generally buckle out-of-plane under compression, leading to large bending
and rotation of the gusset plates. Thus, one plastic hinge forms in the bracing member
with two end plastic hinges forming in the gusset plates with nearly pin-end conditions.
Consequently, this results in less amount of energy dissipation in the bracing member.
Other disadvantage of out-of-plane buckling of the braces includes the damage of non-
structural elements, such as walls (Tremblay et al., 1996).
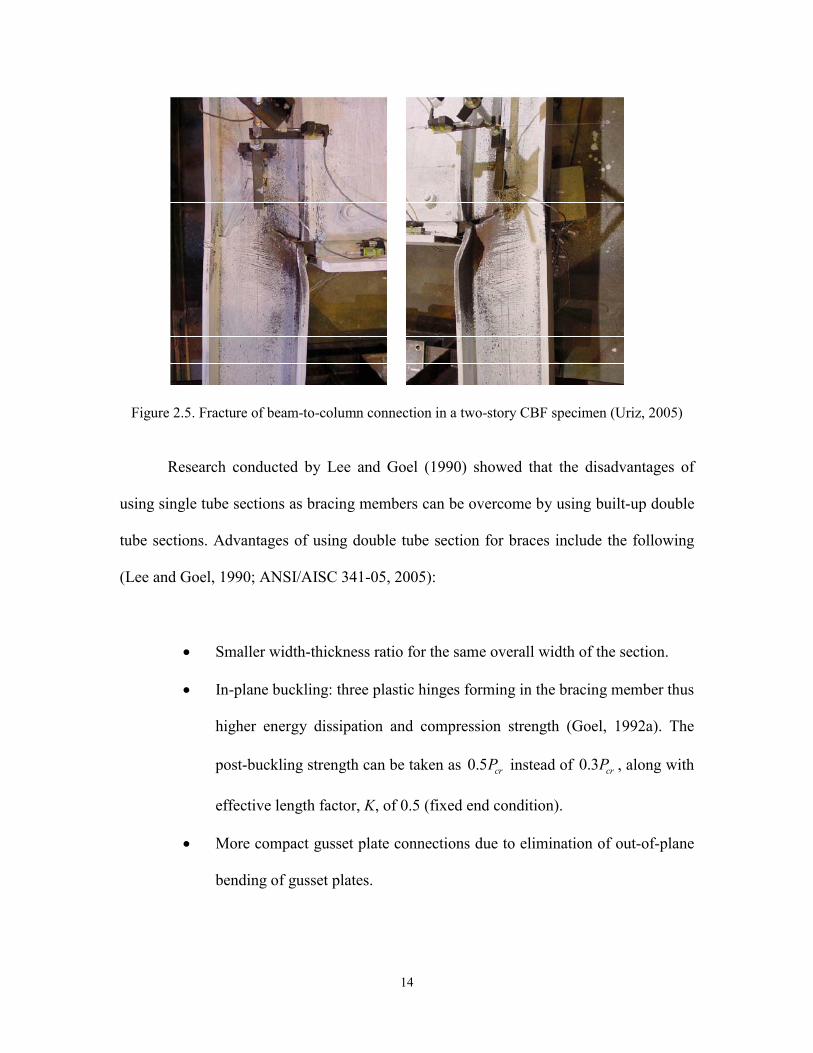
Special detailing is required (ANSI/AISC 341-05, 2005) in order to prevent
premature failure in the gusset plates, which generally results in relatively large gusset
plates. It has been observed in recent tests that large gusset plates change simple beam-to-
column connections into somewhat rigid connections, creating significant moment and
rotation demands on the columns. Because columns in CBF are commonly designed for
axial force only, severe damage can occur at these locations (Figure 2.5, Uriz, 2005).
14
Figure 2.5. Fracture of beam-to-column connection in a two-story CBF specimen (Uriz, 2005)
Research conducted by Lee and Goel (1990) showed that the disadvantages of
using single tube sections as bracing members can be overcome by using built-up double
tube sections. Advantages of using double tube section for braces include the following
(Lee and Goel, 1990; ANSI/AISC 341-05, 2005):
Smaller width-thickness ratio for the same overall width of the section.
In-plane buckling: three plastic hinges forming in the bracing member thus
higher energy dissipation and compression strength (Goel, 1992a). The
post-buckling strength can be taken as 0.5 crP instead of 0.3 crP , along with
effective length factor, K, of 0.5 (fixed end condition).
More compact gusset plate connections due to elimination of out-of-plane
bending of gusset plates.
15
No slots in the tubes are needed, thus reducing the possibility of net
section failure at the ends.
Smaller unbalanced forces on beams due to higher post-buckling strength
of the braces.
Reduced damage to non-structural elements due to in-plane buckling of
braces.
The detailed configuration of the double tube-to-gusset plate connection can be found
elsewhere (Lee and Goel, 1990).
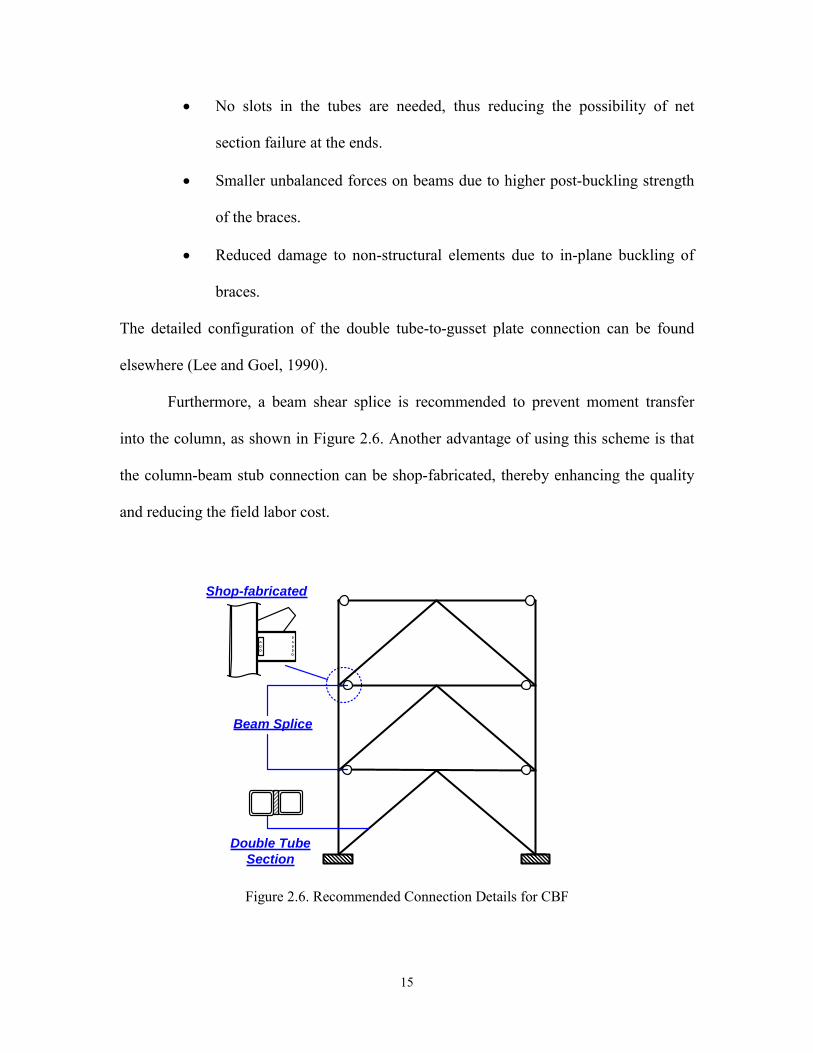
Furthermore, a beam shear splice is recommended to prevent moment transfer
into the column, as shown in Figure 2.6. Another advantage of using this scheme is that
the column-beam stub connection can be shop-fabricated, thereby enhancing the quality
and reducing the field labor cost.
Beam Splice
Double Tube Section
Shop-fabricated
Figure 2.6. Recommended Connection Details for CBF
16
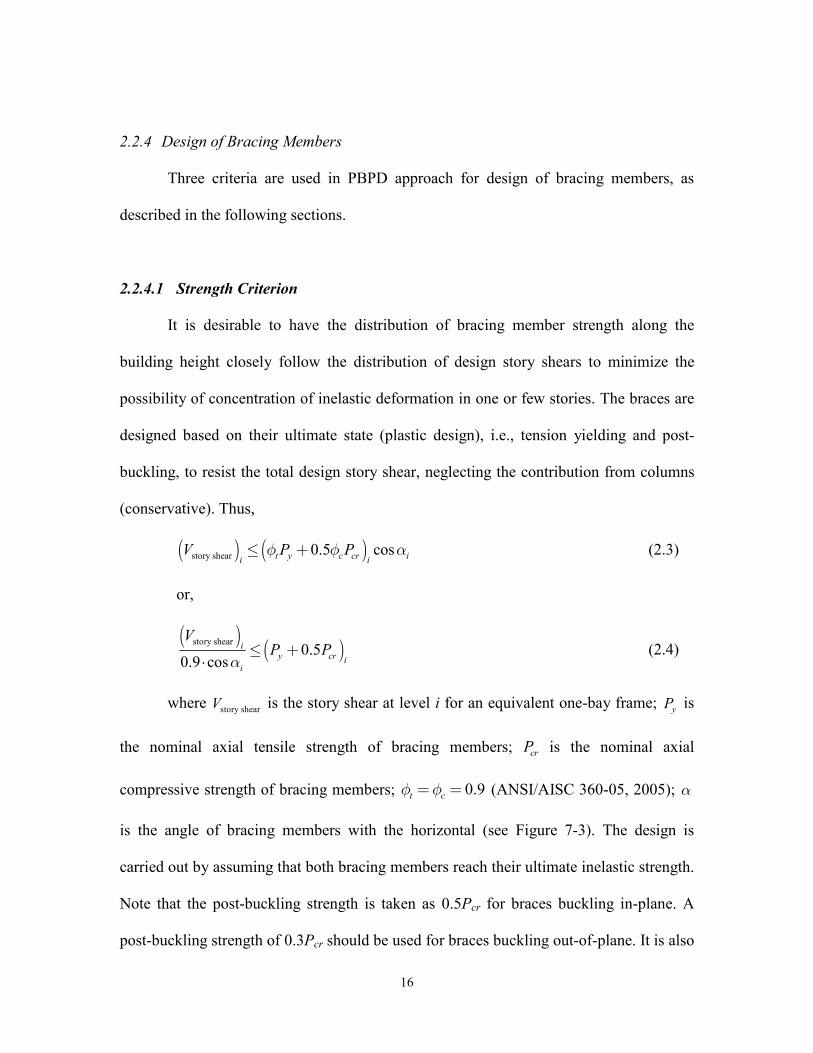
2.2.4 Design of Bracing Members
Three criteria are used in PBPD approach for design of bracing members, as
described in the following sections.
2.2.4.1 Strength Criterion
It is desirable to have the distribution of bracing member strength along the
building height closely follow the distribution of design story shears to minimize the
possibility of concentration of inelastic deformation in one or few stories. The braces are
designed based on their ultimate state (plastic design), i.e., tension yielding and post-
buckling, to resist the total design story shear, neglecting the contribution from columns
(conservative). Thus,
( ) ( )story shear 0.5 cost y c cr ii iV P Pf f a£ +
(2.3)
or,
( ) ( )story shear0.5
0.9 cosi
y cr ii
VP P
a£ +
⋅ (2.4)
where story shearV is the story shear at level i for an equivalent one-bay frame; yP is
the nominal axial tensile strength of bracing members; crP is the nominal axial
compressive strength of bracing members; 0.9t cf f= = (ANSI/AISC 360-05, 2005); a
is the angle of bracing members with the horizontal (see Figure 7-3). The design is
carried out by assuming that both bracing members reach their ultimate inelastic strength.
Note that the post-buckling strength is taken as 0.5Pcr for braces buckling in-plane. A
post-buckling strength of 0.3Pcr should be used for braces buckling out-of-plane. It is also
17
noted that the effective length factor, K, is taken as 0.5 and 0.85 for the in-plane ( xK ) and
out-of-plane ( yK ) directions, respectively (Lee and Goel, 1990). In order to ensure in-
plane buckling, braces are selected such that / /x x y yK L r K L r .
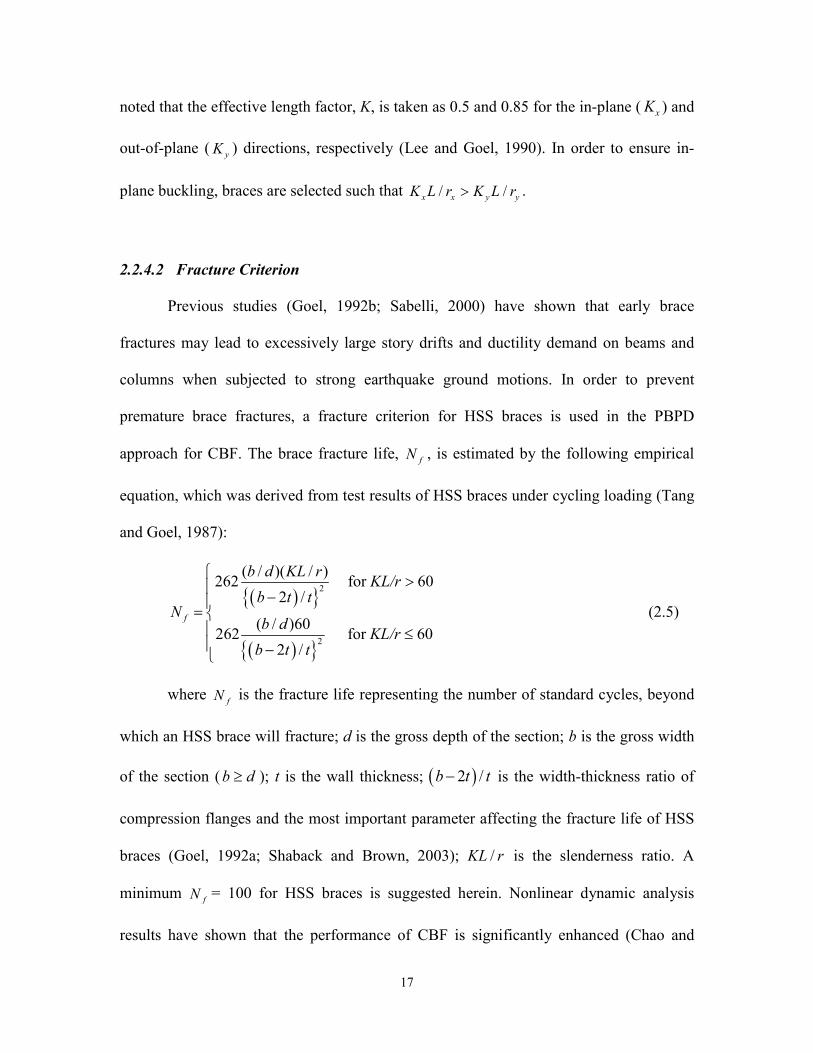
2.2.4.2 Fracture Criterion
Previous studies (Goel, 1992b; Sabelli, 2000) have shown that early brace
fractures may lead to excessively large story drifts and ductility demand on beams and
columns when subjected to strong earthquake ground motions. In order to prevent
premature brace fractures, a fracture criterion for HSS braces is used in the PBPD
approach for CBF. The brace fracture life, fN , is estimated by the following empirical
equation, which was derived from test results of HSS braces under cycling loading (Tang
and Goel, 1987):
2
2
( / )( / )262 for 60
2 /
( / )60262 for 60
2 /
f
b d KL rKL/r
b t tN
b dKL/r
b t t
(2.5)
where is the fracture life representing the number of standard cycles, beyond
which an HSS brace will fracture; d is the gross depth of the section; b is the gross width
of the section (b d ); t is the wall thickness; 2 /b t t is the width-thickness ratio of
compression flanges and the most important parameter affecting the fracture life of HSS
braces (Goel, 1992a; Shaback and Brown, 2003); /KL r is the slenderness ratio. A
minimum = 100 for HSS braces is suggested herein. Nonlinear dynamic analysis
results have shown that the performance of CBF is significantly enhanced (Chao and
fN
fN
18
Goel, 2006b) by using this criterion. Note that current design practice does not consider
the brace fracture life in an explicit manner.
2.2.4.3 Compactness Criterion
The required compactness ratio specified by AISC Seismic Provisions
(ANSI/AISC 341-05, 2005) is also checked for the braces. However, the compactness
requirement is generally satisfied for HSS braces with a minimum = 100.
2.2.5 Design of Non-Yielding Members
The design of non-yielding members, including beams and columns, is performed
based on the capacity design approach. That is, non-yielding members should have
design strengths to resist the combination of factored gravity loads and the forces due to
braces in their ultimate state.
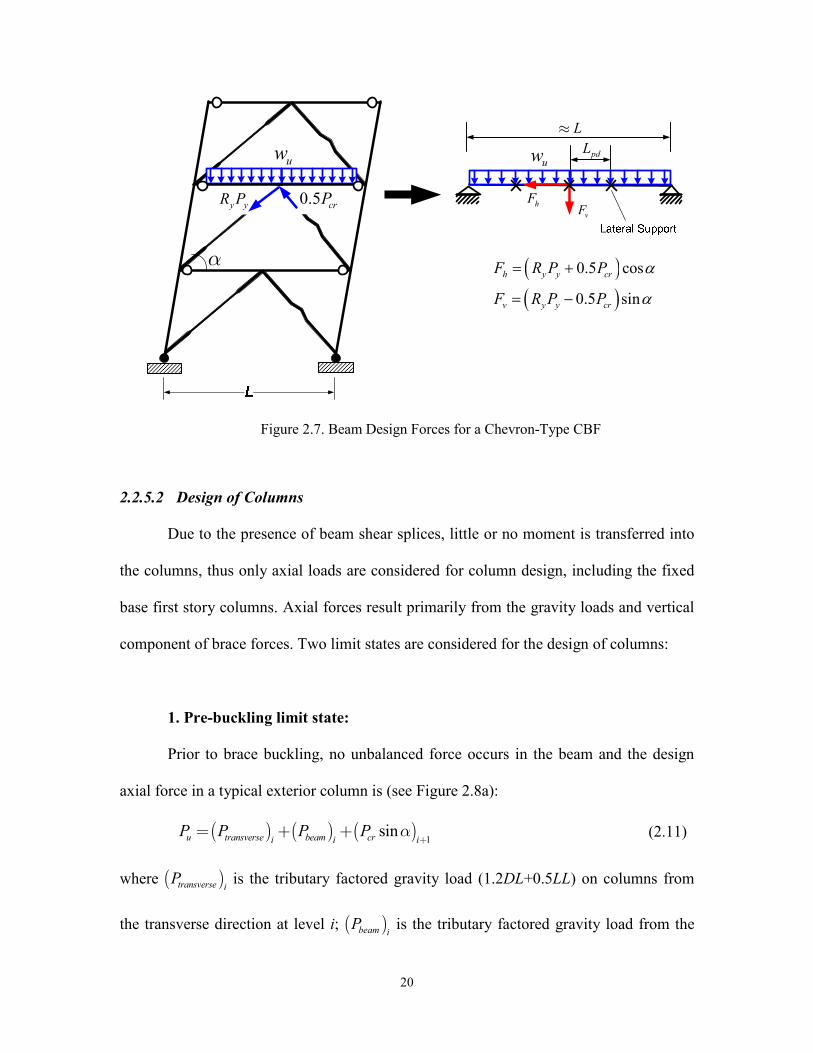
2.2.5.1 Design of Beams
Design of beams follows the criteria given in Section 2.1. It is noted that the post-
buckling strength of a brace is taken as 0.5 crP for in-plane buckling. Beams intersected by
the braces should be designed assuming that no gravity loads are resisted by the braces.
Those beams should also be designed to support vertical and horizontal unbalanced loads
resulting from the force difference in the tension and compression braces as shown in
Figure 2.7. A pin-supported beam model is used because shear splices are used at the
ends. The design of beams should follow the beam-column design requirements due to
the presence of high axial forces. Lateral supports need to be provided at a minimum
fN
19
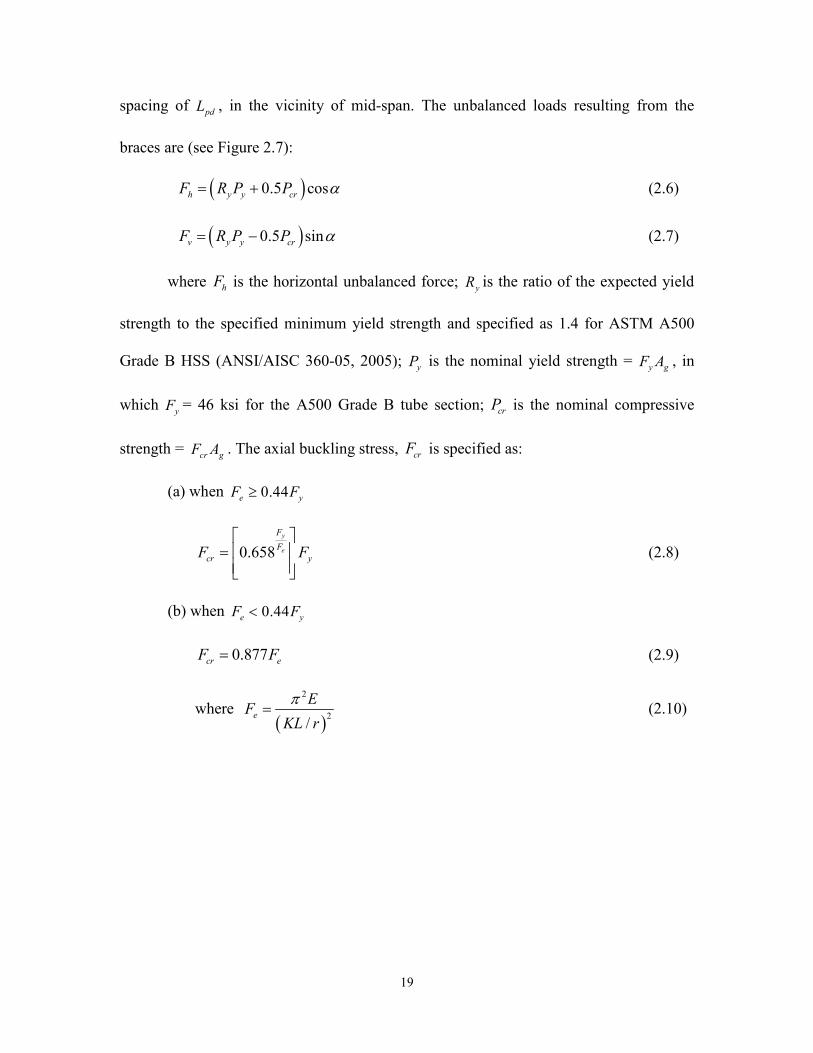
spacing of pdL , in the vicinity of mid-span. The unbalanced loads resulting from the
braces are (see Figure 2.7):
0.5 cosh y y crF R P P (2.6)
0.5 sinv y y crF R P P (2.7)
where hF is the horizontal unbalanced force; yR is the ratio of the expected yield
strength to the specified minimum yield strength and specified as 1.4 for ASTM A500
Grade B HSS (ANSI/AISC 360-05, 2005); yP is the nominal yield strength = y gF A , in
which yF = 46 ksi for the A500 Grade B tube section; crP is the nominal compressive
strength = cr gF A . The axial buckling stress, crF is specified as:
(a) when 0.44e yF F
0.658y
e
F
Fcr yF F
(2.8)
(b) when 0.44e yF F
0.877cr eF F (2.9)
where
2
2/
e
EF
KL r
(2.10)
20
y yR P 0.5 crP
uw
a
L»
uw
0.5 cos
0.5 sin
h y y cr
v y y cr
F R P P
F R P P
hFvF
pdL
Figure 2.7. Beam Design Forces for a Chevron-Type CBF
2.2.5.2 Design of Columns
Due to the presence of beam shear splices, little or no moment is transferred into
the columns, thus only axial loads are considered for column design, including the fixed
base first story columns. Axial forces result primarily from the gravity loads and vertical
component of brace forces. Two limit states are considered for the design of columns:
1. Pre-buckling limit state:
Prior to brace buckling, no unbalanced force occurs in the beam and the design
axial force in a typical exterior column is (see Figure 2.8a):
( ) ( ) ( )1
sinu transverse beam cri i iP P P P a
+= + + (2.11)
where ( )transverse iP is the tributary factored gravity load (1.2DL+0.5LL) on columns from
the transverse direction at level i; ( )beam iP is the tributary factored gravity load from the

21
beam at level i (= ( )12 u i
w L ); ( )1cr i
P+ is the buckling force of brace at i+1 level. Similarly,
for a typical interior column, the axial force demand is determined by (Figure 2.8b):
( ) ( ) ( )1
sinu transverse beam cri i iP P P P a
+= + +å (2.12)
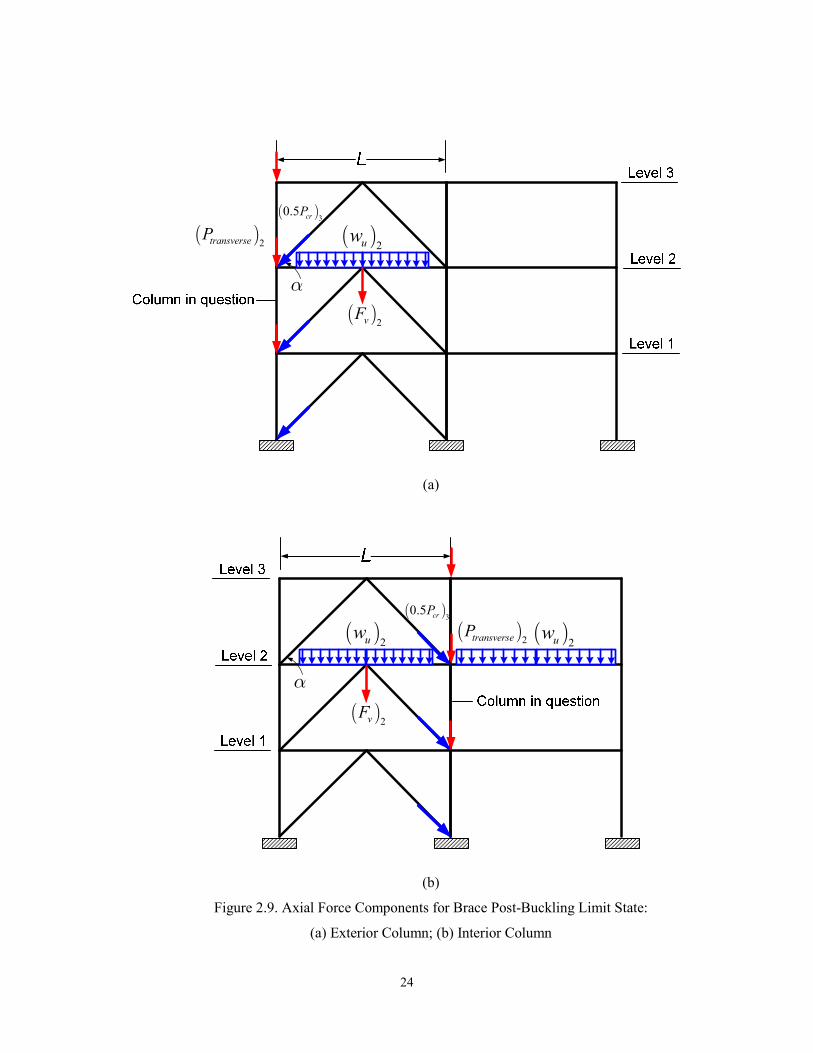
2. Post-buckling limit state:
When a Chevron type CBF reaches its ultimate state, an unbalanced force is
created in the beam (see Figure 2.7) and the axial force demand in a typical exterior
column cab be determined by (see Figure 2.9a):
( ) ( ) ( )1
10.5 sin
2u transverse beam cr vi i iP P P P Fa
+= + + + (2.13)
where ( )transverse iP is the tributary factored gravity load (1.2DL+0.5LL) from the transverse
direction at level i; is the tributary factored gravity load from beam at level i (=
); ( )1
0.5 cr iP
+ is the post-buckling force of brace at i+1 level; vF is the vertical
unbalanced force.
Similarly, the axial force demand for a typical interior column is (Figure 2.9b):
( ) ( ) ( )1
10.5 sin
2u transverse beam cr vi i iP P P P Fa
+= + + +å (2.14)
( )beam iP
( )12 u i
w L

22
a
( )3crP( )
2uw( )2transverseP
(a)
a
( )3crP
( )2uw ( )
2uw( )2transverseP
(b)
Figure 2.8. Axial Force Components for Brace Pre-Buckling Limit State:
(a) Exterior Column; (b) Interior Column
23
The design axial force demand is then determined by the governing pre-buckling
or post-buckling limit state. It is noted that the above approach assumes that all braces
reach their limit states simultaneously. This may be somewhat conservative for design of
lower level columns, especially for high-rise buildings. In that case, the maximum
probable axial force can be estimated by a more rational method, such as square root of
the sum of squares method (SRSS, e.g. Redwood and Channagiri, 1991). Further research
is needed on this issue of column design forces, especially in high-rise structures.
Column design is done by using Equations (2.8) to (2.10), with the effective
length factor K = 1.0 (ANSI/AISC 360-05, 2005). Current AISC Seismic Provisions
(ANSI/AISC 341-05, 2005) require that the compactness of columns in CBF meet the
seismic width-thickness ratios given in the Provisions (e.g. 0.30 yb t E F/ ). This is
supported by findings from previous studies (e.g. Sabelli et al., 2003), that columns in
CBF can experience significant inelastic rotations. However, in CBF designed by PBPD
approach, brace fractures are practically eliminated (especially for 10% in 50 years
earthquake motions) by keeping the interstory drifts well within carefully selected limits.
In addition, moments transferred to the columns are minimized by using the beam shear
splices. Therefore, columns in CBF design by PBPD are expected to remain essentially
free of bending. Yielding at the column bases may occur under severe ground motions
but is generally quite limited. Therefore, the above mentioned b/t limitation is used for
the first-level column only; whereas the limitation of 0.38 yE F as specified in the
AISC Specification (ANSI/AISC 360-05, 2005c) is used for columns at all the other
levels.
24
a
( )3
0.5 crP
( )2uw
( )2vF
( )2transverseP
(a)
a
( )2uw ( )
2uw( )
30.5 crP
( )2vF
( )2transverseP
(b)
Figure 2.9. Axial Force Components for Brace Post-Buckling Limit State:
(a) Exterior Column; (b) Interior Column
25
2.3 Design Examples
Two Chevron type CBF, one with 3 stories and the other with 6 stories, were
designed by using the PBPD procedure. These two frames were originally designed as
SCBF according to current practice (Sabelli, 2000). Plan views of the example 3- and 6-
story structures are shown in Figures 2.10 and 2.11, respectively. The 3-story structure is
120 ft by 180 ft in plan, and 39 ft in elevation. The floor-to-floor height is 13 ft for all
three levels. The bays are 30 ft on centers, in both directions, with six and four bays in
the two directions. The building’s lateral force resisting system is comprised of two
perimeter CBF bays in each direction. The interior frames of the structure consist of
simple framing with composite floors.
The 6-story structure is 150 ft by 150 ft in plan, and 83 ft in height. The floor-to-
floor heights are 13 ft for the first level and 18 ft for all the other levels. The bays are 30
ft on centers, in both directions, with five bays in each direction. The building’s lateral
force resisting system is comprised of three perimeter CBF bays in each direction. The
interior frames of the structure consist of simple framing with composite floors.
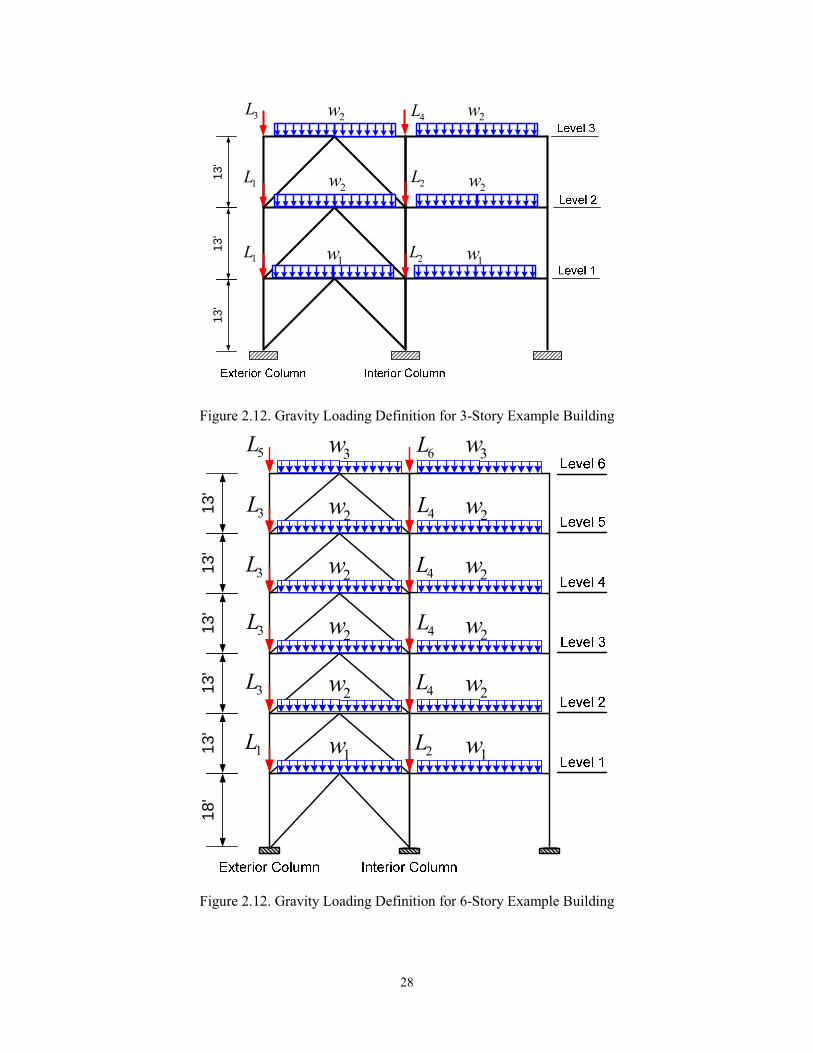
The details of design weights of the building components can be found elsewhere
(Sabelli, 2000). The calculated factored gravity loads (1.2DL+0.5LL) for the 3- and 6-
story perimeter frames are shown in Figures 2.12 and 2.13, respectively, (with only two
bays shown). The gravity loading is as follows:
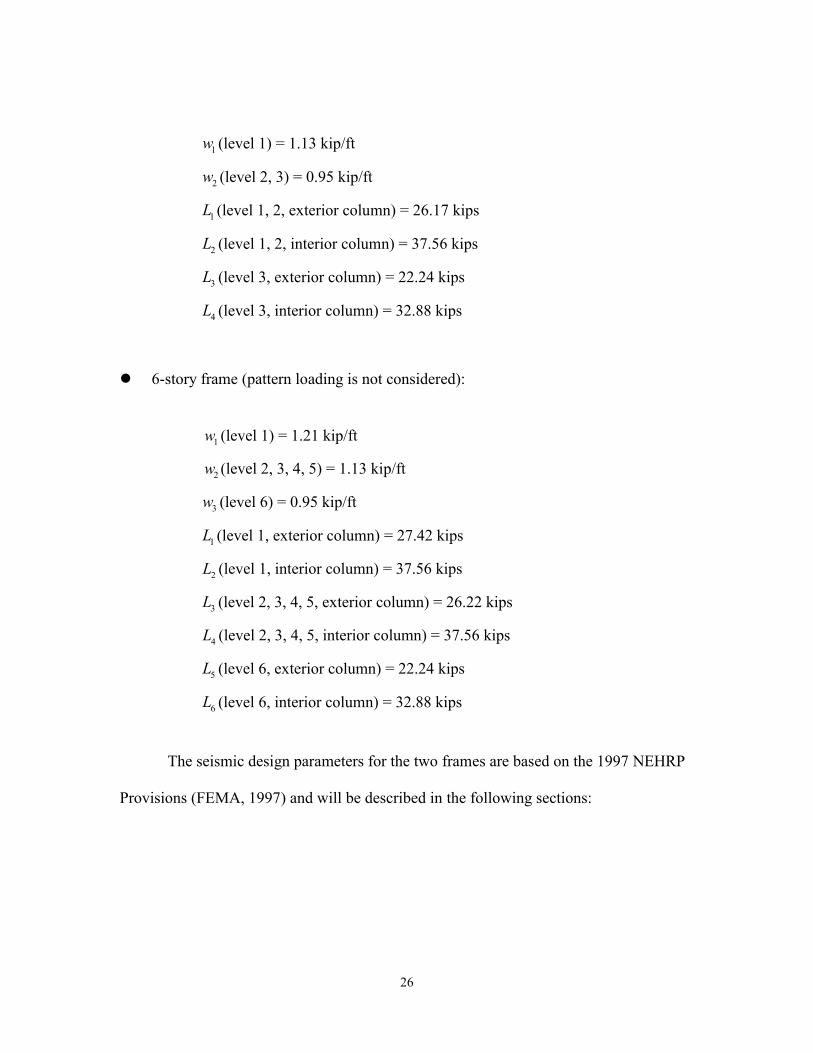
3-story frame (pattern loading is not considered):
26
1w (level 1) = 1.13 kip/ft
2w (level 2, 3) = 0.95 kip/ft
1L (level 1, 2, exterior column) = 26.17 kips
2L (level 1, 2, interior column) = 37.56 kips
3L (level 3, exterior column) = 22.24 kips
4L (level 3, interior column) = 32.88 kips
6-story frame (pattern loading is not considered):
(level 1) = 1.21 kip/ft
(level 2, 3, 4, 5) = 1.13 kip/ft
3w (level 6) = 0.95 kip/ft
1L (level 1, exterior column) = 27.42 kips
(level 1, interior column) = 37.56 kips
3L (level 2, 3, 4, 5, exterior column) = 26.22 kips
(level 2, 3, 4, 5, interior column) = 37.56 kips
5L (level 6, exterior column) = 22.24 kips
6L (level 6, interior column) = 32.88 kips
The seismic design parameters for the two frames are based on the 1997 NEHRP
Provisions (FEMA, 1997) and will be described in the following sections:
1w
2w
2L
4L

27
Figure 2.10. Plan View of 3-Story Example Building
Figure 2.11. Plan View of 6-Story Example Building
28
1w
2w
2w
1L1L
1L
3L
2L
2L
4L
1w
2w
2w
13'
13
'1
3'
Figure 2.12. Gravity Loading Definition for 3-Story Example Building
18'
13'
13'
13'
13'
13'
1L
3L
3L
3L
3L
5L
2L
4L
4L
4L
4L
6L
1w
2w
2w
2w
2w
3w
1w
2w
2w
2w
2w
3w
Figure 2.12. Gravity Loading Definition for 6-Story Example Building

29
2.3.1 Design of 3-story CBF
2.3.1.1 Design Base Shear and Lateral Force Distribution
Design parameters according to 1997 NEHRP Provisions (FEMA, 1997) for the
3-story CBF are listed in Table 2.1.
Table 2.1. Design parameters for the 3-story CBF according to 1997 NEHRP
Parameters 3-story CBF
MCE Short Period Spectral Response Acc., SS 2.09 g
MCE One-Second Spectral Response Acc., 1S 0.77 g
Acceleration Site Coefficient, aF 1.0
Velocity Site Coefficient, vF 1.5
Short Period Design Spectral Response Acc., DSS 1.393 g
One-Second Design Spectral Response Acc., 1DS 0.77 g
Site Class D (Deep Stiff Soil)
Occupancy Importance Factor I = 1.0
Seismic Design Category D
Building Height 130 ft (above the base)
Approximate Building Period, T 0.31 sec.
Response Modification Factor R = 6
Total Building Weight, W 6503 kips
Seismic Response Coefficient, s
VC
W= 0.232 g
The target drift is selected based on intended structural performance. For
example, FEMA 356 (FEMA, 2000) specifies a Basic Safety Objective (BSO), which
requires structures to meet the Life Safety Performance Level under 10%/50 year
earthquake hazard level. For steel braced frames, the criteria are that the maximum
transient and the permanent story drifts should be smaller than 1.5% and 0.5%,
30
respectively. For the two design examples a slightly strict target, 1.25% maximum story
drift for 10%/50 year (2/3MCE) hazard, was selected.
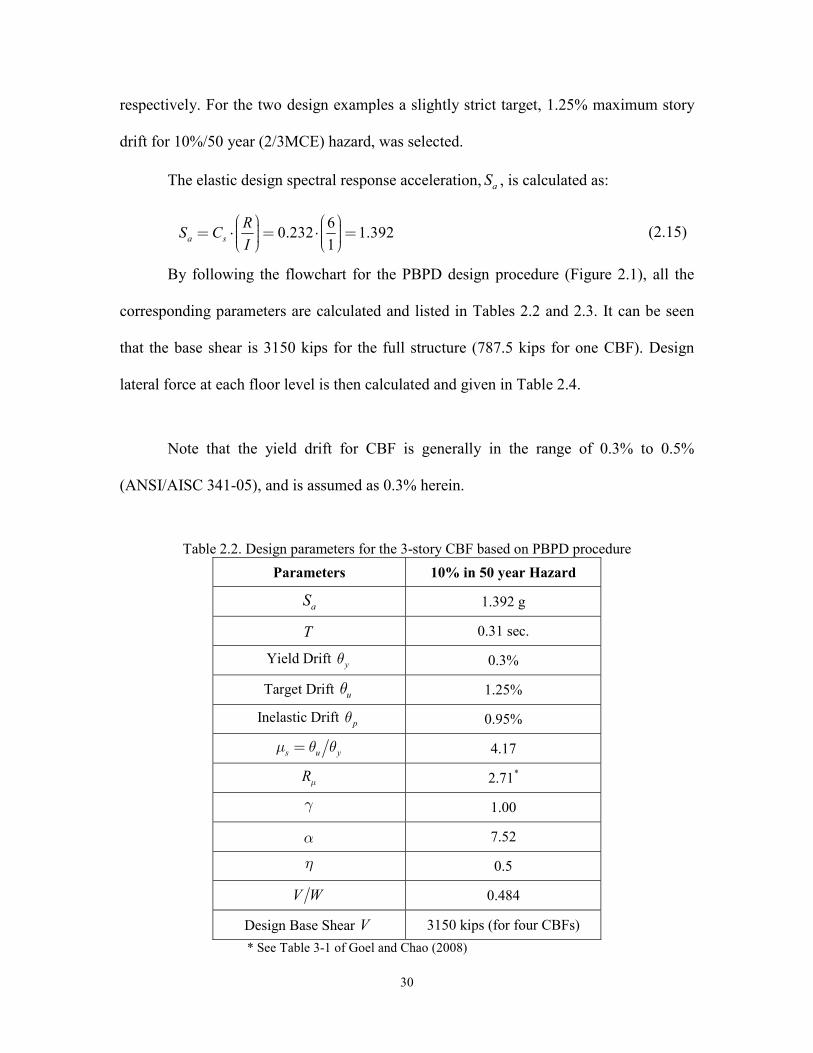
The elastic design spectral response acceleration, aS , is calculated as:
60.232 1.392
1a s
RS C
I
æ ö æ ö÷ ÷ç ç= ⋅ = ⋅ =÷ ÷ç ç÷ ÷ç çè ø è ø (2.15)
By following the flowchart for the PBPD design procedure (Figure 2.1), all the
corresponding parameters are calculated and listed in Tables 2.2 and 2.3. It can be seen
that the base shear is 3150 kips for the full structure (787.5 kips for one CBF). Design
lateral force at each floor level is then calculated and given in Table 2.4.
Note that the yield drift for CBF is generally in the range of 0.3% to 0.5%
(ANSI/AISC 341-05), and is assumed as 0.3% herein.
Table 2.2. Design parameters for the 3-story CBF based on PBPD procedure
Parameters 10% in 50 year Hazard
aS 1.392 g
T 0.31 sec.
Yield Drift yq 0.3%
Target Drift uq 1.25%
Inelastic Drift pq 0.95%
s u ym q q= 4.17
Rm 2.71*
g 1.00
a 7.52
h 0.5
V W 0.484
Design Base Shear V 3150 kips (for four CBFs)
* See Table 3-1 of Goel and Chao (2008)
31
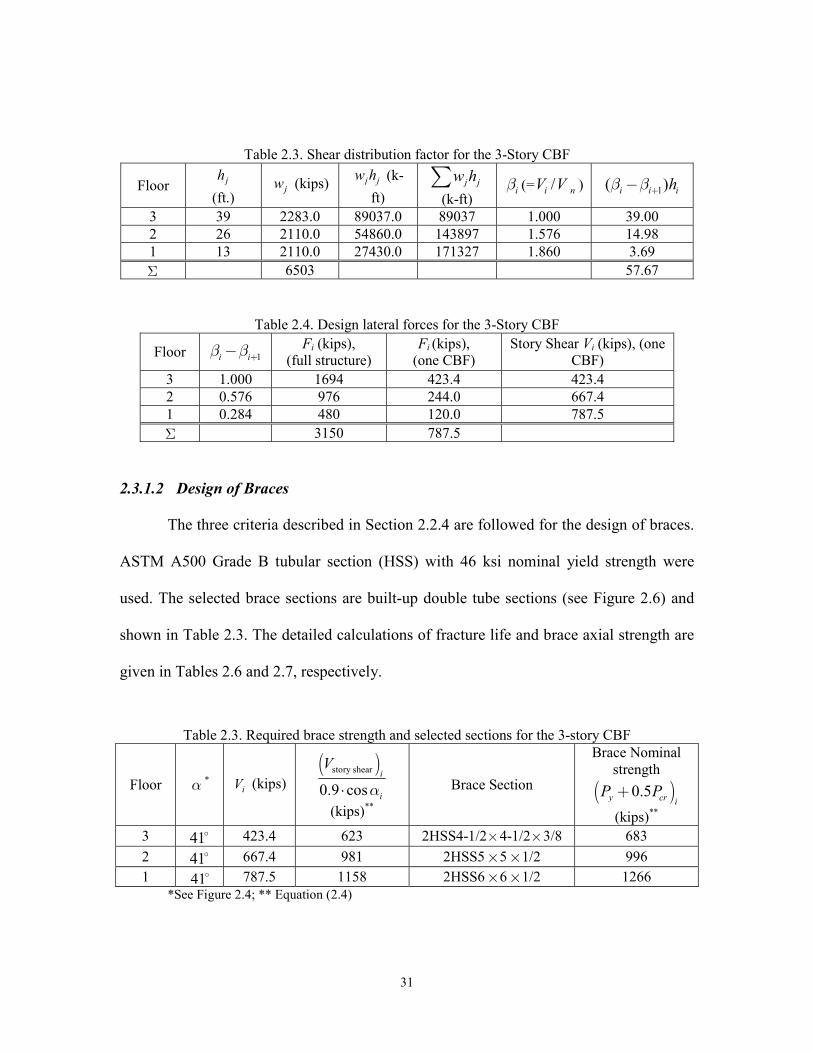
Table 2.3. Shear distribution factor for the 3-Story CBF
Floor jh
(ft.) jw (kips) j jw h (k-
ft) j jw hå
(k-ft) ib (= /i nV V ) 1( )i i ihb b +-
3 39 2283.0 89037.0 89037 1.000 39.00 2 26 2110.0 54860.0 143897 1.576 14.98 1 13 2110.0 27430.0 171327 1.860 3.69 S 6503 57.67
Table 2.4. Design lateral forces for the 3-Story CBF
Floor 1i ib b +-
Fi (kips), (full structure)
Fi (kips), (one CBF)
Story Shear Vi (kips), (one CBF)
3 1.000 1694 423.4 423.4 2 0.576 976 244.0 667.4 1 0.284 480 120.0 787.5
3150 787.5
2.3.1.2 Design of Braces
The three criteria described in Section 2.2.4 are followed for the design of braces.
ASTM A500 Grade B tubular section (HSS) with 46 ksi nominal yield strength were
used. The selected brace sections are built-up double tube sections (see Figure 2.6) and
shown in Table 2.3. The detailed calculations of fracture life and brace axial strength are
given in Tables 2.6 and 2.7, respectively.
Table 2.3. Required brace strength and selected sections for the 3-story CBF
Floor a *
(kips)
( )story shear
0.9 cosi
i
V
a⋅
(kips)**
Brace Section
Brace Nominal strength
( )0.5y cr iP P+
(kips)**
3 41 423.4 623 2HSS4-1/2´4-1/2´3/8 683
2 41 667.4 981 2HSS5 5 1/2 996 1 787.5 1158 2HSS6 6 1/2 1266
*See Figure 2.4; ** Equation (2.4)
S
iV
´ ´41 ´ ´
32
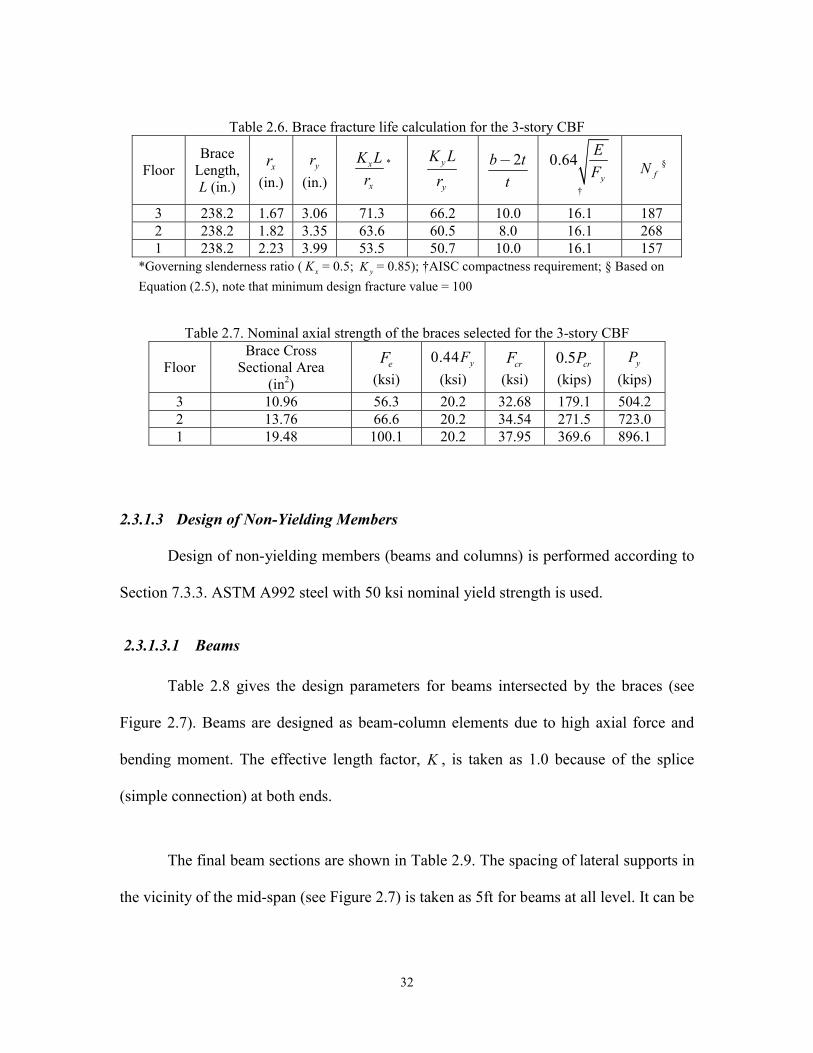
Table 2.6. Brace fracture life calculation for the 3-story CBF
Floor Brace
Length, L (in.)
xr
(in.) yr
(in.)
x
x
K L
r* y
y
K L
r
2b t
t
- 0.64y
E
F†
fN §
3 238.2 1.67 3.06 71.3 66.2 10.0 16.1 187 2 238.2 1.82 3.35 63.6 60.5 8.0 16.1 268 1 238.2 2.23 3.99 53.5 50.7 10.0 16.1 157
*Governing slenderness ratio ( xK = 0.5; yK = 0.85); †AISC compactness requirement; § Based on
Equation (2.5), note that minimum design fracture value = 100
Table 2.7. Nominal axial strength of the braces selected for the 3-story CBF
Floor Brace Cross
Sectional Area (in2)
eF
(ksi) 0.44 yF
(ksi) crF
(ksi)
0.5 crP
(kips) yP
(kips) 3 10.96 56.3 20.2 32.68 179.1 504.2 2 13.76 66.6 20.2 34.54 271.5 723.0 1 19.48 100.1 20.2 37.95 369.6 896.1
2.3.1.3 Design of Non-Yielding Members
Design of non-yielding members (beams and columns) is performed according to
Section 7.3.3. ASTM A992 steel with 50 ksi nominal yield strength is used.
2.3.1.3.1 Beams
Table 2.8 gives the design parameters for beams intersected by the braces (see
Figure 2.7). Beams are designed as beam-column elements due to high axial force and
bending moment. The effective length factor, K , is taken as 1.0 because of the splice
(simple connection) at both ends.
The final beam sections are shown in Table 2.9. The spacing of lateral supports in
the vicinity of the mid-span (see Figure 2.7) is taken as 5ft for beams at all level. It can be
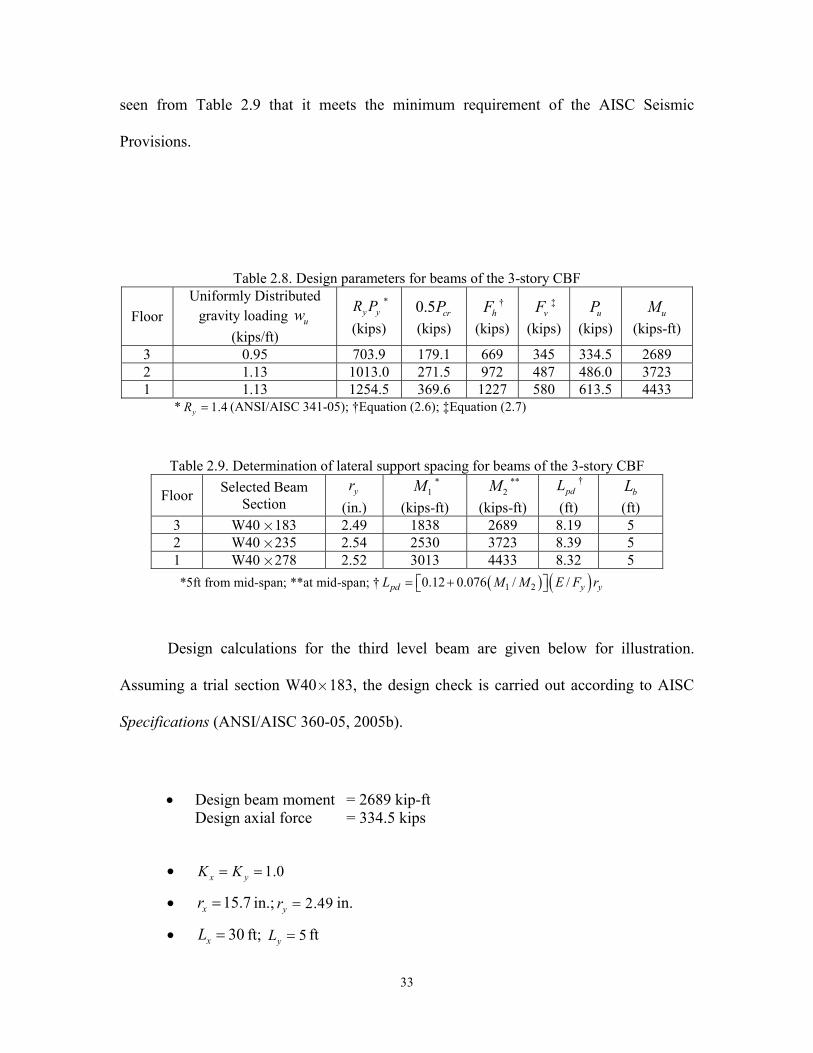
33
seen from Table 2.9 that it meets the minimum requirement of the AISC Seismic
Provisions.
Table 2.8. Design parameters for beams of the 3-story CBF
Floor
Uniformly Distributed gravity loading uw
(kips/ft)
y yR P *
(kips)
0.5 crP
(kips) hF †
(kips) vF ‡
(kips) uP
(kips) uM
(kips-ft)
3 0.95 703.9 179.1 669 345 334.5 2689 2 1.13 1013.0 271.5 972 487 486.0 3723 1 1.13 1254.5 369.6 1227 580 613.5 4433
* 1.4yR (ANSI/AISC 341-05); †Equation (2.6); ‡Equation (2.7)
Table 2.9. Determination of lateral support spacing for beams of the 3-story CBF
Floor Selected Beam
Section yr
(in.) 1M *
(kips-ft)2M **
(kips-ft) pdL †
(ft) bL
(ft) 3 W40 183 2.49 1838 2689 8.19 5 2 W40 235 2.54 2530 3723 8.39 5 1 W40 278 2.52 3013 4433 8.32 5
*5ft from mid-span; **at mid-span; † 1 20.12 0.076 / /pd y yL M M E F r
Design calculations for the third level beam are given below for illustration.
Assuming a trial section W40´183, the design check is carried out according to AISC
Specifications (ANSI/AISC 360-05, 2005b).
Design beam moment = 2689 kip-ft Design axial force = 334.5 kips
1.0x yK K
15.7xr in.; 2.49yr in.
30xL ft; 5yL ft
´´´

34
/ 22.93 / 24.10x x x y y yK L r K L r => The minor axis controls crc F .
/ 24.1 4.71 / 4.71 29,000 / 50 113.4y y y yK L r E F
0.658 47.92y
e
F
Fcr yF F
ksi (2.16)
The compressive strength is:
2299c n c cr gP F A kips ( c = 0.9, Ag = 53.3 in2.)
The flexural strength is:
2903b n b pM M kip-ft
For / 0.15 0.2u c nP P , the member strength must satisfy:
1.02
u ux
c n nx
P M
P M
(2.17)
where 1ux ntM B M
1
1
11
m
u
e
CB
P
P
(2.18)
2
1 2
1
e
EIP
K L
= 26274 kips (2.19)
where mC is conservatively taken as 1.0 for beam-columns subjected to transverse
loading; 1K is the effective length factor in the plane of bending = 1.0.
Hence:
1
1.01.01
334.51
26274
B
35
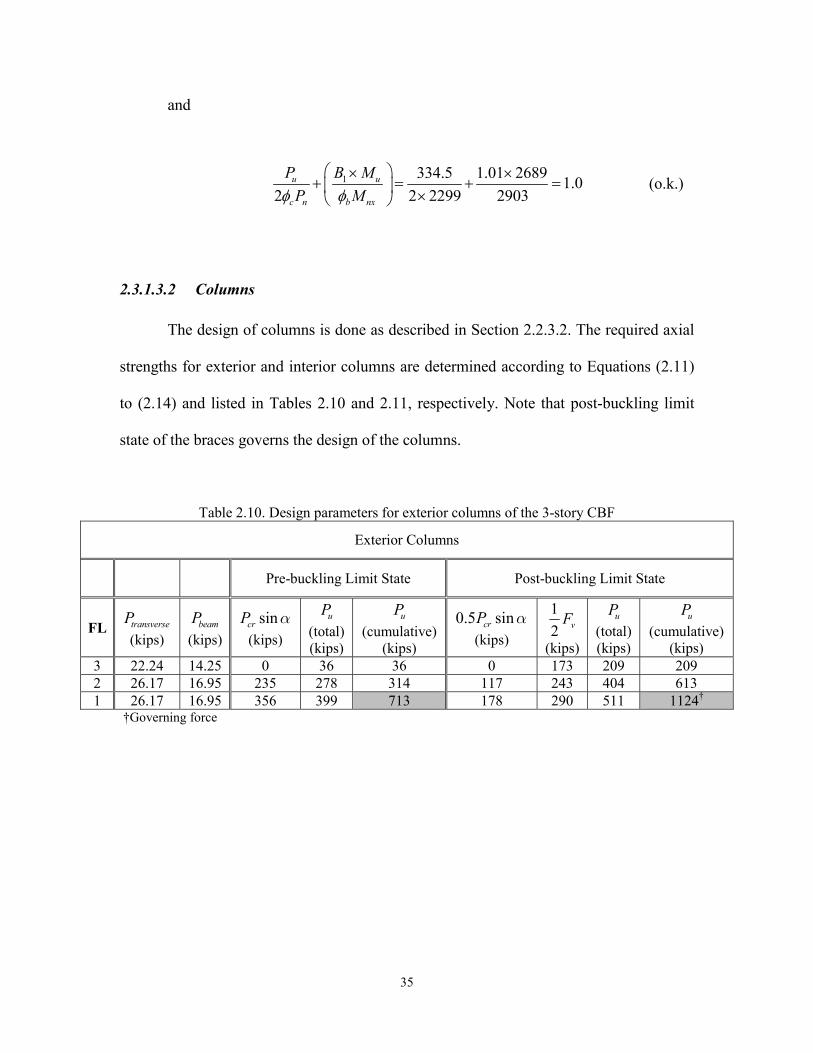
and
1 334.5 1.01 26891.0
2 2 2299 2903u u
c n b nx
P B M
P M
(o.k.)
2.3.1.3.2 Columns
The design of columns is done as described in Section 2.2.3.2. The required axial
strengths for exterior and interior columns are determined according to Equations (2.11)
to (2.14) and listed in Tables 2.10 and 2.11, respectively. Note that post-buckling limit
state of the braces governs the design of the columns.
Table 2.10. Design parameters for exterior columns of the 3-story CBF
Exterior Columns
Pre-buckling Limit State Post-buckling Limit State
FL transverseP
(kips) beamP
(kips)
sincrP a
(kips)
uP
(total) (kips)
uP
(cumulative) (kips)
0.5 sincrP a
(kips)
1
2 vF
(kips)
(total) (kips)
(cumulative) (kips)
3 22.24 14.25 0 36 36 0 173 209 209 2 26.17 16.95 235 278 314 117 243 404 613 1 26.17 16.95 356 399 713 178 290 511 1124†
†Governing force
uP uP

36
Table 2.11. Design parameters for interior columns of the 3-story CBF
Interior Columns
Pre-buckling Limit State Post-buckling Limit State
FL transverseP
(kips)
(kips)
(kips)
(total) (kips)
(cumulative) (kips)
(kips)
(kips)
(total) (kips)
(cumulative) (kips)
3 32.88 28.5 0 61 61 0 173 234 234 2 37.56 33.9 235 306 367 117 243 432 666 1 37.56 33.9 356 427 795 178 290 539 1205†
†Governing force
As mentioned in Section 2.2.3.2, only axial forces are considered for column
design. For this example, the same section is used in all stories. That is, the maximum
axial force (1205 kips) is used and it leads to a column section of W12 120 (axial
strength = 1325 kips). The width-thickness ratio of the selected column section also
meets the compactness requirement. The final member sections for the 3-story CBF are
shown in Figures 2.14. Note that beam sizes are governed by span length and unbalanced
forces from the braces.
Figure 2.14. Member Sections for 3-Story CBF Designed by PBPD
beamP sincrP a uP uP 0.5 sincrP a 1
2 vF uP uP
´
37
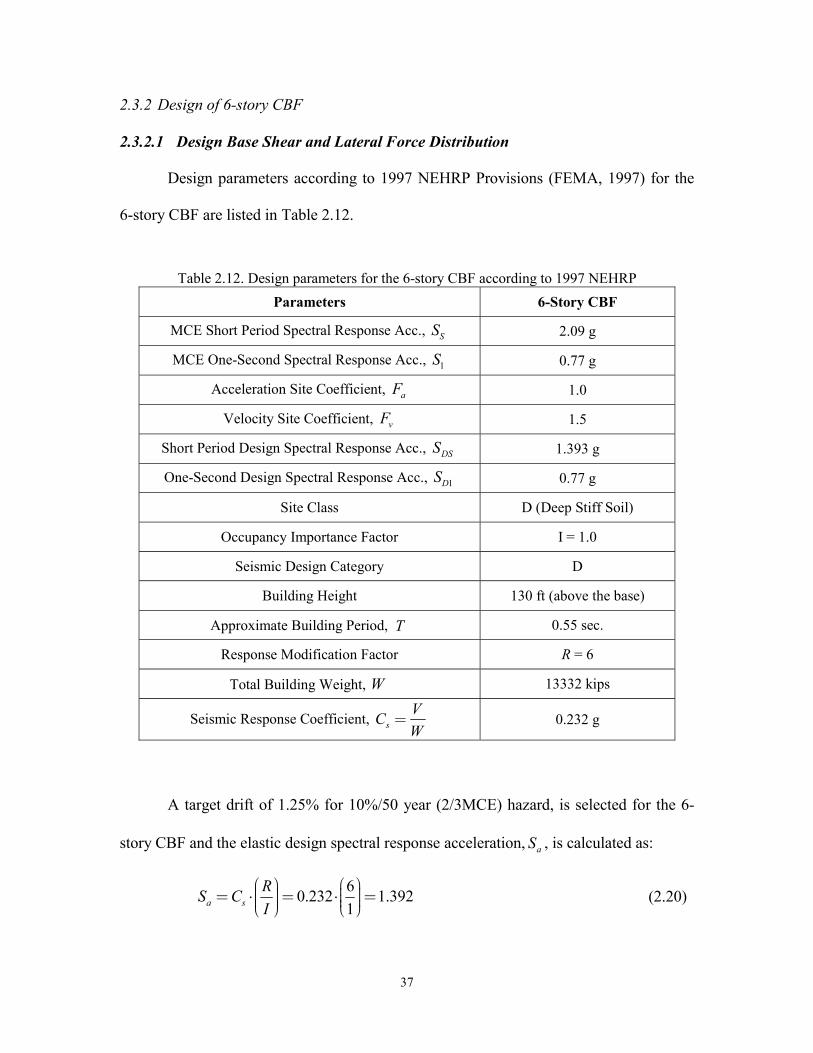
2.3.2 Design of 6-story CBF
2.3.2.1 Design Base Shear and Lateral Force Distribution
Design parameters according to 1997 NEHRP Provisions (FEMA, 1997) for the
6-story CBF are listed in Table 2.12.
Table 2.12. Design parameters for the 6-story CBF according to 1997 NEHRP
Parameters 6-Story CBF
MCE Short Period Spectral Response Acc., 2.09 g
MCE One-Second Spectral Response Acc., 0.77 g
Acceleration Site Coefficient, 1.0
Velocity Site Coefficient, 1.5
Short Period Design Spectral Response Acc., 1.393 g
One-Second Design Spectral Response Acc., 0.77 g
Site Class D (Deep Stiff Soil)
Occupancy Importance Factor I = 1.0
Seismic Design Category D
Building Height 130 ft (above the base)
Approximate Building Period, 0.55 sec.
Response Modification Factor R = 6
Total Building Weight, 13332 kips
Seismic Response Coefficient, 0.232 g
A target drift of 1.25% for 10%/50 year (2/3MCE) hazard, is selected for the 6-
story CBF and the elastic design spectral response acceleration, , is calculated as:
(2.20)
SS
1S
aF
vF
DSS
1DS
T
W
s
VC
W=
aS
60.232 1.392
1a s
RS C
I
æ ö æ ö÷ ÷ç ç= ⋅ = ⋅ =÷ ÷ç ç÷ ÷ç çè ø è ø
38
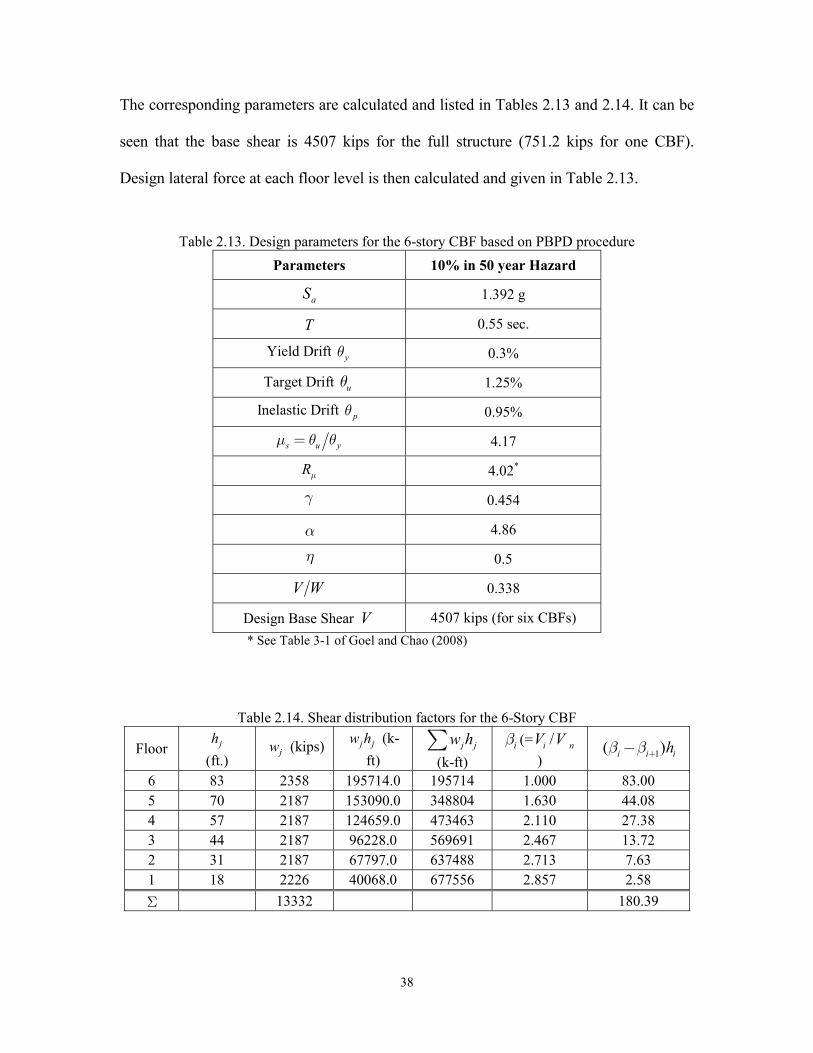
The corresponding parameters are calculated and listed in Tables 2.13 and 2.14. It can be
seen that the base shear is 4507 kips for the full structure (751.2 kips for one CBF).
Design lateral force at each floor level is then calculated and given in Table 2.13.
Table 2.13. Design parameters for the 6-story CBF based on PBPD procedure
Parameters 10% in 50 year Hazard
1.392 g
0.55 sec.
Yield Drift 0.3%
Target Drift 1.25%
Inelastic Drift 0.95%
4.17
4.02*
0.454
4.86
0.5
0.338
Design Base Shear 4507 kips (for six CBFs)
* See Table 3-1 of Goel and Chao (2008)
Table 2.14. Shear distribution factors for the 6-Story CBF
Floor
(ft.) (kips)
(k-
ft)
(k-ft)
(=
)
6 83 2358 195714.0 195714 1.000 83.00 5 70 2187 153090.0 348804 1.630 44.08 4 57 2187 124659.0 473463 2.110 27.38 3 44 2187 96228.0 569691 2.467 13.72 2 31 2187 67797.0 637488 2.713 7.63 1 18 2226 40068.0 677556 2.857 2.58
13332 180.39
aS
T
yq
uq
pq
s u ym q q=
Rm
g
ah
V W
V
jhjw j jw h
j jw hå ib /i nV V1( )i i ihb b +-
S
39
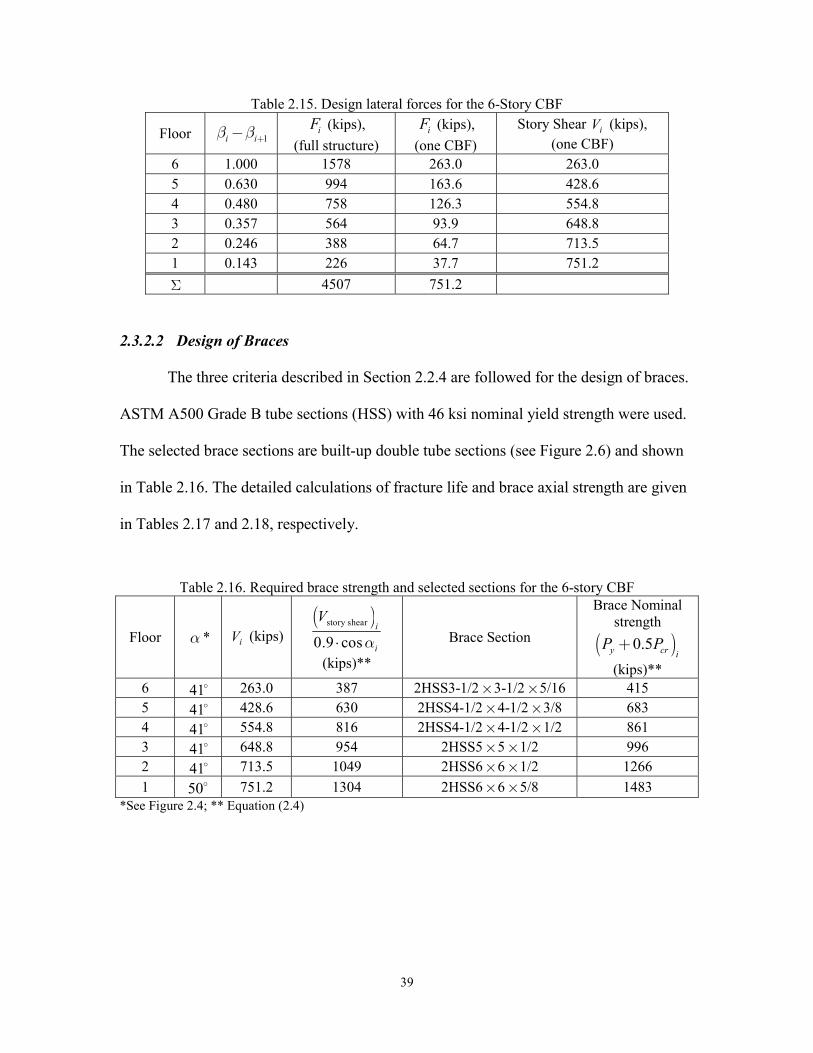
Table 2.15. Design lateral forces for the 6-Story CBF
Floor (kips),
(full structure)
(kips),
(one CBF)
Story Shear (kips), (one CBF)
6 1.000 1578 263.0 263.0 5 0.630 994 163.6 428.6 4 0.480 758 126.3 554.8 3 0.357 564 93.9 648.8 2 0.246 388 64.7 713.5 1 0.143 226 37.7 751.2
4507 751.2
2.3.2.2 Design of Braces
The three criteria described in Section 2.2.4 are followed for the design of braces.
ASTM A500 Grade B tube sections (HSS) with 46 ksi nominal yield strength were used.
The selected brace sections are built-up double tube sections (see Figure 2.6) and shown
in Table 2.16. The detailed calculations of fracture life and brace axial strength are given
in Tables 2.17 and 2.18, respectively.
Table 2.16. Required brace strength and selected sections for the 6-story CBF
Floor *
(kips)
(kips)**
Brace Section
Brace Nominal strength
(kips)**6 263.0 387 2HSS3-1/2 3-1/2 5/16 415 5 428.6 630 2HSS4-1/2 4-1/2 3/8 683 4 554.8 816 2HSS4-1/2 4-1/2 1/2 861 3 648.8 954 2HSS5 5 1/2 996 2 713.5 1049 2HSS6 6 1/2 1266
1 50 751.2 1304 2HSS6 6 5/8 1483 *See Figure 2.4; ** Equation (2.4)
1i ib b +- iF iF iV
S
a iV( )story shear
0.9 cosi
i
V
a⋅ ( )0.5y cr iP P+
41 ´ ´41 ´ ´41 ´ ´41 ´ ´41 ´ ´
´ ´
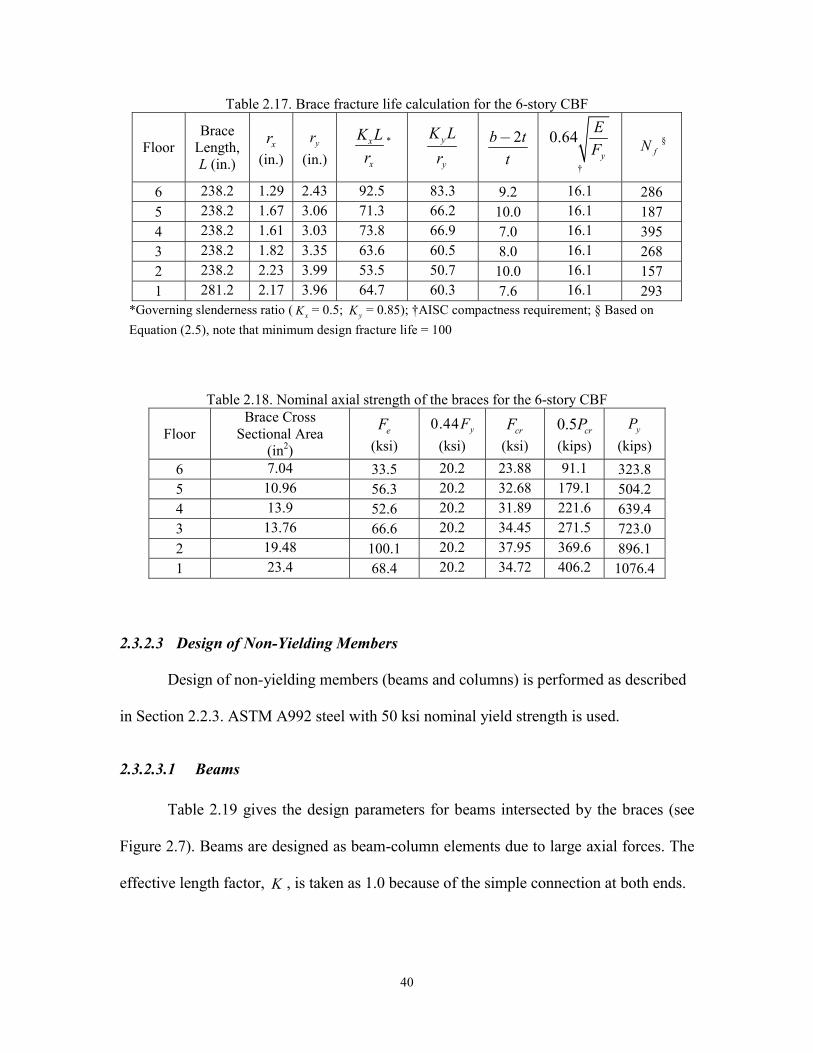
40
Table 2.17. Brace fracture life calculation for the 6-story CBF
Floor Brace
Length, L (in.)
(in.)
(in.)
*
†
§
6 238.2 1.29 2.43 92.5 83.3 9.2 16.1 286 5 238.2 1.67 3.06 71.3 66.2 10.0 16.1 187 4 238.2 1.61 3.03 73.8 66.9 7.0 16.1 395 3 238.2 1.82 3.35 63.6 60.5 8.0 16.1 268 2 238.2 2.23 3.99 53.5 50.7 10.0 16.1 157 1 281.2 2.17 3.96 64.7 60.3 7.6 16.1 293
*Governing slenderness ratio ( = 0.5; = 0.85); †AISC compactness requirement; § Based on
Equation (2.5), note that minimum design fracture life = 100
Table 2.18. Nominal axial strength of the braces for the 6-story CBF
Floor Brace Cross
Sectional Area (in2)
(ksi)
(ksi)
(ksi)
(kips)
(kips) 6 7.04 33.5 20.2 23.88 91.1 323.8 5 10.96 56.3 20.2 32.68 179.1 504.2 4 13.9 52.6 20.2 31.89 221.6 639.4 3 13.76 66.6 20.2 34.45 271.5 723.0 2 19.48 100.1 20.2 37.95 369.6 896.1 1 23.4 68.4 20.2 34.72 406.2 1076.4
2.3.2.3 Design of Non-Yielding Members
Design of non-yielding members (beams and columns) is performed as described
in Section 2.2.3. ASTM A992 steel with 50 ksi nominal yield strength is used.
2.3.2.3.1 Beams
Table 2.19 gives the design parameters for beams intersected by the braces (see
Figure 2.7). Beams are designed as beam-column elements due to large axial forces. The
effective length factor, , is taken as 1.0 because of the simple connection at both ends.
xr yr x
x
K L
ry
y
K L
r2b t
t
- 0.64y
E
F fN
xK yK
eF 0.44 yF crF 0.5 crP yP
K

41
The final beam sections are shown in Table 2.20. The spacing of lateral supports
in the vicinity of the mid-span (see Figure 2.7) is taken as 5ft for beams at all level. It can
be seen from Table 2.20 that it meets the minimum requirement of the AISC Seismic
Provisions.
Table 2.19. Design parameters for beams of the 6-story CBF
Floor
Uniformly Distributed gravity loading
(kips/ft)
*
(kips)
(kips)
†
(kips)
‡
(kips)
(kips)
(kips-ft)
6 0.95 453.3 91.1 411 237 203.5 1866 5 1.13 703.9 179.1 669 345 334.5 2689 4 1.13 893.2 221.6 844 441 422.0 3401 3 1.13 1013.0 271.5 972 487 486.0 3743 2 1.13 1254.5 369.6 1227 580 613.5 4433 1 1.21 1507.0 406.2 1225 846 612.5 6408
* (ANSI/AISC 341-05); †Equation (2.6); ‡Equation (2.7)
Table 2.20. Determination of lateral support spacing for beams of the 6-story CBF
Floor Selected Beam
Section
(in.)
*
(kips-ft)
**
(kips-ft)
†
(ft)
(ft) 6 W33 130 2.39 1280 1866 7.84 5 5 W36 182 2.55 1838 2689 8.39 5 4 W40 211 2.51 2318 3401 8.27 5 3 W40 235 2.54 2548 3743 8.38 5 2 W40 278 2.52 3013 4433 8.32 5 1 W40 397 3.64 4343 6408 12.05 5
*5ft from mid-span; **at mid-span; † 1 20.12 0.076 / /pd y yL M M E F r
2.3.2.3.2 Columns
Design of columns is done as described in Section 2.2.3.2. The required axial
strengths for exterior and interior columns are determined according to Equations (2.11)
uw y yR P 0.5 crP hF vF uP uM
1.4yR
yr 1M 2M pdL bL
´´´´´´
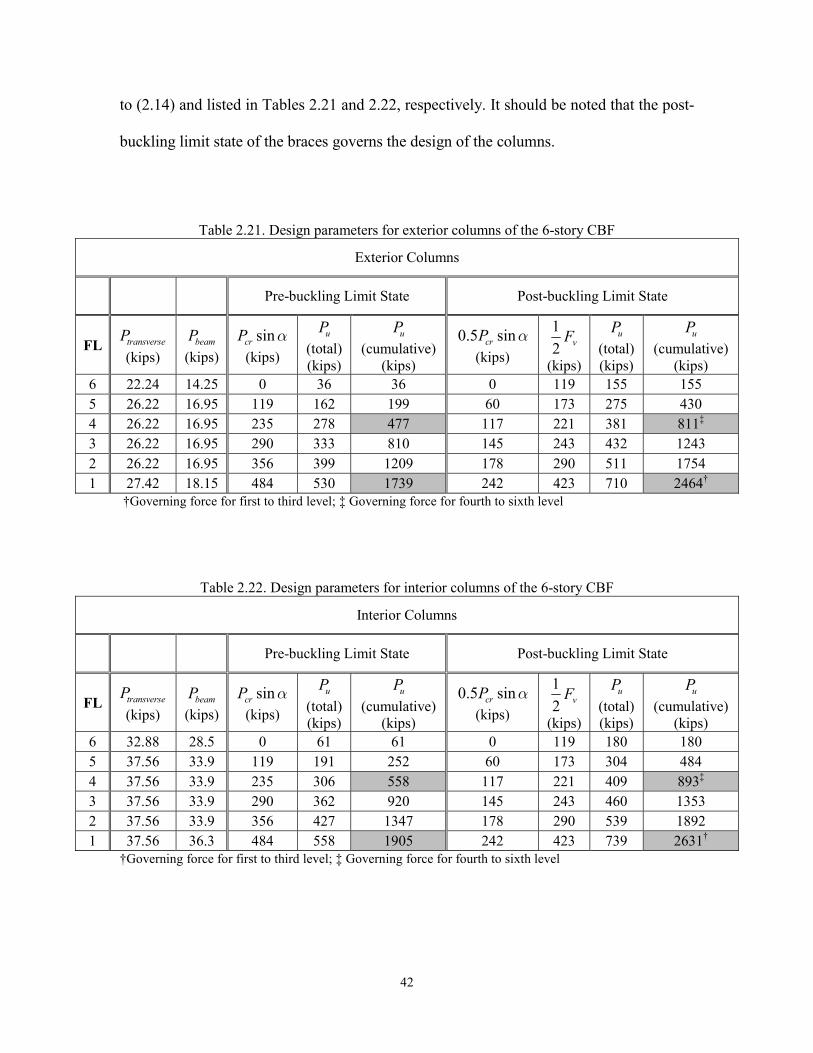
42
to (2.14) and listed in Tables 2.21 and 2.22, respectively. It should be noted that the post-
buckling limit state of the braces governs the design of the columns.
Table 2.21. Design parameters for exterior columns of the 6-story CBF
Exterior Columns
Pre-buckling Limit State Post-buckling Limit State
FL transverseP
(kips)
(kips)
(kips)
(total) (kips)
(cumulative) (kips)
(kips)
(kips)
(total) (kips)
(cumulative) (kips)
6 22.24 14.25 0 36 36 0 119 155 155 5 26.22 16.95 119 162 199 60 173 275 430 4 26.22 16.95 235 278 477 117 221 381 811‡ 3 26.22 16.95 290 333 810 145 243 432 1243 2 26.22 16.95 356 399 1209 178 290 511 1754 1 27.42 18.15 484 530 1739 242 423 710 2464†
†Governing force for first to third level; ‡ Governing force for fourth to sixth level
Table 2.22. Design parameters for interior columns of the 6-story CBF
Interior Columns
Pre-buckling Limit State Post-buckling Limit State
FL transverseP
(kips)
(kips)
(kips)
(total) (kips)
(cumulative) (kips)
(kips)
(kips)
(total) (kips)
(cumulative) (kips)
6 32.88 28.5 0 61 61 0 119 180 180 5 37.56 33.9 119 191 252 60 173 304 484 4 37.56 33.9 235 306 558 117 221 409 893‡ 3 37.56 33.9 290 362 920 145 243 460 1353 2 37.56 33.9 356 427 1347 178 290 539 1892 1 37.56 36.3 484 558 1905 242 423 739 2631†
†Governing force for first to third level; ‡ Governing force for fourth to sixth level
beamP sincrP a uP uP 0.5 sincrP a 1
2 vF uP uP
beamP sincrP a uP uP 0.5 sincrP a 1
2 vF uP uP

43
As mentioned in Section 2.2.3.2, only axial forces are considered for column
design. For this example, column sections were changed after every three stories. That is,
the force of 2631 kips was used for the first to the third story columns, and 893 kips for
the fourth to the sixth story. This led to a column size of W14 257 (axial strength =
2785 kips) for the lower three levels and W14 109 (axial strength = 1267 kips) for the
upper three levels. It is noted that although a lighter section such as W14 90 or W14
99 could have been used for the upper three stories to meet the strength requirement, their
width-thickness ratios do not meet the limit of (see discussion in Section
2.4.3.2). The final member sections for the 6-story CBF are shown in Figures 2.13.
Figure 2.13. Member Sections for 6-Story CBF Designed by PBPD
´
´
´ ´
0.38 yE F
44
2.4 Verification by Nonlinear Analysis
2.4.1 Frames Designed by Elastic Method
The three- and six-story Chevron type CBF described in Section 2.3 were
originally designed (Sabelli, 2000) as SCBF according to 1997 NEHRP design spectra
(FEMA, 1997) and 1997 AISC Seismic Provisions (AISC, 1997). The beams were
designed based on the difference of nominal yield strength ( yP ) and post-buckling
strength ( 0.3 c crP , assuming out-of-plane buckling). The material overstrength factor,
(the ratio of the expected yield strength to the specified minimum yield strength), was not
specified for design of beams in the 1997 Provisions, which could in turn lead to yielding
in the beam at the location of brace intersection under major earthquakes (Sabelli, 2000).
For comparison purposes those frames were re-designed according to the 2005 AISC
Seismic Provisions (ANSI/AISC 341-05, 2005a), where the beams are required to be
designed based on the difference of expected yield strength ( y yR P ) and nominal post-
buckling ( 0.3 crP ).
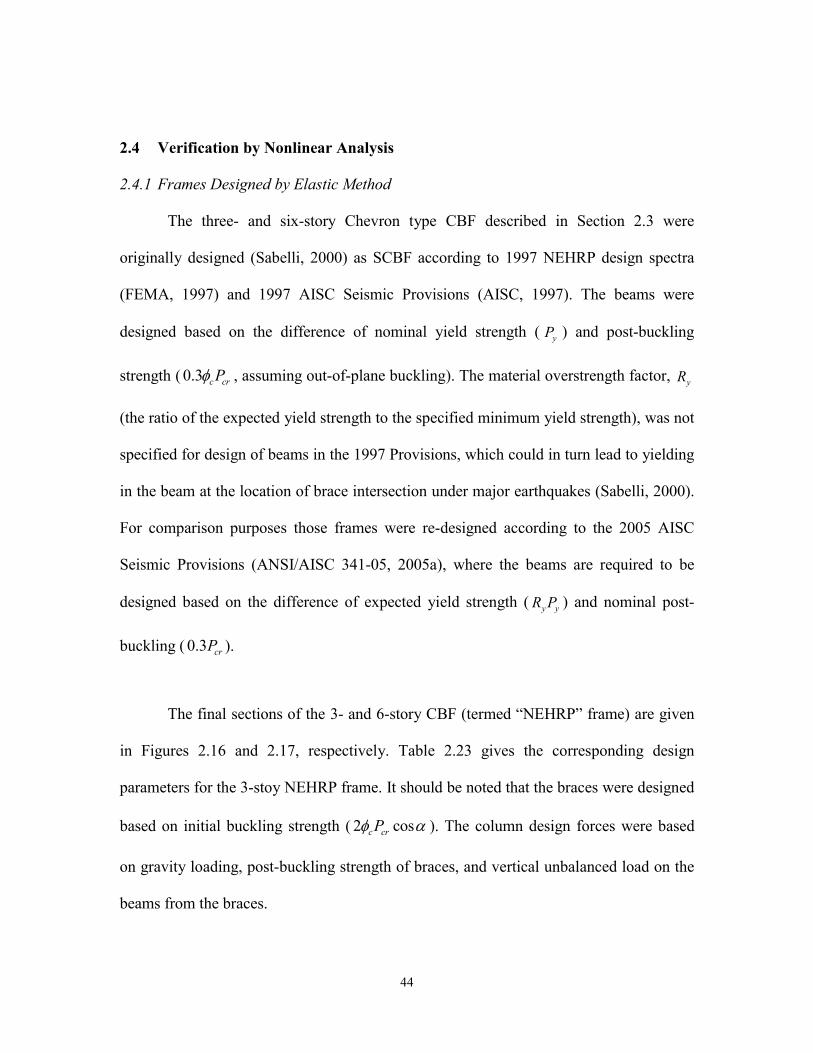
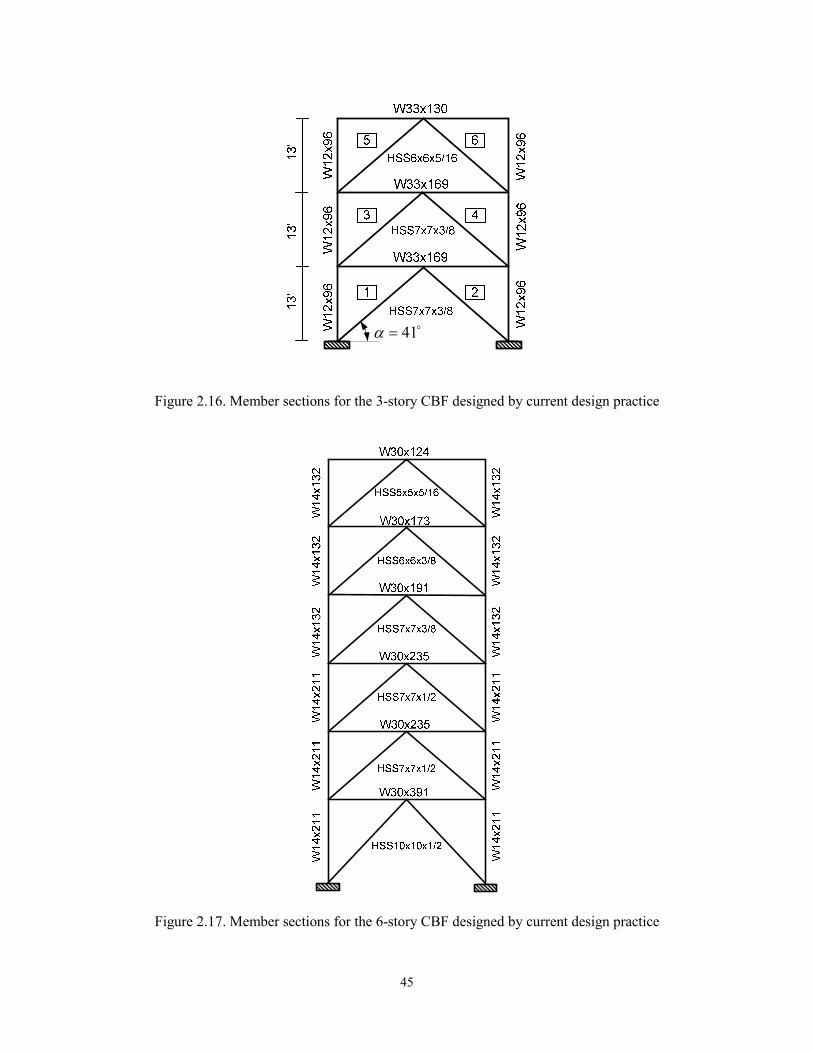
The final sections of the 3- and 6-story CBF (termed “NEHRP” frame) are given
in Figures 2.16 and 2.17, respectively. Table 2.23 gives the corresponding design
parameters for the 3-stoy NEHRP frame. It should be noted that the braces were designed
based on initial buckling strength ( 2 cosc crP ). The column design forces were based
on gravity loading, post-buckling strength of braces, and vertical unbalanced load on the
beams from the braces.
yR
45
41
Figure 2.16. Member sections for the 3-story CBF designed by current design practice
Figure 2.17. Member sections for the 6-story CBF designed by current design practice

46
Table 2.23. Selected design parameters of 3V-NEHRP frame
FL Required Story Shear, iV (kips)
Brace Size ( gA , in2)
Design Strength,
2 cosc crP (kips)
Difference between Tensile and Post-buckling
Strengths, 0.3y crP P (kips)
Fracture Life, fN
3rd 203 HSS665/16
(6.43) 241 243 78
2nd 320 HSS7 7 3/8
(8.97) 386 328 71
1st 377 HSS7 7 3/8
(8.97) 386 328 71
*Note: the braces of 3V- NEHRP frame were chosen based on strength demand, compactness requirement, and weight (lightest among available sections).
The comparison of material weights is given in Tables 2.24 and 2.25 for the 3-
and 6-story frames, respectively. Although the PBPD frames are somewhat heavier than
the NEHRP frames, the merit of PBPD method is justified by their performance as shown
by nonlinear analysis.
Table 2.24. Material weight for one braced frame of the 3-story building Weight
Calculation 3V-NEHRP
(lbs) 3V-PBPD
(lbs) 3V-PBPD/3V-NEHRP
Braces 3505 6598 1.88 Beams 14040 20880 1.49 Column 7488 9360 1.25
Total 25033 36838 1.47
Table 2.25. Material weight for one braced frame of the 6-story building Weight
Calculation 6V-NEHRP
(lbs) 6V-PBPD
(lbs) 6V-PBPD/6V-NEHRP
Braces 9379 13124 1.40 Beams 40470 42990 1.06 Column 28860 31118 1.08
Total 78709 87232 1.11

47
2.4.2 Nonlinear Analysis Results
Nonlinear analyses were carried out by using the SNAP-2DX program, which has
the ability to model brace behavior under large displacement reversals, as well as the
fracture of braces with tubular sections (Rai et al., 1996). Gravity columns were included
in the modeling by using a lumped continuous leaning column, which was connected to
the braced frame through rigid pin-ended links (e.g. see Figures 2.18 to 2.23). P
effect due to the gravity loads was also accounted for in the analysis. All beams and
columns of the frame were modeled as beam-column elements.
2.4.2.1 3-story CBF
The beam-to-column connections at the first and second levels of the 3-story
NEHRP frame were modeled as moment resisting connections due to the presence of
gusset plates. On the other hand, the beam-to-column connections at all levels of the 3-
story PBPD frame were modeled as pin connections due to the introduction of beam
splices (Figure 2.6).
Selected responses of the 3V-NEHRP frame are shown in Figures 2.18, 2.20, and
2.22, under either 10% in 50 years or 2% in 50 years ground motions. In one of these
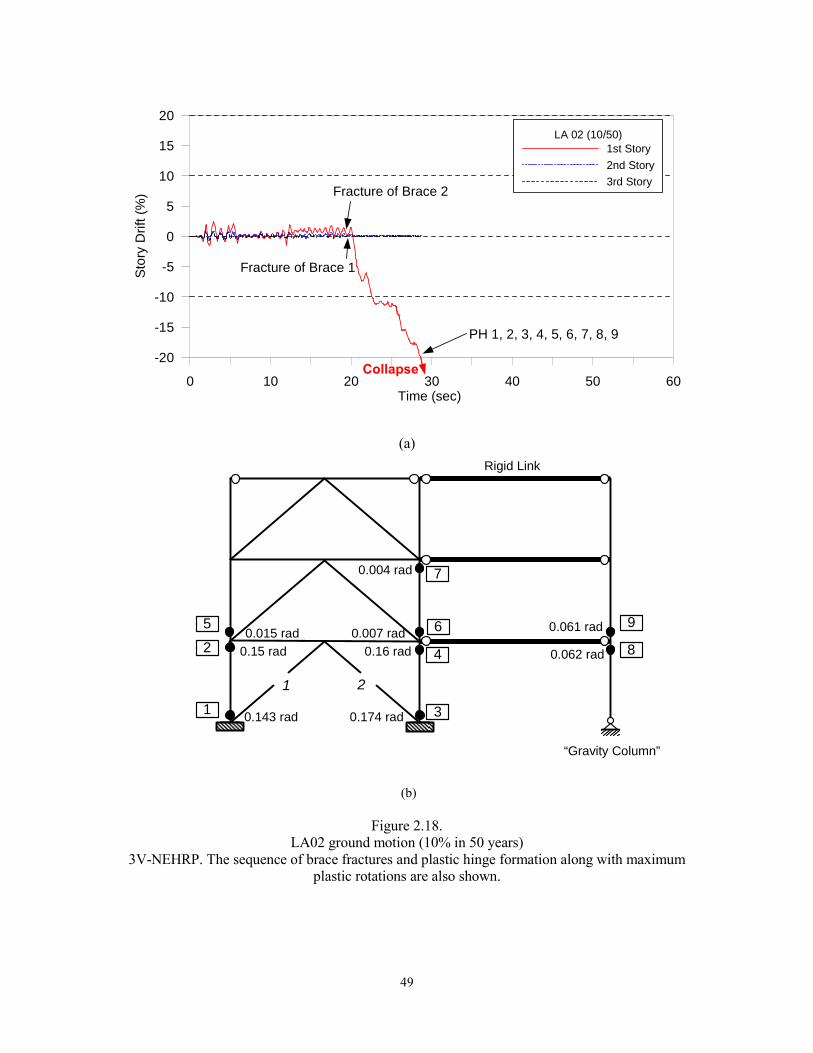
responses, i.e., due to LA 02 record (Figure 2.18a), the structure collapsed after 20
seconds due to early brace fractures (i.e., short fracture life) in the first story. Significant
yielding was also observed in the columns due to rigid connections (Figure 2.18b). This
agrees with recent test results which showed that severe damage can occur in the vicinity
of connection regions of CBF designed by current practice (Uriz, 2005; see Figure 2.5).

48
In the other responses, although collapse did not occur, the NEHRP frame subjected to
severe damage and considerable residual drifts due to early brace fractures and plastic
hinging in the columns.
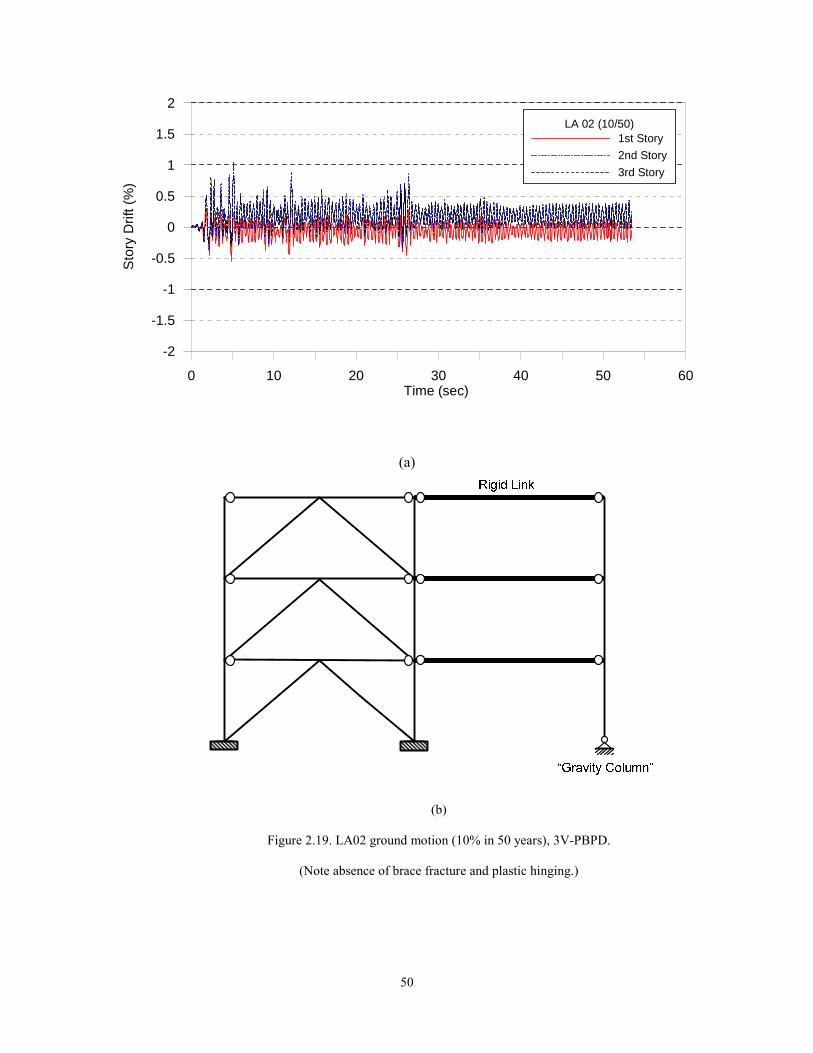
Typical responses of the 3V-PBPD frame are shown in Figures 2.19, 2.21, and
2.23 under the same ground motions. It can be seen that the behavior is quite stable and
drift was considerably less as compared with the 3V-NEHRP frame. The damage in terms
of yielding and buckling was generally confined to the braces only and no brace fracture
occurred, thus the intended yield mechanism and response was achieved. It is also
noticed that the PBPD frame exhibited smaller residual drifts as compared to those in the
NEHRP frame, even due to 2% in 50 years ground motions.
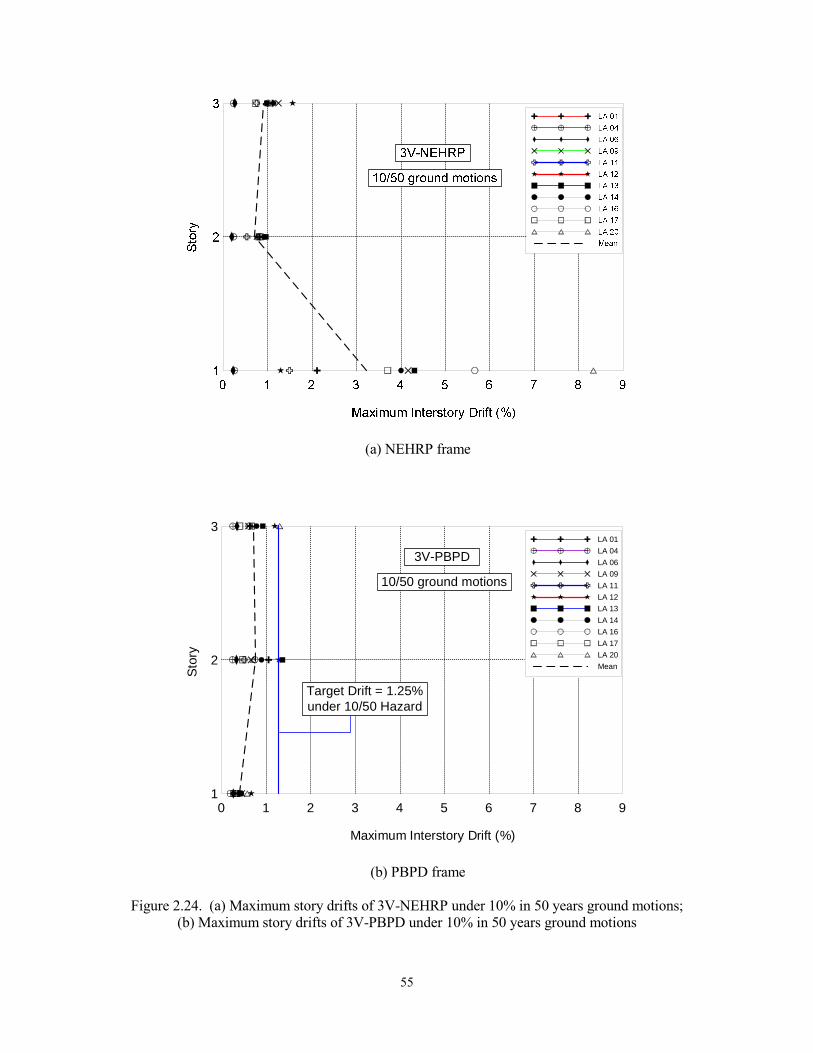
Figure 2.24 shows maximum interstory drifts for both 3V-NEHRP and 3V-PBPD
frames due to eleven 10% in 50 years SAC ground motion records. As can be seen, the
3V-NEHRP frame experienced large concentrated drift in the first story, due to brace
fractures and column hinging. On the other hand, the frame designed by PBPD method
resulted in more uniformly distributed story drifts along the height of the frame, and
generally within the design target drift, while eliminating brace fractures and column
yielding.
49
0 10 20 30 40 50 60Time (sec)
-20
-10
0
10
20
-15
-5
5
15S
tory
Dri
ft (%
)LA 02 (10/50)
1st Story
2nd Story
3rd Story
PH 1, 2, 3, 4, 5, 6, 7, 8, 9
Collapse
Fracture of Brace 2
Fracture of Brace 1
(a)
0.143 rad1
“Gravity Column”
Rigid Link
0.15 rad20.015 rad
0.174 rad
0.16 rad
3
4
0.007 rad
0.004 rad
6
7
5
0.062 rad 8
0.061 rad 9
1 2
(b)
Figure 2.18. LA02 ground motion (10% in 50 years)
3V-NEHRP. The sequence of brace fractures and plastic hinge formation along with maximum plastic rotations are also shown.
50
0 10 20 30 40 50 60Time (sec)
-2
-1
0
1
2
-1.5
-0.5
0.5
1.5S
tory
Dri
ft (%
)LA 02 (10/50)
1st Story
2nd Story
3rd Story
(a)
(b)
Figure 2.19. LA02 ground motion (10% in 50 years), 3V-PBPD.
(Note absence of brace fracture and plastic hinging.)

51
0 10 20 30 40 50 60Time (sec)
-8
-4
0
4
8
-10
-6
-2
2
6
10S
tory
Dri
ft (%
)
LA 27 (2/50)1st Story
2nd Story
3rd Story
(a)
(b) Figure 2.20. LA27 ground motion (2% in 50 years), 3V-NEHRP.
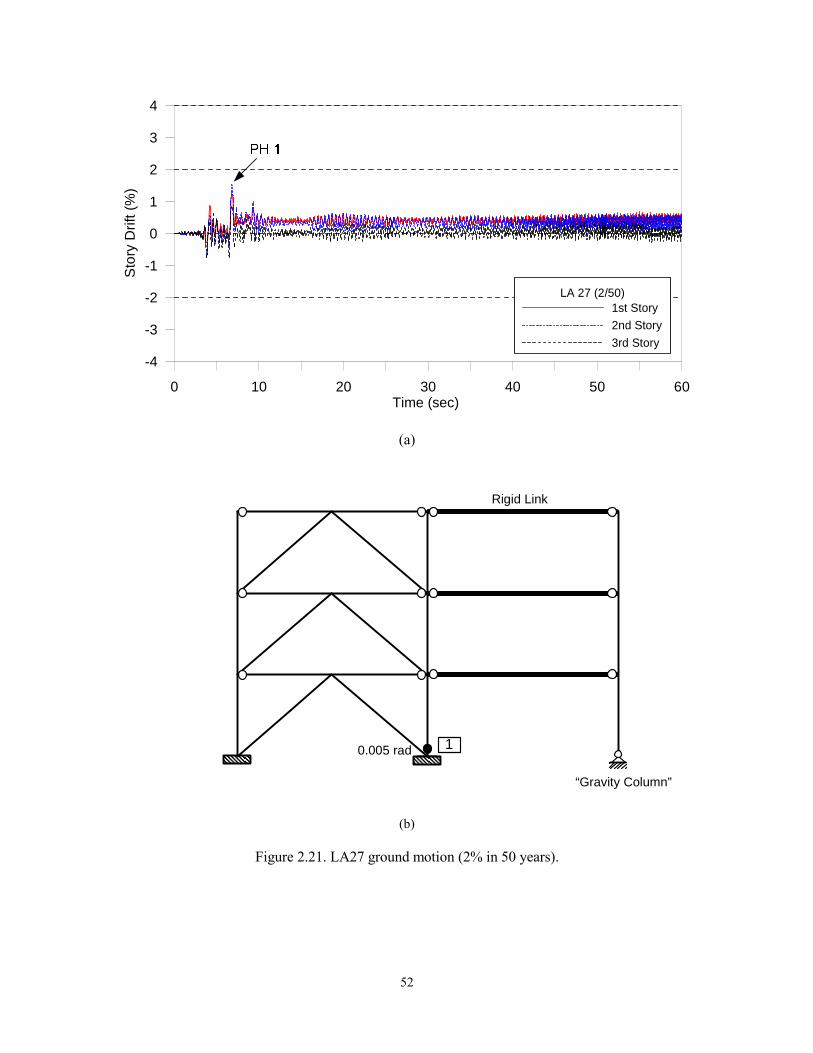
52
0 10 20 30 40 50 60Time (sec)
-4
-2
0
2
4
-3
-1
1
3S
tory
Dri
ft (%
)
LA 27 (2/50)1st Story
2nd Story
3rd Story
(a)
0.005 rad 1
Rigid Link
“Gravity Column”
(b)
Figure 2.21. LA27 ground motion (2% in 50 years).

53
0 10 20 30 40 50 60Time (sec)
-20
-10
0
10
20
-15
-5
5
15S
tory
Dri
ft (%
)LA 38 (2/50)
1st Story
2nd Story
3rd Story
(a)
(b)
Figure 2.22. LA38 ground motion (2% in 50 years), 3V-NEHRP. The sequence of brace fractures and plastic hinge formation along with maximum plastic rotations are also shown.

54
0 10 20 30 40 50 60Time (sec)
-2
-1
0
1
2
-1.5
-0.5
0.5
1.5S
tory
Dri
ft (
%)
LA 38 (2/50)1st Story
2nd Story
3rd Story
(a)
(b)
Figure 2.23. LA38 ground motion (2% in 50 years), 3V-PBPD
55
(a) NEHRP frame
0 1 2 3 4 5 6 7 8 9
Maximum Interstory Drift (%)
1
2
3
Sto
ry
LA 01
LA 04
LA 06
LA 09
LA 11
LA 12
LA 13
LA 14
LA 16
LA 17
LA 20
Mean
10/50 ground motions
3V-PBPD
Target Drift = 1.25% under 10/50 Hazard
(b) PBPD frame
Figure 2.24. (a) Maximum story drifts of 3V-NEHRP under 10% in 50 years ground motions; (b) Maximum story drifts of 3V-PBPD under 10% in 50 years ground motions
56
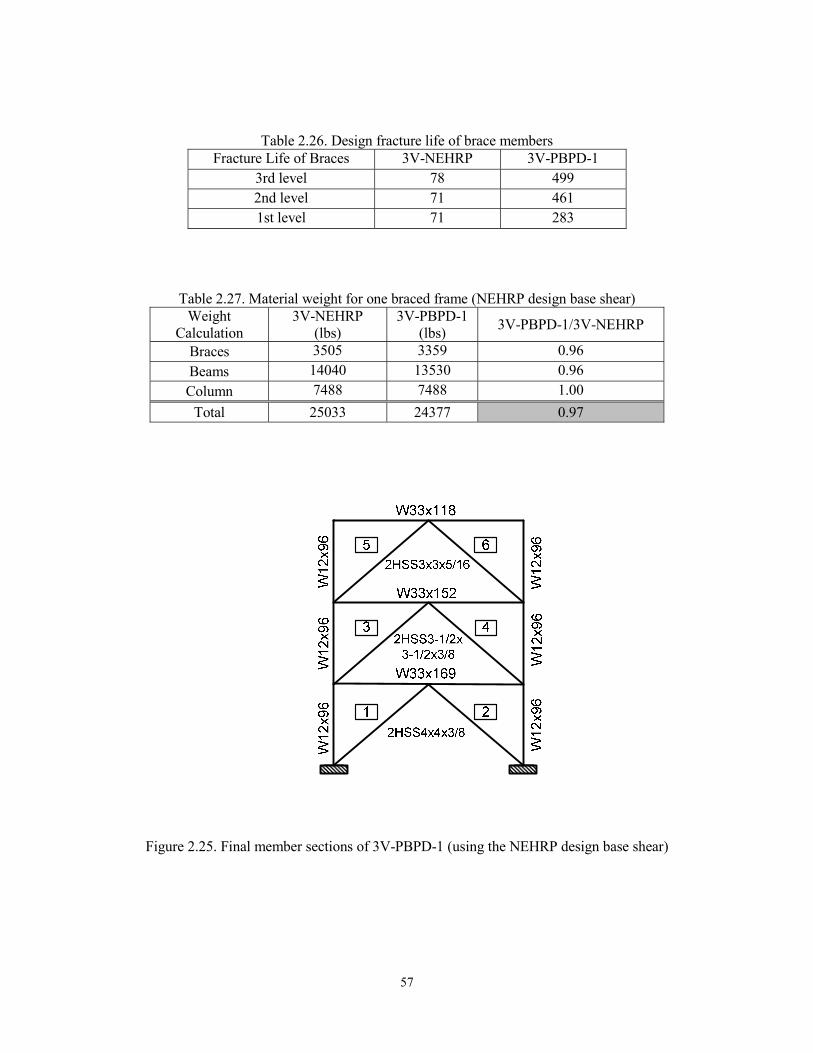
2.4.2.1.1 Redesign of the 3-Story CBF
It should be noted that the design base shear for 3V-PBPD frame was
approximately twice that of the 3V-NEHRP frame. This large difference is attributed to
short period (T = 0.31 second), strict drift control (1.25% for 2/3 MCE design spectrum),
and adjustment due to “pinched” hysteretic behavior of bucking type braces, which are
part of the PBPD method needed to ensure the targeted performance. The differences in
the performance of those two frames as presented in the previous section clearly showed
that. In order to study the effect of the difference in the design base shear, the 3V-PBPD
frame was redesigned (called 3V-PBPD-1 frame) by using the same design base shear as
for the 3V-NEHRP frame. All other design criteria as presented in Section 2.2 for the
PBPD procedure remained unchanged. Tables 2.26 and 2.27 give comparison of some
selected parameters between the 3V-NEHRP and 3V-PBPD-1 frames, and the final
design sections are shown in Figure 2.23. It can be seen that the two frames have equal
material weight.
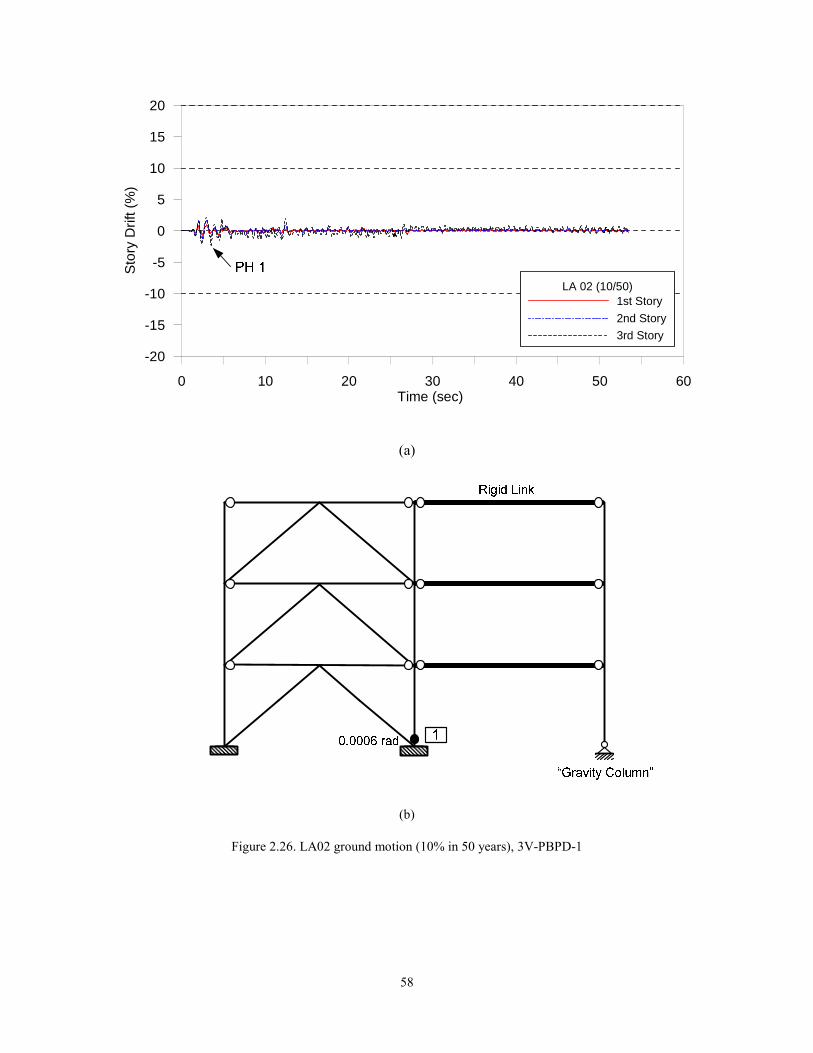
Selected responses of the 3V-PBPD-1 frame are shown in Figures 2.26, 2.27, and
2.28. It is seen that although the behavior is still better than that of 3V-NEHRP frame, in
terms of damage control (no collapse, relatively smaller column hinge rotations, and no
early brace fractures), the 3Vf-PBPD-1 frame exhibited much larger story drifts than
those of the 3V-PBPD frame. This becomes evident when the maximum story drifts due
to eleven ground motions (10% in 50 years) are plotted as shown in Figure 2.29. These
results clearly show the merits of the PBPD method in order to achieve the intended
seismic performance.
57
Table 2.26. Design fracture life of brace members Fracture Life of Braces 3V-NEHRP 3V-PBPD-1
3rd level 78 499 2nd level 71 461 1st level 71 283
Table 2.27. Material weight for one braced frame (NEHRP design base shear) Weight
Calculation 3V-NEHRP
(lbs) 3V-PBPD-1
(lbs) 3V-PBPD-1/3V-NEHRP
Braces 3505 3359 0.96
Beams 14040 13530 0.96
Column 7488 7488 1.00
Total 25033 24377 0.97
Figure 2.25. Final member sections of 3V-PBPD-1 (using the NEHRP design base shear)
58
0 10 20 30 40 50 60Time (sec)
-20
-10
0
10
20
-15
-5
5
15S
tory
Dri
ft (%
)
LA 02 (10/50)1st Story
2nd Story
3rd Story
(a)
(b)
Figure 2.26. LA02 ground motion (10% in 50 years), 3V-PBPD-1

59
0 10 20 30 40 50 60Time (sec)
-8
-4
0
4
8
-10
-6
-2
2
6
10
Sto
ry D
rift
(%)
LA 27 (2/50)1st Story
2nd Story
3rd Story
(a)
(b)
Figure 2.27. LA27 ground motion (2% in 50 years), 3V-PBPD-1. The sequence of brace fractures and plastic hinge formation along with maximum plastic rotations are also shown.

60
0 10 20 30 40 50 60Time (sec)
-20
-10
0
10
20
-15
-5
5
15S
tory
Dri
ft (%
)LA 38 (2/50)
1st Story
2nd Story
3rd Story
(a)
(b)
Figure 2.28. LA38 ground motion (2% in 50 years), 3V-PBPD-1. The sequence of brace fractures and plastic hinge formation along with maximum plastic rotations are also shown.
61
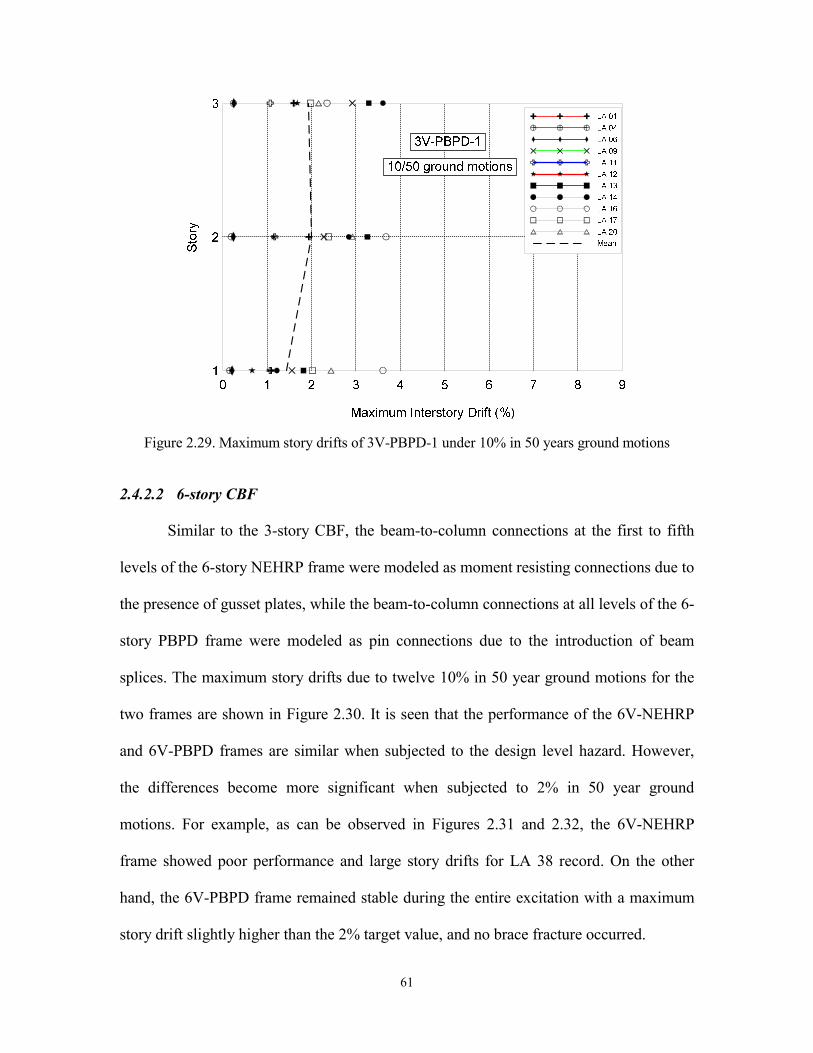
Figure 2.29. Maximum story drifts of 3V-PBPD-1 under 10% in 50 years ground motions 2.4.2.2 6-story CBF
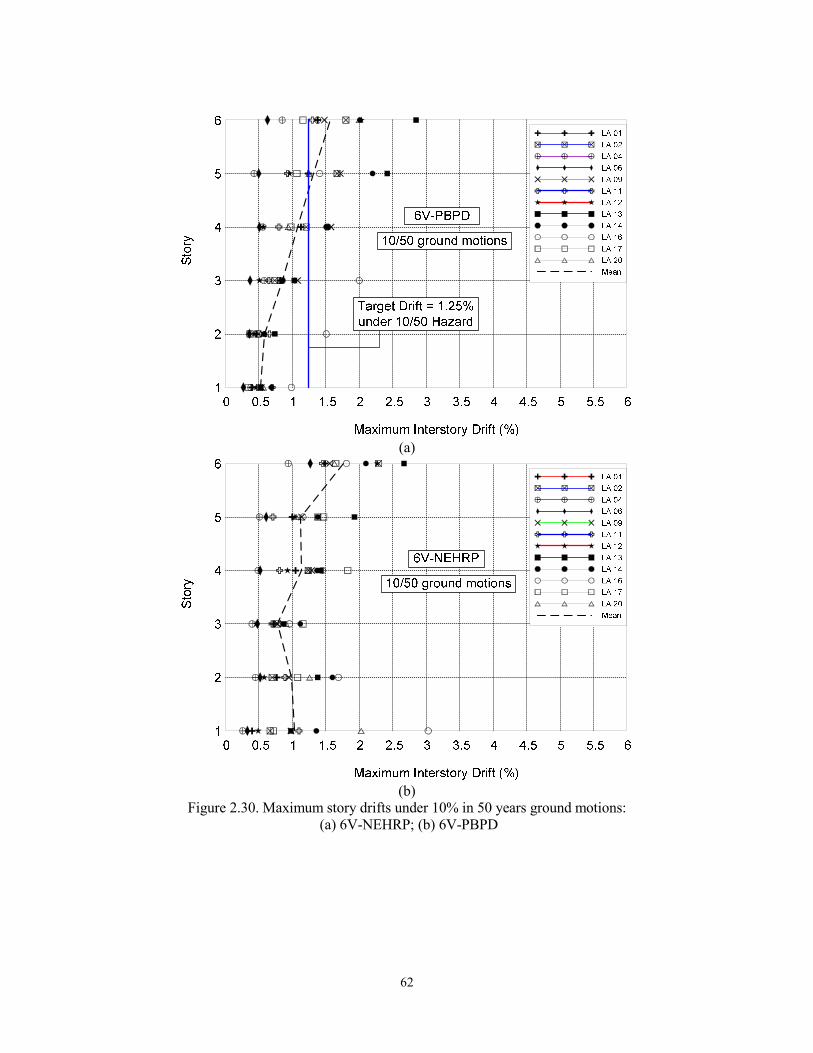
Similar to the 3-story CBF, the beam-to-column connections at the first to fifth
levels of the 6-story NEHRP frame were modeled as moment resisting connections due to
the presence of gusset plates, while the beam-to-column connections at all levels of the 6-
story PBPD frame were modeled as pin connections due to the introduction of beam
splices. The maximum story drifts due to twelve 10% in 50 year ground motions for the
two frames are shown in Figure 2.30. It is seen that the performance of the 6V-NEHRP
and 6V-PBPD frames are similar when subjected to the design level hazard. However,
the differences become more significant when subjected to 2% in 50 year ground
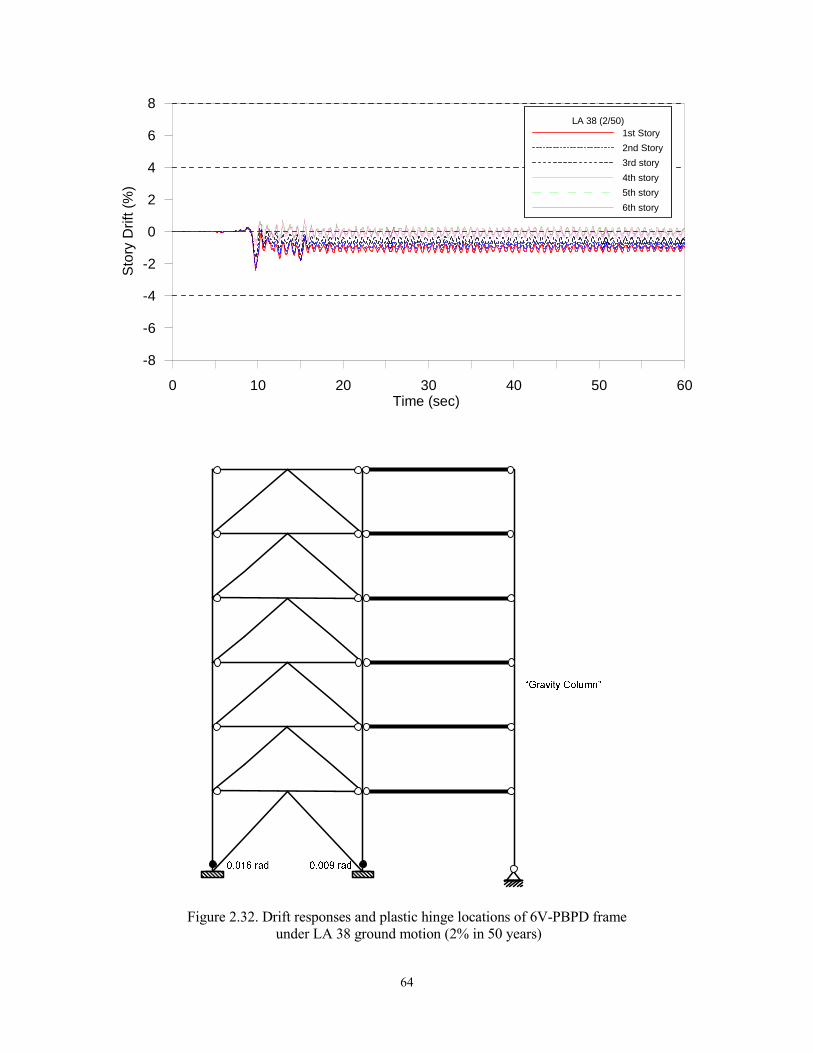
motions. For example, as can be observed in Figures 2.31 and 2.32, the 6V-NEHRP
frame showed poor performance and large story drifts for LA 38 record. On the other
hand, the 6V-PBPD frame remained stable during the entire excitation with a maximum
story drift slightly higher than the 2% target value, and no brace fracture occurred.
62
(a)
(b)
Figure 2.30. Maximum story drifts under 10% in 50 years ground motions: (a) 6V-NEHRP; (b) 6V-PBPD

63
0 10 20 30 40 50 60Time (sec)
-8
-4
0
4
8
-6
-2
2
6S
tory
Dri
ft (%
)LA 38 (2/50)
1st Story
2nd Story
3rd story
4th story
5th story
6th story
Figure 2.31. Drift responses and plastic hinge/brace fracture locations of 6V-NEHRP frame
under LA 38 ground motion (2% in 50 years)
64
0 10 20 30 40 50 60Time (sec)
-8
-4
0
4
8
-6
-2
2
6S
tory
Dri
ft (
%)
LA 38 (2/50)1st Story
2nd Story
3rd story
4th story
5th story
6th story
Figure 2.32. Drift responses and plastic hinge locations of 6V-PBPD frame under LA 38 ground motion (2% in 50 years)

65

66
CHAPTER 3
Further Development of PBPD Method for Design of CBF
3.1 General
The current PBPD procedure for design of CBFs was described in Chapter 2. The
3-story and 6-story CBFs, originally designed by Sabelli (2001) based on NEHRP
guidelines (1997), were re-designed by using the PBPD procedure explained in Chapter 2
(Goel and Chao, 2008). It was shown that the PBPD designed CBFs have much better
performance under design level (2/3MCE) as well as MEC level ground motions
compared to the NEHRP frames.
As part of the current PBPD procedure for CBFs, the beam to column connection
detail was modified by using shear splice in the beam such that the large moments
produced in the beams would not transfer in to the columns. However, since the shear
splice has to be placed with an offset from the column face at least equal to the length of
gusset plate over the beam flange, there are concerns that this eccentricity of the shear
splice combined with the large shear force caused by the vertical component of the
unbalanced force in chevron CBFs may produce large bending moments at the centerline
of the column. A new configuration for the gusset plate connection is proposed in Section
3.2. The gusset plate in this configuration is only connected to the column such that the
total unbalanced moment on the column would be reduced.
67
In Section 3.3, the current capacity design method for columns in CBFs based on
the accumulative axial forces is evaluated by comparing the column moments from
pushover and dynamic analyses. A more accurate design method for columns using
pushover analysis is proposed.
An alternative method to account for pinched hysteretic behavior of CBFs in the
PBPD approach is introduced in Section 3.4. This method is also applicable to other types
of systems with degrading hysteretic behavior.
It is realized that the yield drift in slenderer braced frames such as CBFs, does not
have a constant value due to the significant amount of flexural deformation caused by
axial deformation of columns. Because of importance of having a good estimation of
yield drift in PBPD method, a procedure is presented in Section 3.5 to analytically
estimate the yield drift for slender braced frames.
Unlike MFs, a significant amount of the story drift in slender braced frames
comes from the axial deformation of the columns. This is basically an elastic type of
deformation which is not imposing additional deformation demand on bracing members
as the main seismic components in braced frames. To address this issue, an approach is
introduced in Section 3.6 in order to obtain the proper target drift for CBFs. In this
method, an effective target drift is calculated based on the original definition of the target
drift used in the work-energy equation in PBPD.
In Section 3.7, the suggested PBPD approach is utilized to design the 9-story SAC
building by using CBFs as the lateral load resisting system. The performance of this
design is then evaluated by using 10%/50yrs and 2%/50yrs SAC LA ground motions
(Somerville et al, 1997). Based on the observed maximum story drift profile along the
68
height, the possibility of considering a different lateral load distribution in the PBPD
procedure for CBFs is investigated. Using the new lateral load distribution, the provided
strength and stiffness would be greater in upper stories which can be helpful in reducing
the large story drifts observed under dynamic analyses. Extensive dynamic analyses were
carried out to study the effect of varying lateral distribution on the performance of CBFs.
3.2 Proposed Gusset Plate Configuration
As part of the current PBPD procedure for CBF, the beam-to-column connection
detail is modified by using shear splice in the beam such that the large moments produced
in the beams would not transfer in to the columns (Chao and Goel, 2006b). However,
since the shear splice has to be placed with an offset from the column face at least equal
to the length of gusset plate over the beam flange, there are concerns that this eccentricity
of the shear splice combined with the large shear force caused by the vertical component
of the unbalanced force in chevron CBF may produce large bending moments at the
centerline of the column. A new configuration for the gusset plate connection is presented
in this section. The gusset plate in this configuration is only connected to the column such
that the total unbalanced moment on the column can be reduced.
Figure 3.1.a shows the current detail for gusset plate connection, called
connection Type I. The proposed configuration, called connection Type II, is shown in
Figure 3.1.b. As can be seen in this figure, the gusset plate is only connected to the
column. The top flange of the beam is coped in order to reduce the eccentricity between
the line of action of brace force and the intersection of beam and column. Although there
is some eccentricity in the proposed connection (Type II), the total unbalanced moment
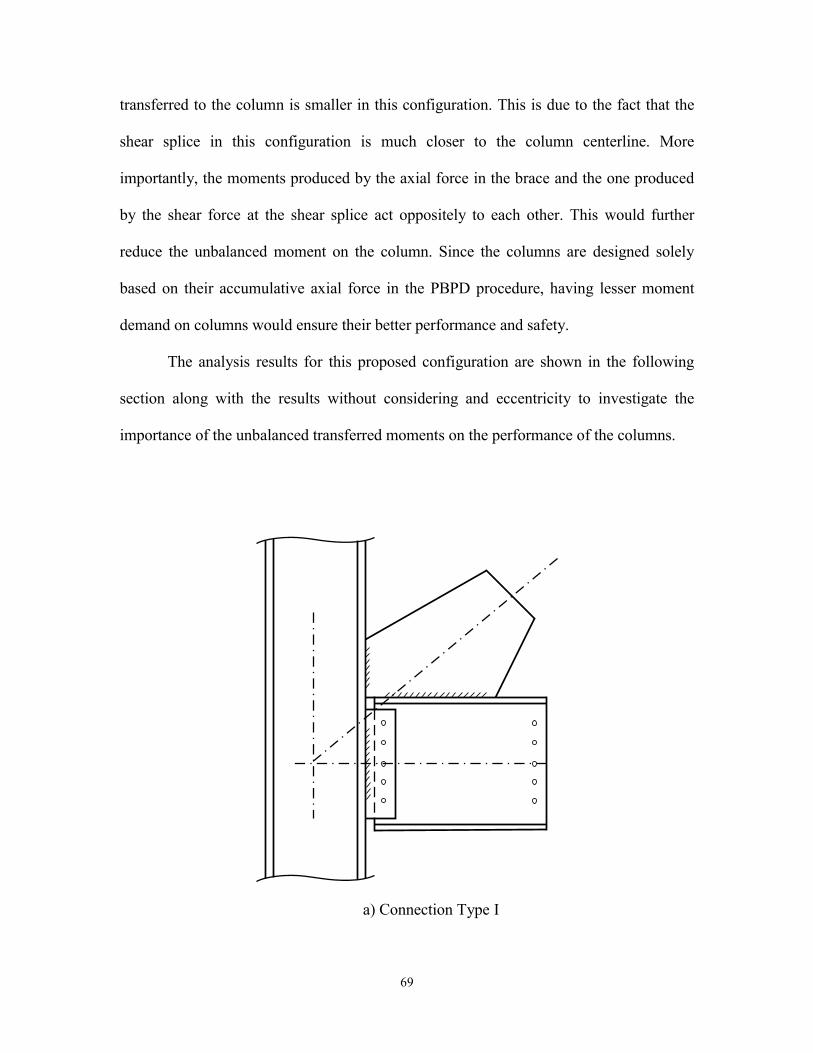
69
transferred to the column is smaller in this configuration. This is due to the fact that the
shear splice in this configuration is much closer to the column centerline. More
importantly, the moments produced by the axial force in the brace and the one produced
by the shear force at the shear splice act oppositely to each other. This would further
reduce the unbalanced moment on the column. Since the columns are designed solely
based on their accumulative axial force in the PBPD procedure, having lesser moment
demand on columns would ensure their better performance and safety.
The analysis results for this proposed configuration are shown in the following
section along with the results without considering and eccentricity to investigate the
importance of the unbalanced transferred moments on the performance of the columns.
a) Connection Type I
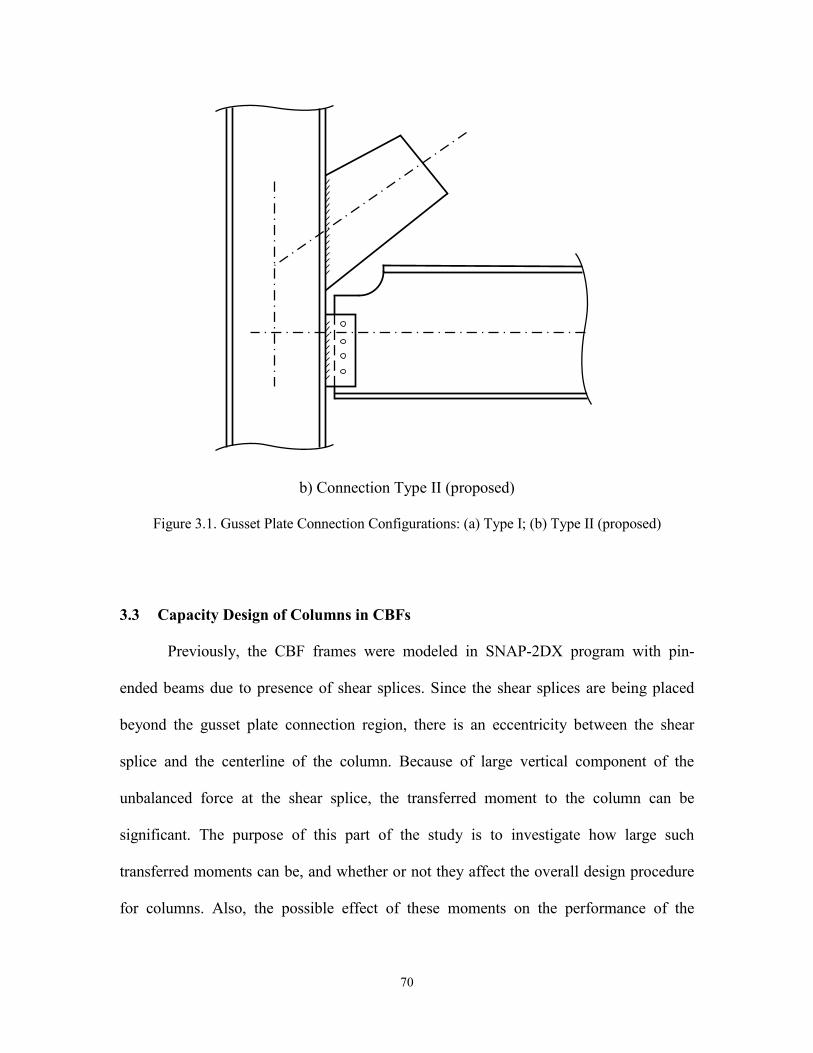
70
b) Connection Type II (proposed)
Figure 3.1. Gusset Plate Connection Configurations: (a) Type I; (b) Type II (proposed)
3.3 Capacity Design of Columns in CBFs
Previously, the CBF frames were modeled in SNAP-2DX program with pin-
ended beams due to presence of shear splices. Since the shear splices are being placed
beyond the gusset plate connection region, there is an eccentricity between the shear
splice and the centerline of the column. Because of large vertical component of the
unbalanced force at the shear splice, the transferred moment to the column can be
significant. The purpose of this part of the study is to investigate how large such
transferred moments can be, and whether or not they affect the overall design procedure
for columns. Also, the possible effect of these moments on the performance of the

71
structure will be studied. In addition, the behavior and performance of two alternative
gusset plate connections to the beam-column joint are compared.
Table 3.1 shows the properties of the CBF models used in this section. The brace,
beam, and column sections in all these models are similar to the PBPD designs (3V-
PBPD and 6V-PBPD) obtained in Chapter 2. The models were analyzed by using the
SNAP-2DX program.
Table 3.1 Description of the Studied CBF Models
CBF Model Design Method Modeling of G.P./ Beam-Column Connection
3V-PBPD PBPD Type I connection, without Ecc. for shear splices
3V-PBPD01 PBPD Type I conn., with Ecc. for shear splices (Ecc.=20 inches)
3V-PBPD02 PBPD Type II connection , with G.P. connected to the column
6V-PBPD PBPD Type I connection, without Ecc. for shear splices
6V-PBPD01 PBPD Type I conn., with Ecc. for shear splices (Ecc.=20 inches)
6V-PBPD02 PBPD Type II connection, with G.P. connected to the column
As can be seen in Figure 3.2, modeling the eccentricity of the shear splice is
resulting in larger column moments for both the design level earthquake LA01, as well as
MCE level earthquake of LA27. As can be seen, considerable moments are transferred
from beams to column due to the end eccentricities. Therefore, these eccentricities should
be properly modeled in order to obtain more realistic moment demands in columns.
In terms of the overall performance, no significant change was observed by
adding the eccentricities in the models (for both 3-story and 6-story models). Still no
plastic hinge formed in the columns except at the base. For the models with eccentricity,
plastic hinge rotation at the column base shows an increase of about 10-15% which is not
significant.

72
Comparing the column moments for connections Type I and Type II, it can be
seen that for most of the stories these moments are somewhat larger in the Type II case
(Figure 3.3 and Figure 3.5). On the other hand, the axial forces at the time of maximum
moments are generally lower for Type II, and hence the available moment capacity is
larger (Figure 3.4 and Figure 3.6).
It can also be seen from Figure 3.5.b Figure 3.6.b that for the 6-story CBF under
2/50 ground motion of LA38, the behavior of the Type I and Type II frames are
practically the same (in terms of column axial forces and moments).
In summary, practically similar performances were seen for connections Type I
and the proposed connection Type II under time-history analysis. However, connection
Type II does not need an extra shear splice connection (like the one in Type I to reduce
the transferred moment) and as a result can be considered to be a more cost-effective
alternative.
A more accurate design method for columns would be the one where moments
obtained from pushover analysis of the frame are taken into account along with the axial
forces in the design of columns. This method is investigated in the next sub section.

73
a)
b)
Figure 3.2. The Effect of Modeling Shear Splice Eccentricity on Column Bending Moments under: (a) LA01; and (b) LA27
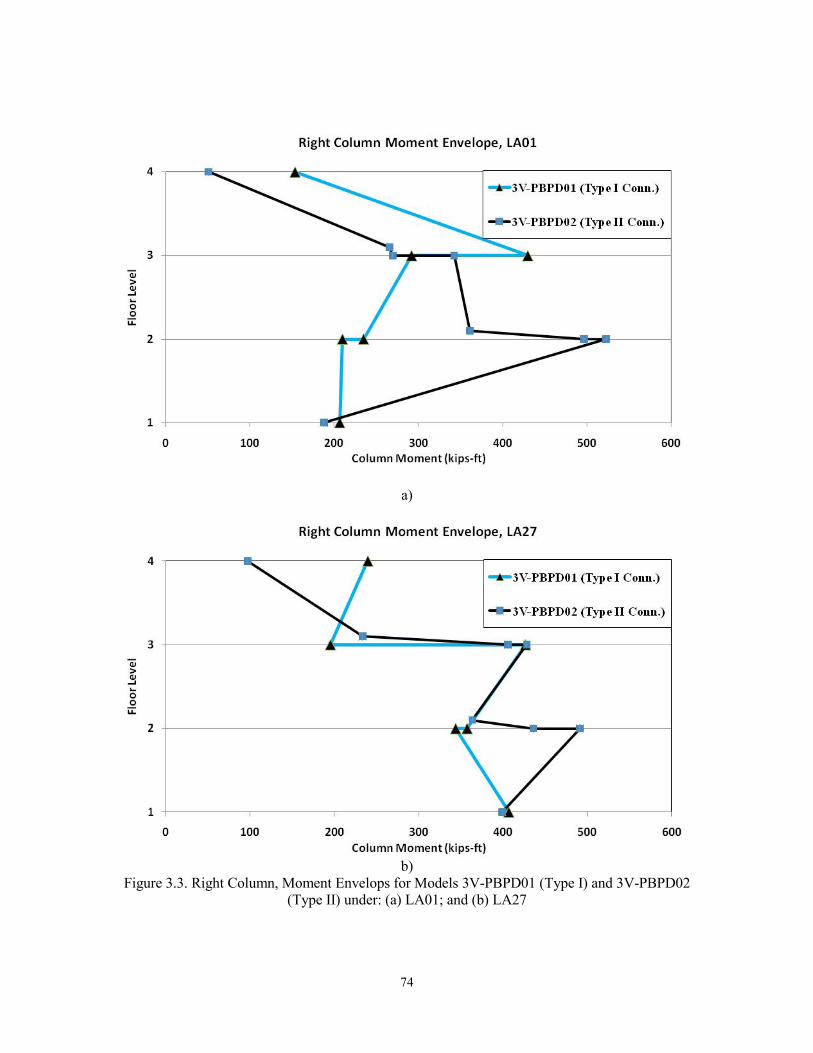
74
a)
b)
Figure 3.3. Right Column, Moment Envelops for Models 3V-PBPD01 (Type I) and 3V-PBPD02 (Type II) under: (a) LA01; and (b) LA27
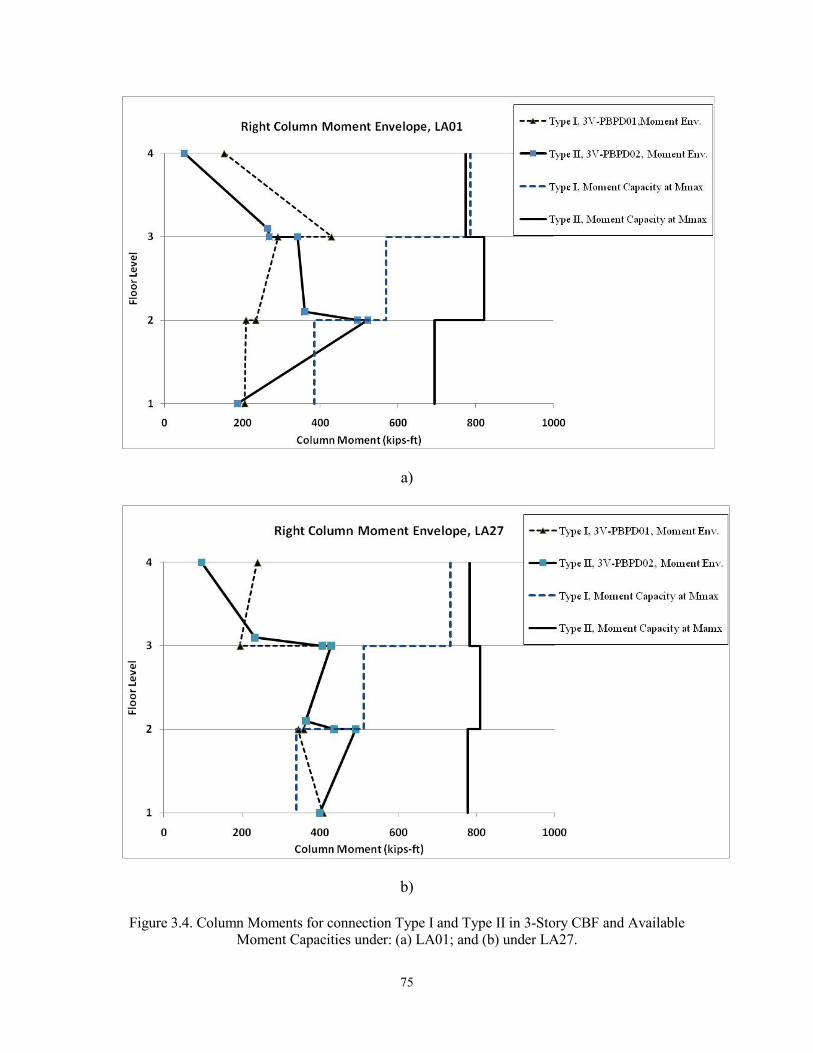
75
a)
b)
Figure 3.4. Column Moments for connection Type I and Type II in 3-Story CBF and Available Moment Capacities under: (a) LA01; and (b) under LA27.
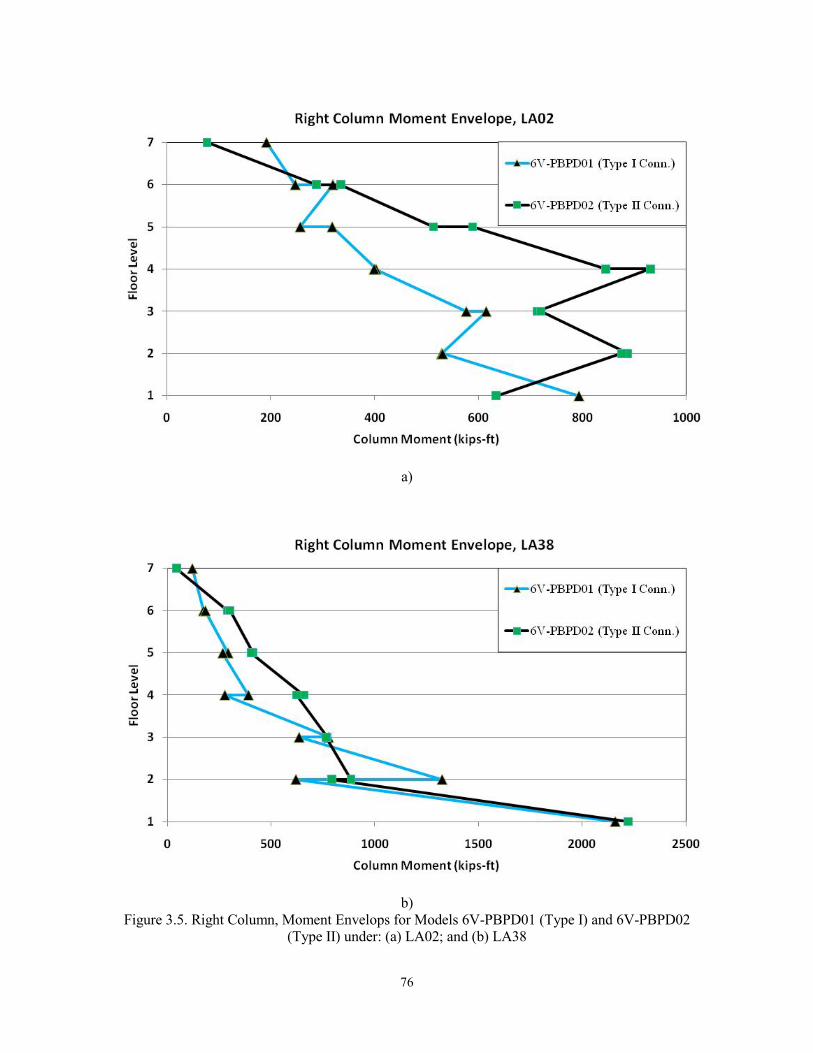
76
a)
b) Figure 3.5. Right Column, Moment Envelops for Models 6V-PBPD01 (Type I) and 6V-PBPD02
(Type II) under: (a) LA02; and (b) LA38
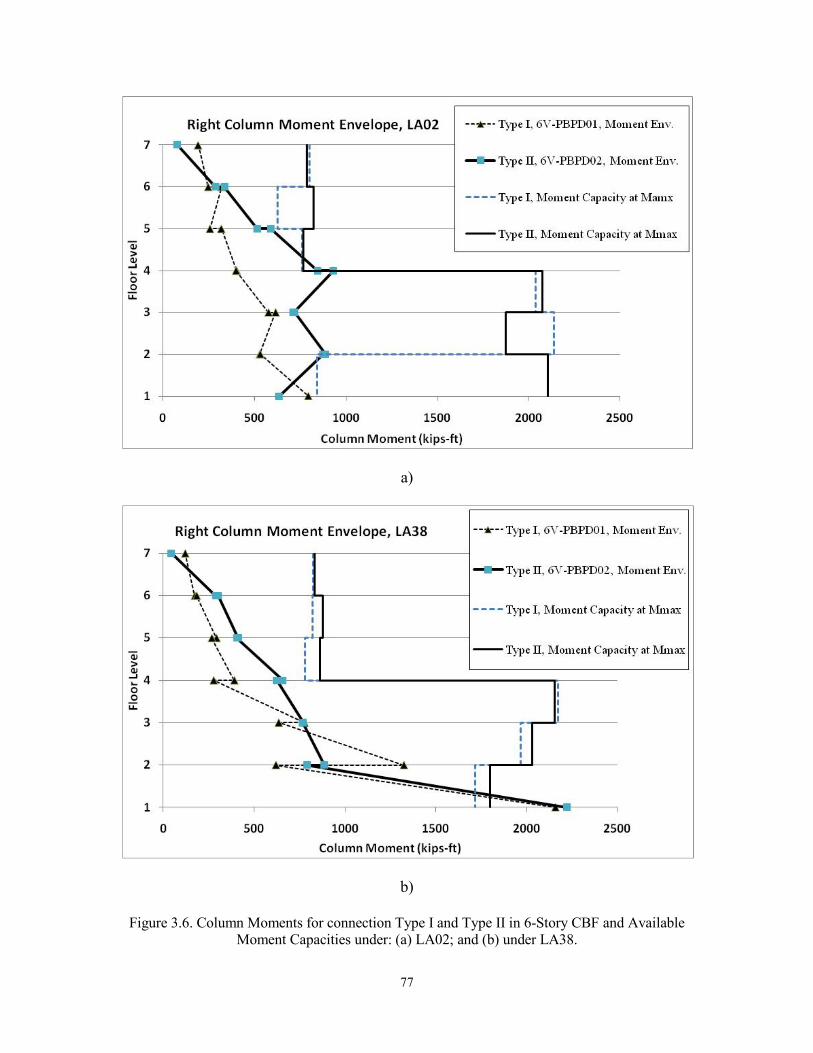
77
a)
b)
Figure 3.6. Column Moments for connection Type I and Type II in 6-Story CBF and Available Moment Capacities under: (a) LA02; and (b) under LA38.
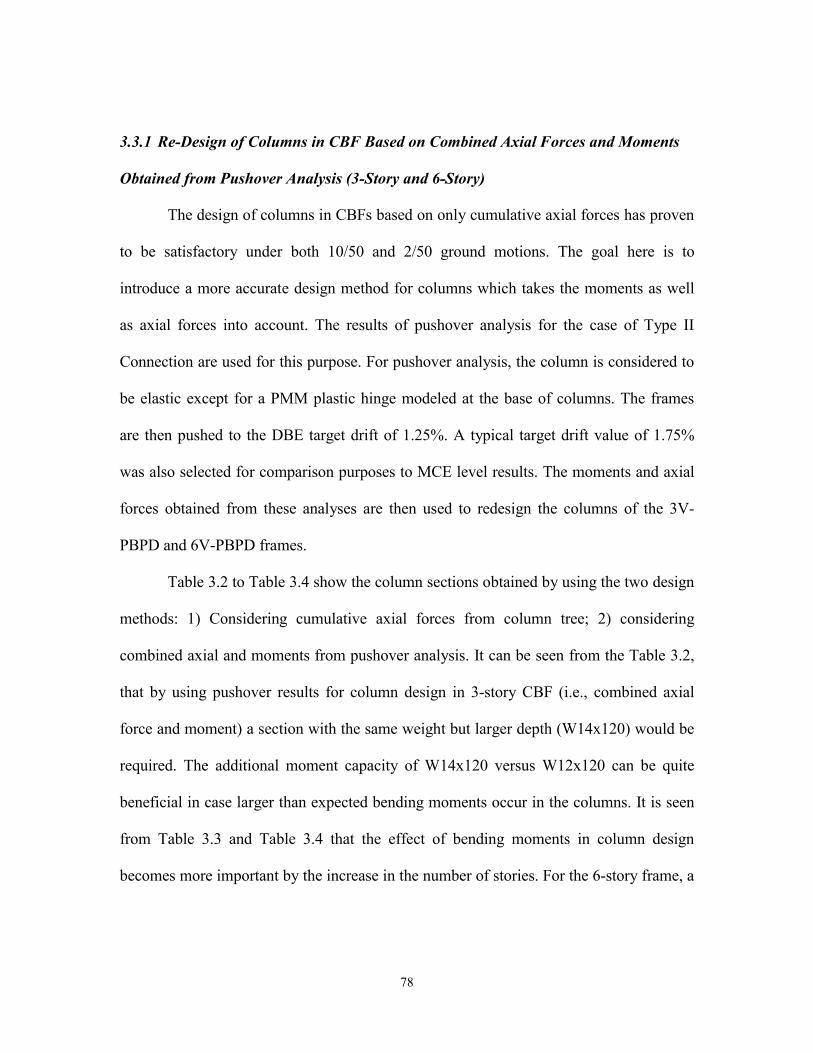
78
3.3.1 Re-Design of Columns in CBF Based on Combined Axial Forces and Moments
Obtained from Pushover Analysis (3-Story and 6-Story)
The design of columns in CBFs based on only cumulative axial forces has proven
to be satisfactory under both 10/50 and 2/50 ground motions. The goal here is to
introduce a more accurate design method for columns which takes the moments as well
as axial forces into account. The results of pushover analysis for the case of Type II
Connection are used for this purpose. For pushover analysis, the column is considered to
be elastic except for a PMM plastic hinge modeled at the base of columns. The frames
are then pushed to the DBE target drift of 1.25%. A typical target drift value of 1.75%
was also selected for comparison purposes to MCE level results. The moments and axial
forces obtained from these analyses are then used to redesign the columns of the 3V-
PBPD and 6V-PBPD frames.
Table 3.2 to Table 3.4 show the column sections obtained by using the two design
methods: 1) Considering cumulative axial forces from column tree; 2) considering
combined axial and moments from pushover analysis. It can be seen from the Table 3.2,
that by using pushover results for column design in 3-story CBF (i.e., combined axial
force and moment) a section with the same weight but larger depth (W14x120) would be
required. The additional moment capacity of W14x120 versus W12x120 can be quite
beneficial in case larger than expected bending moments occur in the columns. It is seen
from Table 3.3 and Table 3.4 that the effect of bending moments in column design
becomes more important by the increase in the number of stories. For the 6-story frame, a

79
W14x283 is required for the three lower stories if moments are considered in the design
whereas W14x257 section was adequate considering only the cumulative axial forces.
Also, as shown in Figure 3.7 and Figure 3.8, the column moments at DBE target
drift (1.25%) obtained from pushover analysis can be used with reasonable accuracy to
account for column moments during the design. It should be noted that although the
column moments obtained from pushover analysis are smaller than the ones under ground
motions, they occur simultaneously with large axial forces under pushover analysis. As
shown in the previous section, the maximum axial force and maximum moments are not
occurring at the same time under time-history analysis.
Based on observation from this preliminary study, one may conclude that even by
considering only axial forces in capacity design of columns, good performance can still
be expected for the PBPD frame. Two main reasons that even with using only axial
forces in design of columns, still a good performance can be achieved are:1) Pmax and
Mmax in columns are not occurring at the same time; and 2) the axial force used in column
design is based on the fact that all braces buckle and yield at the same time, which applies
the largest possible axial demand on columns. But this does not generally occur during
dynamic response; therefore the axial force demand is lower than the value used for
design.
A practical conclusion is that since it is known that there would be some bending
moments in columns due to unbalanced moments transferred to the column and also from
the continuity of the column itself under dynamic analysis, it would be better to use a W-
sections with larger depth (with almost the same weight) whenever possible, so that
additional bending capacity can be provided.
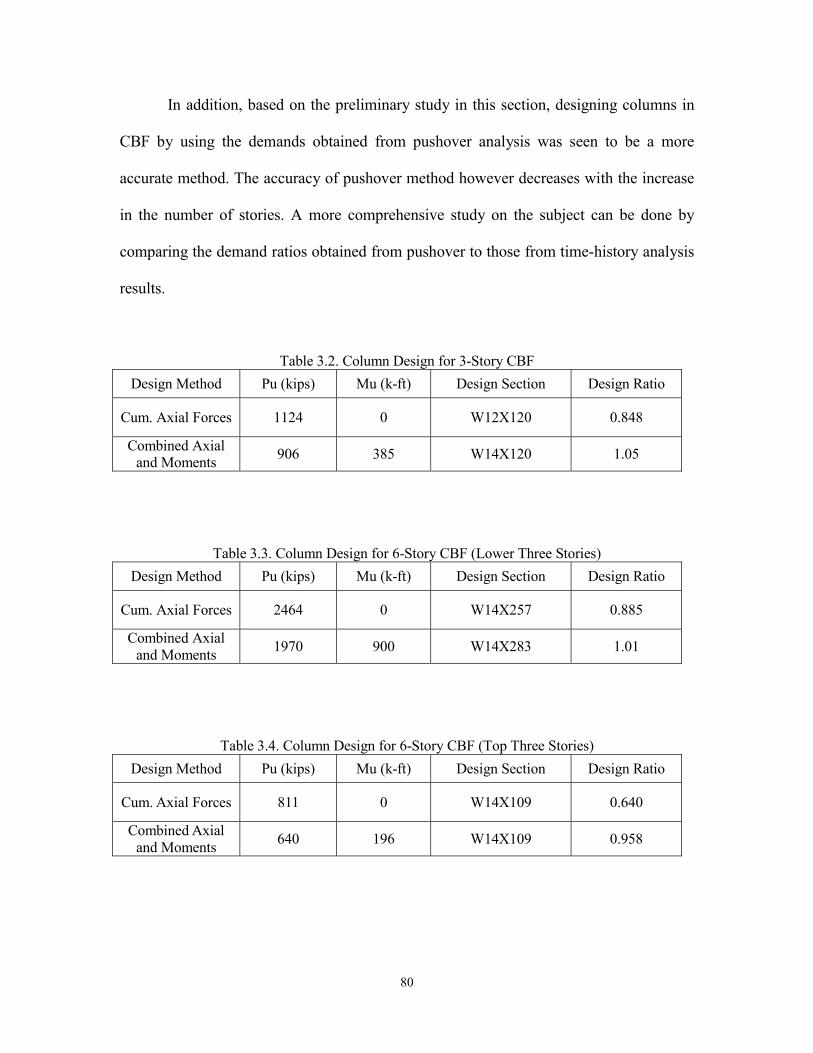
80
In addition, based on the preliminary study in this section, designing columns in
CBF by using the demands obtained from pushover analysis was seen to be a more
accurate method. The accuracy of pushover method however decreases with the increase
in the number of stories. A more comprehensive study on the subject can be done by
comparing the demand ratios obtained from pushover to those from time-history analysis
results.
Table 3.2. Column Design for 3-Story CBF
Design Method Pu (kips) Mu (k-ft) Design Section Design Ratio
Cum. Axial Forces 1124 0 W12X120 0.848
Combined Axial and Moments
906 385 W14X120 1.05
Table 3.3. Column Design for 6-Story CBF (Lower Three Stories)
Design Method Pu (kips) Mu (k-ft) Design Section Design Ratio
Cum. Axial Forces 2464 0 W14X257 0.885
Combined Axial and Moments
1970 900 W14X283 1.01
Table 3.4. Column Design for 6-Story CBF (Top Three Stories)
Design Method Pu (kips) Mu (k-ft) Design Section Design Ratio
Cum. Axial Forces 811 0 W14X109 0.640
Combined Axial and Moments
640 196 W14X109 0.958
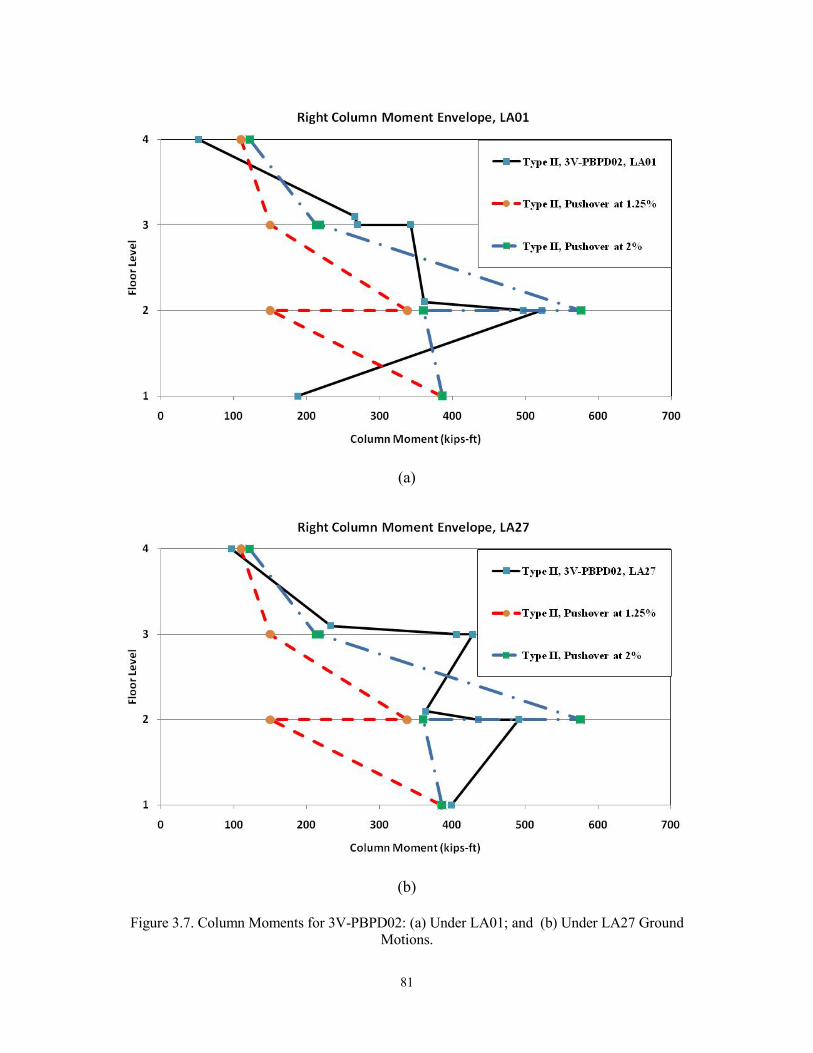
81
(a)
(b)
Figure 3.7. Column Moments for 3V-PBPD02: (a) Under LA01; and (b) Under LA27 Ground Motions.
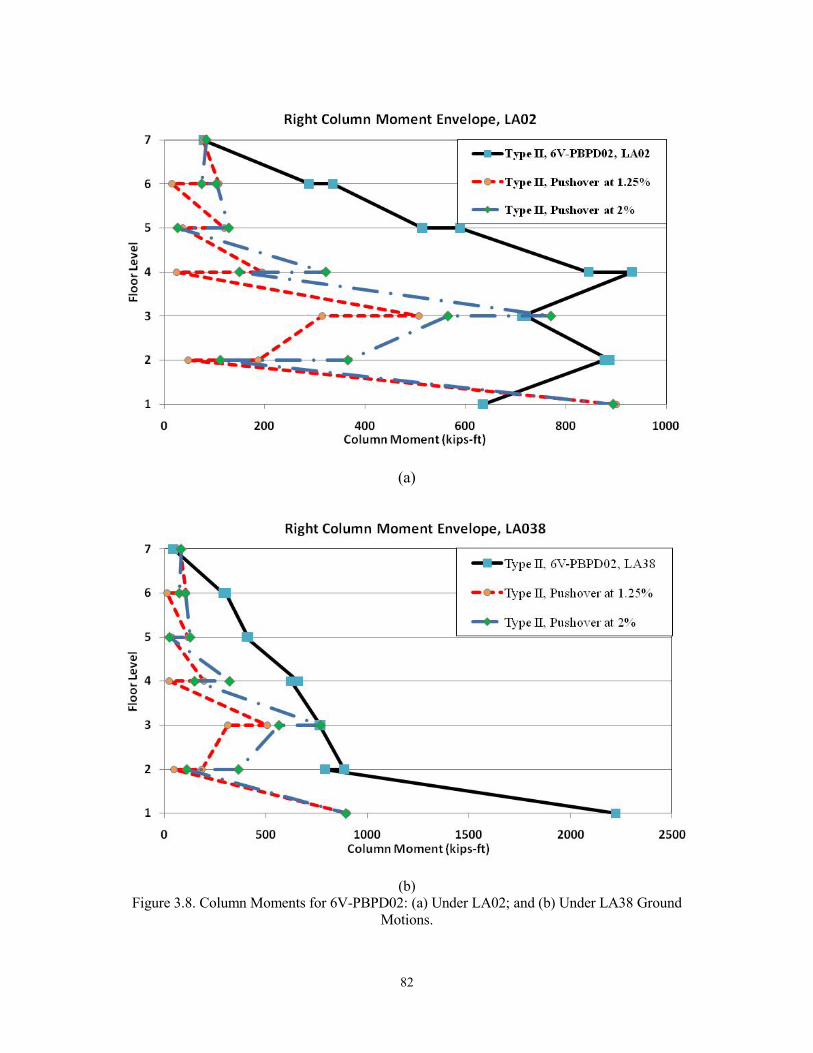
82
(a)
(b) Figure 3.8. Column Moments for 6V-PBPD02: (a) Under LA02; and (b) Under LA38 Ground
Motions.
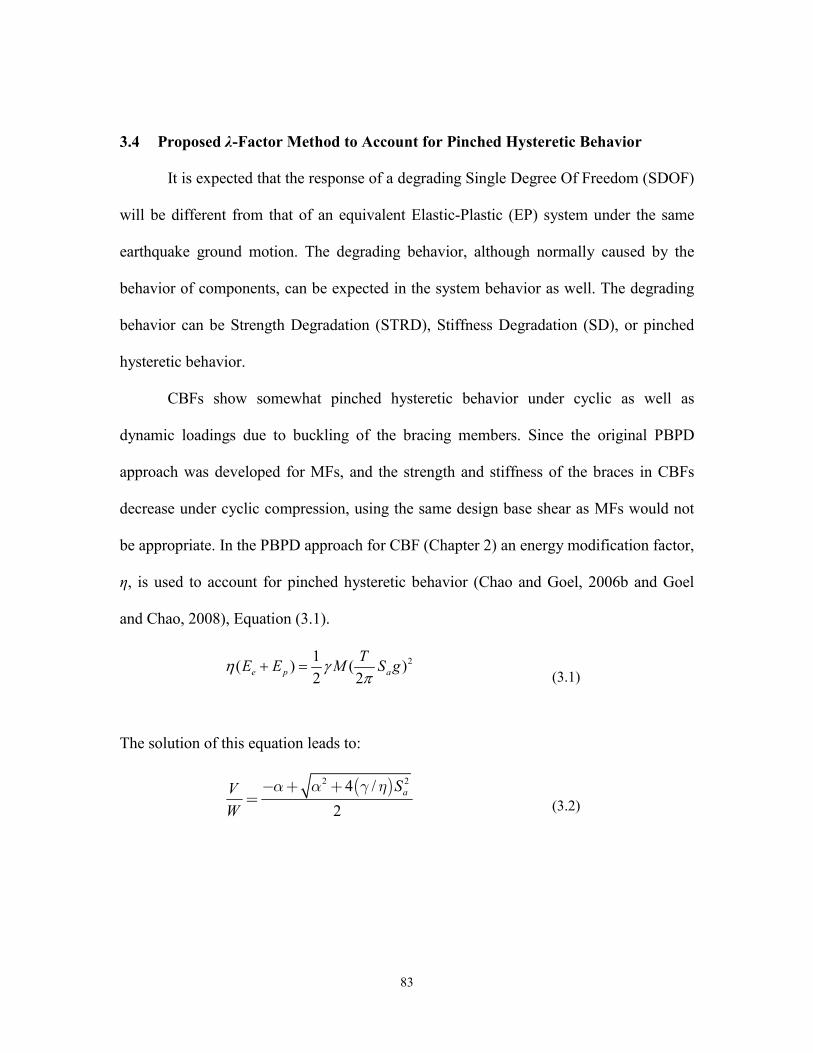
83
3.4 Proposed λ-Factor Method to Account for Pinched Hysteretic Behavior
It is expected that the response of a degrading Single Degree Of Freedom (SDOF)
will be different from that of an equivalent Elastic-Plastic (EP) system under the same
earthquake ground motion. The degrading behavior, although normally caused by the
behavior of components, can be expected in the system behavior as well. The degrading
behavior can be Strength Degradation (STRD), Stiffness Degradation (SD), or pinched
hysteretic behavior.
CBFs show somewhat pinched hysteretic behavior under cyclic as well as
dynamic loadings due to buckling of the bracing members. Since the original PBPD
approach was developed for MFs, and the strength and stiffness of the braces in CBFs
decrease under cyclic compression, using the same design base shear as MFs would not
be appropriate. In the PBPD approach for CBF (Chapter 2) an energy modification factor,
η, is used to account for pinched hysteretic behavior (Chao and Goel, 2006b and Goel
and Chao, 2008), Equation (3.1).
21( ) ( )
2 2 e p a
TE E M S g
( 3.1)
The solution of this equation leads to:
( )2 24 /
2aSV
W
a a g h- + += ( 3.2)
84
By using the energy modification factor, η, the design base shear for the system
with pinched hysteretic behavior is increased with respect to the one for EPP system to
compensate for the pinching effect.
In this approach, the energy modification factor η remains independent of the
fundamental period. Figure 3.9 shows the ratio of the PBPD design base shear for the
pinched system to that of the benchmark EPP system for different values of η. As shown
in this figure, using the same η values, increase in the EPP design base shear is almost the
same for short and long periods. It can also be seen that by using η = 0.5, the design base
shear for the pinched system is almost twice that of the EPP system.
On the other hand, several studies (e.g. Rahnama and Krawinkler, 1993, Gupta
and Krawinkler, 1998, Gupta and Kunnath, 1998, Foutch and Shi, 1998, Medina and
Krawinkler, 2004; Ruiz-Garcia and Miranda, 2005) have shown that, although pinching
alone or in combination with stiffness degradation increases the peak displacement
demands for short period SDOFs (periods less than 0.7 sec) but not for longer periods, as
long as post-yield stiffness remains positive. It can be seen in Figure 3.10, taken from
Ruiz-Garcia and Miranda (2005), that the mean displacement ratio of SD to EPP system
is larger than 1.0 for short periods and can be taken practically equal to 1.0 for longer
periods. The results in this figure are obtained for site Class D. Also, the ratio increases
with increase in the R value. Larger R value corresponds to a weaker system. Therefore,
the significance of the effect of pinching (SD and STRD) on the overall performance of
structures varies with the period.
An alternative approach, called λ-factor method, to take this variation into account
for design of SD and pinched systems by the PBPD approach is presented herein.
85
In this approach, the target ductility (corresponding to the target drift) is directly
modified to account for the SD, pinching, or other degradation effects. An effective
ductility for the degrading system can be obtained by dividing the actual target ductility
by a factor called the -factor. The -factor in general can be considered as the average
ratio of the peak displacement of a degrading system to that of an equivalent EPP system
under the same earthquake ground motion. Therefore, = (μpinched/μEPP).
CBFs show somewhat moderate pinching behavior due to buckling of bracing
members. -R-T curves (with constant R-values) can be obtained by applying suitable
sets of ground motion to pinched systems with different periods and the corresponding
equivalent EPP systems as benchmark.
The procedure to obtain -R-T curves is as follows:
- Select the period for pinched system, T. For this period to be achieved, mass
can be taken equal to 1.0 and the stiffness k can be changed to get the
desired T.
- Find the pseudo spectral acceleration at the selected period T for each ground
motion in the set.
- Find maximum elastic base shear as 1.0e a a aV M S S S .
- Select the desired constant R value (e.g. R=4).
- Since the actual R value from dynamic analysis is R = Ve/Vy, in order to get
constant R values under all ground motions in the set, either the Vy or the
ground motion intensity should be adjusted. If Vy is taken as constant, then a
86
proper scale factor should be applied to each ground motion such that
1.0e a a a yV M S S S R V .
- Find = (Δpinched/ΔEPP).
- With the same R value, select a new period and repeat the above steps to
obtain values.
- When the -R-T curve for an R value is obtained, select a different R value
and follow the above procedure.
Alternatively and pending further study to obtain -R-T curves for pinched
systems representing CBFs, the C2 factor introduced in FEMA 356 (FEMA, 2000a) for
SD systems can be used as a preliminary approximation. The coefficient C2 is the
modification factor to represent the effect of pinching, SD, and STRD on the peak
displacement response according to FEMA 356. In FEMA 356, values of C2 depend on
the structural framing system and the structural performance levels. Those values, taken
from Table 3-3 in FEMA 356, are drawn in FEMA 440 (FEMA, 2005) and are shown in
Figure 3.11.
These approximations for C2 are obtained for systems with rather severe pinching
behavior and also systems with STRD. For CBF which have moderate pinching behavior
slightly different λ-factors based on C2 values are suggested in this study, as shown in
Figure 3.13.
The PBPD procedure to obtain the design base shear for such systems is as
follows:
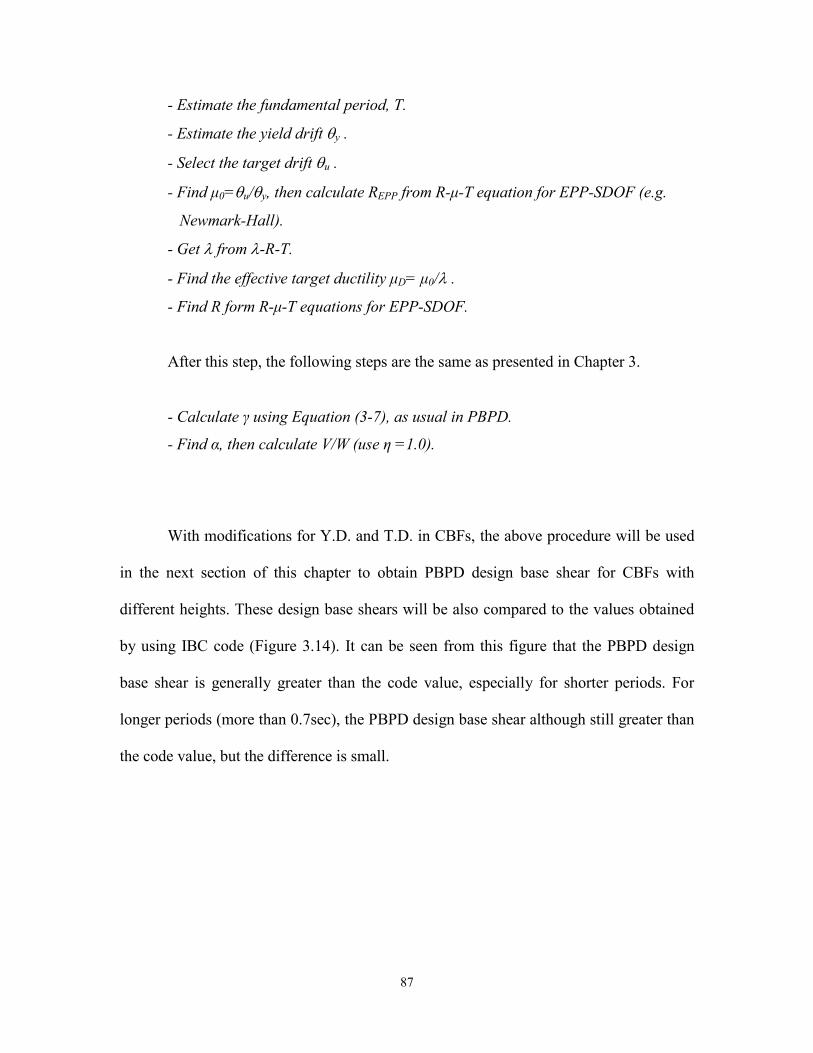
87
- Estimate the fundamental period, T.
- Estimate the yield drift y .
- Select the target drift u .
- Find μ0=u/y, then calculate REPP from R-μ-T equation for EPP-SDOF (e.g.
Newmark-Hall).
- Get from -R-T.
- Find the effective target ductility μD= μ0/ .
- Find R form R-μ-T equations for EPP-SDOF.
After this step, the following steps are the same as presented in Chapter 3.
- Calculate γ using Equation (3-7), as usual in PBPD.
- Find α, then calculate V/W (use η =1.0).
With modifications for Y.D. and T.D. in CBFs, the above procedure will be used
in the next section of this chapter to obtain PBPD design base shear for CBFs with
different heights. These design base shears will be also compared to the values obtained
by using IBC code (Figure 3.14). It can be seen from this figure that the PBPD design
base shear is generally greater than the code value, especially for shorter periods. For
longer periods (more than 0.7sec), the PBPD design base shear although still greater than
the code value, but the difference is small.
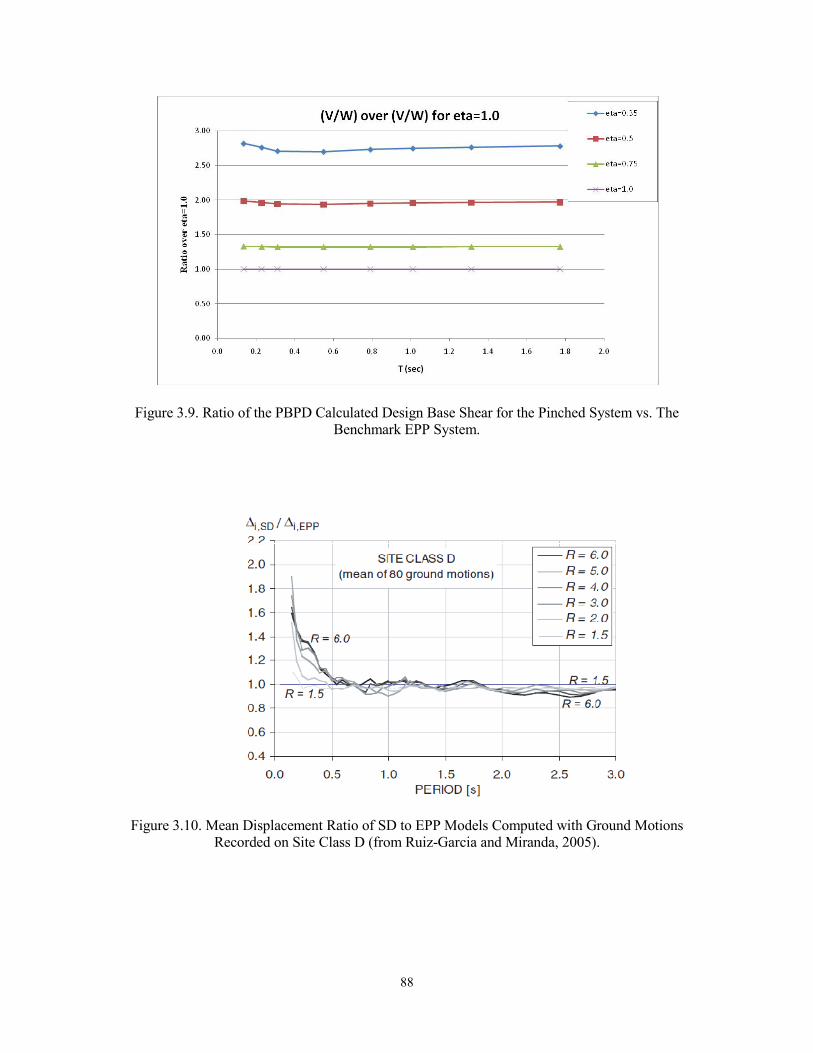
88
Figure 3.9. Ratio of the PBPD Calculated Design Base Shear for the Pinched System vs. The Benchmark EPP System.
Figure 3.10. Mean Displacement Ratio of SD to EPP Models Computed with Ground Motions Recorded on Site Class D (from Ruiz-Garcia and Miranda, 2005).
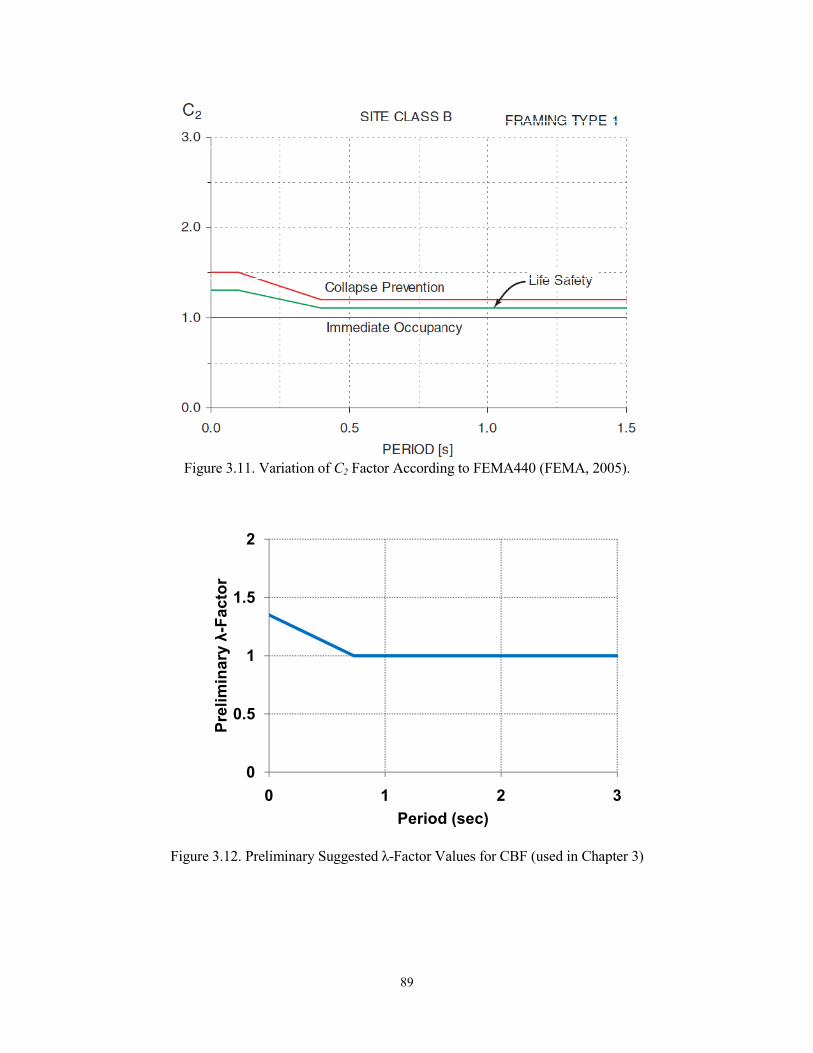
89
Figure 3.11. Variation of C2 Factor According to FEMA440 (FEMA, 2005).
Figure 3.12. Preliminary Suggested λ-Factor Values for CBF (used in Chapter 3)
0
0.5
1
1.5
2
0 1 2 3
Pre
lim
inar
y λ
-Fac
tor
Period (sec)
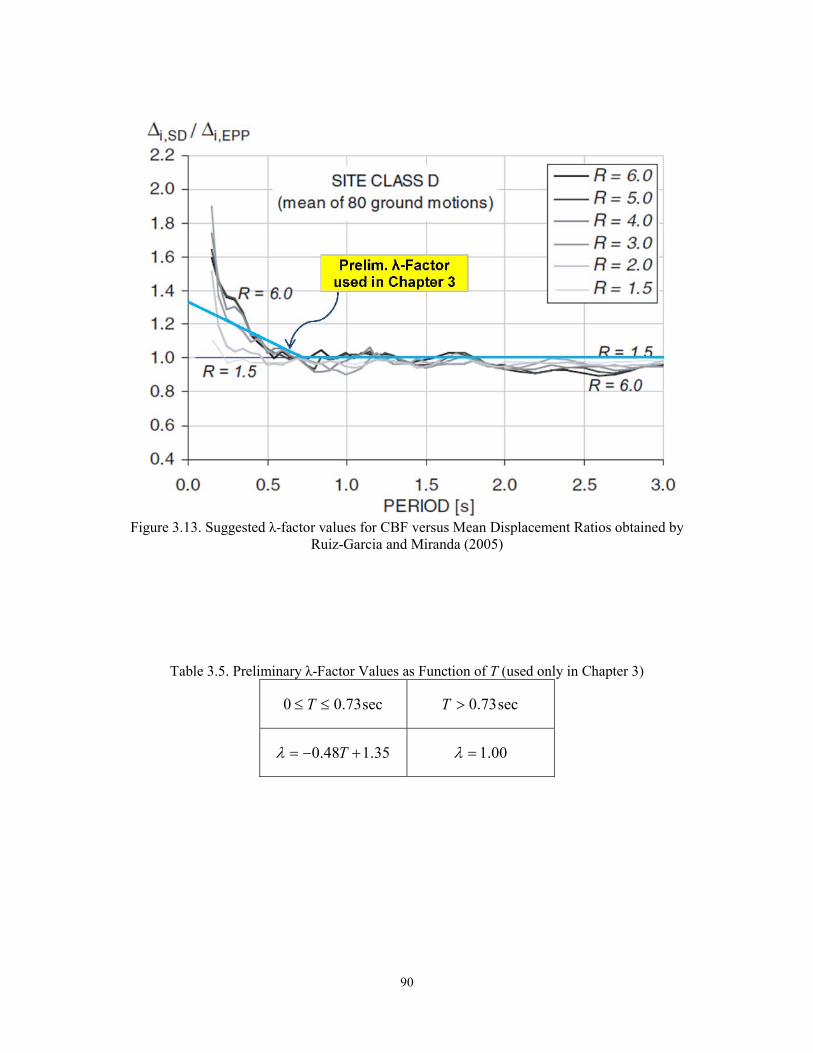
90
Figure 3.13. Suggested λ-factor values for CBF versus Mean Displacement Ratios obtained by
Ruiz-Garcia and Miranda (2005)
Table 3.5. Preliminary λ-Factor Values as Function of T (used only in Chapter 3)
sec73.00 T sec73.0T
35.148.0 T 00.1
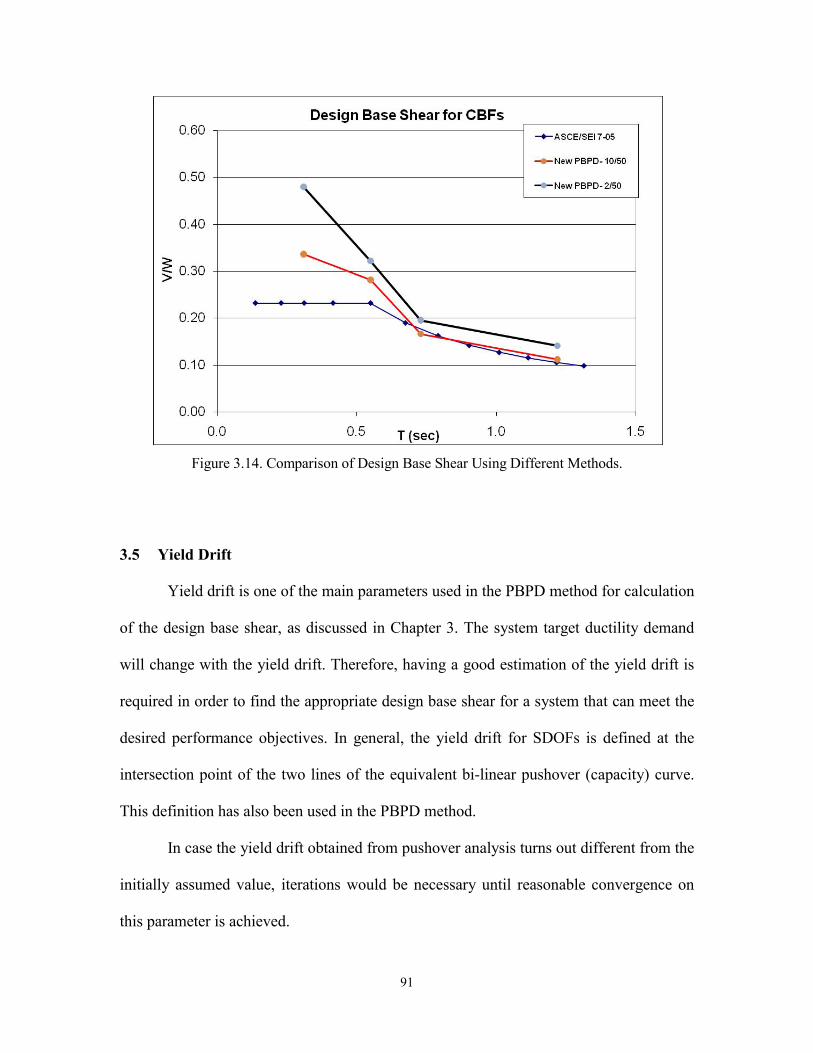
91
Figure 3.14. Comparison of Design Base Shear Using Different Methods.
3.5 Yield Drift
Yield drift is one of the main parameters used in the PBPD method for calculation
of the design base shear, as discussed in Chapter 3. The system target ductility demand
will change with the yield drift. Therefore, having a good estimation of the yield drift is
required in order to find the appropriate design base shear for a system that can meet the
desired performance objectives. In general, the yield drift for SDOFs is defined at the
intersection point of the two lines of the equivalent bi-linear pushover (capacity) curve.
This definition has also been used in the PBPD method.
In case the yield drift obtained from pushover analysis turns out different from the
initially assumed value, iterations would be necessary until reasonable convergence on
this parameter is achieved.

92
It should be noted that in the PBPD method, it would be unconservative if a
smaller than the actual value for yield drift is used in design base shear calculation. That
is because a smaller yield drift would give a larger ductility ratio and therefore a smaller
design base shear. The actual value for the yield drift can be obtained from pushover
analysis under the same lateral force distribution used in design.
It has been observed in several studies that regular Moment Frames (MFs) show
practically constant yield drift of about 1.0% regardless of their height or bay width (Lee,
2002 and Goel and Chao, 2008). This is mainly due to the fact that in regular MFs, the
contribution of stiffness of the beams is significantly larger than that of the columns, and
also axial deformation of columns is negligible (Miranda and Akkar, 2006). On the other
hand, it is known that the flexural type of deformation caused by axial deformation of
columns in slender braced frames (i.e. CBFs, BRBFs, EBFs, and SPSWs) results in
significant change in the yield drift. For instance, it has been observed from the results of
the study by Richard (2009) that the yield drift for BRBFs, CBFs, and EBFs significantly
increases with the increase in the height of the frame. The yield drift for the 3-story frame
is about 0.3%, whereas the yield drift for the 9-story and 18-story frames are
approximately 0.5% and 1.1%, respectively (Figure 3.15).
A building structure can be considered as a vertical cantilever beam which has
shear as well as flexural modes of deformation. Therefore, the lateral deflection of frames
can be obtained by adding the deformations from the shear and flexural modes together.
In order to obtain the shear deformation, one can assume the columns to be axially rigid
(Figure 3.16.a). Therefore, there would be no axial deformation for columns in this mode
which basically means that there is no flexural lateral deformation. In the flexural mode
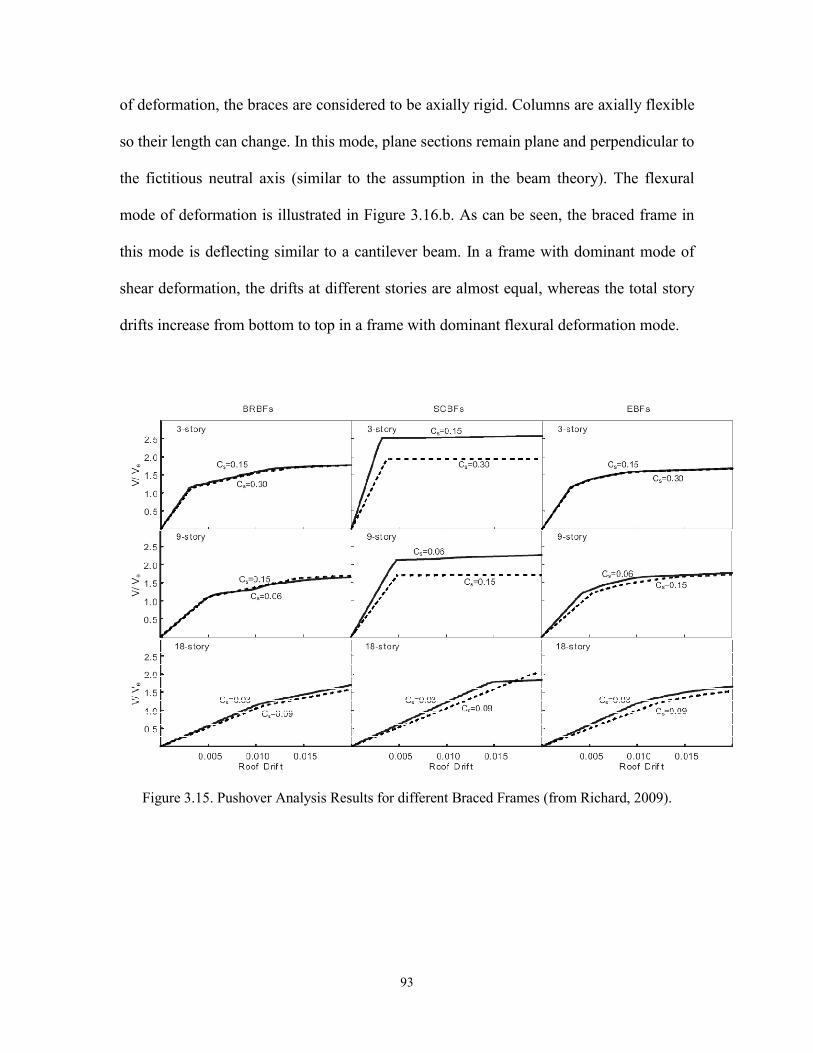
93
of deformation, the braces are considered to be axially rigid. Columns are axially flexible
so their length can change. In this mode, plane sections remain plane and perpendicular to
the fictitious neutral axis (similar to the assumption in the beam theory). The flexural
mode of deformation is illustrated in Figure 3.16.b. As can be seen, the braced frame in
this mode is deflecting similar to a cantilever beam. In a frame with dominant mode of
shear deformation, the drifts at different stories are almost equal, whereas the total story
drifts increase from bottom to top in a frame with dominant flexural deformation mode.
Figure 3.15. Pushover Analysis Results for different Braced Frames (from Richard, 2009).

94
a) b) c)
Figure 3.16. Different Components of Lateral Drift in a Braced Frame: (a) Shear Mode of Deformation; (b) Flexural Mode of Deformation; and (c) Total Deformations (from Calvi, M.J.N.
Priestley, 2006 (presentation)).
There are several reasons for the fact that in a typical MF, the deflection due to
the flexural mode of deformation is negligible (unless we have only a one bay MF). First
of all, in a MF the lateral loads are mainly resisted by bending action in beams and
columns as opposed to the axial action in braced and columns of a braced frame. As a
result, the axial forces in columns of a MF are relatively smaller than those in a braced
frame and thus the change in the length of the columns due to lateral loads would be
smaller. The other reason is that there are usually several bays in a typical MF system
which carry the lateral loads. The axial forces in the interior columns due to lateral loads
are very small (negligible) and therefore there is no axial deformation in these columns.
Exterior columns may have significant axial forces, but due to the presence of several
bays, the moment arm against the overturning moment is large resulting in much smaller
axial forces compared to braced frames with single bay. Also, for the beam lines to
rigidly rotate in order to produce flexural deformation, they have to overcome the axial
stiffness of the interior columns.
On the other hand, in braced systems like CBFs, there is usually a single bay
resisting the lateral loads. Therefore, both columns are exterior and both carry significant
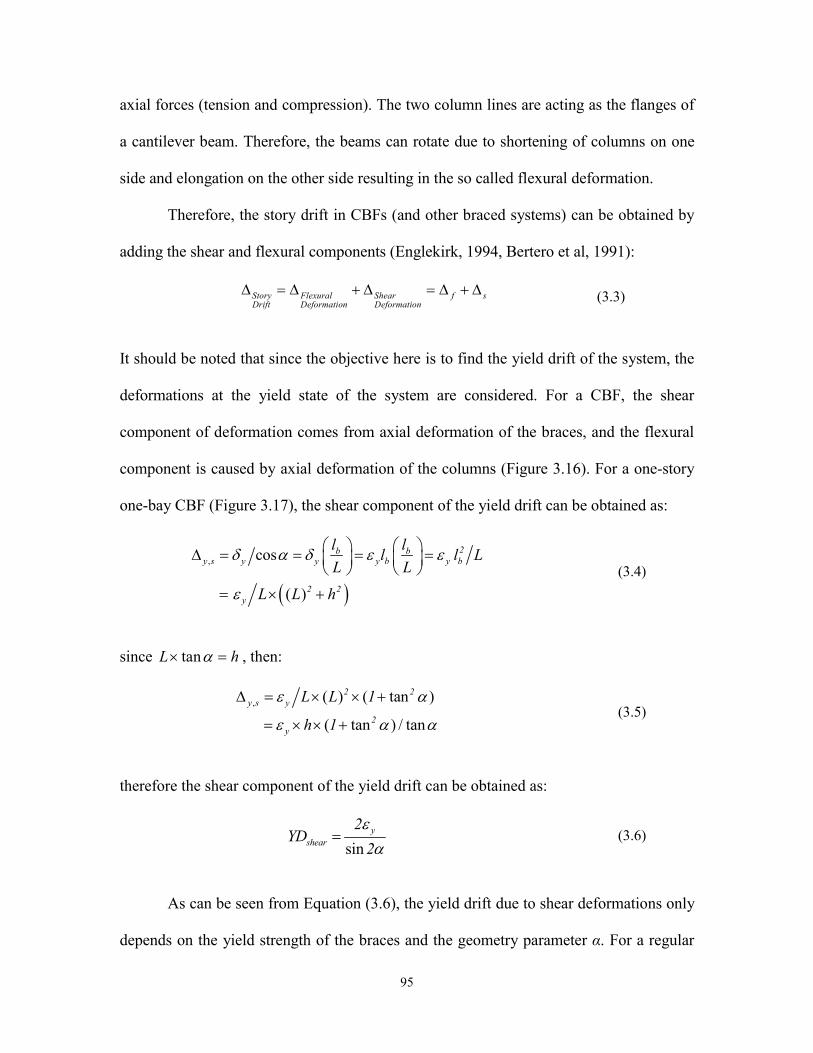
95
axial forces (tension and compression). The two column lines are acting as the flanges of
a cantilever beam. Therefore, the beams can rotate due to shortening of columns on one
side and elongation on the other side resulting in the so called flexural deformation.
Therefore, the story drift in CBFs (and other braced systems) can be obtained by
adding the shear and flexural components (Englekirk, 1994, Bertero et al, 1991):
Story Flexural Shear f sDrift Deformation Deformation
( 3.3)
It should be noted that since the objective here is to find the yield drift of the system, the
deformations at the yield state of the system are considered. For a CBF, the shear
component of deformation comes from axial deformation of the braces, and the flexural
component is caused by axial deformation of the columns (Figure 3.16). For a one-story
one-bay CBF (Figure 3.17), the shear component of the yield drift can be obtained as:
, cos
( )
2b by s y y y b y b
2 2y
l ll l L
L L
L L h
( 3.4)
since tanL h , then:
, ( ) ( tan )
( tan ) / tan
2 2y s y
2y
L L 1
h 1
( 3.5)
therefore the shear component of the yield drift can be obtained as:
siny
shear
2YD
2
( 3.6)
As can be seen from Equation ( 3.6), the yield drift due to shear deformations only
depends on the yield strength of the braces and the geometry parameter α. For a regular
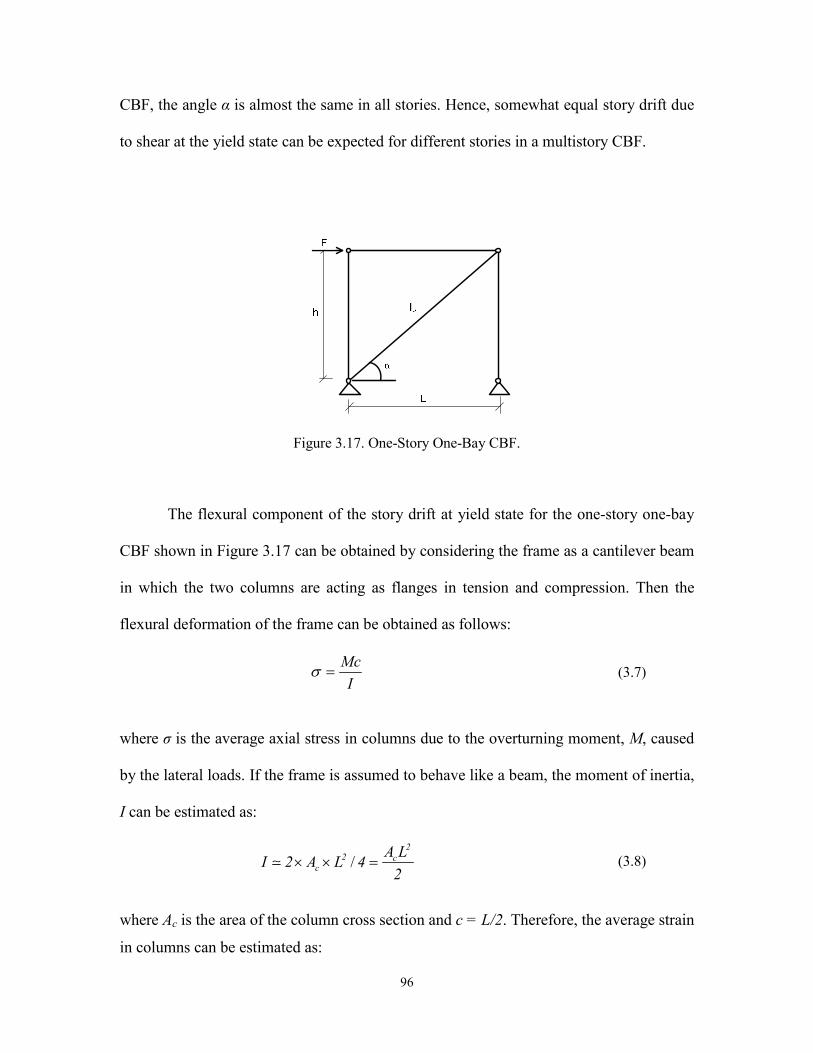
96
CBF, the angle α is almost the same in all stories. Hence, somewhat equal story drift due
to shear at the yield state can be expected for different stories in a multistory CBF.
Figure 3.17. One-Story One-Bay CBF.
The flexural component of the story drift at yield state for the one-story one-bay
CBF shown in Figure 3.17 can be obtained by considering the frame as a cantilever beam
in which the two columns are acting as flanges in tension and compression. Then the
flexural deformation of the frame can be obtained as follows:
Mc
I ( 3.7)
where σ is the average axial stress in columns due to the overturning moment, M, caused
by the lateral loads. If the frame is assumed to behave like a beam, the moment of inertia,
I can be estimated as:
/2
2 cc
A LI 2 A L 4
2 ( 3.8)
where Ac is the area of the column cross section and c = L/2. Therefore, the average strain
in columns can be estimated as:
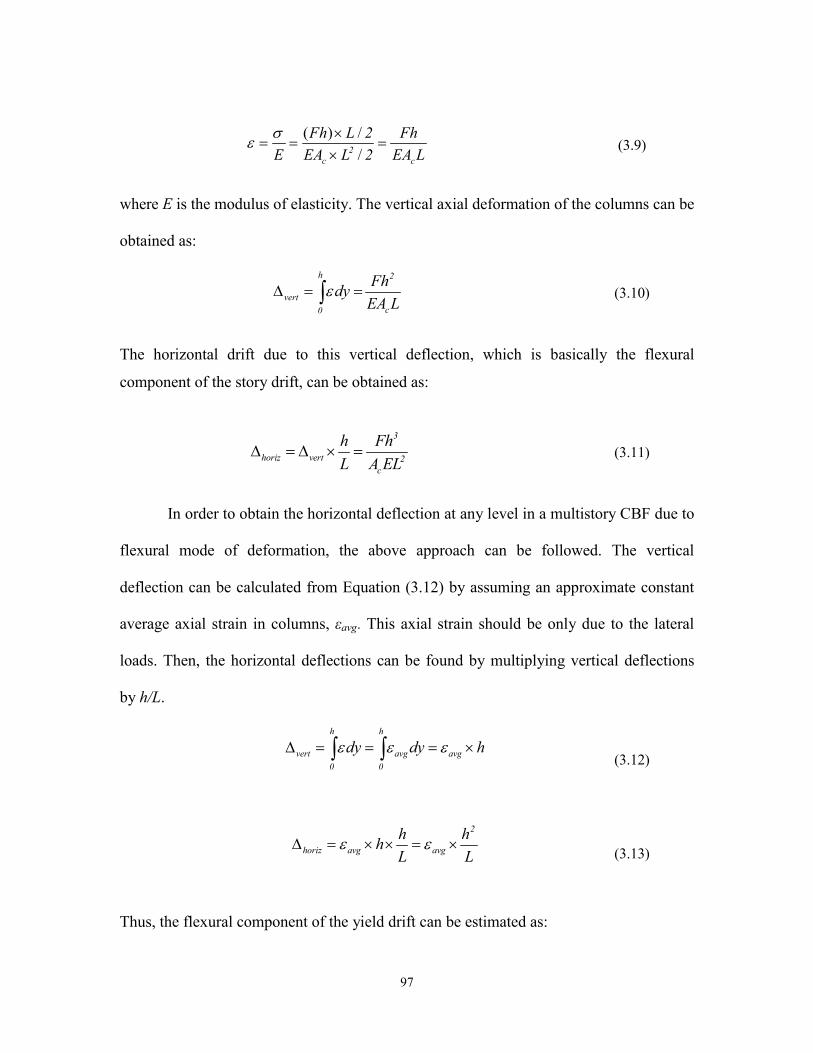
97
( ) /
/2c c
Fh L 2 Fh
E EA L 2 EA L
( 3.9)
where E is the modulus of elasticity. The vertical axial deformation of the columns can be
obtained as:
h 2
vertc0
Fhdy
EA L ( 3.10)
The horizontal drift due to this vertical deflection, which is basically the flexural
component of the story drift, can be obtained as:
3
horiz vert 2c
h Fh
L A EL ( 3.11)
In order to obtain the horizontal deflection at any level in a multistory CBF due to
flexural mode of deformation, the above approach can be followed. The vertical
deflection can be calculated from Equation ( 3.12) by assuming an approximate constant
average axial strain in columns, εavg. This axial strain should be only due to the lateral
loads. Then, the horizontal deflections can be found by multiplying vertical deflections
by h/L.
h h
vert avg avg
0 0
dy dy h ( 3.12)
2
horiz avg avg
h hh
L L
( 3.13)
Thus, the flexural component of the yield drift can be estimated as:
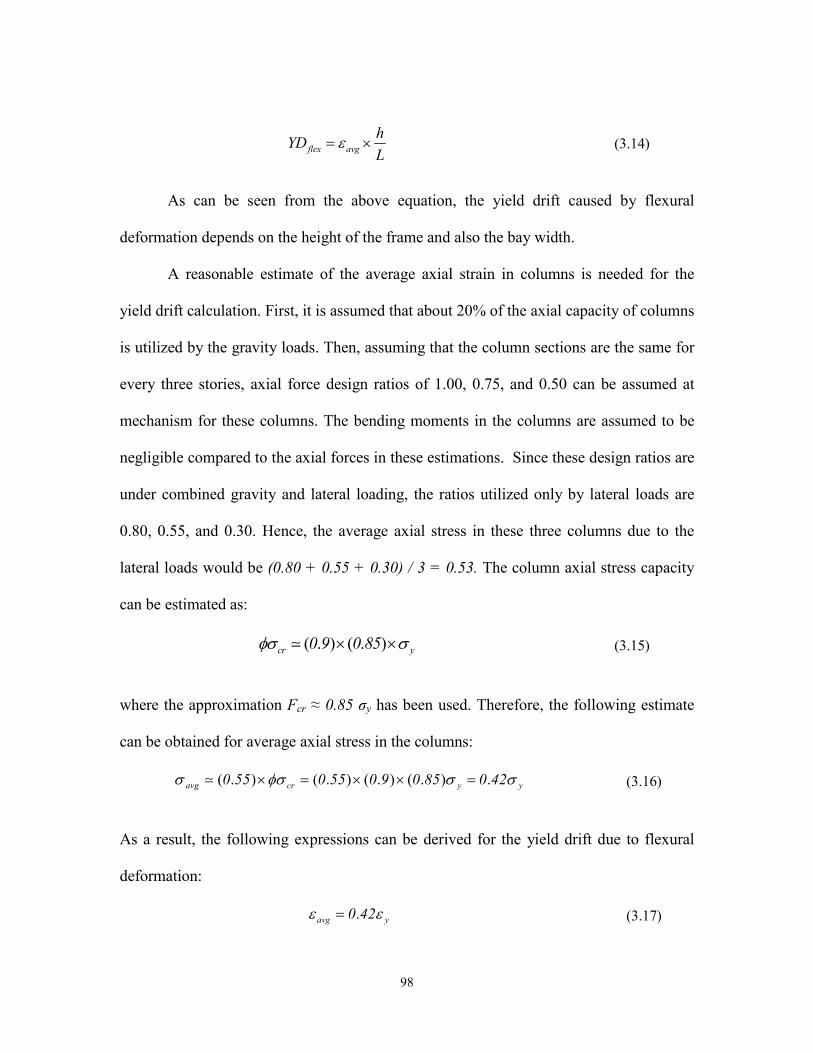
98
flex avg
hYD
L ( 3.14)
As can be seen from the above equation, the yield drift caused by flexural
deformation depends on the height of the frame and also the bay width.
A reasonable estimate of the average axial strain in columns is needed for the
yield drift calculation. First, it is assumed that about 20% of the axial capacity of columns
is utilized by the gravity loads. Then, assuming that the column sections are the same for
every three stories, axial force design ratios of 1.00, 0.75, and 0.50 can be assumed at
mechanism for these columns. The bending moments in the columns are assumed to be
negligible compared to the axial forces in these estimations. Since these design ratios are
under combined gravity and lateral loading, the ratios utilized only by lateral loads are
0.80, 0.55, and 0.30. Hence, the average axial stress in these three columns due to the
lateral loads would be (0.80 + 0.55 + 0.30) / 3 = 0.53. The column axial stress capacity
can be estimated as:
( . ) ( . )cr y0 9 0 85 ( 3.15)
where the approximation Fcr ≈ 0.85 σy has been used. Therefore, the following estimate
can be obtained for average axial stress in the columns:
( . ) ( . ) ( . ) ( . ) .avg cr y y0 55 0 55 0 9 0 85 0 42 ( 3.16)
As a result, the following expressions can be derived for the yield drift due to flexural
deformation:
.avg y0 42 ( 3.17)

99
and
. .
.
avg yflex
0 42h h 0 42 46 hYD
E L E L 29000 Lh
0 000761L
( 3.18)
The yield stress of 46 ksi for HSS sections was used to obtain the numerical values in the
above equation.
It should be noted that in Chevron braced frames the effective h can be considered
from the base to the bottom of top story (i.e. very small contribution of column axial
deformation from the top story). Table 3.6 shows the calculated yield drift values for four
CBFs of different heights. The geometrical information for theses frames is shown in
Figure 3.18. The 6-story frame is assumed to have plan and elevation properties similar to
the 9-story one frame. The effective height, heff, which is basically the total height minus
the height of top story, is used in yield drift calculation. As can be seen, the calculated
yield drifts are quite close to the ones obtained from a pushover analysis of the final
designs shown in Figure 3.15. These yield drifts will be used in the following sections to
calculate the design base shear for example CBF frames.
Table 3.6. Yield Drift for CBFs. CBF
Frame heff (ft) L (ft)
α (deg)
Y.D.f Y.D.s Y.D.total Y.D. from pushover
3-Story (SAC)
25 30 40.9 0.055% 0.317% 0.37% 0.35-0.4%
6-Story (Guideline)
70 30 40.9 0.155% 0.317% 0.47% 0.48%
9-Story (SAC)
109 30 40.9 0.242% 0.317% 0.56% 0.5-0.6%
18-Story (SAC)
226 20 52.4 0.753% 0.328% 1.08% 1.1-1.4%

100
Figure 3.18. Elevation Views of CBF Buildings: (a) 3-Story; (b) 9-Story; and (c) 18-Story.
3.6 Selection of Proper Target Drift for CBFs
In MFs, the roof drift can be considered as a good representative of story drifts
since the shear mode of deformation governs the behavior. However, in braced frames
(e.g. CBFs), the roof drift may not be an accurate estimation of the story drifts (especially
as the height increases) due to the presence of flexural deformations.
In the previously studied 3-story and 6-story CBFs (Sabelli, 2000; Chao and Goel,
2006b; Chao, Bayat, and Geol, 2008; and Goel and Chao, 2008), the flexural
deformations caused by axial deformation of columns were rather small compared to the
shear deformations. This is the main reason that although such flexural deformations
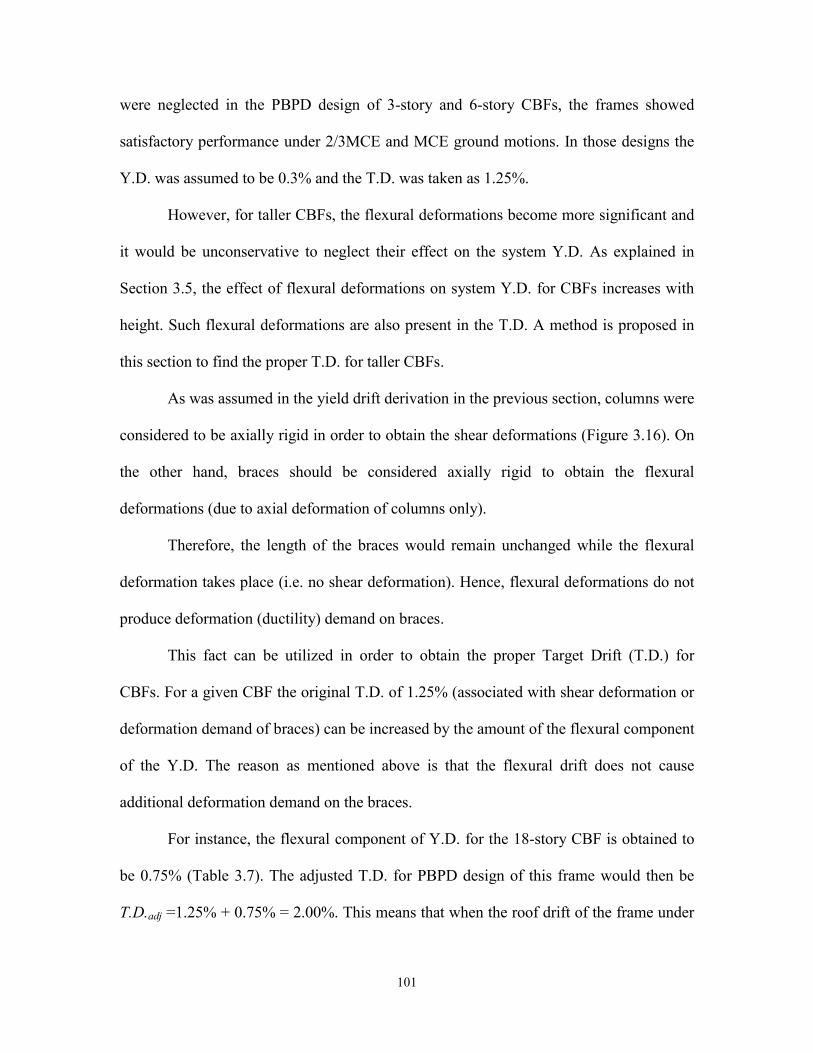
101
were neglected in the PBPD design of 3-story and 6-story CBFs, the frames showed
satisfactory performance under 2/3MCE and MCE ground motions. In those designs the
Y.D. was assumed to be 0.3% and the T.D. was taken as 1.25%.
However, for taller CBFs, the flexural deformations become more significant and
it would be unconservative to neglect their effect on the system Y.D. As explained in
Section 3.5, the effect of flexural deformations on system Y.D. for CBFs increases with
height. Such flexural deformations are also present in the T.D. A method is proposed in
this section to find the proper T.D. for taller CBFs.
As was assumed in the yield drift derivation in the previous section, columns were
considered to be axially rigid in order to obtain the shear deformations (Figure 3.16). On
the other hand, braces should be considered axially rigid to obtain the flexural
deformations (due to axial deformation of columns only).
Therefore, the length of the braces would remain unchanged while the flexural
deformation takes place (i.e. no shear deformation). Hence, flexural deformations do not
produce deformation (ductility) demand on braces.
This fact can be utilized in order to obtain the proper Target Drift (T.D.) for
CBFs. For a given CBF the original T.D. of 1.25% (associated with shear deformation or
deformation demand of braces) can be increased by the amount of the flexural component
of the Y.D. The reason as mentioned above is that the flexural drift does not cause
additional deformation demand on the braces.
For instance, the flexural component of Y.D. for the 18-story CBF is obtained to
be 0.75% (Table 3.7). The adjusted T.D. for PBPD design of this frame would then be
T.D.adj =1.25% + 0.75% = 2.00%. This means that when the roof drift of the frame under
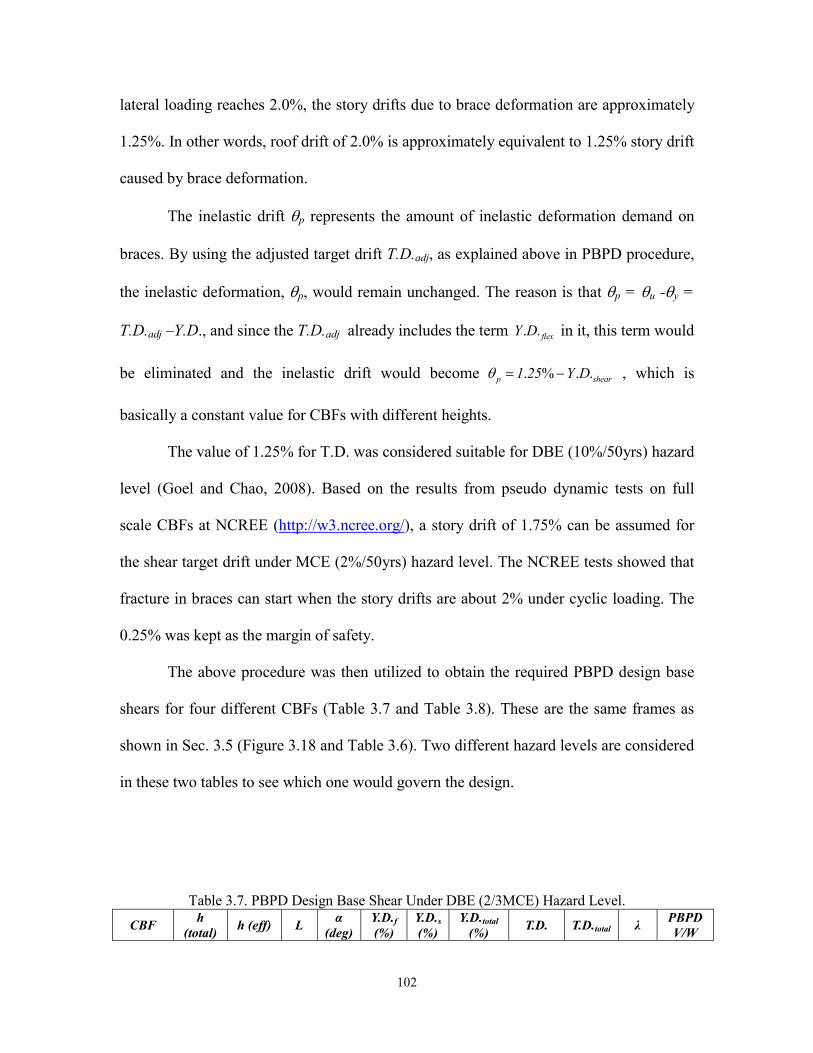
102
lateral loading reaches 2.0%, the story drifts due to brace deformation are approximately
1.25%. In other words, roof drift of 2.0% is approximately equivalent to 1.25% story drift
caused by brace deformation.
The inelastic drift p represents the amount of inelastic deformation demand on
braces. By using the adjusted target drift T.D.adj, as explained above in PBPD procedure,
the inelastic deformation, p, would remain unchanged. The reason is that p = u -y =
T.D.adj –Y.D., and since the T.D.adj already includes the term . . flexY D in it, this term would
be eliminated and the inelastic drift would become . % . .p shear1 25 Y D , which is
basically a constant value for CBFs with different heights.
The value of 1.25% for T.D. was considered suitable for DBE (10%/50yrs) hazard
level (Goel and Chao, 2008). Based on the results from pseudo dynamic tests on full
scale CBFs at NCREE (http://w3.ncree.org/), a story drift of 1.75% can be assumed for
the shear target drift under MCE (2%/50yrs) hazard level. The NCREE tests showed that
fracture in braces can start when the story drifts are about 2% under cyclic loading. The
0.25% was kept as the margin of safety.
The above procedure was then utilized to obtain the required PBPD design base
shears for four different CBFs (Table 3.7 and Table 3.8). These are the same frames as
shown in Sec. 3.5 (Figure 3.18 and Table 3.6). Two different hazard levels are considered
in these two tables to see which one would govern the design.
Table 3.7. PBPD Design Base Shear Under DBE (2/3MCE) Hazard Level.
CBF h
(total) h (eff) L
α (deg)
Y.D.f (%)
Y.D.s (%)
Y.D.total (%)
T.D. T.D.total λ PBPD V/W
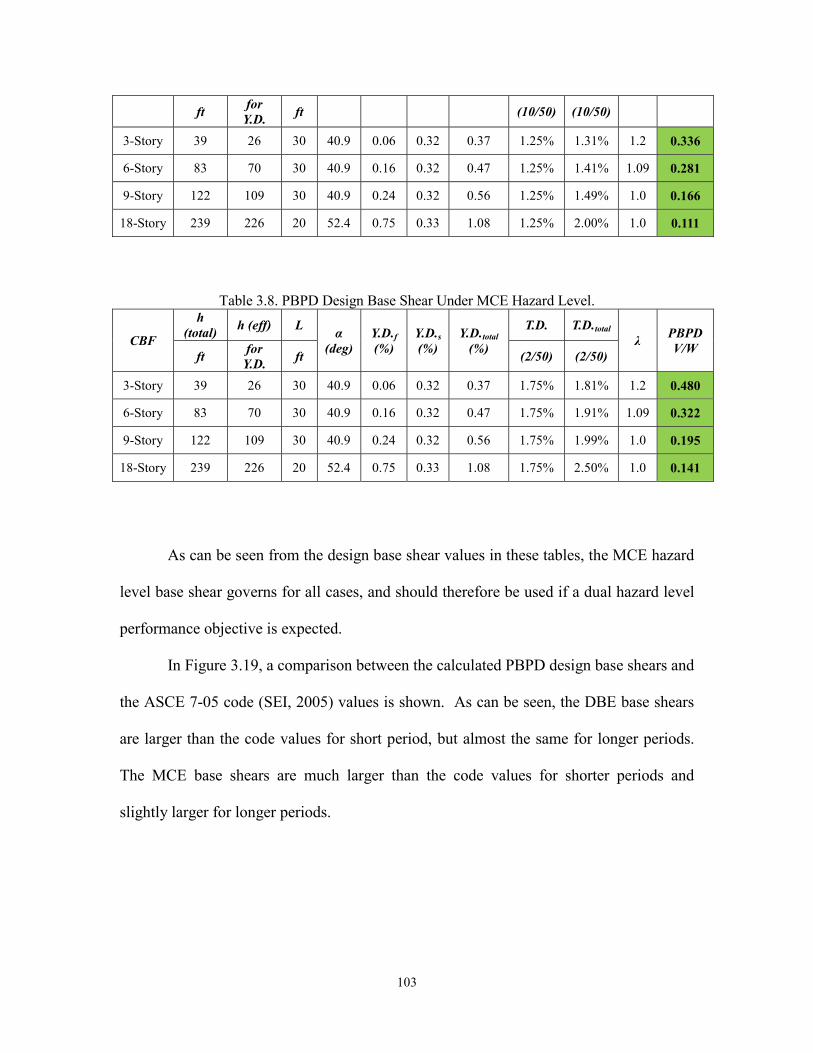
103
ft for
Y.D. ft (10/50) (10/50)
3-Story 39 26 30 40.9 0.06 0.32 0.37 1.25% 1.31% 1.2 0.336
6-Story 83 70 30 40.9 0.16 0.32 0.47 1.25% 1.41% 1.09 0.281
9-Story 122 109 30 40.9 0.24 0.32 0.56 1.25% 1.49% 1.0 0.166
18-Story 239 226 20 52.4 0.75 0.33 1.08 1.25% 2.00% 1.0 0.111
Table 3.8. PBPD Design Base Shear Under MCE Hazard Level.
CBF
h (total)
h (eff) L α
(deg) Y.D.f (%)
Y.D.s (%)
Y.D.total (%)
T.D. T.D.total λ
PBPD V/W
ft for
Y.D. ft (2/50) (2/50)
3-Story 39 26 30 40.9 0.06 0.32 0.37 1.75% 1.81% 1.2 0.480
6-Story 83 70 30 40.9 0.16 0.32 0.47 1.75% 1.91% 1.09 0.322
9-Story 122 109 30 40.9 0.24 0.32 0.56 1.75% 1.99% 1.0 0.195
18-Story 239 226 20 52.4 0.75 0.33 1.08 1.75% 2.50% 1.0 0.141
As can be seen from the design base shear values in these tables, the MCE hazard
level base shear governs for all cases, and should therefore be used if a dual hazard level
performance objective is expected.
In Figure 3.19, a comparison between the calculated PBPD design base shears and
the ASCE 7-05 code (SEI, 2005) values is shown. As can be seen, the DBE base shears
are larger than the code values for short period, but almost the same for longer periods.
The MCE base shears are much larger than the code values for shorter periods and
slightly larger for longer periods.
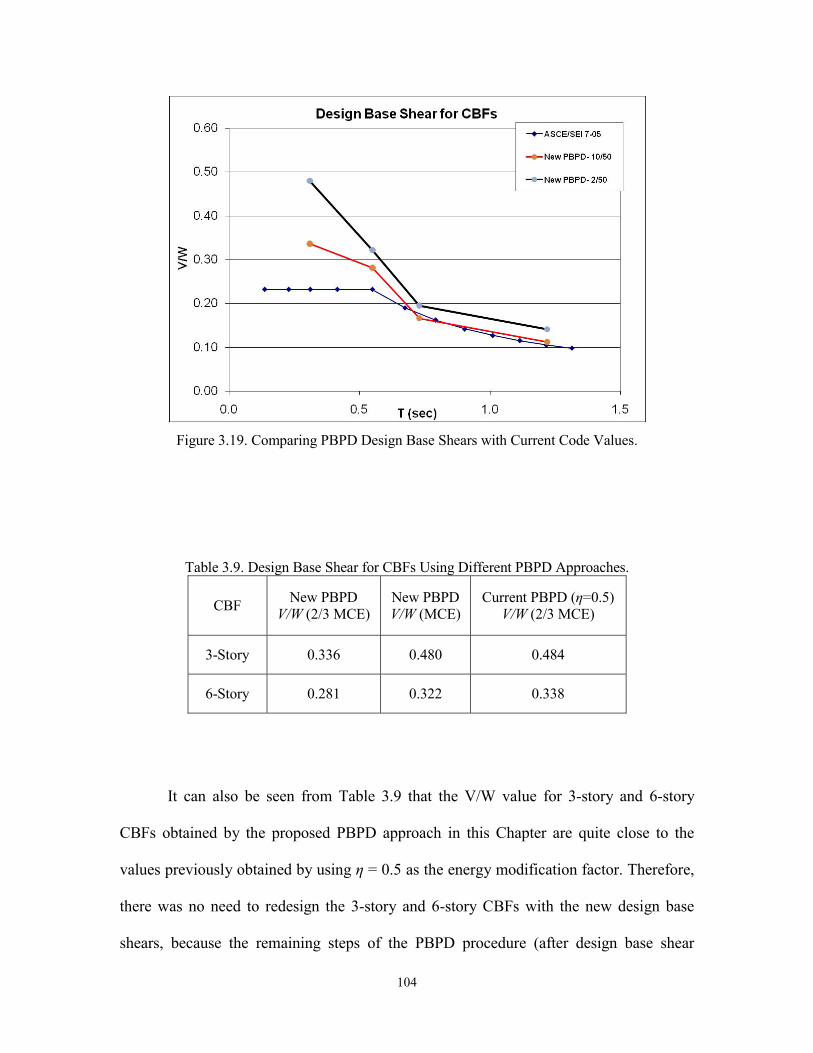
104
Figure 3.19. Comparing PBPD Design Base Shears with Current Code Values.
Table 3.9. Design Base Shear for CBFs Using Different PBPD Approaches.
CBF New PBPD
V/W (2/3 MCE) New PBPD V/W (MCE)
Current PBPD (η=0.5) V/W (2/3 MCE)
3-Story 0.336 0.480 0.484
6-Story 0.281 0.322 0.338
It can also be seen from Table 3.9 that the V/W value for 3-story and 6-story
CBFs obtained by the proposed PBPD approach in this Chapter are quite close to the
values previously obtained by using η = 0.5 as the energy modification factor. Therefore,
there was no need to redesign the 3-story and 6-story CBFs with the new design base
shears, because the remaining steps of the PBPD procedure (after design base shear
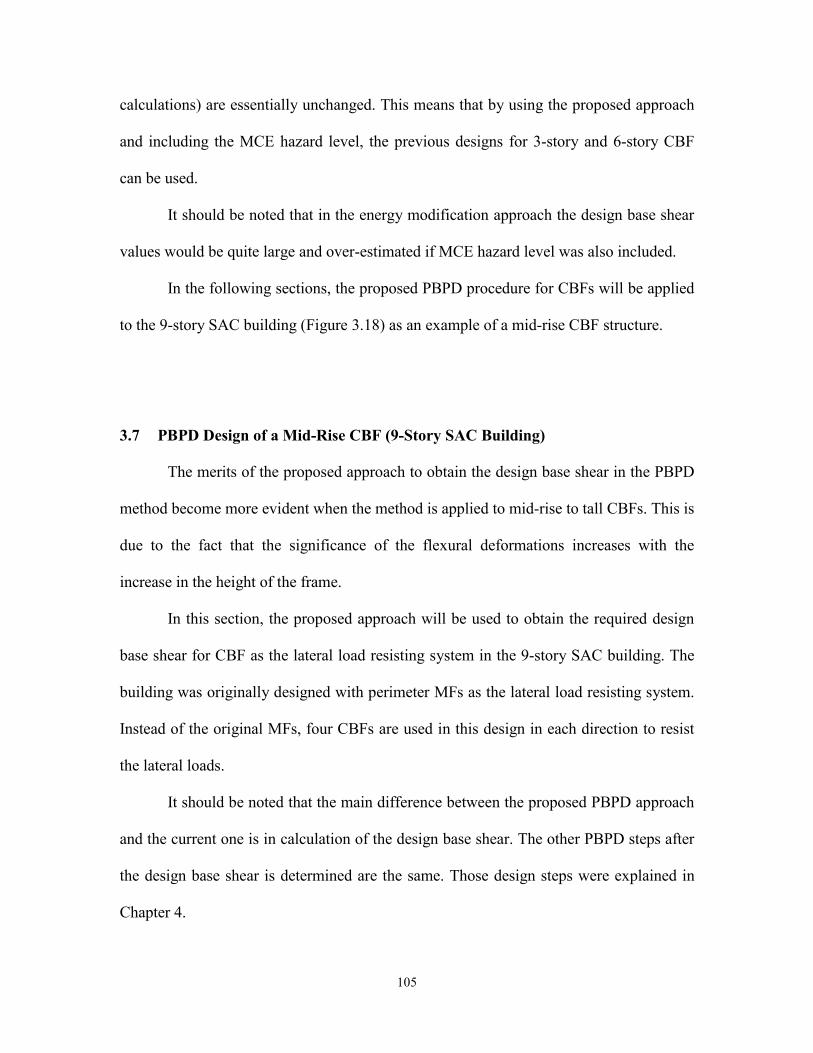
105
calculations) are essentially unchanged. This means that by using the proposed approach
and including the MCE hazard level, the previous designs for 3-story and 6-story CBF
can be used.
It should be noted that in the energy modification approach the design base shear
values would be quite large and over-estimated if MCE hazard level was also included.
In the following sections, the proposed PBPD procedure for CBFs will be applied
to the 9-story SAC building (Figure 3.18) as an example of a mid-rise CBF structure.
3.7 PBPD Design of a Mid-Rise CBF (9-Story SAC Building)
The merits of the proposed approach to obtain the design base shear in the PBPD
method become more evident when the method is applied to mid-rise to tall CBFs. This is
due to the fact that the significance of the flexural deformations increases with the
increase in the height of the frame.
In this section, the proposed approach will be used to obtain the required design
base shear for CBF as the lateral load resisting system in the 9-story SAC building. The
building was originally designed with perimeter MFs as the lateral load resisting system.
Instead of the original MFs, four CBFs are used in this design in each direction to resist
the lateral loads.
It should be noted that the main difference between the proposed PBPD approach
and the current one is in calculation of the design base shear. The other PBPD steps after
the design base shear is determined are the same. Those design steps were explained in
Chapter 4.
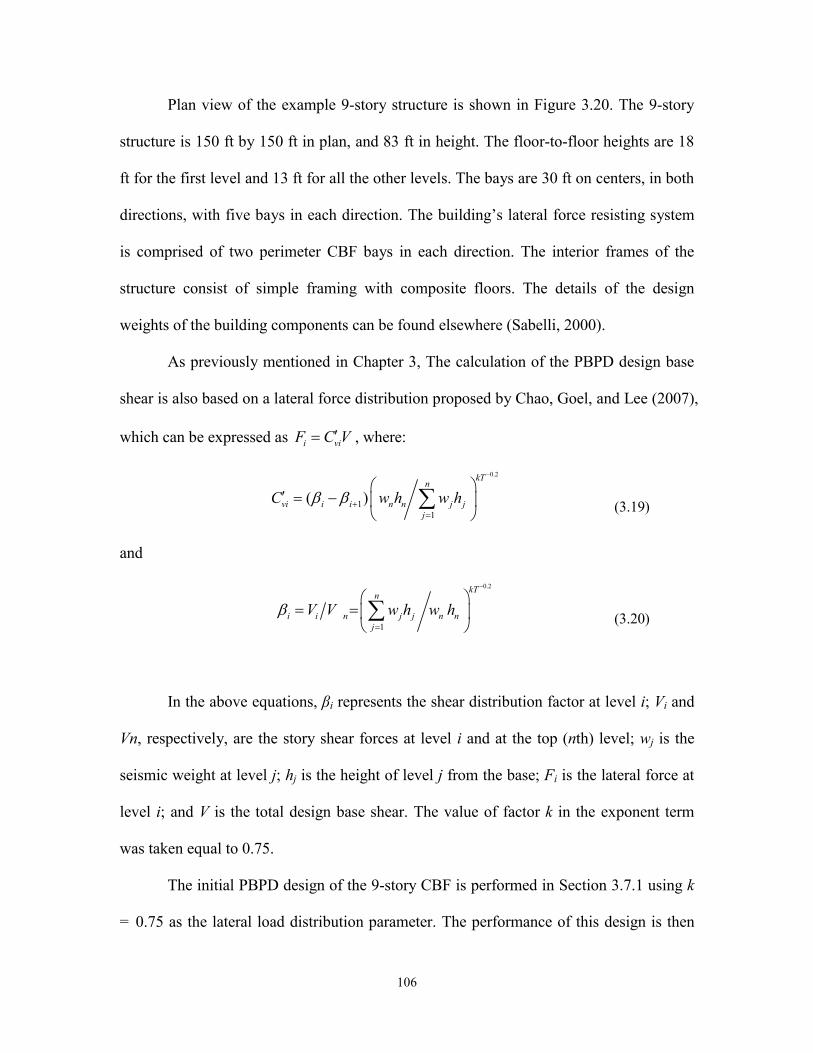
106
Plan view of the example 9-story structure is shown in Figure 3.20. The 9-story
structure is 150 ft by 150 ft in plan, and 83 ft in height. The floor-to-floor heights are 18
ft for the first level and 13 ft for all the other levels. The bays are 30 ft on centers, in both
directions, with five bays in each direction. The building’s lateral force resisting system
is comprised of two perimeter CBF bays in each direction. The interior frames of the
structure consist of simple framing with composite floors. The details of the design
weights of the building components can be found elsewhere (Sabelli, 2000).
As previously mentioned in Chapter 3, The calculation of the PBPD design base
shear is also based on a lateral force distribution proposed by Chao, Goel, and Lee (2007),
which can be expressed as i viF C V , where:
0.2
11
( )
kTn
vi i i n n j jj
C w h w h
( 3.19)
and
0.2
1
kTn
i i n j j n nj
V V w h w h
( 3.20)
In the above equations, βi represents the shear distribution factor at level i; Vi and
Vn, respectively, are the story shear forces at level i and at the top (nth) level; wj is the
seismic weight at level j; hj is the height of level j from the base; Fi is the lateral force at
level i; and V is the total design base shear. The value of factor k in the exponent term
was taken equal to 0.75.
The initial PBPD design of the 9-story CBF is performed in Section 3.7.1 using k
= 0.75 as the lateral load distribution parameter. The performance of this design is then
107
evaluated and recommendations for performance improvement are suggested. In the
subsequent section, k = 0.50 is used as the lateral load distribution parameter in order to
provide more strength and stiffness in the upper stories. This change in the lateral load
distribution appears to enhance the performance of the frame, especially in the upper
stories.
3.7.1 PBPD Design of 9-Story CBF Using k = 0.75 as the Lateral Load Distribution
Parameter
Design parameters according to 1997 NEHRP Provisions (FEMA, 1997) for the
9-story CBF are listed in Table 3.10. A basic target drift (shear target drift) of 1.25% for
10%/50 year (2/3MCE) hazard, and 1.75% for 2%/50 year (MCE) hazard is selected. The
elastic design spectral response acceleration, Sa, is calculated as:
60.175 1.05
1a s
RS C
I
æ ö æ ö÷ ÷ç ç= ⋅ = ⋅ =÷ ÷ç ç÷ ÷ç çè ø è ø
( 3.21)

108
Figure 3.20. Plan View of 9-Story SAC Building.
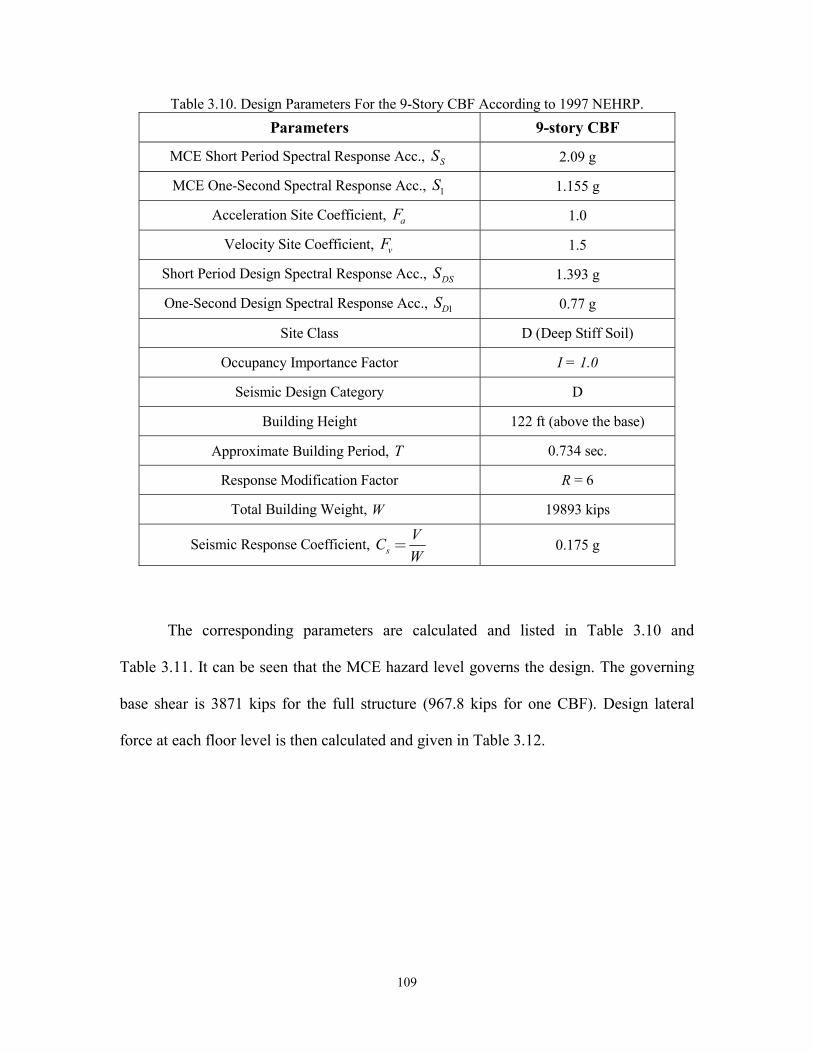
109
Table 3.10. Design Parameters For the 9-Story CBF According to 1997 NEHRP.
Parameters 9-story CBF
MCE Short Period Spectral Response Acc., SS 2.09 g
MCE One-Second Spectral Response Acc., 1S 1.155 g
Acceleration Site Coefficient, aF 1.0
Velocity Site Coefficient, vF 1.5
Short Period Design Spectral Response Acc., DSS 1.393 g
One-Second Design Spectral Response Acc., 1DS 0.77 g
Site Class D (Deep Stiff Soil)
Occupancy Importance Factor I = 1.0
Seismic Design Category D
Building Height 122 ft (above the base)
Approximate Building Period, T 0.734 sec.
Response Modification Factor R = 6
Total Building Weight, W 19893 kips
Seismic Response Coefficient, s
VC
W= 0.175 g
The corresponding parameters are calculated and listed in Table 3.10 and
Table 3.11. It can be seen that the MCE hazard level governs the design. The governing
base shear is 3871 kips for the full structure (967.8 kips for one CBF). Design lateral
force at each floor level is then calculated and given in Table 3.12.
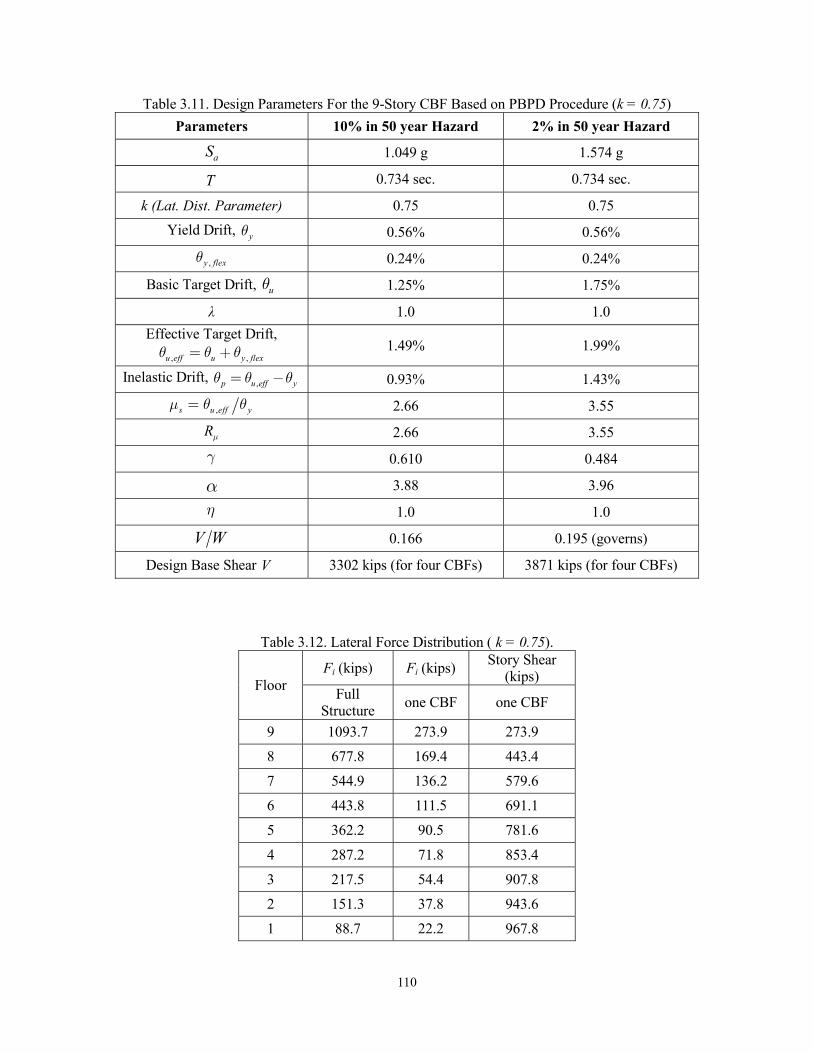
110
Table 3.11. Design Parameters For the 9-Story CBF Based on PBPD Procedure (k = 0.75)
Parameters 10% in 50 year Hazard 2% in 50 year Hazard
aS 1.049 g 1.574 g
T 0.734 sec. 0.734 sec.
k (Lat. Dist. Parameter) 0.75 0.75
Yield Drift, yq 0.56% 0.56%
,y flexq 0.24% 0.24%
Basic Target Drift, uq 1.25% 1.75%
λ 1.0 1.0 Effective Target Drift,
, ,u eff u y flexq q q= + 1.49% 1.99%
Inelastic Drift, ,p u eff yq q q= - 0.93% 1.43%
,s u eff ym q q= 2.66 3.55
Rm 2.66 3.55
g 0.610 0.484
a 3.88 3.96
h 1.0 1.0
V W 0.166 0.195 (governs)
Design Base Shear V 3302 kips (for four CBFs) 3871 kips (for four CBFs)
Table 3.12. Lateral Force Distribution ( k = 0.75).
Floor Fi (kips) Fi (kips)
Story Shear (kips)
Full Structure
one CBF one CBF
9 1093.7 273.9 273.9
8 677.8 169.4 443.4
7 544.9 136.2 579.6
6 443.8 111.5 691.1
5 362.2 90.5 781.6
4 287.2 71.8 853.4
3 217.5 54.4 907.8
2 151.3 37.8 943.6
1 88.7 22.2 967.8
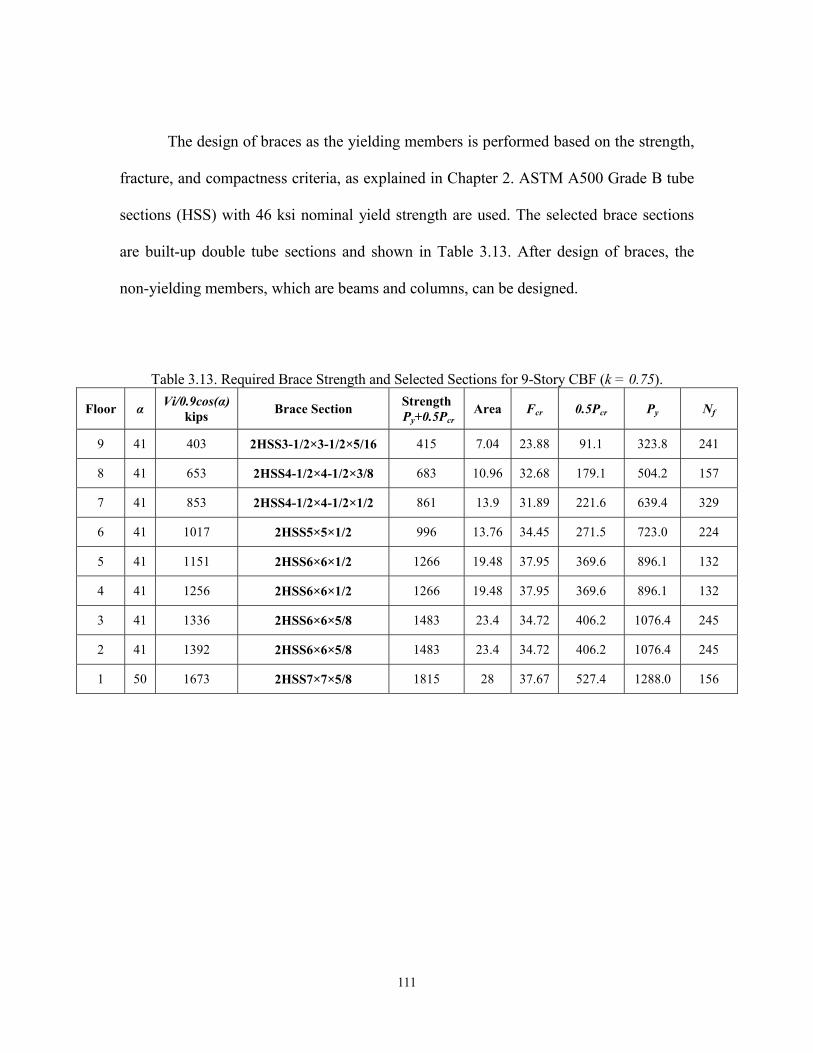
111
The design of braces as the yielding members is performed based on the strength,
fracture, and compactness criteria, as explained in Chapter 2. ASTM A500 Grade B tube
sections (HSS) with 46 ksi nominal yield strength are used. The selected brace sections
are built-up double tube sections and shown in Table 3.13. After design of braces, the
non-yielding members, which are beams and columns, can be designed.
Table 3.13. Required Brace Strength and Selected Sections for 9-Story CBF (k = 0.75).
Floor α Vi/0.9cos(α)
kips Brace Section
Strength Py+0.5Pcr
Area Fcr 0.5Pcr Py Nf
9 41 403 2HSS3-1/2×3-1/2×5/16 415 7.04 23.88 91.1 323.8 241
8 41 653 2HSS4-1/2×4-1/2×3/8 683 10.96 32.68 179.1 504.2 157
7 41 853 2HSS4-1/2×4-1/2×1/2 861 13.9 31.89 221.6 639.4 329
6 41 1017 2HSS5×5×1/2 996 13.76 34.45 271.5 723.0 224
5 41 1151 2HSS6×6×1/2 1266 19.48 37.95 369.6 896.1 132
4 41 1256 2HSS6×6×1/2 1266 19.48 37.95 369.6 896.1 132
3 41 1336 2HSS6×6×5/8 1483 23.4 34.72 406.2 1076.4 245
2 41 1392 2HSS6×6×5/8 1483 23.4 34.72 406.2 1076.4 245
1 50 1673 2HSS7×7×5/8 1815 28 37.67 527.4 1288.0 156
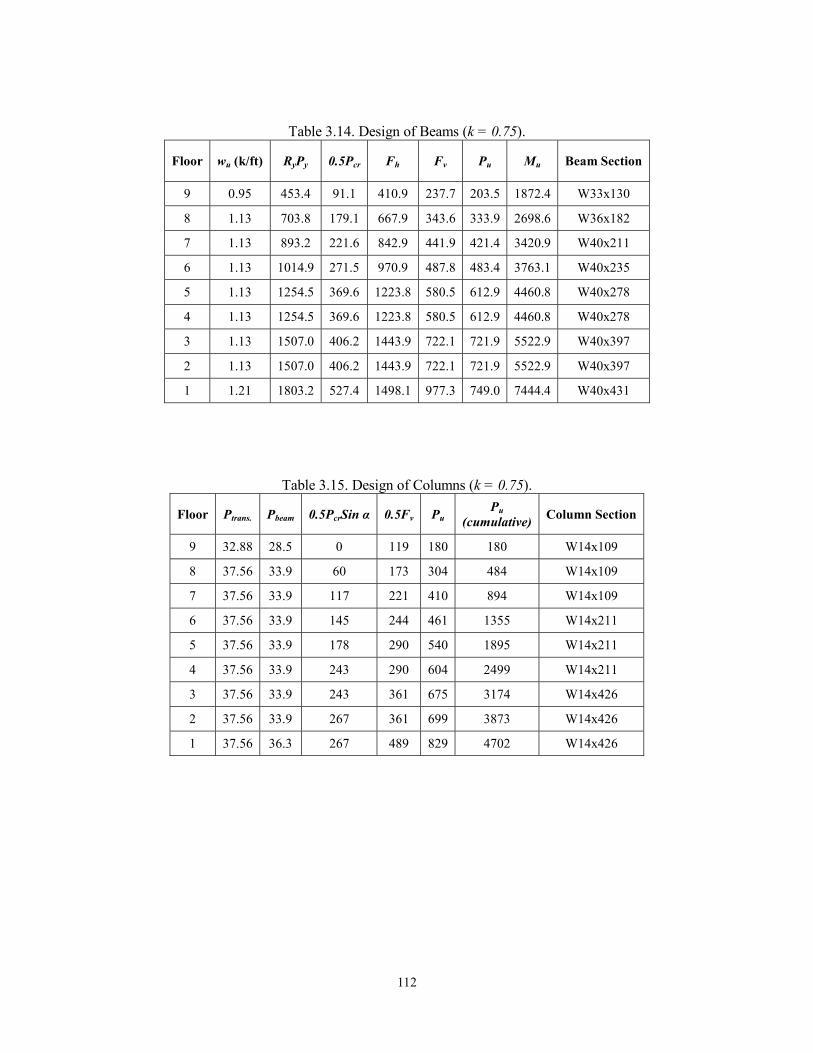
112
Table 3.14. Design of Beams (k = 0.75).
Floor wu (k/ft) RyPy 0.5Pcr Fh Fv Pu Mu Beam Section
9 0.95 453.4 91.1 410.9 237.7 203.5 1872.4 W33x130
8 1.13 703.8 179.1 667.9 343.6 333.9 2698.6 W36x182
7 1.13 893.2 221.6 842.9 441.9 421.4 3420.9 W40x211
6 1.13 1014.9 271.5 970.9 487.8 483.4 3763.1 W40x235
5 1.13 1254.5 369.6 1223.8 580.5 612.9 4460.8 W40x278
4 1.13 1254.5 369.6 1223.8 580.5 612.9 4460.8 W40x278
3 1.13 1507.0 406.2 1443.9 722.1 721.9 5522.9 W40x397
2 1.13 1507.0 406.2 1443.9 722.1 721.9 5522.9 W40x397
1 1.21 1803.2 527.4 1498.1 977.3 749.0 7444.4 W40x431
Table 3.15. Design of Columns (k = 0.75).
Floor Ptrans. Pbeam 0.5PcrSin α 0.5Fv Pu Pu
(cumulative) Column Section
9 32.88 28.5 0 119 180 180 W14x109
8 37.56 33.9 60 173 304 484 W14x109
7 37.56 33.9 117 221 410 894 W14x109
6 37.56 33.9 145 244 461 1355 W14x211
5 37.56 33.9 178 290 540 1895 W14x211
4 37.56 33.9 243 290 604 2499 W14x211
3 37.56 33.9 243 361 675 3174 W14x426
2 37.56 33.9 267 361 699 3873 W14x426
1 37.56 36.3 267 489 829 4702 W14x426

113
Generally, capacity design approach is used for design of non-yielding members,
which are columns and beams in CBFs. For columns, the post-buckling limit state of the
braces governs the design. Table 3.14 and Table 3.15 show the design parameters as well
as the final design sections for beams and columns, respectively. Only cumulative axial
forces are considered for design of columns. Column sections are changed after every
three stories.
3.7.2 Evaluation of 9-Story CBF Designed by the Lateral Load Distribution Parameter
k = 0.75
Nonlinear analyses were carried out by using the SNAP-2DX program, which has
the ability to model brace behavior under large displacement reversals, as well as the
fracture of braces with tubular sections (Rai et al., 1996). Gravity columns were included
in the modeling by using a lumped continuous leaning column, connected to the braced
frame through rigid pin-ended links. P-Δ effect due to the gravity loads was also
accounted for in the analysis. All beams and columns of the frame were modeled as
beam-column elements.
Maximum story drifts under 2/3MCE and MCE level SAC ground motions are
shown in Figure 3.21. Under the design level (2/3MCE) ground motion, although some
ground motions induce somewhat large drifts in middle stories, the response is generally
good and the median response is within the target drift limit except for the top story.
However, under MCE level ground motions, both middle stories and also upper stories
show quite large story drifts. In addition, brace fractures at lower and middle stories were

114
observed under a couple of MCE ground motions. Further investigation showed that the
main reason for brace fractures were large story drifts.
Large story drifts (and subsequent brace fractures) in lower and middle stories
under MCE ground motions are mainly due to large velocity pulses in these records.
However, large story drifts at upper stories are mainly due to the effect of higher modes
on dynamic response and somewhat low strength/stiffness of these stories.
In order to reduce the upper story drifts, a smaller k value can be used. By doing
this, larger forces are assigned at the upper stories which eventually make them stronger
and stiffer. It should be noted that there is significant change in the story shears at lower
stories by using a different k value, since all the upper story forces are added to the lower
stories’ shear. Basically, by using k = 0.5, larger portion of the design base shear is
assigned at upper stories.
A recommendation is made for improving the performance of this frame, which is
by using k = 0.50 as the lateral load distribution parameters. Upper story drifts, as will be
seen in the following section, can be significantly reduced by using the lower value of 0.5
for the lateral distribution parameter, k.
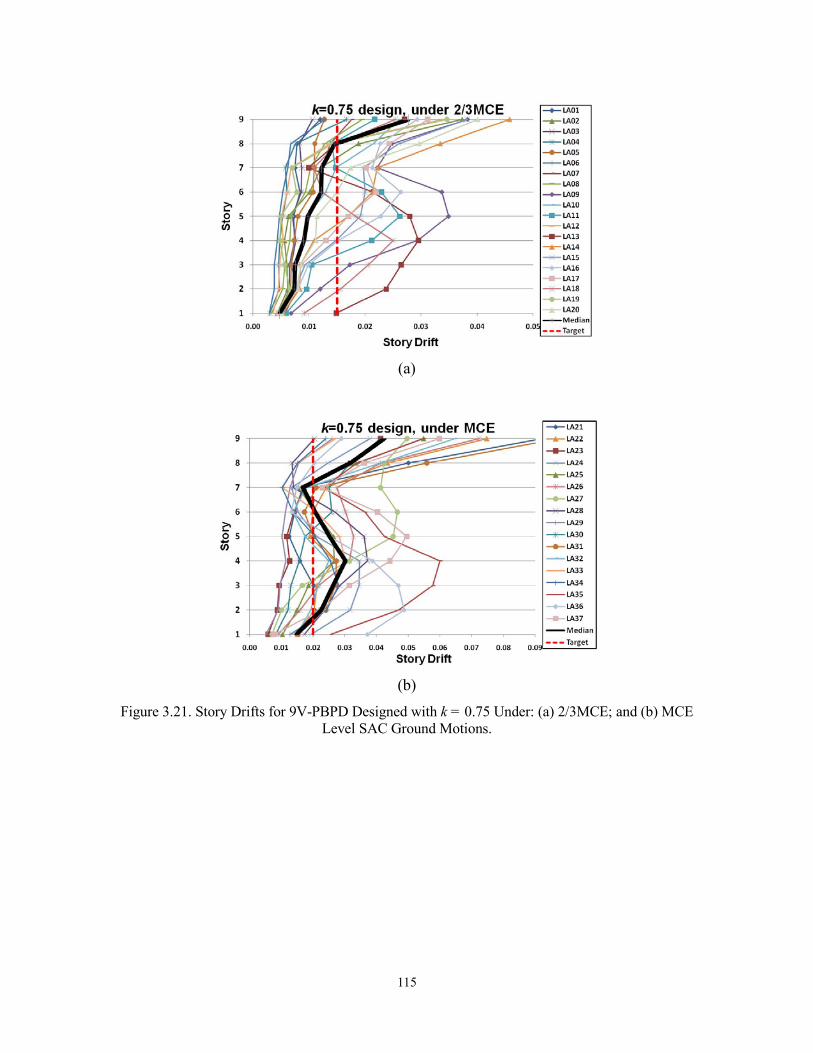
115
(a)
(b)
Figure 3.21. Story Drifts for 9V-PBPD Designed with k = 0.75 Under: (a) 2/3MCE; and (b) MCE Level SAC Ground Motions.
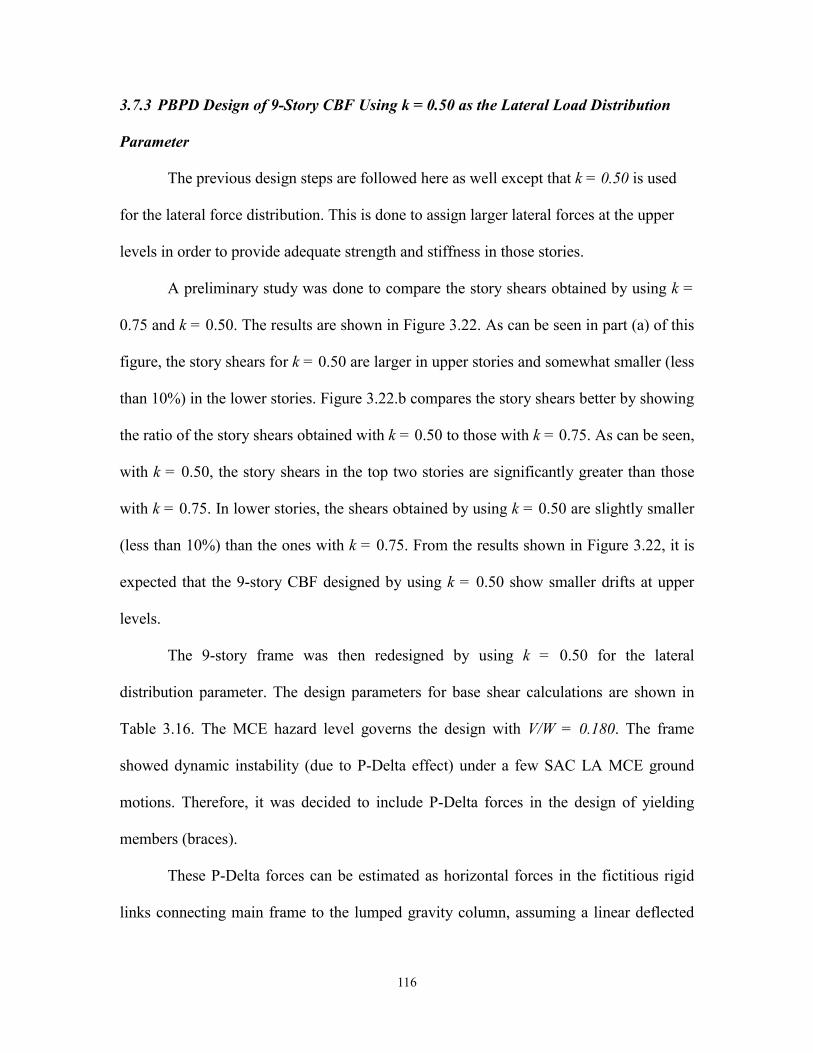
116
3.7.3 PBPD Design of 9-Story CBF Using k = 0.50 as the Lateral Load Distribution
Parameter
The previous design steps are followed here as well except that k = 0.50 is used
for the lateral force distribution. This is done to assign larger lateral forces at the upper
levels in order to provide adequate strength and stiffness in those stories.
A preliminary study was done to compare the story shears obtained by using k =
0.75 and k = 0.50. The results are shown in Figure 3.22. As can be seen in part (a) of this
figure, the story shears for k = 0.50 are larger in upper stories and somewhat smaller (less
than 10%) in the lower stories. Figure 3.22.b compares the story shears better by showing
the ratio of the story shears obtained with k = 0.50 to those with k = 0.75. As can be seen,
with k = 0.50, the story shears in the top two stories are significantly greater than those
with k = 0.75. In lower stories, the shears obtained by using k = 0.50 are slightly smaller
(less than 10%) than the ones with k = 0.75. From the results shown in Figure 3.22, it is
expected that the 9-story CBF designed by using k = 0.50 show smaller drifts at upper
levels.
The 9-story frame was then redesigned by using k = 0.50 for the lateral
distribution parameter. The design parameters for base shear calculations are shown in
Table 3.16. The MCE hazard level governs the design with V/W = 0.180. The frame
showed dynamic instability (due to P-Delta effect) under a few SAC LA MCE ground
motions. Therefore, it was decided to include P-Delta forces in the design of yielding
members (braces).
These P-Delta forces can be estimated as horizontal forces in the fictitious rigid
links connecting main frame to the lumped gravity column, assuming a linear deflected
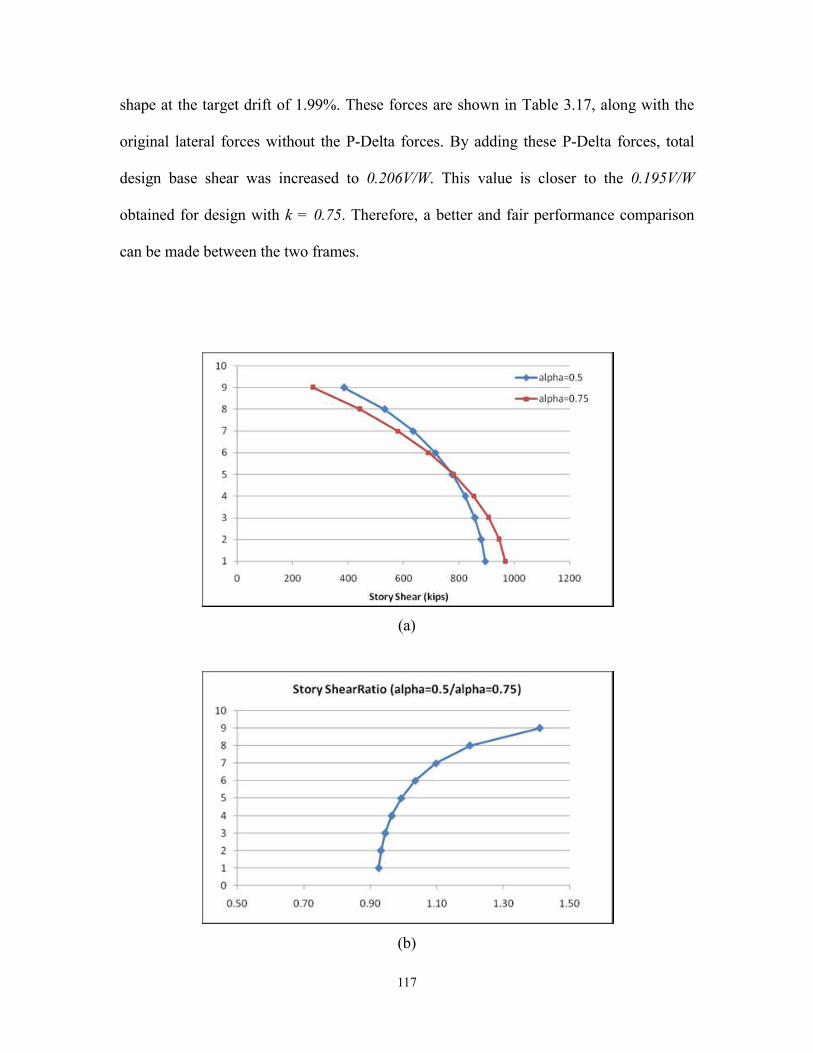
117
shape at the target drift of 1.99%. These forces are shown in Table 3.17, along with the
original lateral forces without the P-Delta forces. By adding these P-Delta forces, total
design base shear was increased to 0.206V/W. This value is closer to the 0.195V/W
obtained for design with k = 0.75. Therefore, a better and fair performance comparison
can be made between the two frames.
(a)
(b)
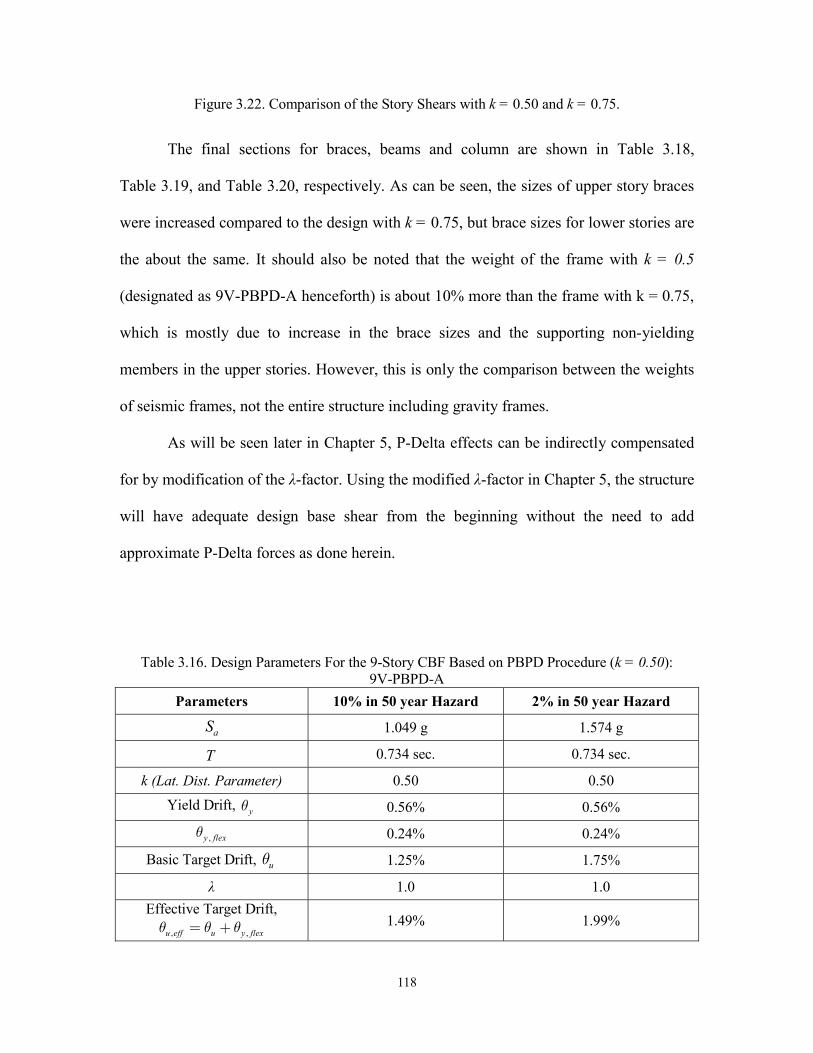
118
Figure 3.22. Comparison of the Story Shears with k = 0.50 and k = 0.75.
The final sections for braces, beams and column are shown in Table 3.18,
Table 3.19, and Table 3.20, respectively. As can be seen, the sizes of upper story braces
were increased compared to the design with k = 0.75, but brace sizes for lower stories are
the about the same. It should also be noted that the weight of the frame with k = 0.5
(designated as 9V-PBPD-A henceforth) is about 10% more than the frame with k = 0.75,
which is mostly due to increase in the brace sizes and the supporting non-yielding
members in the upper stories. However, this is only the comparison between the weights
of seismic frames, not the entire structure including gravity frames.
As will be seen later in Chapter 5, P-Delta effects can be indirectly compensated
for by modification of the λ-factor. Using the modified λ-factor in Chapter 5, the structure
will have adequate design base shear from the beginning without the need to add
approximate P-Delta forces as done herein.
Table 3.16. Design Parameters For the 9-Story CBF Based on PBPD Procedure (k = 0.50): 9V-PBPD-A
Parameters 10% in 50 year Hazard 2% in 50 year Hazard
aS 1.049 g 1.574 g
T 0.734 sec. 0.734 sec.
k (Lat. Dist. Parameter) 0.50 0.50
Yield Drift, yq 0.56% 0.56%
,y flexq 0.24% 0.24%
Basic Target Drift, uq 1.25% 1.75%
λ 1.0 1.0 Effective Target Drift,
, ,u eff u y flexq q q= + 1.49% 1.99%
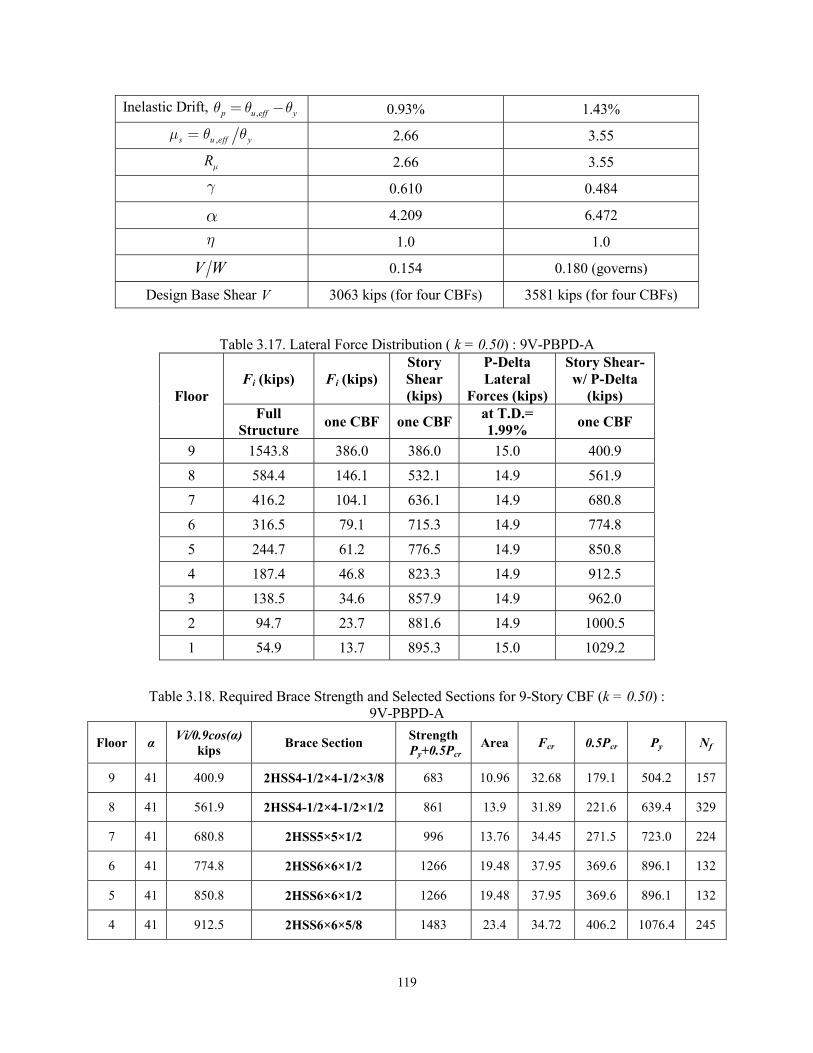
119
Inelastic Drift, ,p u eff yq q q= - 0.93% 1.43%
,s u eff ym q q= 2.66 3.55
Rm 2.66 3.55
g 0.610 0.484
a 4.209 6.472
h 1.0 1.0
V W 0.154 0.180 (governs)
Design Base Shear V 3063 kips (for four CBFs) 3581 kips (for four CBFs)
Table 3.17. Lateral Force Distribution ( k = 0.50) : 9V-PBPD-A
Floor Fi (kips) Fi (kips)
Story Shear (kips)
P-Delta Lateral
Forces (kips)
Story Shear- w/ P-Delta
(kips) Full
Structure one CBF one CBF
at T.D.= 1.99%
one CBF
9 1543.8 386.0 386.0 15.0 400.9
8 584.4 146.1 532.1 14.9 561.9
7 416.2 104.1 636.1 14.9 680.8
6 316.5 79.1 715.3 14.9 774.8
5 244.7 61.2 776.5 14.9 850.8
4 187.4 46.8 823.3 14.9 912.5
3 138.5 34.6 857.9 14.9 962.0
2 94.7 23.7 881.6 14.9 1000.5
1 54.9 13.7 895.3 15.0 1029.2
Table 3.18. Required Brace Strength and Selected Sections for 9-Story CBF (k = 0.50) : 9V-PBPD-A
Floor α Vi/0.9cos(α)
kips Brace Section
Strength Py+0.5Pcr
Area Fcr 0.5Pcr Py Nf
9 41 400.9 2HSS4-1/2×4-1/2×3/8 683 10.96 32.68 179.1 504.2 157
8 41 561.9 2HSS4-1/2×4-1/2×1/2 861 13.9 31.89 221.6 639.4 329
7 41 680.8 2HSS5×5×1/2 996 13.76 34.45 271.5 723.0 224
6 41 774.8 2HSS6×6×1/2 1266 19.48 37.95 369.6 896.1 132
5 41 850.8 2HSS6×6×1/2 1266 19.48 37.95 369.6 896.1 132
4 41 912.5 2HSS6×6×5/8 1483 23.4 34.72 406.2 1076.4 245
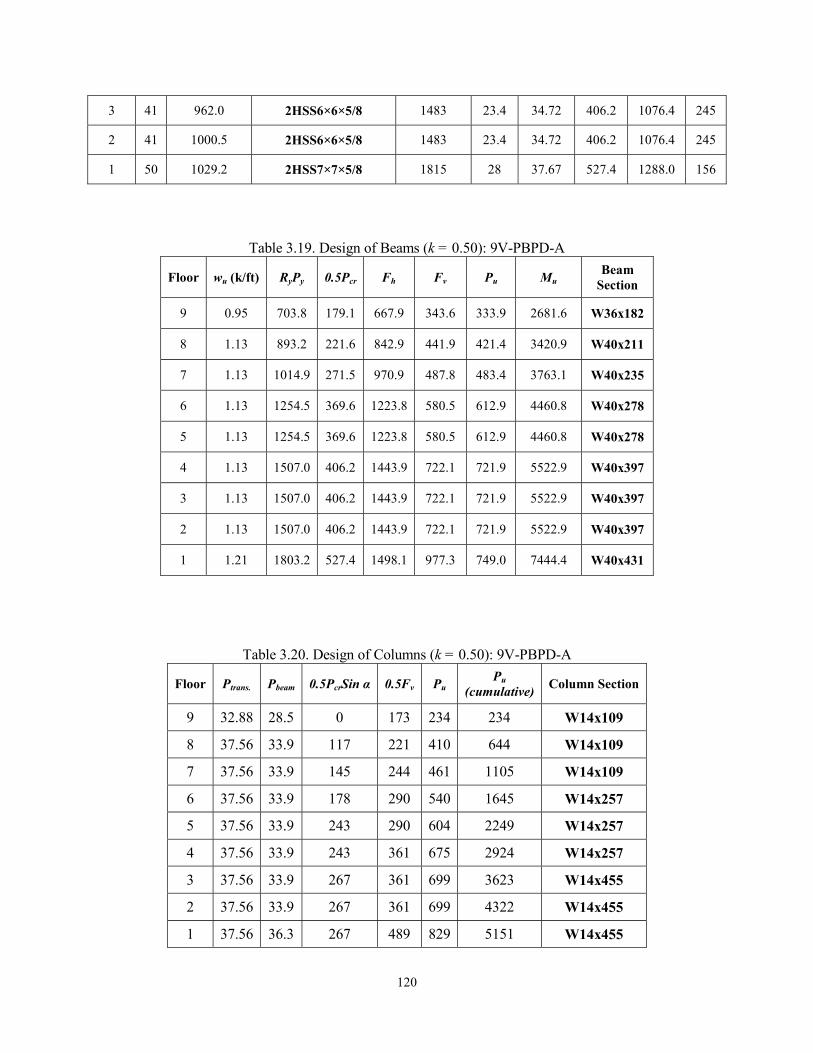
120
3 41 962.0 2HSS6×6×5/8 1483 23.4 34.72 406.2 1076.4 245
2 41 1000.5 2HSS6×6×5/8 1483 23.4 34.72 406.2 1076.4 245
1 50 1029.2 2HSS7×7×5/8 1815 28 37.67 527.4 1288.0 156
Table 3.19. Design of Beams (k = 0.50): 9V-PBPD-A
Floor wu (k/ft) RyPy 0.5Pcr Fh Fv Pu Mu Beam
Section
9 0.95 703.8 179.1 667.9 343.6 333.9 2681.6 W36x182
8 1.13 893.2 221.6 842.9 441.9 421.4 3420.9 W40x211
7 1.13 1014.9 271.5 970.9 487.8 483.4 3763.1 W40x235
6 1.13 1254.5 369.6 1223.8 580.5 612.9 4460.8 W40x278
5 1.13 1254.5 369.6 1223.8 580.5 612.9 4460.8 W40x278
4 1.13 1507.0 406.2 1443.9 722.1 721.9 5522.9 W40x397
3 1.13 1507.0 406.2 1443.9 722.1 721.9 5522.9 W40x397
2 1.13 1507.0 406.2 1443.9 722.1 721.9 5522.9 W40x397
1 1.21 1803.2 527.4 1498.1 977.3 749.0 7444.4 W40x431
Table 3.20. Design of Columns (k = 0.50): 9V-PBPD-A
Floor Ptrans. Pbeam 0.5PcrSin α 0.5Fv Pu Pu
(cumulative) Column Section
9 32.88 28.5 0 173 234 234 W14x109
8 37.56 33.9 117 221 410 644 W14x109
7 37.56 33.9 145 244 461 1105 W14x109
6 37.56 33.9 178 290 540 1645 W14x257
5 37.56 33.9 243 290 604 2249 W14x257
4 37.56 33.9 243 361 675 2924 W14x257
3 37.56 33.9 267 361 699 3623 W14x455
2 37.56 33.9 267 361 699 4322 W14x455
1 37.56 36.3 267 489 829 5151 W14x455
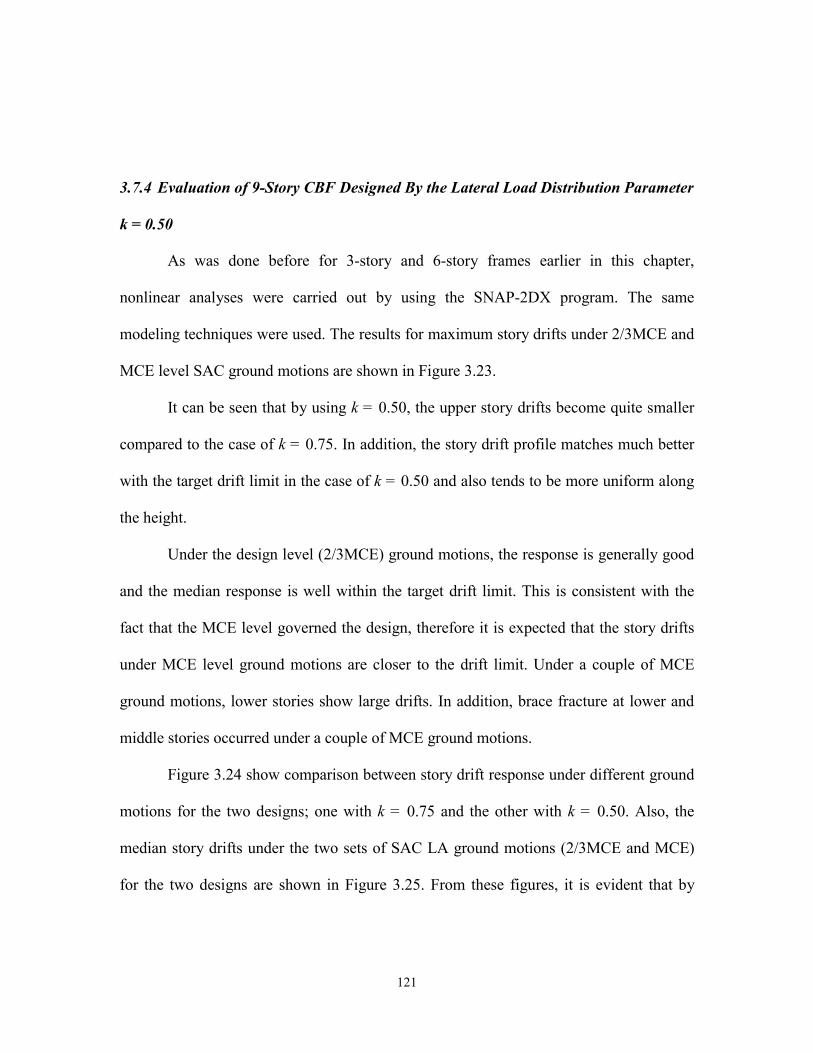
121
3.7.4 Evaluation of 9-Story CBF Designed By the Lateral Load Distribution Parameter
k = 0.50
As was done before for 3-story and 6-story frames earlier in this chapter,
nonlinear analyses were carried out by using the SNAP-2DX program. The same
modeling techniques were used. The results for maximum story drifts under 2/3MCE and
MCE level SAC ground motions are shown in Figure 3.23.
It can be seen that by using k = 0.50, the upper story drifts become quite smaller
compared to the case of k = 0.75. In addition, the story drift profile matches much better
with the target drift limit in the case of k = 0.50 and also tends to be more uniform along
the height.
Under the design level (2/3MCE) ground motions, the response is generally good
and the median response is well within the target drift limit. This is consistent with the
fact that the MCE level governed the design, therefore it is expected that the story drifts
under MCE level ground motions are closer to the drift limit. Under a couple of MCE
ground motions, lower stories show large drifts. In addition, brace fracture at lower and
middle stories occurred under a couple of MCE ground motions.
Figure 3.24 show comparison between story drift response under different ground
motions for the two designs; one with k = 0.75 and the other with k = 0.50. Also, the
median story drifts under the two sets of SAC LA ground motions (2/3MCE and MCE)
for the two designs are shown in Figure 3.25. From these figures, it is evident that by

122
using k = 0.50 much smaller story drifts in the upper stories and more uniform story drift
profile can be expected.
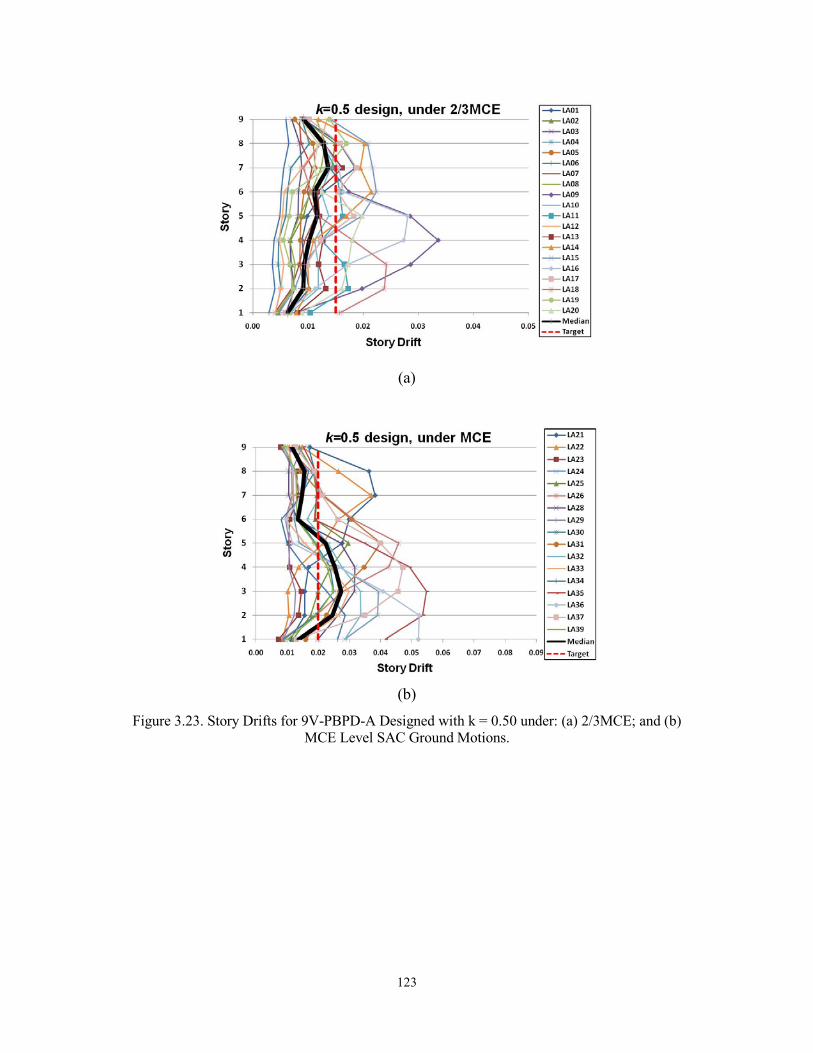
123
(a)
(b)
Figure 3.23. Story Drifts for 9V-PBPD-A Designed with k = 0.50 under: (a) 2/3MCE; and (b) MCE Level SAC Ground Motions.

124
(a)
(b)
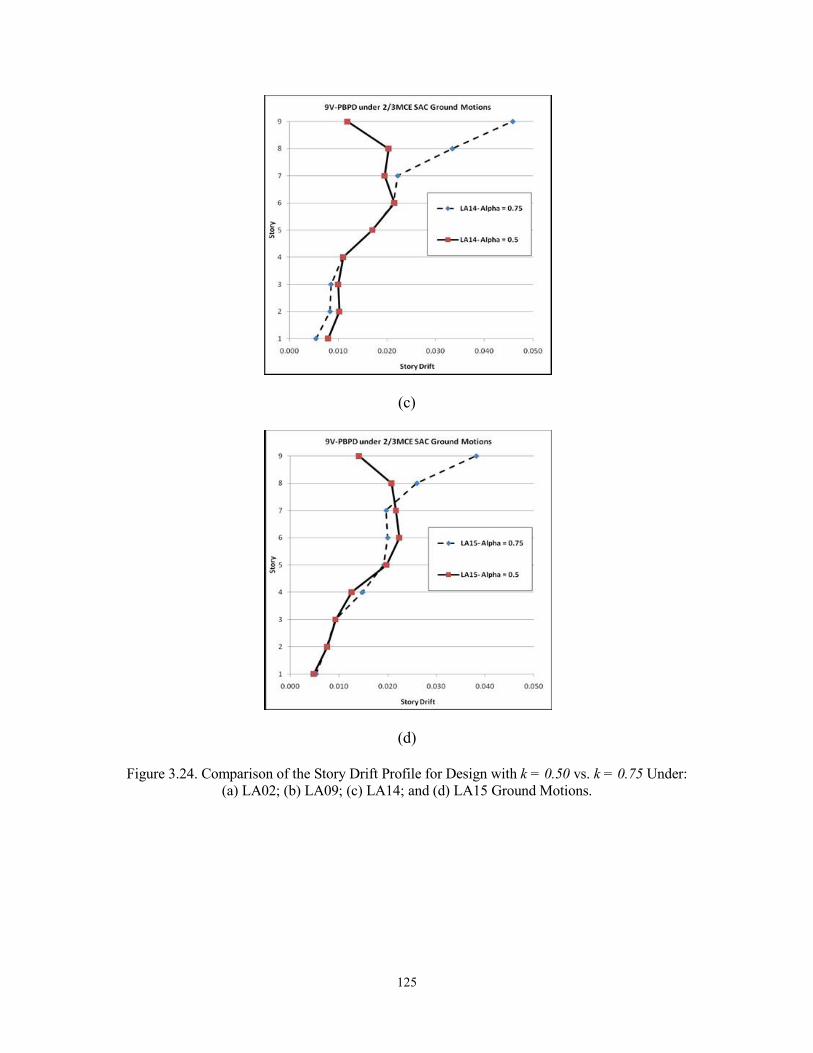
125
(c)
(d)
Figure 3.24. Comparison of the Story Drift Profile for Design with k = 0.50 vs. k = 0.75 Under: (a) LA02; (b) LA09; (c) LA14; and (d) LA15 Ground Motions.
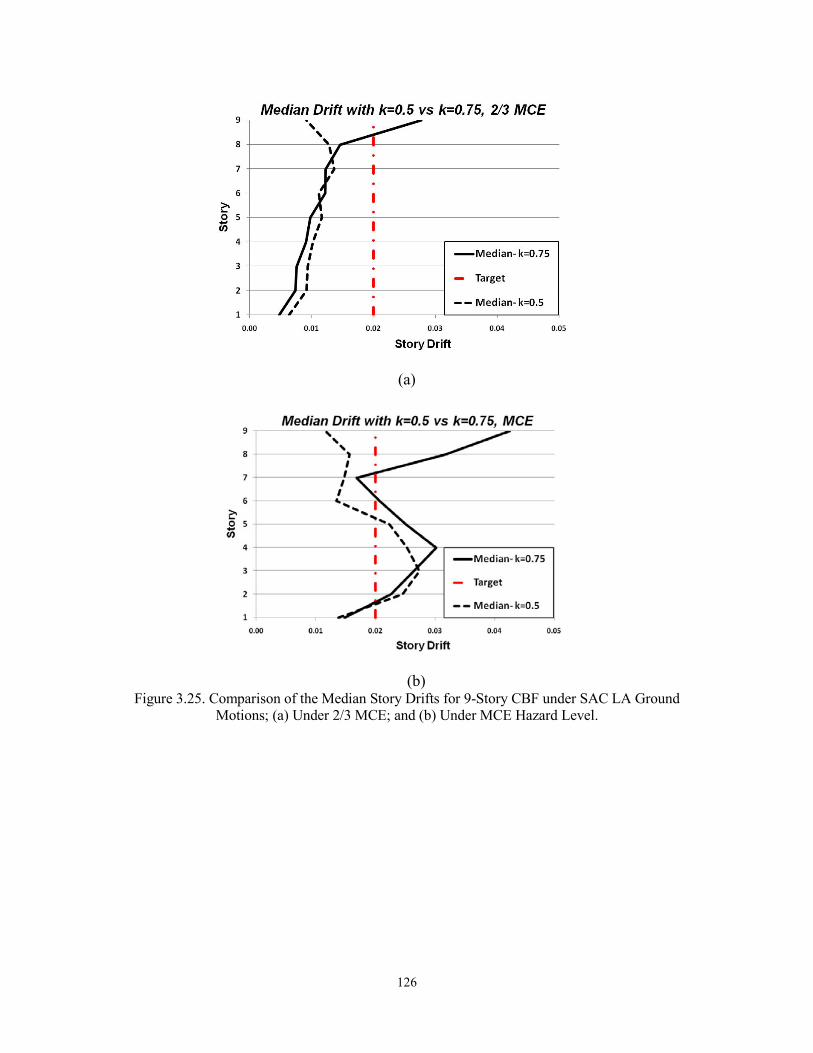
126
(a)
(b) Figure 3.25. Comparison of the Median Story Drifts for 9-Story CBF under SAC LA Ground
Motions; (a) Under 2/3 MCE; and (b) Under MCE Hazard Level.
127
3.8 Performance Comparison Between Beam Shear Splice vs. Conventional
Connection
As was discussed in Section 2.2 (Chapter 2), beam shear splices are recommended
for CBF in order to minimize moment transfer into the columns (Figure 2.6). For analysis
purposes such shear splices can be modeled as pin connections at the beam ends. On the
other hand, the conventional gusset plate detail provides considerable flexural constraint
in the beam-to-column connection region. Therefore, the conventional beam-to-column
connections need to be treated as rigid connections with moment transfer capability.
In this section, the effect of recommended beam shear splice detail, i.e., moment
release, on the seismic performance of the 9V-PBP-A frame is studied. Two models of
the 9V-PBPD-A frame are considered. One, which is the original model, has beam shear
splices at the ends of the beams (9V-PBPD-A-Pin), while the other model has the usual
gusset plate connection (9V-PBPD-A-Rigid). Hence, the only difference between these
two frames is their beam-to-column connection detail. The two models were subjected to
the DBE and MCE SAC ground motion records.
Figures 3.28 and 3.29 show the analysis results of these two frames under the
LA01 record which is a DBE ground motion. No brace fractures were observed and the
maximum story drifts are quite similar. However, several plastic hinges formed in the
columns of the frame with rigid connections (9V-PBPD-A-Rigid). Column plastic hinges
(PH) rotations are more significant in 5th, 6th , and 7th stories as shown in Figure 3.29a.
Formation of the column plastic hinges is due to large moments transferred from beam to
columns when conventional gusset plate connections are used (Refer to Figure 2.5).

128
Figures 3.30, 3.31, and 3.32 show the results of dynamic analysis of the two
frames under LA21 (MCE) ground motion. As can be seen in Figure 3.30, significant
column plastic hinging occurred as the largest pulse of the LA21 ground motion hit the
9V-PBPD03-Rigid frame. The column plastic hinge rotations are most significant in
stories 5 to 8. In addition, several brace fractures occurred in the 9V-PBPD-A-Rigid
frame. On the other hand, very little column plastic hinge formation can be seen in 9V-
PBPD-A-Pin frame. Also, one brace fractured, albeit near the end of the ground motion
(Figure 3.30a). It should be noted that the residual drifts are also larger for 9V-PBPD-A-
Rigid frame as shown in Figure 3.32.
The performance under another MCE level ground motion record, LA36, is
shown in Figures 3.33 and 3.34. As was the case for other ground motions, significant
column plastic hinging and larger residual story drifts can be observed for the 9V-PBPD-
A-Rigid frame. The plastic hinge rotations of columns are quite large in the first two
stories and also some beam plastic hinges can be seen, Figure 3.34a.
It is worth mentioning that although the maximum 2nd story drifts under LA36
are about the same for both frame models, i.e., 5.25% for Pin model and 4.85% for Rigid
model (Figure 3.33b), the 9V-PBPD-A-Pin frame was able to accommodate such
deformation without formation of column plastic hinges. But, such deformation caused
undesirable plastic hinges in the columns of 9V-PBPD-A-Rigid frame. This shows that
the frame with pin connections has more deformation capacity or ductility.
It should be noted that although the story drifts were much larger in the case of
LA36 compared to LA21, no brace fracture was seen under LA36 for either frame. This
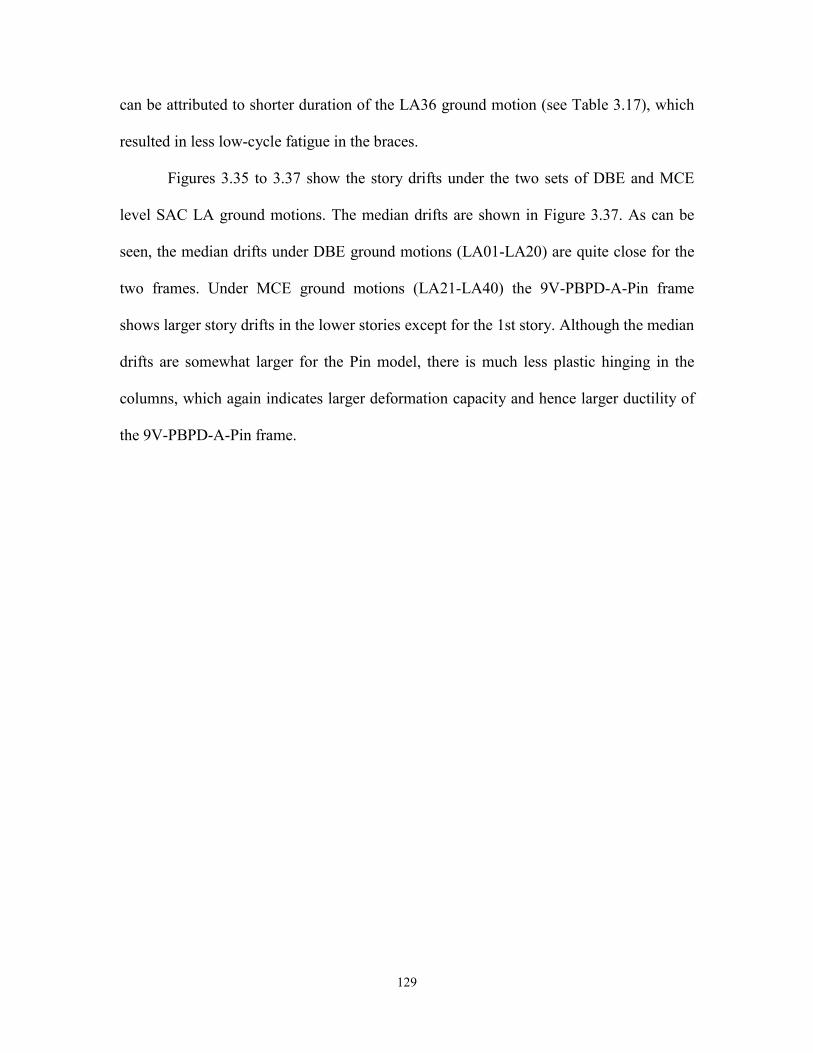
129
can be attributed to shorter duration of the LA36 ground motion (see Table 3.17), which
resulted in less low-cycle fatigue in the braces.
Figures 3.35 to 3.37 show the story drifts under the two sets of DBE and MCE
level SAC LA ground motions. The median drifts are shown in Figure 3.37. As can be
seen, the median drifts under DBE ground motions (LA01-LA20) are quite close for the
two frames. Under MCE ground motions (LA21-LA40) the 9V-PBPD-A-Pin frame
shows larger story drifts in the lower stories except for the 1st story. Although the median
drifts are somewhat larger for the Pin model, there is much less plastic hinging in the
columns, which again indicates larger deformation capacity and hence larger ductility of
the 9V-PBPD-A-Pin frame.

130
(a)
(b)
-0.02
-0.015
-0.01
-0.005
0
0.005
0.01
0 5 10 15 20 25 30 35 40
Sto
ry D
rift
(%
)
Time (sec)
LA01- 5th Story- Pin
LA01- 5th Story- Rigid
No Brace Fracture
Column PHs 7-16Column PHs 1,2
-0.02
-0.015
-0.01
-0.005
0
0.005
0.01
0 5 10 15 20 25 30 35 40
Sto
ry D
rift
(%
)
Time (sec)
LA01- 6th Story- Pin
LA01- 6th Story- Rigid
No Brace Fracture
Column PHs 7-16Column PHs 1,2
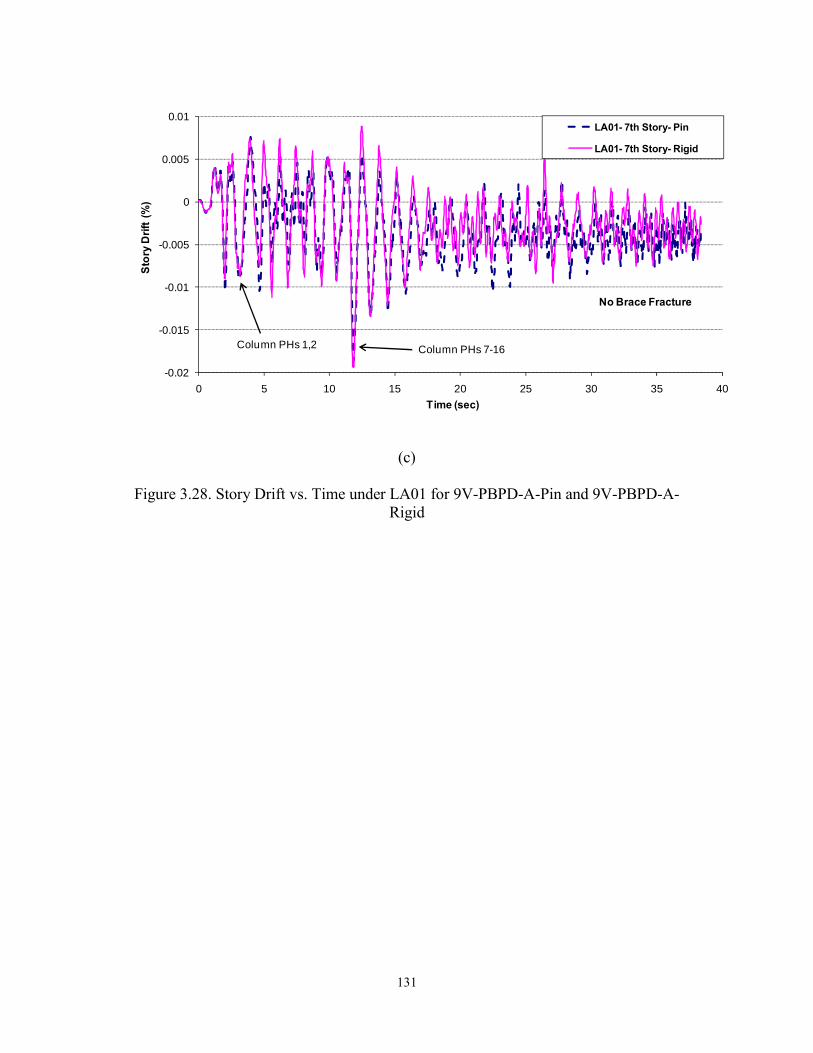
131
(c)
Figure 3.28. Story Drift vs. Time under LA01 for 9V-PBPD-A-Pin and 9V-PBPD-A-Rigid
-0.02
-0.015
-0.01
-0.005
0
0.005
0.01
0 5 10 15 20 25 30 35 40
Sto
ry D
rift
(%
)
Time (sec)
LA01- 7th Story- Pin
LA01- 7th Story- Rigid
No Brace Fracture
Column PHs 7-16Column PHs 1,2

132
(a) (b)
Figure 3.29. Column PHs and No Brace Fractures under LA01 for: (a) 9V-PBPD-A-Pin; and (b) 9V-PBPD-A-Rigid Frames

133
(a)
(b)
Figure 3.30. Sequence of Brace Fractures and PH Formation under LA21 for: (a) 9V-PBPD-A-Pin; and (b) 9V-PBPD-A-Rigid Frame
-0.06
-0.04
-0.02
0
0.02
0.04
0 10 20 30 40 50 60
Sto
ry D
rift
(%
)
Time (sec)
LA21- 5th Story- Pin
LA21- 6th Story- Pin
LA21- 7th Story- Pin
Fracture of brace 10
-0.06
-0.04
-0.02
0
0.02
0.04
0 10 20 30 40 50 60
Sto
ry D
rift
(%
)
Time (sec)
LA21- 5th Story- Rigid
LA21- 6th Story- Rigid
LA21- 7th Story- Rigid
Fracture of brace 11 at 6th story
Fracture of brace 9at 5th story
Fracture of brace 12at 6th story Fracture of brace 13
at 7th storyFormation of major PHs in Columns
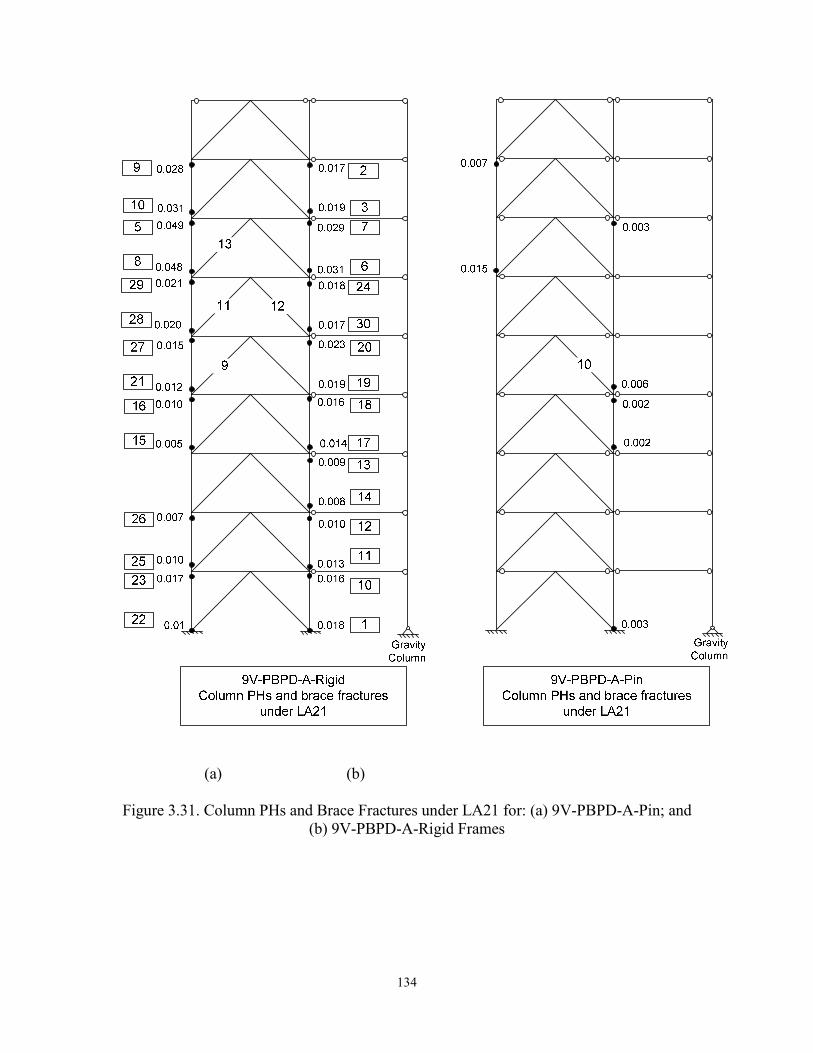
134
(a) (b)
Figure 3.31. Column PHs and Brace Fractures under LA21 for: (a) 9V-PBPD-A-Pin; and (b) 9V-PBPD-A-Rigid Frames
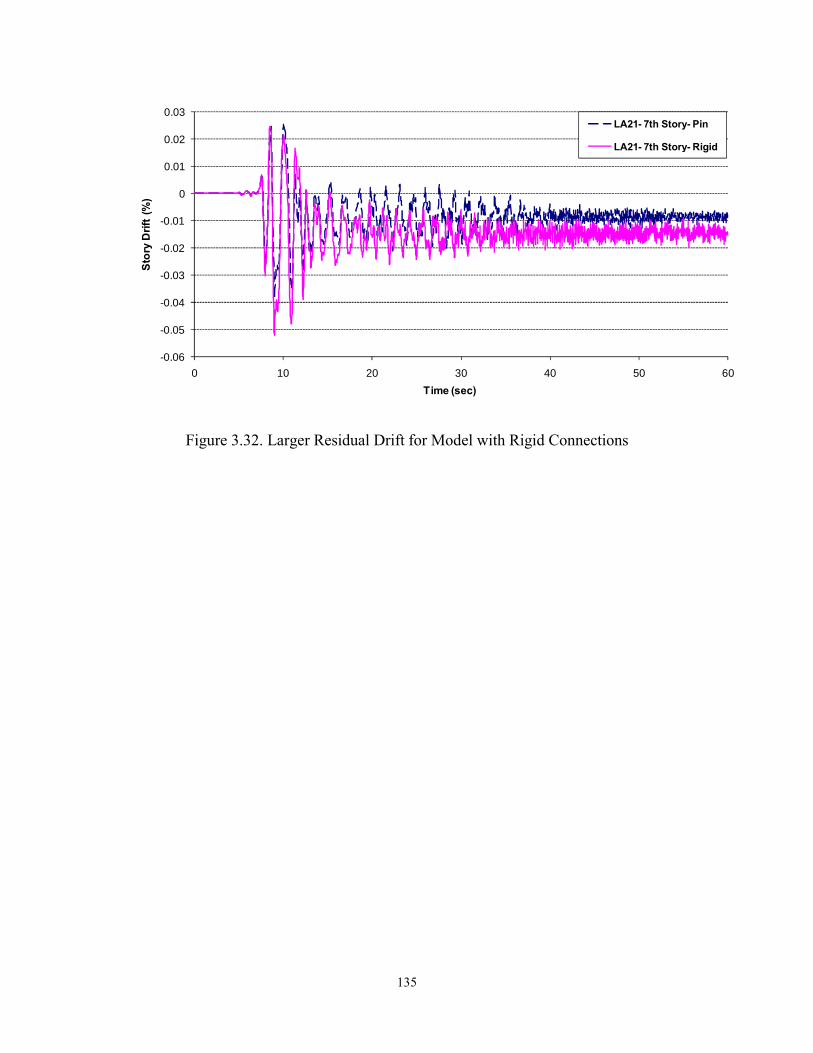
135
Figure 3.32. Larger Residual Drift for Model with Rigid Connections
-0.06
-0.05
-0.04
-0.03
-0.02
-0.01
0
0.01
0.02
0.03
0 10 20 30 40 50 60
Sto
ry D
rift
(%
)
Time (sec)
LA21- 7th Story- Pin
LA21- 7th Story- Rigid
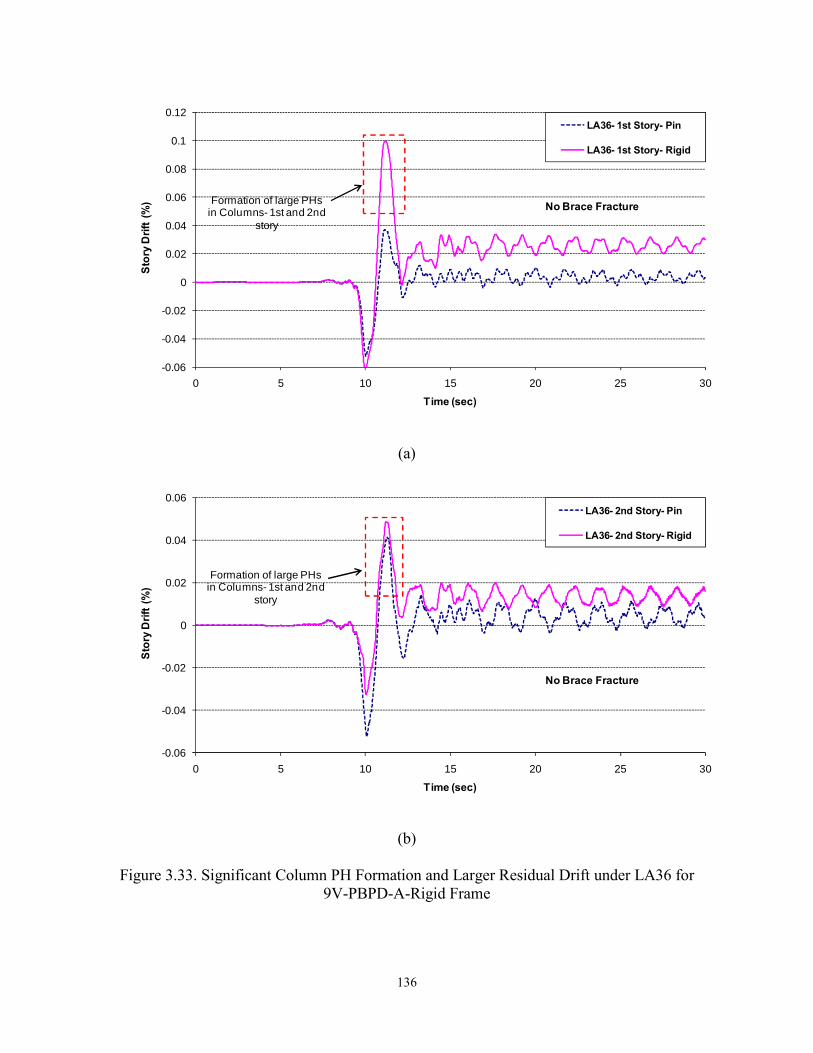
136
(a)
(b)
Figure 3.33. Significant Column PH Formation and Larger Residual Drift under LA36 for 9V-PBPD-A-Rigid Frame
-0.06
-0.04
-0.02
0
0.02
0.04
0.06
0.08
0.1
0.12
0 5 10 15 20 25 30
Sto
ry D
rift
(%
)
Time (sec)
LA36- 1st Story- Pin
LA36- 1st Story- Rigid
No Brace FractureFormation of large PHs
in Columns- 1st and 2nd story
-0.06
-0.04
-0.02
0
0.02
0.04
0.06
0 5 10 15 20 25 30
Sto
ry D
rift
(%
)
Time (sec)
LA36- 2nd Story- Pin
LA36- 2nd Story- Rigid
No Brace Fracture
Formation of large PHs in Columns- 1st and 2nd
story
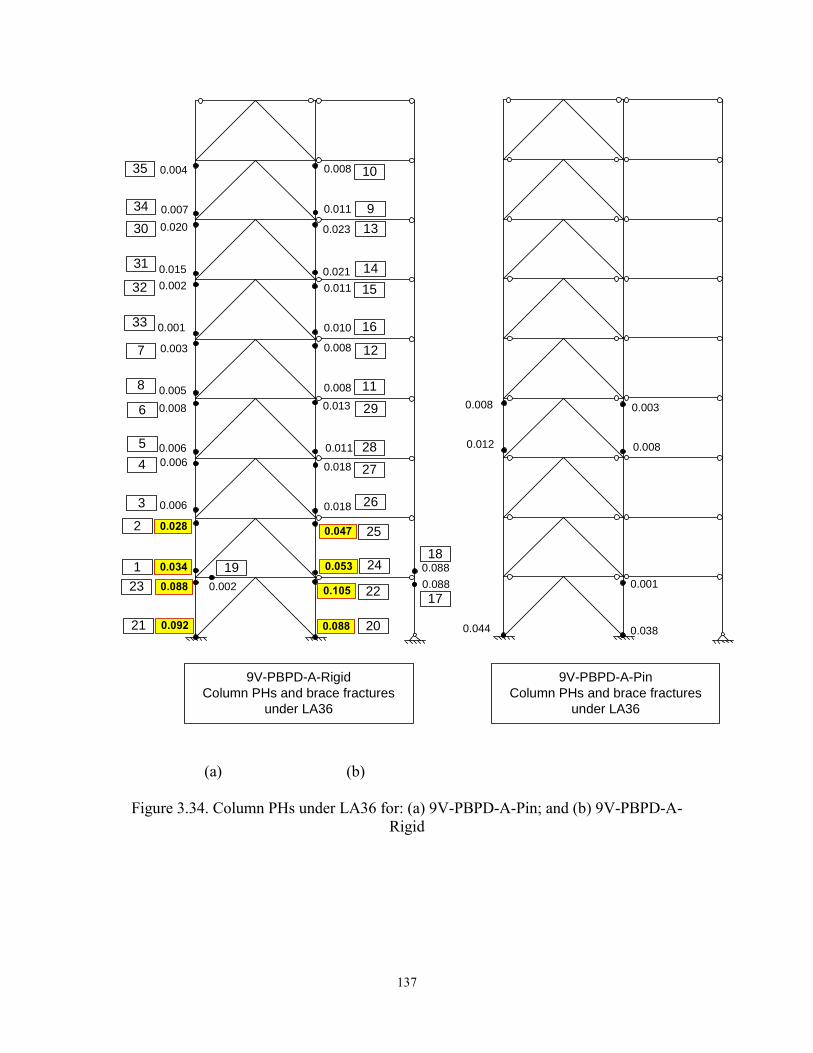
137
0.006
0.005
0.003
0.015
0.020
0.088
0.011
0.013
0.021
0.023
0.007
0.008
0.010
9V-PBPD-A-RigidColumn PHs and brace fractures
under LA36
0.038
0.008
9V-PBPD-A-PinColumn PHs and brace fractures
under LA36
21 20
23 22
14
5
6
8
7
34
31
30
24
29
13
28
0.003
0.018
0.018
0.008
0.008
0.011
0.011
25
26
27
15
16
11
12
9
1
2
0.001
0.002
33
32
0.00435 0.008 10
0.044
0.001
0.012
0.008
0.0063
0.0064
0.08817
0.08818
0.002
19
0.092
0.1050.088
0.034 0.053
0.0470.028
(a) (b)
Figure 3.34. Column PHs under LA36 for: (a) 9V-PBPD-A-Pin; and (b) 9V-PBPD-A-Rigid

138
(a)
(b)
Figure 3.35. Pin and Rigid models under SAC LA 2/3 MCE ground motions
1
2
3
4
5
6
7
8
9
0.00 0.01 0.02 0.03 0.04 0.05
Story
Story Drift
9V‐PBPD03‐Pin under DBELA01
LA02
LA03
LA04
LA05
LA06
LA07
LA08
LA09
LA10
LA11
LA12
LA13
LA14
LA15
LA16
LA17
LA18
LA19
LA20
Median
Target
1
2
3
4
5
6
7
8
9
0.00 0.01 0.02 0.03 0.04 0.05
Story
Story Drift
9V‐PBPD03‐Rigid under DBELA01
LA02
LA03
LA04
LA05
LA06
LA07
LA08
LA09
LA10
LA11
LA12
LA13
LA14
LA15
LA16
LA17
LA18
LA19
LA20
Median
Target

139
(a)
(b)
Figure 3.36. Pin and Rigid models under SAC LA MCE ground motions
1
2
3
4
5
6
7
8
9
0.00 0.02 0.04 0.06 0.08
Story
Story Drift
9V‐PBPD03‐Pin under MCELA21
LA22
LA23
LA24
LA25
LA26
LA28
LA29
LA30
LA31
LA32
LA33
LA34
LA35
LA36
LA37
LA39
LA40
Median
Target
1
2
3
4
5
6
7
8
9
0.00 0.02 0.04 0.06 0.08
Story
Story Drift
9V‐PBPD03‐Rigid under MCELA21
LA22
LA23
LA24
LA25
LA26
LA28
LA29
LA30
LA31
LA32
LA33
LA34
LA35
LA36
LA37
LA39
LA40
Median
Target
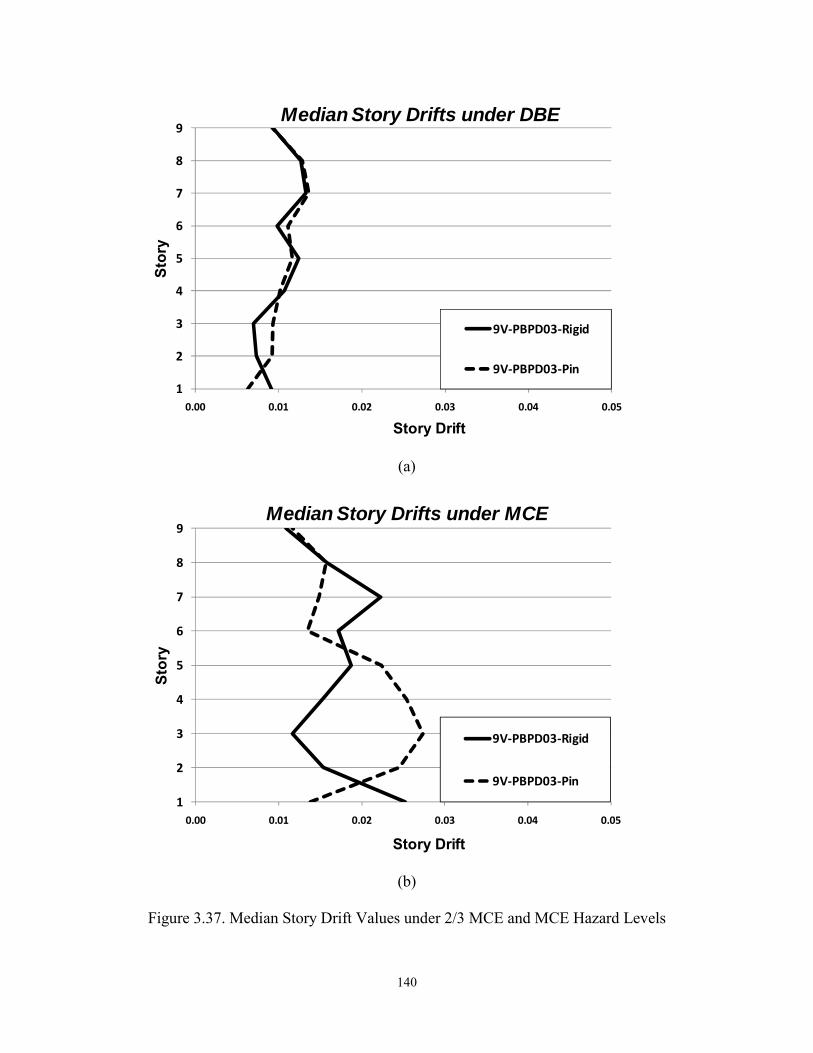
140
(a)
(b)
Figure 3.37. Median Story Drift Values under 2/3 MCE and MCE Hazard Levels
1
2
3
4
5
6
7
8
9
0.00 0.01 0.02 0.03 0.04 0.05
Sto
ry
Story Drift
Median Story Drifts under DBE
9V‐PBPD03‐Rigid
9V‐PBPD03‐Pin
1
2
3
4
5
6
7
8
9
0.00 0.01 0.02 0.03 0.04 0.05
Sto
ry
Story Drift
Median Story Drifts under MCE
9V‐PBPD03‐Rigid
9V‐PBPD03‐Pin
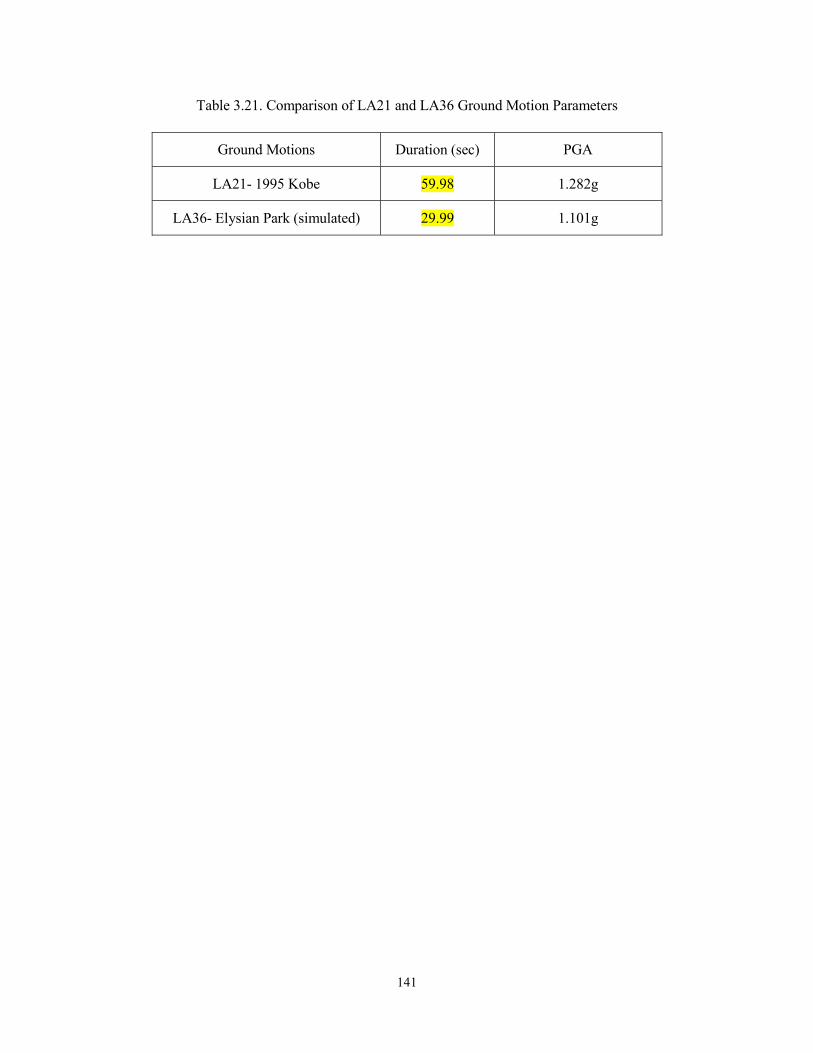
141
Table 3.21. Comparison of LA21 and LA36 Ground Motion Parameters
Ground Motions Duration (sec) PGA
LA21- 1995 Kobe 59.98 1.282g
LA36- Elysian Park (simulated) 29.99 1.101g

142
143
CHAPTER 4
Evaluation of Confidence Level against Collapse
4.1 Performance-Based Evaluation of CBF
A reliability framework for seismic performance evaluation of Steel Moment-
Resisting Frames (SMRFs) was developed as part of the FEMA/SAC Steel Project
(FEMA, 2000b). In this approach, two main performance levels (immediate occupancy
and collapse prevention) are considered under specified seismic hazards. The global and
the local deformation demands (as obtained from analysis) are then compared with the
deformation capacity of the structural system and structural elements, respectively
(FEMA, 2000b and Uriz, 2005). Basically, this procedure provides a simple method to
estimate the confidence level of structures to meet the given performance level under
specified seismic hazard (Yun et al., 2002). In other words, by considering such
deformation demands and capacities in probabilistic terms with the assumption of
lognormal probability distributions relative to uncertainty parameters (due to all
uncertainties and randomness involved), an estimate of the confidence level to achieve
the desired performance can be obtained in terms of the probability of the demand being
less than the capacity.
Based on these, a demand and capacity factor design (DCFD), similar to the Load
and Resistance Factor Design (LRFD), was adopted in FEMA/SAC Steel Project. This

144
reliability-based quantitative approach involves evaluation of site-specific hazard,
structural capacity, and structural demand, such that by having the hazard level and
performance criteria the confidence level for the structure can be estimated. Hence, the
main features in this approach are ground motion hazard curve, dynamic displacements,
and displacement capacity. This procedure requires the calculation of a confidence
parameter which can later be used to determine the confidence level associated with the
assumed performance objective (Yun et al., 2002). The confidence parameter can be
calculated as:
a D
C
( 4.1)
where
C = median estimate of the capacity of the structure, as indicated in FEMA351
(FEMA, 2000b).
D = median demand for the structure, obtained from structural analysis for a
specified level of ground motion.
= demand variability factor that accounts for the variability inherent in the
prediction of demand related to assumptions made in structural modeling and prediction
of the character of ground shaking.
a = analytical uncertainty factor that accounts for bias and uncertainty, inherent
in the specific analytical procedure used to estimate demand as a function of ground
shaking intensity.
145
= resistance factor that accounts for the uncertainty and variability inherent in
the prediction of structural capacity as a function of ground shaking intensity.
= confidence parameter from which a level of confidence can be obtained.
Having calculated the confidence parameter, , by using Equation ( 4.1), the
confidence level can be obtained from a table similar to
Table 4.1 (Yun et al., 2002) or directly from the proper probability-based
formulation. In this table, βUT is the total uncertainty measure and k is the logarithmic
slope of the hazard curve, both of which will be explained later in this chapter.
Uriz and Mahin (2004) used the performance-based earthquake evaluation
(PBEE) framework originally developed for SMRFs in FEMA/SAC steel Project
(FEMA, 2000b) to assess the performance of CBF and BRBF structures. In their study,
the PBEE procedure was applied to four case study buildings; 3-story and 6-story
chevron CBFs, and 3-story and 6-story chevron BRBFs. All four frames were originally
146
designed by Sabelli (2000) according to 1997 NEHRP provisions (FEMA, 1997). In this
chapter, only the performances of example CBFs are studied. Also, only the global
collapse condition and collapse prevention (CP) performance level are considered. It
should be noted, as was mentioned by Uriz and Mahin (2004), that due to lack of
supporting experimental data, several significant assumptions are needed when using the
PBEE procedure for CBFs. Many parameter values used are approximate for CBFs and
as a result, the calculated values for confidence level are only approximate estimates and
they may not be as accurate as they are for SMRFs. Nevertheless, they are reasonable
enough for comparison purposes since the same parameters have been used for both
NEHRP and PBPD designed CBFs.
A summary of the steps in calculating the confidence level with which a structure
can achieve its intended performance objective, as outlined by FEMA 351 (FEMA,
2000b), can be given as follows:
1. The performance objective against which the structure should be evaluated is
selected. This requires selection of the desired performance level, e.g. Collapse
Prevention or Immediate Occupancy, and a desired probability that damage in a period of
time will be worse than this performance level. Representative performance objectives
may include:
2% probability of poorer performance than Collapse Prevention level in 50
years
50% probability of poorer performance than Immediate Occupancy level in 50
years.
2. Characteristic motion for the performance objective is determined. For
probabilistic performance objectives, an average estimate of the ground shaking intensity
147
at the probability of exceedance identified in the performance objective definition (Step
1) is determined. Ground shaking intensity is characterized by the parameter SaT1, the 5%
damped spectral response acceleration at the site for the fundamental period of response
of the structure. NEHRP 1997 provides procedures for determining this parameter for any
probability of exceedance in a 50-year period.
3. Structural demands for the characteristic earthquake ground motion are
determined. A mathematical model is developed to represent the building structure. This
model is then subjected to a structural analysis, using any of the methods mentioned in
Chapter 3 of FEMA 351 (FEMA, 2000b). This analysis provides estimates of maximum
interstory drift demand, maximum column axial compression force demand, and
maximum column-splice axial tension force demand, for the ground motion selected in
Step 2.
4. Median estimates of structural capacity are determined. Interstory drift capacity
for the building frame, as a whole, may be estimated using the default values given in
Chapter 3 of FEMA351 for regular structures. Alternatively, the detailed procedures of
Section A.6 of FEMA351 (e.g. Incemental Dynamic Analysis or IDA) may be used.
3. A factored-demand-to-capacity ratio, is determined. The calculated estimates of
demand D and capacity C are determined using Steps 3 and 4, respectively. The
corresponding demand (γ) and resistance () factors should be determined in accordance
with the applicable procedures. Then the confidence parameter can be obtained using
Equation ( 4.1).
6. The confidence level is evaluated. The confidence level with regard to the ability
of the structure to meet the performance objective should be the lowest value determined
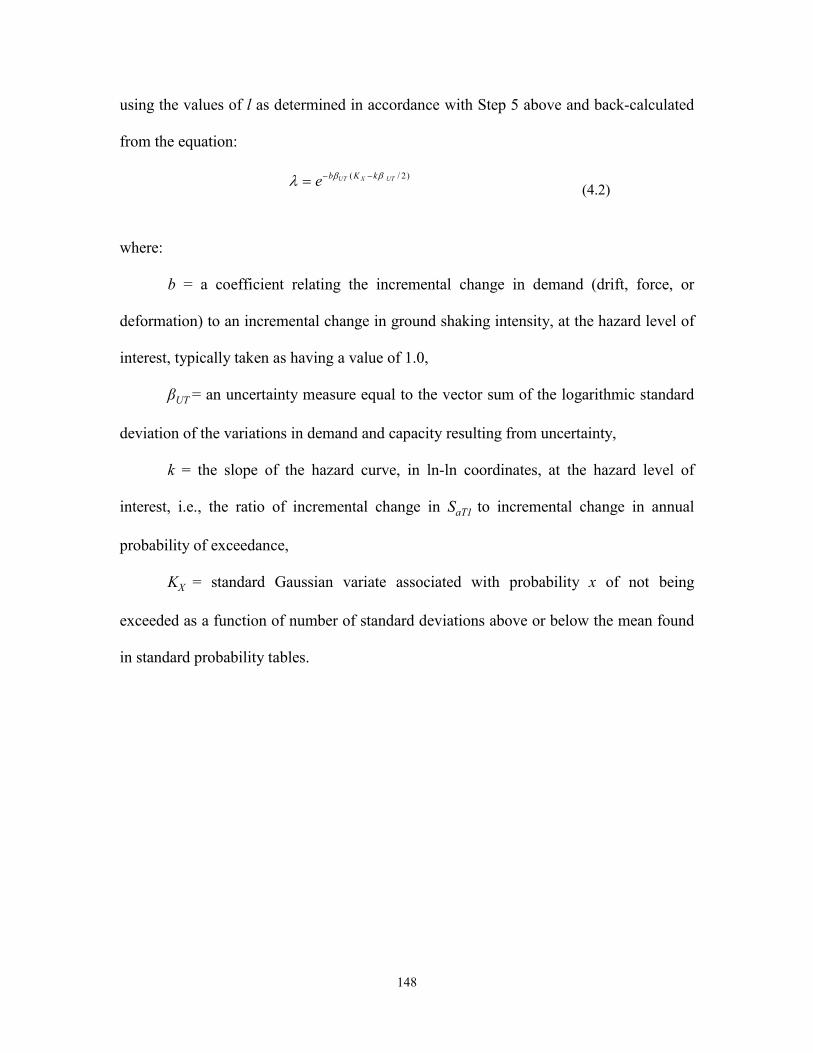
148
using the values of l as determined in accordance with Step 5 above and back-calculated
from the equation:
( / 2) UT X UTb K ke ( 4.2)
where:
b = a coefficient relating the incremental change in demand (drift, force, or
deformation) to an incremental change in ground shaking intensity, at the hazard level of
interest, typically taken as having a value of 1.0,
βUT = an uncertainty measure equal to the vector sum of the logarithmic standard
deviation of the variations in demand and capacity resulting from uncertainty,
k = the slope of the hazard curve, in ln-ln coordinates, at the hazard level of
interest, i.e., the ratio of incremental change in SaT1 to incremental change in annual
probability of exceedance,
KX = standard Gaussian variate associated with probability x of not being
exceeded as a function of number of standard deviations above or below the mean found
in standard probability tables.
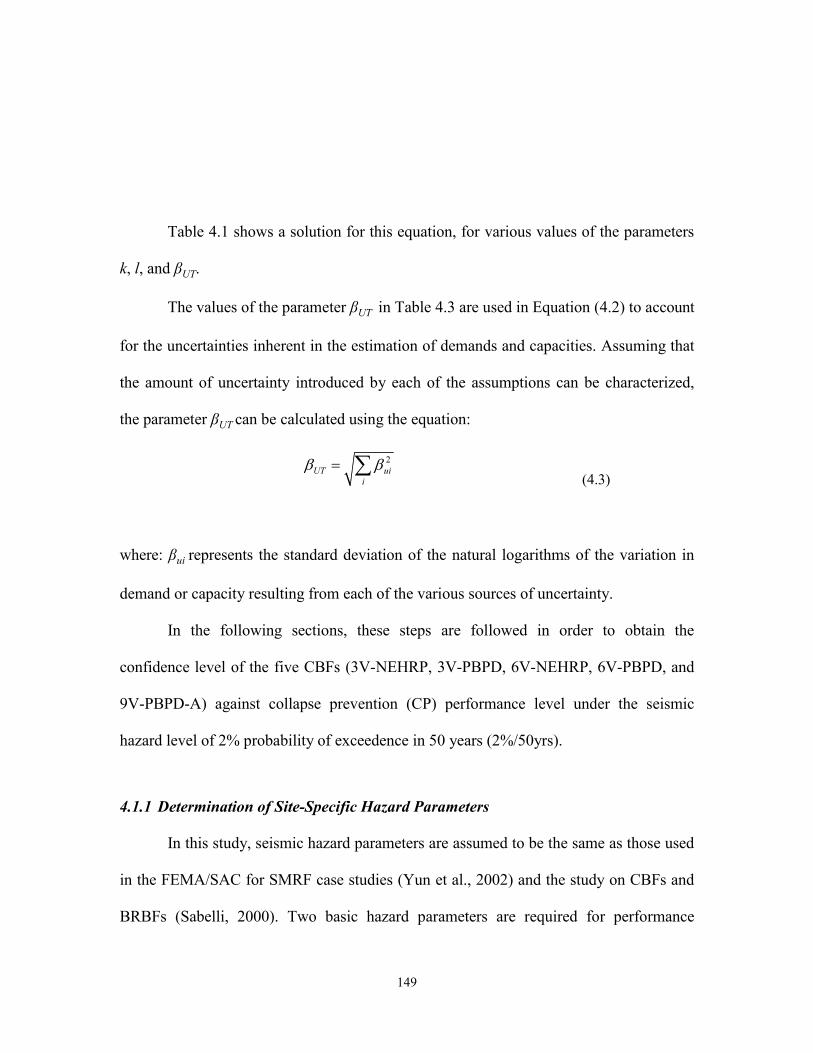
149
Table 4.1 shows a solution for this equation, for various values of the parameters
k, l, and βUT.
The values of the parameter βUT in Table 4.3 are used in Equation ( 4.2) to account
for the uncertainties inherent in the estimation of demands and capacities. Assuming that
the amount of uncertainty introduced by each of the assumptions can be characterized,
the parameter βUT can be calculated using the equation:
2 UT uii
( 4.3)
where: βui represents the standard deviation of the natural logarithms of the variation in
demand or capacity resulting from each of the various sources of uncertainty.
In the following sections, these steps are followed in order to obtain the
confidence level of the five CBFs (3V-NEHRP, 3V-PBPD, 6V-NEHRP, 6V-PBPD, and
9V-PBPD-A) against collapse prevention (CP) performance level under the seismic
hazard level of 2% probability of exceedence in 50 years (2%/50yrs).
4.1.1 Determination of Site-Specific Hazard Parameters
In this study, seismic hazard parameters are assumed to be the same as those used
in the FEMA/SAC for SMRF case studies (Yun et al., 2002) and the study on CBFs and
BRBFs (Sabelli, 2000). Two basic hazard parameters are required for performance

150
evaluation. These are: the intensity as the median 5%-damped linear spectral response
acceleration, SaT1, at the fundamental period of the building for the desired hazard level,
and the logarithmic slope of the hazard curve, k, at the desired hazard level (FEMA,
2000b). In this study, the building is assumed to be located on firm soil in downtown Los
Angeles, California and the seismic hazard parameters are based on the 1997 NEHRP
Provisions (FEMA, 1997). Accordingly, twenty ground motions from FEMA/SAC
database for the LA site and corresponding to a 2% probability of exceedence in 50 year
(hereafter called SAC LA ground motions) are used in dynamic analyses. These ground
motions, which consist of LA21 to LA40, are taken from a larger database of
representative ground motions developed by Somerville et al. (1997).
The logarithmic slope k of the hazard curve at the desired hazard level is used to
determine the resistance factors, demand factors and also the confidence levels. The
hazard curve is a plot of probability of exceedance of a spectral amplitude versus the
spectral amplitude for a given period, and is usually plotted on a log-log scale (FEMA,
2000b). In functional form it can be represented by the equation:
0( ) ksi i iH S k S
( 4.4)
where:
HSi(Si) = the probability of ground shaking having a spectral response acceleration
greater than Si,
k0 = a constant, dependent on the seismicity of the individual site,
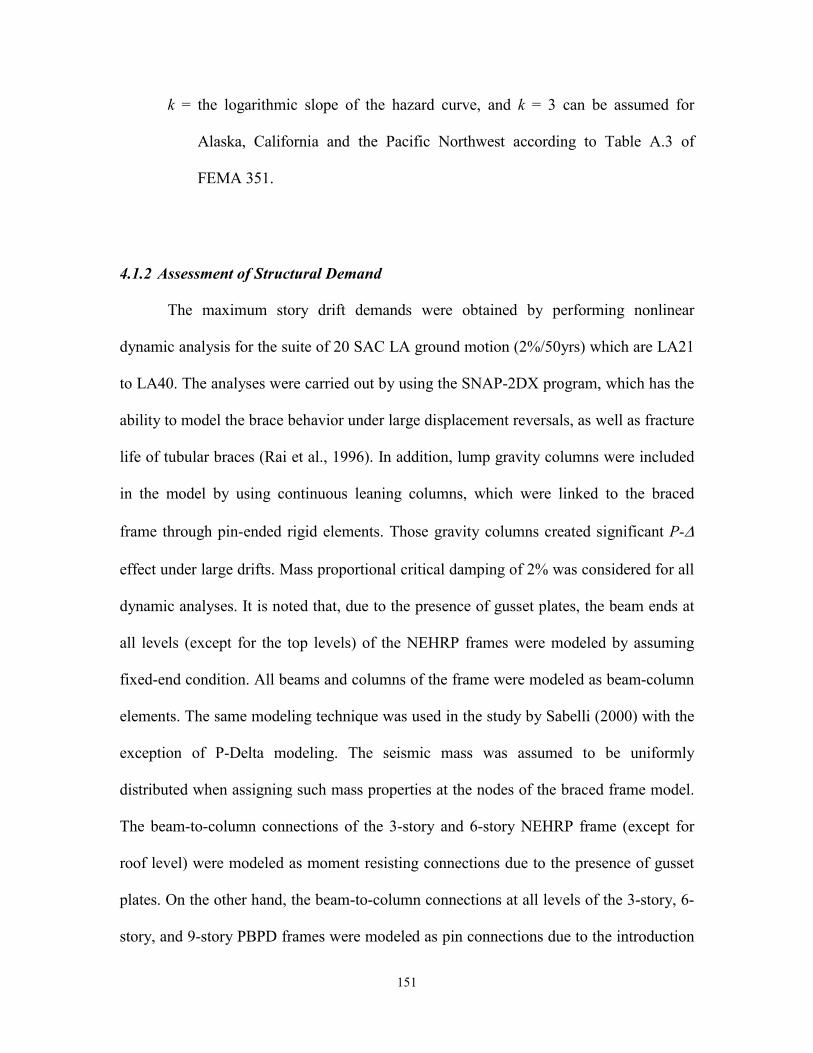
151
k = the logarithmic slope of the hazard curve, and k = 3 can be assumed for
Alaska, California and the Pacific Northwest according to Table A.3 of
FEMA 351.
4.1.2 Assessment of Structural Demand
The maximum story drift demands were obtained by performing nonlinear
dynamic analysis for the suite of 20 SAC LA ground motion (2%/50yrs) which are LA21
to LA40. The analyses were carried out by using the SNAP-2DX program, which has the
ability to model the brace behavior under large displacement reversals, as well as fracture
life of tubular braces (Rai et al., 1996). In addition, lump gravity columns were included
in the model by using continuous leaning columns, which were linked to the braced
frame through pin-ended rigid elements. Those gravity columns created significant P-
effect under large drifts. Mass proportional critical damping of 2% was considered for all
dynamic analyses. It is noted that, due to the presence of gusset plates, the beam ends at
all levels (except for the top levels) of the NEHRP frames were modeled by assuming
fixed-end condition. All beams and columns of the frame were modeled as beam-column
elements. The same modeling technique was used in the study by Sabelli (2000) with the
exception of P-Delta modeling. The seismic mass was assumed to be uniformly
distributed when assigning such mass properties at the nodes of the braced frame model.
The beam-to-column connections of the 3-story and 6-story NEHRP frame (except for
roof level) were modeled as moment resisting connections due to the presence of gusset
plates. On the other hand, the beam-to-column connections at all levels of the 3-story, 6-
story, and 9-story PBPD frames were modeled as pin connections due to the introduction

152
of beam splices (see Figure 2.6). For comparison between performances of NEHRP and
PBPD frames under the design level (10%/50yrs) as well as MCE level (2%/50yrs)
ground motions the reader is referred to Goel and Chao (2008).
The maximum interstory drifts were considered to be a good indication of the
global damage in CBFs. It is well related to the extent of plastic deformations in
structural components (local level) as well as the global instability of the whole frame
due to P-Δ effect. The peak interstory drifts at all stories for the four frames were
obtained under each of the 20 SAC LA ground motions. As recommended by FEMA 351,
a lognormal probability distribution was considered for these peak interstory drift values.
The median and standard deviation values were then obtained for these peak interstory
drifts for all ground motions. The median value of these drift demands can be taken as the
demand parameter D for use in Equation ( 4.1). The variability (uncertainty) of dynamic
response for this hazard level is represented by the standard deviation of the natural
logarithm of the peak drift demands (DR). Once the value of DR is determined, the
demand variability factor, γ, is calculated from the Equation ( 4.5) as:
2
2DR
k
be
( 4.5)
where:
k = the logarithmic slope of the hazard curve (see section 4.3.1)
b = a coefficient that represents the amount that demand increases as a function of
hazard. As mentioned by Uriz (2005), for flexible moment frames, this value is taken as
1.0, but for stiffer braced frames with shorter periods a value larger than 1.0 might be
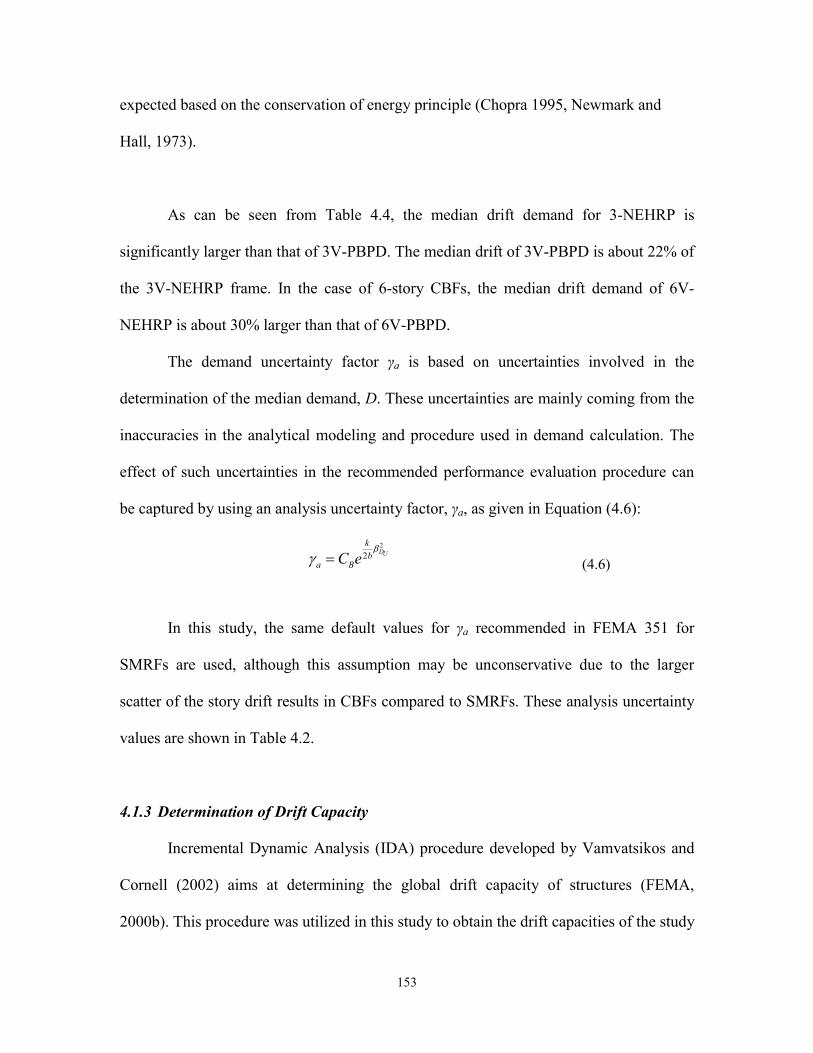
153
expected based on the conservation of energy principle (Chopra 1995, Newmark and
Hall, 1973).
As can be seen from Table 4.4, the median drift demand for 3-NEHRP is
significantly larger than that of 3V-PBPD. The median drift of 3V-PBPD is about 22% of
the 3V-NEHRP frame. In the case of 6-story CBFs, the median drift demand of 6V-
NEHRP is about 30% larger than that of 6V-PBPD.
The demand uncertainty factor γa is based on uncertainties involved in the
determination of the median demand, D. These uncertainties are mainly coming from the
inaccuracies in the analytical modeling and procedure used in demand calculation. The
effect of such uncertainties in the recommended performance evaluation procedure can
be captured by using an analysis uncertainty factor, γa, as given in Equation ( 4.6):
2
2DU
k
ba BC e
( 4.6)
In this study, the same default values for γa recommended in FEMA 351 for
SMRFs are used, although this assumption may be unconservative due to the larger
scatter of the story drift results in CBFs compared to SMRFs. These analysis uncertainty
values are shown in Table 4.2.
4.1.3 Determination of Drift Capacity
Incremental Dynamic Analysis (IDA) procedure developed by Vamvatsikos and
Cornell (2002) aims at determining the global drift capacity of structures (FEMA,
2000b). This procedure was utilized in this study to obtain the drift capacities of the study

154
frames. In this method, the maximum interstory drifts were obtained through nonlinear
dynamic analyses under varying intensities of twenty 2%/50yrs SAC ground motions
(FEMA, 2000b; Vamvatsikos and Cornell, 2002). Having the intensity (in terms of
spectral acceleration, Sa) versus maximum story drift plot for each ground motion, the
drift capacity for a particular ground motion can be estimated at the point where the slope
of the curve falls below one-fifth of its initial slope. Additionally, as an upper bound, the
drift capacities cannot be taken greater than 10%. Figure 4.1 and Figure 4.2 show the
IDA results for the 3, 6, and 9-story frames, respectively. The drift capacities are shown
in these figures by hollow circles on each curve. The numerical values for global drift
capacity C and the corresponding resistance factor are given in Table 4.4.
4.1.4 Confidence Level Assessment
After all the parameters needed in Equation (4-14) to calculate the confidence
parameter are determined, the confidence level can be obtained for each frame. This
can be done either by interpolating the appropriate values from
155
Table 4.1, or by using the standard Gaussian variate KX given by the following
equation:
ln( )
2 UT
XUT
kK
b b
( 4.7)
Randomness and uncertainty parameters as well as resulting confidence levels are
shown in Table 4.3 and Table 4.4, respectively. As can be seen, confidence level of the
3V-NEHRP frame against global collapse (<<1%) was dramatically improved when it
was re-designed by the PBPD method (i.e., 3V-PBPD frame). It is worth mentioning that
the enhanced confidence level (>99.9%) is comparable to those of SMFs designed
according to 1997 NEHRP provisions (Yun et al., 2002). It can also be seen that although
the median drift capacities for the two 3-story frames are somewhat close, the drift
demand of the 3V-PBPD frame is only about 22% of the 3V-NEHRP frame. Therefore,
most of the improvement in confidence level comes from the reduction in drift demand.
Table 4.4 also shows that, the confidence level for 6V-NEHRP frame (23.3%) is higher
compared to the 3V-NEHRP frame, but is still much below the 90% satisfactory level
suggested by FEMA 351 for SMFs. The confidence level of 86.2%, for the 6V-PBPD
frame is also quite close to the desired 90% level. The confidence level for 9V-PBPD-A
frame is about 52% which is quite low compared to the 3 and 6-story PBPD frames.
Several adjustments to improve the confidence level of the 9-story frame are suggested in
Chapter 5.

156
4.2 Summary and Concluding Remarks
- Reliability-based evaluation by using the FEMA 351 procedure for SMFs, which
accounts for randomness and uncertainty in the estimation of seismic demand and drift
capacity, showed that steel concentrically braced frames (CBFs) designed by the
performance-based plastic design (PBPD) method can have dramatically higher
confidence levels against global collapse than those of SCBFs designed by current
practice. Also, those confidence levels can be similar to the target confidence levels for
SMFs in current practice, i.e., 90% or above.
- Significant improvement in the confidence level (C. L.) can be seen for the 3V-
PBPD compared to 3V-NEHRP. This C. L. is indeed comparable to those of MFs
designed by 1997 NEHRP code (Yun et al., 2002). On the other hand, the 3V-NEHRP
shows extremely low confidence level against global collapse. It can also be seen that
although the median drift capacities for the two 3-story frames are somewhat close, they
show quite different drift demands under 2/50 ground motions.
-The C.L. for 6V-NEHRP frame was somewhat better than that of the 3V-NEHRP
frame, but was still much less than the 90% satisfactory level as suggested by FEMA
351. Significant difference can still be observed between the C.L.s of 6V-NEHRP and
6V-PBPD, with the latter having a confidence level quite close to 90%.
157
- The C.L. for 9V-PBPD-A came out to be about 52% which is not quite
satisfactory when compared to the superior C.L. of 3V-PBPD and 6V-PBPD frames. This
can be attributed to larger P-Delta effects and also more brace fractures for this 9-story
frame. These issues are further addressed in Chapter 5 and proper modifications are
suggested to improve the C.L. of the 9-story CBF, to about the level of 6V-PBPD.
Table 4.1. Confidence Parameter , as a Function of Confidence Level, Hazard Parameter k, and
Uncertainty βUT (from Yun et al, 2001)

158
Table 4.2. Analysis Uncertainty Parameters
Study Frames CB βDU γa
3V-NEHRP 1.0 0.15 1.03
3V-PBPD 1.0 0.15 1.03
6V-NEHRP 1.0 0.20 1.06
6V-PBPD 1.0 0.20 1.06
9V-PBPD-A 1.0 0.20 1.06
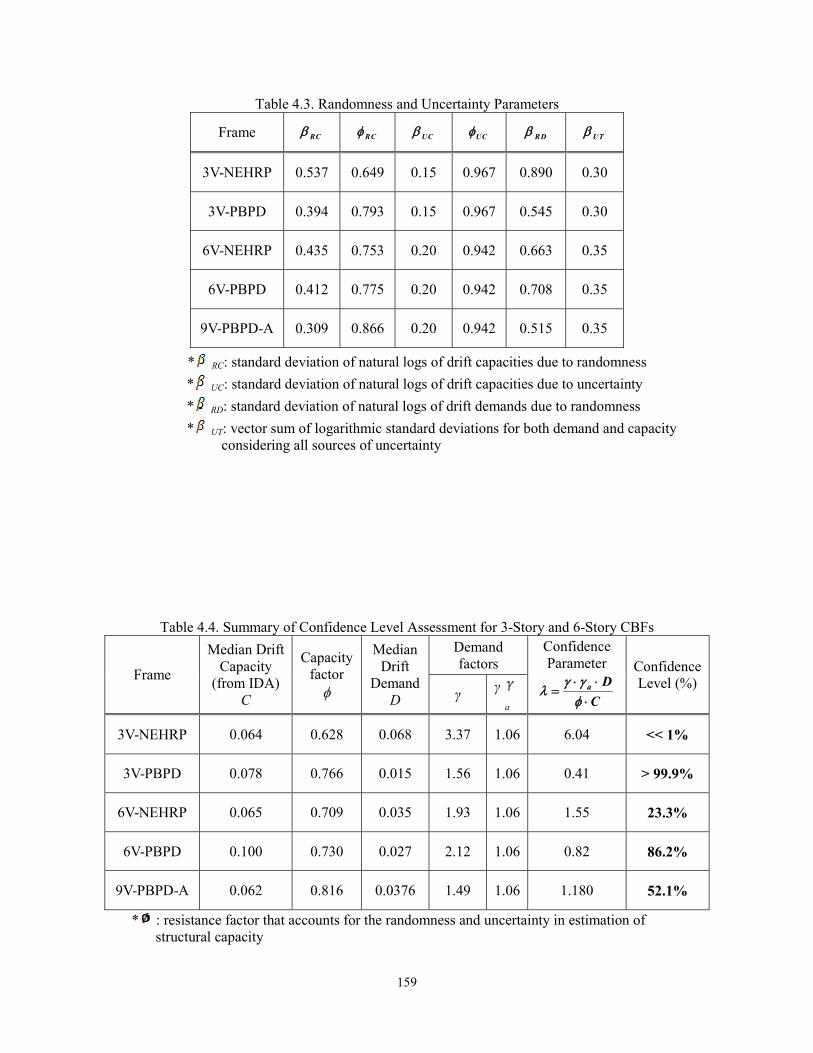
159
Table 4.3. Randomness and Uncertainty Parameters
Frame RC RC UC UC RD UT
3V-NEHRP 0.537 0.649 0.15 0.967 0.890 0.30
3V-PBPD 0.394 0.793 0.15 0.967 0.545 0.30
6V-NEHRP 0.435 0.753 0.20 0.942 0.663 0.35
6V-PBPD 0.412 0.775 0.20 0.942 0.708 0.35
9V-PBPD-A 0.309 0.866 0.20 0.942 0.515 0.35
* RC: standard deviation of natural logs of drift capacities due to randomness
* UC: standard deviation of natural logs of drift capacities due to uncertainty
* RD: standard deviation of natural logs of drift demands due to randomness
* UT: vector sum of logarithmic standard deviations for both demand and capacity considering all sources of uncertainty
Table 4.4. Summary of Confidence Level Assessment for 3-Story and 6-Story CBFs
Frame
Median Drift Capacity
(from IDA) C
Capacity factor
Median Drift
Demand D
Demand factors
Confidence Parameter
a D
C
Confidence Level (%)
γ γa
3V-NEHRP 0.064 0.628 0.068 3.37 1.06 6.04 << 1%
3V-PBPD 0.078 0.766 0.015 1.56 1.06 0.41 > 99.9%
6V-NEHRP 0.065 0.709 0.035 1.93 1.06 1.55 23.3%
6V-PBPD 0.100 0.730 0.027 2.12 1.06 0.82 86.2%
9V-PBPD-A 0.062 0.816 0.0376 1.49 1.06 1.180 52.1%
* : resistance factor that accounts for the randomness and uncertainty in estimation of structural capacity
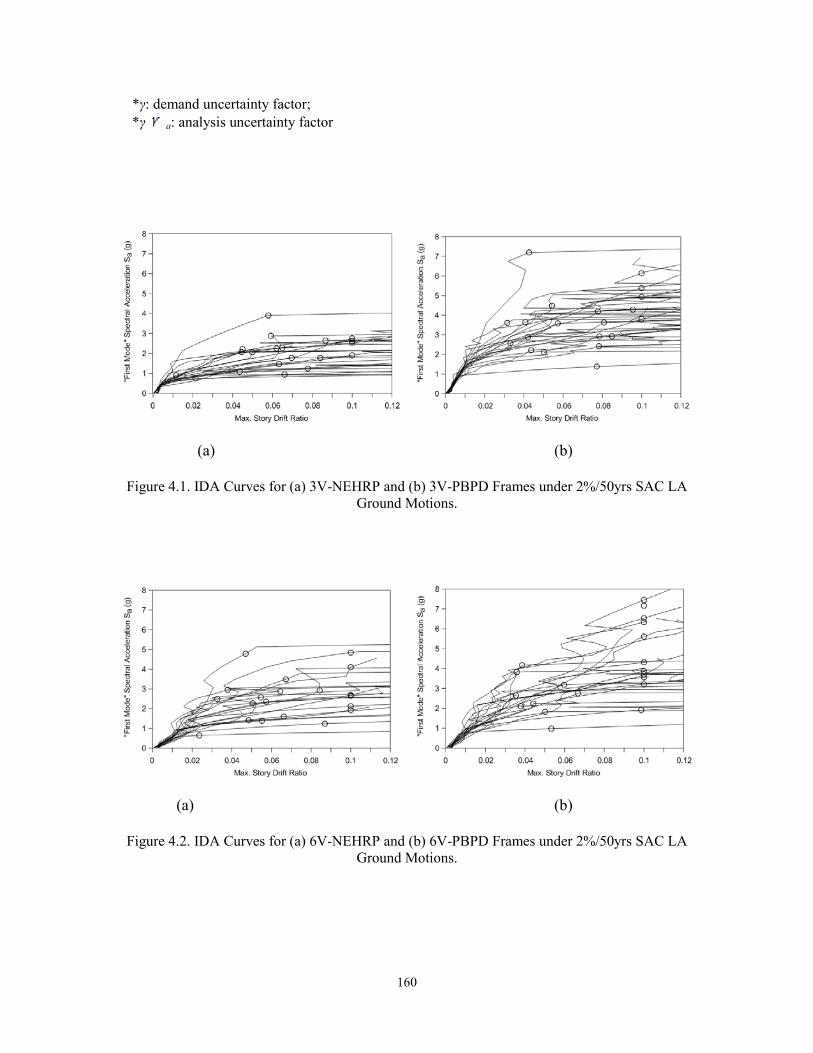
160
*γ: demand uncertainty factor; *γ a: analysis uncertainty factor
(a) (b)
Figure 4.1. IDA Curves for (a) 3V-NEHRP and (b) 3V-PBPD Frames under 2%/50yrs SAC LA Ground Motions.
(a) (b)
Figure 4.2. IDA Curves for (a) 6V-NEHRP and (b) 6V-PBPD Frames under 2%/50yrs SAC LA Ground Motions.

161
Figure 4.35. IDA Curves for 9V-PBPD03 Frames under 2%/50yrs SAC Ground Motions.
0.0
1.0
2.0
3.0
4.0
5.0
6.0
7.0
0 0.02 0.04 0.06 0.08 0.1 0.12
"First‐m
ode" Spectral A
cceleration Sa(T1,5%)
Max. Interstory Drift (rad)
LA21
LA22
LA23
LA24
LA25
LA26
LA27
LA28
LA29
LA30
LA31
LA32
LA33
LA34
LA35
LA36
LA37
LA38
LA39
LA40
Max

162
163
CHAPTER 5
Confidence Level Enhancement of the 9-Story CBF Designed by PBPD
5.1 Introduction
As was presented in Chapter 4, somewhat low confidence level (C.L.) of 52%
against collapse was obtained for the 9V-PBPD-A frame designed by the procedure
described in Chapter 3, even though the story drifts where within drift limits under design
level ground motions. It should also be noted that the C.L. for the 3 and 6-story PBPD
frames were excellent with values of 99.9% and 86%, respectively (see Table 4.4).
The main objective in this chapter was to further improve the C.L. of the 9-story
CBF (as a representative of mid-rise CBF systems) against collapse. Modifications to
improve the C.L. are suggested. These include modification in the PBPD design base
shear (DBS) calculation for taller CBF by revising the λ-factor, and considering alternate
brace configuration of two story X-pattern (split-X). Also, the effect of increasing the
brace fracture life, Nf , on the C.L. is studied.
In general, the main design objectives in the calculation of the required PBPD
design base shear are: (1) not exceeding the targeted story drifts under design level
ground motions; (2) minimizing potential for collapse under MCE ground motions; (3)
achieving satisfactory C.L. against collapse.
164
Lower C.L. observed for 9V-PBPD-A (compared to 3V-PBPD and 6V-PBPD) is
believed mainly due to somewhat low value of DBS used in the design. Therefore, the
main focus in this chapter is to suggest way to calculate suitable value of DBS that would
result in improved C.L. against collapse. In addition, the effect of using split-X
configuration, as well as that of increased Nf on the C.L. are investigated.
5.2 New λ-Factor
The λ-factor approach was introduced in Chapter 3, for calculation of design base
shear (DBS) in the PBPD procedure for CBF structures. In this method, the effective
target drift is obtained by dividing actual target drift by an appropriate value of λ-factor.
This effective target drift is then used along with the modified yield drift (adjusted for
column axial deformations) to obtain the effective ductility of the equivalent Elastic-
Plastic SDOF system. The PBPD design base shear is then obtained by using this
effective ductility.
As was also mentioned in Chapter 3, the estimation for λ-factor in that chapter
was an initial attempt. By careful assessment of the parameters involved in the DBS
calculation, and also based on observations on the seismic performance and confidence
level of the 9V-PBPD-A frame, it was found that the estimation of λ-factor, as used in
Chapter 3 (Figure 3.15), can be improved in order to enhance the seismic response of
longer period taller CBFs.
The P-Delta effect was not directly accounted for in DBS calculation. In the case
of 9V-PBPD-A, the P-Delta forces were later added for the design of braces in order to
indirectly capture this second order effect. An alternate method to account for the P-Delta
165
effects can be through suitable modification of the λ-factor, in a way that reflects this
effect. By following such approach, enhanced response can be achieved through
calculation of appropriate design base shear from the very beginning of the design
process.
Therefore, a new and slightly different estimation of λ-factor is proposed here.
Figure 5.1 shows this new λ-factor along with the one previously used in Chapter 3. As
can be seen, the main difference between the two is for periods larger than 0.7 second
which corresponds to mid to high-rise CBF systems. Table 5.1 shows the values of the
new λ-factor as a function of T.
Also as can be seen in Figures 5.1 to 5.3, the λ-factor value for periods longer
than 1.0 sec is selected to be 1.10 in order to compensate for the P-Delta effect. As a
result, it is expected that the new λ-factor would affect mainly the design of mid-rise to
high-rise CBF systems.
Figure 5.2 shows comparison between the new λ-factor and the suggested C2
values from FEMA 356 (2000). As can be seen, the new λ-factor gets closer to the values
suggested for Collapse Prevention by FEMA 356 in the range of mid-rise CBFs (T= 0.5 ~
0.75 second) and comes closer to the values suggested for Life Safety for longer periods.
However, such comparison may not be quite fair since the new λ-factor accounts for P-
Delta effects, potential brace fractures, as well as pinched hysteretic behavior, whereas
the FEMA 356 C2 factor accounts for the latter only.
As shown in Figure 5.3, the new λ-factor does not exactly follow the mean of
displacement ratio for the set of ground motions for stiffness degrading (SD) systems.
The reasons are: 1) The mean was obtained for SDOF systems; 2) It does not include the

166
effect of brace fractures; 3) It does not capture P-Delta effect for longer period frames.
However, the proposed λ values in general follow the trend of the mean ratios.
Figure 5.1. New λ-Factor versus λ-Factor used in Chapter 3
Figure 5.2. Comparison of the New λ-Factor with C2 values in FEMA 356 (2000)
0
0.5
1
1.5
2
0 0.5 1 1.5 2 2.5 3
λ-
Fac
tor
Period (sec)
λ‐Factor in Chap 3
New λ‐Factor
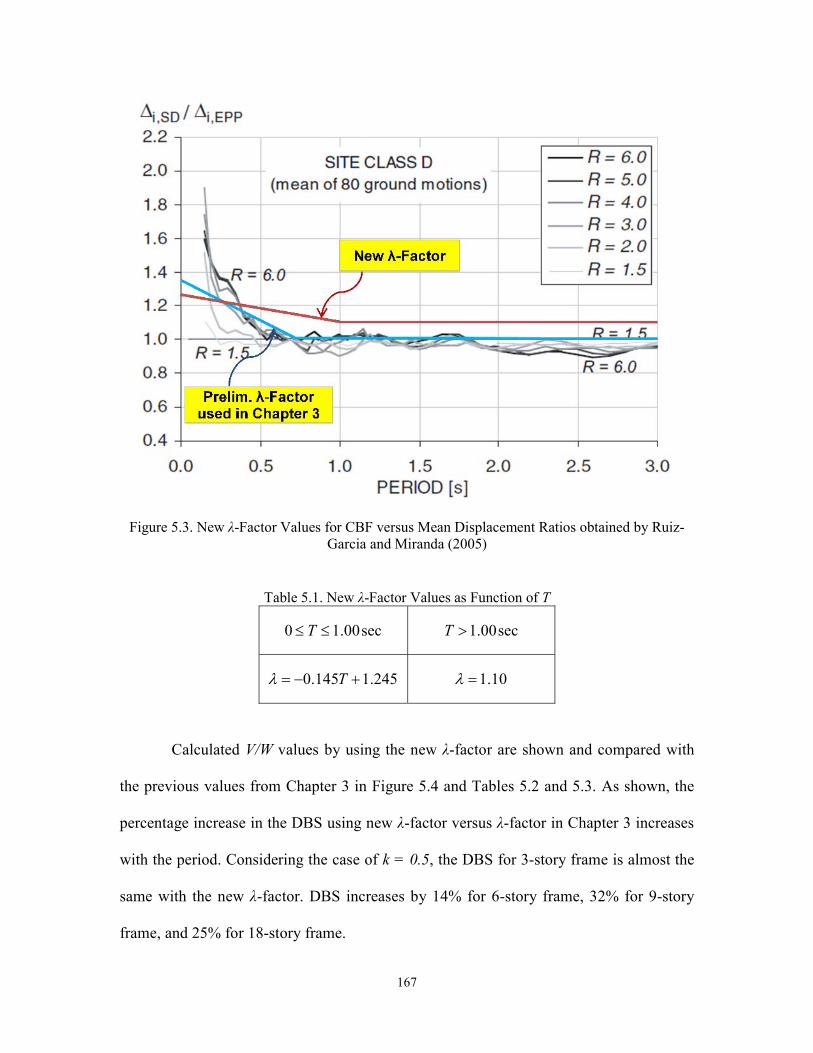
167
Figure 5.3. New λ-Factor Values for CBF versus Mean Displacement Ratios obtained by Ruiz-Garcia and Miranda (2005)
Table 5.1. New λ-Factor Values as Function of T
sec00.10 T sec00.1T
245.1145.0 T 10.1
Calculated V/W values by using the new λ-factor are shown and compared with
the previous values from Chapter 3 in Figure 5.4 and Tables 5.2 and 5.3. As shown, the
percentage increase in the DBS using new λ-factor versus λ-factor in Chapter 3 increases
with the period. Considering the case of k = 0.5, the DBS for 3-story frame is almost the
same with the new λ-factor. DBS increases by 14% for 6-story frame, 32% for 9-story
frame, and 25% for 18-story frame.
168
It should also be mentioned that the DBS for 3 and 6-story frames are almost
similar to the previous values as used in Chapter 2.
The Advantages of using this new λ-factor include:
a) Achieving real dual level design for DBE and MCE, meaning for example DBS
for DBE level would result in a structure that would satisfy the DBE performance
requirements, i.e., targeted drifts, very limited or no brace fracture.
b) When MCE level governs the DBS, that value should be used to satisfy the
performance objectives selected for both levels. That has also been found to result in
enhanced C.L. against collapse. If one chooses to only satisfy the DBE level
requirements, design can be based on DBE base shear alone.
c) Any value of the k factor (for lateral force distribution) between 0.5 and 0.75
can be used. However, it is recommended that for taller frames smaller value be used,
which results in smaller drifts in the upper stories.

169
Figure 5.4. Comparison of Design Base Shear from PBPD versus ASCE/SEI 7-05 (values obtained using k = 0.75)
Table 5.2. PBPD Design Base Shear using k = 0.75
Frame Period T (sec)
λ-factor in Chap 3
New λ-factor ( / )( / )
New
in Chap3
V WV W
DBE MCE DBE MCE
3V 0.31 0.336 0.480 0.325 0.466 0.97
6V 0.55 0.281 0.322 0.317 0.362 1.12
9V 0.734 0.166 0.195 0.222 0.256 1.31
18V 1.22 0.111 0.141 0.144 0.176 1.25
0.00
0.10
0.20
0.30
0.40
0.50
0.60
0.0 0.5 1.0 1.5
V/W
T (sec)
Design Base Shear for CBFs
ASCE/SEI 7-05
New PBPD- 10/50
New PBPD- 2/50
New C2-DBE
New C2-MCE
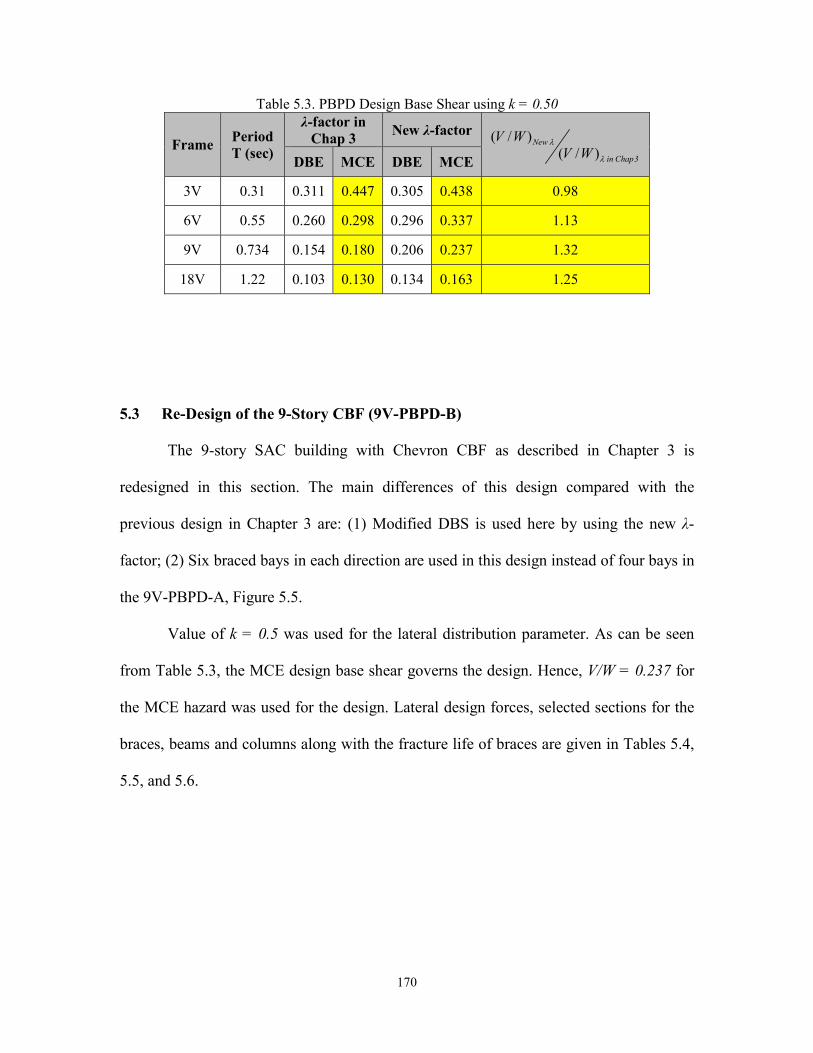
170
Table 5.3. PBPD Design Base Shear using k = 0.50
Frame Period T (sec)
λ-factor in Chap 3
New λ-factor ( / )( / )
New
in Chap3
V WV W
DBE MCE DBE MCE
3V 0.31 0.311 0.447 0.305 0.438 0.98
6V 0.55 0.260 0.298 0.296 0.337 1.13
9V 0.734 0.154 0.180 0.206 0.237 1.32
18V 1.22 0.103 0.130 0.134 0.163 1.25
5.3 Re-Design of the 9-Story CBF (9V-PBPD-B)
The 9-story SAC building with Chevron CBF as described in Chapter 3 is
redesigned in this section. The main differences of this design compared with the
previous design in Chapter 3 are: (1) Modified DBS is used here by using the new λ-
factor; (2) Six braced bays in each direction are used in this design instead of four bays in
the 9V-PBPD-A, Figure 5.5.
Value of k = 0.5 was used for the lateral distribution parameter. As can be seen
from Table 5.3, the MCE design base shear governs the design. Hence, V/W = 0.237 for
the MCE hazard was used for the design. Lateral design forces, selected sections for the
braces, beams and columns along with the fracture life of braces are given in Tables 5.4,
5.5, and 5.6.
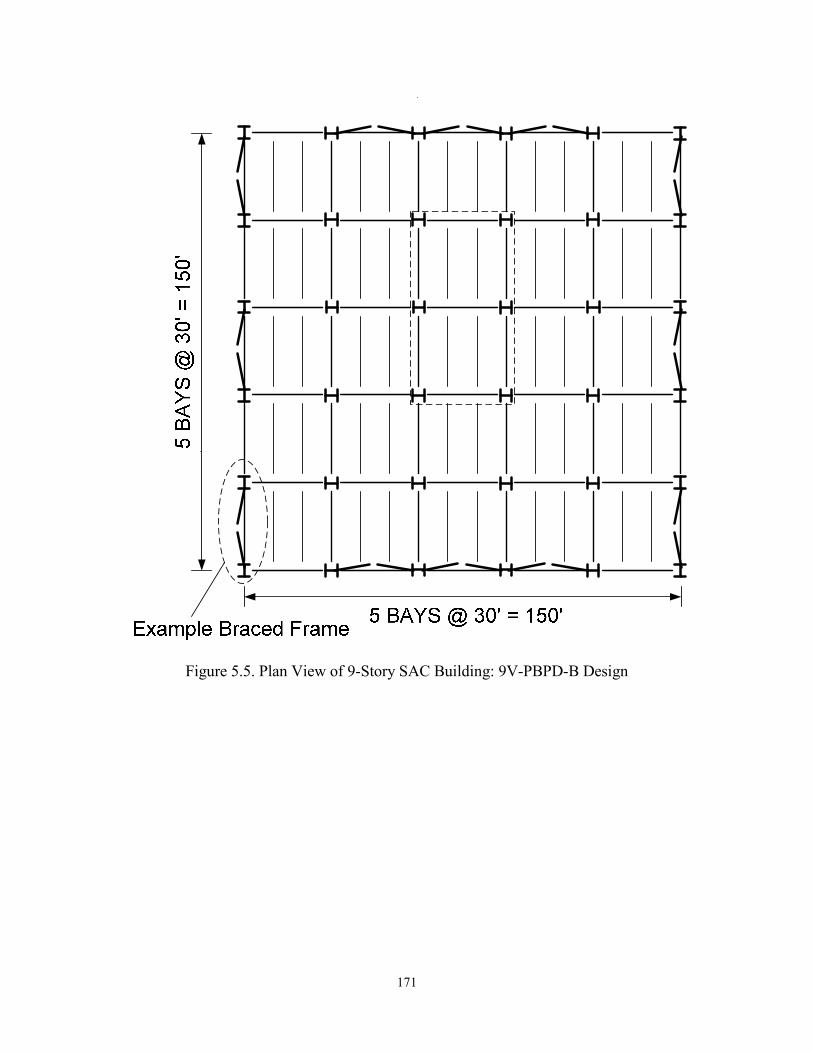
171
Figure 5.5. Plan View of 9-Story SAC Building: 9V-PBPD-B Design
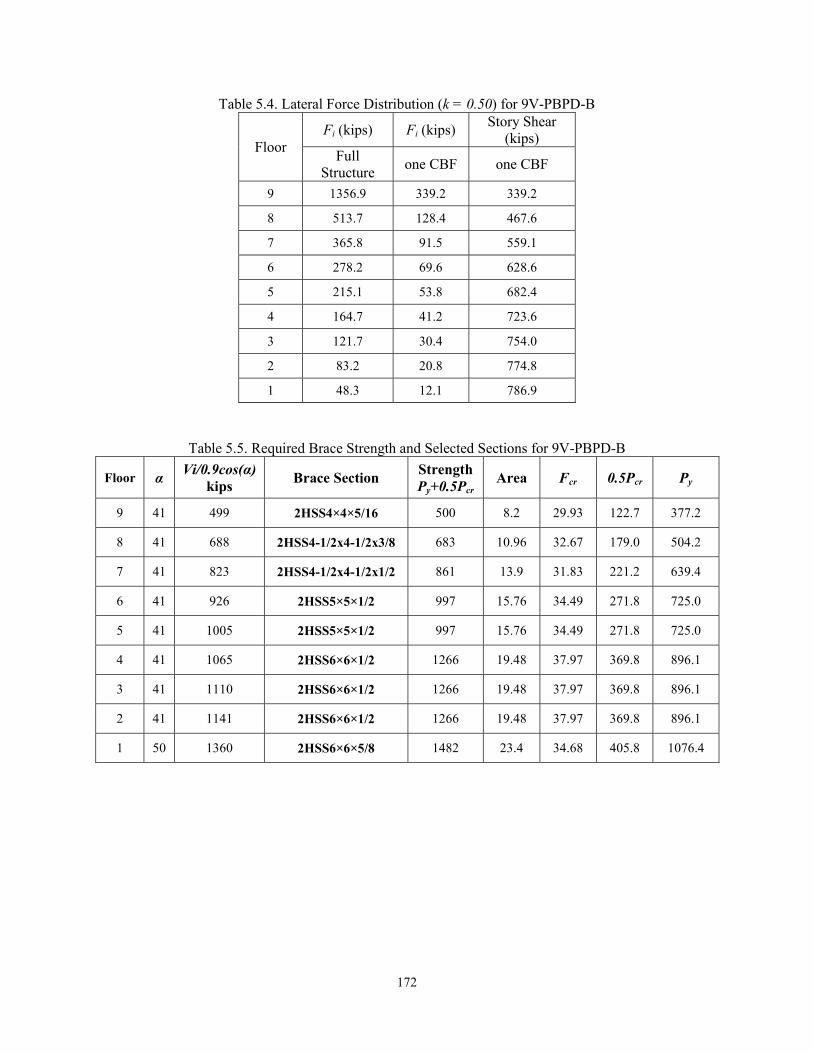
172
Table 5.4. Lateral Force Distribution (k = 0.50) for 9V-PBPD-B
Floor Fi (kips) Fi (kips)
Story Shear (kips)
Full Structure
one CBF one CBF
9 1356.9 339.2 339.2
8 513.7 128.4 467.6
7 365.8 91.5 559.1
6 278.2 69.6 628.6
5 215.1 53.8 682.4
4 164.7 41.2 723.6
3 121.7 30.4 754.0
2 83.2 20.8 774.8
1 48.3 12.1 786.9
Table 5.5. Required Brace Strength and Selected Sections for 9V-PBPD-B
Floor α Vi/0.9cos(α)
kips Brace Section
Strength Py+0.5Pcr
Area Fcr 0.5Pcr Py
9 41 499 2HSS4×4×5/16 500 8.2 29.93 122.7 377.2
8 41 688 2HSS4-1/2x4-1/2x3/8 683 10.96 32.67 179.0 504.2
7 41 823 2HSS4-1/2x4-1/2x1/2 861 13.9 31.83 221.2 639.4
6 41 926 2HSS5×5×1/2 997 15.76 34.49 271.8 725.0
5 41 1005 2HSS5×5×1/2 997 15.76 34.49 271.8 725.0
4 41 1065 2HSS6×6×1/2 1266 19.48 37.97 369.8 896.1
3 41 1110 2HSS6×6×1/2 1266 19.48 37.97 369.8 896.1
2 41 1141 2HSS6×6×1/2 1266 19.48 37.97 369.8 896.1
1 50 1360 2HSS6×6×5/8 1482 23.4 34.68 405.8 1076.4
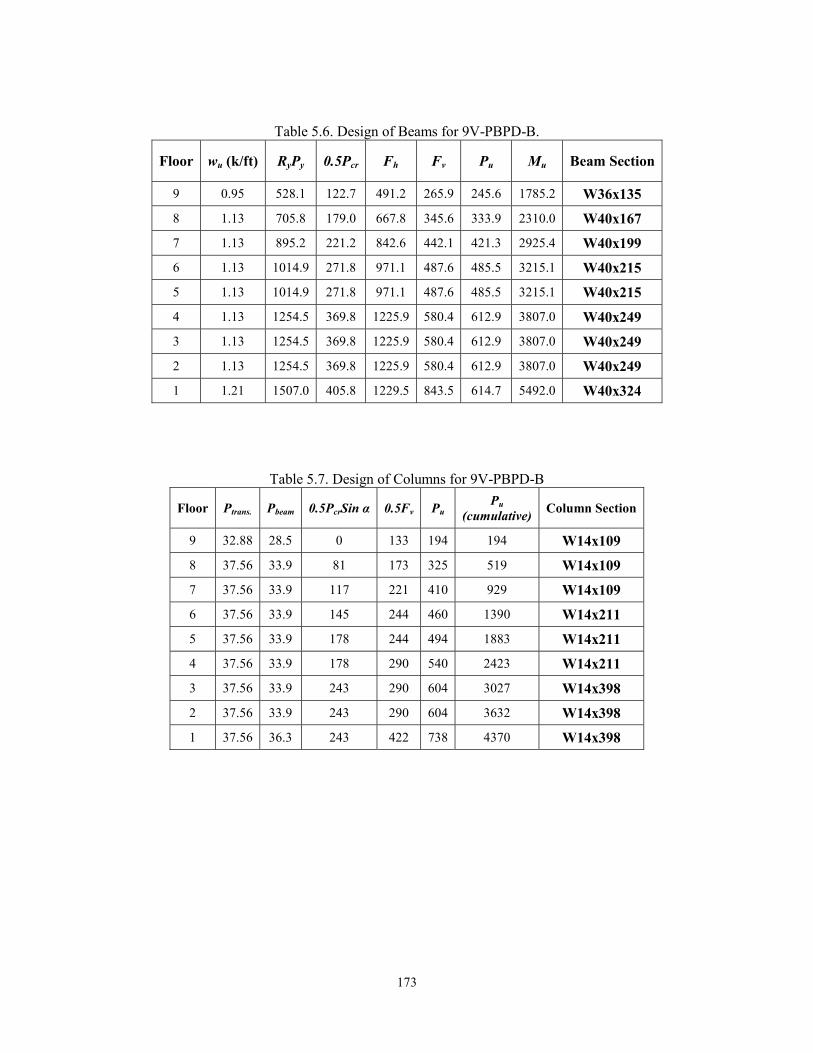
173
Table 5.6. Design of Beams for 9V-PBPD-B.
Floor wu (k/ft) RyPy 0.5Pcr Fh Fv Pu Mu Beam Section
9 0.95 528.1 122.7 491.2 265.9 245.6 1785.2 W36x135
8 1.13 705.8 179.0 667.8 345.6 333.9 2310.0 W40x167
7 1.13 895.2 221.2 842.6 442.1 421.3 2925.4 W40x199
6 1.13 1014.9 271.8 971.1 487.6 485.5 3215.1 W40x215
5 1.13 1014.9 271.8 971.1 487.6 485.5 3215.1 W40x215
4 1.13 1254.5 369.8 1225.9 580.4 612.9 3807.0 W40x249
3 1.13 1254.5 369.8 1225.9 580.4 612.9 3807.0 W40x249
2 1.13 1254.5 369.8 1225.9 580.4 612.9 3807.0 W40x249
1 1.21 1507.0 405.8 1229.5 843.5 614.7 5492.0 W40x324
Table 5.7. Design of Columns for 9V-PBPD-B
Floor Ptrans. Pbeam 0.5PcrSin α 0.5Fv Pu Pu
(cumulative) Column Section
9 32.88 28.5 0 133 194 194 W14x109
8 37.56 33.9 81 173 325 519 W14x109
7 37.56 33.9 117 221 410 929 W14x109
6 37.56 33.9 145 244 460 1390 W14x211
5 37.56 33.9 178 244 494 1883 W14x211
4 37.56 33.9 178 290 540 2423 W14x211
3 37.56 33.9 243 290 604 3027 W14x398
2 37.56 33.9 243 290 604 3632 W14x398
1 37.56 36.3 243 422 738 4370 W14x398

174
5.4 Design of the 9-Story CBF with Split-X Configuration (9X-PBPD-B)
In this section, the effect of using Spli-X brace configuration on seismic
performance and also C.L. of the 9-story CBF is investigated. Other design assumptions
such as pin ended beams, fixed base, and use of double HSS for braces are the same as
before.
The design parameters are kept the same for this configuration as for chevron
braced frame in the previous section. Therefore, the same MCE design base shear of
V/W=0.237 applies and is used for this design as well. The same bracing members are
used since the story shears are the same as the chevron configuration. However, much
smaller unbalanced force on the beams, and therefore much lighter beam sections (more
reasonable design) are obtained for the Split-X frame. Column sections remain about the
same as in the Chevron design. The free-body diagrams used for capacity design of
beams and columns are shown in Figure 5.6. Expected yield forces, RyPy, and post-
buckling strength of braces, 0.5Pcr, are considered in tension and compression,
respectively, to obtain the design forces for beams and columns. PL and PR represent
lateral forces due to other sources, such as frame action, inertia forces, etc. Those forces
were assumed to be zero when designing beam case B. The same assumption was used
for columns and only axial forces due to truss action were used for the design.
Important design parameters of different 9-story PBPD frames studied herein are
given in Table 5.8.
Beam and column sections for the design with Split-X configuration, 9X-PBPD-
B, are shown in Tables 5.9 and 5.10, respectively. It can be seen that the beams in two

175
different designs for Split-X configuration are significantly lighter than those of Chevron
configuration. The column sections are almost the same, except in the 4th story where the
Split-X design needed W14x398 based on capacity design requirements. The difference
between 9X-PBPD-B and 9X-PBPD-B1 is just in their beam sizes, as will be discussed
later in this section.
Generally, the performance of 9X-PBPD-B was found to be somewhat more
stable than the Chevron design under MCE ground motions (e.g. 9V-PBPD-B frame
showed dynamic instability under LA21 but 9X-PBPD-B frame did not.
The Split-X configuration (9X-PBPD-B frame) mainly involves axial behavior of
all members, but the Chevron frame has significant flexural component, especially in the
beams after buckling of the compression braces. That is why large beam sizes are needed
in the Chevron frame.
As mentioned earlier, beams sizes in the Split-X configuration are considerably
smaller compared to the Chevron configuration, making the Split-X frame lighter in
weight. However, local inelastic activity, such as large beam plastic hinge rotation, was
observed in the response of the 9X-PBPD-B frame, especially under MCE ground
motions. Further investigation showed that it was due to small axial design forces for the
beams. Nevertheless, local inelastic activity in the beams did not have much effect on the
global behavior of the frame.
Larger beam sizes with higher strength and stiffness are needed to prevent or
minimize such local inelastic activity. As shown in Table 5.9, W18x175 beam sections
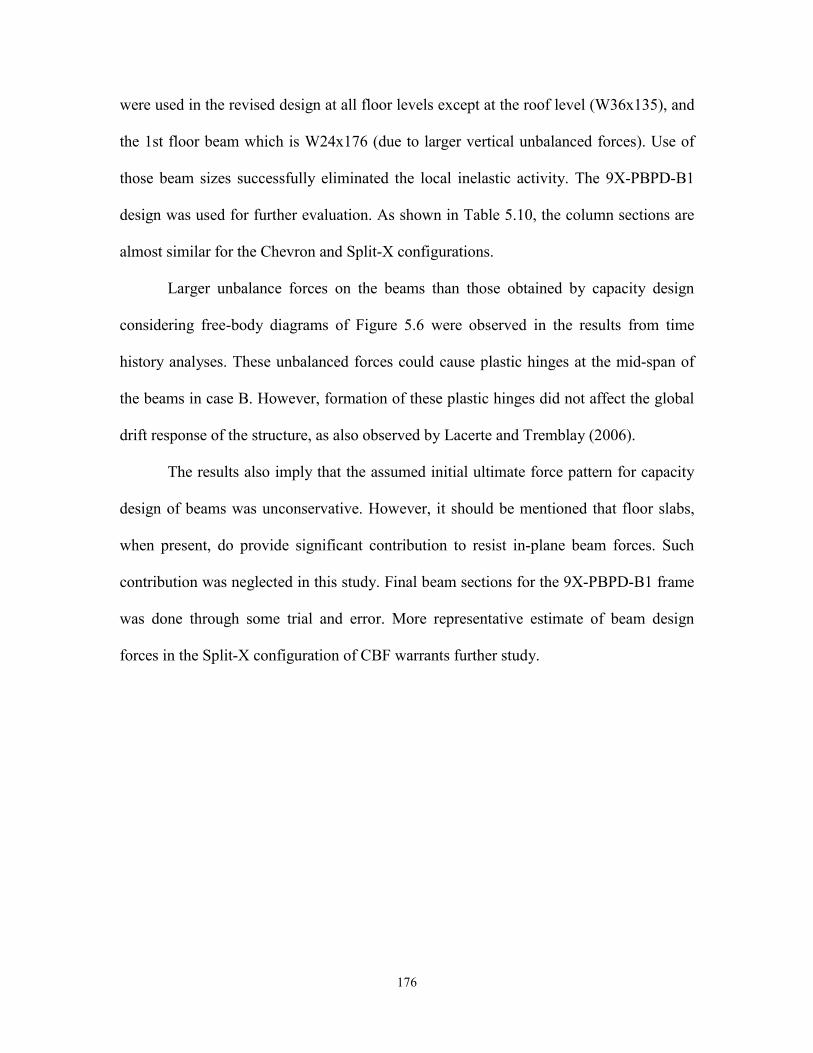
176
were used in the revised design at all floor levels except at the roof level (W36x135), and
the 1st floor beam which is W24x176 (due to larger vertical unbalanced forces). Use of
those beam sizes successfully eliminated the local inelastic activity. The 9X-PBPD-B1
design was used for further evaluation. As shown in Table 5.10, the column sections are
almost similar for the Chevron and Split-X configurations.
Larger unbalance forces on the beams than those obtained by capacity design
considering free-body diagrams of Figure 5.6 were observed in the results from time
history analyses. These unbalanced forces could cause plastic hinges at the mid-span of
the beams in case B. However, formation of these plastic hinges did not affect the global
drift response of the structure, as also observed by Lacerte and Tremblay (2006).
The results also imply that the assumed initial ultimate force pattern for capacity
design of beams was unconservative. However, it should be mentioned that floor slabs,
when present, do provide significant contribution to resist in-plane beam forces. Such
contribution was neglected in this study. Final beam sections for the 9X-PBPD-B1 frame
was done through some trial and error. More representative estimate of beam design
forces in the Split-X configuration of CBF warrants further study.

177
Table 5.8. Different Designs/Models used for 9-story PBPD CBF
9-Story CBF Designs
DBS Brace
Configuration Nf Notes
9V-PBPD-A* Based on λ-factor
in Chapter 3 Chevron regular
9V-PBPD-B Based on New λ-
factor Chevron regular
9V-PBPD-B-Nf Based on New λ-
factor Chevron increased
Same as 9V-PBPD-B, only with increased Nf
9X-PBPD-B Based on New λ-
factor Split-X regular
Small beam sizes, showed local instability
in beams (Table 5.9)
9X-PBPD-B1 Based on New λ-
factor Split-X regular
Modified: only beam sized increased to
W18x175 (Table 5.9)
9X-PBPD-B1-Nf Based on New λ-
factor Split-X increased
Same as 9V-PBPD-B, only with increased Nf
* Suffix A at the end of model designation indicates that design base shear is obtained by using the preliminary λ-factor in Chapter 3, whereas B indicates that the design base shear is obtained using new λ-factor suggested in Chapter 5.
Table 5.9. Beam Sections for Different Designs
Floor Level
Beam Sections
9V-PBPD-B 9X-PBPD-B 9X-PBPD-B1
Roof W36x135 W36x135 W36x135
8 W40x167 W18x65 W18x175
7 W40x199 W27x84 W18x175
6 W40x215 W18x65 W18x175
5 W40x215 W18x65 W18x175
4 W40x249 W18x65 W18x175
3 W40x249 W18x65 W18x175
2 W40x249 W18x65 W18x175
1 W40x324 W24x176 W24x176
178
Table 5.10. Column Sections for Different Designs
Story
Column Sections
9V-PBPD-B 9X-PBPD-B 9X-PBPD-B1
9 W14x109 W14x109 W14x109
8 W14x109 W14x109 W14x109
7 W14x109 W14x109 W14x109
6 W14x211 W14x211 W14x211
5 W14x211 W14x211 W14x211
4 W14x211 W14x398 W14x398
3 W14x398 W14x398 W14x398
2 W14x398 W14x398 W14x398
1 W14x398 W14x398 W14x398
Table 5.11. Different Fracture Life, Nf, Values Used
9-story CBF Model / Story 9V-PBPD-B 9X-PBPD-B1 (regular Nf)
9V-PBPD-B-Nf 9X-PBPD-B1-Nf
(increased Nf)
9 152 237
8 157 237
7 329 329
6 224 224
5 224 224
4 132 227
3 132 227
2 132 227
1 245 245

179
a) Beam, Case A b) Beam, Case B
(c)
Figure 5.6. Capacity Design of Beams and Column in Split-X Configuration: (a) Beam, Case A; (b) Beam, Case B; and (c) Column Tree.
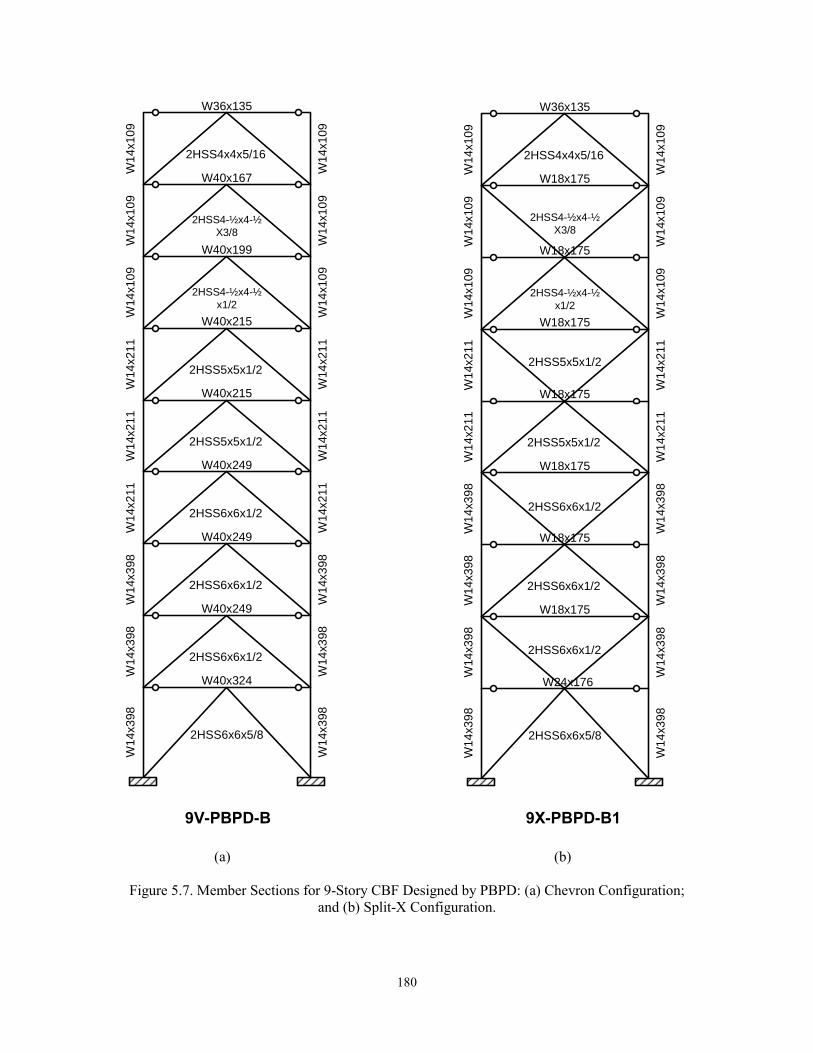
180
2HSS6x6x5/8
2HSS6x6x1/2
W1
4x3
98W
14
x398
W1
4x3
98W
14x
398
W40x324
W40x249
2HSS6x6x1/2
W1
4x3
98
W1
4x3
98
W40x249
2HSS6x6x1/2
W1
4x2
11
W1
4x2
11
W40x249
2HSS5x5x1/2
W1
4x21
1
W1
4x21
1
W40x215
2HSS5x5x1/2
W14
x21
1
W14
x21
1
W40x215
2HSS4-½x4-½x1/2
W14
x10
9
W14
x10
9
W40x199
W1
4x1
09
W1
4x1
09
W40x167
2HSS4x4x5/16
W1
4x1
09
W1
4x1
09
W36x135
2HSS4-½x4-½X3/8
2HSS6x6x5/8
2HSS6x6x1/2W
14
x39
8W
14x3
98
W14
x39
8W
14
x39
8
W24x176
W18x175
2HSS6x6x1/2
W1
4x3
98
W1
4x3
98
W18x175
2HSS6x6x1/2
W1
4x3
98
W1
4x3
98
W18x175
2HSS5x5x1/2
W1
4x2
11
W1
4x2
11
W18x175
2HSS5x5x1/2
W1
4x2
11
W1
4x2
11
W18x175
2HSS4-½x4-½x1/2
W1
4x1
09
W1
4x1
09
W18x175
W1
4x10
9
W1
4x10
9
W18x175
2HSS4x4x5/16
W14
x10
9
W14
x10
9
W36x135
2HSS4-½x4-½X3/8
9V-PBPD-B 9X-PBPD-B1
(a) (b)
Figure 5.7. Member Sections for 9-Story CBF Designed by PBPD: (a) Chevron Configuration; and (b) Split-X Configuration.

181
5.5 Evaluation of Seismic Performance
In this section, performance of the 9V-PBPD-B and 9X-PBPD-B1 frames
(designed by using the new λ-factor) under DBE and MCE level SAC LA ground
motions is evaluated. In addition, the confidence level of these frames are calculated and
compared with that of the previous design in Chapter 3.
SNAP-2DX software was used as was done in Chapter 3 and 4. The same
modeling assumptions used for 9V-PBPD-A were also made for these frames, which
include consideration of gravity and P-Delta column as well as beam-end releases and
eccentricities.
In the following Sections 5.5.1 the time-history response and maximum story
drifts of the new Chevron and Split-X braced frames are shown. The confidence levels
against collapse of these new frames are then evaluated by using the FEMA 351 (2000b)
procedure in Section 5.5.2.
To evaluate the effect of increasing the fracture life, Nf, on dynamic response as
well as confidence level, the Nf values for 9V-PBPD-B and 9X-PBPD-B1 were increased
to the levels greater than 200 for all brace sections. The corresponding models are called
9V-PBPD-B-Nf and 9X-PBPD-B1-Nf, respectively. The results with increased values of
Nf are discussed in Section 5.5.3.
182
5.5.1 Performance Comparison of 9V-PBPD-B and 9X-PBPD-B1 vs. 9V-PBPD-A
Maximum story drifts under SAC LA ground motions for the redesigned 9V-
PBPD-B and 9X-PBPD-B1 frames based on the new λ-factor are shown in Figures 5.8
and 5.9, respectively, for DBE and MCE ground motions.
The median drift values can also be seen in Figure 5.10. The median story drifts
under DBE level are close to each other for all three frames, with 9V-PBPD-B and 9X-
PBPD-B1 showing smaller drifts at upper levels. The median drifts fall well within the
target drift limit used in the design. The 9V-PBPD-B and 9X-PBPD-B1 frames show
smaller median drifts, especially at lower levels. This shows that the increase in design
base shear resulted in lower drift demands for these designs under MCE ground motions.
Also, 9X-PBPD-B1 frame shows somewhat more uniform distribution over the height.
The number of brace fractures were almost the same for all three models (9V-
PBPD-A, 9V-PBPD-B, and 9X-PBPD-B1) under both DBE and MCE ground motions.
However, models with increased Nf, 9V-PBPD-B-Nf and 9X-PBPD-B1-Nf, showed
much less and also delayed brace fractures compared to their corresponding models with
original Nf values. Therefore, the increase in design base shear did not have much effect
on brace fractures. Such fractures, however, could be prevented by using a minimum Nf
of 200 for taller CBF structures, instead of 100 as used earlier in Chapter 2.
The ground motions under which each design showed collapse are shown in Table
5.12. As can be seen, the Split-X configuration shows more stable behavior. In addition,
the 9V-PBPD-B model designed by using the new λ-factor shows somewhat more stable

183
response compared with 9V-PBPD-A frame designed in Chapter 3 based on original λ-
factor.
It can be seen that the collapse of 9V-PBPD-B was due to brace fracture since this
model did not show collapse when Nf was increased. However, under LA38, the increase
in Nf value did not affect the time at which the collapses occurred, indicating that the
collapses were not caused by brace fractures.
Figure 5.11 shows the 3rd story drift time-history response of 9V-PBPD-B frame
under LA28. Such response can be considered as the typical response of the 9-story
frames designed by PBPD under those ground motions that cause some brace fractures.
Due to near-field nature of the MC level SAC LA ground motions, most of the
earthquake energy is transferred to the frames through large velocity pulses in a rather
short time interval in the early stages of the record. Maximum story drifts of PBPD 9-
story frames occur mostly under such velocity pulses, except for 9V-PBPD-B model
under LA21 which showed collapse due to extensive brace fracture (Figure 5.12.a). Brace
fractures, which are due to low-cycle fatigue, occurred at later stages of the ground
motion. As a result, even for ground motions under which some brace fractures were
observed, the maximum story drifts under MCE ground motions had occurred before the
fracture of braces started.
Figure 5.12.a shows the exception to the trend mentioned above. In this case, the
peak story drift occurred at about 10 seconds past the start of the ground motion.
However, at about t = 45 seconds, the frame became unstable due to excessive brace
fractures and eventually collapsed after formation of soft stories.

184
Figure 5.12.b shows the 4th story drift versus time for the same frame as in 5.12.a,
but with increased Nf values in stories 2,3,4, and 5 (model 9V-PBPD-B-Nf). As can be
seen, this model survived under LA21 even though there were brace fractures. The
increase in Nf delayed fracture of braces 7 and 8 for about 7 seconds, which was enough
in this case for the structure to survive the earthquake.
Figure 5.12.c shows 4th story drift versus time response of the Split-X
configuration model 9X-PBPD-B1 (with original Nf values) under LA21. As shown, only
minor brace fractures occurred at the end of the ground motion.

185
Table 5.12. Collapse Cases under Time History Analyses
Model 9V-PBPD-A 9V-PBPD-B 9V-PBPD-B-Nf 9X-PBPD-B1 9X-PBPD-
B1-Nf
Ground Motions caused
Collapse
LA27 (t=46.8sec)
LA38
(t=12.7sec)
LA21 (t=51.3sec)
LA38
( t=36.7sec)
LA38 (t=36.7sec)
LA38 (t=50.2sec)
LA38 (t=50.2sec)

186
a) 9V-PBPD-B
b) 9X-PBPD-B1 Figure 5.8. Maximum Story Drifts under SAC DBE Ground Motions
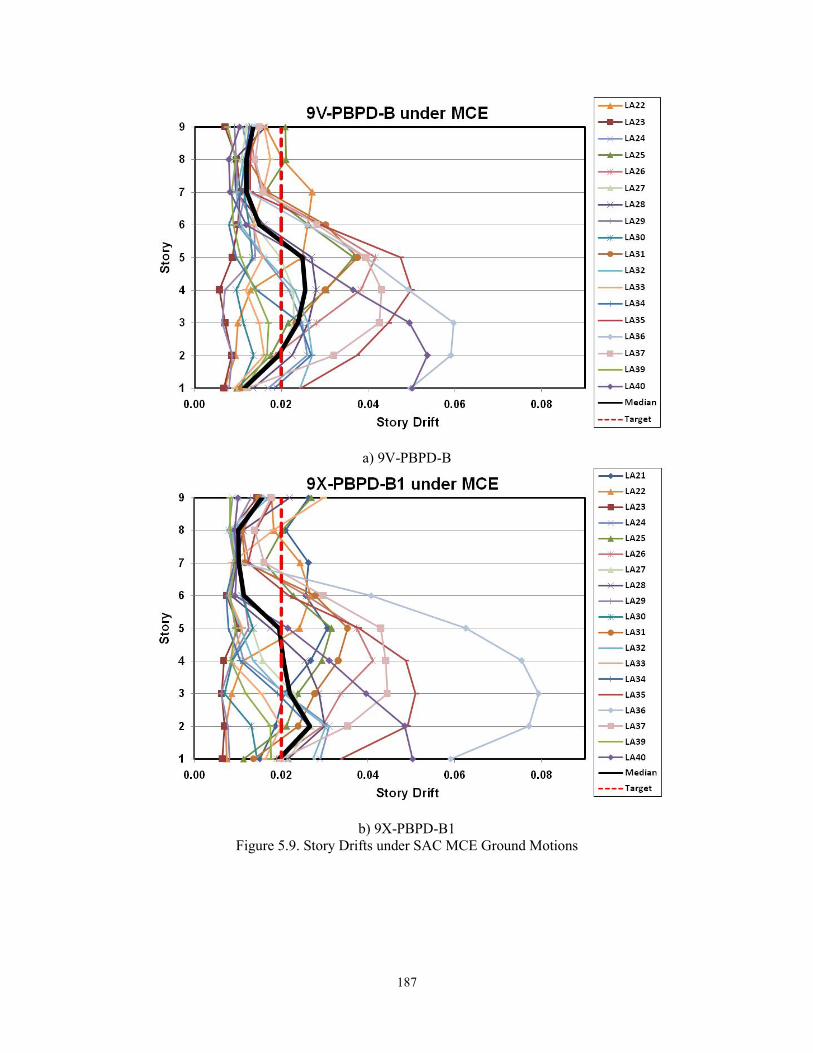
187
a) 9V-PBPD-B
b) 9X-PBPD-B1 Figure 5.9. Story Drifts under SAC MCE Ground Motions
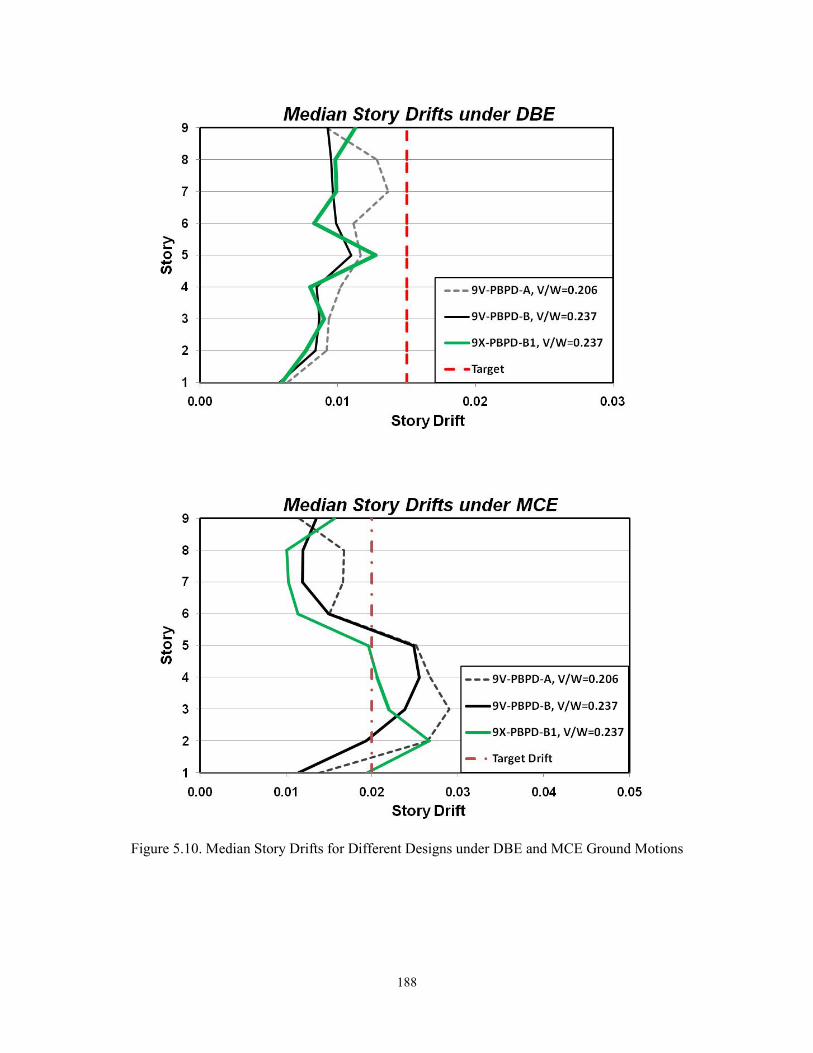
188
Figure 5.10. Median Story Drifts for Different Designs under DBE and MCE Ground Motions
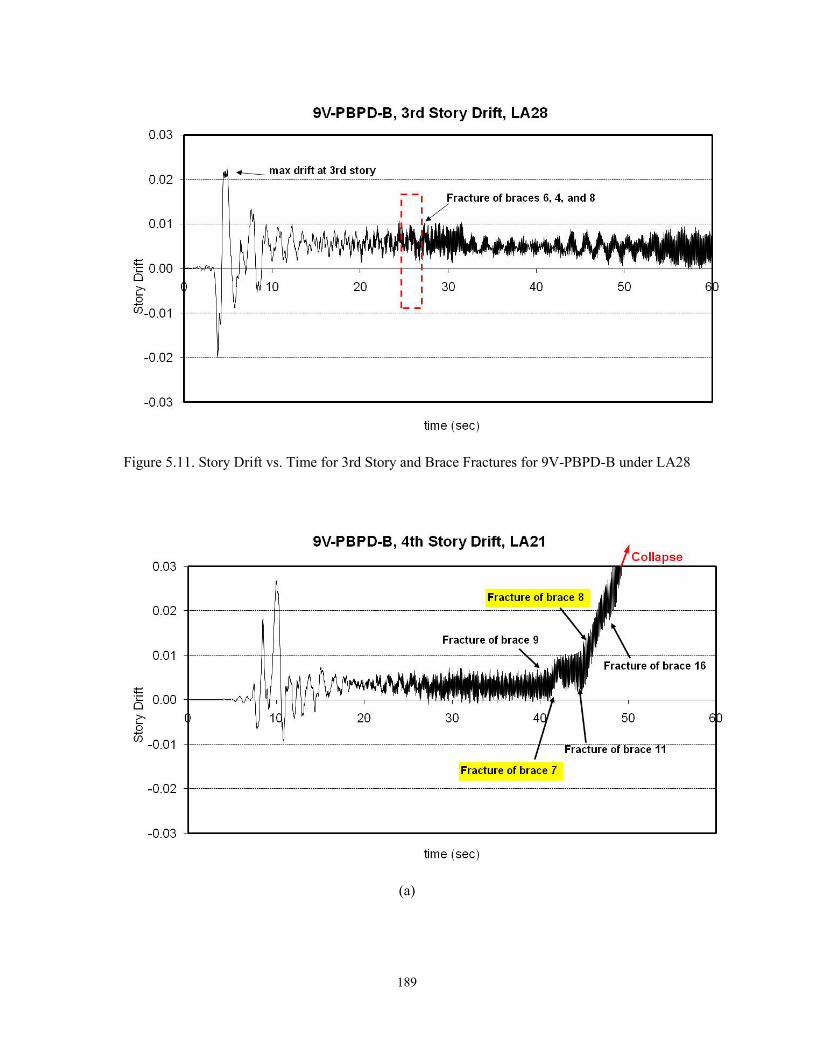
189
Figure 5.11. Story Drift vs. Time for 3rd Story and Brace Fractures for 9V-PBPD-B under LA28
(a)
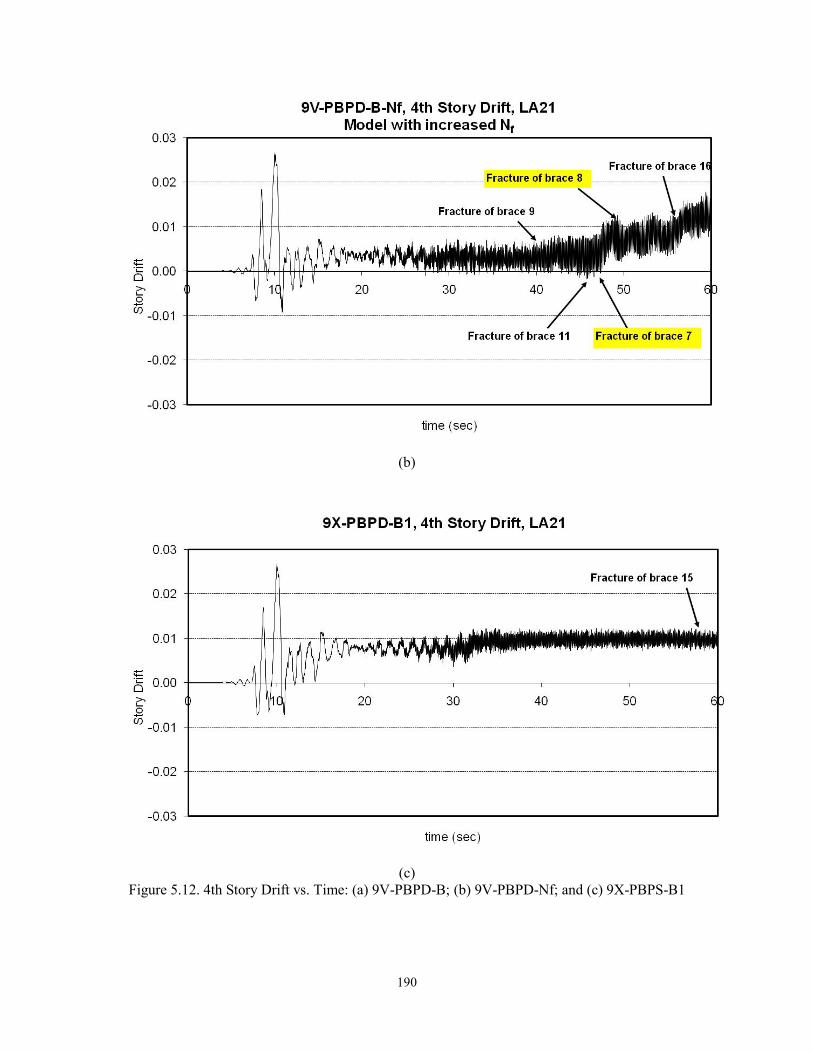
190
(b)
(c) Figure 5.12. 4th Story Drift vs. Time: (a) 9V-PBPD-B; (b) 9V-PBPD-Nf; and (c) 9X-PBPS-B1
191
5.5.2 Confidence Level Evaluation of 9V-PBPD-B and 9X-PBPD-B1 Frames
The confidence levels of the 9V-PBPD-B and 9X-PBPD-B1 frames were
evaluated by following the FEMA 351 (2000b) procedure as described in Chapter 4.
Tables 5.12 to 5.14 show the parameters used in confidence level evaluation. Figure 5.13
shows the IDA curves for these two designs under MCE set of SAC LA ground motions.
It can be seen from Table 5.14 that the new designed frames show improvement in
confidence level against collapse. The confidence level for 9V-PBPD-B came out to be
68.6% versus 52.1% of the original 9V-PBPD-A frame (Chapter 4). This 16.5% increase
in the confidence level comes mainly from the increase in the design base shear using
new λ-factor.
It can also be seen that the brace configuration has significant effect on the
confidence level. The 9X-PBPD-B1 frame has same brace sections as 9V-PBPD-B, but
only with different configuration. The confidence level of the Split-X frame is about 10%
better than the corresponding Chevron frame (77.4% versus 68.6%). This was mainly due
to smaller scatter in drift demand for the Split-X frame under MCE ground motions. It
should be noted that the beams sizes in the Split-X frame are considerably smaller
compared to those of Chevron frame, but still the Split-X design shows better confidence
level.

192
5.5.3 The Effect of Increasing Nf on the Confidence Level
It was seen that the brace fractures, e.g., under LA21 ground motion led to
instability or quite large story drifts. Thus far, main focus of the study presented in this
chapter was on evaluation of the effect of increasing the design base shear on the seismic
performance of the 9-story frames. In this section, an increased level of Nf for 9V-PBPD-
B and 9X-PBPD-B1 designs is considered in order to minimize the adverse effects of
lower Nf on the performance and confidence level of these frames. This can be achieved
by increasing Nf to values more than 200 (for braces with Nf smaller than 200) without
any change in other properties of the model. The increased values of Nf are shown in
Table 5.11 which shows increase in stories 2, 3, 4, 8, and 9. Such increases in fracture life
for hollow structural sections can be achieved by various methods as mentioned in
section C13.2d of AISC Seismic Provisions (AISC, 2005a). Filling with plain concrete
can be used as an effective way of reducing the severity of local buckling and delay
fractures hollow tubular braces (Liu and Goel, 1988; Lee and Goel, 1987). Goel and Lee
(1992) developed an empirical equation to estimate the effective width-to-thickness ratio
of concrete-filled HSS braces. As another method, longitudinal stiffeners such as rib
plates or small angle sections in a hat configuration can be used on tube walls (Liu and
Goel, 1987).
Therefore, the Nf values for braces in 9V-PBPD-B and 9X-PBPD-B1 frames were
increased to over 200 (stories 2, 3, 4, 8, 9). As shown in Table 5.8, these new models are
designated 9V-PBPD-B-Nf and 9X-PBPD-B1-Nf, respectively. The time-history
193
response as well as confidence level analysis were carried out for these frame models as
well.
The maximum story drifts for the models with increased Nf were found to be
essentially the same as the models with regular Nf, except for 9V-PBPD-B model under
LA21 ground motions. 9V-PBPD-B frame collapsed under LA21, but the increased Nf
model 9V-PBPD-B-Nf survived without collapse with about 3.4% maximum story drift.
For other ground motions, the maximum story drifts did not change with increase in Nf.
However, brace fractures were delayed by about 4 to 14 seconds (depending on ground
motion), and in some cases the fractures were totally eliminated in the increased Nf
models.
The values of confidence level are shown in Table 5.13 to 5.15. Also, Figure 5.15
shows the IDA curves for these two models under MCE set of SAC LA ground motions.
As can be seen, the increase in Nf value increases the confidence level of 9V-PBPD-B by
about 11% from 68.6% tp 79.4%. The main reason for this increase was that 9V-PBPD-
B-Nf model showed smaller scatter in drift demand compared to 9V-PBPD, even though
the two models had the same median drift demand. For the Split-X configuration, both
the drift demand and its scatter essentially remained unchanged with increase in Nf.
However, 9X-PBPD-B1-Nf model showed slightly larger drift capacity which resulted in
somewhat higher confidence level. As can be seen from Table 5.15, confidence level
increased 5.3% (from 77.4% to 82.7%) by increasing Nf to values more than 200 for the
Split-X configuration.

194
5.6 Summary and Conclusions
The main objective of the study presented in this chapter was to improve the
confidence level against collapse (C.L.) for the 9-story CBF against collapse. Several
modifications were suggested. The first modification was in the design base shear (DBS)
calculation. A slightly larger λ-factor was suggested for mid to high-rise CBF frames to
offset the detrimental effect of P-Delta overturning forces in the calculation of DBS.
The effect of using Split-X (two story X bracing) configuration on seismic
performance and C.L. of CBF was also studied. In addition, the effect of increasing brace
fracture life, Nf, on seismic performance and C.L. was evaluated.
The main conclusions from the results presented in this chapter are:
1- Higher values of design base shear (DBS) for 9-story (and taller) CBF were
obtained using the proposed new λ-factor in PBPD method. This new λ-factor results in
larger design base shear for mid to high-rise CBF structures.
2- The 9-story Chevron CBF design based on the new DBS showed smaller story
drifts under both DBE (10%/50 yrs) and MCE (2%/50 yrs) ground motions compared to
the 9V-PBPD-A frame designed in Chapter 3.
3- Higher levels of confidence level (C.L.) against collapse were obtained using
the new DBS for Chevron configuration. The C.L. of 52% obtained in Chapter 4 for 9V-
PBPD-A increased to 68.6% by using the new DBS in 9V-PBPD-B.
195
4- Improvement was seen in C.L. of the Chevron frame designed by using
increased Nf (of more than 200) for fracture life of the braces. This increase in Nf
resulted in increase of C.L. of the 9-stoy Chevron CBF from 68.6% to 79.4% (about
11%).
5- It was shown that C.L. of 9-story CBF improved by only changing the brace
configuration to Split-X. The C.L. increased from 68.6% to 77.4% (about 10%) by using
Split-X instead of Chevron configuration. The same brace sections were used. However,
much lighter beams are needed in the Split-X configuration. The C.L. obtained for the
Split-X design with original Nf values was almost equal to that of Chevron design with
increased Nf.
6- Increasing the design base shear did not have much effect on drift capacity of
the 9-story CBF frames obtained from IDA. However, larger design base shear resulted
in lower drift demands with reduced scatter under MCE ground motions which basically
translates into higher confidence level.
7- Increase in design base shear based on the new λ-factor was seen to be the main
factor in reducing the story drifts under MCE level ground motions. Better controlled
drift demand results in higher confidence level.
8- Increase in Nf value (brace fracture life factor) did not have significant effect
on drift response under MCE level SAC LA ground motions since the maximum story
drifts generally occur at the early stages for such near-field ground motions.
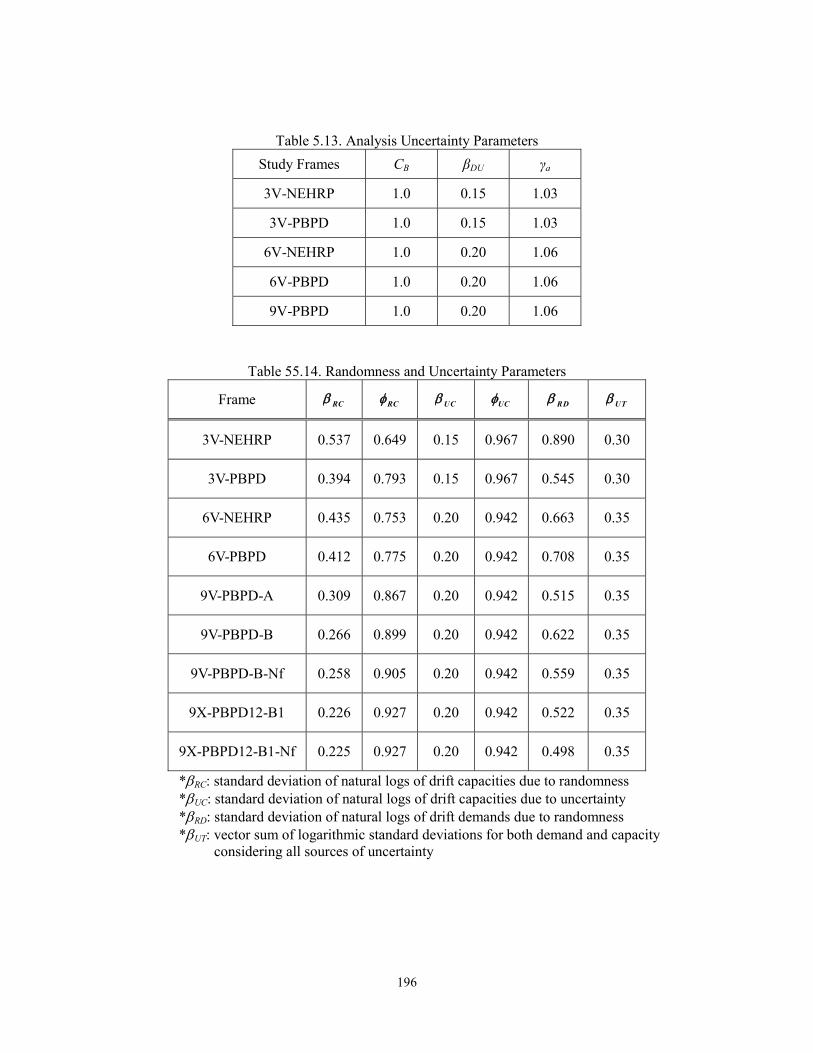
196
Table 5.13. Analysis Uncertainty Parameters
Study Frames CB βDU γa
3V-NEHRP 1.0 0.15 1.03
3V-PBPD 1.0 0.15 1.03
6V-NEHRP 1.0 0.20 1.06
6V-PBPD 1.0 0.20 1.06
9V-PBPD 1.0 0.20 1.06
Table 55.14. Randomness and Uncertainty Parameters
Frame RC RC UC UC RD UT
3V-NEHRP 0.537 0.649 0.15 0.967 0.890 0.30
3V-PBPD 0.394 0.793 0.15 0.967 0.545 0.30
6V-NEHRP 0.435 0.753 0.20 0.942 0.663 0.35
6V-PBPD 0.412 0.775 0.20 0.942 0.708 0.35
9V-PBPD-A 0.309 0.867 0.20 0.942 0.515 0.35
9V-PBPD-B 0.266 0.899 0.20 0.942 0.622 0.35
9V-PBPD-B-Nf 0.258 0.905 0.20 0.942 0.559 0.35
9X-PBPD12-B1 0.226 0.927 0.20 0.942 0.522 0.35
9X-PBPD12-B1-Nf 0.225 0.927 0.20 0.942 0.498 0.35
*RC: standard deviation of natural logs of drift capacities due to randomness *UC: standard deviation of natural logs of drift capacities due to uncertainty *RD: standard deviation of natural logs of drift demands due to randomness *UT: vector sum of logarithmic standard deviations for both demand and capacity
considering all sources of uncertainty

197
Table 5.15. Summary of Confidence Level Assessment for 3-Story, 6-Story, and 9-Story CBFs
Frame
Median Drift Capacity
(from IDA), C
Capacity factor,
Median Drift
Demand, D
Demand factors
Confidence Parameter
a D
C
Confidence Level (%)
γ* γa*
3V-NEHRP 0.064 0.628 0.068 3.37 1.06 6.04 << 1%
3V-PBPD 0.078 0.766 0.015 1.56 1.06 0.41 > 99.9%
6V-NEHRP 0.065 0.709 0.035 1.93 1.06 1.55 23.3%
6V-PBPD 0.100 0.730 0.027 2.12 1.06 0.82 86.2%
9V-PBPD-A 0.062 0.816 0.0376 1.49 1.06 1.180 52.1%
9V-PBPD-B 0.061 0.847 0.0276 1.79 1.06 1.015 68.6%
9V-PBPD-B-Nf 0.061 0.852 0.0276 1.60 1.06 0.902 79.4%
9X-PBPD-B1 0.0604 0.873 0.0305 1.51 1.06 0.924 77.4%
9X-PBPD-B1- Nf 0.0646 0.873 0.0305 1.51 1.06 0.832 82.7%
* : resistance factor that accounts for the randomness and uncertainty in estimation of structural capacity *γ: demand uncertainty factor; *γa: analysis uncertainty factor
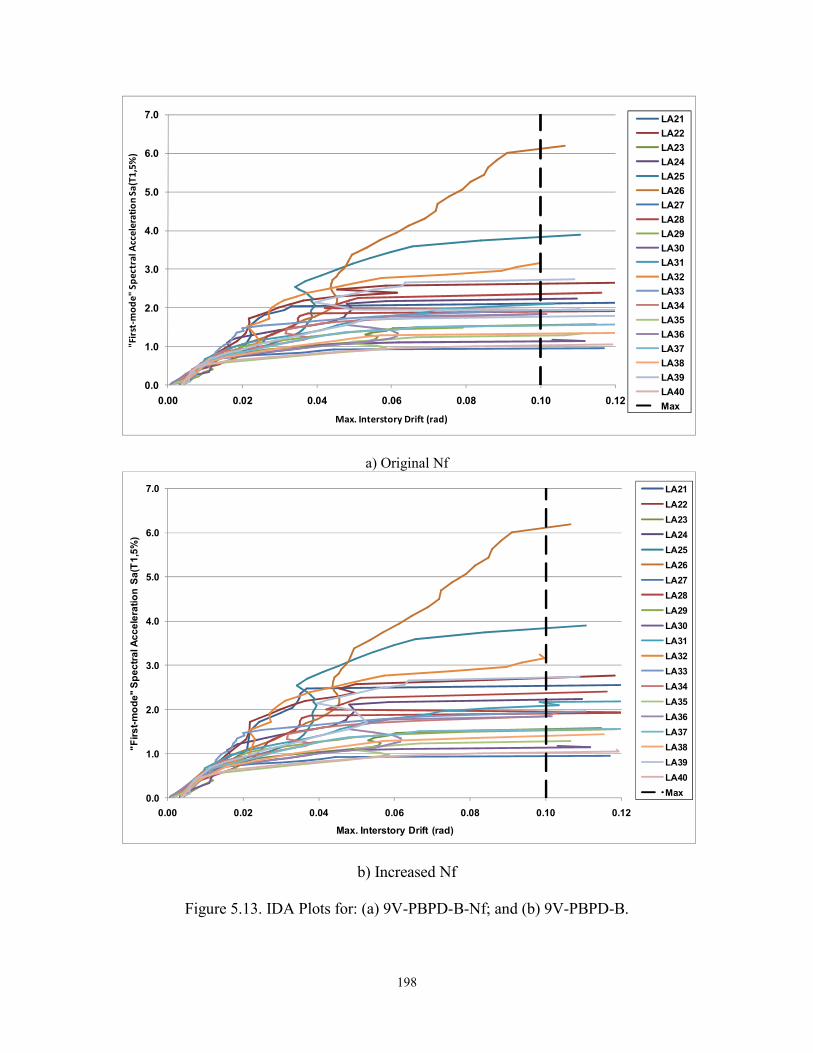
198
a) Original Nf
b) Increased Nf
Figure 5.13. IDA Plots for: (a) 9V-PBPD-B-Nf; and (b) 9V-PBPD-B.
0.0
1.0
2.0
3.0
4.0
5.0
6.0
7.0
0.00 0.02 0.04 0.06 0.08 0.10 0.12
"First‐m
ode" Spectral Acceleration Sa(T1,5%)
Max. Interstory Drift (rad)
LA21
LA22
LA23
LA24
LA25
LA26
LA27
LA28
LA29
LA30
LA31
LA32
LA33
LA34
LA35
LA36
LA37
LA38
LA39
LA40
Max
0.0
1.0
2.0
3.0
4.0
5.0
6.0
7.0
0.00 0.02 0.04 0.06 0.08 0.10 0.12
"Fir
st-
mo
de
" S
pe
ctr
al A
cc
ele
rati
on
Sa
(T1
,5%
)
Max. Interstory Drift (rad)
LA21
LA22
LA23
LA24
LA25
LA26
LA27
LA28
LA29
LA30
LA31
LA32
LA33
LA34
LA35
LA36
LA37
LA38
LA39
LA40
Max
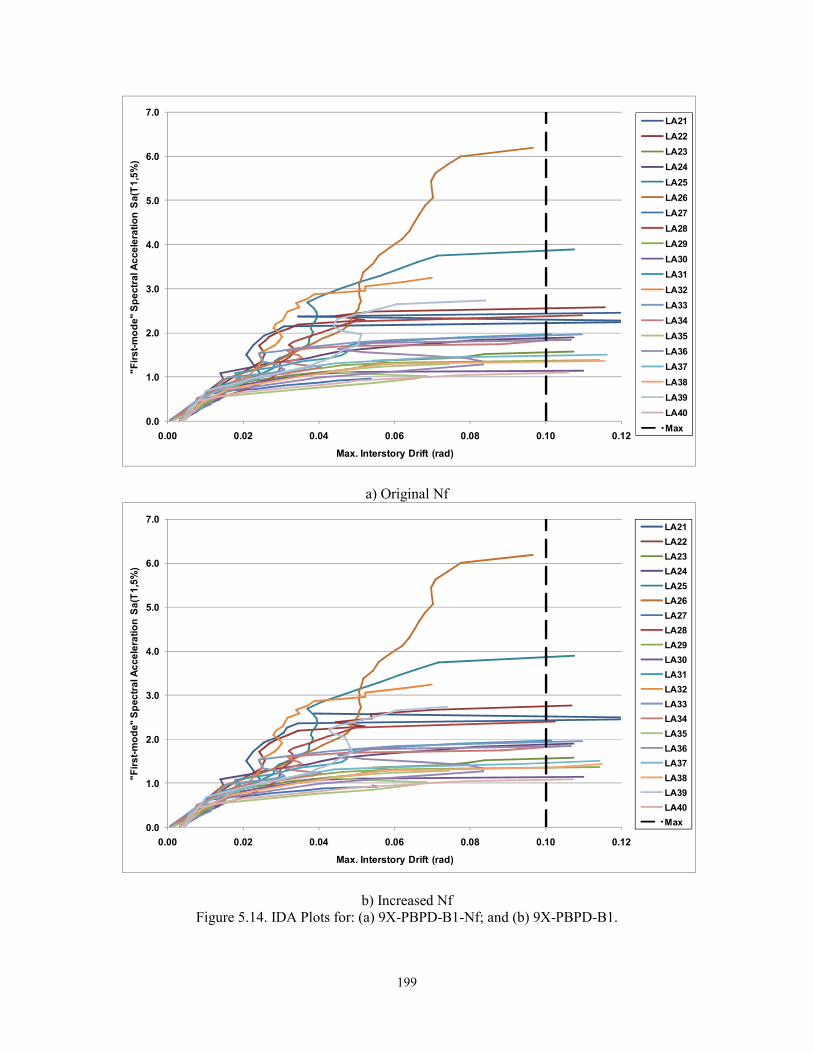
199
a) Original Nf
b) Increased Nf Figure 5.14. IDA Plots for: (a) 9X-PBPD-B1-Nf; and (b) 9X-PBPD-B1.
0.0
1.0
2.0
3.0
4.0
5.0
6.0
7.0
0.00 0.02 0.04 0.06 0.08 0.10 0.12
"Fir
st-
mo
de"
Sp
ect
ral A
cce
lera
tio
n S
a(T
1,5
%)
Max. Interstory Drift (rad)
LA21
LA22
LA23
LA24
LA25
LA26
LA27
LA28
LA29
LA30
LA31
LA32
LA33
LA34
LA35
LA36
LA37
LA38
LA39
LA40
Max
0.0
1.0
2.0
3.0
4.0
5.0
6.0
7.0
0.00 0.02 0.04 0.06 0.08 0.10 0.12
"Fir
st-m
od
e" S
pec
tra
l Ac
cele
rati
on
Sa
(T1
,5%
)
Max. Interstory Drift (rad)
LA21
LA22
LA23
LA24
LA25
LA26
LA27
LA28
LA29
LA30
LA31
LA32
LA33
LA34
LA35
LA36
LA37
LA38
LA39
LA40
Max

200

201
CHAPTER 6
Summary and Conclusions
6.1 Summary
Application of the PBPD method to seismic design of CBF is presented in this
report. The PBPD method directly accounts for inelastic behavior by using pre-selected
target drift and yield mechanism as key performance limit states. As a result, control of
drift and yielding is built into the design process from the very start, eliminating or
minimizing the need for lengthy iterations to arrive at the final design.
The overall PBPD procedure for design of CBF was presented in Chapter 2. One
procedure developed earlier to calculate the PBPD design base shear by using the concept
of energy modification factor, η, was discussed. In addition, several related design
recommendations were proposed in order to improve the seismic performance of CBF
systems and to avoid undesirable failure modes. Those recommendations include: Use of
beam shear splices to minimum moment transfer into the columns; using double HSS
sections for braces instead of single HSS, and direct consideration of the fracture criterion
along with strength and compactness criteria for the design of braces. Two CBF systems,
3 and 6-story frames previously designed based on 1997 NEHRP, were redesigned using
the PBPD procedure. The redesigned frames showed dramatic improvement in their
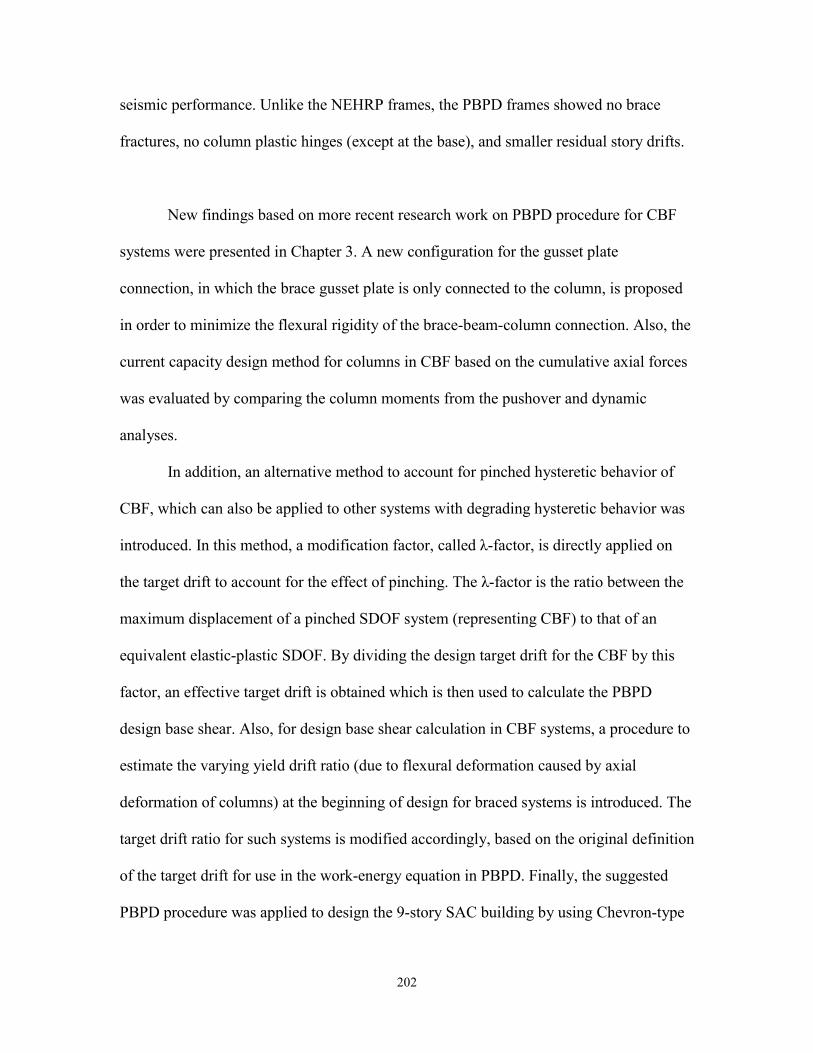
202
seismic performance. Unlike the NEHRP frames, the PBPD frames showed no brace
fractures, no column plastic hinges (except at the base), and smaller residual story drifts.
New findings based on more recent research work on PBPD procedure for CBF
systems were presented in Chapter 3. A new configuration for the gusset plate
connection, in which the brace gusset plate is only connected to the column, is proposed
in order to minimize the flexural rigidity of the brace-beam-column connection. Also, the
current capacity design method for columns in CBF based on the cumulative axial forces
was evaluated by comparing the column moments from the pushover and dynamic
analyses.
In addition, an alternative method to account for pinched hysteretic behavior of
CBF, which can also be applied to other systems with degrading hysteretic behavior was
introduced. In this method, a modification factor, called λ-factor, is directly applied on
the target drift to account for the effect of pinching. The λ-factor is the ratio between the
maximum displacement of a pinched SDOF system (representing CBF) to that of an
equivalent elastic-plastic SDOF. By dividing the design target drift for the CBF by this
factor, an effective target drift is obtained which is then used to calculate the PBPD
design base shear. Also, for design base shear calculation in CBF systems, a procedure to
estimate the varying yield drift ratio (due to flexural deformation caused by axial
deformation of columns) at the beginning of design for braced systems is introduced. The
target drift ratio for such systems is modified accordingly, based on the original definition
of the target drift for use in the work-energy equation in PBPD. Finally, the suggested
PBPD procedure was applied to design the 9-story SAC building by using Chevron-type
203
CBF as the lateral force resisting system. The performance of this design was then
evaluated using both DBE and MCE level SAC LA ground motions.
In Chapter 4, the reliability-based performance evaluation (confidence level
analysis) was carried out for the study CBF structures, the NEHRP designs (Sabelli,
2000) and the PBPD designs. The NEHRP frames were shown to have very low
confidence levels against collapse by Uriz and Mahin (2004). For reference, a summary
of the reliability-based performance evaluation procedure developed as part of the
FEMA/SAC Steel Project (FEMA, 2000) was also presented.
The main objective of the study presented in Chapter 5 was to improve the
confidence level against collapse (C.L.) for the 9-story CBF against collapse. Several
modifications were suggested. The first modification was in the design base shear (DBS)
calculation. A slightly larger λ-factor was suggested for mid to high-rise CBF frames to
offset the detrimental effect of P-Delta overturning forces in the calculation of DBS.
The effect of using Split-X (two story X bracing) configuration on seismic
performance and C.L. of CBF was also studied. In addition, the effect of increasing brace
fracture life, Nf, on seismic performance and C.L. was evaluated.
6.2 Major Conclusions and Findings
Based on the study presented in this report, following conclusions can be drawn:
204
1. The basic PBPD method has been successfully adapted for CBF systems by
making appropriate modifications.
2. The seismic performance and confidence level against collapse under severe
ground motions can be dramatically enhanced by using the PBPD procedure as
developed herein.
3. Results from nonlinear time-history analyses carried out on example frames
designed by PBPD method showed the frames met all desired performance
objectives, including the intended yield mechanism and story drifts, while
preventing brace fractures and undesirable column yielding under varied hazard
levels.
4. Application of the PBPD method for taller CBF systems was achieved by using
the proposed modifications in PBPD design base shear calculation as
demonstrated in Chapter 3. The proposed modifications included, accounting for
pinched hysteretic behavior, varying yield drift and selection of proper target
drift.
5. It was shown in Chapter 3 that the dual hazard level design based on appropriate
target drift for each hazard level can be easily and reliably implemented in the
PBPD procedure to obtain the desired performance at different hazard levels for
CBF systems.
Other major findings from the study presented in Chapter 3 are:
a) Although there is some eccentricity in the proposed connection Type II of gusset
plate to column, the total unbalanced moments transferred to the columns are

205
smaller as compared with those in the connection Type I where beam shear splice
is used. This is due to the fact that the shear connection in this configuration is
much closer to the column centerline. Also, the moments produced by the axial
force in the brace and those produced by the shear force in the beam act in
opposite directions. Since the columns in CBF are generally designed for axial
force only, having less moment demand on columns would ensure better
performance.
b) Even with considering only axial forces in column design in CBF, good
performance can still be expected for the PBPD frame. The main reason is that
although moments were not considered in columns during the design, maximum
moments and maximum axial forces in the columns generally do not occur at the
same time. Also, the axial force used in column design is based on the assumption
that all braces buckle and yield at the same time, which is quite conservative. A
practical implication is that since there would be some bending moments in the
columns it is better to use somewhat deeper sections whenever possible in order
to have some reserve bending capacity.
c) A new approach (λ-factor method) was used to account for the pinched hysteretic
behavior of CBF systems in PBPD procedure. The method can be easily applied
to other degrading systems as well. This method gave reasonable design base
shear values for low-rise as well as high-rise CBF structures. The proposed
modifications on yield drift and target drift should also be included in the
modified procedure.

206
d) The proposed modifications were applied in the design of the 9-story SAC LA
frame with CBF as the lateral system. The results from nonlinear static and time-
history analyses showed excellent performance of the designed structure under
both DBE and MCE hazard levels, proving that the dual level design concept
worked well.
Following conclusions are drawn from the study presented in Chapter 4:
a) Reliability-based performance evaluation by using the FEMA 351 procedure,
which accounts for randomness and uncertainty in the estimation of seismic drift
demand and capacity, showed that CBF designed by the proposed Performance-
Based Plastic Design (PBPD) method can have dramatically higher confidence
levels against global collapse than those of SCBF designed by current practice.
Also, those confidence levels can be similar to the target levels for SMF in current
practice, i.e., 90% or above.
b) Dramatic improvement in the confidence level was seen for the 3V-PBPD frame,
comparable with those of MF designed by 1997 NEHRP code (Yun et al., 2002).
On the other hand, the 3V-NEHRP frame showed extremely low confidence level
against global collapse (less than 1%). It was also be seen that although the
median drift capacities for the two 3-story frames were somewhat close, they
showed quite different drift demands under 2/50 ground motions.
c) The confidence level for 6V-NEHRP frame was somewhat better than that of the
3V-NEHRP frame, but was still much less than the 90% satisfactory level as
suggested by FEMA 351. Large difference was still observed in the confidence
207
levels of 6V-NEHRP and 6V-PBPD frames, with the latter having a confidence
level quite close to 90%.
Following conclusions are drawn from the study presented in Chapter 5:
a) Higher values of design base shear (DBS) for 9-story (and taller) CBF were
obtained using the proposed new λ-factor in PBPD method. This new λ-factor
results in larger design base shear for mid to high-rise CBF structures.
b) The 9-story Chevron CBF design based on the new DBS showed smaller story
drifts under both DBE (10%/50 yrs) and MCE (2%/50 yrs) ground motions
compared to the 9V-PBPD-A frame designed in Chapter 3.
c) Higher levels of confidence level (C.L.) against collapse were obtained using the
new DBS for Chevron configuration. The C.L. of 52% obtained in Chapter 4 for
9V-PBPD-A increased to 68.6% by using the new DBS in 9V-PBPD-B.
d) Improvement was seen in C.L. of the Chevron frame designed by using increased
Nf (of more than 200) for fracture life of the braces. This increase in Nf resulted
in increase of C.L. of the 9-stoy Chevron CBF from 68.6% to 79.4% (about 11%).
e) It was shown that C.L. of 9-story CBF improved by only changing the brace
configuration to Split-X. The C.L. increased from 68.6% to 77.4% (about 10%)
by using Split-X instead of Chevron configuration. The same brace sections were
used. However, much lighter beams are needed in the Split-X configuration. The
C.L. obtained for the Split-X design with original Nf values was almost equal to
that of Chevron design with increased Nf.
208
f) Increasing the design base shear did not have much effect on drift capacity of the
9-story CBF frames obtained from IDA. However, larger design base shear
resulted in lower drift demands with reduced scatter under MCE ground motions
which basically translates into higher confidence level.
g) Increase in design base shear based on the new λ-factor was seen to be the main
factor in reducing the story drifts under MCE level ground motions. Better
controlled drift demand results in higher confidence level.
h) Increase in Nf value (brace fracture life factor) did not have significant effect on
drift response under MCE level SAC LA ground motions since the maximum
story drifts generally occur at the early stages for such near-field ground motions.
209
REFERENCES
AISC. (1997), Seismic Provisions for Structural Steel Buildings, American Institute of Steel Construction, Chicago, Illinois.
AISC. (2005a), ANSI/AISC 341-05, Seismic Provisions for Structural Steel Buildings, American Institute of Steel Construction, Chicago, Illinois.
AISC. (2005b), ANSI/AISC 360-05, Specification for Structural Steel Buildings, AmericanInstitute of Steel Construction, Chicago, Illinois.
ASCE. (2000), “Prestandard and Commentary for the Seismic Rehabilitation of Buildings,” FEMA 356 Report, prepared by the American Society of Civil Engineers, published by Federal Emergency Management Agency, Washington, D. C.
ASCE. (2005), Minimum Design Loads for Buildings and Other Structures, SEI/ASCE 7-05, American Society of Civil Engineers, Reston, VA.
Astaneh-Asl, A. (1998), "Seismic Design And Behavior of Gusset Plates." Structural Steel And Education Council (Steel Tips), 209 Vernal Drive, Alamo, California 94507.
Astaneh-Asl, A., Goel, S., and Hanson, R. D. (1985), "Cyclic out-of-plane buckling of double-angle bracing." ASCE Journal of Structural Engineering, 111(5), 1135- 1153.
Bayat, M.R., Chao, S-H., and Goel, S.C. (2010), “Further Development of Performance-Based Plastic Design Method for Concentrically Braced Frame.” 9th US National and 10th Canadian Conference on Earthquake Engineering, July 2010, Toronto, Canada.
Bayat, M.R. (2010), “Performance-Based Plastic Design of Earthquake Resistant Steel Structures: Concentrically Braced Frames, Tall Moment Frames, and Plate Shear Wall Frames” Ph.D. Dissertation, University of Texas at Arlington.
Calvi, G. M., Priestley, M. J. N., Sullivan, T. J., and Happold, B. (2006), “Development of Displacement-Based Design and Assessment Methods; Progress Review: Year 1.” Presentation, European Centre for Training and Research in Earthquake Engineering (EUCENTRE), Nov 2006. (url: http://www.reluis.it).
Chao, S.-H., and Goel, S. C. (2005), “Performance-Based Seismic Design of EBF Using Target Drift and Yield Mechanism as Performance Criteria,” Report No. UMCEE 05-05, Department of Civil and Environmental Engineering, University of Michigan, Ann Arbor, MI.
210
Chao, S-H., and Goel, S. C., (2006a), “Performance-Based Plastic Design of Seismic Resistant Special Truss Moment Frames (STMF).” Report No. UMCEE 06-03, Department of Civil and Environmental Engineering, University of Michigan, Ann Arbor, MI.
Chao, S-H., and Goel, S. C., (2006b). “A seismic design method for steel concentric braced frames for enhanced performance.” 4th International Conference on Earthquake Engineering, Taipei, Taiwan.
Chao, S.-H., and Goel, S.C., Lee, S.-S., (2007), “A Seismic design lateral force distribution based on inelastic state of structures.” Earthquake Spectra 23 (3), 547-569.
Chao, S.-H., Bayat, M. R., and Goel, S.C., (2008), “Performance-Based Plastic Design of steel concentric braced frames for enhanced confidence level.” 14th World Conference on Earthquake Engineering, Beijing, China.
Federal Emergency Management Agency, FEMA (2000a), FEMA 356, Prestandard and Commentary for the Seismic Rehabilitation of Buildings, Washington, D. C.
Federal Emergency Management Agency, FEMA (2000b), FEMA 351, Recommended Seismic Evaluation and Upgrade Criteria for Existing Welded Steel Moment Frame Buildings, , Federal Emergency Management Agency, Washington, D. C.
Federal Emergency Management Agency, FEMA (2004), FEMA 440, Improvement of Inelastic Seismic Analysis Procedures, Federal Emergency Management Agency, Washington, D. C.
Federal Emergency Management Agency, FEMA (2009), FEMA P695, Recommended Methodology for Quantification of Building System Performance and Response Parameters, prepared for the Federal Emergency Management Agency, prepared by the Applied Technology Council, Redwood City, CA
Foutch, D. and Shi, S. (1998), “Effects of Hysteresis Type on the Seismic Response of Buildings.” Proceedings of the 6th US National Conference on Earthquake Engineering.
Goel, S. C. (1992a), “Earthquake Resistant Design of Ductile Braced Steel Structures,” Stability and Ductility of Steel Structures under Cyclic Loading, CRC Press, Boca Raton, FL., pp.
297-308. Goel, S.C., (1992b). “Earthquake Resisitant Design of Ductile Braced Steel Structures.” In
Stability and Ductility of Steel Structures under Cyclic Loading. Ed. Y. Fukumoto and G. C. Lee. Boca Raton, FL: CRC Press: 297-308.
Goel, S.C., and Lee, S. (1992), “A Fracture Criterion for Concrete-Filled Tubular Bracing Members Under Cyclic Loading.” Proceedings of the 1992 ASCE Structures Congress, ASCE, pp. 922-925, Reston, VA.
Goel, S.C. and Chao, S-H., 2008. Performance-Based Plastic Design: Earthquake Resistant Steel Structures, International Code Council.
Gupta, A. and Krawinkler, H. (1999). “Seismic Demands for Performance Evaluation Steel Moment Resisting Frame Structures.” Report No. 132, The John A. Blume Earthquake Engineering Center, Dept. of Civil and Env Eng., Stanford University.

211
Gupta, B and Kunnath, S.K. (1998), “Effects of Hysteresis Model Parameters on Inelastic Seismic Demands.” Proceedings of the 6th US National Conference on Earthquake Engineering.
Hassan, O. F., and Goel, S. C. (1991). "Modeling of Bracing Members and Seismic Concentrically Braced Frames." UMCE 91-1, University of Michigan, College of Engineering, Ann Arbor, MI 48109-2125.
Lacerte, M., Tremblay, R. (2006), “Making Use of Brace Overstrength to Improve the Seismic Response of Multistory Split-X Concentrically Braced Steel Frames.”, Canadian Journal of Civil Engineering, 33 (8), 1005-1021.
Lee, S-S, and Goel, S. C. (1987), “Seismic Behavior of Hollow and Concrete-Filled Square Tubular Bracing Members,” Report No. UMCE 87-11, Department of Civil and Environmental Engineering, University of Michigan, Ann Arbor, MI.
Lee, H.-S, and Goel, S. C. (1990), “Seismic Behavior of Steel Built-Up Box-Shaped Bracing Members and Their Use in Strengthening Reinforced Concrete Frames,” Report No. UMCE 90-7, Department of Civil and Environmental Engineering, University of Michigan, Ann Arbor, MI.
Lee, S.-S. and Goel, S.C. (2001). “Performance-Based Design of Steel Moment Frames Using Target Drift and Yield Mechanism”, Report No. UMCEE 01-17, Dept. of Civil and Environmental Engrg, University of Michigan, Ann Arbor, MI.
Leelataviwat, S.(1998), “Drift and Yield Mechanism Based Seismic Design and Upgrading od Steel Moment Frames”, PhD Dissertation, University of Michigan, Ann Arbor, MI.
Liu, Z. and Goel, S.C. (1987), “Investigation of Concrete Filled Steel Tubes under Cyclic Bending and Buckling.” Report No. UMCEE 87-03, Department of Civil and Environmental Engineering, University of Michigan, Ann Arbor, MI.
Liu, Z. and Goel, S.C. (1988), “Cyclic Load Behavior of Concrete-Filled Tubular Braces,” Journal of the Structural Division, ASCE, Vol. 114, No. 7, Reston, VA.
MacRae, G.A., Kimura, Y., Roeder, C. ( 2004), “Effect of Column Stiffness on Braced Frame
Seismic Behavior.” Journal pf Structural Engineering, 130(3), 381-391.
Medina, R. A. and Krawinkler, H. (2004). "Influence of Hysteretic Behavior on the Nonlinear Response of Frame Structures", Proceedings of the 13th World Conference on Earthquake Engineering, 13WCEE, Vancouver, B.C., Canada, Paper # 239, August 1-6.
NCREE website, National Center for Research on Earthquake Engineering, Taipei, Taiwan, url: http://w3.ncree.org/
NEHRP (National Earthquake Hazards Reduction Program). (1997). FEMA 302: Recommended Provisions for Seismic Regulations for New Buildings and Other Structures. Washington, D.C., Federal Emergency Management Agency.
Rai, D.C., Goel, S. C. and Firmansjah, J. (1996). “SNAP-2DX: General Purpose Computer Program for Static and Dynamic Nonlinear Analysis of Two Dimensional Structures.” Report No. UMCEE 96-21, Dept of Civil and Environmental Engrg, University of Michigan, Ann Arbor, MI.
212
Rahnama, M., and Krawinkler, H. (1993), “Effects of soft soil and hysteresis model on seismic demands”, Report No. 108, John A. Blume Earthquake Engineering Center Department of Civil and Environmental Engineering, Stanford University, Stanford, California.
Redwood, R. G., and Channagiri, V. S. (1991), “Earthquake Resistant Design of Concentrically Braced Steel Frames,” Canadian Journal of Civil Engineering, Vol. 18, pp. 839-850.
Richards, P. 2008. Seismic column demands in ductile frames. Journal of Structural Engineering, 135 (1), 33-41.
Ruiz-Garcia, J., Miranda, E. (2005), “Performance-based assessment of existing structures accounting for residual displacements”, Report TR-153, The John A. Blume Earthquake Engineering Center, Stanford University, Stanford, CA.
Sabelli, R., 2000. “Research on Improving the Design and Analysis of Earthquake Resistant Steel Braced Frames”, FEMA/EERI Report, Washington, D. C.
Sabelli, R., Mahin, S., and Chang, C. (2003), “Seismic Demands on Steel Braced Frame Buildings with Buckling-Restrained Braces,” Engineering Structures, Vol. 25, pp. 655-666.
Sabelli, R., and Bruneau, M. 2007. Steel Plate Shear Walls (AISC design guide # 20), American Institute of Steel Construction, Chicago.
Shaback, B., and Brown, T. (2003),” Behaviour of Square Hollow Structural Steel Braces with End Connections under Reversed Cyclic Axial Loading,” Canadian Journal of Civil Engineering, Vol. 30, pp. 745-753.
Somerville, P.G., Smith, M., Punyamurthula, S. and Sun, J. (1997). “Development of Ground Motion Time Histories for Phase 2 of the FEMA/SAC Steel Project”, Report No. SAC/BD-97/04, SAC Joint Venture, Sacramento, CA.
Tang, X., and Goel, S. C. (1987), “Seismic Analysis and Design Considerations of Braced Steel Structures,” Report No. UMCEE 87-04, Department of Civil and Environmental Engineering, University of Michigan, Ann Arbor, MI
Tang, X., and Goel, S. (1989). "Brace Fractures and Analysis of Phase I Structure."ASCE Journal of Structural Engineering, 115(8), 1960-1976.
Tremblay, R., Bruneau, M., Nakashima, M., Prion, H. G. L., Filiatrault, A., and Devall, R. (1996), “Seismic Design of Steel Buildings: Lessons from the 1995 Hyogo-Ken Nanbu Earthquake,” Canadian Journal of Civil Engineering, Vol. 23, pp. 727-756.
Tremblay, R. and Robert, N. (2000), “Seismic Design of Low- and Medium-Rise Chevron Braced Steel Frame.” Canadian Journal of Civil Engineering, 27(6), 338-360.
Uriz, P., Mahin, S.A. (2004). “Seismic Performance Assessment of Concentrically Braced Frames”. Paper No. 1639, 13th World Conference on Earthquake Engineering, Vancouver, B. C., Canada.
Uriz, P. (2005). “Towards Earthquake Resistant Design of Concentrically Braced Steel Structures”, Ph.D. Thesis, University of California, Berkeley.

213
Vamvatsikos, D. and Cornell, C.A. (2002), “Incremental Dynamic Analysis.” Earthquake Engineering and Structural Dynamics, 31, 491-514.
Yun, S.-Y., Hamburger, R.O., Cornell, C.A. and Foutch, D.A. (2002), “Seismic Performance Evaluation for Steel Moment Frames.” Journal of Structural Engineering, 128: 4, 534-545.