Embed Size (px)
Citation preview

Penthiopyrad
1365
PENTHIOPYRAD (253)
The first draft was prepared by Mr Christian Sieke, Federal Institute for Risk Assessment, Berlin, Germany
EXPLANATION
Penthiopyrad is a carboxamide fungicide used to control a broad spectrum of diseases on large variety of crops. Penthiopyrad inhibits fungal respiration by binding to mitochondrial respiratory complex II. It was considered for the first time by the 2011 JMPR for toxicology, establishing an acceptable daily intake (ADI) of 0–0.1 mg/kg bw and an acute reference dose (ARfD) of 1 mg/kg bw.
IDENTITY
ISO common name Penthiopyrad
Chemical name
IUPAC (RS)-N-[2-(1,3-dimethylbutyl)-3-thienyl]-1-methyl-3-(trifluoromethyl) pyrazole-4-carboxamide
CA N-[2-(1,3-dimethylbutyl)-3-thienyl]-1-methyl-3-(trifluoromethyl)-1H-pyrazole-4-carboxamide (9CI)
CIPAC No. not attributed
CAS No. 183675-82-3
Structural formula
Molecular formula C16H20F3N3OS
Molecular mass 359.4 g/mol
Specifications
Specifications for penthiopyrad were not yet developed by FAO.
SNHN
N
OCF3

Penthiopyrad
1366
PHYSICAL AND CHEMICAL PROPERTIES
Table 1 Physical and chemical properties
Property Results Method (test material)
Reference
Melting point 381.9 K (= 108.7 °C) OECD 102 (EEC A.1) pure active ingredient (99.9%)
Tognucci A, 1999, PTHIO_001
Boiling point No boiling before decomposition observed OECD 103 pure active ingredient (99.9%)
Tognucci A, 1999, PTHIO_002
Temperature of decomposition or sublimation
> 250 °C colour change > 314 °C degradation clearly observable
OECD 103 pure active ingredient (99.9%)
Tognucci A, 1999, PTHIO_002
Relative density 1.256 g per cm3 OECD 109 (EEC A.3) pure active ingredient. (99.9%)
Badt-Tognucci, A, 2007, PTHIO_003
Vapour pressure Penthiopyrad 3.7 × 10⁻³ Pa at 70 °C 8.04 × 10⁻³ Pa at 80 °C 3.61 × 10⁻² Pa at 90 °C 6.43 × 10⁻⁶ kPa at 25 °C (calculated)
OECD 104 pure active ingredient (99.9%)
Tognucci, A, 1999, PTHIO_004
DM-PCA ≤ 6.8 × 10⁻⁵ Pa at 80 °C
OECD 104 pure ingredient (99.7%)
Matsumoto, T, 2006, PTHIO_005
PCA 1.6 × 10⁻³ Pa at 50 °C 1.6 × 10⁻² Pa at 60 °C 5.5 × 10⁻² Pa at 70 °C 8.9 × 10⁻⁶ Pa at 25 °C (calculated)
OECD 104 pure ingredient (99.7%)
Weissenfeld M, 2008, PTHIO_006
Henry´s Law Coefficient
at pH 4: 4.152 × 10⁻⁴ Pa m3 mol-1 at 25 °C at pH 5: 1.40 × 10⁻⁴ Pa m3 mol-1 at 25 °C at pH 7: 7.66 × 10⁻³ Pa m3 mol-1 at 25 °C at pH 10: 6.36 × 10⁻³ Pa m3 mol-1 at 25 °C
OECD 105 Pure active ingredient (99.8%)
Labano S, 2009, PTHIO_007
Physical state Pure: solid (powder) visual pure active ingredient (99.8%)
Tomiya K, 2008, PTHIO_008
Techn.: solid (powder) visual technical active ingredient (98.6%)
Tomiya K, 2008, PTHIO_009
Colour Pure: white visual pure active ingredient (99.8%)
Tomiya K, 2008, PTHIO_010
Techn.: white visual technical active ingredient (98.6%)
Tomiya K, 2008, PTHIO_011
Odour Pure: odourless olfactoric pure active ingredient (99.8%)
Tomiya K, 2008, PTHIO_012
Techn.: odourless olfactoric technical active ingredient (986%)
Tomiya K, 2008, PTHIO_013

Penthiopyrad
1367
Property Results Method (test material)
Reference
Spectra active substance
UV absorption: characteristics at 20 °C: acidic solution (pH 0.8) λmax = 226 nm, ε= 14460 L.mol-1.cm-1. neutral solution (pH 7.4) λmax = 226 nm, ε= 14492 L.mol-1.cm-1. basic solution (pH 13.1) apparent λmax = 227 nm but artefact caused by the absorption of solvent, ε: n.a.
OECD 101 pure active ingredient (99.8%)
Badt-Tognucci, A, 2007, PTHIO_014
Solubility in water including effect of pH
Penthiopyrad At 20 °C: at pH 4: 2.535 mg/L at pH 7: 1.375 mg/L at pH 10: 1.657 mg/L At 30 °C: at pH 7: 1.426 mg/L At 20 °C: at pH 5: 7.53 × 10 mg/L
OECD 105 pure active ingredient (99.6%), batch no. 2000111 batch no. OS-770
Franke J, 2008, PTHIO_015 Tognucci A, 1999, PTHIO_016
DM-PCA At 30 °C: At pH 7: 8240 mg/L
Flask method Pure ingredient (99.7%)
Matsumoto, T, 2006, PTHIO_017
PCA At 20 °C: In HCl (1N): 1438.7 mg/L In NaOH (1N): 171.8 g/kg
OECD 105 Pure ingredient (99.1%)
Weissenfeld M, 2008, PTHIO_018
Solubility in organic solvents
At 20 ± 0.5 °C: Methanol: 402 g/L Ethanol: 234.5 g/L Acetone: 557 g/L Ethylacetate: 349 g/L Hexane: 0.75 g/L Heptane: 0.74 g/L Xylene: 42.7 g/L Toluene: 67.0 g/L Dichloromethane: 531 g/L
OECD 105 pure active ingredient (99.8%)
Tognucci A, 1999, PTHIO_016
Partition coefficient n-octanol / water
Penthiopyrad log Pow: 4.36 at 20 °C and pH 4 log Pow: 4.62 at 20 °C and pH 7 log Pow: 4.43 at 30 °C and pH 7 log Pow: 4.54 at 20 °C and pH 10
OECD 107 pure active ingredient (98.6%)
Franke J, 2008, PTHIO_019
DM-PCA log Pow: 1.42 at 25 °C and pH 2
OECD 107 pure ingredient (99.7%)
Matsumoto, T, 2006, PTHIO_020
PCA log Pow: 0.9 at 25 °C and pH 2
OECD 107 pure ingredient (99.9%)
Furutani, E, 2006, PTHIO_021
PAM log Pow: < 0.5 at 25 °C and pH 7
OECD 107 pure ingredient (99.9%)
Furutani, E, 2006, PTHIO_022
753-A-OH log Pow: 2.4 at 25 °C and pH 7
OECD 107 pure ingredient (98.6%)
Furutani, E, 2006, PTHIO_023
Hydrolysis rate Hydrolytically stable during 5 days at pH 4, 7 and 9 at 50 °C.
OECD 111 pure active ingredient (99.9%)
Tognucci A, 1999, PTHIO_024

Penthiopyrad
1368
Property Results Method (test material)
Reference
Photochemical degradation
Photolytically stable during 15 days at 25 °C and pH 7. OECD 101 radiolabelled pure active ingredient (99.9%)
Burgener A, 1999, PTHIO_025
Quantum yield Not applicable Dissociation constant
pKa = 10.0 ± 0.16 OECD 112 Pure active ingredient (99.9%)
Tognucci, A, 1999, PTHIO_026
Hydrolysis of penthiopyrad
Hydrolysis studies were carries out by Adam, D (2006, PTHIO_027). A mixture of 14C-penthiopyrad (mixture of two radiolabels 14C-pyrazole and 14C-thienyl) was investigated in aqueous buffer solutions at three pH values and at different temperatures to simulate processing practice. The solutions were incubated at pH 4, 5 and 6 at temperatures of 90, 100 and 120 °C, respectively, for 20 or 60 minutes.
The solutions were analysed by HPLC and TLC before and after incubation. The nature of degradates by means of high performance liquid chromatography (HPLC) and thin layer chromatography (TLC).
A summary of the results is presented in the following table:
Table 2 Summary of radioactive residues in reaction mixtures treated with a mixture of 14C-pyrazole and 14C-thienyl labelled penthiopyrad
T (°C) Duration (min)
pH Replicate Before incubation % of nominal
After incubation % of nominal
90 20 4 A B Mean
100 101 100
103 100 102
100 60 5 A B Mean
101 99 100
101 103 102
120 20 6 A B Mean
100 100 100
99 100 100
Formulations
Penthiopyrad is registered as SC, WG and EC formulations in Canada and the USA on a large variety of crops including pome fruit, various vegetables, cereals, oilseeds and pulses. The active substance is applied late in the growing season normally with PHIs of 30 days or less.
METABOLISM AND ENVIROMENTAL FATE
Metabolism studies were conducted using [14C-pyrazole]-penthiopyrad (P-label) and [14C-thienyl]-penthiopyrad (T-label). The position of the label for both substances is presented in the following figure:

Penthiopyrad
1369
Chemical names, structures and code names of metabolites and degradation products of penthiopyrad are shown below.
Table 3 Known metabolites of penthiopyrad
Code Names MCAG DuPont
Chemical Abstracts Name (IUPAC Name)
Structure Where found
Penthiopyrad MTF-753 DPX-LEM17
(RS)-N-[2-(1,3-dimethylbutyl)-3-thienyl]-1-methyl-3-(trifluoromethyl) pyrazole-4-carboxamide CAS No.: 183675-82-3 Formula: C16H20F3N3OS M.W.: 359.42
Parent molecule.
753-T-DO IN-PGH58
N-[5-hydroxy-5-(1,3-dimethylbutyl)-2-oxo-2,5-dihydrothiophen-4-yl]-1-methyl-3-trifluoromethyl-1H-pyrazole-4-carboxamide CAS No.: n.a. Formula: C16H20F3N3O3S M.W.: 391.41
E-fate: soil, aquatic aerobic. Metabolism: plant, rat, goat, hen.
753-F-DO IN-PGH59
N-[5-hydroxy-5-(1,3-dimethylbutyl)-2-oxo-2,5-dihydrofuran-4-yl]-1-methyl-3-trifluoromethyl-1H-pyrazole-4-carboxamide CAS No.: n.a. Formula: C16H20F3N3O4 M.W.: 375.34
E-fate: soil, soil photolysis, aquatic aerobic. Metabolism: plant, rat, goat, hen.
753-A-OH IN-PGH53
N-[2-(3-hydroxy-1,3-dimethyl-butyl) thiophen-3-yl]-1-methyl-3-trifluoromethyl-1H-pyrazole-4-carboxamide CAS No.: n.a. Formula: C16H20F3N3O2S M.W.: 375.42
E-fate: soil, aquatic aerobic. Metabolism: plant, rat, goat, hen.
753-A-OH isomer (M12)
N-[2-(1-hydroxymethyl-1,3-dimethylbutyl)thiophen-3-yl]-1-methyl-3-trifluoromethyl-1H-pyrazole-4-carboxamide CAS No.: n.a. Formula: C16H20F3N3O2S M.W.: 375.41
E-fate: soil.
S
NHN
N
OCF3
NN
SNH
OCF3
O
OH
NN
ONH
OCF3
O
OH
S
NHN
N
OCF3
OH
S
NHN
N
OCF3
OH
SS
NNHHNN
NN
OOCCFF33
** ppoossiittiioonn ooff llaabbeell
**
Figure 1 [14C-pyrazole]-penthiopyrad (P-label)
Figure 2 [14
C-thienyl]-penthiopyrad (T-label)
S
NHN
N
OCF3
* position of label
*

Penthiopyrad
1370
Code Names MCAG DuPont
Chemical Abstracts Name (IUPAC Name)
Structure Where found
dehydro-753-A-OH
N-[2-(1,3-dimethyl-butenyl)thiophen-3-yl]-1-methyl-3-trifluoromethyl-1H-pyrazole-4-carboxamide CAS No.: n.a. Formula: C16H18F3N3OS M.W.: 357.39
Note: the position of the double bond on the alkyl-chain is not definite.
Metabolism: rat.
hydroxy-MTF-753 (753-A-OH isomer)
N-[2-(3,4-dihydroxy-1,3-dimethylbutyl)thiophen-3-yl]-1-methyl-3-trifluoromethyl-1H-pyrazole-4-carboxamide CAS No.: n.a. Formula: C16H20F3N3O3S M.W.: 375.41
Metabolism: rat, goat and hen.
dihydroxy-MTF-753
CAS No.: n.a. Formula: C16H20F3N3O3S M.W.: 391.41
Metabolism: hen.
DM-753 IN-PGH60
N-[2-(1,3-dimethylbutyl)thiophen-3-yl]-3-trifluoromethyl-1H-pyrazole-4-carboxamide CAS No.: n.a. Formula: C15H18F3N3OS M.W.: 345.39
Metabolism: plant, rat, goat.
DM-753-A-OH
N-[2-(3-hydroxy-1,3-dimethylbutyl) thiophen-3-yl]-3-trifluoromethyl-1H-pyrazole-4-carboxamide CAS No.: n.a. Formula: C15H18F3N3O2S M.W.: 361.39
Metabolism: plant, rat.
753-A-COOH 2-methyl-4-{3-[(1-methyl-3-trifluoromethyl-1H-pyrazole-4-carbonyl)amino]thiophen-2-yl}pentanoic acid CAS No.: n.a. Formula: C16H18F3N3O3S M.W.: 389.40
Metabolism: rat.
753-A-COOH isomer (M11)
3-methyl-1-{3-[(1-methyl-3-trifluoromethyl-1H-pyrazole-4-carbonyl)amino]thiophen-2-yl}pentanoic acid CAS No.: n.a. Formula: C16H18F3N3O3S M.W.: 389.40
E-fate: soil, soil photolysis.
DM-753-A-COOH
2-methyl-4-{3-[(3-trifluoromethyl-1H-pyrazole-4-carbonyl)amino]thiophen-2-yl}pentanoic acid CAS No.: n.a. Formula: C15H16F3N3O3S
Metabolism: rat.
S
NHN
N
OCF3
S
NHN
N
OCF3
OH
S
NHN
N
OCF3
dihydroxy
S
NHN
NH
OCF3
S
NHN
NH
OCF3
OH
S
NHN
N
OCF3
OH
O
S
NHN
N
OCF3
OH
O
S
NHN
NH
OCF3
OH
O

Penthiopyrad
1371
Code Names MCAG DuPont
Chemical Abstracts Name (IUPAC Name)
Structure Where found
M.W.: 375.37
PAM IN-PGH45
1-methyl-3-trifluoromethyl-1H-pyrazole-4-carboxamide CAS No.: n.a. Formula: C6H6F3N3O M.W.: 193.13
E-fate: soil, soil photolysis, aquatic aerobic. Metabolism: plant, rat, goat, hen.
DM-PAM IN-PGH32
3-trifluoromethyl-1H-pyrazole-4-carboxamide CAS No.: n.a. Formula: C5H4F3N3O M.W.: 179.10
Metabolism: plant, rat, goat, hen.
PCA IN-MR507
1-methyl-3-trifluoromethyl-1H-pyrazole-4-carboxylic acid CAS No.: 113100-53-1 Formula: C6H5F3N2O2 M.W.: 194.11
E-fate: soil, soil photolysis, aquatic aerobic. Metabolism: plant, rat, goat, hen.
DM-PCA IN-DRJ75
3-trifluoromethyl-1H-pyrazole-4- carboxylic acid CAS No.: 543739-84-0 Formula: C5H3F3N2O2 M.W.: 180.08
E-fate: soil, aquatic aerobic. Metabolism: plant, rat, goat.
PDA 2,4-pentadienoic acid CAS No.: n.a. Formula: C5H6O2 M.W.: 98.10
Metabolism: rat.
hydroxy-MTF-753- glucuronide
CAS No.: n.a. Formula: C22H28F3N3O6S M.W.: 551.53
Metabolism: rat.
hydroxy-DM-MTF-753 glucuronide
CAS No.: n.a. Formula: C23H26F3N3O8S M.W.: 537.51
Metabolism: rat.
NN
NH2
OCF3
NNH
NH2
OCF3
NN
OH
OCF3
NNH
OH
OCF3
OH
O
S
NN
O
NH
F3C
O
OHOH
O OH
O
HO
S
NNH
O
NH
F3C
O
OHOH
O OH
O
HO

Penthiopyrad
1372
Code Names MCAG DuPont
Chemical Abstracts Name (IUPAC Name)
Structure Where found
hydroxy-DM-MTF-753-glucoside
CAS No.: n.a. Formula: C21H28F3N3O7S M.W.: 523.52
Metabolism: plant.
hydroxy-MTF-753-malonyl-glucoside
CAS No.: n.a. Formula: C25H32F3N3O19S M.W.: 623.607
Metabolism: plant.
hydroxy-DM-MTF-753-malonyl-glucoside
CAS No.: n.a. Formula: C24H30F3N3O10S M.W.: 609.580
Metabolism: plant.
cys-T-DO CAS No.: n.a. Formula: C19H26F3N4O5S2 M.W.: 511.57
Metabolism: goat and hen.
hydroxy-cys-T-DO
CAS No.: n.a. Formula: C19H27F3N4O6S2 M.W.: 528.57
Metabolism: rat.
dihydroxy-cys-T-DO
CAS No.: n.a. Formula: C19H27F3N4O7S2 M.W.: 544.57
Metabolism: goat and hen.
S
NNH
O
NH
F3C
O
OHOH
O OH
HO
S
NN
O
NH
F3C
O
OHOH
O O
HO
OH
O O
S
NNH
O
NH
F3C
O
OHOH
O O
HO
OH
O O
NN
SNH
OCF3
O
OH
Cys
NN
SNH
OCF3
O
OH
Cys
OH
NN
SNH
OCF3
O
OH
Cys
dihydroxy

Penthiopyrad
1373
Code Names MCAG DuPont
Chemical Abstracts Name (IUPAC Name)
Structure Where found
GSH-T-DO CAS No.: n.a. Formula: C26H37F3N6O9S2 M.W.: 698.73
Metabolism: rat.
N-acetyl-cys-T-DO
CAS No.: n.a. Formula: C21H29F3N4O6S2 M.W.: 554.60
Metabolism: rat.
cys-F-DO CAS No.: n.a. Formula: C19H27F3N4O6S M.W.: 496.50
Metabolism: rat, goat and hen.
dehydro-cys-F-DO
CAS No.: n.a. Formula: C19H25F3N4O5S M.W.: 478.49
Note: the position of the double bond on the alkyl-chain is not definite.
Metabolism: rat, goat and hen.
hydroxy-cys-F-DO
CAS No.: n.a. Formula: C19H27F3N4O7S M.W.: 512.50
Metabolism: rat, goat and hen.
dihydroxy-cys-F-DO
CAS No.: n.a. Formula: C19H27F3N4O8S M.W.: 528.50
Metabolism: goat and hen.
S
NN
O
NH
F3C
O
OH
S
HN
NH
O
O
O OH
HH2N
OHO
S
NN
O
NH
F3C
OS
HNOH
O
OH
O
NN
ONH
OCF3
O
OH
Cys
NN
ONH
OCF3
OCys
NN
ONH
OCF3
O
OH
Cys
OH
NN
ONH
OCF3
O
OH
Cys
dihydroxy

Penthiopyrad
1374
Code Names MCAG DuPont
Chemical Abstracts Name (IUPAC Name)
Structure Where found
DM-cys-F-DO
CAS No.: n.a. Formula: C18H25F3N4O6S M.W.: 482.47
Metabolism: rat.
hydroxy-DM-cys-F-DO
CAS No.: n.a. Formula: C18H25F3N4O7S M.W.: 498.47
Metabolism: rat.
GSH-F-DO
CAS No.: n.a. Formula: C26H37F3N6O10S M.W.: 682.67
Metabolism: rat.
dehydro-GSH-F-DO
CAS No.: n.a. Formula: C26H35F3N6O9S M.W.: 664.66
Note: the position of the double bond on the alkyl-chain is not definitive.
Metabolism: rat.
hydroxy-GSH-F-DO
CAS No.: n.a. Formula: C26H37F3N6O11S M.W.: 698.67
Metabolism: rat.
NNH
ONH
OCF3
O
OH
Cys
NNH
ONH
OCF3
O
OH
Cys
OH
O
NN
O
NH
F3C
O
OH
S
HN
NH
O
O
O OH
HH2N
OHO
O
NN
O
NH
F3C
OS
HN
NH
O
O
O OH
HH2N
OHO
O
NN
O
NH
F3C
O
OH
S
HN
NH
O
O
O OH
HH2N
OHO
OH

Penthiopyrad
1375
Code Names MCAG DuPont
Chemical Abstracts Name (IUPAC Name)
Structure Where found
dihydroxy-GSH-F-DO
CAS No.: n.a. Formula: C26H37F3N6O12S M.W.: 714.67
Metabolism: rat.
DM-hydroxy-GSH-F-DO
CAS No.: n.a. Formula: C25H35F3N6O11S M.W.: 684.64
Metabolism: rat.
cys-gly-F-DO
CAS No.: n.a. Formula: C21H30F3N5O7S M.W.: 553.55
Metabolism: rat.
cys-glu-F-DO CAS No.: n.a. Formula: C24H34F3N5O9S M.W.: 625.63
Metabolism: rat.
hydroxy-cys-glu-F-DO
CAS No.: n.a. Formula: C24H34F3N5O10S M.W.: 641.61
Metabolism: rat.
O
NN
O
NH
F3C
O
OH
S
HN
NH
O
O
O OH
HH2N
OHO
dihydroxy
O
NNH
O
NH
F3C
O
OH
S
HN
NH
O
O
O OH
HH2N
OHO
OH
O
NN
O
NH
F3C
O
OH
S
H2NNH
O
H
OHO
O
NN
O
NH
F3C
O
OH
S
HN
OH
O
O
H2N
OHO
O
NN
O
NH
F3C
O
OH
S
HN
OH
O
O
H2N
OHO
OH

Penthiopyrad
1376
Code Names MCAG DuPont
Chemical Abstracts Name (IUPAC Name)
Structure Where found
N-acetyl-cys-F-DO
CAS No.: n.a. Formula: C21H29F3N4O7S M.W.: 538.54
Metabolism: rat.
dehydro-gly-N-acetyl-cys-F-DO
CAS No.: n.a. Formula: C23H30F3N5O7S M.W.: 577.57
Note: the position of the double bond on the alkyl-chain is not definitive.
Metabolism: rat.
hydroxy-N-acetyl-cys-F-DO
CAS No.: n.a. Formula: C21H29F3N4O8S M.W.: 554.54
Metabolism: rat.
dehydro-cys-gly-F-DO
CAS No.: n.a. Formula: C21H28F3N5O6S M.W.: 535.54
Note: the position of the double bond on the alkyl-chain is not definitive.
Metabolism: rat.
Animal metabolism
The Meeting received metabolism studies on laboratory animals, poultry and lactating goats using the P- and the T-label of penthiopyrad.
The metabolism of penthiopyrad in livestock animals was extensive, leaving numerous single metabolites present at levels below 10% of the TRR. In most cases radioactivity could not be attributed to specific reference compounds since individual levels were below the limit required for identification.
O
NN
O
NH
F3C
OS
HNOH
O
OH
O
O
NN
O
NH
F3C
OS
HNNH
O
H
OHOO
O
NN
O
NH
F3C
OS
HNOH
O
OH
O
OH
O
NN
O
NH
F3C
OS
H2NNH
OO OH
H

Penthiopyrad
1377
Identified metabolites were normally PAM and PCA or 753-F-DO and 753-A-OH; the latter mostly conjugated with cysteine and/or hydroxylated. Parent penthiopyrad was found in few matrices and only being present at very low amounts far below 10% of the TRR.
In general the metabolic pathway of penthiopyrad was comparable between ruminants and hens, although the amount of unchanged penthiopyrad was slightly higher in poultry.
Laboratory animals
In the 2011 JMPR Report the following conclusions were drawn by WHO for the metabolism of penthiopyrad in rats:
The absorption, distribution, metabolism and excretion of penthiopyrad were investigated in rats. 14C-labelled penthiopyrad was rapidly and extensively absorbed from the gastrointestinal tract of rats following oral dosing. The extent of absorption was approximately 80–90% of the administered dose, independent of dose and sex. Very little penthiopyrad was retained in the tissues. Faecal excretion was the primary route of elimination, and excretion was rapid, with the majority excreted by all routes 24 hours after dosing (74.8–85.0%).
Extensive metabolism occurred at numerous positions within the molecule, including thienyl ring oxidation and conjugation with glutathione, thienyl ring opening, N-demethylation and alkyl side-chain hydroxylation, followed by oxidation to carboxylic acids and glucuronidation. The most abundant metabolite in both urine and faeces was formed as the result of N-demethylation and oxidation of the methyl moiety of the alkyl side-chain. The most abundant metabolites found in bile were formed as a result of thienyl ring oxidation to 753-F-DO, followed by its conjugation with glutathione and the catabolism of this product. Other significant metabolites in bile were glucuronic acid conjugates of the intermediate demethylated and hydroxylated metabolites. Four metabolites containing the pyrazole moiety following cleavage from the thienyl moiety were excreted in both urine and faeces. The two acids, 1-methyl-3-trifluoromethyl-1H-pyrazole-4-carboxylic acid (PCA) and 3-trifluoromethyl-1H-pyrazole-4-carboxylic acid (DM-PCA), are likely formed by amide hydrolysis from 1-methyl-3-trifluoromethyl-1H-pyrazole-4-carboxamide (PAM) and DM-PAM. PAM and subsequent metabolites account for less than 1% of the administered dose. The thienyl ring appears to be completely degraded.
Lactating goats
In a study by Burri, R, (2009, PTHIO_028) [pyrazole-14C]-penthiopyrad or [thienyl-14C]-penthiopyrad was administered orally to two lactating goats at rates equivalent to 20 ppm diet in two daily doses for seven consecutive days. The concentration profiles of radioactivity in milk, blood and plasma as well as the excretion patterns via urine and faeces were followed. The goats were sacrificed at approximately 6 hours after the last (14th) administration and liver, kidney, muscle, fat, blood and bile were collected. The effective doses based on the actual amount of consumed diet were 21.8 ppm diet for the P-label and 14.6 ppm diet for the T-label.
Analysis of the total radioactive residues (TRR) was carried out using liquid scintillation counting (LSC).
Milk was separated by centrifugation into skim milk and milk fat and analysed by HPLC and TLC.
Liver, kidney and muscle were extracted on three times with acetonitrile and twice with acetonitrile/purified water (4+1, v/v). Because still significant amounts remained after extraction, a pronase incubation and a Soxhlet extraction at elevated temperature in methanol were performed, followed by hydrolysis of the pellet in 2N HCl. After partitioning against hexane and dichloromethane (liver, kidney) or ethyl acetate (muscle), the organic extracts were analysed by HPLC/TLC.
Fat was pooled and extracted three times with dichloromethane. The dichloromethane extracts were pooled and radioassayed. The sample was additionally extracted twice with methanol followed by a Soxhlet extraction in methanol.

Penthiopyrad
1378
The total radioactive residues (TRR) found in milk and tissues, are summarized in Table 4 and Table 5.
Table 4 TRR in milk of lactating goats - recovery of administered doses of [14C]penthiopyrad
Time period after first admin. (hours) P-label mg eq/kg
T-label mg eq/kg
Prior to admin. 0.002 0.001
0–16 0.010 0.008
16–24 0.023 0.016
24–40 0.038 0.024
40–48 0.039 0.029
48–64 0.052 0.031
64–72 0.067 0.030
72–88 0.059 0.037
88–96 0.046 0.041
96–112 0.062 0.043
112–120 0.065 0.038
120–136 0.060 0.041
136–144 0.055 0.035
144–160 0.078 0.033
160–166 0.062 0.032
Table 5 TRR in tissues of lactating goats - recovery of administered doses of [14C]penthiopyrad
P-label % Total dose
P-label mg eq/kg
T-label % Total dose
T-label mg eq/kg
Liver 0.36 1.9 0.33 0.99
Kidney 0.01 0.33 0.01 0.11
Muscle 0.21 0.038 0.13 0.011
Fat 0.05 0.028 0.05 0.015
Total 0.63 0.52
The main objective of this study was to characterize the radioactivity in the different tissues and investigate the mass balance in livestock animals.
For milk the last sample ((160–166 hours) was selected for detailed analysis. The distribution of radiolabel between the fat, extracted whey (skimmed milk) and protein pellet (post-extraction solids) for both labels is presented in Table 6.
Table 6 Overview of characterisation of radioactive residues in goat milk
P-label (21.8 ppm) T-label (14.6 ppm)
% TRR mg eq/kg % TRR mg eq/kg
Total in fat 5.0 0.003 18.3 0.006

Penthiopyrad
1379
P-label (21.8 ppm) T-label (14.6 ppm)
% TRR mg eq/kg % TRR mg eq/kg
Total in whey 93.9 0.058 55.2 0.018
Total dichloromethane
66.9 0.042 35.9 0.011
U1 7.4 0.005
U2 7.2 0.004
U3 12.7 0.008
U4 9.0 0.006
U5 22.0 0.007
U6 9.6 0.006
U7 13.9 0.004
PAM 21.1 0.013
Aqueous phase 26.9 0.017 14.4 0.005
PCA Rf = 0.12
6.2 0.004
PAM Rf = 0.27
9.5 0.006
U8 11.3 0.007
Soxhlet (methanol) – – 5.0 0.002
Unextracted 1.2 0.001 26.5 0.008
Total in milk 100.0 0.062 100.0 0.032
– = not applicable U: unknown metabolite
Extractability of residues in liver was lower than for milk. Following sequential extractions
47.4% and 68.2% remained unextractable for the P-label and T-label respectively.
A complex pattern of chromatographic peaks was observed, 10 of those were quantified below 0.034 mg eq/kg. Co-chromatography of metabolites with reference compounds was used to attribute penthiopyrad, DM-753, 753-FDO, 753-TDO, PAM and PCA in the P-label. A summary of the characterized residues is presented in Table 7.
Table 7 Overview of characterization of radioactive residues in goat liver
P-label (21.8 ppm) T-label (14.6 ppm)
% TRR mg eq/kg % TRR mg eq/kg
Total hexane 2.3 0.044 14.3 0.14
Total dichloromethane 17.4 0.33 5.2 0.051
Penthiopyrad 2.0 0.037
DM-753 0.7 0.013
753-T-DO 1.1 0.020
PCA 1.3 0.024
PAM 2.8 0.053
753-F-DO 1.1 0.02
753-A-OH – – 0.5 0.005
U1+U2 1.3 0.024
U3+U4 1.6 0.028

Penthiopyrad
1380
P-label (21.8 ppm) T-label (14.6 ppm)
% TRR mg eq/kg % TRR mg eq/kg
U5 1.0 0.02
U6 1.0 0.018 9 unknowns
U7 1.5 0.027 each less than 0.01 mg eq/kg
U8 2.2 0.041
Total aqueous 32.9 0.62 12.3 0.12
PCA (13.5 min) 7.5 0.14
U9 1.8 0.033
U10 1.7 0.033
U11 1.9 0.035 18 unknowns; one unknown at 1.4% and
U12 1.6 0.031 0.014 mg eq/kg TRR.
U13 2.3 0.043 All other unknowns less than 0.01 mg eq/kg
U14 3.2 0.059
U15 1.9 0.036
U16 1.8 0.034
U17 1.5 0.028
U18 2.2 0.042
U19 5.4 0.101
Total extracted 52.6 0.99 31.8 0.31
Released by pronase 17.9 0.34 31.1 0.31
Released by hydrolysis 14.2 0.27 18.8 0.19
Unextracted 15.3 0.29 18.3 0.18
Total in liver 100.0 1.9 100.0 0.99
U: unknown metabolite
For kidney 76.4% TRR and 65.3% of the TRR were extracted for the P-label and T-label,
respectively. PAM was the major component in kidney accounting for 18.6% TRR (0.062 mg eq/kg). PCA was also identified by co-chromatography on HPLC and TLC and quantified at 12.5% TRR (0.041 mg eq/kg). All radioactive residues in the T-label sample were present at less than 0.01 mg eq/kg (see Table 8).
Table 8 Overview of characterization and identification of radioactive residues in goat kidney
P-label (21.8 ppm) T-label (14.6 ppm)
% TRR mg eq/kg % TRR mg eq/kg
Hexane phase 1.4 0.004 7.9 0.009
Total dichloromethane 31.1 0.1 18.6 0.021
753-A-OH 2.5 0.003
PCA 12.5 0.041
PAM 18.6 0.062
12 unknowns (each < 0.01 mg eq/kg)
16.1 0.018
Total aqueous 43.9 0.15 38.7 0.044
Penthiopyrad 3.4 0.011

Penthiopyrad
1381
P-label (21.8 ppm) T-label (14.6 ppm)
% TRR mg eq/kg % TRR mg eq/kg
753-A-OH 3.2 0.004
U1 5.4 0.018
U2 3.0 0.010
U3 5.2 0.017
U4 4.0 0.013
U5 4.7 0.016
U6 6.2 0.021
U7 7.3 0.024
U8 4.6 0.015
7 unknowns (each < 0.01 mg eq/kg)
35.5 0.04
Total extracted 76.4 0.25 65.3 0.074
Released by hydrolysis 13.0 0.043 17.2 0.019
Unextracted 10.6 0.035 17.5 0.020
Total in kidney 100.0 0.33 100.0 0.11
U: unknown metabolite
In muscle and fat total radioactive residues were present at concentrations of 0.038 mg eq/kg
for the P-label and 0.011 mg eq/kg for the T-label and of 0.028 mg eq/kg for the P-label and 0.015 mg eq/kg for the T-label, respectively. Only the P-label was further investigated for both tissues.
In muscle PAM was the major residue accounting for a total of 51.1% of the TRR (44.3% TRR in the dichloromethane and 7.8% of the TRR in the aqueous phase) (see Table 9).
In fat the major component was penthiopyrad with 0.009 mg eq/kg. A component co-chromatographed with PAM, being present at 12.1% of the TRR (0.003 mg eq/kg) (see Table 10).
Table 9 Overview of characterisation and identification of radioactive residues in goat muscle
P-label (21.8 ppm)
% TRR mg eq/kg
Hexane phase 13.8 0.005
Total dichloromethane 45.7 0.017
PAM 44.3 0.016
U1 1.4 0.001
Total aqueous 23.7 0.009
PAM 7.8 0.003
PCA 6.8 0.003
U2 9.1 0.003
Total extracted 83.1 0.032
Unextracted 16.9 0.006
Total in muscle 100.0 0.038
U: unknown metabolite

Penthiopyrad
1382
Table10 Overview of characterisation and identification of radioactive residues in goat fat
P-label (21.8 ppm)
% TRR mg eq/kg
Hexane phase 5.9 0.002
Total acetonitrile 55.6 0.016
Penthiopyrad 32.4 0.009
PAM 12.1 0.003
U1 3.2 0.001
U2 5.7 0.002
U3 2.2 0.001
Total extracted 73.0 0.020
Unextracted 27.0 0.008
Total in fat 100.0 0.028
U: unknown metabolite
A second goat metabolism study was undertaken by Marin, J (2009, PTHIO_029) to further
elucidate the metabolic pathway and the nature of the residues in liver and kidney. Two lactating goats were administered either [pyrazole-14C]- or [thienyl-14C]-penthiopyrad at 10 ppm in the diet with a single daily dose over five consecutive days. The goats were sacrificed 20–21 hours after the last administration and liver, kidney, muscle, fat, blood and bile were sampled.
Total radioactive residues (TRR) were determined by liquid scintillation counting after solubilisation or by direct liquid scintillation counting for skim milk, milk fat, blood, cage wash and urine samples. Milk was centrifuged to obtain skimmed milk and milk fat. TRR levels found in milk other matrices are summarized in Table 11 and Table 12.
Table 11 Overview of TRR level in goats milk
Whole Milk
Sampling P-label 10 ppm (mg eq/kg)
T-label 10 ppm (mg eq/kg)
Day 1 0.009 0.017
Day 2 0.030 0.054
Day 3 0.035 0.072
Day 4 0.036 0.055
Day 5 0.031 0.032
Day 6 am 0.040 0.039
Table 12 Overview of TRR level in goats tissues
Tissue P-label 10 ppm (mg eq/kg)
T-label 10 ppm (mg eq/kg)
Liver 0.74 0.66
Kidney 0.15 0.17
Loin Muscle 0.024 0.012
Flank Muscle 0.025 0.020
Renal Fat 0.019 0.013
Omental Fat 0.016 0.018
Subcutaneous Fat 0.022 0.014

Penthiopyrad
1383
Tissue P-label 10 ppm (mg eq/kg)
T-label 10 ppm (mg eq/kg)
Blood 0.055 0.051
Bile 5.8 7.3
For characterization, tissues and milk were extracted twice with acetone/water, unextracted
residues were afterwards measured by combustion. As appropriate, pronase, acid and base digestions were used to release radioactivity remaining. Extracts were chromatographed on HPLC and compared to unlabelled reference compounds and radiolabelled conjugates.
In liver solvent extraction released approx. 40% of the TRR. The identification of the radioactivity revealed numerous metabolites for both labels present at levels of < 10% of the TRR (0.069 mg eq/kg or less) each. Only hydroxy-MTF-753 was found in the T-label above 10% of the TRR (10.3%) (see Table 13).
To increase the extraction rate protease, acid and base hydrolysis were performed, resulting in a spectrum of low level metabolites (see Table 14 and Table 15).
Table 13 Characterization of residues in goat liver following solvent extraction
P-label 10 ppm T-label 10 ppm
Identity mg eq/kg % TRR Identity mg eq/kg % TRR
DM-PAM 0.007 0.88 Polar metabolites 0.014 2.10
PAM 0.017 2.14 dihydroxy-cys-F-DO isomer a
0.013 1.95
dihydroxy-cys-F-DO isomer a
0.016 2.02 dihydroxy-cys-F-DO isomer a
0.015 2.25
dihydroxy-cys-F-DO isomer a
0.015 1.89 hydroxy-cys-F-DO 0.014 2.10
hydroxy-cys-F-DO 0.014 1.76 dihydroxy-cys-T-DO 0.018 2.69
cys-T-DO-isomer a 0.042 5.29 cys-T-DO-isomer a 0.013 1.95
cys-T-DO-isomer a 0.017 2.14 cys-T-DO-isomer a 0.045 6.74
dihydroxy-MTF-753 + hydroxy-MTF-753
0.031 3.90 hydroxy-MTF-753 0.069 10.33
cys-F-DO isomer a 0.027 3.40 cys-F-DO-isomer a 0.016 2.40
cys-F-DO isomer a 0.028 3.53 cys-F-DO-isomer a 0.031 4.64
dehydro-cys-F-DO 0.036 4.53 dehydro-cys-FDO 0.009 1.35
753-A-OH 0.011 1.39 753-A-OH 0.012 1.80
U1 0.015 1.89 Unknown (40.75min) 0.006 0.90
PTU + MTF-753 0.011 1.39 MTF-753 0.005 0.75
Sum of unassigned chromatographic peaks
0.019 2.39 Sum of unassigned chromatographic peaks
0.019 2.84
Total extracted 0.321 40.4 Total extracted 0.283 42.4
Total protease digest 0.066 8.3 Total protease digest 0.083 12.4
Total acid digest 0.250 31.5 Total acid digest 0.146 21.9
Total base digest 0.147 18.5 Total base digest 0.138 20.7

Penthiopyrad
1384
P-label 10 ppm T-label 10 ppm
Identity mg eq/kg % TRR Identity mg eq/kg % TRR
Total recovered 0.784 98.7 Total recovered 0.650 97.3
U: unidentified metabolite a isomeric constitution not identifyable by mass spectrometry
Table 14 Characterization of residues in protease and acid digests of P-label liver (10 ppm)
Protease Digest Acid Digest
Identity mg eq/kg % TRR mg eq/kg % TRR
U2 – – 0.019 2.39 DM-PAM 0.001 0.13 – – PCA (unconfirmed) – – 0.101 12.72 PAM 0.005 0.63 0.063 7.93 dihydroxy-cys-F-DO isomer a 0.011 1.39 – dihydroxy-cys-F-DO isomer a – – 0.002 0.25 hydroxy-cys-F-DO 0.006 0.76 0.005 0.63 cys-T-DO-isomer a 0.008 1.01 0.003 0.38 cys-T-DO-isomer a – – 0.010 1.26 dihydroxy-MTF-753 + hydroxy-MTF-753
0.009 1.13 0.008 1.01
cys-F-DO isomer a 0.002 0.25 0.019 2.39 cys-F-DO isomer a 0.001 0.13 0.012 1.51 dehydro-cys-F-DO 0.002 0.25 – – 753-A-OH 0.001 0.13 – – U3 – – – – PTU + MTF-753 – – – – Sum of unassigned chromatographic peaks
0.020 2.5 0.008 1.01
Total 0.066 8.3 0.250 31.5
Unconfirmed PCA was identified based on analytical retention time U: unidentified metabolite a isomeric constitution not identifyable by mass spectrometry
Table 15 Characterization residues in protease and acid digests of T-label liver
Protease Digest Acid Digest
Identity mg eq/kg % TRR mg eq/kg % TRR
U4 0.007 1.05 0.012 1.80 U5 0.005 0.75 – – dihydroxy-cys-F-DO isomer a – – – – dihydroxy-cys-F-DO isomer a 0.005 0.75 0.009 1.35 hydroxy-cys-F-DO – – – – dihydroxy-cys-T-DO 0.021 3.14 0.014 2.10 cys-T-DO-isomer a – – 0.016 2.40 cys-T-DO-isomer a 0.004 0.60 0.014 2.10 hydroxy-MTF-753 0.008 1.20 0.014 2.10 cys-F-DO isomer a 0.003 0.45 0.015 2.25 cys-F-DO isomer a 0.002 0.30 0.009 1.35 dehydro-cys-F-DO 0.002 0.30 0.008 1.20 753-A-OH – – – – U6 0.001 0.15 – –

Penthiopyrad
1385
Protease Digest Acid Digest
Identity mg eq/kg % TRR mg eq/kg % TRR
MTF-753 – – – – Sum of unassigned chromatographic peaks
0.025 3.74 0.035 5.24
Total 0.083 12.4 0.146 21.9
U: unidentified metabolite a isomeric constitution not identifyable by mass spectrometry
For kidney the extraction rates were 64.5% of the TRR for the P-label and 48.5% of the TRR
for the T-label. Most of the unextracted radioactivity was released after using pronase, acid and base digestion.
Following solvent extraction most of the radioactivity was identified as numerous metabolites below 10% of the TRR (0.017 mg eq/kg and less) each. In the T-label PAM and the dihydroxy-cys-F-DO isomer were present at amounts of 10.3% and 11% of the TRR, respectively (see Table 16).
After hydrolysis of the kidney a large number of metabolites at individual levels all below 4% of the TRR (0.006 mg eq/kg or less) were found (see Table 17 and Table 18).
Table16 Characterisation of residues in goat kidney following solvent extraction
P-label (10 ppm) T-label (10 ppm) Identity mg eq/kg % TRR Identity mg eq/kg % TRR Extracted in acetone/water 0.1 64.5 Extracted in acetone/water 0.083 48.5 DM-PAM 0.007 4.52 Polar fraction 0.004 2.34 PAM 0.016 10.3 U1 0.003 1.75 dihydroxy-cys-F-DO isomer 0.017 11.0 U2 0.003 1.75 hydroxy-cys-F-DO 0.009 5.81 U3 0.004 2.34 dihydroxy-cys-T-DO 0.008 5.16 dihydroxy-cys-F-DO isomer (a) 0.007 4.09 cys-T-DO isomer 0.007 4.52 dihydroxy-cys-F-DO isomer (a) 0.007 4.09 dihydroxy-MTF-753 0.008 5.16 hydroxy-cys-F-DO 0.007 4.09 hydroxy-MTF-753 0.009 5.81 dihydroxy-cys-TDO 0.007 4.09 cys-F-DO isomer 0.007 4.52 cys-TDO isomer (a) 0.004 2.34 dehydro-cys-F-DO + A-OH 0.013 8.39 cys-TDO isomer (a) 0.005 2.92 U4 0.003 1.94 dihydroxy-MTF-753 0.007 4.09 penthiopyrad 0.002 1.29 hydroxy-MTF-753 0.006 3.51 Sum of unassigned chromatographic peaks
0.008 5.16 cys-F-DO isomer 0.003 1.75
cys-F-DO isomer 0.007 4.09 dehydro-cys-F-DO + A-OH 0.003 1.75 U5 0.003 1.75 penthiopyrad 0.001 0.58 Sum of unassigned
chromatographic peaks 0.006 3.51
Total in protease digest 0.019 12.3 Total in protease digest 0.034 19.9 Total in acid digest 0.022 14.2 Total in acid digest 0.032 18.7 Unextracted 0.009 5.8 Unextracted 0.027 15.8 Total 0.15 96.8 Total 0.176 102.9
U: unidentified metabolite a isomeric constitution not identifyable by mass spectrometry
Table 17 Characterisation of residues in protease and acid digests of P-label kidney
Protease Digest Acid Digest
Identity mg eq/kg % TRR mg eq/kg % TRR

Penthiopyrad
1386
Protease Digest Acid Digest
Identity mg eq/kg % TRR mg eq/kg % TRR U6 – – 0.001 0.65 PAM 0.002 1.29 0.004 2.58 dihydroxy-cys-F-DO isomer – – 0.001 0.65 hydroxy-cys-F-DO 0.002 1.29 0.001 0.65 dihydroxy-cys-T-DO 0.003 1.94 – – cys-T-DO-isomer 0.002 1.29 – – dihydroxy-MTF-753 0.001 0.65 0.001 0.65 cys-F-DO isomer – – 0.002 1.29 dehydro-cys-F-DO + A-OH
– – 0.001 1.29
Sum of unassigned chromatographic peaks
0.009 5.81 0.011 7.09
Total 0.019 12.3 0.022 14.2
U: unidentified metabolite
Table 18 Characterization residues in protease and acid digests of T-label kidney
Protease Digest Acid Digest
Identity mg eq/kg % TRR mg eq/kg % TRR
U7 0.004 2.34 0.004 2.34
U8 0.005 2.92 0.001 0.58
dihydroxy-cys-F-DO isomer a – – 0.001 0.58
dihydroxy-cys-F-DO isomer a 0.006 3.51 0.002 1.17
hydroxy-cys-F-DO 0.002 1.17 0.002 1.17
dihydroxy-cys-T-DO 0.003 1.75 0.003 1.75
cys-T-DO-isomer a 0.004 2.34 0.002 1.17
cys-T-DO-isomer a – – 0.002 1.17
hydroxy-MTF-753 0.001 0.58 0.003 1.75
cys-F-DO isomer a 0.001 0.58 0.002 1.17
cys-F-DO isomer a – – 0.002 1.17
dehydro-cys-F-DO + A-OH 0.001 0.58 – –
U9 – – 0.001 0.58
Sum of unassigned chromatographic peaks
0.007 4.09 0.007 4.09
Total 0.034 19.88 0.032 18.7
U: unidentified metabolite a isomeric constitution not identifyable by mass spectrometry
In milk (3 day milk) 93% of the TRR was released by solvent extraction. As main metabolite
PAM was identified amounting to 30% of the TRR (0.013 mg eq/kg) for the P-label, followed by the cys-T-DO-isomer with 16.3% of the TRR (0.007 mg eq/kg). For the T-label metabolisation was more extensive, resulting numerous metabolites, each being present at levels of 8.4% of the TRR or less (0.008 mg eq/kg or less).
Table 19 Characterisation radioactive residues in milk
P-label T-label
Identity mg eq/kg % TRR Identity mg eq/kg % TRR

Penthiopyrad
1387
P-label T-label
Identity mg eq/kg % TRR Identity mg eq/kg % TRR
DM-PAM 0.003 6.98 A 0.008 8.42
PAM 0.013 30.23
dihydroxy-cys-F-DO isomer a
0.001 2.33 dihydroxy-cys-F-DO isomer a
dihydroxy-cys-F-DO isomer a
0.001 2.33 dihydroxy-cys-F-DO isomer a
0.005 5.26
hydroxy-cys-F-DO 0.003 6.98 hydroxy-cys-F-DO 0.004 4.21
dihydroxy-cys-TDO 0.002 4.65 dihydroxy-cys-TDO 0.004 4.21
cys-TDO isomer 0.007 16.28 cys-TDO isomer a 0.005 5.26
dihydroxy-MTF-753 + hydroxy-MTF-753
0.004 9.30 cys-TDO isomer a 0.007 7.37
cys-F-DO isomer 0.003 6.98 dihydroxy-MTF-753 0.005 5.26
Dehydro-cys-F-DO 0.003 6.98 hydroxy-MTF-753
cys-F-DO isomer a 0.008 8.42
cys-F-DO isomer a 0.005 5.26 dehydro-cys-F-DO 0.006 6.32 A-OH 0.002 2.11
Total identified 0.040 93.0 Total identified 0.051 53.26
Unidentified extracted – – Unidentified extracted 0.015 15.8
Unidentified in digest – – Unidentified in digest 0.021 22.1
Unextracted – – Unextracted – –
Total 0.040 93.0 Total 0.095 100 a isomeric constitution not identifiable by mass spectrometry
In muscle total radioactivity was 0.02 mg eq/kg. Extraction of composite loin and flank
muscle samples with acetone/water yielded 76.9% and 58.8% of the TRR for the P- and T-label respectively. Identification of the radioactivity gave PAM (0.012 mg eq/kg equivalent to 46% TRR) and DM-PAM (0.003 mg eq/kg equivalent to 11.5% TRR) as metabolites from the P-label. For the T-label residues were too low for identification.
For fat the TRR was approximately 0.02 mg eq/kg for each of the labels. Extraction of composite fat samples yielded 84.2% TRR and 57.1% TRR for the P- and T-label, respectively. Analysis of the P-label extract showed DM-PAM, PAM and penthiopyrad in concentrations up to 0.005 mg eq/kg. For the T-label residues were too low for identification.
A proposed metabolic pathway of penthiopyrad in ruminants is presented in Figure 1.

Penthiopyrad
1388
Figure 1 Proposed metabolic pathway of penthiopyrad in ruminants
Laying hens
For the metabolism in laying hens the first study was conducted by Burri, R (2009, PTHIO_030). [Pyrazole-14C]-penthiopyrad (P-label) and [thienyl-14C]-penthiopyrad (T-label) were administered orally as capsules to two separate groups of five hens once per day for 14 consecutive days at 10 ppm in the diet (actual dosing: P-label 11.7 ppm = 0.88 mg/kg bw and d, T-label 12.4 ppm = 0.93 mg/kg bw and d). Eggs were collected prior to dosing and during dosing twice daily and separated into yolk and white. Excreta were sampled in 24-hour intervals and at sacrifice. The hens were sacrificed 6–8 hours after the last dose and blood was collected. Liver, muscle (breast and thigh), fat (peritoneal), skin (including subcutaneous fat) were sampled. TRR levels in all matrices were analysed by using liquid scintillation counting (LSC) (see Tables 20 and 21).
Eggs were extracted with acetone, acetonitrile and acetonitrile/0.1N HCl (4:1, v/v), followed by Soxhlet extraction with methanol. In addition, for egg yolks the unextracted radioactivity was characterised by hydrolysis in 2 N HCl at 70–80 °C for approximately 6 hours. After the hydrolysis, the sample was extracted with acetonitrile and with methanol. Analysis of the hydrolysed residue was performed with TLC against reference substances instead of HPLC.
Hen liver was extracted with acetonitrile and acetonitrile/purified water (4:1, v/v). The samples were further extracted with methanol, with acetonitrile/0.1 N HCl (4:1, v/v) and with acetonitrile/0.1 N NaOH (4:1, v/v). The unextracted radioactivity was characterised by hydrolysis in 2 N HCl at 70 °C for approximately 6 hours. After hydrolysis the sample was extracted with methanol, methanol/dichloromethane and with methanol/H2O (1:1, v/v).
Muscle tissue was extracted with acetonitrile, methanol, and acetonitrile/0.1 N HCl (4:1, v/v), followed by a Soxhlet extraction in methanol. All extracts were pooled for partitioning.
Hen fat was only extracted for the T-label. The skin gave TRR levels sufficient for further characterization with both labels. Extractions were performed with dichloromethane and acetonitrile. Additionally, a Soxhlet extraction in methanol was performed for skin. All extracts were pooled,
753-T-DOPenthiopyrad
DM-753
753-F-DO cys-F-DO
hydroxy-cys-T-DO
dehydro-cys-F-DO
hydroxy-MTF-753
SNHN
N
OCF3
NN
SNH
OCF3
O
OH
NN
ONH
OCF3
O
OH
SNHN
N
OCF3
OHS
NHN
NH
OCF3
NN
ONH
OCF3
O
OH
Cys
PCA PAM
DM-PCA DM-PAM
+NN
NH2
OCF3
NNH
NH2
OCF3
NN
OH
OCF3
NNH
OH
OCF3
NN
NH
OCF3
O
HO
O
Thienyl ring fragments
753-A-OH
SNHN
N
OCF3
OH
hydroxy-cys-F-DO
dihydroxy-cys-F-DO
NN
SNH
OCF3
O
OH
Cys
cys-T-DO
dihydroxy-cys-T-DO
OHO
OHO

Penthiopyrad
1389
concentrated, and re-dissolved in hexane. The hexane phase was then partitioned with acetonitrile and acetonitrile/purified water (1:1, v/v; fat only).
Table 20 Total radioactive residues in egg white and egg yolk
Time after Egg white Egg white Egg yolk Egg yolk
1st admin. P-label (11.7 ppm) T-label (12.4 ppm) P-label (11.7 ppm) T-label (12.4 ppm) (hours) mg eq/kg mg eq/kg mg eq/kg mg eq/kg 0–24 0.002 0.002 0.001 0.001 24–48 0.035 0.029 0.016 0.007 48–72 0.049 0.032 0.049 0.033 72–96 0.047 0.045 0.1 0.068 96–120 0.05 0.037 0.15 0.14 120–144 0.046 0.04 0.19 0.21 144–168 0.05 0.041 0.22 0.26 168–192 0.049 0.039 0.23 0.31 192–216 0.043 0.039 0.24 0.33 216–240 0.06 0.05 0.22 0.35 240–264 0.052 0.043 0.24 0.34 264–288 0.052 0.043 0.26 0.37 288–312 0.053 0.042 0.27 0.37 312–318 0.049 0.041 0.28 0.35
Table 21 Total radioactive residues in hen tissues and whole eggs
Tissue Mean Mean P-label (11.7 ppm) T-label (12.4 ppm) mg eq/kg mg eq/kg
Blood 0.52 0.52 Fat 0.021 0.049 Liver 0.63 0.68 Muscle 0.052 0.038 Blood Plasma 0.13 0.13 Skin 0.053 0.059 Whole Egg calculated 7 day 0.095 0.11 Whole Egg calculated 13 day 0.12 0.13
For egg white PAM was identified as the major metabolite for the P-label, giving residues of
49.8% of the TRR in the organic phase after 144–168 h of dosing (0.025 mg eq/kg). In egg white after 288–312 h of dosing PAM was present in the organic phase with 24.6% of the TRR and in the aqueous phase with additional 16.5% of the TRR (0.009 mg eq/kg). In addition DM-PAM was identified in the aqueous phase with 18.7% of the TRR (0.01 mg eq/kg) (see Table 22).
For the T-label the total rate of identification was relatively low with 30.2% of the TRR (0.012 mg eq/kg) for egg white after 144–168 h and 37.1% of the TRR (0.016 mg eq/kg) for egg white after 288–312 h. The only metabolites identified were unchanged penthiopyrad (1.3–2.0% TRR, 0.001 mg eq/kg) and 753-A-OH (6.7–6.2% TRR, 0.003 mg eq/kg) (see Table 23).
Table 22 Characterization of radioactive residues in egg white (P-label at 11.7 ppm)
Egg white 144–168 h Egg white 288–312 h % TRR mg eq/kg % TRR mg eq/kg
Total organic phase 60.4 0.030 47.2 0.025

Penthiopyrad
1390
Egg white 144–168 h Egg white 288–312 h % TRR mg eq/kg % TRR mg eq/kg Penthiopyrad 2.7 0.001 3.3 0.002 753-A-OH – – 4.8 0.003 PAM 49.8 0.025 24.6 0.013 U3 4.2 0.002 5.2 0.003 U4 – – 4.1 0.002 U5 – – 5.2 0.003 U6 3.7 0.002 – – Total aqueous phase 33.4 0.017 45.9 0.024 PAM Not performed Not performed 16.5 0.009 DM-PAM Not performed Not performed 18.7 0.010 U1 Not performed Not performed 8.1 0.004 U4 Not performed Not performed 2.6 0.001 Total extracted 93.8 0.047 93.0 0.049 Unextracted 6.2 0.003 7.0 0.004 Total recovered 100.0 0.050 100.0 0.053
U: unidentified metabolite
Table 23 Characterization of radioactive residues in egg white (T-label at 12.4 ppm)
Egg white 144–168 h Egg white 288–312 h % TRR mg eq/kg % TRR mg eq/kg Total organic phase 30.2 0.012 37.1 0.016 Penthiopyrad 1.3 0.001 2.0 0.001 753-A-OH 6.7 0.003 6.2 0.003 Sum of unassigned chromatographic peaks at least 9
peaks HPLC Rt 9–25.3 min
all less than 0.001
at least 9 peaks HPLC Rt 9–25.3 min
all less than 0.002
Total aqueous phase 26.9 0.011 24.6 0.01 Total extracted 57.1 0.023 61.7 0.026 Unextracted 42.9 0.018 38.3 0.016 Total recovered 100.0 0.041 100.0 0.042
U: unidentified metabolite
In egg yolks identification of the radioactivity in the organic phase revealed for the P-label
unchanged parent penthiopyrad at levels of 7.0% and 11.7% of the TRR (0.015 and 0.031 mg eq/kg). In addition PAM was found as major metabolite present at amounts of 23.6% and 28.4% of the TRR (0.052 and 0.07 mg eq/kg). In the aqueous phase additional PAM and DM-PAM were identified at lower amounts of 2.7% TRR (0.007 mg eq/kg) and 3.1% TRR (0.008 mg eq/kg), respectively. Hydrolysis of the unextracted residue released additional 2.9% of the TRR (0.008 mg eq/kg) as penthiopyrad and 10% of the TRR (0.027 mg eq/kg) as PAM (see Table 24 and Table 25).
Table 24 Characterization of radioactive residues in egg yolk (P-label 11.7 ppm)
Egg yolk 144–168 h Egg yolk 288–312 h % TRR mg eq/kg % TRR mg eq/kg Total organic phase 40.4 0.089 40.1 0.11 Penthiopyrad 7.0 0.015 11.7 0.031 PAM 23.6 0.052 28.4 0.075

Penthiopyrad
1391
Egg yolk 144–168 h Egg yolk 288–312 h % TRR mg eq/kg % TRR mg eq/kg U2 6.3 0.014 – – U3 3.5 0.008 – – Total aqueous phase 9.4 0.021 11.7 0.031 PAM Not
performed Not performed
2.7 0.007
DM-PAM Not performed
Not performed
3.1 0.008
3 unassigned chromatographic peaks Not performed
Not performed
5.9 0.016
Total extracted 49.8 0.11 51.9 0.14 Unextracted 50.2 0.11 48.1 0.13 Total 100.0 0.22 100.0 0.27
U: unidentified metabolite
Table 25 Characterization of unextracted radioactive residues in egg yolk after hydrolysis (P-label 12.4 ppm)
Egg yolk 144–168 h Egg yolk 288–312 h % TRR mg eq/kg % TRR mg eq/kg
Organic after hydrolysis 26.6 0.059 23.6 0.063 Penthiopyrad Not performed Not performed 2.9 0.008 PAM Not performed Not performed 10.0 0.027 4 unassigned analytical peaks
Not performed Not performed < 3.7% < 0.01
Aqueous after hydrolysis 5.1 0.011 2.4 0.006 Total released on hydrolysis 31.7 0.070 26.0 0.069 Unextracted 18.5 0.041 22.1 0.056 Total 50.2 0.11 48.1 0.13
U: unidentified metabolite
The investigation of egg yolk after administration of the T-label gave a broad pattern of breakdown products all present at levels below 10% of the TRR (0.021 mg eq/kg or less) each. The only substance identified was unchanged parent substance with 2.2% of the TRR (0.006 mg eq/kg). After hydrolysis some additional penthiopyrad could be released, giving total levels of 9.4% TRR (0.035 mg eq/kg). No further metabolites were identified (see Tables 26 and 27).
Table 26 Characterization of radioactive residues in egg yolk (T-label 11.7 ppm)
Egg yolk 144–168 h Egg yolk 288–312 h % TRR mg eq/kg % TRR mg eq/kg
Total organic phase 50.3 0.13 52.5 0.19 Penthiopyrad 2.2 0.006 – – U2 1.4 0.004 4.6 0.017 U3 8.1 0.021 7.2 0.026 U4 – – 3.8 0.014 U5 7.9 0.021 7.3 0.027 U6 4.5 0.012 – – U7 3.2 0.008 – – U8 – – 5.7 0.021

Penthiopyrad
1392
Egg yolk 144–168 h Egg yolk 288–312 h % TRR mg eq/kg % TRR mg eq/kg U9 4.4 0.011 – – U10 3.9 0.010 6.6 0.024 U11 2.8 0.007 – – U12 2.4 0.006 7.3 0.027 U13 3.9 0.010 – – U14 5.7 0.015 9.9 0.036 Total aqueous phase 7.6 0.020 5.8 0.021 Total extracted 57.9 0.15 58.3 0.21 Unextracted 42.1 0.11 41.7 0.15 Total 100.0 0.26 100.0 0.37
U: unidentified metabolite
Table 27 Characterization of unextracted radioactive residues in egg yolk after hydrolysis (T-label 12.4 ppm)
Egg yolk 144–168 h Egg yolk 288–312 h % TRR mg eq/kg % TRR mg eq/kg
Organic after hydrolysis 11.4 0.030 14.9 0.055 Penthiopyrad Not performed Not performed 9.4 0.035 U1 Not performed Not performed 1.5 0.005 U3 Not performed Not performed 1.5 0.005 U4 Not performed Not performed 2.0 0.007 U5 Not performed Not performed 0.6 0.002 Aqueous after hydrolysis 15.4 0.040 15.4 0.056 Total released on hydrolysis 26.7 0.070 30.3 0.11 Unextracted 15.4 0.040 11.4 0.042 Total 42.1 0.11 41.7 0.15
U: unidentified metabolite
For hen liver solvent extraction released 66.3% of the TRR for the P-label (0.42 mg eq/kg)
and 56.6% of the TRR for the T-label (0.39 mg eq/kg).
The identification of the extracts following administration of the P-label showed numerous metabolites present at individual levels of 12.5% of the TRR and less (0.079 mg eq/kg and less). The only substances identified were PCA with 1.4% TRR (0.009 mg eq/kg) and PAM with 7.9% TRR (0.05 mg eq/kg) (see Table 28).
The major part of the unextracted radioactivity could be released by hydrolysis. Again PCA and PAM were the only structures identified with an additional amount of 2.0% TRR (0.012 mg eq/kg) and 6.8% TRR (0.043 mg eq/kg), respectively (see Table 29).
For the T-label also a very broad metabolic pattern was found, but none of the individual substances could be identified. After hydrolysis of the unextracted residue 6.2% of the TRR remained in the final residue. Characterization of the radioactivity gave a distribution of 25.0% TRR in the organic phase plus additional 4.3% TRR after hydrolysis and 31.5% in the aqueous phase plus additional 30.1% TRR after hydrolysis.

Penthiopyrad
1393
Table 28 Characterization of radioactive residues in hens’ liver (P-label 11.7 ppm)
% TRR mg eq/kg Total organic phase 33.1 0.21 Total hexane phase 19.4 0.12 U1 3.0 0.019 U2 2.9 0.019 U3 2.0 0.012 U4 2.1 0.013 9 unassigned chromatographic peaks 0.7–1.4 0.004–0.009 Total dichloromethane phase 13.7 0.087 PCA 1.4 0.009 PAM 5.5 0.035 9 unassigned chromatographic peaks 0.3–1.3 0.002–0.008 Total aqueous phase 33.2 0.21 PAM 2.4 0.015 U5 12.5 0.079 U6 2.7 0.017 U7 3.7 0.023 U8 3.6 0.023 5 unassigned chromatographic peaks 0.9–2.2 0.006–0.014 Total extracted 66.3 0.42 Unextracted 33.7 0.21 Total in liver 100.0 0.63
U: unidentified metabolite
Table 29 Characterization of unextracted radioactive residues in hen liver after hydrolysis (P-label 12.4 ppm)
% TRR mg eq/kg Total released on hydrolysis 31.9 0.20 Total organic phase 9.0 0.057 PCA 2.0 0.012 PAM 4.9 0.031 2 unassigned chromatographic peaks 1.0,1.1 0.006, 0.007 Total aqueous phase 20.2 0.13 PAM 1.9 0.012 U1 0.8 0.005 U2 0.7 0.005 U3 6.9 0.044 U4 2.7 0.017 U5 2.4 0.015 U6 4.8 0.030 Unextracted 1.7 0.011 Total 33.7 0.21
U: unidentified metabolite
A second study to investigate the metabolism of penthiopyrad in laying hens’ livers and eggs was conducted by Marin, J (2009, PTHIO_031). This study was also performed with [pyrazole-14C]-penthiopyrad (P-label) and [thienyl-14C]-penthiopyrad (T-label), which were administered orally as

Penthiopyrad
1394
capsules to two separate groups of five hens once per day for 7 consecutive days at a rate of 10 ppm diet (approx. 0.85 mg/kg bw and day). Eggs were collected twice daily and immediately before sacrifice (23–24 h after the final dose). The entire liver, sub-samples of two types of muscles (breast and thigh), two types of fat (omental and subcutaneous) and the contents of the GI tracts were sampled.
Total radioactive residues (TRR) were determined by liquid scintillation counting after homogenisation and solubilisation or by direct liquid scintillation counting.
Portions of liver were extracted with acetone/water (4:1) and analysed by HPLC. In the second extraction set, samples after extraction with acetone/water were subjected to protease, acid and base hydrolysis. The post-extraction solids (PES) were analysed by combustion analysis.
Eggs were extracted with water and acetonitrile or with water and acetone (day 8, P-label only). The extracts were concentrated and analysed by HPLC (UV, RD and MS) against reference substances.
Total radioactive residues in eggs increased over the whole study period reaching a plateau at day 7. Overall radioactivity was found at levels up to 0.094 mg eq/kg parent equivalents. In tissues highest radioactivity was found in liver with 0.24 mg eq/kg parent eq. for the P-label and 0.35 mg eq/kg parent eq. for the T-label. Residues in muscle and fat were 0.014 to 0.022 mg eq/kg parent eq. for both labels (see Table 30 and Table 31).
Most of the radioactivity administered was recovered from the excreta and cage wash (84% for the P-label and 85% for the T-label) and the GI tract (2.05% for the P-label and 2.12% for the T-label).
Table 30 Mean total radioactive residues in whole eggs
Time Point P-Label at 10 ppm (mg eq/kg) T-Label at 10 ppm (mg eq/kg)
Day 1 AM pre dose < 0.001 < 0.001
Day 1 PM < 0.001 < 0.001
Day 2 AM < 0.001 0.010
Day 2 PM 0.013 0.012
Day 3 AM 0.028 0.023
Day 3 PM 0.029 0.028
Day 4 AM – –
Day 4 PM 0.038 0.041
Day 5 AM 0.043 0.049
Day 5 PM 0.047 0.060
Day 6 AM 0.048 0.066
Day 6 PM 0.056 0.075
Day 7 AM 0.062 0.082
Day 7 PM – 0.094
Day 8 AM 0.062 0.088
Table 31 Total radioactive residues in hen tissues
Tissue P-label at 10 ppm (mg eq/kg) T-label at 10 ppm (mg eq/kg)
Liver (% total dose) 0.24 0.35

Penthiopyrad
1395
Tissue P-label at 10 ppm (mg eq/kg) T-label at 10 ppm (mg eq/kg)
Thigh Muscle 0.022 0.020
Breast Muscle 0.020 0.014
Omental Fat 0.015 0.020
Subcutaneous Fat 0.014 0.018
Egg average (% total dose) 0.035 0.042
In liver solvent extraction, protease digestion and acid digestion all showed a broad pattern of
metabolites all being present at individual amounts of < 10% TRR for both labels. PAM was the major metabolites in hens liver for the P-label with a total of 0.046 mg eq/kg parent equivalents (18.9% of the TRR). For the T-label dihydroxy-cys-T-DO was identified at a total of 0.042 mg eq/kg parent equivalents (12.2% of the TRR). All findings for both labels are summarised in Tables 32 and 33.
Table 32 Characterization of extracted residues in hen liver following solvent extraction, protease and acid digestion (P-label 10 ppm)
Solvent extract Protease digestion Acid digestion Total
mg eq/kg
% TRR mg eq/kg
% TRR mg eq/kg
% TRR mg eq/kg
% TRR
DM-PAM 0.005 2.07 – – – – 0.005 2.07
PAM 0.009 3.72 0.001 0.41 0.036 14.8 0.046 18.93
dihydroxy-cys-F-DO isomer a 0.005 2.07 0.005 2.07 – – 0.01 4.14
dihydroxy-cys-F-DO isomer a 0.006 2.48 0.003 1.24 – – 0.009 3.72
hydroxy-cys-F-DO 0.009 3.72 0.003 1.24 0.001 0.41 0.013 5.37
dihydroxy-cys-T-DO 0.008 3.31 0.008 3.31 0.003 1.24 0.019 7.86
cys-T-DO isomer a 0.010 4.13 – – 0.003 1.24 0.013 5.37
cys-T-DO isomer a 0.013 5.37 0.006 2.48 0.007 2.89 0.026 10.74
hydroxy-MTF-753 0.008 3.31 0.002 0.83 0.002 0.83 0.012 4.97
cys-F-DO isomer a 0.004 1.65 0.001 0.41 0.004 1.65 0.009 3.72
cys-F-DO isomer a 0.006 2.48 – – 0.002 0.83 0.008 3.31
U1 – – – – 0.003 1.24 0.003 1.24
Unassigned 0.026 10.7 0.006 2.48 0.006 2.48 0.036 15.66
Total 0.10 41.7 0.035 14.5 0.067 27.7 0.20 83.9
U: unidentified metabolite a isomeric constitution not identifyable by mass spectrometry
Table 33 Characterization of extracted residues in hen liver following solvent extraction, protease and acid digestion (T-label 10 ppm)
Solvent extract Protease digestion Acid digestion Total
mg eq/kg
% TRR mg eq/kg
% TRR mg eq/kg
% TRR mg eq/kg
% TRR
dihydroxy-cys-F-DO isomer a 0.007 2.04 0.005 1.46 0.002 0.58 0.014 4.08

Penthiopyrad
1396
Solvent extract Protease digestion Acid digestion Total
mg eq/kg
% TRR mg eq/kg
% TRR mg eq/kg
% TRR mg eq/kg
% TRR
dihydroxy-cys-F-DO isomer a 0.013 3.79 0.002 0.58 0.001 0.29 0.016 4.66
hydroxy-cys-F-DO 0.012 3.50 0.003 0.87 0.003 0.87 0.018 5.24
dihydroxy-cys-T-DO 0.033 9.62 0.006 1.75 0.003 0.87 0.042 12.24
cys-T-DO isomer a 0.011 3.21 0.005 1.46 0.006 1.75 0.022 6.42
cys-T-DO isomer a 0.022 6.41 0.004 1.17 0.004 1.17 0.030 8.75
hydroxy-MTF-753 0.014 4.08 0.001 0.29 0.007 2.11 0.022 6.42
cys-F-DO isomer a 0.008 2.33 0.001 0.29 0.009 2.62 0.017 5.24
cys-F-DO isomer a 0.012 3.50 0.001 0.29 0.011 3.21 0.024 7.0
dehydro-cys-F-DO 0.010 2.92 0.001 0.29 – – 0.011 3.21
U1 0.003 0.87 – – – – 0.003 0.87
U2 0.003 0.87 – – – – 0.003 0.87
U3 – – 0.003 0.87 – – 0.003 0.87
Polar metabolites – – 0.004 1.17 0.006 1.75 0.01 2.92
Unassigned 0.025 7.29 0.011 3.21 0.016 4.66 0.052 15.16
Total 0.18 51.6 0.047 13.7 0.068 19.8 0.29 85.1
U: unidentified metabolite a isomeric constitution not identifyable by mass spectrometry
For eggs the identification of the radioactivity also revealed a broad pattern of metabolites all
being present below 0.01 mg eq/kg (less than 16% of the TRR) each. PAM was the major residue (0.007 ppm, 11.3% TRR), followed by DM-PAM (0.004 ppm, 6.5% TRR). Hydolysis released some additional radioactivity, resulting in various chromatographic peaks present at levels too low of identification. Only two major peaks were found which could be attributed to PAM without confirmation, giving additional 0.01 mg eq/kg for the P-label and 0.008 mg eq/kg for the T-label (see Table 34).
Table 34 Characterisation of extracted residues in hen eggs
P-label (10 ppm) T-label (10 ppm)
P-label egg components mg eq/kg % TRR T-label egg components mg eq/kg % TRR
Total Extracted 0.035 56.5 Total Extracted 0.025 30.9
DM-PAM 0.004 6.45 dihydroxy-MTF-753 0.002 2.47
PAM 0.007 11.3 hydroxy-MTF-753 0.002 2.47
cys-T-DO isomer 0.003 4.8 753-F-DO 0.001 1.23
Dihydroxy-MTF- 753
0.003 4.8 penthiopyrad 0.001 1.23
cys-FDO isomer a 0.001 1.6 U1 0.001 1.23
cys-FDO isomer a 0.001 1.6 U2 0.002 2.47
unassigned 0.016 25.8 unassigned 0.016 19.8

Penthiopyrad
1397
P-label (10 ppm) T-label (10 ppm)
P-label egg components mg eq/kg % TRR T-label egg components mg eq/kg % TRR
Total in Protease Digest 0.004 6.4 Total in Protease Digest 0.009 11.1
Total in Acid Digest 0.010 16.1 Total in Acid Digest 0.014 17.3
Total in Base Digest 0.008 12.9 Total in Base Digest 0.023 28.4
Total 0.057 91.9 Total 0.071 87.7
U: unidentified metabolite a isomeric constitution not identifyable by mass spectrometry
A proposal for a metabolic pathway of penthiopyrad in laying hens is presented below in
Figure 2.
Figure 2 Proposed metabolic pathway of penthiopyrad in laying hens
Plant metabolism
The fate of penthiopyrad in plants was investigated following foliar application of 14C-radiolabelled active substance to grapes, cabbage, tomatoes, wheat and canola. All crop samples were extracted with methanol followed by methanol/water. The combined extracts were concentrated and partitioned with ethyl acetate/hexane or ethyl acetate. The radioactivity in the extracts was measured by liquid scintillation counting (LSC). The radioactive content of the post extraction solids was determined by combustion radioanalysis.
For identification the HPLC retention times of the radiolabelled components in the samples were compared to reference compounds that were co-injected with the samples. Metabolite identification was confirmed by co-chromatography on silica gel TLC using reference standards. In addition chiral column HPLC was used in grapes and cabbage metabolism studies. There was no indication of epimerisation of the parent substance.
753-T-DOPenthiopyrad
DM-753
753-F-DO cys-F-DO
hydroxy-cys-T-DO
dehydro-cys-F-DO
hydroxy-MTF-753
SNHN
N
OCF3
NN
SNH
OCF3
O
OH
NN
ONH
OCF3
O
OH
SNHN
N
OCF3
OH
SNHN
NH
OCF3
NN
ONH
OCF3
O
OH
Cys
PCA PAM
DM-PCA DM-PAM
+NN
NH2
OCF3
NNH
NH2
OCF3
NN
OH
OCF3
NNH
OH
OCF3
NN
NH
OCF3
O
HO
O
Thienyl ring fragments
753-A-OH
SNHN
N
OCF3
OH
hydroxy-cys-F-DO
dihydroxy-cys-F-DO
NN
SNH
OCF3
O
OH
Cys
cys-T-DO
dihydroxy-cys-T-DO
dihydroxy-MTF-753
SNHN
N
OCF3
dihydroxy
OHO
OHO

Penthiopyrad
1398
After short PHIs rinseable residues mainly contained unchanged parent substance. In the plant extracts a complex pattern of metabolites were identified, mainly at individual amounts of less than 10% of the TRR. Other metabolites frequently found were PAM and PCA. A proposal for a metabolic pathway of penthiopyrad in plants is presented in Figure 3.
Grapes
For grapes Baker, FC (2006, PTHIO_114) investigated the metabolism of penthiopyrad using a 1:1 mixture of P- and T-labelled active substance. The active substance was sprayed to two plots of grapevines with rates of 0.4 kg ai/ha each. The corresponding days after treatment (DATs) were 30 or 60 days. Samples included grape bunches, leaves, stems and roots.
Grape berries were divided into two groups. Treated grapes and leaves from Group I were rinsed twice with methanol/water (7/3, v/v) while treated berries from Group II were not rinsed. Group I rinsed grapes were directly homogenised while Group II grape berries were homogenised and the juice was separated by centrifugation and filtering. Rinsed leaves were homogenised in the presence of dry ice.
The rinsed grape berries and pomace were extracted with methanol and methanol/water (7/3 v/v). DAT 60 grapes and pomace were additionally extracted using methanol/hydrochloric acid 0.2N (1/1 v/v). The rinsed leaves were extracted with methanol/water (7/3 v/v) followed by methanol/hydrochloric acid 0.2N (1/1 v/v). The leaf post-extraction solids (PES) were further extracted with methanol/water (1/1 v/v) reflux, methanol/hydrochloric acid 0.2N (1/1 v/v) reflux, cellulase hydrolysis and protease hydrolysis. The leaf rinses and methanol/water extracts were partitioned into an organic phase and an aqueous phase. The aqueous phase was then hydrolysed using concentrated hydrochloric acid.
TRR levels found in the samples are presented in Table 35.
Table 35 Total radioactive residues in grapes treated with P- and T-labelled penthiopyrad
30 day PHI 30 day PHI 60 day PHI 60 day PHI
Group I (Rinsed)
Group II (Unrinsed)
Group I (Rinsed)
Group II (Unrinsed)
mg eq/kg %TRR mg eq/kg %TRR mg eq/kg %TRR mg eq/kg %TRR
Grape berries total 0.20 100 0.24 100 0.083 100 0.21 100
Rinses 0.048 23.5 na na 0.010 12 na na
Rinsed berries 0.16 76.5 na na 0.073 88 na na
Juice na na 0.13 55.2 na na 0.12 56.7
Pomace na na 0.11 44.8 na na 0.091 43.3
Leaves total 5.1 100 na na 3.35 100 na na
Rinses 3.1 60.8 na na 1.37 40.9 na na
Rinsed leaves 2.0 39.2 na na 1.98 59.1 na na
na: not analysed
Table 36 Extractability of grapes and grape leaves treated with P- and T-labelled penthiopyrad
Grapes Leaves
30 day PHI 60 day PHI 30 day PHI 60 day PHI
mg/ kg % TRR mg/ kg % TRR mg/ kg % TRR mg/ kg % TRR

Penthiopyrad
1399
Grapes Leaves
30 day PHI 60 day PHI 30 day PHI 60 day PHI
mg/ kg % TRR mg/ kg % TRR mg/ kg % TRR mg/ kg % TRR
Rinses total 0.048 23.5 0.010 12.0 3.1 60.8 1.37 40.9
Methanol Extract 1
0.13 61.3 0.060 72.3 np np np np
Methanol Extract 2
0.009 4.4 0.004 4.8 np np np np
Methanol/Water 7/3 Extract 1
0.002 1.0 0.001 1.2 0.84 16.4 0.94 28.0
Methanol/Water 7/3 Extract 2
np np np np 0.17 3.3 0.21 6.3
Methanol/HCl (0.2N) 1/1
np np 0.002 2.4 0.096 1.9 0.14 4.1
Methanol/HCl (0.2N) 1/1
np np nd < 1.2 0.13 2.6 0.12 3.5
Methanol/Water 1/1 Refluxed
np np np np 0.18 3.6 0.20 6.0
Methanol/HCl Refluxed
np np np np 0.070 1.4 0.077 2.3
Cellulase Hydrolysis
np np np np 0.002 < 0.1 0.004 0.1
Protease Hydrolysis
np np np np 0.002 < 0.1 0.002 0.1
Unextracted 0.013 6.4 0.009 10.8 0.14 2.7 0.20 6.0
Total recovered 0.197 96.6 0.086 103.5 4.74 92.7 3.26 97.3
np: not performed nd not detected (< 0.001 mg eq/kg)
Penthiopyrad was the major analyte in the 30 day PHI grape berries (0.042 mg eq/kg). About
half of the penthiopyrad was recovered in the rinses. The identity of penthiopyrad was confirmed by TLC following isolation from the 30 day fruit rinse. PAM was observed at 0.011 mg eq/kg and 0.018 mg eq/kg. Levels of all known metabolites except PAM were below 0.01 mg eq/kg in both groups of grapes.
An unidentified chromatographic peak denoted as U20 accounted for 0.082 and 0.148 mg eq/kg in the two groups of grapes respectively. Two-dimensional TLC indicated that at least six components were contained in this peak. Acid hydrolysis resulted in the formation of 753-A-OH as the main component.
Table 37 Metabolism of [14C]penthiopyrad in grape plants treated at 30 day PHI
Grapes Group I Grapes Group2 Leaves
Rinses Rinsed grapes
Total Juice Pomace Total
% TRR (mg eq/kg)
% TRR (mg eq/kg)
% TRR (mg eq/kg)
% TRR (mg eq/kg)
% TRR (mg eq/kg)
% TRR (mg eq/kg)
% TRR (mg eq/kg)

Penthiopyrad
1400
Grapes Group I Grapes Group2 Leaves
Rinses Rinsed grapes
Total Juice Pomace Total
% TRR (mg eq/kg)
% TRR (mg eq/kg)
% TRR (mg eq/kg)
% TRR (mg eq/kg)
% TRR (mg eq/kg)
% TRR (mg eq/kg)
% TRR (mg eq/kg)
Penthiopyrad 11.3 (0.023) 9.3 (0.019) 20.6 (0.042) n.d. 17.4 (0.042) 17.4 (0.042) 16.8 (0.858)
PAM 1.0 (0.002) 7.8 (0.016) 8.8 (0.018) 3.3 (0.008)) 0.4 (0.001) 3.7 (0.009) 11.7 (0.599)
PCA 1.0 (0.002) 1.0 (0.002) 2.0 (0.004) 1.7 (0.004) 0.4 (0.001) 2.1 (0.005) 6.4 (0.327)
753-A-OH 0.5 (0.001) 2.9 (0.006) 3.4 (0.007) 0.8 (0.002) 2.5 (0.006) 3.3 (0.008) 2.5 (0.128)
753-F-DO 1.5 (0.003) 1.0 (0.002) 2.5 (0.005) n.d. 0.8 (0.002) 0.8 (0.002) 3.4 (0.174)
DM-753 n.d. 0.5 (0.001) 0.5 (0.001) n.d. n.d. n.d. 0.2 (0.010)
753-T-DO n.d. n.d. n.d. n.d. n.d. n.d. 0.8 (0.041)
U20 0.5 (0.001) 19.6 (0.040) 20.1 (0.041) 23.2 (0.056) 7.5 (0.018) 30.7 (0.074) 6.1 (0.312)
non polar 2.5 (0.005) n.d. 2.5 (0.005) n.d. 0.8 (0.002) 0.8 (0.002) 5.6 (0.291)
polar 1.0 (0.002) 7.4 (0.015) 8.4 (0.017) 10.4 (0.025) 0.8 (0.002) 11.2 (0.027) 9.0 (0.460)
Minor metabolites
0.5 (0.001) 11.8 (0.024) 12.3 (0.025) a
10.0 (0.024) 4.5 (0.011) 14.5 (0.035) b
26.7 (1.364)
not attributed 3.7 (0.008) 5.4 (0.011) 9.1 (0.019) 5.8 (0.014) 4.3 (0.010) 10.1 (0.024) 0.7 (0.036)
Unextracted not applicable
6.4 (0.013) 6.4 (0.013) not applicable
9.1 (0.022) 9.1 (0.022) 2.7 (0.138)
Total 23.5 (0.048) 73.1 (0.15) 96.6 (0.197) 55.2 (0.13) 48.5 (0.12) 103.7 (0.25) 92.7 (4.7)
n.d. not detected (< 0.001 mg eq/kg) a Minor metabolites: U19 (8.0 % TRR, 0.028 mg eq/kg), U24 (6.3 % TRR, 0.022 mg eq/kg) b Minor metabolites: U11 (6.5 % TRR, 0.028 mg eq/kg), U12 (6.0 % TRR, 0.026 mg eq/kg), U25 (2.8 % TRR, 0.012 mg eq/kg), U28 (0.9 % TRR, 0.004 mg eq/kg) U: unidentified metabolite
Table 38 Metabolism of [14C]penthiopyrad in grape plants treated at 60 day PHI
Grapes Group I Grapes Group 2 Leaves
Rinses Rinsed grapes
Total Juice Pomace Total
% TRR (mg eq/kg)
% TRR (mg eq/kg)
% TRR (mg eq/kg)
% TRR (mg eq/kg)
% TRR (mg eq/kg)
% TRR (mg eq/kg)
% TRR (mg eq/kg)
Penthiopyrad 2.4 (0.002) 2.4 (0.002) 4.8 (0.004) n.d. 4.3 (0.009) 4.3 (0.009) 5.0 (0.17)
PAM 1.2 (0.001) 12.0 (0.010) 13.3 (0.011) 3.3 (0.007) 0.5 (0.001) 3.8 (0.008) 14.1 (0.47)
PCA 1.2 (0.001) 2.4 (0.002) 3.6 (0.003) 1.9 (0.004) 0.5 (0.001) 2.4 (0.005) 10.8 (0.36)
753-A-OH n.d. 4.8 (0.004) 4.8 (0.004) 0.5 (0.001) 3.3 (0.007) 3.8 (0.008) 1.2 (0.039)
753-F-DO 1.2 (0.001) 1.2 (0.001) 2.4 (0.002) n.d. 1.0 (0.002) 1.0 (0.002) 3.7 (0.12)
DM-753 n.d. n.d. n.d. n.d. n.d. n.d. n.d.
753-T-DO n.d. n.d. n.d. n.d. n.d. n.d. 0.6 (0.021)
U20 n.d. 28.9 (0.024) 28.9 (0.024) 19.5 (0.041) 8.1 (0.017) 27.6 (0.058) 10.4 (0.35)

Penthiopyrad
1401
Grapes Group I Grapes Group 2 Leaves
Rinses Rinsed grapes
Total Juice Pomace Total
% TRR (mg eq/kg)
% TRR (mg eq/kg)
% TRR (mg eq/kg)
% TRR (mg eq/kg)
% TRR (mg eq/kg)
% TRR (mg eq/kg)
% TRR (mg eq/kg)
non polar n.d. n.d. n.d. 0.5 (0.001) 1.0 (0.002) 1.4 (0.003) 6.7 (0.22)
polar 1.2 (0.001) 13.3 (0.011) 14.5 (0.012) 9.5 (0.020) 1.0 (0.002) 10.5 (0.022) 15.5 (0.52)
Minor metabolites
n.d. 6.0 (0.005) 6.0 (0.005) a 18.6 (0.039) 5.7 (0.012) 24.4 (0.051) b
21.2 (0.71)
not attributed 4.8 (0.004) 9.6 (0.008) 14.5 (0.012) 2.9 (0.006) 8.6 (0.018) 11.4 (0.024) 2.1 (0.069)
Unextracted not applicable
10.8 (0.009) 10.8 (0.009) not applicable
11.9 (0.025) 11.9 (0.025) 6.0 (0.20)
Total 12.0 (0.010) 91.5 (0.076) 103.5 (0.086)
56.7 (0.12) 45.7 (0.096) 102.4 (0.22) 97.3 (3.26)
n.d. not detected (< 0.001 mg eq/kg) a Minor metabolites: U23 (6.0 % TRR, 0.0005 mg eq/kg) b Minor metabolites: U11 (7.7 % TRR, 0.016 mg eq/kg), U17 (1.9 % TRR, 0.0.004 mg eq/kg), U19 (5.2 % TRR, 0.011 mg eq/kg), U22 (3.4 % TRR, 0.0.007 mg eq/kg), U23 (6.2 % TRR, 0.013 mg eq/kg) U: unidentified metabolite
Cabbage
The metabolism of penthiopyrad in cabbage was investigated by Baker, F.C. (2009, PTHIO_032). A 1:1 mixture of P- and T-labelled active substance was sprayed as a SC formulation to cabbage plants 21 days before harvest. One plot was treated once at a rate equivalent to 200 g ai/ha and another plot once at 1000 g ai/ha. Outer leaves, inner heads and roots were sampled separately.
For the analysis the outer leaves were removed manually and then rinsed once with water and once with methanol/water (7/3 v/v). The rinsed outer leaves and the heads were extracted twice with methanol/water (7/3, v/v). The outer leaves were further extracted twice using methanol/hydrochloric acid 0.1 N (1/1 v/v). TRR levels found in the samples are presented in Table 39.
Table 39 Total radioactive residues in cabbage treated with P- and T-labelled penthiopyrad
200 g ai/ha 1000 g ai/ha
mg eq/kg % TRR mg eq/kg % TRR
Outer Leaves 1.4 93.5 7.9 95.9
Heads 0.045 6.5 0.16 4.1
Whole cabbage 0.48 100 2.6 100
After mechanical removal of the outer leaves these leaves as well as the inner head were
rinsed and subsequently extracted as described above. Approximately 40% of the TRR in the outer leaves and 10% of the TRR in the inner head could be rinsed. The major part of the radioactivity was extracted from the samples, leaving unextracted radioactivity at less than 10% of the TRR. The amount of radioactivity in the rinse as well as the extract is presented in Table 40.

Penthiopyrad
1402
Table 40 Extraction of TRR in cabbage treated with P- and T-labelled penthiopyrad
200 g ai/ha 1000 g ai/ha
mg eq/kg % TRR mg eq/kg % TRR
Outer leaves
Rinse 1 (water) 0.26 15.9 1.3 15.9
Rinse 2 (methanol/water)
0.23 28.5 2.3 28.5
Extract 1 (methanol/water)
0.70 49.9 3.7 46.9
Extract 2 (methanol/0.1N HCl)
0.067 4.8 0.32 4.1
Unextracted 0.14 9.7 0.79 9.9
Total recovered 1.4 97.9 8.3 105.2
Total residue TRR 1.41 100.0 7.93 100.0
Inner head
Rinse 1 (water) 0.003 6.7 0.004 2.6
Rinse 2 (methanol/water)
0.002 4.4 0.008 5.2
Extract 1 (methanol/water)
0.031 68.9 0.12 75.5
Extract 2 (methanol/0.1N HCl)
0.003 6.7 na na
Unextracted 0.004 8.9 0.013 8.4
Total recovered 0.043 95.6 0.14 91.6
Total residue TRR 0.045 100.0 0.16 100.0
The identification of the rinses and the extracts showed penthiopyrad as the major residue in
both fractions, amounting 20.4% of the TRR for the low and 34.0% of the TRR for the high application rate. A further metabolite present in amounts above 10% of the TRR was identified as PAM (10.4–10.7% of the TRR). In Table 41 an overview of all metabolites identified is presented.
Table 41 Identification of radioactive residues in cabbage treated with P- and T-labelled penthiopyrad
200 g ai/ha 1000 g ai/ha
% TRR (mg eq/kg) % TRR (mg eq/kg)
Rinses Extract Total Rinses Extract Total
Penthiopyrad 12.9 (0.061) 7.5 (0.036) 20.4 (0.097) 22.8 (0.59) 11.2 (0.29) 34.0 (0.88)
Unassigned chromatographic peaks
1.3 (0.006) nd 1.3 (0.006) 1.9 (0.050) 0.7 (0.016) 2.6 (0.066)
DM-753 nd 0.2 (0.001) 0.2 (0.001) Nd 0.5 (0.014) 0.5 (0.014)
U30 0.4 (0.002) 2.8 (0.013) 3.2 (0.015) 0.7 (0.019) 1.9 (0.048) 2.6 (0.067)
753-F-DO 1.2 (0.006) 0.7 (0.003) 1.9 (0.009) 2.2 (0.056) 0.8 (0.021) 3.0 (0.077)
753-A-OH (attentively 0.2 (0.001) 2.3 (0.011) 2.5 (0.012) 0.2 (0.002) 1.4 (0.040) 1.6 (0.042)

Penthiopyrad
1403
200 g ai/ha 1000 g ai/ha
% TRR (mg eq/kg) % TRR (mg eq/kg)
Rinses Extract Total Rinses Extract Total
assigned)
U20 0.6 (0.003) 13.5 (0.064) 14.1 (0.067) 0.6 (0.014) 10.4 (0.27) 11.0 (0.28)
PCA 2.9 (0.014) 7.0 (0.33) 9.9 (0.047) 1.1 (0.029) 3.5 (0.090) 4.6 (0.12)
PAM 2.5 (0.012) 8.2 (0.039) 10.7 (0.051) 2.4 (0.061) 8.0 (0.21) 10.4 (0.27)
DM-PAM (attentively assigned)
1.5 (0.007) nd 1.5 (0.007) 0.9 (0.023) 1.8 (0.047) 2.7 (0.070)
Polar region 0.4 (0.002) 2.8 (0.013) 3.2 (0.015) 0.3 (0.007) 1.7 (0.041) 2.0 (0.051)
Not resolved or losses 10.9 (0.052) 15.2 (0.39)
Unextracted 8.4 (0.040) 8.4 (0.040) 4.6 (0.119) 4.6 (0.12)
Total 32.2 (0.15) 56.0 (0.27) 88.2 (0.42) 42.8 (1.1) 52.0 (1.3) 94.8 (2.4)
nd: not detected (< 0.001 mg eq/kg) attentively assigned: solely confirmed by chromatographic retention time U: unidentified metabolite
Tomatoes
In a study conducted by Baker, FC (2006, PTHIO_033) field grown tomato plants were treated with [14C]penthiopyrad (1:1 mixture of P- and T-label) as a SC formulation, 21 days before normal harvest. One plot was treated once at a rate 300 g ai/ha and another plot once at 1500 g ai/ha. Tomatoes were sampled 14–21 days after treatment, the leaves 21 days after treatment.
Harvested tomatoes were separated in two groups. Group I tomatoes were surface rinsed and then extracted; Group II tomatoes were converted to juice and pomace to obtain basic information on the distribution of the residues during processing.
Group I tomatoes, leaves, stems and roots were rinsed with methanol/water (7/3, v/v). Treated Group II tomatoes were rinsed with water. Group I rinsed tomatoes were homogenised in a cutter-mixer in the presence of dry ice. Group II rinsed tomatoes were homogenised and the juice was separated by centrifugation and filtering.
An overview of the total radioactive residues recovered is summarized in Table 42.
Table 42 Total radioactive residues in tomatoes treated with P- and T-labelled penthiopyrad
300 g ai/ha 1500 g ai/ha
Group I Group II Group I Group II
mg eq/kg % TRR mg eq/kg % TRR mg eq/kg % TRR mg eq/kg % TRR
14 DAT harvest
Tomato rinses
0.005 35.7 0.009 37.5 0.35 75.9 0.096 32.7
Rinsed tomato
0.009 64.3 na na 0.11 24.1 na na
Juice na na 0.008 33.3 na na 0.049 16.7
Pomace na na 0.007 29.2 na na 0.15 50.6
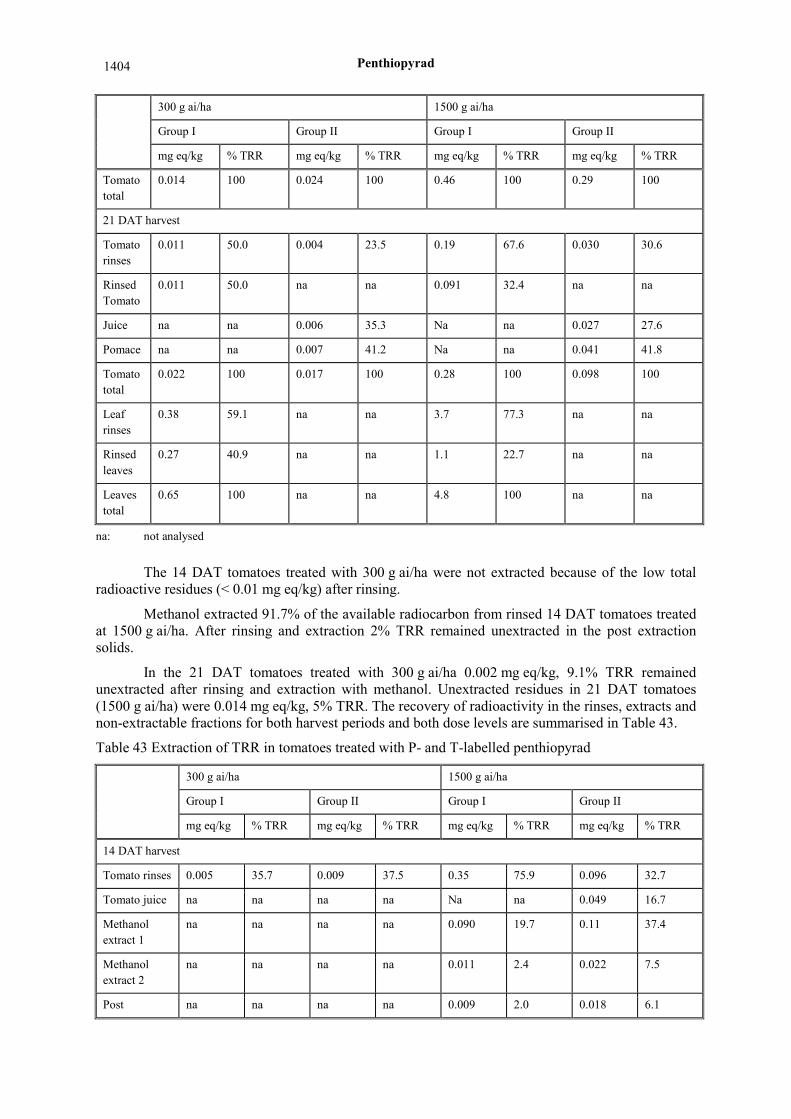
Penthiopyrad
1404
300 g ai/ha 1500 g ai/ha
Group I Group II Group I Group II
mg eq/kg % TRR mg eq/kg % TRR mg eq/kg % TRR mg eq/kg % TRR
Tomato total
0.014 100 0.024 100 0.46 100 0.29 100
21 DAT harvest
Tomato rinses
0.011 50.0 0.004 23.5 0.19 67.6 0.030 30.6
Rinsed Tomato
0.011 50.0 na na 0.091 32.4 na na
Juice na na 0.006 35.3 Na na 0.027 27.6
Pomace na na 0.007 41.2 Na na 0.041 41.8
Tomato total
0.022 100 0.017 100 0.28 100 0.098 100
Leaf rinses
0.38 59.1 na na 3.7 77.3 na na
Rinsed leaves
0.27 40.9 na na 1.1 22.7 na na
Leaves total
0.65 100 na na 4.8 100 na na
na: not analysed
The 14 DAT tomatoes treated with 300 g ai/ha were not extracted because of the low total
radioactive residues (< 0.01 mg eq/kg) after rinsing.
Methanol extracted 91.7% of the available radiocarbon from rinsed 14 DAT tomatoes treated at 1500 g ai/ha. After rinsing and extraction 2% TRR remained unextracted in the post extraction solids.
In the 21 DAT tomatoes treated with 300 g ai/ha 0.002 mg eq/kg, 9.1% TRR remained unextracted after rinsing and extraction with methanol. Unextracted residues in 21 DAT tomatoes (1500 g ai/ha) were 0.014 mg eq/kg, 5% TRR. The recovery of radioactivity in the rinses, extracts and non-extractable fractions for both harvest periods and both dose levels are summarised in Table 43.
Table 43 Extraction of TRR in tomatoes treated with P- and T-labelled penthiopyrad
300 g ai/ha 1500 g ai/ha
Group I Group II Group I Group II
mg eq/kg % TRR mg eq/kg % TRR mg eq/kg % TRR mg eq/kg % TRR
14 DAT harvest
Tomato rinses 0.005 35.7 0.009 37.5 0.35 75.9 0.096 32.7
Tomato juice na na na na Na na 0.049 16.7
Methanol extract 1
na na na na 0.090 19.7 0.11 37.4
Methanol extract 2
na na na na 0.011 2.4 0.022 7.5
Post na na na na 0.009 2.0 0.018 6.1

Penthiopyrad
1405
300 g ai/ha 1500 g ai/ha
Group I Group II Group I Group II
mg eq/kg % TRR mg eq/kg % TRR mg eq/kg % TRR mg eq/kg % TRR
extraction solids
Tomato total 0.014 100 0.024 100 0.46 100 0.3 100.4
21 DAT harvest
Tomato rinses 0.011 50.0 0.004 23.5 0.19 67.6 0.030 30.6
Tomato juice na na 0.007 41.2 na na 0.027 27.6
Methanol extract 1
0.007 31.8 0.004 23.5 0.069 24.6 0.029 29.6
Methanol extract 2
0.001 4.5 0.001 5.9 0.009 3.2 0.006 6.1
Post extraction solids
0.002 9.1 0.001 5.9 0.014 5.0 0.004 4.1
Tomato total 0.021 95.4 0.017 100 0.28 100.4 0.096 98.0
na: not analysed
The low total radioactive residues in the low rate samples were not further identified. In the
high rate sample rinse and extract parent penthiopyrad was identified as major residue, being present at approximately 45% of the TRR after 14 days. Additional metabolites were found, but their individual amounts were below 10% of the TRR. An overview of all substances identified in tomatoes is presented in Table 44.
Table 44 Identification of radioactive residues in tomatoes treated with P- and T-labelled penthiopyrad
14 DAT—Group I tomatoes in % TRR (mg eq/kg)
14 DAT—Group II tomatoes in % TRR (mg eq/kg)
Rinses Rinsed tomato
Total tomato
Rinses Juice Pomace Total tomato
Tomatoes (1500 g ai/ha)
Penthiopyrad 35.7 (0.16) 9.4 (0.043)
45.1 (0.21)
17.3 (0.051)
nd 28.9 (0.085)
46.2 (0.14)
PAM 3.1 (0.014)
1.3 (0.006)
4.4 (0.020)
4.4 (0.013)
1.4 (0.004)
0.3 (0.001)
6.1 (0.018)
PCA 2.6 (0.012)
1.3 (0.006)
3.9 (0.018)
3.1 (0.009)
4.1 (0.012)
0.3 (0.001)
7.5 (0.022)
753-A-OH nd nd nd nd nd 0.7 (0.002)
0.7 (0.002)
753-F-DO 3.9 (0.018)
0.2 (0.001)
4.1 (0.019)
2.0 (0.006)
0.3 (0.001)
0.7 (0.002)
3.0 (0.009)
U20 2.0 (0.009)
3.1 (0.014)
5.1 (0.023)
0.3 (0.001)
3.7 (0.011)
0.7 (0.002)
4.7 (0.014)
Polar 0.9 2.2 3.1 1.0 3.4 Nd 4.4

Penthiopyrad
1406
14 DAT—Group I tomatoes in % TRR (mg eq/kg)
14 DAT—Group II tomatoes in % TRR (mg eq/kg)
Rinses Rinsed tomato
Total tomato
Rinses Juice Pomace Total tomato
(0.004) (0.010) (0.014) (0.003) (0.010) (0.013)
Total characterised
48.2 (0.22)
17.5 (0.080)
65.7 (0.30)
28.1 (0.083)
12.9 (0.038)
31.6 (0.093)
72.6 (0.21)
Sum of minor metabolites
11.2 (0.051)
1.8 (0.008)
13.0 (0.059)
nd nd Nd nd
Not resolved + losses 16.5 (0.075)
2.8 (0.013)
19.3 (0.088)
4.6 (0.014)
3.8 (0.011)
13.3 (0.039)
21.7 (0.064)
Unextracted na 2.0 (0.009)
2.0 (0.009)
na na 6.1 (0.018)
6.1 (0.018)
Total
75.9 (0.35)
24.1 (0.11)
100.0 (0.46)
32.7 (0.096)
16.7 (0.049)
51.0 (0.15)
100.4 (0.3)
nd: not detected na: not analysed U: unidentified metabolite
In the 21 DAT tomato samples penthiopyrad was the major analyte at both treatment levels
accounting for 22.7% and 38.4% TRR. The 21 DAT tomatoes (300 g ai/ha) contained PCA and PAM at levels of 0.001 mg eq/kg each.
The 21 d 5× tomatoes contained the metabolites PCA (4.3% TRR, 0.012 mg eq/kg) and PAM (6.4% TRR, 0.018 mg eq/kg). No other metabolites were detected above 0.01 mg eq/kg.
In leaves penthiopyrad was the major residue, ranging from 37.2% TRR to 55.3% TRR following treatment at 300 g ai/ha or 1500 g ai/ha, respectively (0.241–2.675 mg eq/kg). The identified metabolites were PCA (8.2% TRR or 0.053 mg eq/kg and 2.9% TRR or 0.140 mg eq/kg), PAM (4.2–4.9% TRR or 0.027–0.238 mg eq/kg) and 753-F-DO (2.2–4.5% TRR or 0.014–220 mg eq/kg) following treatment at 300 g/ ai/ha or 1500 g/ ai/ha, respectively.
The processing of tomatoes from Group 2 into pomace and juice showed parent penthiopyrad being the only residue present in pomace. In juice PAM and PCA were found, but the individual levels were below 0.01 mg eq/kg for each metabolite.
Wheat
Baker FC (2009, PTHIO_034) investigated the metabolism of penthiopyrad in wheat plants. An SC formulation with radiolabelled penthiopyrad (1:1 mixture of P- and T-label) was sprayed twice each at a rate of 250 g/ ai/ha or 750 g/ ai/ha. The growth stages at application were at stem elongation and the end of flowering (BBCH 59). Forage (DAT 7 after 1st application), hay (DAT 5 after 2nd application), wheat straw and grain (DAT 32 after 2nd application) were analysed HPLC.
Unextracted radioactivity in hay, grain and straw were further extracted with methanol/ HCl (0.1 N), methanol/ NaOH (0.1 N). The grain residue was hydrolysed with dextranase/β-amylase and refluxed with HCl (1 N). An overview on the TRR levels found and the extractability of the radioactive residues is presented in Table 45.
Table 45 Total radioactive residues and extractability in wheat matrices treated with P- and T-labelled penthiopyrad
2× 250 g/ ai/ha 2× 750 g/ ai/ha mg eq/kg % TRR mg eq/kg % TRR

Penthiopyrad
1407
2× 250 g/ ai/ha 2× 750 g/ ai/ha mg eq/kg % TRR mg eq/kg % TRR
Forage TRR 6.5 22.1 Methanol 56.0 91.4% 20.8 94.1% Methanol/Water 0.34 5.2% 0.78 3.5% Unextracted (PES): 0.22 3.4% 0.53 2.4% Extracted + Unextracted: 6.5 100.0% 22.1 100.0% Hay TRR by combustion 4.3 17.8 Methanol 3.4 80.1% 14.6 81.9% Methanol/Water 0.17 4.0% 0.66 3.7% Methanol/HCl 0.1N 0.064 1.5% 0.23 1.3% THF 0.034 0.8% 0.11 0.6% Methanol/NaOH 0.1N 0.14 3.3% 0.45 2.5% Unextracted (PES): 0.14 3.2% 0.48 2.7% Extracted + Unextracted: 4.0 92.9% 16.5 92.6% Straw TRR by combustion 9.2 43.7 Methanol 6.8 73.5% 30.5 69.8% Methanol/Water 1.1 12.2% 4.9 11.2% Methanol/HCl 0.1N 0.34 3.7% 1.4 3.1% Methanol/NaOH 0.1N 0.67 7.2% 2.8 5.4% Unextracted (PES): 0.53 5.8% 2.1 4.9% Extracted + Unextracted: 9.4 102.3% 41.6 95.3% Grain TRR by combustion 0.3 0.75 Methanol/Water 0.17 57.5% 0.45 60.1% Methanol 0.007 2.4% 0.016 2.1% Methanol/HCl 0.1N 0.020 6.8% 0.046 6.1% Methanol/NaOH 0.1N 0.032 10.8% 0.079 10.5% Dextranase + β-Amylase 0.046 15.5% 0.16 21.0% HCl reflux 0.040 13.5% 0.062 8.2% Unextracted 0.022 7.4% 0.053 7.0% Extracted + Unextracted: 0.34 114.9% 0.87 116.1%
In forage and hay treated with the 2× 250 g/ ai/ha rate, penthiopyrad was the major
component amounting to 76.5% of the TRR in forage and 43.6% of the TRR in hay. Further metabolites could be identified (PAM, PCA, 753-F-DO, 753-T-DO and 753-A-OH), but the individual amounts were all below 10% of the TRR each. The results of identified metabolites are summarised in Table 46.
For wheat hay unextracted residues were additionally treated with acidic and basic hydrolysis. In total additional 5.6% of the TRR could be released. Identification revealed mainly PAM (0.6% of the TRR) and PCA (0.1% of the TRR). Further peaks were characterised, but could not be attributed to a reference compound.
Table 46 Identification of radioactive residues in wheat forage and hay treated with P- and T-labelled penthiopyrad
Forage (2× 250 g/ ai/ha, after 1st appl.) Hay (2× 250 g/ ai/ha, after 2nd appl.)
Organic Aqueous Total Organic Aqueous Total
mg eq/kg mg eq/kg % TRR mg eq/kg mg eq/kg % TRR
PAM 0.097 1.5 0.021 0.16 4.3
PCA 0.065 1.0 0.070 0.10 3.9

Penthiopyrad
1408
Forage (2× 250 g/ ai/ha, after 1st appl.) Hay (2× 250 g/ ai/ha, after 2nd appl.)
Organic Aqueous Total Organic Aqueous Total
mg eq/kg mg eq/kg % TRR mg eq/kg mg eq/kg % TRR
753-F-DO 0.069 1.1 0.15 0.28 4.1
753-T-DO 0.11 0.008 2.7
Penthiopyrad 4.5 0.49 76.6 1.9 0.018 43.6
U5 1.4 0.085 2.0
U6 0.020 0.077 2.3
U10 (DM-PCA attentively assigned) 0.017 0.3
U18 0.040 0.13 2.7 0.022 0.17 4.3
U20 0.27 4.1 0.11 0.22 7.5
U24 (753-A-OH attentively assigned) 0.039 0.6 0.042 0.040 1.9
U30 0.039 0.011 1.2
U37 0.018 0.013 0.7
9 unassigned chromatographic peaks 0.15 0.34 7.4 0.15 0.091 5.5
Organic Solvent Phase Total: 4.9 74.6 2.6 60.4%
Aqueous Phase Total: 1.4 22.0 1.0 23.7%
Total Extracted: 6.3 96.6 3.6 84.1%
Tentatively assigned: solely confirmed by chromatographic retention time U: unidentified metabolite
In wheat straw, as in wheat forage and hay, the major component (19.3% TRR,
1.78 mg eq/kg) was penthiopyrad. The largest single metabolite was PCA which accounted for 8.7% (0.802 mg eq/kg) in straw. 753-F-DO accounted for 6.4% followed by PAM (5.9%) and 753-A-OH (4.7%). Hydrolysis of the unidentified radioactivity followed by LC-MS analysis revealed mainly the malonyl glucoside of an isomer of 753-A-OH. In addition, PCA and PAM could be released. In the unextracted residue harsh treatment using acidic and basic hydrolysis released an additional 10.9% TRR. Besides PAM and PCA no additional metabolites could be identified.
In the wheat grain penthiopyrad was the largest single component accounting for 7.8% TRR. Metabolites PAM and PCA accounted for 3.7% TRR each. Further analysis of the unextracted radioactivity in grain showed a large number of components, which were all less than 0.01 mg eq/kg. Dextranase/amylase treatment released 15% TRR (0.046 mg eq/kg).
An overview of the identified metabolites in the extracts of straw and grain is presented in Table 47.
Table 47 Identification of radioactive residues in wheat straw and grain treated with P- and T-labelled penthiopyrad
Straw (2× 250 g/ ai/ha, after 2nd appl.) Grain (2× 250 g/ ai/ha, after 2nd appl.)
Organic Aqueous Total Organic Aqueous Total
mg eq/kg mg eq/kg % TRR mg eq/kg mg eq/kg % TRR
Penthiopyrad 1.7 0.079 19.3 0.023 7.8
PAM 0.55 5.9 0.011 3.7
PCA 0.38 0.43 8.7 0.011 3.7
753-F-DO 0.46 0.14 6.4 0.005 1.6
753-T-DO 0.37 0.030 4.3
U4 0.17 1.9 0.020 6.8
U5 0.002 0.7

Penthiopyrad
1409
Straw (2× 250 g/ ai/ha, after 2nd appl.) Grain (2× 250 g/ ai/ha, after 2nd appl.)
Organic Aqueous Total Organic Aqueous Total
mg eq/kg mg eq/kg % TRR mg eq/kg mg eq/kg % TRR
U6 0.37 4.1
U8 0.010 0.008 6.1
U10 (DM-PCA attentively assigned) 0.005 1.7
U13 0.013 4.4
U16 0.11 0.68 8.6 0.007 0.017 8.2
U20 0.18 0.7 9.5 0.019 0.003 7.5
U24 (753-A-OH attentively assigned) 0.19 2.1 0.001 0.3
U30 0.096 0.060 1.6
U37 0.042 0.082 1.4
9 unassigned chromatographic peaks 0.46 0.40 9.3 0.020 0.006 8.8
Organic Solvent Phase Total 4.0 43.7 0.11 36.8
Aqueous Phase Total 3.9 41.9 0.072 24.3
Total Extracted 7.9 85.6 0.18 61.1
Tentatively assigned: solely confirmed by chromatographic retention time U: unidentified metabolite
Rape seed (canola)
The metabolism of penthiopyrad in rape seed was investigated by Baker, FC (2009, PTHIO_035). Field grown rapeseed plants were treated twice with [14C]penthiopyrad (1:1 mixture of P- and T- label) at a rate of 400 g/ ai/ha each: one treatment after stem elongation and the second toward the end of flowering. Rape forage was collected 14 days after the first application. Seeds were harvested from mature plants 34 days after the second application.
Samples were extracted with methanol followed by methanol/water (7/3, v/v) and ethyl acetate. The residue was analysed by HPLC and co-chromatography with reference compounds was performed. Unextracted radioactivity in seeds was additionally treated with acidic/basic hydrolysis and enzymes.
An overview of the TRR and the radioactivity released by extraction and hydrolysis is presented in Table 48.
Table 48 Total radioactive residues and extractability in canola matrices treated with P- and T-labelled penthiopyrad
Forage (400 g ai/ha) Seeds (2× 400 g ai/ha)
mg eq/kg % TRR mg eq/kg % TRR
TRR measured 12.2 100 0.14 100 Total Neutral Extraction 11.1 91.5 0.085 61.2%
Methanol 10.8 88.6 0.044 31.7%
Methanol/Water 0.35 2.9 0.008 5.8%
Ethyl Acetate – – 0.033 23.7%
Total released from PES – – 0.056 40.3%
Methanol/HCl 0.1N – – 0.013 9.4%
Methanol/NaOH 0.1N – – 0.006 4.3%
Tetrahydrofuran – – 0.001 0.7%
Protease Digestion – – 0.015 10.8%

Penthiopyrad
1410
Forage (400 g ai/ha) Seeds (2× 400 g ai/ha)
mg eq/kg % TRR mg eq/kg % TRR
Acetone Wash – – 0.001 0.7%
Dextranase/Amylase – – 0.002 1.4%
24% KOH – – 0.018 12.9%
Unextracted 0.73 6.0 0.007 5.0%
Total extracted 11.9 97.5 0.15 106.5%
For forage, the analysis of the methanol extract showed 753-A-OH malonyl glucoside (24.8%
TRR, 3.022 mg eq/kg) as major residue. Unchanged penthiopyrad was found at 11.4% of the TRR (11.4% TRR, 1.387 mg eq/kg). Other metabolites were all below 10% of the TRR each. A summary of the characterised and identified metabolites is presented in Table 49.
Table 49 Identification of radioactive residues in canola forage treated with P- and T-labelled penthiopyrad
HPLC of ethyl acetate phase mg eq/kg % TRR Comments
Code
PAM 0.16 1.3
PCA 0.062 0.5
Penthiopyrad 1.4 11.4
DM-A-OH Malonyl Glucoside 1.1 8.9
753-A-OH Malonyl Glucoside 3.0 24.8
U19 0.15 1.2
U20 0.24 2.4 3 components separated by LC/MS
U22 0.35 2.9 2 components separated by LC/MS
U27 0.33 2.7 3 components separated by LC/MS
U29 0.33 2.7 2 components separated by LC/MS
U32 0.21 1.7
U34 0.44 3.6 2 components separated by LC/MS
U36 0.098 0.8
U39 0.19 1.6
U42 0.15 1.2
U5 0.36 3.0 1 major component separated by LC/MS
U47 0.24 2.0
U48 0.75 6.2 2 components separated by LC/MS
Minor baseline components (~ 8) 0.56 4.6
Organic Solvent Phase Total: 10.2 83.5
U: unidentified metabolite
The identification of radioactivity in the organic extract showed very low amounts of
metabolites. Only penthiopyrad and PCA were found at the LOQ of 0.001 mg eq/kg (0.7% TRR). Approximately 27.3% of the TRR (0.038 mg eq/kg) was attributed to natural lipids.

Penthiopyrad
1411
In the aqueous phase DM-PAM and PAM were attributed to two chromatographic peaks at levels of 5.0% TRR (0.007 mg eq/kg) and 7.9% TRR (0.011 mg eq/kg), respectively. PCA was found at lower amount with 2.2% TRR (0.003 mg eq/kg).
A summary of the characterisation and identification of the extracted radioactivity is presented in Table 50.
Table 50 Identification of radioactive residues in rape seeds treated with P- and T-labelled penthiopyrad
Fraction mg eq/kg % TRR
Organic Solvent Phase Total 0.008 5.8%
Penthiopyrad 0.001 0.7%
PCA 0.001 0.7%
U20 0.001 0.7%
U24 0.001 0.7%
U27 0.001 0.7%
U30 0.001 0.7%
Minor baseline components 0.002 1.4%
TLC of Hexane Phase
Natural Products (Lipids) 0.038 27.3%
Aqueous Phase Total 0.039 28.1%
PCA 0.003 2.2%
U6 (DM-PAM attentively assigned) 0.007 5.0%
U9 (PAM attentively assigned) 0.011 7.9%
U12 0.003 2.2%
U18 0.003 2.2%
U19 0.002 1.4%
U20 0.005 3.6%
U24 0.001 0.7%
U27 0.001 0.7%
Minor baseline components (approximately 14 minor components, none > 0.01 ppm) 0.003 2.2%
Total Extracted 0.085 61.2%
Tentatively assigned: solely confirmed by chromatographic retention time U: unidentified metabolite

Penthiopyrad
1412
Figure 3 Proposed metabolic pathway of penthiopyrad in plants
Environmental fate in soil
For the investigation of the environmental fate of penthiopyrad the Meeting received studies on photolysis on soil, the aerobic soil metabolism and the behaviour in confined and field rotational crops.
Soil photolysis of penthiopyrad was relatively quick with less than 50% remaining after three days. Within 15 days 4.1% of the initial concentration was recovered from the soil. Main degradation products were PAM and PCA.
In soil the metabolism was more or less comparable to the plant metabolism. In nearly all samples PAM, PCA, 753-A-OH and 753-F-DO were found at levels of 2–10% of the applied dose. DM-PCA was identified as major residue in most samples, although still being present at levels below 10% of the applied dose (in two samples up to 16.8 and 28% of the applied dose). Depending on the soil type remaining levels of penthiopyrad were between 11.1 and 77.8% of the applied dose. Estimated half-life times (1st order kinetics) were between 65 to 356 days.
Confined rotational crop studies revealed a strong degradation in follow crops. Although TRR levels up to 0.1 mg/kg in green plant parts and 0.728 mg/kg in straw were found, identification of the radioactivity showed numerous compound below the limit for identification. Traces of penthiopyrad in wheat chaff and of PCA, 753-A-OH and DM-PCA in other crops were detected.

Penthiopyrad
1413
In field rotational crop studies quantifiable residues were mainly found for DM-PCA and at lower levels for PCA.
Photolysis on soil
The photodegradation of [14C]penthiopyrad (P and T labels) on the soil surface was investigated under artificial sunlight (Mamouni, A, 2008, PTHIO_045). The two labels of the test item were applied as a mixture to a thin layer of 2 mm of a sandy loam soil on glass dishes. The actual concentration applied was 96 µg per 12.5 cm² soil sample, equivalent to a field rate of 800 g/ ai/ha. The 15 days of irradiation corresponded to about 29 days of midsummer sunlight at latitude 50°N and 27 days at latitudes 30–40°N.
The soil moisture was maintained at 75% field capacity at a temperature of 22.7 ± 1.2 °C (irradiated) and 20.2 ± 0.7 °C (dark control). Irradiated and dark control samples were taken at a range of intervals during the 15 days irradiation/incubation periods.
In irradiated samples degradation of penthiopyrad was observed, mainly forming PAM and PCA. After 10 days the parent substance was nearly completely degraded, contribution 4.3% to the TRR. A summary of the metabolic spectrum of irradiated and dark samples is presented in the following table:
Table 51 Soil photolysis of penthiopyrad
Days after application
% applied radioactivity
Penthiopyrad PAM PCA 753- F-DO
U1 U8 U11 U12 U13 14CO2
Not extracted
Total Recovery
Irradiated
0 98.3 0.0 0.0 0.0 0.0 0.0 0.0 0.0 0.0 np 0.1 98.4
1 70.3 6.3 5.3 1.8 2.1 0.4 0.0 0.0 0.0 3.6 3.9 97.9
3 44.6 13.8 9.7 3.0 2.3 1.6 1.9 0.0 0.0 9.1 6.9 97.3
5 37.0 7.5 13.9 2.9 2.2 1.4 1.8 1.6 1.0 11.0 8.9 95.8
7 12.3 24.2 22.7 1.6 1.5 0.0 1.2 0.0 0.0 17.1 10.3 95.2
10 4.3 26.7 20.2 2.2 0.0 0.0 0.8 0.0 0.0 24.1 12.3 95.8
15 4.1 24.0 17.8 3.7 0.0 0.0 0.7 0.0 0.0 25.8 11.6 94.5
Dark
0 98.3 0.0 0.0 0.0 0.0 0.0 0.0 0.0 0.0 np 0.1 98.4
1 94.8 0.0 0.0 0.0 0.0 0.0 0.0 0.0 0.0 < 0.1 0.8 95.6
3 94.6 n.d. n.d. n.d. n.d. n.d. n.d. n.d. n.d. 0.1 1.1 95.9
5 np np np np np np np np np np np np
7 93.5 0.0 0.0 0.0 0.0 0.0 0.0 0.0 0.0 0.2 2.8 96.6
10 90.6 0.0 0.0 0.0 0.0 0.0 0.0 0.0 0.0 0.5 4.5 95.7
15 92.0 0.0 0.0 0.0 0.0 0.0 0.0 0.0 0.0 0.6 3.4 96.0
np not performed n.d. not detected U: unidentified metabolite

Penthiopyrad
1414
Soil metabolism
Aerobic soil metabolism
The aerobic soil metabolism of penthiopyrad was investigated in several soil types using [14C]penthiopyrad radiolabelled in the P- and T-position of the molecule. Penthiopyrad showed a moderate degradation, mainly giving PAM, PCA and DM-PCA as degradation products. Further metabolites identified were 753-A-OH, 753-F-DO and 753-T-DO. An proposal of a metabolic pathway is presented in Figure 4.
Ref: Mamouni, A, (2008, PTHIO_046) & Gassen, M (2009, PTHIO_047) Test material: [14C]penthiopyrad (P- and T-label) Dose rate: 0.36 mg/kg each Duration: 161 days Temp: 10 °C Moisture: 29.6% maximum holding capacity Soil: Oakville, sandy clay loam pH: 5.2 Organic carbon: 1.29% Half-life (parent): 356 days (1st order) 14C accountability: 99–101.8% % penthiopyrad remaining: 77.2% after 120 days (mean of P- and T-label) % mineralisation: 1.2% after 120 days (mean of P- and T-label) % unextracted: 7.1% after 161 days (mean of P- and T-label) Metabolites Max (% TRR) Day PAM (P-label) 2.1 161 PCA (P-label) not detected 161 DM-PCA (P-label) 3.4 161 753-A-OH (mean of P- and T-label) 1.0 90 753-F-DO (mean of P- and T-label) 1.7 90 753-T-DO (mean of P- and T-label) 5.1 120 M11 (mean of P- and T-label) 1.5 161 M12 (mean of P- and T-label) 3.0 90 M20 (mean of P- and T-label) 1.5 62 Ref: Mamouni, A, (2008, PTHIO_046) & Gassen, M (2009, PTHIO_047) Test material: [14C]penthiopyrad (P- and T-label) Dose rate: 0.36 mg/kg each Duration: 161 days Temp: 20 °C Moisture: 29.6% maximum holding capacity Soil: Oakville, sandy clay loam pH: 5.2 Organic carbon: 1.29% Half-life (parent): 154 days (1st order) 14C accountability: 95.9–100.4 % % penthiopyrad remaining: 54.8% after 161 days (mean of P- and T-label) % mineralisation: 4.4% after 161 days (mean of P- and T-label) % unextracted: 14% after 120 days (mean of P- and T-label) Metabolites Max (%TRR) Day PAM (P-label) 3.0 161 PCA (P-label) 3.0 161 DM-PCA (P-label) 6.6 161 753-A-OH (mean of P- and T-label) 1.1 14 753-F-DO (mean of P- and T-label) 2.4 90 753-T-DO (mean of P- and T-label) 7.6 161 M9 (mean of P- and T-label) 1.4 28 M11 (mean of P- and T-label) 1.2 120 M12 (mean of P- and T-label) 3.5 161

Penthiopyrad
1415
M20 (mean of P- and T-label) 1.9 161 Ref: Mamouni, A, (2008, PTHIO_046) & Gassen, M (2009, PTHIO_047) Test material: [14C]penthiopyrad (P- and T-label) Dose rate: 0.36 mg/kg each Duration: 161 days Temp: 20 °C Moisture: 63.1% maximum holding capacity Soil: Senozan, silt loam pH: 6.6 Organic carbon: 1.02% Half-life (parent): 78.5 days (1st order) 14C accountability: 94.1–104.1% % penthiopyrad remaining: 31.2% after 161 days (mean of P- and T-label) % mineralisation: 8.4% after 161 days (mean of P- and T-label) % unextracted: 25.6% after 161 days (mean of P- and T-label) Metabolites Max (%TRR) Day PAM (P-label) 2.3 161 PCA (P-label) 2.4 161 DM-PCA (P-label) 16.8 120 753-A-OH (mean of P- and T-label) 7.0 62 753-F-DO (mean of P- and T-label) 1.8 90 753-T-DO (mean of P- and T-label) 2.2 120 M9 (mean of P- and T-label) 2.9 161 M10 (mean of P- and T-label) 2.0 120 M11 (mean of P- and T-label) 4.1 161 M12 (mean of P- and T-label) 2.4 161 M20 (mean of P- and T-label) 1.6 161 Ref: Mamouni, A, (2008, PTHIO_046) & Gassen, M (2009, PTHIO_047) Test material: [14C]penthiopyrad (P- and T-label) Dose rate: 0.36 mg/kg each Duration: 161 days Temp: 20 °C Moisture: 67.6% maximum holding capacity Soil: Gartenacker, loam pH: 7.3 Organic carbon: 1.7% Half-life (parent): 65 days (1st order) 14C accountability: 90.9–101.3% % penthiopyrad remaining: 11.1% after 161 days (mean of P- and T-label) % mineralisation: 13.3% after 161 days (mean of P- and T-label) % unextracted: 34.2% after 161 days (mean of P- and T-label) Metabolites Max (%TRR) Day DM-PCA (P-label) 28.0 161 753-A-OH (mean of P- and T-label) 4.6 28 753-F-DO (mean of P- and T-label) 1.1 120 753-T-DO (mean of P- and T-label) 2.7 28 M9 (mean of P- and T-label) 2.9 90 M10 (mean of P- and T-label) 1.6 90 M11 (mean of P- and T-label) 4.8 120 M12 (mean of P- and T-label) 2.0 90 M13 (mean of P- and T-label) 1.1 62 Ref: Mamouni, A, (2008, PTHIO_046) & Gassen, M (2009, PTHIO_047) Test material: [14C]penthiopyrad (P- and T-label) Dose rate: 0.36 mg/kg each Duration: 161 days Temp: 20 °C Moisture: 27.7% maximum holding capacity Soil: Bruisyard, sandy clay loam

Penthiopyrad
1416
pH: 7.3 Organic carbon: 1.92% Half-life (parent): 354 days (1st order) 14C accountability: 98.5–102% % penthiopyrad remaining: 77.8% after 161 days (mean of P- and T-label) % mineralisation: 1.4% after 161 days (mean of P- and T-label) % unextracted: 10.5% after 120 days (mean of P- and T-label) Metabolites Max (%TRR) Day PCA (P-label) 2.0 62 DM-PCA (P-label) 3.3 161 753-A-OH (mean of P- and T-label) 4.7 161 753-F-DO (mean of P- and T-label) 1.0 62 753-T-DO (mean of P- and T-label) 1.2 62, 120 M9 (mean of P- and T-label) 1.1 120 M18 (mean of P- and T-label) 1.0 90 Ref: Mamouni, A, (2008, PTHIO_048) & Gassen, M (2009, PTHIO_049, PTHIO_050) Test material: [14C]penthiopyrad (P- and T-label) Dose rate: 0.36 mg/kg each Duration: 360 days Temp: 20 °C Moisture: 40.97% maximum holding capacity Soil: Waddesdon 2, sandy loam pH: 4.5 Organic carbon: 0.4 % Half-life (parent): 102 days (1st order) 14C accountability: 93.3–99.5% % penthiopyrad remaining: 21.3% after 360 days (mean of P- and T-label) % mineralisation: 24% after 360 days (mean of P- and T-label) % unextracted: 35.5% after 269 days (mean of P- and T-label) Metabolites Max (%TRR) Day PAM (P-label) 3.9 90 PCA (P-label) 0.4 360 DM-PCA (P-label) 9.1 269 753-A-OH (mean of P- and T-label) 0.9 90 753-F-DO (mean of P- and T-label) 4.3 90 753-T-DO (mean of P- and T-label) 4.4 90 M9 (mean of P- and T-label) 1.7 360 M10 (mean of P- and T-label) traces 360 M11 (mean of P- and T-label) 2.0 155 M12 (mean of P- and T-label) 1.8 155 Ref: Satsuma, K (2005, PTHO_051) Test material: [14C]penthiopyrad (P- and T-label) Dose rate: 1.5 mg/kg each Duration: 196 days Temp: 25 °C Moisture: 71.96% maximum holding capacity Soil: Nagano, clay loam pH: 4.5 Organic carbon: 0.4 % Half-life (parent): 135 days (1st order) 14C accountability: 49.9–102.5% % penthiopyrad remaining: 34.4% after 196 days (T-label), 35.6% after 196 days (P-label) % mineralisation: 19.2% after 196 days (T-label), 15.7% after 196 days (P-label) % unextracted: 26.8% after 196 days (T-label), 23.2% after 196 days (P-label) Metabolites Max (%TRR) Day DM-PCA (P-label) 7.2 140 753-F-DO (P-label) 1.6 168 753-F-DO (T-label) 1.9 196

Penthiopyrad
1417
753-T-DO (P-label) 1.4 28 753-T-DO (T-label) 1.6 28
Figure 4 Proposed aerobic metabolic pathway of penthiopyrad in soil
Confined rotational crop studies
The metabolic fate of penthiopyrad in rotational crops was investigated by Walther, D (2009, PTHIO_036). Spinach/lettuce (as leafy vegetables), radish (as root crop) and summer/winter wheat
NN
NH2
OCF3
NN
OH
OCF3
NNH
OH
OCF3
PCA
PAM
DM-PCA
NN
SNH
OCF3
O
OH
753-T-DO
NN
ONH
OCF3
O
OH
753-F-DO
SNHN
N
OCF3
Penthiopyrad
SNHN
N
OCF3
HO
SNHN
N
OCF3
HO
O
CO2
M11
M12
SNHN
N
OCF3
OH
753-A-OH
minor route

Penthiopyrad
1418
(as small grain crop) were grown under confined conditions as model crops. The [14C]penthiopyrad, a mixture of both pyrazole-label (P-label) and thienyl-label (T-label) formulated as a suspension concentrate, was applied to the soil surface by spraying. The applications were conducted at a rate of 0.8 kg ai/ha. The treated soil was aged for three periods before planting to simulate rotational planting schemes: 30 days to simulate a crop failure, 120 days simulating planting of a second crop in the same year and 360 days simulating a yearly rotational crop cycle.
The crops were harvested after emergence (when sufficient material was available). Additionally, raw agricultural commodities for human and livestock feed plant parts were harvested as immature (pre-harvest) and mature crops.
The measurement of total radioactivity present was conducted by combustion analysis. For identification of the radioactivity, the samples were extracted at room temperature with solvents or solvents systems of various polarity: 1) hexane, once; 2) acetonitrile, once or twice; 3) methanol, up to 4 times; 4) methanol/water (1:1, v/v), up to 3 times and pooled. Some pooled extracts were selected and the organic solvent evaporated. The remaining aqueous phase was diluted with water and acidified to pH 2 with 1.0 M HCl. The acidic extracts were partitioned up to three times with ethyl acetate. Identification of radioactivity was achieved by analysis with HPLC in comparison to standard substances.
In Table 52 the TRR found in the various samples is summarized.
Table 52 Total radioactive residues in rotational crops after treatment with P- and T-labelled penthiopyrad
Interval TRR in mg/kg parent eq.
Emergence Pre-Harvest Mature plants
Spinach, leaves
30 d 0.051 0.105 0.059
120 d 0.033 0.024 0.033
360 d 0.016 0.022 0.016
Lettuce, leaves
30 d 0.049 0.049 0.068
Radish, roots
30 d 0.014 0.011 0.026
120 d 0.005 0.007 0.007
360 d 0.003 0.005 0.005
Radish, tops and leaves
30 d 0.079 0.036 0.079
120 d 0.006 0.013 0.016
360 d 0.014 0.013 0.018
Wheat, forage
30 d 0.281 0.210 –
120 d 0.138 0.059 –
360 d 0.054 0.065 –
Wheat, straw
30 d – – 0.728

Penthiopyrad
1419
Interval TRR in mg/kg parent eq.
Emergence Pre-Harvest Mature plants
120 d – – 0.158
360 d – – 0.086
Wheat, chaff
30 d – – 0.367
120 d – – 0.061
360 d – – 0.023
Wheat, grain
30 d – – 0.023
120 d – – 0.015
360 d – – 0.003
Identification of radioactivity was performed for samples with TRR levels above 0.01 mg/kg
parent equivalents. In summary the rate of identification was low, showing mainly 753-A-OH as residue present. Parent penthiopyrad was found in chaff samples from 30 day crops rotation. In addition PCA and DM-PAM were identified in some of the samples. An overview about the characterised and indentified radioactivity is presented in the tables below.
Table 53 Identification of radioactive residues in rotational crops after 30 day plant back interval
Metabolite 30 day interval, residue in mg/kg
Spinach leaves
Lettuce leaves
Radish root
Wheat chaff
Wheat grain
Radish leaves
Wheat forage
Wheat straw
Wheat chaff
Wheat grain
Emergence
Penthiopyrad
753-A-OHa
U1b 0.022 0.023 0.024 0.075
Total Extracted
0.043 0.033 0.011 – – 0.073 0.248 – – –
Pre-Harvest
PCA a 0.039
U1b 0.018 0.106
Total Extracted
0.090 0.033 0.007 – – 0.029 0.175 – – –
Mature plants
Penthiopyrad 0.020
PCAa 0.012 0.014
753-A-OHa 0.012 0.116
U1b 0.023 0.106 0.034 0.124 0.106
DM-PAM 0.012
U5 0.014

Penthiopyrad
1420
Metabolite 30 day interval, residue in mg/kg
Spinach leaves
Lettuce leaves
Radish root
Wheat chaff
Wheat grain
Radish leaves
Wheat forage
Wheat straw
Wheat chaff
Wheat grain
U6 0.014
Total Extracted
0.049 0.041 0.015 0.232 0.023 0.063 – 0.419 0.232 0.023
a Given in mg metabolite/kg plant part and corrected for the specific activity for one label. b U1 is a polar containing up to 14 components.
Table 54 Identification of radioactive residues in rotational crops after 120 and 360 day plant back intervals
Metabolite 120 day interval, residue in mg/kg 360 day interval, residue in mg/kg
Spinach leaves Wheat chaff Wheat forage Wheat straw
Emergence
753-A-OHa 0.024
U1b
Total Extracted 0.025 – 0.045 –
Pre-Harvest
U1b 0.024
Total Extracted 0.018 – 0.047 –
Mature plants
U1b 0.065
Total Extracted 0.023 0.024 – 0.065
a Given in mg metabolite/kg plant part and corrected for the specific activity for one label. b U1 is a polar containing up to 14 components.
Additional information are available from soil extracts. At all sampling intervals (1 to 469
days after treatment) unchanged penthiopyrad was the major residue, declining from 1.437 mg/kg (99.1% TRR) to a plateau of 0.018–0.023 mg/kg (18.4–41.9% TRR) after 124 days till the end of the study. Identified metabolites stayed at low levels with 753-A-OH being the major structure with a maximum of 0.019 mg/kg (15.2% TRR) after 33 days. Most of the radioactivity became unextracted, leaving a total of 0.096 mg/kg (72.5% TRR) unextracted after 469 days. The results of the analysis of soil samples are presented in Table 55.
Table 55 Identification of radioactive residues in soil
Soil Plot I (0–30 cm)
Days after treatment
1 33 58 124 376 433 469
Identified metabolites, mg/kg (% TRR)
Penthiopyrad 1.437 (99.1)
0.031 (24.8) 0.046 (57.8) 0.019 (41.9) 0.023 (34.5) 0.019 (25.4) 0.018 (18.4)
PCA < 0.001 (< 0.1)
< 0.001 (< 0.1)
0.003 (2.9) < 0.001 (< 0.1)
< 0.001 (< 0.1)
< 0.001 (< 0.1)
< 0.001 (< 0.1)

Penthiopyrad
1421
Soil Plot I (0–30 cm)
Days after treatment
1 33 58 124 376 433 469
DM-PCA < 0.001 (< 0.1)
0.0010 (5.1) 0.009 (8.0) 0.003 (4.1) < 0.001 (< 0.1)
< 0.001 (< 0.1)
< 0.001 (< 0.1)
753-A-OH < 0.001 (< 0.1)
0.019 (15.2) 0.004 (4.8) 0.002 (3.8) 0.005 (6.8) < 0.001 (< 0.1)
< 0.001 (< 0.1)
Unidentified metabolites, mg/kg (% TRR)
Unknown total < 0.001 (< 0.1)
0.048 (38.0) 0.003 (4.0) 0.005 (11.3) < 0.001 (< 0.1)
0.009 (11.8) 0.009 (9.1)
Amount of extracted and unextracted, mg/kg (% TRR)
Extracted 1.861 (99.1) 0.129 (83.1) 0.258 (77.5) 0.172 (61.1) 0.049 (41.3) 0.053 (37.3) 0.036 (27.5)
Unextracted 0.016 (0.9) 0.026 (16.9) 0.075 (22.5) 0.110 (38.9) 0.069 (58.7) 0.089 (62.7) 0.096 (72.5)
Totals, mg/kg (% TRR)
Total recoverya 1.877 (100.0)
0.155 (100.0)
0.334 (100.0)
0.282 (100.0)
0.118 (100.0)
0.143 (100.0)
0.133 (100.0)
a Total recovery is the total extracted + remaining unextracted 14C-residues

Penthiopyrad
1422
Figure 5 Proposed metabolic pathway of penthiopyrad in rotational crops
Field crop rotation studies
For the investigation of residues in follow crops under field conditions several trials conducted in Europe and in the United States of America were submitted.
In a study conducted by Old, J (2009, PTHIO_041, PTHIO_042) cucumbers in Southern Europe (Site 1) and barley in Northern Europe (Site 2) were treated with penthiopyrad at rates of 2× 0.4 kg ai/ha. For cucumbers treatment occurred 6 and 1 day before harvest, for barley at BBC 39 and 69. After removal of the primary crops radish (Site 1 + 2), lettuce (Site 1), spinach (Site 2), wheat (Site 1) and Barley (Site 2) were planted at a target plant back intervals of 30, 60, 120 and 365 days.
NN
NH2
OCF3
NN
OH
OCF3
NNH
OH
OCF3
PCA
PAM
DM-PCA
NN
SNH
OCF3
O
OH
753-T-DO
NN
ONH
OCF3
O
OH
753-F-DO
SNHN
N
OCF3
Penthiopyrad
CO2
Oxidation at thienyl ring
Hydroxylationat alkyl chain
OxidationMicrobial or Photochemical
SNHN
N
OCF3
OH
753-A-OH
Hydrolysis of amide
Demethylation
Mineralization
+ T-label metabolites
CO2

Penthiopyrad
1423
All samples were analysed for parent penthiopyrad and its metabolites PAM, PCA, DM-PCA, 753-A-OH and 753-F-DO. An overview of the results is presented in Table 56.
Table 56 Residues of penthiopyrad and its metabolites in rotational crops under field condition in Europe
Crop Plantback interval (days)
Commodity Residue in mg/kg (extrapolated below LOQ)
Penthiopyrad PAM 753-A-OH PCA DM-PCA 753-F-DO
Site 1: Spain, Los Palacios, Andalacia, 2007, 2× 0.4 kg ai/ha to cucumbers (6 and 1 day before harvest)
Lettuce 30 50% mature < 0.01 < 0.01 < 0.01 0.016 0.1 < 0.01
mature < 0.01 < 0.01 < 0.01 0.012 < 0.05 (0.03) < 0.01
65 50% mature < 0.01 < 0.01 < 0.01 < 0.01 (0.008)
0.075 < 0.01
mature < 0.01 < 0.01 < 0.01 < 0.01 < 0.05 (0.03) < 0.01
122 50% mature < 0.01 < 0.01 < 0.01 < 0.01 < 0.05 (0.03) < 0.01
mature < 0.01 < 0.01 < 0.01 < 0.01 < 0.05 < 0.01
Radish 30 Tops < 0.01 < 0.01 < 0.01 < 0.01 (0.003)
0.03 < 0.01
Roots < 0.01 < 0.01 < 0.01 < 0.01 < 0.01 < 0.01
65 Tops < 0.01 < 0.01 < 0.01 < 0.01 0.049 < 0.01
Roots < 0.01 < 0.01 < 0.01 < 0.01 < 0.01 < 0.01
122 Tops < 0.01 < 0.01 < 0.01 < 0.01 0.033 < 0.01
Roots < 0.01 < 0.01 < 0.01 < 0.01 < 0.01 < 0.01
Wheat 30 Whole plant < 0.05 < 0.05 < 0.05 < 0.05 (0.04)
0.33 < 0.05
Hay < 0.05 < 0.05 < 0.05 < 0.05 0.05 < 0.05
Straw < 0.05 < 0.05 < 0.05 < 0.05 0.1 < 0.05
Grain < 0.01 < 0.01 < 0.01 < 0.01 < 0.01 < 0.01
65 Whole plant < 0.05 < 0.05 < 0.05 < 0.05 (0.02)
0.16 < 0.05
Hay < 0.05 < 0.05 < 0.05 < 0.05 < 0.05 (0.04) < 0.05
Straw < 0.05 < 0.05 < 0.05 < 0.05 0.15 < 0.05
Grain < 0.01 < 0.01 < 0.01 < 0.01 < 0.01 (0.004)
< 0.01
122 Whole plant < 0.05 < 0.05 < 0.05 < 0.05 < 0.05 (0.04) < 0.05
Hay < 0.05 < 0.05 < 0.05 < 0.05 < 0.05 (0.03) < 0.05
Straw < 0.05 < 0.05 < 0.05 < 0.05 0.051 < 0.05
Grain < 0.01 < 0.01 < 0.01 < 0.01 < 0.01 < 0.01
366 Whole plant < 0.05 < 0.05 < 0.05 < 0.05 < 0.05 < 0.05
Hay < 0.05 < 0.05 < 0.05 < 0.05 < 0.05 < 0.05
Straw < 0.05 < 0.05 < 0.05 < 0.05 < 0.05 (0.02) < 0.05
Grain < 0.01 < 0.01 < 0.01 < 0.01 < 0.01 < 0.01

Penthiopyrad
1424
Crop Plantback interval (days)
Commodity Residue in mg/kg (extrapolated below LOQ)
Penthiopyrad PAM 753-A-OH PCA DM-PCA 753-F-DO
Site 2: UK, Tranent, Scotland, 2× 0.4 kg ai/ha to barley (BBCH 39 and 69)
Spinach 32 50% mature < 0.01 < 0.01 < 0.01 < 0.01 < 0.05 < 0.01
mature < 0.01 (0.004) < 0.01 < 0.01 < 0.01 < 0.05 < 0.01
62 50% mature 0.011 < 0.01 (0.004)
< 0.01 < 0.01 < 0.05 < 0.01
mature < 0.01 (0.006) < 0.01 < 0.01 < 0.01 < 0.05 < 0.01
122 50% mature < 0.01 < 0.01 < 0.01 < 0.01 < 0.05 (0.02) < 0.01
mature < 0.01 < 0.01 < 0.01 < 0.01 < 0.05 (0.03) < 0.01
Radish 32 Tops < 0.01 < 0.01 < 0.01 < 0.01 < 0.01 (0.008)
< 0.01
Roots < 0.01 (0.005) < 0.01 < 0.01 < 0.01 < 0.01 < 0.01
62 Tops < 0.01 (0.004) < 0.01 < 0.01 < 0.01 < 0.01 (0.009)
< 0.01
Roots 0.017 < 0.01 < 0.01 < 0.01 < 0.01 < 0.01
122 Tops < 0.01 < 0.01 < 0.01 < 0.01 0.02 < 0.01
Roots < 0.01 < 0.01 < 0.01 < 0.01 < 0.01 < 0.01
Barley 32 Whole plant < 0.05 < 0.05 < 0.05 < 0.05 < 0.05 < 0.05
Hay < 0.05 < 0.05 < 0.05 < 0.05 (0.02)
< 0.05 < 0.05
Straw < 0.05 < 0.05 < 0.05 < 0.05 < 0.05 < 0.05
Grain < 0.01 < 0.01 < 0.01 < 0.01 < 0.01 < 0.01
62 Whole plant < 0.05 < 0.05 < 0.05 < 0.05 < 0.05 < 0.05
Hay < 0.05 < 0.05 < 0.05 < 0.05 < 0.05 < 0.05
Straw < 0.05 < 0.05 < 0.05 < 0.05 < 0.05 < 0.05
Grain < 0.01 < 0.01 < 0.01 < 0.01 < 0.01 < 0.01
122 Whole plant < 0.05 < 0.05 < 0.05 < 0.05 < 0.05 < 0.05
Hay < 0.05 < 0.05 < 0.05 < 0.05 < 0.05 < 0.05
Straw < 0.05 < 0.05 < 0.05 < 0.05 < 0.05 < 0.05
Grain < 0.01 < 0.01 < 0.01 < 0.01 < 0.01 < 0.01
402 Whole plant < 0.05 < 0.05 < 0.05 < 0.05 < 0.05 < 0.05
Hay < 0.05 < 0.05 < 0.05 < 0.05 < 0.05 < 0.05
Straw < 0.05 < 0.05 < 0.05 < 0.05 < 0.05 (0.02) < 0.05
Grain < 0.01 < 0.01 < 0.01 < 0.01 < 0.01 < 0.01
50% mature: approximately 50% of the crop were at a stage of commercial harvest
A second study on the behaviour of penthiopyrad in follow crops under field conditions was
conducted by Shepard E (2009, PTHIO_043, PTHIO_044) in the United States of America and in Canada. In a total of six supervised trials radish, lettuce and wheat were planted as rotational crops with plant back intervals of 30, 60 and 365 days. Application rate were 4× 0.245 kg ai/ha for a total

Penthiopyrad
1425
annual rate of 0.98–1.05 kg ai/ha. Samples were analysed for residues of parent penthiopyrad, PAM, PCA, 753-A-OH, DM-PCA and 753-F-DO. The results of the field trials are presented in Table 57.
Table 57 Residues of penthiopyrad and its metabolites in rotational crops under field condition in the United States and Canada
Crop Plant back interval (days)
Commodity Residue in mg/kg
Penthiopyrad PAM 753-A-OH PCA DM-PCA 753-F-DO
Trial 01, USA (Florida)
Lettuce 30 50% mature < 0.01 0.03 < 0.01 0.012 0.055 < 0.01
mature < 0.01 0.01 < 0.01 < 0.01 (0.005)
0.03 < 0.01
60 50% mature < 0.01 < 0.01 (0.008)
< 0.01 < 0.01 0.01 < 0.01
mature < 0.01 < 0.01 (0.005)
< 0.01 < 0.01 < 0.01 (0.008)
< 0.01
336 50% mature < 0.01 < 0.01 < 0.01 < 0.01 < 0.01 < 0.01
mature Not sampled
Radish 30 Tops < 0.01 0.064 < 0.01 < 0.01 0.049 < 0.01
Roots < 0.01 < 0.01 (0.009)
< 0.01 < 0.01 < 0.01 (0.006)
< 0.01
60 Not sampled
336 Tops < 0.01 < 0.01 < 0.01 < 0.01 < 0.01 < 0.01
Roots < 0.01 < 0.01 < 0.01 < 0.01 < 0.01 < 0.01
Trial 02, USA (California)
Lettuce 30 50% mature < 0.01 < 0.01 < 0.01 < 0.01 0.018 < 0.01
mature < 0.01 < 0.01 < 0.01 < 0.01 0.015 < 0.01
60 50% mature < 0.01 < 0.01 (0.003)
< 0.01 < 0.01 (0.007)
0.038 < 0.01
mature < 0.01 < 0.01 < 0.01 < 0.01 0.025 < 0.01
300 50% mature < 0.01 < 0.01 < 0.01 < 0.01 < 0.01 (0.009)
< 0.01
mature < 0.01 < 0.01 < 0.01 < 0.01 0.015 < 0.01
Radish 30 Tops < 0.01 0.055 < 0.01 < 0.01 0.087 < 0.01
Roots < 0.01 < 0.01 (0.003)
< 0.01 < 0.01 (0.007)
0.011 < 0.01
60 Tops < 0.01 0.01 < 0.01 < 0.01 0.04 < 0.01
Roots < 0.01 < 0.01 < 0.01 < 0.01 (0.004)
< 0.01 < 0.01
300 Tops < 0.01 0.019 < 0.01 < 0.01 0.043 < 0.01

Penthiopyrad
1426
Crop Plant back interval (days)
Commodity Residue in mg/kg
Penthiopyrad PAM 753-A-OH PCA DM-PCA 753-F-DO
Roots < 0.01 < 0.01 < 0.01 < 0.01 < 0.01 < 0.01
Trial 03, USA (Iowa)
Wheat 30 Forage < 0.01 < 0.01 < 0.01 < 0.01 0.017 < 0.01
Hay < 0.01 < 0.01 < 0.01 < 0.01 < 0.01 < 0.01
Grain < 0.01 < 0.01 < 0.01 < 0.01 < 0.01 < 0.01
Straw < 0.01 < 0.01 < 0.01 < 0.01 < 0.01 < 0.01
60 Forage < 0.01 < 0.01 < 0.01 < 0.01 0.036 < 0.01
Hay < 0.01 < 0.01 < 0.01 < 0.01 0.05 < 0.01
Grain < 0.01 < 0.01 < 0.01 < 0.01 < 0.01 < 0.01
Straw < 0.01 < 0.01 < 0.01 < 0.01 < 0.01 < 0.01
381 Forage < 0.01 < 0.01 < 0.01 < 0.01 < 0.01 < 0.01
Hay < 0.01 < 0.01 < 0.01 < 0.01 < 0.01 < 0.01
Grain < 0.01 < 0.01 < 0.01 < 0.01 < 0.01 < 0.01
Straw < 0.01 < 0.01 < 0.01 < 0.01 < 0.01 < 0.01
Trial 04, Canada (Ontario)
Wheat 31 Forage < 0.01 < 0.01 < 0.01 < 0.01 0.02 < 0.01
Hay < 0.01 < 0.01 < 0.01 < 0.01 0.02 < 0.01
Grain < 0.01 < 0.01 < 0.01 < 0.01 < 0.01 < 0.01
Straw < 0.01 < 0.01 < 0.01 < 0.01 0.05 < 0.01
62 Forage < 0.01 < 0.01 < 0.01 < 0.01 0.049 < 0.01
Hay < 0.01 < 0.01 < 0.01 < 0.01 0.03 < 0.01
Grain < 0.01 < 0.01 < 0.01 < 0.01 < 0.01 < 0.01
Straw < 0.01 < 0.01 < 0.01 < 0.01 0.071 < 0.01
380 Forage < 0.01 < 0.01 < 0.01 < 0.01 < 0.01 < 0.01
Hay < 0.01 < 0.01 < 0.01 < 0.01 < 0.01 < 0.01
Grain < 0.01 < 0.01 < 0.01 < 0.01 < 0.01 < 0.01
Straw < 0.01 < 0.01 < 0.01 < 0.01 < 0.01 < 0.01
Trial 05, Canada (Ontario)
Radish 8 Tops < 0.01 < 0.01 (0.009)
< 0.01 < 0.01 (0.007)
0.12 < 0.01
Roots 0.019 < 0.01 < 0.01 < 0.01 (0.008)
0.011 < 0.01
60 Tops < 0.01 < 0.01 < 0.01 < 0.01 0.074 < 0.01
Roots < 0.01 < 0.01 < 0.01 < 0.01 < 0.01 < 0.01

Penthiopyrad
1427
Crop Plant back interval (days)
Commodity Residue in mg/kg
Penthiopyrad PAM 753-A-OH PCA DM-PCA 753-F-DO
(0.006)
Trial 06, USA (New York)
Radish 30 Tops < 0.01 < 0.01 (0.008)
< 0.01 < 0.01 0.029 < 0.01
Roots < 0.01 < 0.01 < 0.01 < 0.01 < 0.01 < 0.01
60 Tops < 0.01 < 0.01 < 0.01 < 0.01 < 0.01 < 0.01
Roots < 0.01 < 0.01 < 0.01 < 0.01 < 0.01 < 0.01
50% mature: approximately 50% of the crop were at a stage of comercial harvest
Field dissipation studies
Field dissipation studies for penthiopyrad and DM-PCA were not submitted to the Meeting. However confined and field rotational crop studies suggest that no significant uptake of residues from soil into succeeding crops occurs.
RESIDUE ANALYSIS
Analytical methods
A number of analytical methods have been reported for the analysis of penthiopyrad, PAM, PCA, 753-A-OH, 753-F-DO and DM-PCA in plant and animal matrices. The basic approach employs extraction by homogenisation with acetone/water or acetonitrile/water. After partitioning against an organic solvent (normally ethyl acetate) the extract cleaned with GPC or directly used for analysis. Residues are determined by liquid chromatography (LC) in combination with tandem mass spectroscopy (MS/MS). Validated LOQs for all analytes were 0.01 mg/kg for plant and animal matrices.
For the application of multi-residue methods the DFG S-19 was tested with satisfactory recoveries for parent penthiopyrad. The metabolites PCA, PAM and DM-PCA can not be analysed with acceptable recoveries by the DFG S-19 method.
Samples of plant origin
Reference: Rzepka, S (2008, PTHIO_052), Rzepka, S (2008, PTHIO_053), Daneva, E (2009, PTHIO_054), Mayer, M (2009, PTHIO_055)
Method: DFG Method S19
Commodities: Oranges, grapes, oilseed rape, wheat (straw)
Analytes: penthiopyrad, PAM, PCA, 753-A-OH, DM-PCA
LOQ: 0.01 mg/kg
Determination: LC-MS/MS
Description: Specimen material was extracted with acetone. Water was added before-hand in an amount that takes full account of the natural water content of the specimen so that during extraction the acetone/water ratio remains constant at 2:1 v/v. For liquid-liquid partition ethyl

Penthiopyrad
1428
acetate/cyclohexane (1:1, v/v) and sodium chloride were added and after repeated mixing excess water was separated. The oil seed rape (seeds) sample material was mixed intensely with synthetic calcium silicate after addition of acetone and acetonitrile.
The extract was evaporated and an aliquot of the remaining residue of the organic phase was cleaned up by gel permeation chromatography (GPC) using a mixture of ethyl acetate/ cyclohexane (1:1, v/v) as eluent. The residue-containing fraction was concentrated and analysed for residues of penthiopyrad and its metabolites (PCA, 753-A-OH, PAM and DM-PCA) using LC-MS/MS.
Table 58 Recoveries of penthiopyrad and its metabolites in samples of plant origin (DFG Method S19)
Matrix/Analyte Fortification levels (mg/kg)
No. Mean recovery (%)
Standard deviation (%)
Relative standard deviation (%)
Reference (Author, Year)
Wheat, straw penthiopyrad 753-A-OH PAM PCA DM-PCA
0.01 0.1 0.01 0.1 0.01 0.1 0.01 0.1 0.01 0.1
5 5 5 5 5 5 5 5 5 5
89 87 105 100 91 91 np np 0 4
11 5.1 12 6.3 1.8 5.3 – – – 1.5
12 6 11 6 2 6 – – – 35
Rzepka, S (2008, PTHIO_052)
Oilseed rape penthiopyrad 753-A-OH PAM PCA DM-PCA
0.01 0.1 0.01 0.1 0.01 0.1 0.01 0.1 0.01 0.1
5 5 5 5 5 5 5 5 5 5
97 102 94 99 74 73 0 2 0 0
5.2 11 6.0 6.2 7.6 6.6 – 2.5 – –
5 11 6 6 10 9 – 138 – –
Rzepka, S (2008, PTHIO_053)
Orange, whole fruits penthiopyrad 753-A-OH PAM PCA DM-PCA
0.01 0.1 0.01 0.1 0.01 0.1 0.01 0.1 0.01 0.1
5 5 5 5 5 5 5 5 5 5
100 89 107 101 92 78 43 3 0 0
6.5 3.7 8.9 9.3 12 3.6 27 0.5 – –
7 4 8 9 13 5 62 21 – –
Daneva, E (2009, PTHIO_054)
Grapes penthiopyrad 753-A-OH PAM PCA DM-PCA
0.01 0.1 0.01 0.1 0.01 0.1 0.01 0.1 0.01 0.1
5 5 5 5 5 5 5 5 5 5
97 89 90 80 89 90 0 4 0 2
5.4 2.7 9.9 7.5 7.2 2.9 – 0.7 – 1.1
6 3 11 9 8 3 – 18 – 105
Daneva, E (2009, PTHIO_054)
Wheat, straw penthiopyrad 753-A-OH
0.01 0.1 0.01
5 5 5
83 89 70
4.3 4.8 5.4
5 6 12
Mayer, M (2009, PTHIO_055) Independent

Penthiopyrad
1429
Matrix/Analyte Fortification levels (mg/kg)
No. Mean recovery (%)
Standard deviation (%)
Relative standard deviation (%)
Reference (Author, Year)
PAM
0.1 0.01 0.1
5 5 5
84 70 72
9.6 6.1 2.3
6 9 3
laboratory validation
Grapes penthiopyrad 753-A-OH PAM
0.01 0.1 0.01 0.1 0.01 0.1
5 5 5 5 5 5
89 99 87 90 80 87
5.8 3.1 4.2 2.6 5.7 2.6
7 3 5 3 7 3
Mayer, M (2009, PTHIO_055) Independent laboratory validation
n.a. not analysed
Reference: Ballard, TD (2009, PTHIO_056)
Method: United States Food and Drug Administration (FDA) Multiresidue Method (MRM)
Description: This study evaluated the capability of the FDA MRM protocols to analyze residues of penthiopyrad and its metabolites in non-fatty and fatty-food. This evaluation of penthiopyrad and its metabolites was conducted in accordance with the FDA Decision Tree for multi-residue testing, and it was also used as a guide to direct the analyst to the most appropriate Pesticide Analytical Manual I protocols for the chemical being tested according to the results obtained as each protocol is completed.
Protocol A: No response to fluorescence detection.
Protocol B: No chromatography after methylation.
Protocol C: This protocol evaluates penthiopyrad and its four metabolites using three GC detection systems; one specific DG-17 and two nonspecific DG-1 and DG-7. For the Module DG1 and DG7 the data collection system was set so that 0.15 ng of chlorpyrifos gave a 50% full-scale deflection (FSD) response. For the Module DG17 the data collection system was set so that 1.5 ng of chlorpyrifos gave a 50% FSD response:
Protocol D: This protocol includes methods, which are generally applicable to non-ionic chemicals, which are detectable by electron capture, nitrogen, and/or phosphorus-selective detectors. Furthermore, the methods of protocol D are applicable to a variety of crops, grouped into non-fatty foods for purposes of the Multiresidue Testing requirements. Parent penthiopyrad showed no acceptable recovery, ranging from 69–228% without cleanup and less than 1% with Florosil cleanup. PCA and PAM gave satisfactory recoveries (82–128%), however no Clean-Up using Florosil was investigated.
Protocol E: Protocol E includes methods, which are generally applicable to relatively nonpolar chemicals, although many chemicals can be recovered through this method. The methods described by Protocol E, are applicable to non-fatty foods. This protocol consists of recovery through a Florisil cleanup and recovery through complete method. Neither penthiopyrad nor its metabolites can be analysed with this protocol.
Protocol F: Protocol F includes methods, which are generally applicable to relatively nonpolar chemicals, although many chemicals can be recovered through this method. The methods described by Protocol F are applicable to fatty foods. This protocol consists of recovery through a FlorisilR clean-up and recovery through complete method. PAM was the only compound which showed sufficient sensitivity, however since PAM was not recovered through the C1 or C2 Florisil cleanup procedures, the testing was terminated.

Penthiopyrad
1430
Reference: Bell, A (2008, PTHIO_057), Stry, JJ (2009, PTHIO_058), Stry, JJ (2009, PTHIO_059), Sadgrove, L (2009, PTHIO_060, ILV)
Method: CEMR 3727
Commodities: Almonds (nutmeat and hulls), apples (fruits, dry pomace and juice), beans, cherry, cucumber, grapes (dry pomace, fruits, juice and raisins), lettuce, melon (peel and pulp), oilseed rape (seeds, oil and press cake), oranges, peach, peanuts (nutmeat, hay and meal, refined oil), peas (dry seeds, hay and vines), pecans (nutmeat), plums (fruits and prunes), potatoes, radish roots, sunflower oil, wheat (forage, grain and straw)
Analytes: penthiopyrad (m/z 358 → 149), PAM (m/z 194 → 174), PCA (m/z 193 → 109), 753-A-OH (m/z 374 → 224), 753-F-DO (m/z 374 → 193), DM-PCA (m/z 179 → 159)
LOQ: 0.01 mg/kg (except for dry grape pomace, pea hay & vines, peanut hay, rapeseed press cake, wheat forage & straw: LOQ = 0.05 mg/kg)
Determination: LC-MS/MS
Description: The samples are extracted with acetonitrile/water (4:1, v/v). After centrifugation and removal of the organic solvent, the aqueous layer is acidified with hydrochloric acid in order to hydrolyse conjugates, and then partitioned with ethyl acetate. The ethyl acetate phase is then evaporated and the extract is re-dissolved in methanol/deionised water (50:50, v/v) for LC-MS/MS analysis. Quantitation is performed by the external standardisation with bracketing standards.
Table 59 Recoveries of penthiopyrad and its metabolites in samples of plant origin (CEMR 3727)
Matrix/Analyte Fortification levels (mg/kg)
No. Mean recovery (%)
Standard deviation (%)
Relative standard deviation (%)
Reference (Author, Year)
Oil seed rape Penthiopyrad PCA PAM 753-A-OH 753-F-DO DM-PCA
0.01 0.1 0.01 0.1 0.01 0.1 0.01 0.1 0.01 0.1 0.01 0.1
4 5 5 5 5 5 5 5 5 5 5 5
90 81 91 95 86 89 107 93 102 96 96 95
12.1 1.1 6.3 3.6 9.5 9.0 1.0 2.5 4.2 2.5 2.5 3.2
13 1 7 4 11 10 1 3 4 3 3 3
Bell, A 2008 (PTHIO_057)
Sunflower oil Penthiopyrad PCA PAM 753-A-OH 753-F-DO DM-PCA
0.01 0.1 0.01 0.1 0.01 0.1 0.01 0.1 0.01 0.1 0.01 0.1
5 5 5 5 5 5 5 5 5 5 5 5
88 83 95 92 91 95 84 84 95 91 99 97
2.6 4.1 3.6 4.4 8.8 7.4 2.7 3.8 2.8 2.7 3.5 3.8
3 5 4 5 10 8 3 5 3 3 4 4
Bell, A 2008 (PTHIO_057)
Oranges Penthiopyrad PCA PAM
0.01 0.1 0.01 0.1 0.01
5 4 5 4 5
87 89 99 95 87
10.2 4.9 3.1 4.2 3.2
12 6 3 4 4
Bell, A 2008 (PTHIO_057)

Penthiopyrad
1431
Matrix/Analyte Fortification levels (mg/kg)
No. Mean recovery (%)
Standard deviation (%)
Relative standard deviation (%)
Reference (Author, Year)
753-A-OH 753-F-DO DM-PCA
0.1 0.01 0.1 0.01 0.1 0.01 0.1
4 5 5 5 5 5 5
87 95 100 95 92 105 96
5.7 3.7 10.6 5.4 2.5 3.7 12.4
7 4 11 6 3 4 13
Grapes Penthiopyrad PCA PAM 753-A-OH 753-F-DO DM-PCA
0.01 0.1 0.01 0.1 0.01 0.1 0.01 0.1 0.01 0.1 0.01 0.1
5 5 5 5 5 5 5 5 5 4 5 5
98 99 97 98 91 96 102 101 103 100 92 99
4.7 2.8 7.4 6.4 4.3 4.4 4.1 3.7 2.9 4.0 6.4 6.2
5 3 8 7 5 5 4 4 3 4 7 6
Bell, A 2008 (PTHIO_057)
Pea hay Penthiopyrad PCA PAM 753-A-OH 753-F-DO DM-PCA
0.05 0.5 0.05 0.5 0.05 0.5 0.05 0.5 0.05 0.5 0.05 0.5
5 5 5 5 5 5 5 5 5 5 5 5
82 76 85 81 92 82 81 79 83 81 82 89
4.8 1.8 6.4 6.0 8.6 3.5 1.3 1.7 1.5 1.9 6.4 5.7
6 2 8 7 9 4 2 2 2 2 8 6
Bell, A 2008 (PTHIO_057)
Lettuce Penthiopyrad PCA PAM 753-A-OH 753-F-DO DM-PCA
0.01 0.1 0.01 0.1 0.01 0.1 0.01 0.1 0.01 0.1 0.01 0.1
5 5 5 5 5 5 5 5 5 5 5 5
79 76 89 90 109 85 96 93 88 84 94 100
4.0 4.4 2.2 3.0 3.5 3.7 3.0 3.1 1.2 1.8 4.2 7.1
5 6 2 3 3 4 3 3 1 2 4 7
Stry, JJ 2009 (PTHIO_058)
Apples Penthiopyrad PCA PAM 753-A-OH 753-F-DO DM-PCA
0.01 0.1 0.01 0.1 0.01 0.1 0.01 0.1 0.01 0.1 0.01 0.1
5 5 5 5 5 5 5 5 5 5 5 5
85 80 84 70 88 84 103 99 91 89 87 114
7.9 8.3 1.9 2.8 5.4 2.5 3.2 5.0 1.3 3.3 8.4 7.3
9 10 2 4 6 3 3 5 1 4 10 6
Stry, JJ 2009 (PTHIO_058)

Penthiopyrad
1432
Matrix/Analyte Fortification levels (mg/kg)
No. Mean recovery (%)
Standard deviation (%)
Relative standard deviation (%)
Reference (Author, Year)
Potatoes Penthiopyrad PCA PAM 753-A-OH 753-F-DO DM-PCA
0.01 0.1 0.01 0.1 0.01 0.1 0.01 0.1 0.01 0.1 0.01 0.1
5 5 5 5 5 5 5 5 5 5 5 5
82 76 85 87 89 84 106 91 85 78 95 101
3.2 3.2 3.7 1.5 2.0 5.5 5.0 2.7 1.3 1.9 8.9 3.5
4 4 4 2 2 6 5 3 2 3 9 4
Stry, JJ 2009 (PTHIO_058)
Grapes Penthiopyrad PCA PAM 753-A-OH 753-F-DO DM-PCA
0.01 0.1 0.01 0.1 0.01 0.1 0.01 0.1 0.01 0.1 0.01 0.1
5 5 5 5 5 5 5 5 5 5 5 5
86 80 81 85 80 80 83 82 n.a. n.a. 94 85
7.6 7.0 5.7 10.2 4.3 8.8 3.9 4.1 n.a. n.a. 5.2 8.1
9 9 7 12 5 11 5 5 n.a. n.a. 6 10
Stry, JJ 2009 (PTHIO_058)
Dried beans Penthiopyrad PCA PAM 753-A-OH 753-F-DO DM-PCA
0.01 0.1 0.01 0.1 0.01 0.1 0.01 0.1 0.01 0.1 0.01 0.1
5 5 5 5 5 5 5 5 5 5 5 5
100 98 92 97 86 100 90 101 79 85 86 95
3.4 0.8 6.7 3.1 4.5 5.3 3.7 7.5 1.9 3.9 3.8 5.0
3 1 7 3 5 5 4 7 2 5 4 5
Stry, JJ 2009 (PTHIO_058)
Dry grape pomace Penthiopyrad PCA PAM 753-A-OH 753-F-DO DM-PCA
0.05 0.1 0.05 0.1 0.05 0.1 0.05 0.1 0.05 0.1 0.05 0.1
5 5 5 5 5 5 5 5 5 5 5 5
97 97 90 73 71 71 96 95 103 97 88 82
6.1 3.5 3.9 5.9 2.2 1.3 4.9 12 3.7 3.5 2.9 5.9
6 4 4 8 3 2 5 13 4 4 3 7
Stry, JJ 2009 (PTHIO_058)
Grape juice Penthiopyrad PCA PAM 753-A-OH
0.01 0.1 0.01 0.1 0.01 0.1 0.01
5 5 5 5 5 5 5
95 83 73 82 87 76 94
2.9 1.6 5.5 3.3 6.3 2.8 1.6
3 2 8 4 7 4 2
Stry, JJ 2009 (PTHIO_058)

Penthiopyrad
1433
Matrix/Analyte Fortification levels (mg/kg)
No. Mean recovery (%)
Standard deviation (%)
Relative standard deviation (%)
Reference (Author, Year)
753-F-DO DM-PCA
0.1 0.01 0.1 0.01 0.1
5 5 5 5 5
86 96 97 93 85
4.5 4.3 3.3 1.7 3.5
5 5 3 2 4
Raisins Penthiopyrad PCA PAM 753-A-OH 753-F-DO DM-PCA
0.01 0.1 0.01 0.1 0.01 0.1 0.01 0.1 0.01 0.1 0.01 0.1
5 5 5 5 5 5 5 5 5 5 5 5
78 75 101 73 82 76 90 77 83 84 87 86
3.3 1.4 5.3 3.0 3.7 2.8 4.0 2.6 2.2 1.7 3.3 2.4
4 2 5 4 5 4 4 3 3 2 4 3
Stry, JJ 2009 (PTHIO_058)
Oilseed rape Penthiopyrad PCA PAM 753-A-OH 753-F-DO DM-PCA
0.01 0.1 0.01 0.1 0.01 0.1 0.01 0.1 0.01 0.1 0.01 0.1
5 5 5 5 5 5 5 5 5 5 5 5
96 85 91 108 80 80 100 93 106 99 106 117
5.4 3.7 9.2 9.3 4.2 1.4 3.1 3.0 3.6 5.9 1.9 7.9
6 4 10 9 5 2 3 3 3 6 2 7
Stry, JJ 2009 (PTHIO_058)
Rapeseed oil Penthiopyrad PCA PAM 753-A-OH 753-F-DO DM-PCA
0.01 0.1 0.01 0.1 0.01 0.1 0.01 0.1 0.01 0.1 0.01 0.1
5 5 5 5 5 5 5 5 5 5 5 5
98.3 88.4 87.3 89.2 102 104 101 92.3 107 107 97 99
2.3 5.1 3.8 4.7 6.3 5.3 3.5 5.8 3.2 8.4 1.9 5.1
2 6 4 5 6 5 4 6 3 8 2 5
Stry, JJ 2009 (PTHIO_058)
Wheat grain Penthiopyrad PCA PAM 753-A-OH 753-F-DO DM-PCA
0.01 0.1 0.01 0.1 0.01 0.1 0.01 0.1 0.01 0.1 0.01 0.1
5 5 5 5 5 5 5 5 5 5 5 5
99 95 79 72 93 94 90 86 96 100 85 83
2.2 4.3 4.0 3.1 4.0 5.8 1.6 4.8 3.1 4.3 4.7 2.4
2 5 5 4 4 6 2 6 3 4 6 3
Stry, JJ 2009 (PTHIO_058)
Wheat straw Penthiopyrad
0.05
5
85
9.0
11
Stry, JJ 2009 (PTHIO_058)

Penthiopyrad
1434
Matrix/Analyte Fortification levels (mg/kg)
No. Mean recovery (%)
Standard deviation (%)
Relative standard deviation (%)
Reference (Author, Year)
PCA PAM 753-A-OH 753-F-DO DM-PCA
0.1 0.05 0.1 0.05 0.1 0.05 0.1 0.05 0.1 0.05 0.1
5 5 5 5 5 5 5 5 5 5 5
84 86 85 86 81 81 77 84 73 86 88
4.0 3.1 0.7 4.0 2.5 5.2 3.9 4.7 2.8 1.9 3.6
5 4 1 5 3 7 5 6 4 2 4
Wheat forage Penthiopyrad PCA PAM 753-A-OH 753-F-DO DM-PCA
0.05 0.1 0.05 0.1 0.05 0.1 0.05 0.1 0.05 0.1 0.05 0.1
5 5 5 5 5 5 5 5 5 5 5 5
85 85 92 96 84 88 91 90 86 96 91 93
2.7 3.7 3.7 7.3 2.4 6.1 3.9 3.6 2.8 3.8 3.2 4.2
3 4 4 8 3 7 4 4 3 4 4 5
Stry, JJ 2009 (PTHIO_058)
Prunes Penthiopyrad PCA PAM 753-A-OH 753-F-DO DM-PCA
0.01 0.1 0.01 0.1 0.01 0.1 0.01 0.1 0.01 0.1 0.01 0.1
4 4 4 4 4 4 4 4 4 4 4 4
103 102 109 106 101 103 106 110 110 117 92 102
3.7 6.0 8.4 3.1 5.7 5.3 4.9 3.1 4.8 4.4 16 3.5
4 6 8 3 6 5 5 3 4 4 17 3
Stry, JJ 2009 (PTHIO_059)
Cucumber Penthiopyrad PCA PAM 753-A-OH 753-F-DO DM-PCA
0.01 0.1 0.01 0.1 0.01 0.1 0.01 0.1 0.01 0.1 0.01 0.1
4 4 4 4 4 4 4 4 4 4 4 4
93 99 81 101 95 102 93 101 101 105 93 99
3.8 5.6 9.6 1.8 2.1 6.7 4.7 5.2 3.1 5.3 4.0 3.9
4 6 12 2 2 7 5 5 3 5 4 4
Stry, JJ 2009 (PTHIO_059)
Melon pulp Penthiopyrad PCA PAM 753-A-OH 753-F-DO
0.01 0.1 0.01 0.1 0.01 0.1 0.01 0.1 0.01
4 4 4 4 4 4 4 4 4
100 93 87 90 80 84 98 93 100
1.3 2.4 7.7 2.0 1.0 1.7 2.9 2.7 3.1
1 3 9 2 1 2 3 3 3
Stry, JJ 2009 (PTHIO_059)

Penthiopyrad
1435
Matrix/Analyte Fortification levels (mg/kg)
No. Mean recovery (%)
Standard deviation (%)
Relative standard deviation (%)
Reference (Author, Year)
DM-PCA
0.1 0.01 0.1
4 4 4
94 93 91
2.7 1.4 2.8
3 2 3
Melon peel Penthiopyrad PCA PAM 753-A-OH 753-F-DO DM-PCA
0.01 0.1 0.01 0.1 0.01 0.1 0.01 0.1 0.01 0.1 0.01 0.1
4 4 4 4 4 4 4 4 4 4 4 4
104 105 93 117 93 103 106 110 114 115 103 108
2.8 4.5 6.0 4.1 2.9 3.5 2.2 5.4 2.5 4.3 4.2 1.7
3 4 7 4 3 3 2 5 2 4 4 2
Stry, JJ 2009 (PTHIO_059)
Almond nutmeat Penthiopyrad PCA PAM 753-A-OH 753-F-DO DM-PCA
0.01 0.1 0.01 0.1 0.01 0.1 0.01 0.1 0.01 0.1 0.01 0.1
4 4 4 4 4 4 4 4 4 4 4 4
69 80 100 101 93 102 74 96 88 91 99 94
2.6 2.6 12 6.5 3.7 5.8 6.2 3.5 16 2.6 2.5 12
4 3 12 6 4 6 8 4 18 3 3 12
Stry, JJ 2009 (PTHIO_059)
Almond hulls Penthiopyrad PCA PAM 753-A-OH 753-F-DO DM-PCA
0.01 0.1 0.01 0.1 0.01 0.1 0.01 0.1 0.01 0.1 0.01 0.1
4 4 4 4 4 4 4 4 4 4 4 4
85 77 96 85 76 75 84 85 81 80 79 75
4.6 4.8 12 11 4.2 4.0 4.0 5.2 6.0 5.1 13 4.9
5 6 12 13 6 5 5 6 7 6 16 7
Stry, JJ 2009 (PTHIO_059)
Pecan nutmeat Penthiopyrad PCA PAM 753-A-OH 753-F-DO DM-PCA
0.01 0.1 0.01 0.1 0.01 0.1 0.01 0.1 0.01 0.1 0.01 0.1
4 4 4 4 4 4 4 4 4 4 4 4
85 83 79 89 86 88 88 89 94 96 89 80
2.7 2.7 8.3 1.6 5.2 2.2 4.9 2.5 4.1 3.7 6.8 1.7
3 3 11 2 6 3 6 3 4 4 8 2
Stry, JJ 2009 (PTHIO_059)
Apples Penthiopyrad PCA
0.01 0.1 0.01
4 4 4
94 90 96
5 3 16
6 4 16
Stry, JJ 2009 (PTHIO_059)

Penthiopyrad
1436
Matrix/Analyte Fortification levels (mg/kg)
No. Mean recovery (%)
Standard deviation (%)
Relative standard deviation (%)
Reference (Author, Year)
PAM 753-A-OH 753-F-DO DM-PCA
0.1 0.01 0.1 0.01 0.1 0.01 0.1 0.01 0.1
4 4 4 4 4 4 4 4 4
95 74 86 100 95 101 95 93 95
3 8 5 7 3 8 2 4 4
4 11 6 7 3 8 2 5 4
Peach Penthiopyrad PCA PAM 753-A-OH 753-F-DO DM-PCA
0.01 0.1 0.01 0.1 0.01 0.1 0.01 0.1 0.01 0.1 0.01 0.1
4 4 4 4 4 4 4 4 4 4 4 4
95 91 95 101 92 97 99 106 102 104 93 102
5.1 6.1 11 3.2 5.1 9.1 4.9 3.5 4.8 4.4 7.8 2.5
5 7 12 3 6 9 5 3 5 4. 8 3
Stry, JJ 2009 (PTHIO_059)
Plum Penthiopyrad PCA PAM 753-A-OH 753-F-DO DM-PCA
0.01 0.1 0.01 0.1 0.01 0.1 0.01 0.1 0.01 0.1 0.01 0.1
4 4 4 4 4 4 4 4 4 4 4 4
106 103 103 114 103 102 114 112 115 115 107 110
4.0 2.2 4.2 3.2 3.1 2.4 3.2 2.1 4.1 1.4 5.0 2.4
4 2 4 3 3 2 3 2 4 1 4.7 2.2
Stry, JJ 2009 (PTHIO_059)
Sweet cherry Penthiopyrad PCA PAM 753-A-OH 753-F-DO DM-PCA
0.01 0.1 0.01 0.1 0.01 0.1 0.01 0.1 0.01 0.1 0.01 0.1
4 4 4 4 4 4 4 4 4 4 4 4
100 97 98 123 88 107 105 117 105 116 98 120
6.5 5.9 10 2.0 2.8 0.9 8.7 4.6 9.2 5.6 5.7 4.1
7 6 10 2 3 1 8 4 9 5 6 3
Stry, JJ 2009 (PTHIO_059)
Apple dry pomace Penthiopyrad PCA PAM 753-A-OH 753-F-DO DM-PCA
0.01 0.1 0.01 0.1 0.01 0.1 0.01 0.1 0.01 0.1 0.01
4 4 4 4 4 4 4 4 4 4 4
98 94 92 95 83 82 97 96 91 89 91
2.6 3.0 11 3.2 4.7 2.2 1.5 2.9 2.1 2.2 1.3
3 3 12 3 6 3 2 3 2 2 1
Stry, JJ 2009 (PTHIO_059)

Penthiopyrad
1437
Matrix/Analyte Fortification levels (mg/kg)
No. Mean recovery (%)
Standard deviation (%)
Relative standard deviation (%)
Reference (Author, Year)
0.1 4 92 2.0 2
Apple juice Penthiopyrad PCA PAM 753-A-OH 753-F-DO DM-PCA
0.01 0.1 0.01 0.1 0.01 0.1 0.01 0.1 0.01 0.1 0.01 0.1
4 4 4 4 4 4 4 4 4 4 4 4
88 79 79 90 70 81 91 91 92 89 90 91
3.0 6.6 11 9.2 5.5 6.6 2.5 6.8 5.4 7.2 5.7 6.5
3 8 14 10 8 8 3 7 6 8 6 7
Stry, JJ 2009 (PTHIO_059)
Pea vine Penthiopyrad PCA PAM 753-A-OH 753-F-DO DM-PCA
0.01 0.1 0.01 0.1 0.01 0.1 0.01 0.1 0.01 0.1 0.01 0.1
4 4 4 4 4 4 4 4 4 4 4 4
82 84 90 88 87 82 98 95 108 106 72 86
4.6 6.7 8.5 5.3 11 6.0 7.8 5.9 9.0 7.4 8.1 4.5
6 8 9 6 12 7 8 6 8 7 11 5
Stry, JJ 2009 (PTHIO_059)
Pea hay Penthiopyrad PCA PAM 753-A-OH 753-F-DO DM-PCA
0.05 0.5 0.05 0.5 0.05 0.5 0.05 0.5 0.05 0.5 0.05 0.5
4 4 4 4 4 4 4 4 4 4 4 4
73 76 83 93 85 82 83 90 79 90 74 101
1.8 2.9 3.4 1.9 3.7 2.4 2.1 4.6 1.3 2.5 3.7 3.2
3 4 4 2 4 3 3 5 2 3 5 3
Stry, JJ 2009 (PTHIO_059)
Pea dry seed Penthiopyrad PCA PAM 753-A-OH 753-F-DO DM-PCA
0.01 0.1 0.01 0.1 0.01 0.1 0.01 0.1 0.01 0.1 0.01 0.1
4 4 4 4 4 4 4 4 4 4 4 4
104 94 92 88 96 89 87 85 115 106 84 85
8.4 6.2 5.8 5.7 8.1 5.5 5.7 4.1 8.7 6.2 7.7 6.3
8 7 6 7 9 6 6 5 8 6 9 7
Stry, JJ 2009 (PTHIO_059)
Bean dry seed Penthiopyrad PCA PAM
0.01 0.1 0.01 0.1 0.01
4 4 4 4 4
89 81 76 77 87
4.2 4.3 1.1 3.8 5.4
5 5 2 5 6
Stry, JJ 2009 (PTHIO_059)

Penthiopyrad
1438
Matrix/Analyte Fortification levels (mg/kg)
No. Mean recovery (%)
Standard deviation (%)
Relative standard deviation (%)
Reference (Author, Year)
753-A-OH 753-F-DO DM-PCA
0.1 0.01 0.1 0.01 0.1 0.01 0.1
4 4 4 4 4 4 4
83 87 85 96 90 89 79
3.7 3.3 4.1 3.9 4.1 5.3 3.5
5 4 5 4 5 6 4
Lettuce Penthiopyrad PCA PAM 753-A-OH 753-F-DO DM-PCA
0.01 0.1 0.01 0.1 0.01 0.1 0.01 0.1 0.01 0.1 0.01 0.1
4 4 4 4 4 4 4 4 4 4 4 4
84 69 90 79 82 70 91 79 102 85 86 77
5.1 7.9 4.1 6.8 3.0 6.7 3.8 7.2 3.0 8.1 6.5 7.3
6 11 5 9 4 10 4 9 3 10 8 10
Stry, JJ 2009 (PTHIO_059)
Radish roots Penthiopyrad PCA PAM 753-A-OH 753-F-DO DM-PCA
0.01 0.1 0.01 0.1 0.01 0.1 0.01 0.1 0.01 0.1 0.01 0.1
4 4 4 4 4 4 4 4 4 4 4 4
91 90 83 82 79 78 88 90 96 92 111 83
3.7 2.7 2.3 0.7 5.3 3.3 2.9 1.4 3.9 1.0 4.4 0.5
4 3 3 1 7 4 3 2 4 1 4 1
Stry, JJ 2009 (PTHIO_059)
Oilseed rape Penthiopyrad PCA PAM 753-A-OH 753-F-DO DM-PCA
0.01 0.1 0.01 0.1 0.01 0.1 0.01 0.1 0.01 0.1 0.01 0.1
4 4 4 4 4 4 4 4 4 4 4 4
94 96 103 96 97 107 93 102 84 97 84 100
3.1 5.1 2.6 5.6 3.9 4.3 1.4 3.9 6.9 2.4 4.6 5.7
3 6 3 6 4 4 2 4 8 2 6 6
Stry, JJ 2009 (PTHIO_059)
Rapeseed press cake Penthiopyrad PCA PAM 753-A-OH 753-F-DO DM-PCA
0.05 0.5 0.05 0.5 0.05 0.5 0.05 0.5 0.05 0.5 0.05 0.5
4 4 4 4 4 4 4 4 4 4 4 4
97 94 87 87 94 91 97 100 89 94 94 98
4 3 3 1 6 3 4 4 8 3 3 2
4 4 3 2 6 3 4 4 7 3 3 2
Stry, JJ 2009 (PTHIO_059)

Penthiopyrad
1439
Matrix/Analyte Fortification levels (mg/kg)
No. Mean recovery (%)
Standard deviation (%)
Relative standard deviation (%)
Reference (Author, Year)
Peanut nutmeat Penthiopyrad PCA PAM 753-A-OH 753-F-DO DM-PCA
0.01 0.1 0.01 0.1 0.01 0.1 0.01 0.1 0.01 0.1 0.01 0.1
4 4 4 4 4 4 4 4 4 4 4 4
97 99 81 89 93 96 98 112 99 113 78 111
1.0 8.9 6.3 4.0 3.7 5.9 4.3 7.9 12 10 7.1 7.4
1 9 8 5 4 6 4 7 12 9 9 7
Stry, JJ 2009 (PTHIO_059)
Peanut hay Penthiopyrad PCA PAM 753-A-OH 753-F-DO DM-PCA
0.05 0.5 0.05 0.5 0.05 0.5 0.05 0.5 0.05 0.5 0.05 0.5
4 4 4 4 4 4 4 4 4 4 4 4
107 108 106 94 112 97 100 97 102 93 104 97
8.1 7.3 3.8 2.4 4.7 2.2 3.7 3.7 3.9 6.4 3.7 2.8
8 7 4 3 4 2 4 4 4 7 4 3
Stry, JJ 2009 (PTHIO_059)
Peanut meal Penthiopyrad PCA PAM 753-A-OH 753-F-DO DM-PCA
0.01 0.1 0.01 0.1 0.01 0.1 0.01 0.1 0.01 0.1 0.01 0.1
4 4 4 4 4 4 4 4 4 4 4 4
98 107 80 82 87 92 109 97 102 124 80 82
5.0 6.6 8.3 3.6 4.3 5.5 10 3.7 3.9 7.0 6.9 6.0
5 6 10 4 5 6 9 4 4 6 9 7
Stry, JJ 2009 (PTHIO_059)
Peanut refined oil Penthiopyrad PCA PAM 753-A-OH 753-F-DO DM-PCA
0.01 0.1 0.01 0.1 0.01 0.1 0.01 0.1 0.01 0.1 0.01 0.1
4 4 4 4 4 4 4 4 4 4 4 4
98 93 96 95 100 94 112 109 105 98 106 103
6.9 5.2 5.7 3.4 8.7 3.9 8.5 5.8 11 5.7 8.0 3.0
7 6 6 4 9 4 8 5 10 6 8 3
Stry, JJ 2009 (PTHIO_059)
Grapes Penthiopyrad PCA PAM 753-A-OH
0.01 0.1 0.01 0.1 0.01 0.1 0.01
4 4 4 4 4 4 4
101 94 95 100 81 86 104
0.6 0.7 7.9 4.7 3.0 2.7 2.4
1 1 8 5 4 3 2
Stry, JJ 2009 (PTHIO_059)

Penthiopyrad
1440
Matrix/Analyte Fortification levels (mg/kg)
No. Mean recovery (%)
Standard deviation (%)
Relative standard deviation (%)
Reference (Author, Year)
753-F-DO DM-PCA
0.1 0.01 0.1 0.01 0.1
4 4 4 4 4
99 106 99 94 101
2.8 3.8 3.6 2.1 2.8
3 4 4 2 3
Pea hay Penthiopyrad PCA PAM 753-A-OH DM-PCA
0.05 0.5 0.05 0.5 0.05 0.5 0.05 0.5 0.05 0.5
5 5 5 5 5 5 5 5 5 5
79 78 76 90 86 81 77 83 83 92
3.2 1.3 2.5 4.5 8.4 3.2 2.5 2.1 4.1 5.0
4 2 3 5 10 4 3 3 5 5
Sadgrove, L 2009 (PTHIO_060) Independent laboratory validation
Oilseed rape Penthiopyrad PCA PAM 753-A-OH DM-PCA
0.01 0.1 0.01 0.1 0.01 0.1 0.01 0.1 0.01 0.1
5 5 5 5 5 5 5 5 5 5
88 82 83 81 86 74 87 92 98 87
6.6 7.0 7.7 2.6 9.0 6.0 4.4 2.7 2.1 3.2
8 9 9 3 11 8 5 3 2 4
Sadgrove, L 2009 (PTHIO_060) Independent laboratory validation
Grapes Penthiopyrad PCA PAM 753-A-OH DM-PCA
0.01 0.1 0.01 0.1 0.01 0.1 0.01 0.1 0.01 0.1
5 5 5 5 5 5 5 5 5 5
83 88 98 90 88 82 83 94 92 95
3.5 3.1 8.5 3.8 8.7 3.2 5.9 2.7 6.6 2.8
4 4 9 4 10 4 7 3 7 3
Sadgrove, L 2009 (PTHIO_060) Independent laboratory validation
n.a. not analysed
Samples of animal origin
Reference: Class, T (2009, PTHIO_061), Meyer, M (2009, PTHIO_055, ILV)
Method: DFG Method S19
Commodities: milk, liver, meat, eggs
Analytes: penthiopyrad, PAM, 753-A-OH
LOQ: 0.01 mg/kg
Determination: LC-MS/MS
Description: Specimen material was extracted with acetone. Water was added before-hand in an amount that takes full account of the natural water content of the specimen so that during extraction the acetone/water ratio remains constant at 2:1 v/v. For liquid-liquid partition ethyl acetate/cyclohexane (1:1, v/v) and sodium chloride were added and after repeated mixing excess

Penthiopyrad
1441
water was separated. The oil seed rape (seeds) sample material was mixed vigerously with synthetic calcium silicate after addition of acetone and acetonitrile.
The solution was evaporated and an aliquot of the remaining residue of the organic phase was cleaned up by gel permeation chromatography (GPC) using a mixture of ethyl acetate/ cyclohexane (1:1, v/v) as eluent. The residue-containing fraction was concentrated and analysed for residues of penthiopyrad and its metabolites (PCA, 753-A-OH, PAM and DM-PCA) using LC-MS/MS.
Table 60 Recoveries of penthiopyrad and its metabolites in samples of animal origin (DFG Method S19)
Matrix/Analyte Fortification levels (mg/kg)
No. Mean recovery (%)
Standard deviation (%)
Relative standard deviation (%)
Reference (Author, Year)
Milk Penthiopyrad PAM 753-A-OH
0.01 0.1 0.01 0.1 0.01 0.1
5 5 5 5 5 5
94 92 84 76 96 93
4.7 5.5 2.5 8.3 6.7 8.3
5 6 3 11 7 9
Class, T, 2009 (PTHIO_061)
Liver Penthiopyrad PAM 753-A-OH
0.01 0.1 0.01 0.1 0.01 0.1
5 5 5 5 5 5
98 96 97 96 103 100
8.8 4.8 1.9 1.9 17 10
9 5 2 2 17 10
Class, T, 2009 (PTHIO_061)
Meat Penthiopyrad PAM 753-A-OH
0.01 0.1 0.01 0.1 0.01 0.1
5 5 5 5 5 5
96 84 101 95 105 97
6.7 10 2.0 4.7 3.1 9.7
7 12 2 5 3 10
Class, T, 2009 (PTHIO_061)
Eggs Penthiopyrad PAM 753-A-OH
0.01 0.1 0.01 0.1 0.01 0.1
5 5 5 5 5 5
83 83 86 85 76 73
13 4.1 7.7 5.1 8.3 3.6
16 5 9 6 11 5
Class, T, 2009 (PTHIO_061)
Milk Penthiopyrad PAM 753-A-OH
0.01 0.1 0.01 0.1 0.01 0.1
5 5 5 5 5 5
80 83 86 85 85 90
4.1 1.4 2.1 1.6 2.0 1.3
5 2 2 2 2 2
Meyer, M 2009 (PTHIO_055) Independent laboratory validation
Liver Penthiopyrad PAM 753-A-OH
0.01 0.1 0.01 0.1 0.01 0.1
5 5 5 5 5 5
75 70 85 85 73 80
3.8 4.8 5.6 5.0 1.6 4.5
5 7 7 6 2 6
Meyer, M 2009 (PTHIO_055) Independent laboratory validation
Eggs Penthiopyrad PAM
0.01 0.1 0.01 0.1
5 5 5 5
89 88 96 97
1.8 1.4 1.3 2.5
2 2 1 3
Meyer, M 2009 (PTHIO_055) Independent

Penthiopyrad
1442
Matrix/Analyte Fortification levels (mg/kg)
No. Mean recovery (%)
Standard deviation (%)
Relative standard deviation (%)
Reference (Author, Year)
753-A-OH 0.01 0.1
5 5
74 87
7.0 3.4
9 4
laboratory validation
Reference: Airs, D (2008, PTHIO_062), Airs, D (2008, PTHIO_063), Oliver-Kang, J (2008, PTHIO_064), Oliver-Kang, J (2008, PTHIO_065), Class, T (2009, PTHIO_066, ILV)
Method: LDA0082, LDA0083 and CEMR-3657
Commodities: milk, liver (bovine, poultry), meat/muscle (bovine, poultry), eggs, skin/fat (bovine, poultry)
Analytes: penthiopyrad, PAM, 753-A-OH
LOQ: 0.01 mg/kg
Determination: LC-MS/MS
Description: The analytical methods LDA0082, LDA0083 and CEMR-3657 involve the extraction of samples with acetone/water (80:20, v/v). After centrifugation and removal of the organic solvent the aqueous layer was acidified with concentrated hydrochloric acid in order to hydrolyse the conjugates, and then partitioned twice with ethyl acetate. For the analytical method CEMR-3574 the milk samples were extracted with acetone. Then, after centrifugation and removal of the organic solvent, the aqueous layer was acidified with formic acid and partitioned with ethyl acetate. In all methods the combined ethyl acetate phase was evaporated and the extract re-dissolved in methanol/deionised water (50:50, v/v) for LC-MS/MS analysis. For the CEMR-3657, quantitation was performed by the external standardisation with matrix-matched bracketing standards, and for CEMR-3574 quantitation was performed by the external standardisation with bracketing standards.
Table 61 Recoveries of penthiopyrad and its metabolites in samples of animal origin (LDA0082, LDA0083 and CEMR-3657)
Matrix/Analyte Fortification levels (mg/kg)
No. Mean recovery (%)
Standard deviation (%)
Relative standard deviation (%)
Reference (Author, Year)
Poultry liver Penthiopyrad PAM PCA 753-A-OH
0.01 1.0 0.01 1.0 0.01 1.0 0.01 1.0
5 5 5 5 5 5 5 5
77 81 81 79 86 89 74 83
3.0 6.9 11 7.4 10 4.7 5.3 7.3
4 9 14 9 12 5 7 9
Airs, D 2008 (PTHIO_062)
Poultry muscle Penthiopyrad PAM PCA 753-A-OH
0.01 1.0 0.01 1.0 0.01 1.0 0.01 1.0
5 5 5 5 5 5 5 5
84 92 96 89 88 93 97 89
9.1 8.2 7.1 10 6.8 7.4 9.1 5.5
11 9 8 12 8 8 9 6
Airs, D 2008 (PTHIO_062)
Poultry skin/fat Penthiopyrad PAM PCA
0.01 1.0 0.01 1.0 0.01 1.0
5 5 5 5 5 5
90 101 101 96 97 95
8.6 8.0 6.5 5.3 9.4 0.8
10 8 7 6 10 1
Airs, D 2008 (PTHIO_062)

Penthiopyrad
1443
Matrix/Analyte Fortification levels (mg/kg)
No. Mean recovery (%)
Standard deviation (%)
Relative standard deviation (%)
Reference (Author, Year)
753-A-OH 0.01 1.0
5 5
106 96
2.9 7.0
3 7
Poultry abdominal fat Penthiopyrad PAM PCA 753-A-OH
0.01 1.0 0.01 1.0 0.01 1.0 0.01 1.0
5 5 5 5 5 5 5 5
92 93 81 94 84 95 93 99
8.0 4.3 9.8 7.8 8.8 10 9.0 3.8
9 5 12 8 11 11 10 4
Airs, D 2008 (PTHIO_062)
Eggs Penthiopyrad PAM PCA 753-A-OH
0.01 1.0 0.01 1.0 0.01 1.0 0.01 1.0
5 5 5 5 5 5 5 5
101 96 94 100 102 89 103 104
4.0 6.3 11 5.5 7.4 11 5.2 4.5
4 7 11 6 7 13 5 4
Airs, D 2008 (PTHIO_062)
Bovine liver Penthiopyrad PAM PCA 753-A-OH
0.01 1.0 0.01 1.0 0.01 1.0 0.01 1.0
5 5 5 5 5 5 5 5
98 93 98 93 103 98 99 96
8.5 9.0 11 6.9 5.5 5.3 5.8 11
9 10 12 7 5 5 6 12
Airs, D 2008 (PTHIO_063)
Bovine muscle Penthiopyrad PAM PCA 753-A-OH
0.01 1.0 0.01 1.0 0.01 1.0 0.01 1.0
5 5 5 5 5 5 5 5
93 85 104 87 101 98 89 90
7.3 7.7 7.3 4.1 9.3 7.8 8.8 9.3
7.8 9.1 7.1 4.7 9.1 8.0 9.9 10
Airs, D 2008 (PTHIO_063)
Bovine kidney Penthiopyrad PAM PCA 753-A-OH
0.01 1.0 0.01 1.0 0.01 1.0 0.01 1.0
5 5 5 5 5 5 5 5
92 84 81 99 102 93 86 90
2.3 5.7 12 9.1 6.1 4.3 9.4 4.0
3 7 15 9 6 5 11 5
Airs, D 2008 (PTHIO_063)
Bovine fat Penthiopyrad PAM PCA 753-A-OH
0.01 1.0 0.01 1.0 0.01 1.0 0.01 1.0
5 5 5 5 5 5 5 5
96 91 91 89 101 92 95 85
10 13 16 13 7.4 7.6 10 10
11 15 17 15 7 8 11 12
Airs, D 2008 (PTHIO_063)
Milk Penthiopyrad
0.01
5
93
7.4
8
Airs, D 2008

Penthiopyrad
1444
Matrix/Analyte Fortification levels (mg/kg)
No. Mean recovery (%)
Standard deviation (%)
Relative standard deviation (%)
Reference (Author, Year)
PAM PCA 753-A-OH
1.0 0.01 1.0 0.01 1.0 0.01 1.0
5 5 5 5 5 5 5
101 87 99 90 99 88 101
5.8 12 7.2 14 6.1 5.1 7.1
6 14 7 16 6 6 7
(PTHIO_063)
Milk Penthiopyrad PAM PCA 753-A-OH
0.01 0.025 0.1 0.25 0.01 0.025 0.1 0.25 0.01 0.025 0.1 0.25 0.01 0.025 0.1 0.25
5 5 5 5 5 5 5 5 5 5 5 5 5 5 5 5
97 93 92 89 91 86 89 87 89 88 87 91 96 99 92 88
6.2 5.0 2.5 5.7 5.8 5.1 2.3 2.3 9.6 5.8 1.7 1.9 4.1 6.5 1.8 2.6
6 5 3 6 6 6 3 3 11 7 2 2 4 7 2 3
Oliver-Kang, J, 2008 (PTHIO_064)
Bovine muscle Penthiopyrad PAM PCA 753-A-OH
0.01 0.1 0.01 0.1 0.01 0.1 0.01 0.1
7 5 7 5 7 5 7 5
96 88 73 72 92 81 101 87
13 7.4 3.4 1.7 2.9 2.5 8.0 7.4
14 8 5 2 3 3 8 9
Oliver-Kang, J, 2008 (PTHIO_065)
Bovine kidney Penthiopyrad PAM PCA 753-A-OH
0.01 0.1 0.01 0.1 0.01 0.1 0.01 0.1
7 5 7 5 7 5 7 5
105 103 96 96 95 98 110 104
6.6 3.3 5.4 3.9 7.3 3.7 5.4 5.7
6 3 6 4 8 4 5 6
Oliver-Kang, J, 2008 (PTHIO_065)
Bovine liver Penthiopyrad PAM PCA 753-A-OH
0.01 0.03 0.1 0.5 0.01 0.03 0.1 0.5 0.01 0.03 0.1 0.5 0.01 0.03 0.1 0.5
7 5 5 5 7 5 5 5 7 5 5 5 7 5 5 5
99 102 94 89 85 94 79 88 96 96 92 91 99 96 93 76
8.1 12 7.8 4.1 4.3 2.0 3.0 3.0 4.0 2.9 2.7 2.3 6.0 3.7 4.9 1.9
8 11 8 5 5 2 4 3 4 3 3 3 6 4 5 3
Oliver-Kang, J, 2008 (PTHIO_065)

Penthiopyrad
1445
Matrix/Analyte Fortification levels (mg/kg)
No. Mean recovery (%)
Standard deviation (%)
Relative standard deviation (%)
Reference (Author, Year)
Bovine fat Penthiopyrad PAM PCA 753-A-OH
0.01 0.1 0.01 0.1 0.01 0.1 0.01 0.1
7 5 7 5 7 5 7 5
82 84 93 100 102 90 98 93
8.4 8.6 12 4.1 10 7.7 3.8 11
10 10 12 4 10 9 4 11
Oliver-Kang, J, 2008 (PTHIO_065)
Milk Penthiopyrad PAM 753-A-OH
0.01 1.0 0.01 1.0 0.01 1.0
5 5 5 5 5 5
94 88 93 82 95 82
6.5 5.3 3.7 4.9 10 6.5
7 6 4 6 11 8
Class, T 2009 (PTHIO_066) Independent laboratory validation
Eggs Penthiopyrad PAM 753-A-OH
0.01 1.0 0.01 1.0 0.01 1.0
5 5 5 5 5 5
92 103 89 93 93 86
8.3 10 8.0 6.5 4.6 9.5
9 10 9 7 3 4
Class, T 2009 (PTHIO_066) Independent laboratory validation
Bovine liver Penthiopyrad PAM 753-A-OH
0.01 1.0 0.01 1.0 0.01 1.0
5 5 5 5 5 5
93 103 83 92 93 99
1.8 5.1 2.5 3.7 1.9 8.9
2 5 3 4 2 9
Class, T 2009 (PTHIO_066) Independent laboratory validation
Stability of pesticides in stored analytical samples
The storage stability of penthiopyrad and its metabolites PAM, PCA, 753-A-OH, 753-F-DO and DM-PCA has been investigated in various matrices for a storage periode of up to 18 months. Beyond the expected variation in view of the number of samples no significant degradation was observed in plant matrices.
For animal matrices the storage stability was investigated only for milk for a period of more than one month. Within 6 months no degradation was observed in milk. Bovine and poultry tissues and eggs showed no degradation of residues within one month, an interval that covers the storage durations reported in animal metabolism and livestock feeding studies.
Reference: Cairns, SD, 2009 and 2001 (PTHIO_037 and PTHIO_038)
Commodities: grapes (fruits, juice, raisins and dry pomace), wheat (grain, straw and forage), rape (seed and oil), lettuce, apples, potatoes and dry beans
Analytes: penthiopyrad, PAM, 753-A-OH, 753-F-DO, PCA, DM-PCA
Material and Method: Test samples were stored over a period up to 12 months during which they were kept in a frozen condition (approximately -20 °C) pending analysis. All samples were homogenised and fortified with a concentration equal to 0.2 mg/kg for each analyte per container. After the listed intervals the samples were analysed and compared to freshly fortified samples.
Reference: Rodgers, M, 2009 (PTHIO_039)

Penthiopyrad
1446
Commodities: poultry liver, muscle, skin/fat, fat and eggs
Analytes: penthiopyrad, PAM, 753-A-OH, PCA
Material and Method: Test samples were stored over a period up to 1 month during which they were kept in a frozen condition (approximately -20 °C) pending analysis. All samples were homogenised and fortified with a concentration equal to either 0.01 mg/kg or 0.1 mg/kg for each analyte. Remaining residues between the first and second analysis were compared for storage stability.
Reference: Rawle, NW, 2008 (PTHIO_040)
Commodities: bovine milk
Analytes: penthiopyrad, PAM, 753-A-OH, PCA
Material and Method: Milk samples collected during the dosing period were stored over a period up to 6 months during which they were kept in a frozen condition (approximately -20 °C) pending analysis. After the listed intervals the samples were analysed and compared for storage stability.
Table 62 Freezer storage stability of penthiopyrad, PAM, 753-A-OH, 753-F-DO, PCA and DM-PCA residues in plant and animal commodities
Matrix Analyte Storage interval (months)
Residues remained in stored samples fortified at 0.2 mg/kg as % nominal level
Mean procedural recovery of samples fresh fortified at 0.2 mg/kg in %
Reference (Author, Year)
measured mean measured mean
Lettuce penthiopyrad 0 1 3 6 12 18
73, 93 96, 87 91, 93 86, 79 93, 79 87, 84
Not applicable 92 92 83 95 86
88, 74 82, 73 86, 71 74, 80 72, 76
83 81 77 79 77 74
Cairns, SD, 2009 and 2001
PAM 0 1 3 6 12 18
Not applicable 99, 100 100, 98 73, 71 90, 103 82, 77
Not applicable 99 99 72 97 80
92, 96 87, 89 84, 86 67, 66 87, 82 76, 67
94 88 85 67 85 72
(PTHIO_037 and PTHIO_038)
753-A-OH 0 1 3 6 12 18
Not applicable 110, 113 105, 108 93, 113 108, 113 72, 69
Not applicable 112 106 103 111 71
107, 113 96, 103 90, 87 94, 82 84, 84 67, 61
110 100 89 88 84 64
753-F-DO 0 1 3 6 12 18
Not applicable 103, 99 100, 100 95, 97 96, 109 90, 89
Not applicable 101 100 96 103 90
97, 94 96, 94 99, 100 99, 102 91, 91 80, 82
96 95 99 100 91 81
PCA 0 1 3 6 12 18
Not applicable 110, 104 100, 103 102, 102 117, 104 93, 82
Not applicable 107 101 102 111 87
102, 98 100, 97 101, 92 98, 93 83., 87 86, 76
100 98 97 96 85 81
DM-PCA 0 Not Not applicable 72, 95 83

Penthiopyrad
1447
Matrix Analyte Storage interval (months)
Residues remained in stored samples fortified at 0.2 mg/kg as % nominal level
Mean procedural recovery of samples fresh fortified at 0.2 mg/kg in %
Reference (Author, Year)
measured mean measured mean
1 3 6 12 18
applicable 103, 97 106, 105 78, 98 99, 103 78, 80
100 106 88 101 79
76, 71 98, 97 89, 92 90, 95 78, 75
74 97 90 92 77
Apple penthiopyrad 0 1 week 1 3 6 12 18
Not applicable 78, 87 85, 87 98, 67 102, 92 72, 72 75, 83
Not applicable 82 86 83 97 72 79
48, 48 84, 53 74, 81 73, 65 90, 96 71, 73 85, 83
48 69 78 69 93 72 84
PAM 0 1 week 1 3 6 12 18
Not applicable 90, 92 89, 88 99, 95 97, 96 103, 100 77, 72
Not applicable 91 89 97 96 102 75
86, 83 97, 92 93, 89 103, 104 93, 97 85, 89 74, 70
85 94 91 104 95 87 72
753-A-OH 0 1 week 1 3 6 12 18
Not applicable 104, 104 106, 107 115, 121 108, 101 94, 96 85, 76
Not applicable 104 107 118 105 95 81
106, 105 112, 111 108, 108 117, 102 101, 104 76, 83 71, 70
106 112 108 110 103 80 70
753-F-DO 0 1 week 1 3 6 12 18
Not applicable 93, 92 95, 95 105, 101 104, 101 94, 98 83, 88
Not applicable 93 95 103 103 96 91
89, 89 95, 90 94, 93 109, 98 109, 112 82, 90 86, 90
89 93 94 104 111 86 88
PCA 0 1 week 1 3 6 12 18
Not applicable 93, 92 97, 96 109, 100 94, 98 96, 89 102, 92
Not applicable 92 97 105 96 93 97
91, 93 93, 95 100, 99 113, 117 86, 99 88, 94 88, 96
92 94 99 115 93 91 92
DM-PCA 0 1 week 1 3 6 12 18
Not applicable 89, 91 101, 98 105, 87 110, 98 96, 88 75, 67
Not applicable 91 99 96 104 92 71
101, 107 89, 91 106, 101 98, 94 109, 111 97, 93 71, 73
104 90 104 96 110 95 72
Potato penthiopyrad 0 1 3
Not applicable 54, 69
Not applicable 62 100
86, 85 79, 90 95, 79
86 84 87

Penthiopyrad
1448
Matrix Analyte Storage interval (months)
Residues remained in stored samples fortified at 0.2 mg/kg as % nominal level
Mean procedural recovery of samples fresh fortified at 0.2 mg/kg in %
Reference (Author, Year)
measured mean measured mean
6 12 18
98, 101 96, 101 96, 101 100, 95
98.5 84.7 97.5
96, 98 79, 70 100, 115
97 75 108
PAM 0 1 3 6 12 18
Not applicable 84, 92 83, 97 97, 100 103, 110 91, 88
Not applicable 88 90 98 107 90
88, 88 93, 94 73, 92 96, 95 93, 83 88, 90
88 93 82 96 88 89
753-A-OH 0 1 3 6 12 18
Not applicable 98, 108 112, 115 103, 98 99, 98 98, 100
Not applicable 103 114 101 97 99
97, 93 98, 104 97, 95 97, 103 79, 81 101, 113
95 101 96 100 80 107
753-F-DO 0 1 3 6 12 18
Not applicable 92, 95 96, 101 102, 102 83, 91 86, 87
Not applicable 93 99 102 87 86
93, 89 92, 97 99, 97 109, 119 79, 80 82, 88
91 95 98 114 80 85
PCA 0 1 3 6 12 18
Not applicable 93, 98 99, 92 97, 102 102, 100 107, 97
Not applicable 96 96 100 101 102
86, 81 94, 97 102, 86 95, 103 83, 83 107, 123
83 95 94 99 83 115
DM-PCA 0 1 3 6 12 18
Not applicable 91, 88 110, 97 86, 87 101, 99 73, 68
Not applicable 90 104 86 100 71
94, 83 93, 99 111, 90 103, 102 84, 87 87, 93
88 96 101 103 100, 86 71, 90
Grapes penthiopyrad 0 1 3 6 12 18
Not applicable 96, 90 97, 97 81, 99 93, 111 71, 72
Not applicable 93 97 90 102 71
93, 91 98, 97 98, 105 75, 72 85, 83 73, 75
92 97 102 73 84 74
PAM 0 1 3 6 12 18
Not applicable 92, 89 87, 89 96, 92 100, 119 88, 83
Not applicable 90 88 94 109 86
105, 114 99, 109 101, 99 73, 84 85, 91 78, 79
110 104 100 78 88 78
753-A-OH 0 1 3
Not applicable 117, 103
Not applicable 110 101
100, 98 101, 112 104, 105
99 107 105

Penthiopyrad
1449
Matrix Analyte Storage interval (months)
Residues remained in stored samples fortified at 0.2 mg/kg as % nominal level
Mean procedural recovery of samples fresh fortified at 0.2 mg/kg in %
Reference (Author, Year)
measured mean measured mean
6 12 18
101, 101 99, 102 91, 102 79, 77
101 97 78
88, 88 87, 85 72, 70
88 86 71
753-F-DO 0 1 3 6 12 18
Not performed
Not performed Not performed Not performed
PCA 0 1 3 6 12 18
Not applicable 115, 93 92, 91 109, 114 108, 114 80, 77
Not applicable 104 91 112 111 79
91, 88 98, 124 104, 93 89, 93 89, 94 88, 78
89 111 98 91 92 83
DM-PCA 0 1 3 6 12 18
Not applicable 106, 94 95, 87 88, 97 98, 106 75, 73
Not applicable 100 91 93 89 74
104, 97 94, 125 90, 99 92, 90 88, 90 76, 82
101 110 95 91 102 80
Dry beans penthiopyrad 0 1 3 6 12 18
Not applicable 78, 81 81, 96 91, 102 94, 98 100, 87
Not applicable 80 89 96 96 94
87, 82 80, 79 89, 83 90, 74 93, 99 100, 103
85 79 86 82 96 102
PAM 0 1 3 6 12 18
Not applicable 90, 92 85, 96 86, 93 82, 88 87, 82
Not applicable 91 91 89 85 85
85, 89 100, 96 89, 81 70, 62 80, 87 81, 101
87 98 85 66 84 91
753-A-OH 0 1 3 6 12 18
Not applicable 103, 108 80, 89 101, 109 95, 102 90, 82
Not applicable 106 85 105 98 93
88, 83 101, 100 80, 74 102, 82 101, 99 97, 93
86 101 77 92 100 95
753-F-DO 0 1 3 6 12 18
Not applicable 88, 91 86, 96 77, 91 93, 97 103, 100
Not applicable 100 91 84 95 101
82, 80 88, 92 91, 86 82, 65 81, 98 99, 100
81 90 89 74 90 100
PCA 0 1 3 6
Not applicable 79, 88 74, 86
Not applicable 84 80 83
86, 81 86, 82 72, 70 79, 61
83 84 71 70

Penthiopyrad
1450
Matrix Analyte Storage interval (months)
Residues remained in stored samples fortified at 0.2 mg/kg as % nominal level
Mean procedural recovery of samples fresh fortified at 0.2 mg/kg in %
Reference (Author, Year)
measured mean measured mean
12 18
72, 93 86, 94 97, 76
90 87
86, 90 87, 90
88 89
DM-PCA 0 1 3 6 12 18
Not applicable 77, 81 83, 88 76, 90 84, 88 83, 69
Not applicable 79 85 83 86 76
92, 85 85, 83 81, 75 79, 61 90, 89 82, 87
88.6 84.2 78.0 70.4 89.6 84.3
Grape pomace dry
penthiopyrad 0 1 week 1 3 6 12 18
Not applicable 91, 102 86, 90 105, 113 102, 101 95, 99 105, 78
Not applicable 97 88 109 102 97 91
37, 96 101, 96 90, 80 106, 110 95, 93 98, 122 85, 110
66 98 85 108 94 110 97
PAM 0 1 week 1 3 6 12 18
Not applicable 75, 89 81, 80 101, 99 108, 109 88, 94 90, 73
Not applicable 82 80 100 109 91 82
71, 93 82, 80 79, 77 104, 105 87, 99 87, 79 83, 84
82 81 78 105 93 83 83
753-A-OH 0 1 week 1 3 6 12 18
Not applicable 99, 104 81, 90 82, 81 112, 112 76, 86 107, 78
Not applicable 102 85 82 112 81 93
85, 102 103, 104 88, 82 84, 89 100, 97 82, 78 85, 108
93 104 85 86 98 80 96
753-F-DO 0 1 week 1 3 6 12 18
Not applicable 89, 94 102, 110 132, 130 130, 125 122, 118 94, 80
Not applicable 92 106 131 128 120 87
101, 113 97, 93 100, 99 109, 108 100, 100 101, 100 83, 89
107 95 100 109 100 101 86
PCA 0 1 week 1 3 6 12 18
Not applicable 72, 77 72, 73 73, 76 90, 80 79, 89 70, 65
Not applicable 75 73 75 85 84 68
84, 84 75, 76 70, 66 73, 64 75, 73 71, 77 63, 68
84 75 68 69 74 74 65
DM-PCA 0 1 week 1 3 6 12 18
Not applicable 86, 84 91, 101 113, 106 129, 131 109, 117
Not applicable 85 96 110 130 113 98
89.3, 89.5 85, 81 97, 91 103, 103 97, 107 106, 95 79, 94
89.4 83 94 103 102 101 87

Penthiopyrad
1451
Matrix Analyte Storage interval (months)
Residues remained in stored samples fortified at 0.2 mg/kg as % nominal level
Mean procedural recovery of samples fresh fortified at 0.2 mg/kg in %
Reference (Author, Year)
measured mean measured mean
105, 92
Grape juice penthiopyrad 0 1 3 6 12 18
Not applicable 90, 101 108, 100 72, 75 84, 67 86, 82
Not applicable 96 104 73 75 84
92, 103 101, 87 101, 105 72, 74 72, 79 79, 80
98 94 103 73 75 78
PAM 0 1 3 6 12 18
Not applicable 86, 89 96, 91 79, 86 80, 83 77, 83
Not applicable 87 93 83 81 80
77, 88 92, 80 104, 101 81, 85 81, 84 85, 90
83 86 103 83 82 87
753-A-OH 0 1 3 6 12 18
Not applicable 91, 94 102, 90 88, 91 75, 77 79, 79
Not applicable 93 96 90 76 79
87, 98 92, 86 103, 106 97, 99 80, 81 85, 86
93 89 105 98 80 86
753-F-DO 0 1 3 6 12 18
Not applicable 85, 89 105, 93 91, 93 83, 79 92, 92
Not applicable 87 99 92 81 92
86, 96 95, 82 122, 124 94, 99 89, 89 103, 100
91 88 123 97 89 102
PCA 0 1 3 6 12 18
Not applicable 88, 99 96, 100 92, 91 90, 91 77
Not applicable 94 98 91 90 77
80, 88 99, 90 111, 104 89, 95 83, 90 79, 77
84 94 108 92 87 78
DM-PCA 0 1 3 6 12 18
Not applicable 99, 104 114, 106 99, 98 92, 91 92, 99
Not applicable 101 110 98 91 95
86, 93 94, 86 134, 123 96, 101 83, 81 90, 94
90 90 129 99 82 92
Raisins penthiopyrad 0 1 3 6 12 18
Not applicable 78, 78 74, 76 77, 63 68, 66 65, 77
Not applicable 78 75 70 67 71
81, 79 78, 72 92, 97 66, 70 70, 58 85, 84
80 75 94 68 64 84
PAM 0 1 3 6 12 18
Not applicable 79, 85 77, 67 73, 74 77, 77
Not applicable 82 72 73 77 70
80, 76 83, 80 96, 97 80, 74 80, 78 87, 85
78 81 96. 77 79 86

Penthiopyrad
1452
Matrix Analyte Storage interval (months)
Residues remained in stored samples fortified at 0.2 mg/kg as % nominal level
Mean procedural recovery of samples fresh fortified at 0.2 mg/kg in %
Reference (Author, Year)
measured mean measured mean
63, 76
753-A-OH 0 1 3 6 12 18
Not applicable 73, 78 74, 76 69, 65 78, 72 65, 79
Not applicable 76 75 67 75 72
83, 85 83, 91 97, 101 74, 71 81, 78 81, 89
84 87 99 72 79 85
753-F-DO 0 1 3 6 12 18
Not applicable 73, 74 81, 81 79, 77 76, 75 60, 74
Not applicable 73 81 78 75 67
82, 79 87, 85 129, 127 82, 85 80, 78 88, 87
81 86 128 84 79 88
PCA 0 1 3 6 12 18
Not applicable 84, 91 82, 80 78, 74 83, 75 57, 71
Not applicable 87 81 76 79 64
87, 78 75, 77 96, 105 84, 79 80, 75 89, 86
82 76 101 81 77 87
DM-PCA 0 1 3 6 12 18
Not applicable 85, 92 90, 91 91, 89 83, 82 62, 73
Not applicable 89 91 90 83 67
87, 79 80, 85 114, 117 86, 83 88, 80 88, 87
83 83 116 85 84 87
Wheat grain penthiopyrad 0 1 3 6 12 18
Not applicable 116, 100 70, 65 73, 71 101, 114 110, 112
Not applicable 108 67 72 108 111
100, 91 104, 107 82, 74 67, 67 91, 96 101, 104
96 106 78 67 94 103
PAM 0 1 3 6 12 18
Not applicable 95, 89 101, 90 98, 108 85, 96 102, 96
Not applicable 92 95 103 90 99
92, 88 101, 96 92, 94 97, 107 74, 76 89, 95
90 99 93 102 75 92
753-A-OH 0 1 3 6 12 18
Not applicable 98, 95 88, 78 82, 79 110, 116 121, 105
Not applicable 97 83 80 113 113
91, 88 107, 98 82, 85 70, 69 89, 97 101, 103
89 102 84 70 93 102
753-F-DO 0 1 3 6 12 18
Not applicable 102, 101 91, 84 109, 106 111, 115
Not applicable 102 87 108 113 923
106, 103 110, 101 76, 77 81, 85 80, 86 84, 85
105 106 77 83 83 84

Penthiopyrad
1453
Matrix Analyte Storage interval (months)
Residues remained in stored samples fortified at 0.2 mg/kg as % nominal level
Mean procedural recovery of samples fresh fortified at 0.2 mg/kg in %
Reference (Author, Year)
measured mean measured mean
95, 91
PCA 0 1 3 6 12 18
Not applicable 94, 93 90, 74 89, 88 87, 105 82, 83
Not applicable 93 82 88 96 82
94, 88 106, 92 83, 76 79, 77 72, 74 70, 68
91 99 80 78 73 69
DM-PCA 0 1 3 6 12 18
Not applicable 107, 101 98, 85 100, 94 91, 106 95, 91
Not applicable 104 91 97 99 93
106, 103 107, 102 83, 87 79, 77 73, 71 74, 75
105 105 85 78 72 75
Wheat straw penthiopyrad 0 1 4 6 12 18
Not applicable 92, 87 84, 101 74, 95 112, 112 71, 74
Not applicable 89 93 85 112 73
78, 88 83, 84 76, 81 67, 67 91, 96 101, 104
83 84 78 67 94 103
PAM 0 1 4 6 12 18
Not applicable 89, 95 93, 105 98, 90 113, 112 81, 82
Not applicable 92 99 94 113 81
89, 93 92, 84 83, 93 69, 69.6 76, 89 69, 73
91 88 88 69 83 71
753-A-OH 0 1 4 6 12 18
Not applicable 96, 97 88, 91 83, 77 162, 164 126, 137
Not applicable 97 89. 80 163 132
90, 96 76, 77 84, 84 70, 69 89, 97 101, 103
93 77 84 70 93 102
753-F-DO 0 1 4 6 12 18
Not applicable 105, 99 105, 118 103, 100 132, 121 97, 99
Not applicable 102 112 101 127 98
84, 94 95, 92 83, 90 68, 75 72, 80 65, 67
89 93 87 71 76 76
PCA 0 1 4 6 12 18
Not applicable 94, 95 99, 77 90, 89 96, 98 106, 113
Not applicable 95 88 89 97 110
90, 95 90, 87 72, 78 56, 63 69, 80 77, 94
93 88 75 59 74 85
DM-PCA 0 1 4 6 12 18
Not applicable 108, 108 104, 115 98, 95 104, 100
Not applicable 108 110 96 102 96
89, 98 102, 100 88, 94 59, 60 65, 78 69, 78
93 101 91 60 72 73

Penthiopyrad
1454
Matrix Analyte Storage interval (months)
Residues remained in stored samples fortified at 0.2 mg/kg as % nominal level
Mean procedural recovery of samples fresh fortified at 0.2 mg/kg in %
Reference (Author, Year)
measured mean measured mean
97, 96
Wheat forage penthiopyrad 0 1 3 6 12 18
Not applicable 74, 71 78, 78 85, 78 76, 83 84, 86
Not applicable 72 78 81 80 85
81, 74 72, 79 84, 78 84, 84 94, 72 78, 82
78 76 81 84 83 80
PAM 0 1 3 6 12 18
Not applicable 75, 81 91, 89 103, 107 71, 89 80, 92
Not applicable 78 90 105 80 91
89, 87 88, 93 87, 89 97, 105 84, 87 74, 83
88 91 88 101 86 79
753-A-OH 0 1 3 6 12 18
Not applicable 81, 76 85, 82 89, 87 80, 87 98, 95
Not applicable 78 83 88 83 97
96, 92 81, 83 93, 88 80, 87 99, 85 86, 88
94 82 91 84 92 87
753-F-DO 0 1 3 6 12 18
Not applicable 91, 87 95, 95 99, 95 91, 99 84, 87
Not applicable 89 95 97 95 86
108, 102 88, 105 95, 95 86, 89 98, 83 82, 88
105 97 95 87 91 85
PCA 0 1 3 6 12 18
Not applicable 84, 79 91, 92 101, 94 95, 100 108, 109
Not applicable 82 92 98 97 109
101, 96 86, 95.0 92, 88 92, 90 103, 94 88, 93
98 90 90 91 98 90
DM-PCA 0 1 3 6 12 18
Not applicable 91, 91 97, 91 105, 102 102, 102 114, 124
Not applicable 91 94 104 102 119
109, 108 95, 103 90, 85 93, 87 90, 87 98, 97
109 98.9 87.9 90.2 88.3 97.7
Rapeseed oil penthiopyrad 0 1 3 6 12 18
Not applicable 86, 93 98, 96 93, 91 87, 87 89, 94
Not applicable 90 97 92 87 91
99, 98 79, 73 9, 97 101, 98 77, 89 86, 91
99 76 94 100 83 88
PAM 0 1 3 6 12 18
Not applicable 90, 93 102, 94 83, 87 82, 88
Not applicable 92 98 85 85 102
99, 102 80, 77 89, 94 83, 82 85, 87 87, 95
101 79 91 83 86 91

Penthiopyrad
1455
Matrix Analyte Storage interval (months)
Residues remained in stored samples fortified at 0.2 mg/kg as % nominal level
Mean procedural recovery of samples fresh fortified at 0.2 mg/kg in %
Reference (Author, Year)
measured mean measured mean
102, 102
753-A-OH 0 1 3 6 12 18
Not applicable 90, 90 105, 102 107, 98 84, 82 100, 99
Not applicable 90 104 102 83 99
95, 97 81, 78 89, 100 101, 99 75, 86 96, 107
96 80 94 100 80 102
753-F-DO 0 1 3 6 12 18
Not applicable 84, 87 84, 86 84, 81 76, 81 92, 79
Not applicable 86 85 82 79 85
98, 101 80, 78 83, 87 99, 92 77, 83 82, 82
99 79 85 95 80 82
PCA 0 1 3 6 12 18
Not applicable 91, 100 93, 78 80, 81 89, 82 89, 98
Not applicable 96 86 80 85 93
97, 96 84, 79 84, 88 76, 78 72, 86 76, 85
97 82 86 77 79 81
DM-PCA 0 1 3 6 12 18
Not applicable 91, 90 88, 82 87, 78 85, 82 96, 88
Not applicable 91 85 83 83 92
100, 103 86, 80 77, 85 99, 95 67, 78 81, 80
102 83 81 97 73 80
Oilseed rape seeds
penthiopyrad 0 1 3 6 12 18
Not applicable 109, 95 91, 93 84, 77 99, 101 104, 114
Not applicable 102 92 81 100 109
99, 99 106, 102 91, 96 87, 91 99, 103 101, 103
99 104 94 89 101 102
PAM 0 1 3 6 12 18
Not applicable 93, 90 90, 89 86, 82 85, 86 82, 86
Not applicable 91 90 84 85 84
88, 86 81, 83 92, 101 85, 87 107, 92 80, 77
87 82 96 86 99 79
753-A-OH 0 1 3 6 12 18
Not applicable 100, 105 94, 93 105, 98 99, 96 113, 111
Not applicable 102 94 101 97 112
95, 106 105, 103 85, 94 97, 101 87, 104 101, 98
101 104 90 99 95 99
753-F-DO 0 1 3 6 12 18
Not applicable 86, 92 86, 86 84, 80 100, 71
Not applicable 89 86 82 85 89
98, 97 92, 91 86, 98 92, 97 104, 118 92, 92
97 92 92 94 111 92

Penthiopyrad
1456
Matrix Analyte Storage interval (months)
Residues remained in stored samples fortified at 0.2 mg/kg as % nominal level
Mean procedural recovery of samples fresh fortified at 0.2 mg/kg in %
Reference (Author, Year)
measured mean measured mean
88, 91
PCA 0 1 3 6 12 18
Not applicable 100, 94 85, 88 89, 87 75, 67 98, 96
Not applicable 97 86 88 71 97
99, 99 103, 102 85, 93 97, 91 82, 75 95, 98
99 103 89 94 78 97
DM-PCA 0 1 3 6 12 18
Not applicable 84, 91 97, 98 92, 86 84, 81 84, 91
Not applicable 87 97 89 82 88
99, 94 89, 86 97, 105 95, 95 82, 90 92, 113
97 88 101 95 86 103
Poultry liver,
penthiopyrad 0 1
104 94
Not applicable
Not performed Not performed Rodgers, M, 2009
0.01 mg/kg fortification
753-A-OH 0 1
85 110
Not applicable
Not performed Not performed (PTHIO_039)
PAM 0 1
104 94
Not applicable
Not performed Not performed
PCA 0 1
85 110
Not applicable
Not performed Not performed
Poultry liver,
penthiopyrad 0 1
96 108
Not applicable
Not performed Not performed
0.1 mg/kg fortification
753-A-OH 0 1
74 106
Not applicable
Not performed Not performed
PAM 0 1
96 108
Not applicable
Not performed Not performed
PCA 0 1
74 106
Not applicable
Not performed Not performed
Poultry muscle,
penthiopyrad 0 1
96 108
Not applicable
Not performed Not performed
0.01 mg/kg fortification
753-A-OH 0 1
72 94
Not applicable
Not performed Not performed
PAM 0 1
96 108
Not applicable
Not performed Not performed
PCA 0 1
72 94
Not applicable
Not performed Not performed
Poultry muscle,
penthiopyrad 0 1
90 102
Not applicable
Not performed Not performed
0.1 mg/kg fortification
753-A-OH 0 1
70 91
Not applicable
Not performed Not performed
PAM 0 1
90 102
Not applicable
Not performed Not performed
PCA 0 1
70 91
Not applicable
Not performed Not performed

Penthiopyrad
1457
Matrix Analyte Storage interval (months)
Residues remained in stored samples fortified at 0.2 mg/kg as % nominal level
Mean procedural recovery of samples fresh fortified at 0.2 mg/kg in %
Reference (Author, Year)
measured mean measured mean
Poultry skin/fat,
penthiopyrad 0 1
87 105
Not applicable
Not performed Not performed
0.01 mg/kg fortification
753-A-OH 0 1
84 107
Not applicable
Not performed Not performed
PAM 0 1
87 105
Not applicable
Not performed Not performed
PCA 0 1
84 107
Not applicable
Not performed Not performed
Poultry skin/fat,
penthiopyrad 0 1
95 108
Not applicable
Not performed Not performed
0.1 mg/kg fortification
753-A-OH 0 1
81 98
Not applicable
Not performed Not performed
PAM 0 1
95 108
Not applicable
Not performed Not performed
PCA 0 1
81 98
Not applicable
Not performed Not performed
Poultry fat,
penthiopyrad 0 1
82 110
Not applicable
Not performed Not performed
0.01 mg/kg fortification
753-A-OH 0 1
105 109
Not applicable
Not performed Not performed
PAM 0 1
82 110
Not applicable
Not performed Not performed
PCA 0 1
105 109
Not applicable
Not performed Not performed
Poultry fat,
penthiopyrad 0 1
92 110
Not applicable
Not performed Not performed
0.1 mg/kg fortification
753-A-OH 0 1
110 106
Not applicable
Not performed Not performed
PAM 0 1
92 110
Not applicable
Not performed Not performed
PCA 0 1
110 106
Not applicable
Not performed Not performed
Eggs,
penthiopyrad 0 1
90 102
Not applicable
Not performed Not performed
0.01 mg/kg fortification
753-A-OH 0 1
97 103
Not applicable
Not performed Not performed
PAM 0 1
90 102
Not applicable
Not performed Not performed
PCA 0 1
97 103
Not applicable
Not performed Not performed
Eggs,
penthiopyrad 0 1
104 95
Not applicable
Not performed Not performed
0.1 mg/kg fortification
753-A-OH 0 1
81 110
Not applicable
Not performed Not performed
PAM 0 1
104 95
Not applicable
Not performed Not performed

Penthiopyrad
1458
Matrix Analyte Storage interval (months)
Residues remained in stored samples fortified at 0.2 mg/kg as % nominal level
Mean procedural recovery of samples fresh fortified at 0.2 mg/kg in %
Reference (Author, Year)
measured mean measured mean
PCA 0 1
81 110
Not applicable
Not performed Not performed
Bovine milk, penthiopyrad 0 1 2 6
70, 66 74, 78 84, 79 93, 84
68 76 82 89
70, 75 79, 81 82, 84 92, 93
73 80 83 93
Rawle, NW 2008 (PTHIO_040)
753-A-OH 0 1 2 6
83, 84 80, 81 84, 80 90, 85
84 81 82 88
90, 102 82, 80 87, 93 85, 92
96 81 90 89
PAM 0 1 2 6
72, 72 75, 75 90, 88 93, 84
72 75 89 88.5
76, 75 79, 80 71, 77 89, 88
76 80 74 89
PCA 0 1 2 6
88, 86 90, 88 93, 93 89, 88
87 89 93 88.5
95, 95 88, 89 88, 98 88, 91
95 89 93 90
USE PATTERN
Penthiopyrad is a non-systemic protectant fungicide. The Meeting received numerous uses involving foliar spray applications mainly before harvest.
Table 63 List of registered uses
Crop Country Application detail Form Type kg ai/ha L/ha No. Pre harvest
interval (PHI) in days
Alfalfa USA EC foliar spray (F)
0.36 min. 140
2 (max. 0.72 kg ai/ha and year)
14
Alfalfa Canada SC foliar spray (F)
0.35 min. 110
2 (max. 0.7 kg ai/ha and year)
14
Almonds USA SC foliar spray (F)
0.26 min. 140
3 (max. 0.78 kg ai/ha and year)
150
Barley USA EC foliar spray (F)
0.36 (up to BBCH 59)
min. 140
2 (max. 0.71 kg ai/ha and year)
0 (forage/hay) F (grain/straw)
Barley Canada EC foliar spray (F)
0.35 (up to BBCH 59)
min. 110
2 (max. 0.7 kg ai/ha and year)
0 (forage/hay) F (grain/straw)
Beans Canada SC foliar spray (F)
0.45 min. 110
3 (max. 1.1 kg ai/ha and year)
0
Beans (legume vegetables) USA SC foliar spray (F)
0.39 min. 140
3 (max. 0.94 kg ai/ha and year)
7
Berries (strawberry, blueberry)
USA EC foliar spray (F)
0.36 min. 140
3 (max. 1.1 kg ai/ha and year)
0
Blueberry USA SC foliar spray (F)
0.31 min. 140
3 (max. 0.94 kg ai/ha and year)
42
Blueberry Canada SC foliar spray (F)
0.35 min. 110
3 (max. 1.1 kg ai/ha and year)
0
Brassica, head and stem (cabbage, broccoli, cauliflower)
USA SC foliar spray (F)
0.39 min. 140
3 (max. 0.94 kg ai/ha and year)
7
Brassica, leafy vegetables (cabbage, broccoli, cauliflower, mustard
USA EC foliar spray (F)
0.45 min. 140
3 (max. 1.1 kg ai/ha and year)
0

Penthiopyrad
1459
Crop Country Application detail Form Type kg ai/ha L/ha No. Pre harvest
interval (PHI) in days
greens) Brassica, leafy vegetables (cabbage, broccoli, cauliflower, mustard greens)
Canada SC foliar spray (F)
0.35 min. 110
3 (max. 1.1 kg ai/ha and year)
0
Bulb vegetables (green and dry)
USA EC foliar spray (F)
0.36 min. 140
3 (max. 1.1 kg ai/ha and year)
3
Bulb vegetables (green and dry)
Canada SC foliar spray (F)
0.35 min. 110
3 (max. 1.1 kg ai/ha and year)
3
Carrot USA SC foliar spray (F)
0.39 min. 140
2 (max. 0.78 kg ai/ha and year)
0
Celery USA EC foliar spray (F)
0.36 min. 140
3 (max. 1.1 kg ai/ha and year)
3
Celery Canada SC foliar spray (F)
0.35 min. 110
3 (max. 1.1 kg ai/ha and year)
3
Cotton USA EC in-furrow + foliar spray (F)
0.36 min. 140
3 (max. 1.1 kg ai/ha and year)
21
Cucurbits (cucumbers, melons, watermelon, squashes)
USA EC foliar spray (F)
0.24 min. 140
4 (max. 1 kg ai/ha and year)
1
Cucurbits (cucumbers, melons, watermelon, squashes)
Canada SC foliar spray (F)
0.3 min. 110
4 (max. 1 kg ai/ha and year)
1
Filberts (= hazelnuts) USA SC foliar spray (F)
0.26 min. 140
3 (max. 0.78 kg ai/ha and year)
120
Fruiting vegetables USA EC foliar spray (F+G)
0.36 min. 140
3 (max. 1.1 kg ai/ha and year)
0
Fruiting vegetables Canada SC foliar spray (F+G)
0.35 min. 110
3 (max. 1.1 kg ai/ha and year)
0
Fruiting vegetables (except tomato)
USA SC foliar spray (F)
0.31 min. 140
3 (max. 0.94 kg ai/ha and year)
3
Garlic (dry) USA SC foliar spray (F)
0.31 min. 140
3 (max. 0.94 kg ai/ha and year)
7
Leafy vegetables (lettuce, celery, spinach)
USA EC foliar spray (F)
0.36 min. 140
3 (max. 1.1 kg ai/ha and year)
3
Leafy vegetables (lettuce, celery, spinach)
Canada SC foliar spray (F)
0.35 min. 110
3 (max. 1.1 kg ai/ha and year)
3
Leek USA SC foliar spray (F)
0.31 min. 140
3 (max. 0.94 kg ai/ha and year)
14
Legume vegetables (succulent shelled or podded)
USA EC foliar spray (F)
0.45 min. 140
3 (max. 1.1 kg ai/ha and year)
0
Legume vegetables (succulent shelled or podded)
Canada SC foliar spray (F)
0.45 min. 110
3 (max. 1.1 kg ai/ha and year)
0
Maize USA EC foliar spray (F)
0.36 min. 140
2 (max. 0.71 kg ai/ha and year)
0 (forage) 7 (grain/stover)
Maize Canada EC foliar spray (F)
0.35 min. 110
2 (max. 0.7 kg ai/ha and year)
0 (forage/hay) 30 (grain/stover)
Oats USA EC foliar spray (F)
0.36 (up to BBCH 59)
min. 140
2 (max. 0.71 kg ai/ha and year)
0 (forage/hay) F (grain/straw)
Oats Canada EC foliar spray (F)
0.35 (up to BBCH 59)
min. 110
2 (max. 0.7 kg ai/ha and year)
0 (forage/hay) F (grain/straw)
Oilseed rape (canola) USA EC foliar spray (F)
0.3 min. 140
3 (max. 0.61 kg ai/ha and year)
21
Oilseed rape (canola) Canada EC foliar spray (F)
0.3 min. 110
2 (max. 0.6 kg ai/ha and year)
21
Onion (dry) USA SC foliar 0.31 min. 3 (max. 0.94 kg ai/ha 7

Penthiopyrad
1460
Crop Country Application detail Form Type kg ai/ha L/ha No. Pre harvest
interval (PHI) in days
spray (F) 140 and year) Onion (green) USA SC foliar
spray (F) 0.31 min.
140 3 (max. 0.94 kg ai/ha and year)
14
Parsnips USA SC foliar spray (F)
0.39 min. 140
2 (max. 0.78 kg ai/ha and year)
10
Peanut USA EC foliar spray (F)
0.36 min. 140
3 (max. 1.1 kg ai/ha and year)
14
Peanut Canada SC foliar spray (F)
0.35 min. 110
3 (max. 1.1 kg ai/ha and year)
14
Pistachio USA SC foliar spray (F)
0.26 min. 140
3 (max. 0.78 kg ai/ha and year)
14
Pome fruits USA EC foliar spray (F)
0.3 min. 140
4 (max. 0.91 kg ai/ha and year)
28
Pome fruits Canada SC foliar spray (F)
0.3 min. 110
3 (max. 0.9 kg ai/ha and year)
28
Potato, Yams USA SC foliar spray (F)
0.31 min. 140
3 (max. 0.94 kg ai/ha and year)
7
Pulses (except soya beans) USA EC foliar spray (F)
0.3 min. 140
3 (max. 0.61 kg ai/ha and year)
0 (vine/hay) 21 (seeds)
Pulses (except soya beans) Canada EC foliar spray (F)
0.35 min. 110
2 (max. 0.6 kg ai/ha and year)
21
Rhubarb USA EC foliar spray (F)
0.36 min. 140
3 (max. 1.1 kg ai/ha and year)
3
Rhubarb Canada SC foliar spray (F)
0.35 min. 110
3 (max. 1.1 kg ai/ha and year)
3
Root and tuber vegetables (except sugar beets, potatoes and carrots)
USA EC foliar spray (F)
0.36 min. 140
3 (max. 1.1 kg ai/ha and year)
7
Root and tuber vegetables (except sugar beets, potatoes and carrots)
Canada EC foliar spray (F)
0.35 min. 110
3 (max. 1 kg ai/ha and year)
7
Root and tuber vegetables (except sugar beets and potatoes)
Canada SC foliar spray (F)
0.35 min. 110
3 (max. 0.9 kg ai/ha and year)
0
Root vegetables (except sugar beets and potatoes)
USA EC foliar spray (F)
0.45 min. 140
3 (max. 0.91 kg ai/ha and year)
0
Rye USA EC foliar spray (F)
0.36 (up to BBCH 59)
min. 140
2 (max. 0.71 kg ai/ha and year)
0 (forage/hay) F (grain/straw)
Rye Canada EC foliar spray (F)
0.35 (up to BBCH 59)
min. 110
2 (max. 0.7 kg ai/ha and year)
0 (forage/hay) F (grain/straw)
Shallots USA SC foliar spray (F)
0.31 min. 140
3 (max. 0.94 kg ai/ha and year)
14
Sorghum Canada EC foliar spray (F)
0.35 min. 110
2 (max. 0.7 kg ai/ha and year)
0 (forage/hay) 30 (grain/stover)
Sorghum, Millet USA EC foliar spray (F)
0.36 min. 140
2 (max. 0.71 kg ai/ha and year)
0 (forage/hay) 30 (grain/stover)
Soya beans USA EC foliar spray (F)
0.45 min. 140
3 (max. 0.91 kg ai/ha and year)
0 (forage/hay) 14 (seeds)
Soya beans Canada SC foliar spray (F)
0.45 min. 110
3 (max. 1.1 kg ai/ha and year)
0
Stone fruits USA EC foliar spray (F)
0.3 min. 140
4 (max. 0.91 kg ai/ha and year)
0
Stone fruits Canada SC foliar spray (F)
0.35 min. 110
3 (max. 0.9 kg ai/ha and year)
0
Strawberry Canada SC foliar spray (F)
0.35 min. 110
3 (max. 1.1 kg ai/ha and year)
0
Sugar beet USA EC foliar spray (F)
0.45 min. 140
3 (max. 0.91 kg ai/ha and year)
0 (forage) 7 (turnip)
Sugar beet Canada EC foliar spray (F)
0.3 min. 110
3 (max. 0.9 kg ai/ha and year)
7 (forage) 7 (turnip)

Penthiopyrad
1461
Crop Country Application detail Form Type kg ai/ha L/ha No. Pre harvest
interval (PHI) in days
Sunflower USA EC foliar spray (F)
0.45 min. 140
3 (max. 0.91 kg ai/ha and year)
14
Sunflower Canada EC foliar spray (F)
0.35 min. 110
3 (max. 0.9 kg ai/ha and year)
14
Sweet corn USA EC foliar spray (F)
0.36 min. 140
2 (max. 0.71 kg ai/ha and year)
0 (forage) 7 (grain/stover)
Sweet corn Canada EC foliar spray (F)
0.35 min. 110
2 (max. 0.7 kg ai/ha and year)
0 (forage/hay) 30 (grain/stover)
Tomato USA SC foliar spray (F)
0.31 min. 140
3 (max. 0.94 kg ai/ha and year)
0
Tree nuts (almond, hazelnut, chestnut, walnut)
Canada SC foliar spray (F)
0.3 min. 110
3 (max. 0.9 kg ai/ha and year)
14
Tree nuts (incl. Pistachios) USA EC foliar spray (F)
0.3 min. 140
4 (max. 0.91 kg ai/ha and year)
14
Wheat, Triticale USA EC foliar spray (F)
0.36 (up to BBCH 59)
min. 140
2 (max. 0.71 kg ai/ha and year)
0 (forage/hay) F (grain/straw)
Wheat, Triticale Canada EC foliar spray (F)
0.35 (up to BBCH 59)
min. 110
2 (max. 0.7 kg ai/ha and year)
0 (forage/hay) F (grain/straw)
F = field use G = glasshouse use
In Canada and the USA general label restrictions on rotational crops apply; thereby, not
allowing the planting of crops without authorised uses of penthiopyrad within 120 days after treatment.
RESIDUES RESULTING FROM SUPERVISED TRIALS ON CROPS
Residue levels were reported as measured. Application rates were always reported as penthiopyrad. When residues were not detected they are shown as below the LOQ, e.g., < 0.01 mg/kg. Residues, application rates and spray concentrations have generally been rounded to two significant figures. HR and STMR values from the trials conducted according to maximum GAP have been used for the estimation of maximum residue levels. These results are underlined.
Laboratory reports included method validation including batch recoveries with spiking at residue levels similar to those occurring in samples from the supervised trials. Dates of analyses or duration of residue sample storage were also provided. Field reports provided data on the sprayers used and their calibration, plot size, residue sample size and sampling date. Although trials included control plots, no control data are recorded in the tables except where residues in control samples exceeded the LOQ. Residue data are recorded unadjusted for % recovery.
Penthiopyrad—supervised residue trials
Commodity Indoor/ Outdoor
Treatment Countries Table No.
Pome fruit outdoor foliar spray Canada, France, Germany, Greece, Hungary, Italy, Spain, USA
64
Cherries outdoor foliar spray Canada, USA 65
Peaches outdoor foliar spray Canada, USA 66
Plums outdoor foliar spray Canada, USA 67
Strawberries outdoor foliar spray Canada, USA 68

Penthiopyrad
1462
Commodity Indoor/ Outdoor
Treatment Countries Table No.
Bulb onions outdoor foliar spray Canada, USA 69
Green onions outdoor foliar spray Canada, USA 70
Broccoli outdoor foliar spray Canada, USA 71
Cauliflower outdoor foliar spray Canada, USA 72
Cabbage outdoor foliar spray Canada, USA 73
Summer squash (courgettes)
indoor and outdoor
foliar spray Canada, France, Greece, Italy, Spain, USA
74
Cucumbers indoor and outdoor
foliar spray Belgium, Canada, France, Greece, Italy, Spain, USA
75
Melons outdoor foliar spray Canada, USA 76
Winter squash outdoor foliar spray Canada, USA 77
Bell peppers indoor and outdoor
foliar spray Canada, France, Greece, Italy, Spain, USA
78
Non-bell peppers outdoor foliar spray Canada, USA 79
Sweet corn outdoor foliar spray Canada, USA 80
Tomatoes indoor and outdoor
foliar spray Belgium, Canada, France, Greece, Italy, Spain, USA
81
Head lettuce outdoor foliar spray Canada, USA 82
Leaf lettuce outdoor foliar spray Canada, USA 83
Mustard greens outdoor foliar spray Canada, USA 84
Spinach outdoor foliar spray Canada, USA 85
Turnip greens outdoor foliar spray Canada, USA 86
Celery outdoor foliar spray Canada, USA 87
Beans (legume vegetables)
outdoor foliar spray Canada, USA 88
Peas (legume vegetables)
outdoor foliar spray Canada, USA 89
Beans (pulses) outdoor foliar spray Canada, USA 90
Peas (pulses) outdoor foliar spray Canada, USA 91
Soya beans outdoor foliar spray Canada, USA 92
Carrots outdoor foliar spray Canada, USA 93
Potatoes outdoor foliar spray Canada, USA 94
Radish outdoor foliar spray Canada, USA 95
Sugar beets outdoor in furrow and foliar spray
Canada, USA 96
Barley outdoor foliar spray Canada, France, Germany, Hungary, UK, USA
97
Maize outdoor foliar spray Canada, USA 98
Sorghum outdoor foliar spray Canada, USA 99
Wheat outdoor foliar spray Canada, France, Germany, Hungary, UK, USA
100
Almonds outdoor foliar spray USA 101

Penthiopyrad
1463
Commodity Indoor/ Outdoor
Treatment Countries Table No.
Pecan outdoor foliar spray USA 102
Cotton outdoor in furrow and foliar spray
USA 103
Rape seed outdoor foliar spray Canada, France, Germany, Hungary, UK, USA
104
Peanuts outdoor foliar spray USA 105
Sunflowers outdoor foliar spray Canada, France, Germany, Hungary, UK, USA
106
Alfalfa forage and hay
outdoor foliar spray Canada, USA 107
Pea vines and hay outdoor foliar spray Canada, USA 108
Soya bean forage and hay
outdoor foliar spray Canada, USA 109
Barley forage outdoor foliar spray France, Germany, UK 110
Barley hay outdoor foliar spray Canada, USA 111
Maize forage outdoor foliar spray Canada, USA 112
Sorghum forage outdoor foliar spray USA 113
Wheat forage outdoor foliar spray Canada, France, Germany, UK, USA 114
Barley straw outdoor foliar spray Canada, France, Germany, Hungary, UK, USA
115
Maize stover outdoor foliar spray Canada, USA 116
Sorghum stover outdoor foliar spray USA 117
Wheat straw outdoor foliar spray Canada, France, Germany, Hungary, UK, USA
118
Sugar beet leaves and tops
outdoor foliar spray Canada, USA 119
Rape forage outdoor foliar spray France, Hungary, UK 120
Peanut hay outdoor foliar spray USA 121
Sunflower forage outdoor foliar spray France, Germany, Hungary 122
Almond hulls outdoor foliar spray USA 123
Cotton by-products outdoor in furrow and foliar spray
USA 124
Table 64 Residues in pome fruit following foliar application of penthiopyrad
Location, Year (variety) Reference
Application DAT Residues, mg/kg Selected residue mg/kg b n kg ai/ha kg
ai/hL parent PAM PCA 753-A-
OH 753-F-DO
DM-PCA
Germany, Sornzig 2007 (Apple, Spartan) PTHIO_074
3 0.24 0.24 0.23
0.02 0.02 0.02
21 0.2 0.01 < 0.01 0.045 < 0.01 < 0.01

Penthiopyrad
1464
Location, Year (variety) Reference
Application DAT Residues, mg/kg Selected residue mg/kg b n kg ai/ha kg
ai/hL parent PAM PCA 753-A-
OH 753-F-DO
DM-PCA
Hungary, Agárd 2007 (Apple, Jonathan) PTHIO_074
3 0.23 0.23 0.23
0.02 0.02 0.02
28 0.019 < 0.01 < 0.01 < 0.01 < 0.01 < 0.01
France (North), Herlies 2007 (Apple, Corail) PTHIO_074 Reverse decline
3 0.22 0.23 0.22
0.02 0.02 0.02
0a 0 7
0.33 0.66 0.55
< 0.01 < 0.01 < 0.01
< 0.01 < 0.01 < 0.01
< 0.01 < 0.01 < 0.01
< 0.01 < 0.01 < 0.01
< 0.01 < 0.01 < 0.01
3 0.22 0.23 0.23
0.02 0.02 0.02
14 0.36 0.012 < 0.01 0.011 < 0.01 < 0.01
3 0.22 0.22 0.22
0.02 0.02 0.02
22 0.17 < 0.01 < 0.01 0.012 < 0.01 < 0.01
3 0.22 0.23 0.23
0.02 0.02 0.02
29 0.037 < 0.01 < 0.01 < 0.01 < 0.01 < 0.01
Germany, Pommlitz 2007 (Pear, Williams Christ) PTHIO_074 Reverse decline
3 0.23 0.23 0.22
0.02 0.02 0.02
0a 0 7
0.049 0.29 0.15
< 0.01 < 0.01 < 0.01
0.011 0.012 0.012
< 0.01 < 0.01 0.021
< 0.01 < 0.01 < 0.01
< 0.01 < 0.01 < 0.01
3 0.23 0.22 0.24
0.02 0.02 0.02
14 0.11 < 0.01 0.012 < 0.01 < 0.01 < 0.01
3 0.24 0.22 0.22
0.02 0.02 0.02
22 0.044 < 0.01 0.012 < 0.01 < 0.01 < 0.01
3 0.24 0.23 0.22
0.02 0.02 0.02
29 0.025 < 0.01 0.011 < 0.01 < 0.01 < 0.01
France (North), Herlies 2007 (Pear, Angelys) PTHIO_074 Reverse decline
3 0.22 0.22 0.22
0.02 0.02 0.02
0a 0 7
0.6 0.76 0.75
< 0.01 < 0.01 0.01
< 0.01 < 0.01 0.01
< 0.01 0.012 0.012
0.01 0.013 0.013
< 0.01 < 0.01 < 0.01
3 0.22 0.22 0.22
0.02 0.02 0.02
14 0.41 0.013 0.011 0.027 0.018 < 0.01
3 0.23 0.22 0.22
0.02 0.02 0.02
22 0.057 < 0.01 < 0.01 0.019 < 0.01 < 0.01
3 0.22 0.22 0.22
0.02 0.02 0.02
29 0.032 < 0.01 < 0.01 0.01 < 0.01 < 0.01

Penthiopyrad
1465
Location, Year (variety) Reference
Application DAT Residues, mg/kg Selected residue mg/kg b n kg ai/ha kg
ai/hL parent PAM PCA 753-A-
OH 753-F-DO
DM-PCA
France (North), Herlies 2008 (Apple, Corail) PTHIO_074
3 0.22 0.23 0.23
0.02 0.02 0.02
21 0.083 < 0.01 < 0.01 < 0.01 < 0.01 < 0.01
Germany, Sornzig 2008 (Apple, James Grieve) PTHIO_074 Reverse decline
3 0.22 0.23 0.23
0.02 0.02 0.02
0a 0 7
0.08 0.29 0.12
< 0.01 < 0.01 < 0.01
< 0.01 < 0.01 < 0.01
< 0.01 < 0.01 < 0.01
< 0.01 < 0.01 < 0.01
< 0.01 < 0.01 < 0.01
3 0.24 0.23 0.24
0.02 0.02 0.02
14 0.12 < 0.01 < 0.01 0.01 < 0.01 < 0.01
3 0.24 0.24 0.22
0.02 0.02 0.02
22 0.059 < 0.01 < 0.01 0.011 < 0.01 < 0.01
3 0.24 0.24 0.24
0.02 0.02 0.02
29 0.033 < 0.01 < 0.01 < 0.01 < 0.01 < 0.01
France (North), Herlies 2008 (Pear, Conference) PTHIO_074
3 0.23 0.22 0.23
0.02 0.02 0.02
21 0.074 < 0.01 < 0.01 0.024 < 0.01 < 0.01
Germany, Ablass 2008 (Pear, Williams Christ) PTHIO_074
3 0.22 0.23 0.22
0.02 0.02 0.02
21 0.037 < 0.01 < 0.01 < 0.01 < 0.01 < 0.01
Italy, Casalnoceto 2007 (Apple, Golden) PTHIO_074 Reverse decline
3 0.22 0.23 0.22
0.01 0.01 0.01
0a 0 7
0.2 0.28 0.065
< 0.01 < 0.01 < 0.01
< 0.01 < 0.01 < 0.01
< 0.01 < 0.01 < 0.01
< 0.01 < 0.01 < 0.01
< 0.01 < 0.01 < 0.01
3 0.22 0.22 0.23
0.01 0.01 0.01
14 0.05 < 0.01 < 0.01 < 0.01 < 0.01 < 0.01
3 0.22 0.22 0.22
0.01 0.01 0.01
21 0.1 < 0.01 < 0.01 0.01 < 0.01 < 0.01
3 0.22 0.22 0.22
0.01 0.01 0.01
28 0.054 < 0.01 < 0.01 < 0.01 < 0.01 < 0.01
Spain, Arbeca 2007 (Apple,
3 0.22 0.22 0.22
0.01 0.01 0.01
0a 0 7
0.09 0.15 0.22
< 0.01 < 0.01 < 0.01
< 0.01 < 0.01 < 0.01
< 0.01 < 0.01 < 0.01
< 0.01 < 0.01 0.011
< 0.01 < 0.01 < 0.01

Penthiopyrad
1466
Location, Year (variety) Reference
Application DAT Residues, mg/kg Selected residue mg/kg b n kg ai/ha kg
ai/hL parent PAM PCA 753-A-
OH 753-F-DO
DM-PCA
Golden) PTHIO_074
3 0.22 0.22 0.23
0.01 0.01 0.01
14 0.17 < 0.01 < 0.01 < 0.01 0.011 < 0.01
3 0.22 0.22 0.22
0.01 0.01 0.01
21 0.064 < 0.01 < 0.01 < 0.01 < 0.01 < 0.01
3 0.22 0.23 0.22
0.01 0.01 0.01
28 0.04 < 0.01 < 0.01 < 0.01 < 0.01 < 0.01
Greece, Platani 2007 (Apple, Granny Smith) PTHIO_074
3 0.22 0.23 0.23
0.02 0.02 0.02
21 0.028 < 0.01 < 0.01 < 0.01 < 0.01 < 0.01
Italy, Casalnoceto 2007 (Pear, Santa Maria) PTHIO_074
3 0.21 0.22 0.22
0.01 0.01 0.01
20 0.11 < 0.01 0.018 0.015 < 0.01 < 0.01
France (South), Rochemaure 2007 (Pear, Madame Ballet) PTHIO_074
3 0.22 0.22 0.22
0.02 0.02 0.02
21 0.026 < 0.01 0.011 < 0.01 < 0.01 < 0.01
Spain, Torregrossa 2008 (Apple, Brookfield) PTHIO_074
3 0.23 0.23 0.23
0.02 0.02 0.02
21 0.033 < 0.01 < 0.01 < 0.01 < 0.01 < 0.01
Italy, Casalnoceto 2008 (Apple, Golden) PTHIO_074 Reverse decline
3 0.23 0.23 0.23
0.02 0.02 0.02
0a 0 7
0.13 0.25 0.11
< 0.01 < 0.01 < 0.01
< 0.01 < 0.01 < 0.01
< 0.01 < 0.01 < 0.01
< 0.01 < 0.01 < 0.01
< 0.01 < 0.01 < 0.01
3 0.23 0.22 0.23
0.02 0.02 0.02
14 0.13 < 0.01 < 0.01 < 0.01 < 0.01 < 0.01
3 0.23 0.23 0.22
0.02 0.02 0.02
21 0.06 < 0.01 < 0.01 < 0.01 < 0.01 < 0.01
3 0.23 0.23 0.22
0.02 0.02 0.02
28 0.06 < 0.01 < 0.01 < 0.01 < 0.01 < 0.01
Italy, Casalnoceto 2008 (Pear,
3 0.22 0.22 0.22
0.02 0.02 0.02
0a 0 7
0.051 0.026 0.016
< 0.01 < 0.01 < 0.01
< 0.01 < 0.01 < 0.01
< 0.01 < 0.01 < 0.01
< 0.01 < 0.01 < 0.01
< 0.01 < 0.01 < 0.01

Penthiopyrad
1467
Location, Year (variety) Reference
Application DAT Residues, mg/kg Selected residue mg/kg b n kg ai/ha kg
ai/hL parent PAM PCA 753-A-
OH 753-F-DO
DM-PCA
Santa Maria) PTHIO_074 Reverse decline
3 0.23 0.22 0.22
0.02 0.02 0.02
14 0.024 < 0.01 < 0.01 < 0.01 < 0.01 < 0.01
3 0.22 0.23 0.22
0.02 0.02 0.02
21 0.022 < 0.01 < 0.01 < 0.01 < 0.01 < 0.01
3 0.23 0.22 0.22
0.02 0.02 0.02
28 0.014 < 0.01 < 0.01 < 0.01 < 0.01 < 0.01
France (South), Le Tremblay 2008 (Pear, Louise Bonne) PTHIO_074 Reverse decline
3 0.23 0.23 0.23
0.02 0.02 0.02
0a 0 7
0.081 0.13 0.095
< 0.01 < 0.01 < 0.01
< 0.01 < 0.01 < 0.01
< 0.01 < 0.01 0.016
< 0.01 < 0.01 < 0.01
< 0.01 < 0.01 < 0.01
3 0.22 0.23 0.23
0.02 0.02 0.02
14 0.031 < 0.01 < 0.01 < 0.01 < 0.01 < 0.01
3 0.22 0.23 0.23
0.02 0.02 0.02
21 0.01 < 0.01 < 0.01 < 0.01 < 0.01 < 0.01
3 0.22 0.23 0.23
0.02 0.02 0.02
28 < 0.01 < 0.01 < 0.01 < 0.01 < 0.01 < 0.01
USA (NY), North Rose 2007 (Apple, Ida Red) PTHIO_075
3 0.31 0.03 28 28
0.11 0.13
< 0.01 < 0.01
< 0.01 < 0.01
< 0.01 < 0.01
< 0.01 < 0.01
< 0.01 < 0.01
Parent: 0.12 Total: 0.14
USA (PA), Hereford 2007 (Apple, Starkrimson Red Delicious) PTHIO_075
3 0.31 0.02 28 28
0.12 0.14
0.012 0.014
< 0.01 < 0.01
0.012 0.013
< 0.01 < 0.01
< 0.01 < 0.01
Parent: 0.13 Total: 0.15
USA (PA), Berwick 2007 (Apple, Cortland) PTHIO_075
3 0.3100.3 0.31
0.03 0.03 0.03
28 28
0.23 0.18
< 0.01 < 0.01
< 0.01 < 0.01
< 0.01 < 0.01
< 0.01 < 0.01
< 0.01 < 0.01
Parent: 0.21 Total: 0.22
USA (VA), Crozet 2007 (Apple, Fuji) PTHIO_075
3 0.3 0.3100.3
0.02 0.02 0.02
28 28
0.076 0.076
< 0.01 < 0.01
< 0.01 < 0.01
< 0.01 < 0.01
< 0.01 < 0.01
< 0.01 < 0.01
Parent: 0.076 Total: 0.095

Penthiopyrad
1468
Location, Year (variety) Reference
Application DAT Residues, mg/kg Selected residue mg/kg b n kg ai/ha kg
ai/hL parent PAM PCA 753-A-
OH 753-F-DO
DM-PCA
USA (IL), Wyoming 2007 (Apple, Imperial Gala) PTHIO_075
3 0.31 0.04 28 28
0.12 0.15
< 0.01 < 0.01
< 0.01 < 0.01
0.022 0.023
< 0.01 < 0.01
< 0.01 < 0.01
Parent: 0.14 Total: 0.15
USA (MN), Paynesville 2007 (Apple, Empire) PTHIO_075
3 0.31 0.03 28 28
< 0.01 < 0.01
< 0.01 < 0.01
< 0.01 < 0.01
< 0.01 < 0.01
< 0.01 < 0.01
< 0.01 < 0.01
Parent: < 0.01 Total: < 0.01
Canada, Vittoria 2007 (Apple, Empire) PTHIO_075
3 0.3 0.31 0.31
0.03 0.03 0.03
0a 0a 0 0 7 7 14 14 22 22 28 28
0.27 0.2 0.32 0.26 0.26 0.28 0.15 0.25 0.14 0.14 0.12 0.11
< 0.01 < 0.01 < 0.01 < 0.01 < 0.01 < 0.01 < 0.01 < 0.01 < 0.01 < 0.01 < 0.01 < 0.01
< 0.01 < 0.01 < 0.01 < 0.01 < 0.01 < 0.01 < 0.01 < 0.01 < 0.01 < 0.01 < 0.01 < 0.01
< 0.01 < 0.01 < 0.01 < 0.01 < 0.01 < 0.01 < 0.01 < 0.01 < 0.01 < 0.01 < 0.01 < 0.01
< 0.01 < 0.01 < 0.01 < 0.01 < 0.01 < 0.01 < 0.01 < 0.01 < 0.01 < 0.01 < 0.01 < 0.01
< 0.01 < 0.01 < 0.01 < 0.01 < 0.01 < 0.01 < 0.01 < 0.01 < 0.01 < 0.01 < 0.01 < 0.01
Parent: 0.12 Total: 0.13
Canada, London 2007 (Apple, Marshall McIntosh) PTHIO_075
3 0.31 0.04 27 27
0.17 0.14
0.01 < 0.01
< 0.01 < 0.01
0.019 0.015
< 0.01 < 0.01
< 0.01 < 0.01
Parent: 0.16 Total: 0.17
USA (UT), Perry 2007 (Apple, Gala) PTHIO_075
3 0.31 0.3 0.3
0.05 0.06 0.05
28 28
0.11 0.088
< 0.01 < 0.01
< 0.01 < 0.01
0.01 0.011
< 0.01 < 0.01
< 0.01 < 0.01
Parent: 0.099 Total: 0.12
USA (CA), Madera 2007 (Apple, Fuji) PTHIO_075
3 0.31 0.34 0.31
0.03 0.03 0.03
28 28
0.2 0.23
0.013 0.018
< 0.01 < 0.01
0.014 0.015
0.014 0.016
< 0.01 < 0.01
Parent: 0.22 Total: 0.24
USA (WA), Ephrata 2007 (Apple, Red Delicious) PTHIO_075
3 0.31 0.03 28 28
0.2 0.26
0.015 0.017
0.01 0.013
0.023 0.029
0.012 0.012
< 0.01 < 0.01
Parent: 0.23 Total: 0.26
USA (ID), Weiser 2007 (Apple, Law Rome) PTHIO_075
3 0.31 0.03 28 28
0.16 0.14
< 0.01 < 0.01
< 0.01 < 0.01
< 0.01 < 0.01
< 0.01 < 0.01
< 0.01 < 0.01
Parent: 0.15 Total: 0.17

Penthiopyrad
1469
Location, Year (variety) Reference
Application DAT Residues, mg/kg Selected residue mg/kg b n kg ai/ha kg
ai/hL parent PAM PCA 753-A-
OH 753-F-DO
DM-PCA
USA (OR), Hood River 2007 (Apple, Jonagold) PTHIO_075
3 0.31 0.3100.3
0.03 0.03 0.03
28 28
0.12 0.11
< 0.01 < 0.01
< 0.01 < 0.01
< 0.01 < 0.01
< 0.01 < 0.01
< 0.01 < 0.01
Parent: 0.12 Total: 0.13
Canada, Penticton 2007 (Apple, Gala) PTHIO_075
3 0.31 0.04 29 29
0.22 0.23
< 0.01 < 0.01
< 0.01 < 0.01
0.018 0.017
< 0.01 < 0.01
< 0.01 < 0.01
Parent: 0.23 Total: 0.24
USA (NY), North Rose 2007 (Pear, Bosc) PTHIO_075
3 0.31 0.03 28 28
0.11 0.083
< 0.01 < 0.01
< 0.01 < 0.01
0.013 < 0.01
< 0.01 < 0.01
< 0.01 < 0.01
Parent: 0.097 Total: 0.12
USA (MN), Paynesville 2007 (Pear, Parker) PTHIO_075
3 0.31 0.03 28 28
< 0.01 < 0.01
< 0.01 < 0.01
< 0.01 < 0.01
< 0.01 < 0.01
< 0.01 < 0.01
< 0.01 < 0.01
Parent: < 0.01 Total: < 0.01
Canada, Beamsville 2007 (Pear, Bosc PTHIO_075
3 0.3 0.03 28 28
0.23 0.26
0.012 0.013
< 0.01 < 0.01
0.017 0.017
0.011 0.013
< 0.01 < 0.01
Parent: 0.25 Total: 0.27
Canada, Jordan Station 2007 (Pear, Bosc) PTHIO_075
3 0.3 0.31 0.3
0.03 0.03 0.03
29 29
0.18 0.19
0.02 0.02
< 0.01 < 0.01
0.017 0.018
0.015 0.016
< 0.01 < 0.01
Parent: 0.19 Total: 0.22
Canada, London 2007 (Pear, Bosc) PTHIO_075
3 0.3 0.04 27 27
0.2 0.16
0.011 < 0.01
< 0.01 < 0.01
0.023 0.02
< 0.01 < 0.01
< 0.01 < 0.01
Parent: 0.18 Total: 0.2
USA (CA), Madera 2007 (Pear, Asian Hogai) PTHIO_075
3 0.31 0.03 28 28
0.063 0.065
0.013 0.015
< 0.01 0.01
< 0.01 < 0.01
< 0.01 < 0.01
< 0.01 < 0.01
Parent: 0.064 Total: 0.09
USA (CA), Lindsay 2007 (Pear, Olympic) PTHIO_075
3 0.31 0.31 0.31
0.03 0.02 0.02
28 28
0.11 0.12
< 0.01 < 0.01
< 0.01 < 0.01
< 0.01 < 0.01
< 0.01 < 0.01
< 0.01 < 0.01
Parent: 0.12 Total: 0.13

Penthiopyrad
1470
Location, Year (variety) Reference
Application DAT Residues, mg/kg Selected residue mg/kg b n kg ai/ha kg
ai/hL parent PAM PCA 753-A-
OH 753-F-DO
DM-PCA
USA (WA), Ephrata 2007 (Pear, Concord) PTHIO_075
3 0.31 0.03 28 28
0.15 0.18
0.012 0.012
< 0.01 < 0.01
0.039 0.041
0.014 0.015
< 0.01 < 0.01
Parent: 0.17 Total: 0.19
USA (OR), Hood River 2007 (Pear, Red Clapp) PTHIO_075
3 0.31 0.03 28 28
0.044 0.026
< 0.01 < 0.01
< 0.01 < 0.01
< 0.01 < 0.01
< 0.01 < 0.01
< 0.01 < 0.01
Parent: 0.035 Total: 0.054
Canada, Penticton 2007 (Pear, Bartlett) PTHIO_075
3 0.31 0.04 29 29
0.25 0.19
< 0.01 < 0.01
< 0.01 < 0.01
< 0.01 < 0.01
< 0.01 < 0.01
< 0.01 < 0.01
Parent: 0.22 Total: 0.24
USA (NY), North Rose 2007 (Apple, Ida Red) PTHIO_103
3 0.31 0.03 28 0.14 < 0.01 < 0.01 < 0.01 < 0.01 < 0.01 Parent: 0.14 Total: 0.16
USA (MI), Conklin 2007 (Apple, Idared) PTHIO_103
3 0.3 0.03 28 0.12 < 0.01 < 0.01 < 0.01 < 0.01 < 0.01 Parent: 0.12 Total: 0.14
USA (ID), Weiser 2007 (Apple, Law Rome) PTHIO_103
3 0.31 0.03 28 0.23 < 0.01 < 0.01 < 0.01 < 0.01 < 0.01 Parent: 0.23 Total: 0.25
a before last treatment b mean of replicate samples (if applicable); total residue based on the edible portion DAT: days after final treatment
Table 65 Residues in cherries following foliar application of penthiopyrad
Location, Year (variety) Reference
Application DAT Residues, mg/kg Selected residue mg/kg b n kg
ai/ha kg ai/hL
parent PAM PCA 753-A-OH
753-F-DO
DM-PCA
USA (OH), Marysville 2007 (Gold) PTHIO_076
3 0.29 0.29 0.3
0.03 0.03 0.03
Pitted fruits 0 0 whole fruits 0 0
0.85 0.74 0.47 0.41
< 0.01 < 0.01 < 0.01 < 0.01
< 0.01 < 0.01 < 0.01 < 0.01
< 0.01 < 0.01 < 0.01 < 0.01
< 0.01 < 0.01 < 0.01 < 0.01
< 0.01 < 0.01 < 0.01 < 0.01
Parent: 0.44 Total: 0.80

Penthiopyrad
1471
Location, Year (variety) Reference
Application DAT Residues, mg/kg Selected residue mg/kg b n kg
ai/ha kg ai/hL
parent PAM PCA 753-A-OH
753-F-DO
DM-PCA
USA (CA), Kerman 2007 (Brooks) PTHIO_076
3 0.31 0.31 0.3
0.04 0.04 0.04
Pitted fruits 0 0 whole fruits 0 0
0.93 1.1 0.83 0.97
< 0.01 < 0.01 < 0.01 < 0.01
< 0.01 < 0.01 < 0.01 < 0.01
0.054 0.049 0.048 0.044
< 0.01 < 0.01 < 0.01 < 0.01
< 0.01 < 0.01 < 0.01 < 0.01
Parent: 0.9 Total: 1.0
USA (WA), Zillah 2007 (Vans) PTHIO_076
3 0.29 0.3 0.3
0.03 0.03 0.03
Pitted fruits 0 0 whole fruits 0 0
1.4 1.4 1.3 1.2
0.011 0.012 0.01 0.01
< 0.01 < 0.01 < 0.01 < 0.01
0.087 0.085 0.075 0.072
< 0.01 < 0.01 < 0.01 < 0.01
< 0.01 < 0.01 < 0.01 < 0.01
Parent: 1.3 Total: 1.4
USA (OR), Dallas 2007 (Royal Ann) PTHIO_076
3 0.32 0.3 0.3
0.03 0.03 0.03
Pitted fruits 0 0 whole fruits 0 0
1.1 0.91 1.0 0.91
< 0.01 < 0.01 < 0.01 < 0.01
< 0.01 < 0.01 < 0.01 < 0.01
0.04 0.028 0.035 0.025
< 0.01 < 0.01 < 0.01 < 0.01
< 0.01 < 0.01 < 0.01 < 0.01
Parent: 0.96 Total: 1.0
USA (NY), Sodus 2007 (Mont Morency) PTHIO_076
3 0.31 0.31 0.3
0.03 0.03 0.03
Pitted fruits 0 0 whole fruits 0 0
1.4 1.1 1.2 0.99
0.016 0.016 0.014 0.013
< 0.01 < 0.01 < 0.01 < 0.01
0.052 0.052 0.045 0.045
< 0.01 < 0.01 < 0.01 < 0.01
< 0.01 < 0.01 < 0.01 < 0.01
Parent: 1.2 Total: 1.3
USA (MI), Shelby 2007 (Mont Morency) PTHIO_076
3 0.29 0.03 Pitted fruits 0 0 whole fruits 0 0
0.66 0.73 0.36 0.4
< 0.01 < 0.01 < 0.01 < 0.01
< 0.01 < 0.01 < 0.01 < 0.01
0.024 0.029 0.013 0.016
< 0.01 < 0.01 < 0.01 < 0.01
< 0.01 < 0.01 < 0.01 < 0.01
Parent: 0.38 Total: 0.71

Penthiopyrad
1472
Location, Year (variety) Reference
Application DAT Residues, mg/kg Selected residue mg/kg b n kg
ai/ha kg ai/hL
parent PAM PCA 753-A-OH
753-F-DO
DM-PCA
Canada, St. Catharines 2007 (Montmercy) PTHIO_076
3 0.3 0.03 Pitted fruits 0 0 whole fruits 0 0
1.4 1.1 1.3 0.89
0.016 0.015 0.015 0.013
< 0.01 < 0.01 < 0.01 < 0.01
0.093 0.092 0.085 0.077
< 0.01 < 0.01 < 0.01 < 0.01
< 0.01 < 0.01 < 0.01 < 0.01
Parent: 1.1 Total: 1.3
USA (UT), Perry 2007 (Mont Morency) PTHIO_076
3 0.3 0.3 0.3
0.02 0.02 0.02
Pitted fruits 0 0 whole fruits 0 0
1.8 1.8 1.6 1.6
0.013 0.014 0.012 0.013
< 0.01 < 0.01 < 0.01 < 0.01
0.11 0.13 0.1 0.12
< 0.01 < 0.01 < 0.01 < 0.01
< 0.01 < 0.01 < 0.01 < 0.01
Parent: 1.6 Total: 1.8
USA (WA), Othello 2007 (Mont Morency) PTHIO_076
3 0.31 0.03 Pitted fruits 0 0 whole fruits 0 0
1.9 1.8 1.8 1.6
0.016 0.015 0.015 0.014
< 0.01 < 0.01 < 0.01 < 0.01
0.066 0.063 0.061 0.057
0.011 < 0.01 0.01 < 0.01
< 0.01 < 0.01 < 0.01 < 0.01
Parent: 1.7 Total: 1.9
a before last treatment b mean of replicate samples (if applicable); total residue based on the edible portion DAT: days after final treatment
Table 66 Residues in peaches following foliar application of penthiopyrad
Location, Year (variety) Reference
Application PHI Residues, mg/kg Selected residue mg/kg b n kg
ai/ha kg ai/hL
parent PAM PCA 753-A-OH
753-F-DO
DM-PCA
USA (NY), Alton 2007 (Gold Nine) PTHIO_076
3 0.31 0.3 0.31
0.03 0.03 0.03
Pitted fruits 0 0 whole fruits 0 0
0.7 0.6 0.64 0.57
< 0.01 < 0.01 < 0.01 < 0.01
< 0.01 < 0.01 < 0.01 < 0.01
0.024 0.019 0.022 0.018
< 0.01 < 0.01 < 0.01 < 0.01
< 0.01 < 0.01 < 0.01 < 0.01
Parent: 0.61 Total: 0.67

Penthiopyrad
1473
Location, Year (variety) Reference
Application PHI Residues, mg/kg Selected residue mg/kg b n kg
ai/ha kg ai/hL
parent PAM PCA 753-A-OH
753-F-DO
DM-PCA
USA (SC), Batesburg 2007 (Coronet) PTHIO_076
3 0.31 0.31 0.3
0.02 0.02 0.02
Pitted fruits 0 0 whole fruits 0 0
0.71 0.45 0.58 0.35
< 0.01 < 0.01 < 0.01 < 0.01
< 0.01 < 0.01 < 0.01 < 0.01
0.041 0.03 0.034 0.024
< 0.01 < 0.01 < 0.01 < 0.01
< 0.01 < 0.01 < 0.01 < 0.01
Parent: 0.47 Total: 0.60
USA (VA), Crouzet 2007 (Encore) PTHIO_076
3 0.29 0.05 Pitted fruits 0 0 whole fruits 0 0
0.22 0.54 0.2 0.49
< 0.01 0.01 < 0.01 < 0.01
< 0.01 < 0.01 < 0.01 < 0.01
0.014 0.028 0.013 0.025
< 0.01 < 0.01 < 0.01 < 0.01
< 0.01 < 0.01 < 0.01 < 0.01
Parent: 0.35 Total: 0.40
USA (GA), Plains 2007 (Redskin) PTHIO_076
3 0.3 0.02 Pitted fruits 0 0 whole fruits 0 0
0.58 0.65 0.52 0.59
< 0.01 < 0.01 < 0.01 < 0.01
< 0.01 < 0.01 < 0.01 < 0.01
0.031 0.034 0.028 0.031
< 0.01 < 0.01 < 0.01 < 0.01
< 0.01 < 0.01 < 0.01 < 0.01
Parent: 0.56 Total: 0.63
USA (MI), Conklin 2007 (Red Haven)
3 0.31 0.04 Pitted fruits 0 0 whole fruits 0 0
0.62 0.87 0.58 0.82
< 0.01 < 0.01 < 0.01 < 0.01
< 0.01 < 0.01 < 0.01 < 0.01
0.033 0.044 0.031 0.042
< 0.01 < 0.01 < 0.01 < 0.01
< 0.01 < 0.01 < 0.01 < 0.01
Parent: 0.7 Total: 0.76
Canada, Jordan Station 2007 (Harrow Diamond) PTHIO_076
3 0.31 0.31 0.32
0.03 0.04 0.03
Pitted fruits 0 0 whole fruits 0 0
0.76 0.67 0.71 0.66
0.01 < 0.01 < 0.01 < 0.01
< 0.01 < 0.01 < 0.01 < 0.01
0.027 0.025 0.025 0.024
< 0.01 < 0.01 < 0.01 < 0.01
< 0.01 < 0.01 < 0.01 < 0.01
Parent: 0.69 Total: 0.73

Penthiopyrad
1474
Location, Year (variety) Reference
Application PHI Residues, mg/kg Selected residue mg/kg b n kg
ai/ha kg ai/hL
parent PAM PCA 753-A-OH
753-F-DO
DM-PCA
Canada, Jordan Station 2007 (Vivid) PTHIO_076
3 0.32 0.31 0.31
0.03 Pitted fruits 0 0 whole fruits 0 0
0.42 0.62 0.34 0.53
< 0.01 < 0.01 < 0.01 < 0.01
< 0.01 < 0.01 < 0.01 < 0.01
0.028 0.02 0.022 0.017
< 0.01 < 0.01 < 0.01 < 0.01
< 0.01 < 0.01 < 0.01 < 0.01
Parent: 0.44 Total: 0.54
Canada, Arkona 2007 (Vivid) PTHIO_076
3 0.31 0.04 Pitted fruits 0 0 whole fruits 0 0
0.66 0.64 0.59 0.57
< 0.01 < 0.01 < 0.01 < 0.01
< 0.01 < 0.01 < 0.01 < 0.01
0.027 0.028 0.024 0.025
< 0.01 < 0.01 < 0.01 < 0.01
< 0.01 < 0.01 < 0.01 < 0.01
Parent: 0.58 Total: 0.67
USA (TX), Vernon 2007 (Alberta) PTHIO_076
3 0.31 0.03 Pitted fruits 0 0 whole fruits 0 0
1.5 1.7 1.3 1.5
< 0.01 < 0.01 < 0.01 < 0.01
< 0.01 < 0.01 < 0.01 < 0.01
< 0.01 < 0.01 < 0.01 < 0.01
< 0.01 < 0.01 < 0.01 < 0.01
< 0.01 < 0.01 < 0.01 < 0.01
Parent: 1.4 Total: 1.6
USA (CA), Sanger 2007 (White Lady) PTHIO_076
3 0.03 0.03 Pitted fruits 0 0 whole fruits 0 0
0.23 0.14 0.22 0.13
< 0.01 < 0.01 < 0.01 < 0.01
< 0.01 < 0.01 < 0.01 < 0.01
< 0.01 < 0.01 < 0.01 < 0.01
< 0.01 < 0.01 < 0.01 < 0.01
< 0.01 < 0.01 < 0.01 < 0.01
Parent: 0.18 Total: 0.20
USA (CA), Hickman 2007 (Summerset) PTHIO_076
3 0.32 0.3 0.31
0.03 0.02 0.02
Pitted fruits 0 0 whole fruits 0 0
0.68 0.71 0.56 0.67
< 0.01 < 0.01 < 0.01 < 0.01
< 0.01 < 0.01 < 0.01 < 0.01
0.026 0.025 0.022 0.024
< 0.01 < 0.01 < 0.01 < 0.01
< 0.01 < 0.01 < 0.01 < 0.01
Parent: 0.61 Total: 0.71

Penthiopyrad
1475
Location, Year (variety) Reference
Application PHI Residues, mg/kg Selected residue mg/kg b n kg
ai/ha kg ai/hL
parent PAM PCA 753-A-OH
753-F-DO
DM-PCA
USA (CA), Madera 2007 (Angelas) PTHIO_076
3 0.31 0.03 Pitted fruits 0a 0a 0 0 3 3 7 7 10 10 14 14 whole fruits 0a 0a
0 0 3 3 7 7 10 10 14 14
0.17 0.17 0.39 0.2 0.28 0.28 0.17 0.17 0.13 0.17 0.11 0.072 0.16 0.15 0.36 0.19 0.26 0.26 0.16 0.16 0.12 0.16 0.11 0.069
< 0.01 < 0.01 < 0.01 < 0.01 < 0.01 < 0.01 < 0.01 < 0.01 < 0.01 < 0.01 < 0.01 < 0.01 < 0.01 < 0.01 < 0.01 < 0.01 < 0.01 < 0.01 < 0.01 < 0.01 < 0.01 < 0.01 < 0.01 < 0.01
< 0.01 < 0.01 < 0.01 < 0.01 < 0.01 < 0.01 < 0.01 < 0.01 < 0.01 < 0.01 < 0.01 < 0.01 < 0.01 < 0.01 < 0.01 < 0.01 < 0.01 < 0.01 < 0.01 < 0.01 < 0.01 < 0.01 < 0.01 < 0.01
< 0.01 < 0.01 < 0.01 < 0.01 < 0.01 < 0.01 < 0.01 < 0.01 < 0.01 < 0.01 < 0.01 < 0.01 < 0.01 < 0.01 < 0.01 < 0.01 < 0.01 < 0.01 < 0.01 < 0.01 < 0.01 < 0.01 < 0.01 < 0.01
< 0.01 < 0.01 < 0.01 < 0.01 < 0.01 < 0.01 < 0.01 < 0.01 < 0.01 < 0.01 < 0.01 < 0.01 < 0.01 < 0.01 < 0.01 < 0.01 < 0.01 < 0.01 < 0.01 < 0.01 < 0.01 < 0.01 < 0.01 < 0.01
< 0.01 < 0.01 < 0.01 < 0.01 < 0.01 < 0.01 < 0.01 < 0.01 < 0.01 < 0.01 < 0.01 < 0.01 < 0.01 < 0.01 < 0.01 < 0.01 < 0.01 < 0.01 < 0.01 < 0.01 < 0.01 < 0.01 < 0.01 < 0.01
Parent: 0.28 Total: 0.31
Canada, Summerland 2007 (Cresthaven) PTHIO_076
3 0.3 0.31 0.31
0.04 0.04 0.04
Pitted fruits 0 0 whole fruits 0 0
0.19 0.42 0.13 0.27
< 0.01 < 0.01 < 0.01 < 0.01
< 0.01 < 0.01 < 0.01 < 0.01
< 0.01 < 0.01 < 0.01 < 0.01
< 0.01 < 0.01 < 0.01 < 0.01
< 0.01 < 0.01 < 0.01 < 0.01
Parent: 0.2 Total: 0.32
a before last treatment b mean of replicate samples (if applicable); total residue based on the edible portion
Table 67 Residues in plums following foliar application of penthiopyrad
Location, Year (variety) Reference
Application DAT Residues, mg/kg Selected residue mg/kg a n kg ai/ha kg
ai/hL parent PAM PCA 753-
A-OH 753-F-DO
DM-PCA

Penthiopyrad
1476
Location, Year (variety) Reference
Application DAT Residues, mg/kg Selected residue mg/kg a n kg ai/ha kg
ai/hL parent PAM PCA 753-
A-OH 753-F-DO
DM-PCA
Canada, Wolfville 2007 (Empress) PTHIO_076
3 0.31 0.03 Pitted fruits 0 a 0 whole fruits 0 a 0
0.095 0.073 0.09 0.07
< 0.01 < 0.01 < 0.01 < 0.01
< 0.01 < 0.01 < 0.01 < 0.01
< 0.01 < 0.01 < 0.01 < 0.01
< 0.01 < 0.01 < 0.01 < 0.01
< 0.01 < 0.01 < 0.01 < 0.01
Parent: 0.08 Total: 0.10
USA (MI), Hart 2007 (Stanley) PTHIO_076
3 0.29 0.29 0.3
0.03 Pitted fruits 0 0 whole fruits 0 0
0.3 0.14 0.21 0.094
< 0.01 < 0.01 < 0.01 < 0.01
< 0.01 < 0.01 < 0.01 < 0.01
< 0.01 < 0.01 < 0.01 < 0.01
< 0.01 < 0.01 < 0.01 < 0.01
< 0.01 < 0.01 < 0.01 < 0.01
Parent: 0.15 Total: 0.24
Canada, Beamsville 2007 (Victory) PTHIO_076
3 0.31 0.32 0.31
0.03 Pitted fruits 0 0 whole fruits 0 0
0.3 0.33 0.27 0.3
< 0.01 < 0.01 < 0.01 < 0.01
< 0.01 < 0.01 < 0.01 < 0.01
< 0.01 < 0.01 < 0.01 < 0.01
< 0.01 < 0.01 < 0.01 < 0.01
< 0.01 < 0.01 < 0.01 < 0.01
Parent: 0.29 Total: 0.33
Canada, Arkona 2007 (Stanley) PTHIO_076
3 0.3 0.31 0.31
0.04 Pitted fruits 0 0 whole fruits 0 0
0.78 0.84 0.74 0.8
< 0.01 < 0.01 < 0.01 < 0.01
< 0.01 < 0.01 < 0.01 < 0.01
0.015 0.013 0.014 0.012
< 0.01 < 0.01 < 0.01 < 0.01
< 0.01 < 0.01 < 0.01 < 0.01
Parent: 0.77 Total: 0.83
USA (CA), Sanger 2007 (Catalina) PTHIO_076
3 0.3 0.05 Pitted fruits 0 0 whole fruits 0 0
0.046 0.061 0.043 0.058
< 0.01 < 0.01 < 0.01 < 0.01
< 0.01 < 0.01 < 0.01 < 0.01
< 0.01 < 0.01 < 0.01 < 0.01
< 0.01 < 0.01 < 0.01 < 0.01
< 0.01 < 0.01 < 0.01 < 0.01
Parent: 0.51 Total: 0.072

Penthiopyrad
1477
Location, Year (variety) Reference
Application DAT Residues, mg/kg Selected residue mg/kg a n kg ai/ha kg
ai/hL parent PAM PCA 753-
A-OH 753-F-DO
DM-PCA
USA (CA), Hickman 2007 (Grand Rosa) PTHIO_076
3 0.32 0.3100.3
0.02 0.02 0.02
Pitted fruits 0 0 whole fruits 0 0
0.074 0.086 0.073 0.084
< 0.01 < 0.01 < 0.01 < 0.01
< 0.01 < 0.01 < 0.01 < 0.01
< 0.01 < 0.01 < 0.01 < 0.01
< 0.01 < 0.01 < 0.01 < 0.01
< 0.01 < 0.01 < 0.01 < 0.01
Parent: 0.076 Total: 0.099
USA (CA), Fresno 2007 (Flavor Rich) PTHIO_076
3 0.3 0.29 0.3
0.03 0.02 0.03
Pitted fruits 0 0 whole fruits 0 0
0.094 0.11 0.08 0.097
< 0.01 < 0.01 < 0.01 < 0.01
< 0.01 < 0.01 < 0.01 < 0.01
< 0.01 < 0.01 < 0.01 < 0.01
< 0.01 < 0.01 < 0.01 < 0.01
< 0.01 < 0.01 < 0.01 < 0.01
Parent: 0.089 Total: 0.12
USA (CA), Sanger 2007 (Angeleno) PTHIO_076
3 0.3 0.3 0.3
0.05 0.03 0.03
Pitted fruits 0 0 whole fruits 0 0
0.048 0.05 0.046 0.048
< 0.01 < 0.01 < 0.01 < 0.01
< 0.01 < 0.01 < 0.01 < 0.01
< 0.01 < 0.01 < 0.01 < 0.01
< 0.01 < 0.01 < 0.01 < 0.01
< 0.01 < 0.01 < 0.01 < 0.01
Parent: 0.047 Total: 0.068
USA (ID), Payette 2007 (Empress) PTHIO_076
3 0.3 0.31 0.31
0.03 0.03 0.03
Pitted fruits 0 0 whole fruits 0 0
0.12 0.13 0.12 0.13
< 0.01 < 0.01 < 0.01 < 0.01
< 0.01 < 0.01 < 0.01 < 0.01
< 0.01 < 0.01 < 0.01 < 0.01
< 0.01 < 0.01 < 0.01 < 0.01
< 0.01 < 0.01 < 0.01 < 0.01
Parent: 0.13 Total: 0.14
USA (OR), Dallas 2007 (Moyer) PTHIO_076
3 0.31 0.31 0.3
0.04 0.04 0.03
Pitted fruits 0 0 whole fruits 0 0
0.093 0.13 0.089 0.12
< 0.01 < 0.01 < 0.01 < 0.01
< 0.01 < 0.01 < 0.01 < 0.01
< 0.01 < 0.01 < 0.01 < 0.01
< 0.01 < 0.01 < 0.01 < 0.01
< 0.01 < 0.01 < 0.01 < 0.01
Parent: 0.11 Total: 0.13

Penthiopyrad
1478
Location, Year (variety) Reference
Application DAT Residues, mg/kg Selected residue mg/kg a n kg ai/ha kg
ai/hL parent PAM PCA 753-
A-OH 753-F-DO
DM-PCA
USA (MI), Cinklin 2007 (Vision) PTHIO_105
3 0.3 0.04 Pitted fruits 0 whole fruits 0
0.12 0.12
< 0.01 < 0.01
< 0.01 < 0.01
< 0.01 < 0.01
< 0.01 < 0.01
< 0.01 < 0.01
Parent: 0.12 Total: 0.14
USA (CA), Kerman 2007 (French) PTHIO_105
3 0.3 0.02 Pitted fruits 0 whole fruits 0
0.1 0.1
< 0.01 < 0.01
< 0.01 < 0.01
< 0.01 < 0.01
< 0.01 < 0.01
< 0.01 < 0.01
Parent: 0.1 Total: 0.12
a mean of replicate samples (if applicable); total residue based on the edible portion DAT: days after final treatment
Table 68 Residues in strawberries following foliar application of penthiopyrad
Location, Year (variety) Reference
Application DAT Residues, mg/kg Selected residue mg/kg b n kg
ai/ha kg ai/hL
parent PAM PCA 753-A-OH
753-F-DO
DM-PCA
USA (PA), New Tripoli 2008 (Allstar) PTHIO_080
3 0.35 0.04 0 0
0.34 0.4
< 0.01 < 0.01
< 0.01 < 0.01
0.067 0.029
< 0.01 < 0.01
< 0.01 < 0.01
Parent: 0.37 Total: 0.39
USA (FL), Oviedo 2008 (Camarosa) PTHIO_080
3 0.35 0.36 0.36
0.13 0.13 0.13
0 0 0 0
2.2 1.8 1.6 1.5
0.021 0.019 0.022 0.02
< 0.01 < 0.01 < 0.01 < 0.01
0.046 0.044 0.042 0.042
< 0.01 < 0.01 < 0.01 < 0.01
< 0.01 < 0.01 < 0.01 < 0.01
Parent: 1.8 Total: 1.8
Canada, St. Jean-Baptiste 2008 (Kent) PTHIO_080
3 0.35 0.34 0.33
0.14 0.14 0.14
0 0
0.49 0.42
0.01 0.01
< 0.01 < 0.01
0.014 0.011
< 0.01 < 0.01
< 0.01 < 0.01
Parent: 0.46 Total: 0.47
Canada, Thorndale 2008 (Saphire) PTHIO_080
3 0.38 0.36 0.36
0.15 0.14 0.14
0 0
0.67 0.86
0.021 0.017
< 0.01 < 0.01
0.034 0.024
0.011 < 0.01
< 0.01 < 0.01
Parent: 0.77 Total: 0.8
Canada, Brantford 2008 (Mira) PTHIO_080
3 0.37 0.36 0.42
0.09 0.09 0.09
0 0 0 0
0.69 0.65 0.15 0.17
< 0.01 < 0.01 < 0.01 < 0.01
< 0.01 < 0.01 < 0.01 < 0.01
< 0.01 < 0.01 < 0.01 < 0.01
< 0.01 < 0.01 < 0.01 < 0.01
< 0.01 < 0.01 < 0.01 < 0.01
Parent: 0.41 Total: 0.43

Penthiopyrad
1479
Location, Year (variety) Reference
Application DAT Residues, mg/kg Selected residue mg/kg b n kg
ai/ha kg ai/hL
parent PAM PCA 753-A-OH
753-F-DO
DM-PCA
USA (MI), Comstock Park 2008 (Darselect) PTHIO_080
3 0.35 0.12 0a 0a 0 0 1 1 3 3 7 7 10 10
0.26 0.28 0.84 0.9 0.71 0.65 0.43 0.79 0.37 0.37 0.34 0.32
0.01 0.01 0.012 0.012 0.017 0.013 0.015 0.019 0.023 0.026 0.027 0.024
< 0.01 < 0.01 < 0.01 < 0.01 < 0.01 < 0.01 < 0.01 < 0.01 < 0.01 < 0.01 < 0.01 < 0.01
0.033 0.035 0.04 0.038 0.031 0.031 0.029 0.037 0.029 0.033 0.038 0.034
< 0.01 < 0.01 < 0.01 < 0.01 < 0.01 < 0.01 < 0.01 < 0.01 0.011 0.012 < 0.01 < 0.01
< 0.01 < 0.01 < 0.01 < 0.01 < 0.01 < 0.01 < 0.01 < 0.01 < 0.01 < 0.01 < 0.01 < 0.01
Parent: 0.87 Total: 0.89
USA (CA), Sanger 2008 (Albion) PTHIO_080
3 0.36 0.05 0 0
1.2 1.5
0.03 0.038
0.015 0.022
0.035 0.033
< 0.01 < 0.01
< 0.01 < 0.01
Parent: 1.4 Total: 1.4
USA (CA), Santa Monica 2008 (Albion) PTHIO_080
3 0.35 0.35 0.36
0.12 0.12 0.13
0 0 0 0
1.4 1.0 0.63 1.0
0.061 0.057 0.04 0.054
0.016 0.014 0.011 0.012
0.07 0.061 0.05 0.075
0.017 0.014 < 0.01 < 0.01
< 0.01 < 0.01 < 0.01 < 0.01
Parent: 1.0 Total: 1.1
USA (OR), Junction City 2008 (Shuksan) PTHIO_080
3 0.35 0.08 0 0
0.68 0.56
< 0.01 < 0.01
< 0.01 < 0.01
0.01 0.013
< 0.01 < 0.01
< 0.01 < 0.01
Parent: 0.62 Total: 0.64
a before last treatment b mean of replicate samples (if applicable); total residue based on the edible portion DAT: days after final treatment
Table 69 Residues in bulb onions following foliar application of penthiopyrad
Location, Year (variety) Reference
Application DAT Residues, mg/kg Selected residue mg/kg a
n kg ai/ha
kg ai/hL
parent PAM PCA 753-A-OH
753-F-DO
DM-PCA
USA (NY), North Rose 2008 (Bonker) PTHIO_081
3 0.36 0.36 0.35
0.13 0.13 0.13
3 3
0.44 0.45
0.14 0.16
0.022 0.025
< 0.01 < 0.01
0.014 0.018
< 0.01 < 0.01
Parent: 0.45 Total: 0.72
Canada, Marc-sur-Richelieu 2008 (Sturon) PTHIO_081
3 0.35 0.35 0.34
0.14 0.14 0.14
3 3
0.061 0.046
< 0.01 < 0.01
0.016 0.022
< 0.01 < 0.01
< 0.01 < 0.01
< 0.01 < 0.01
Parent: 0.054 Total: 0.072
Canada, Delhi 2008 (Nebula) PTHIO_081
3 0.37 0.38 0.38
0.19 0.19 0.19
2 2
0.13 0.14
< 0.01 < 0.01
< 0.01 < 0.01
< 0.01 < 0.01
< 0.01 < 0.01
< 0.01 < 0.01
Parent: 0.14 Total: 0.15

Penthiopyrad
1480
Location, Year (variety) Reference
Application DAT Residues, mg/kg Selected residue mg/kg a
n kg ai/ha
kg ai/hL
parent PAM PCA 753-A-OH
753-F-DO
DM-PCA
Canada, Branchton 2008 (Hamlet) PTHIO_081
3 0.36 0.34 0.36
0.18 0.17 0.18
3 3
0.33 0.38
< 0.01 < 0.01
< 0.01 < 0.01
< 0.01 < 0.01
< 0.01 < 0.01
< 0.01 < 0.01
Parent: 0.36 Total: 0.37
Canada, Thorndale 2008 (212-Arsenal) PTHIO_081
3 0.35 0.37 0.36
0.14 0.14 0.16
3 3
0.066 0.063
0.012 < 0.01
0.031 0.022
< 0.01 < 0.01
< 0.01 < 0.01
< 0.01 < 0.01
Parent: 0.065 Total: 0.085
Canada, Lakeside 2008 (Arsenal) PTHIO_081
3 0.36 0.35 0.34
0.14 0.14 0.14
3 3
0.06 0.039
< 0.01 < 0.01
0.013 0.011
< 0.01 < 0.01
< 0.01 < 0.01
< 0.01 < 0.01
Parent: 0.05 Total: 0.068
USA (TX), Uvalde 2008 (Texas Early White) PTHIO_081
3 0.36 0.15 3 3
0.092 0.16
< 0.01 < 0.01
< 0.01 < 0.01
< 0.01 < 0.01
< 0.01 < 0.01
< 0.01 < 0.01
Parent: 0.13 Total: 0.14
USA (TX), Levelland 2008 (Yellow Spanisch) PTHIO_081
3 0.35 0.36 0.37
0.13 0.13 0.13
3 3
0.064 0.063
< 0.01 < 0.01
0.017 0.018
< 0.01 < 0.01
< 0.01 < 0.01
< 0.01 < 0.01
Parent: 0.064 Total: 0.082
USA (CA), Fresno 2008 (Gunnison F1) PTHIO_081
3 0.36 0.04 3 3
< 0.01 0.01
< 0.01 < 0.01
0.034 0.043
< 0.01 < 0.01
< 0.01 < 0.01
< 0.01 < 0.01
Parent: 0.01 Total: 0.029
USA (CA), Hughson 2008 (Ringmaster) PTHIO_081
3 0.35 0.36 0.36
0.13 0.13 0.13
3 3
0.018 < 0.01
< 0.01 < 0.01
0.027 0.016
< 0.01 < 0.01
< 0.01 < 0.01
< 0.01 < 0.01
Parent: 0.014 Total: 0.033
USA (ID), Jerome 2008 (Harmony) PTHIO_081
3 0.35 0.34 0.35
0.16 0.16 0.16
7 7
0.05 0.036
< 0.01 < 0.01
< 0.01 < 0.01
< 0.01 < 0.01
< 0.01 < 0.01
< 0.01 < 0.01
Parent: 0.043 Total: 0.062
a mean of replicate samples (if applicable); total residue based on the edible portion DAT: days after final treatment
Table 70 Residues in green onions following foliar application of penthiopyrad
Location, Year (variety) Reference
Application DAT Residues, mg/kg Selected residue mg/kg, b n kg
ai/ha kg ai/hL
parent PAM PCA 753-A-OH
753-F-DO
DM-PCA

Penthiopyrad
1481
Location, Year (variety) Reference
Application DAT Residues, mg/kg Selected residue mg/kg, b n kg
ai/ha kg ai/hL
parent PAM PCA 753-A-OH
753-F-DO
DM-PCA
Canada, St. Marc-sur-Richelieu 2008 (Long White Tokyo) PTHIO_081
3 0.36 0.34 0.34
0.18 0.18 0.18
0a 0a 0 0 1 1 3 3 7 7 10 10
0.045 0.045 1.3 1.4 1.1 1.0 1.0 0.71 0.27 0.24 0.2 0.19
0.017 0.017 0.019 0.025 0.025 0.022 0.028 0.021 0.028 0.029 0.041 0.04
< 0.01 < 0.01 0.011 0.013 0.013 0.014 0.015 0.011 0.016 0.016 0.017 0.018
< 0.01 < 0.01 < 0.01 < 0.01 < 0.01 < 0.01 < 0.01 < 0.01 < 0.01 < 0.01 < 0.01 < 0.01
< 0.01 < 0.01 0.014 0.017 0.012 0.014 0.015 0.011 < 0.01 < 0.01 0.01 0.01
< 0.01 < 0.01 < 0.01 < 0.01 < 0.01 < 0.01 < 0.01 < 0.01 < 0.01 < 0.01 < 0.01 < 0.01
Parent: 0.86 Total: 1.2
Canada, Branchton 2008 (Lisbon) PTHIO_081
3 0.36 0.36 0.39
0.18 0.18 0.19
3 3
0.21 0.24
0.062 0.077
0.016 0.018
< 0.01 < 0.01
< 0.01 < 0.01
0.029 0.034
Parent: 0.23 Total: 0.35
USA (TX), East Bernard 2008 (Evergreen White Bunching) PTHIO_081
3 0.36 0.16 3 3
0.21 0.21
0.24 0.27
0.11 0.11
< 0.01 0.01
0.018 0.018
0.01 0.012
Parent: 0.21 Total: 0.68
USA (CA), Fresno 2008 (White Spear) PTHIO_081
3 0.35 0.04 3 3
0.54 0.55
0.062 0.067
0.012 0.028
< 0.01 < 0.01
0.035 0.036
< 0.01 < 0.01
Parent: 0.55 Total: 0.67
USA (CA), Hickman 2008 (Southport White 404) PTHIO_081
3 0.36 0.35 0.35
0.13 0.12 0.13
3 3
0.85 1.0
0.088 0.11
0.048 0.05
< 0.01 < 0.01
0.043 0.049
0.011 0.012
Parent: 0.93 Total: 1.1
USA (CA), Sanger 2008 (Southport White 404) PTHIO_081
3 0.36 0.04 3 3
1.8 1.7
0.15 0.14
0.055 0.046
< 0.01 < 0.01
0.079 0.083
0.017 0.015
Parent: 1.8 Total: 2.0
a before last treatment b mean of replicate samples (if applicable); total residue based on the edible portion DAT: days after final treatment
Table 71 Residues in broccoli following foliar application of penthiopyrad
Location, Year (variety) Reference
Application DAT Residues, mg/kg Selected residue mg/kg b
n kg ai/ha
kg ai/hL
parent PAM PCA 753-A-OH
753-F-DO
DM-PCA

Penthiopyrad
1482
Location, Year (variety) Reference
Application DAT Residues, mg/kg Selected residue mg/kg b
n kg ai/ha
kg ai/hL
parent PAM PCA 753-A-OH
753-F-DO
DM-PCA
USA (NY), Alton 2009 (Blue Wind) PTHIO_082
3 0.16 0.45 0.47
0.06 0.16 0.17
0 0 edible part 0 0
0.55 0.75 1.0 0.62
< 0.01 < 0.01 < 0.01 < 0.01
0.12 0.11 0.13 0.12
< 0.01 < 0.01 < 0.01 < 0.01
0.024 0.032 0.092 0.051
< 0.01 < 0.01 < 0.01 < 0.01
Parent: 0.65 Total: 0.67
USA (OH), Richwood 2009 (Premium Crop) PTHIO_082
3 0.16 0.47 0.46
0.1 0.28 0.28
0 0 edible part 0 0
2.0 1.8 1.7 1.6
< 0.01 0.01 0.011 0.011
0.12 0.12 0.12 0.12
< 0.01 < 0.01 < 0.01 < 0.01
0.033 0.038 0.048 0.044
< 0.01 < 0.01 < 0.01 < 0.01
Parent: 1.9 Total: 1.9
Canada, Branchton 2009 (Diplomat) PTHIO_082
3 0.15 0.45 0.47
0.02 0.05 0.05
0 0
2.2 2.5
0.014 0.018
0.099 0.1
< 0.01 < 0.01
0.061 0.058
< 0.01 < 0.01
Parent: 2.4 Total: 2.4
USA (CA), Porterville 2009 (Heritage) PTHIO_082
3 0.15 0.45 0.45
0.06 0.17 0.17
0 0 edible part 0 0
1.8 0.97 0.54 0.76
0.02 0.01 < 0.01 < 0.01
0.097 0.078 0.097 0.12
< 0.01 < 0.01 < 0.01 < 0.01
0.083 0.061 0.068 0.081
< 0.01 < 0.01 < 0.01 < 0.01
Parent: 1.4 Total: 1.4
USA (CA), Madera 2009 (Heritage) PTHIO_082
3 0.16 0.46 0.46
0.06 0.17 0.17
0 0
0.64 1.1
< 0.01 0.01
0.046 0.06
< 0.01 0.011
0.015 0.018
< 0.01 < 0.01
Parent: 0.87 Total: 0.89
USA (AZ), Yuma 2009 (General) PTHIO_082
3 0.16 0.46 0.46
0.09 0.25 0.25
0 0
1.3 1.4
< 0.01 < 0.01
< 0.01 < 0.01
< 0.01 < 0.01
< 0.01 < 0.01
< 0.01 < 0.01
Parent: 1.4 Total: 1.4
USA (CA), Sanger 2009 (Magic Green) PTHIO_082
3 0.16 0.45 0.45
0.03 0.07 0.07
0a 0a 0 0 3 3 7 7 10 10
1.8 1.8 1.7 2.0 1.7 1.3 1.5 1.4 1.4 1.1
0.012 0.013 0.012 0.015 0.013 0.012 0.023 0.024 0.018 0.019
0.033 0.033 0.029 0.033 0.047 0.038 0.065 0.066 0.068 0.077
< 0.01 < 0.01 < 0.01 0.01 < 0.01 < 0.01 0.014 0.013 0.01 0.012
0.035 0.034 0.032 0.041 0.047 0.037 0.045 0.047 0.028 0.029
< 0.01 < 0.01 < 0.01 < 0.01 < 0.01 < 0.01 < 0.01 < 0.01 < 0.01 < 0.01
Parent: 1.9 Total: 1.9
a before last treatment b mean of replicate samples (if applicable); total residue based on the edible portion DAT: days after final treatment
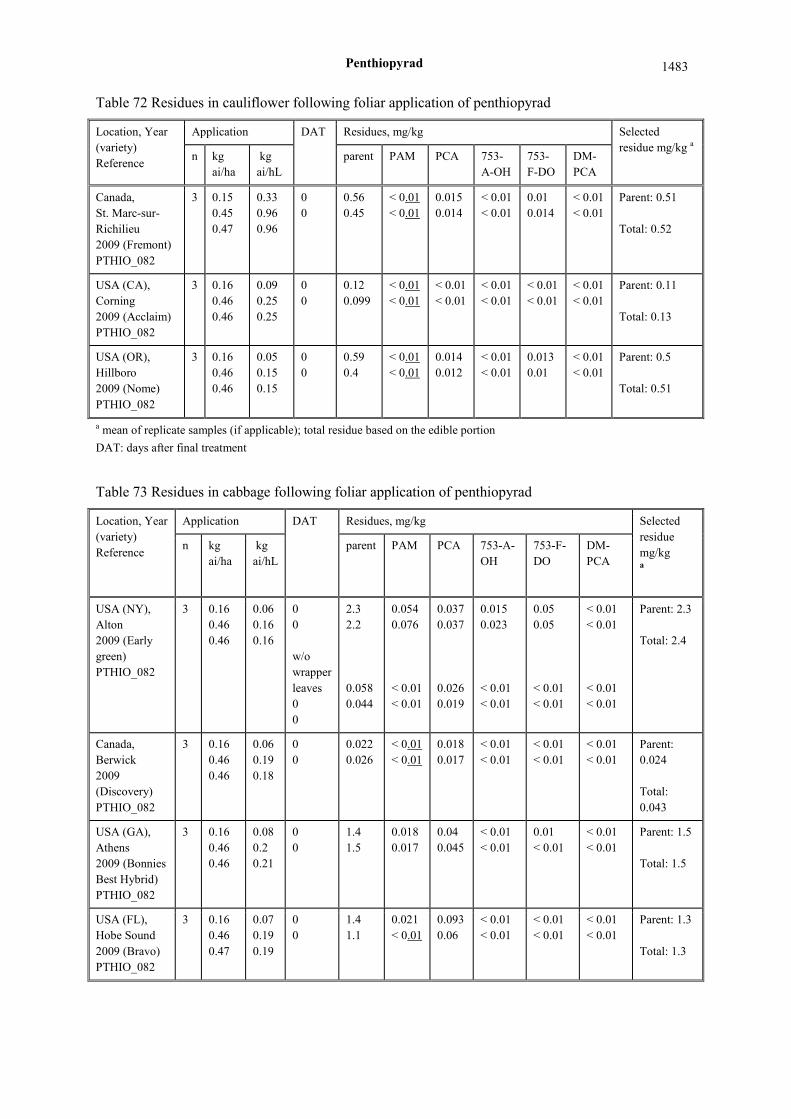
Penthiopyrad
1483
Table 72 Residues in cauliflower following foliar application of penthiopyrad
Location, Year (variety) Reference
Application DAT Residues, mg/kg Selected residue mg/kg a
n kg ai/ha
kg ai/hL
parent PAM PCA 753-A-OH
753-F-DO
DM-PCA
Canada, St. Marc-sur-Richilieu 2009 (Fremont) PTHIO_082
3 0.15 0.45 0.47
0.33 0.96 0.96
0 0
0.56 0.45
< 0.01 < 0.01
0.015 0.014
< 0.01 < 0.01
0.01 0.014
< 0.01 < 0.01
Parent: 0.51 Total: 0.52
USA (CA), Corning 2009 (Acclaim) PTHIO_082
3 0.16 0.46 0.46
0.09 0.25 0.25
0 0
0.12 0.099
< 0.01 < 0.01
< 0.01 < 0.01
< 0.01 < 0.01
< 0.01 < 0.01
< 0.01 < 0.01
Parent: 0.11 Total: 0.13
USA (OR), Hillboro 2009 (Nome) PTHIO_082
3 0.16 0.46 0.46
0.05 0.15 0.15
0 0
0.59 0.4
< 0.01 < 0.01
0.014 0.012
< 0.01 < 0.01
0.013 0.01
< 0.01 < 0.01
Parent: 0.5 Total: 0.51
a mean of replicate samples (if applicable); total residue based on the edible portion DAT: days after final treatment
Table 73 Residues in cabbage following foliar application of penthiopyrad
Location, Year (variety) Reference
Application DAT Residues, mg/kg Selected residue mg/kg a
n kg ai/ha
kg ai/hL
parent PAM PCA 753-A-OH
753-F-DO
DM-PCA
USA (NY), Alton 2009 (Early green) PTHIO_082
3 0.16 0.46 0.46
0.06 0.16 0.16
0 0 w/o wrapper leaves 0 0
2.3 2.2 0.058 0.044
0.054 0.076 < 0.01 < 0.01
0.037 0.037 0.026 0.019
0.015 0.023 < 0.01 < 0.01
0.05 0.05 < 0.01 < 0.01
< 0.01 < 0.01 < 0.01 < 0.01
Parent: 2.3 Total: 2.4
Canada, Berwick 2009 (Discovery) PTHIO_082
3 0.16 0.46 0.46
0.06 0.19 0.18
0 0
0.022 0.026
< 0.01 < 0.01
0.018 0.017
< 0.01 < 0.01
< 0.01 < 0.01
< 0.01 < 0.01
Parent: 0.024 Total: 0.043
USA (GA), Athens 2009 (Bonnies Best Hybrid) PTHIO_082
3 0.16 0.46 0.46
0.08 0.2 0.21
0 0
1.4 1.5
0.018 0.017
0.04 0.045
< 0.01 < 0.01
0.01 < 0.01
< 0.01 < 0.01
Parent: 1.5 Total: 1.5
USA (FL), Hobe Sound 2009 (Bravo) PTHIO_082
3 0.16 0.46 0.47
0.07 0.19 0.19
0 0
1.4 1.1
0.021 < 0.01
0.093 0.06
< 0.01 < 0.01
< 0.01 < 0.01
< 0.01 < 0.01
Parent: 1.3 Total: 1.3

Penthiopyrad
1484
Location, Year (variety) Reference
Application DAT Residues, mg/kg Selected residue mg/kg a
n kg ai/ha
kg ai/hL
parent PAM PCA 753-A-OH
753-F-DO
DM-PCA
USA (OH), Richwood 2009 (Stonehead) PTHIO_082
3 0.16 0.46 0.46
0.1 0.28 0.28
0 0 w/o wrapper leaves 0 0
0.067 0.11 0.011 0.015
< 0.01 < 0.01 < 0.01 < 0.01
0.034 0.031 0.016 0.038
< 0.01 < 0.01 < 0.01 < 0.01
< 0.01 < 0.01 < 0.01 < 0.01
< 0.01 < 0.01 < 0.01 < 0.01
Parent: 0.089 Total: 0.11
Canada, Branchton 2009 (Red Dynasty) PTHIO_082
3 0.16 0.45 0.45
0.02 0.05 0.05
0 0
1.1 0.89
0.018 0.023
0.033 0.036
< 0.01 0.01
0.024 0.019
< 0.01 < 0.01
Parent: 1.0 Total: 1.0
Canada, St. Marc-sur-Richilieu 2009 (Bronco) PTHIO_082
3 0.16 0.45 0.44
0.33 0.96 0.96
0 0
0.16 0.28
< 0.01 < 0.01
0.014 0.016
< 0.01 < 0.01
< 0.01 < 0.01
< 0.01 < 0.01
Parent: 0.22 Total: 0.24
USA (ZX), Uvalde 2009 (Pennant) PTHIO_082
3 0.16 0.46 0.45
0.11 0.33 0.32
0 0
0.38 0.57
< 0.01 < 0.01
0.13 0.11
< 0.01 < 0.01
< 0.01 < 0.01
< 0.01 < 0.01
Parent: 0.48 Total: 0.49
USA (OK), Hinton 2009 (Showboat) PTHIO_082
3 0.16 0.46 0.45
0.08 0.24 0.24
0 0
0.18 0.2
< 0.01 < 0.01
0.021 0.024
< 0.01 < 0.01
< 0.01 < 0.01
< 0.01 < 0.01
Parent: 0.19 Total: 0.21
USA (CA), Porterville 2009 (Supreme Vantage) PTHIO_082
3 0.15 0.45 0.45
0.06 0.17 0.17
0 0 w/o wrapper leaves 0 0
0.29 0.29 0.2 0.22
< 0.01 0.013 < 0.01 < 0.01
0.046 0.047 0.052 0.061
< 0.01 < 0.01 < 0.01 < 0.01
< 0.01 < 0.01 < 0.01 < 0.01
< 0.01 < 0.01 < 0.01 < 0.01
Parent: 0.29 Total: 0.31
a mean of replicate samples (if applicable); total residue based on the edible portion DAT: days after final treatment
Table 74 Residues in courgettes and summer squash following foliar application of penthiopyrad
Location, Year (variety) Reference
Application DAT Residues, mg/kg Selected residue mg/kg b n kg
ai/ha kg ai/hL parent PAM PCA 753-A-OH 753-F-DO DM-
PCA
Protected

Penthiopyrad
1485
Location, Year (variety) Reference
Application DAT Residues, mg/kg Selected residue mg/kg b n kg
ai/ha kg ai/hL parent PAM PCA 753-A-OH 753-F-DO DM-
PCA
Spain, Los Palacios 2008 (Jedida) PTHIO_071
2 0.2 0.59
0.04 0.04
0a 0 1 3 7 14
0.021 0.19 0.29 0.23 0.046 0.012
< 0.01 < 0.01 < 0.01 < 0.01 < 0.01 < 0.01
< 0.01 < 0.01 < 0.01 < 0.01 < 0.01 < 0.01
< 0.01 < 0.01 < 0.01 0.01 < 0.01 < 0.01
< 0.01 < 0.01 < 0.01 < 0.01 < 0.01 < 0.01
< 0.01 < 0.01 < 0.01 < 0.01 < 0.01 < 0.01
France (South), Pernes-les-Fontaines 2008 (Cora) PTHIO_071
2 0.19 0.59
0.04 0.04
0a 0 1 3 7 14
0.014 0.2 0.083 0.13 0.01 < 0.01
< 0.01 < 0.01 < 0.01 < 0.01 < 0.01 < 0.01
< 0.01 < 0.01 < 0.01 < 0.01 < 0.01 < 0.01
< 0.01 < 0.01 < 0.01 0.01 < 0.01 < 0.01
< 0.01 < 0.01 < 0.01 < 0.01 < 0.01 < 0.01
< 0.01 < 0.01 < 0.01 < 0.01 < 0.01 < 0.01
France (North), Baisieux 2008 (Cora) PTHIO_071
2 0.2 0.6
0.04 0.04
1 0.38 < 0.01 < 0.01 < 0.01 < 0.01 < 0.01
Italy, Mediglia 2008 (Altea) PTHIO_071
2 0.2 0.58
0.04 0.04
1 0.46 < 0.01 < 0.01 0.014 < 0.01 < 0.01
Outdoor
Spain, Aguadulce 2008 (Nieve) PTHIO_072 Reverse decline
2 0.2 0.6
0.04 0.04
0a 0
< 0.01 0.36
< 0.01 < 0.01
< 0.01 < 0.01
< 0.01< 0.01 < 0.01< 0.01 < 0.01 < 0.01
2 0.2 0.6
0.04 0.04
1 0.37 < 0.01 < 0.01 0.01 < 0.01 < 0.01
2 0.2 0.6
0.04 0.04
3 0.12 < 0.01 < 0.01 < 0.01 < 0.01 < 0.01
2 0.2 0.6
0.04 0.04
7 0.017 < 0.01 < 0.01 < 0.01 < 0.01 < 0.01
2 0.2 0.59
0.04 0.04
14 < 0.01 < 0.01 < 0.01 < 0.01 < 0.01 < 0.01
Spain, Utrera 2008 (Zedide) PTHIO_072
2 0.2 0.6
0.04 0.04
1 0.17 < 0.01 < 0.01 < 0.01 < 0.01 < 0.01
Greece, Nea Magnisia 2008 (Lorea) PTHIO_072 Reverse decline
2 0.19 0.6
0.04 0.04
0a 0
0.029 0.2
< 0.01 < 0.01
< 0.01 < 0.01
< 0.01< 0.01 < 0.01< 0.01 < 0.01 < 0.01
2 0.19 0.58
0.04 0.04
1 0.28 < 0.01 < 0.01 < 0.01 < 0.01 < 0.01
2 0.2 0.6
0.04 0.04
3 0.075 < 0.01 < 0.01 < 0.01 < 0.01 < 0.01
2 0.19 0.6
0.04 0.04
7 0.024 < 0.01 < 0.01 < 0.01 < 0.01 < 0.01

Penthiopyrad
1486
Location, Year (variety) Reference
Application DAT Residues, mg/kg Selected residue mg/kg b n kg
ai/ha kg ai/hL parent PAM PCA 753-A-OH 753-F-DO DM-
PCA
2 0.2 0.59
0.04 0.04
14 < 0.01 < 0.01 < 0.01 < 0.01 < 0.01 0.01
Italy, Poasco San Donato 2008 (President) PTHIO_072
2 0.19 0.58
0.04 0.04
1 0.48 < 0.01 < 0.01 < 0.01 < 0.01 < 0.01
USA (NY), North Rose 2007 (Zucchini Select) PTHIO_073
4 0.25 0.11 1 1
0.16 0.092
< 0.01 < 0.01
< 0.01 < 0.01
0.015 < 0.01
< 0.01< 0.01 < 0.01 < 0.01
Parent: 0.13 Total: 0.15
USA (IA), Richland 2007 (Crookneck) PTHIO_073
4 0.25 0.08 1 1
< 0.01 0.01
< 0.01 < 0.01
< 0.01 < 0.01
< 0.01< 0.01 < 0.01< 0.01 < 0.01 < 0.01
Parent: 0.01 Total: 0.029
Canada, Branchton 2007 (Senator) PTHIO_073
4 0.25 0.27 0.26 0.26
0.07 0.08 0.07 0.07
1 1
0.21 0.15
< 0.01 < 0.01
< 0.01 < 0.01
< 0.01< 0.01 < 0.01< 0.01 0.012 0.011
Parent: 0.18 Total: 0.2
Canada, Branchton 2007 (Zucchini Select) PTHIO_073
4 0.25 0.24 0.25 0.25
0.08 0.08 0.08 0.08
1 1
0.24 0.14
< 0.01 < 0.01
< 0.01 < 0.01
0.023 < 0.01
< 0.01< 0.01 < 0.01 < 0.01
Parent: 0.19 Total: 0.21
a before last treatment b mean of replicate samples (if applicable); total residue based on the edible portion DAT: days after final treatment
Table 75 Residues in cucumbers following foliar application of penthiopyrad
Location, Year (variety) Reference
Application DAT Residues, mg/kg Selected residue mg/kg b
n kg ai/ha
kg ai/hL
parent PAM PCA 753-A-OH 753-F-DO DM-PCA
Protected
Italy, Triginto die Mediglia 2007 (Edona) PTHIO_071
2 0.2 0.59
0.04 0.04
0a 0 1 3 7 14
0.011 0.2 0.13 0.031 0.018 < 0.01
< 0.01 < 0.01 < 0.01 < 0.01 < 0.01 < 0.01
< 0.01 < 0.01 < 0.01 < 0.01 < 0.01 < 0.01
< 0.01 0.026 0.024 0.02 < 0.01 < 0.01
< 0.01 < 0.01 < 0.01 < 0.01 < 0.01 < 0.01
< 0.01 < 0.01 < 0.01 < 0.01 < 0.01 < 0.01

Penthiopyrad
1487
Location, Year (variety) Reference
Application DAT Residues, mg/kg Selected residue mg/kg b
n kg ai/ha
kg ai/hL
parent PAM PCA 753-A-OH 753-F-DO DM-PCA
Spain, Lleida 2007 (Sol Verde) PTHIO_071
2 0.2 0.59
0.04 0.04
1 0.076 < 0.01 < 0.01 0.013 < 0.01 < 0.01
Spain, Los Palacios 2007 (Edona) PTHIO_071
2 0.2 0.59
0.04 0.04
0a 0 1 3 7 14
< 0.01 0.23 0.098 0.041 0.011 < 0.01
< 0.01 < 0.01 < 0.01 < 0.01 < 0.01 < 0.01
< 0.01 < 0.01 < 0.01 < 0.01 < 0.01 < 0.01
< 0.01 0.015 0.038 0.021 < 0.01 < 0.01
< 0.01 < 0.01 < 0.01 < 0.01 < 0.01 < 0.01
< 0.01 < 0.01 < 0.01 < 0.01 < 0.01 < 0.01
France (South), Lucenay 2007 (Loustik) PTHIO_071
2 0.19 0.59
0.04 0.04
1 0.089 < 0.01 < 0.01 0.016 < 0.01 < 0.01
Greece, Nea Magnisia 2007 (Luberon) PTHIO_071
2 0.2 0.6
0.04 0.04
1 0.29 < 0.01 < 0.01 0.065 < 0.01 < 0.01
Spain, Los Palacios 2008 (Suso) PTHIO_071
2 0.2 0.6
0.04 0.04
0a 0 1 3 7 14
0.01 0.15 0.16 0.058 0.017 < 0.01
< 0.01 < 0.01 < 0.01 < 0.01 < 0.01 < 0.01
< 0.01 < 0.01 < 0.01 < 0.01 < 0.01 < 0.01
< 0.01 0.018 0.029 0.019 < 0.01 < 0.01
< 0.01 < 0.01 < 0.01 < 0.01 < 0.01 < 0.01
< 0.01 < 0.01 < 0.01 < 0.01 < 0.01 < 0.01
Belgium, Ingelmunster 2008 (Aviance) PTHIO_071
2 0.2 0.58
0.04 0.04
0a 0 1 3 7 14
< 0.01 0.18 0.093 0.053 0.025 < 0.01
< 0.01 < 0.01 < 0.01 < 0.01 < 0.01 < 0.01
< 0.01 < 0.01 < 0.01 < 0.01 < 0.01 < 0.01
< 0.01 < 0.01 0.019 0.013 < 0.01 < 0.01
< 0.01 < 0.01 < 0.01 < 0.01 < 0.01 < 0.01
< 0.01 < 0.01 < 0.01 < 0.01 < 0.01 < 0.01
Greece, Nea Magnisia 2008 (803) PTHIO_071
2 0.2 0.6
0.04 0.04
1 0.15 < 0.01 < 0.01 0.04 < 0.01 < 0.01
Italy, Mediglia 2008 (Edona) PTHIO_071
2 0.2 0.6
0.04 0.04
1 0.3 < 0.01 < 0.01 0.033 < 0.01 < 0.01
Outdoor
Italy, Alba Adriatica 2007 (Lunga) PTHIO_072 Reverse decline
2 0.2 0.6
0.04 0.04
0a 0
< 0.01 0.4
< 0.01 < 0.01
< 0.01 < 0.01
< 0.01 0.059
< 0.01< 0.01 < 0.01 < 0.01
2 0.2 0.61
0.04 0.04
1 0.12 < 0.01 < 0.01 0.033 < 0.01 < 0.01
2 0.2 0.6
0.04 0.04
3 0.013 < 0.01 0.014 0.014 < 0.01 < 0.01

Penthiopyrad
1488
Location, Year (variety) Reference
Application DAT Residues, mg/kg Selected residue mg/kg b
n kg ai/ha
kg ai/hL
parent PAM PCA 753-A-OH 753-F-DO DM-PCA
2 0.2 0.58
0.04 0.04
7 < 0.01 < 0.01 0.014 < 0.01 < 0.01 < 0.01
2 0.2 0.59
0.04 0.04
14 < 0.01 < 0.01 0.037 < 0.01 < 0.01 < 0.01
Spain, Los Palacios 2007 (Torres) PTHIO_072 Reverse decline
2 0.2 0.59
0.04 0.04
0a 0
< 0.01 0.085
< 0.01 < 0.01
< 0.01 < 0.01
< 0.01< 0.01 < 0.01< 0.01 < 0.01 < 0.01
2 0.2 0.59
0.04 0.04
1 < 0.01 < 0.01 < 0.01 < 0.01 < 0.01 < 0.01
2 0.2 0.59
0.04 0.04
3 0.082 < 0.01 < 0.01 0.014 < 0.01 < 0.01
2 0.2 0.59
0.04 0.04
7 0.046 < 0.01 < 0.01 < 0.01 < 0.01 < 0.01
2 0.2 0.59
0.04 0.04
14 < 0.01 < 0.01 < 0.01 < 0.01 < 0.01 < 0.01
Spain, Los Palacios 2007 (Edona) PTHIO_072
2 0.2 0.6
0.04 0.04
1 0.083 < 0.01 < 0.01 0.018 < 0.01 < 0.01
France (South), Montauban 2007 (Raider) PTHIO_072
2 0.2 0.61
0.04 0.04
1 0.16 < 0.01 < 0.01 0.02 < 0.01 < 0.01
Greece, Platanos 2007 (803) PTHIO_072 Reverse decline
2 0.21 0.57
0.04 0.04
0a 0
< 0.01 0.55
< 0.01 < 0.01
< 0.01 < 0.01
< 0.010.041 < 0.01< 0.01 < 0.01 < 0.01
2 0.2 0.6
0.04 0.04
1 0.12 < 0.01 < 0.01 0.063 < 0.01 < 0.01
2 0.21 0.57
0.04 0.04
3 0.13 < 0.01 < 0.01 0.036 < 0.01 < 0.01
2 0.2 0.6
0.04 0.04
7 < 0.01 < 0.01 0.01 < 0.01 < 0.01 < 0.01
2 0.19 0.6
0.04 0.04
14 < 0.01 < 0.01 < 0.01 < 0.01 < 0.01 < 0.01
Spain, Utrera 2008 (Suso) PTHIO_072 PTHIO_072 Reverse decline
2 0.2 0.6
0.04 0.04
0a 0
0.019 0.69
< 0.01 < 0.01
< 0.01 < 0.01
< 0.01 0.038
< 0.01< 0.01 < 0.01 < 0.01
2 0.2 0.6
0.04 0.04
1 0.26 < 0.01 < 0.01 0.039 < 0.01 < 0.01
2 0.2 0.6
0.04 0.04
3 0.3 < 0.01 < 0.01 0.086 < 0.01 < 0.01
2 0.2 0.6
0.04 0.04
7 0.029 < 0.01 < 0.01 < 0.01 < 0.01 < 0.01
2 0.2 0.61
0.04 0.04
14 < 0.01 < 0.01 < 0.01 < 0.01 < 0.01 < 0.01

Penthiopyrad
1489
Location, Year (variety) Reference
Application DAT Residues, mg/kg Selected residue mg/kg b
n kg ai/ha
kg ai/hL
parent PAM PCA 753-A-OH 753-F-DO DM-PCA
Italy, Alba Adriatica 2008 (Jazzer) Reverse decline
2 0.2 0.63
0.04 0.04
0a 0
< 0.01 0.011
< 0.01 < 0.01
< 0.01 < 0.01
< 0.01< 0.01 < 0.01< 0.01 < 0.01 < 0.01
2 0.2 0.62
0.04 0.04
1 0.12 < 0.01 < 0.01 0.018 < 0.01 < 0.01
2 0.2 0.63
0.04 0.04
3 0.019 < 0.01 < 0.01 0.019 < 0.01 < 0.01
2 0.2 0.61
0.04 0.04
7 0.014 < 0.01 0.013 < 0.01 < 0.01 < 0.01
2 0.2 0.63
0.04 0.04
14 < 0.01 < 0.01 0.011 < 0.01 < 0.01 < 0.01
Greece, Platanos 2008 (803) PTHIO_072
2 0.2 0.6
0.04 0.04
1 0.053 < 0.01 < 0.01 0.015 < 0.01 < 0.01
France (South), Montauban 2008 (Gerone) PTHIO_072
2 0.22 0.65
0.04 0.04
1 0.18 < 0.01 < 0.01 0.024 < 0.01 < 0.01
USA (NJ), Baptistown 2007 (Indy) PTHIO_073
4 0.26 0.26 0.25 0.25
0.07 0.07 0.07 0.07
1 1
0.015 0.014
< 0.01 < 0.01
0.017 0.017
< 0.01 < 0.01
< 0.01 < 0.01
< 0.01 < 0.01
Parent: 0.015 Total: 0.033
USA (VA), Bumpass 2007 (Stra. S. ght 8) PTHIO_073
4 0.25 0.08 1 1
0.042 0.025
< 0.01 < 0.01
0.019 < 0.01
< 0.01 < 0.01
< 0.01 < 0.01
< 0.01 < 0.01
Parent: 0.034 Total: 0.052
USA (FL), Bradenton 2007 (Sppedway) PTHIO_073
4 0.25 0.24 0.24 0.24
0.05 0.05 0.05 0.05
1 1
0.12 0.13
0.013 0.015
0.019 0.021
0.012 0.01
< 0.01 < 0.01
< 0.01 < 0.01
Parent: 0.13 Total: 0.15
USA (IA), Richland 2007 (Stra. S. ght 9) PTHIO_073
4 0.25 0.25 0.26 0.25
0.08 0.09 0.08 0.08
1 1
0.056 0.038
< 0.01 < 0.01
0.013 < 0.01
0.01 < 0.01
< 0.01 < 0.01
< 0.01 < 0.01
Parent: 0.047 Total: 0.066
USA (KS), Gardner 2007 (Stra. S. ght 8) PTHIO_073
4 0.26 0.25 0.25 0.25
0.07 0.07 0.07 0.07
1 1
0.034 0.051
< 0.01 < 0.01
0.011 0.011
< 0.01 < 0.01
< 0.01 < 0.01
0.021 0.02
Parent: 0.043 Total: 0.061

Penthiopyrad
1490
Location, Year (variety) Reference
Application DAT Residues, mg/kg Selected residue mg/kg b
n kg ai/ha
kg ai/hL
parent PAM PCA 753-A-OH 753-F-DO DM-PCA
USA (IA), Richland 2007 (Stra. S. ght 9) PTHIO_073
4 0.25 0.08 0a 0a 0 0 1 1 3 3 7 7 10 10
0.035 0.067 0.14 0.19 0.034 0.024 < 0.01 < 0.01 < 0.01 < 0.01 < 0.01 < 0.01
< 0.01 < 0.01 < 0.01 < 0.01 < 0.01 < 0.01 < 0.01 < 0.01 < 0.01 < 0.01 < 0.01 < 0.01
< 0.01 < 0.01 < 0.01 < 0.01 < 0.01 < 0.01 < 0.01 < 0.01 < 0.01 < 0.01 < 0.01 < 0.01
< 0.01 < 0.01 < 0.01 0.015 0.021 0.013 < 0.01 < 0.01 < 0.01 < 0.01 < 0.01 < 0.01
< 0.01 < 0.01 < 0.01 < 0.01 < 0.01 < 0.01 < 0.01 < 0.01 < 0.01 < 0.01 < 0.01 < 0.01
< 0.01 < 0.01 < 0.01 < 0.01 < 0.01 < 0.01 < 0.01 < 0.01 < 0.01 < 0.01 < 0.01 < 0.01
Parent: 0.029 Total: 0.048
Canada, Branchton 2007 (Eclipse) PTHIO_073
4 0.26 0.26 0.25 0.24
0.07 0.07 0.07 0.07
1 1
0.062 0.068
< 0.01 < 0.01
0.01 0.01
< 0.01< 0.01 < 0.01< 0.01 < 0.01 < 0.01
Parent: 0.065 Total: 0.084
Canada, Branchton 2007 (Market More) PTHIO_073
4 0.26 0.25 0.25 0.26
0.07 0.07 0.07 0.07
1 1
0.13 0.088
< 0.01 < 0.01
0.032 0.031
< 0.01< 0.01 < 0.01< 0.01 < 0.01 < 0.01
Parent: 0.11 Total: 0.13
USA (TX), Raymond-ville 2007 (Dasher II) PTHIO_073
4 0.26 0.25 0.26 0.26
0.07 0.07 0.07 0.07
1 1
0.077 0.094
< 0.01 < 0.01
0.017 0.014
< 0.01< 0.01 < 0.01< 0.01 < 0.01 < 0.01
Parent: 0.086 Total: 0.10
Canada, Abbotsford 2007 (Jackson Supreme F1) PTHIO_073
4 0.25 0.06 1 1
0.11 0.13
0.01 < 0.01
0.013 0.01
0.017 0.011
< 0.01< 0.01 < 0.01 < 0.01
Parent: 0.012 Total: 0.031
a before last treatment b mean of replicate samples (if applicable); total residue based on the edible portion DAT: days after final treatment
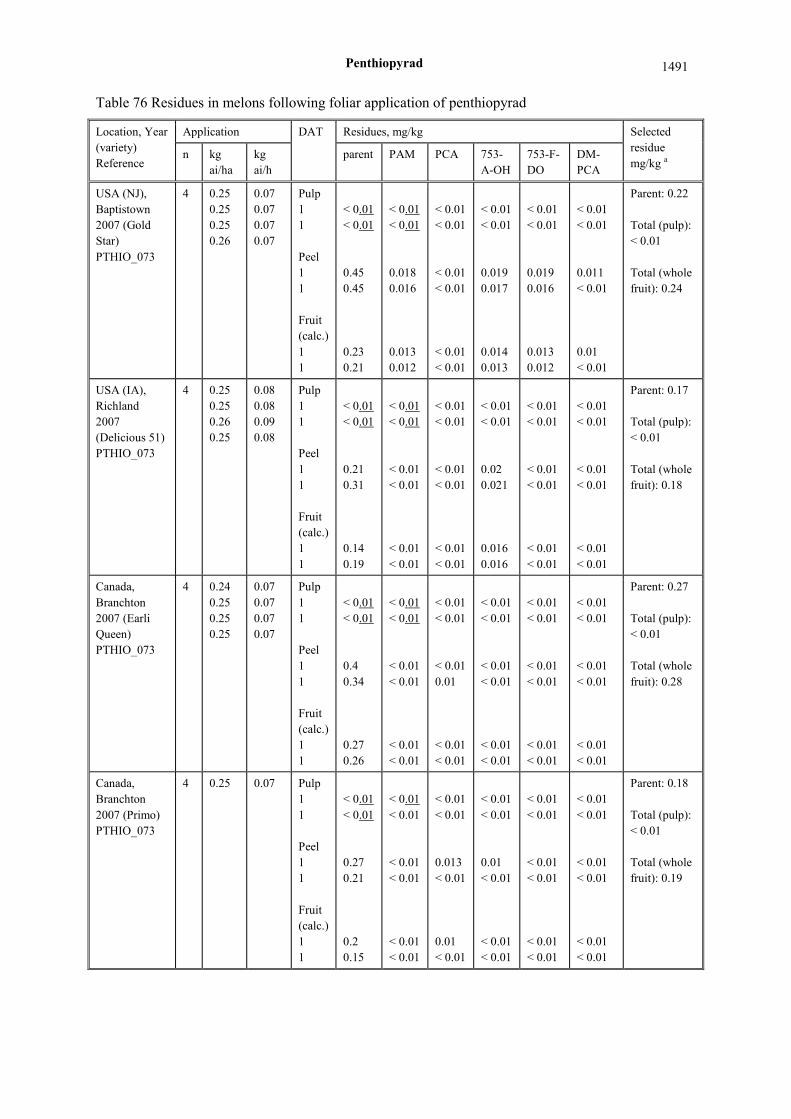
Penthiopyrad
1491
Table 76 Residues in melons following foliar application of penthiopyrad
Location, Year (variety) Reference
Application DAT Residues, mg/kg Selected residue mg/kg a
n kg ai/ha
kg ai/h
parent PAM PCA 753-A-OH
753-F-DO
DM-PCA
USA (NJ), Baptistown 2007 (Gold Star) PTHIO_073
4 0.25 0.25 0.25 0.26
0.07 0.07 0.07 0.07
Pulp 1 1 Peel 1 1 Fruit (calc.) 1 1
< 0.01 < 0.01 0.45 0.45 0.23 0.21
< 0.01 < 0.01 0.018 0.016 0.013 0.012
< 0.01 < 0.01 < 0.01 < 0.01 < 0.01 < 0.01
< 0.01 < 0.01 0.019 0.017 0.014 0.013
< 0.01 < 0.01 0.019 0.016 0.013 0.012
< 0.01 < 0.01 0.011 < 0.01 0.01 < 0.01
Parent: 0.22 Total (pulp): < 0.01 Total (whole fruit): 0.24
USA (IA), Richland 2007 (Delicious 51) PTHIO_073
4 0.25 0.25 0.26 0.25
0.08 0.08 0.09 0.08
Pulp 1 1 Peel 1 1 Fruit (calc.) 1 1
< 0.01 < 0.01 0.21 0.31 0.14 0.19
< 0.01 < 0.01 < 0.01 < 0.01 < 0.01 < 0.01
< 0.01 < 0.01 < 0.01 < 0.01 < 0.01 < 0.01
< 0.01 < 0.01 0.02 0.021 0.016 0.016
< 0.01 < 0.01 < 0.01 < 0.01 < 0.01 < 0.01
< 0.01 < 0.01 < 0.01 < 0.01 < 0.01 < 0.01
Parent: 0.17 Total (pulp): < 0.01 Total (whole fruit): 0.18
Canada, Branchton 2007 (Earli Queen) PTHIO_073
4 0.24 0.25 0.25 0.25
0.07 0.07 0.07 0.07
Pulp 1 1 Peel 1 1 Fruit (calc.) 1 1
< 0.01 < 0.01 0.4 0.34 0.27 0.26
< 0.01 < 0.01 < 0.01 < 0.01 < 0.01 < 0.01
< 0.01 < 0.01 < 0.01 0.01 < 0.01 < 0.01
< 0.01 < 0.01 < 0.01 < 0.01 < 0.01 < 0.01
< 0.01 < 0.01 < 0.01 < 0.01 < 0.01 < 0.01
< 0.01 < 0.01 < 0.01 < 0.01 < 0.01 < 0.01
Parent: 0.27 Total (pulp): < 0.01 Total (whole fruit): 0.28
Canada, Branchton 2007 (Primo) PTHIO_073
4 0.25 0.07 Pulp 1 1 Peel 1 1 Fruit (calc.) 1 1
< 0.01 < 0.01 0.27 0.21 0.2 0.15
< 0.01 < 0.01 < 0.01 < 0.01 < 0.01 < 0.01
< 0.01 < 0.01 0.013 < 0.01 0.01 < 0.01
< 0.01 < 0.01 0.01 < 0.01 < 0.01 < 0.01
< 0.01 < 0.01 < 0.01 < 0.01 < 0.01 < 0.01
< 0.01 < 0.01 < 0.01 < 0.01 < 0.01 < 0.01
Parent: 0.18 Total (pulp): < 0.01 Total (whole fruit): 0.19

Penthiopyrad
1492
Location, Year (variety) Reference
Application DAT Residues, mg/kg Selected residue mg/kg a
n kg ai/ha
kg ai/h
parent PAM PCA 753-A-OH
753-F-DO
DM-PCA
USA (TX), Raymond-ville 2007 (Ma.s.n-stream) PTHIO_073
4 0.25 0.07 Pulp 1 1 Peel 1 1 Fruit (calc.) 1 1
< 0.01 < 0.01 0.12 0.16 0.086 0.11
< 0.01 < 0.01 0.014 0.019 0.011 0.015
< 0.01 < 0.01 0.019 0.023 0.015 0.021
< 0.01 < 0.01 < 0.01 < 0.01 < 0.01 < 0.01
< 0.01 < 0.01 0.011 0.017 0.009 0.014
< 0.01 < 0.01 < 0.01 < 0.01 < 0.01 < 0.01
Parent: 0.098 Total (pulp): < 0.01 Total (whole fruit): 0.12
USA (CA), Fresno 2007 (Athena) PTHIO_073
4 0.05 0.06 Pulp 1 1 Peel 1 1 Fruit (calc.) 1 1
< 0.01 < 0.01 1.1 0.51 0.35 0.16
< 0.01 < 0.01 0.071 0.036 0.039 0.014
< 0.01 < 0.01 0.059 0.034 0.034 0.014
< 0.01 < 0.01 0.019 < 0.01 0.01 < 0.01
< 0.01 < 0.01 0.078 0.029 0.028 0.012
< 0.01 < 0.01 < 0.01 < 0.01 < 0.01 < 0.01
Parent: 0.26 Total (pulp): < 0.01 Total (whole fruit): 0.30
USA (CA), Sanger 2007 (Hale´s Best Jumbo) PTHIO_073
4 0.25 0.05 Pulp 1 1 Peel 1 1 Fruit (calc.) 1 1
< 0.01 < 0.01 0.39 0.42 0.17 0.16
< 0.01 < 0.01 0.026 0.029 0.014 0.014
0.012 0.018 0.03 0.032 0.039 0.059
< 0.01 < 0.01 < 0.01 < 0.01 < 0.01 < 0.01
< 0.01 < 0.01 0.016 0.015 0.01 0.01
< 0.01 < 0.01 < 0.01 < 0.01 < 0.01 < 0.01
Parent: 0.17 Total (pulp): < 0.01 Total (whole fruit): 0.19
USA (CA), Porterville 2007 (Cantaloupe Top Mark) PTHIO_073
4 0.25 0.07 Pulp 1 1 Peel 1 1 Fruit (calc.) 1 1
< 0.01 < 0.01 0.3 0.89 0.17 0.35
< 0.01 < 0.01 0.016 0.032 0.011 0.023
0.011 0.013 0.016 0.03 0.025 0.038
< 0.01 < 0.01 0.01 0.025 < 0.01 0.013
< 0.01 < 0.01 0.011 0.029 < 0.01 0.014
< 0.01 < 0.01 < 0.01 < 0.01 < 0.01 < 0.01
Parent: 0.26 Total (pulp): < 0.01 Total (whole fruit): 0.29
a mean of replicate samples (if applicable); total residue based on the edible portion DAT: days after final treatment

Penthiopyrad
1493
Table 77 Residues in winter squash following foliar application of penthiopyrad
Location, Year (variety) Reference
Application DAT Residues, mg/kg Selected residue mg/kg a
n kg ai/ha
kg ai/hL
parent PAM PCA 753-A-OH 753-F-DO DM-PCA
USA (Bumpass) 2007 (Prolific) PTHIO_073
4 0.26 0.25 0.27 0.27
0.09 0.08 0.09 0.09
1 1
0.059 0.075
< 0.01 < 0.01
< 0.01 < 0.01
< 0.01< 0.01 < 0.01< 0.01 < 0.01 < 0.01
Parent: 0.067 Total (whole fruit): 0.086
USA (FL), Bradenton 2007 (Enterprise) PTHIO_073
4 0.25 0.24 0.24 0.24
0.05 0.05 0.05 0.05
1 1
0.17 0.19
0.019 0.017
< 0.01 < 0.01
< 0.01< 0.01 < 0.01< 0.01 0.018 0.016
Parent: 0.18 Total (whole fruit): 0.21
USA (KS), Gardner 2007 (Black Beauty) PTHIO_073
4 0.25 0.07 1 1
0.12 0.12
< 0.01 < 0.01
< 0.01 < 0.01
< 0.01< 0.01 < 0.01< 0.01 0.044 0.045
Parent: 0.12 Total (whole fruit): 0.14
USA (CA), Fresno 2007 (Jackpot F1) PTHIO_073
4 0.25 0.06 1 1
0.25 0.16
< 0.01 < 0.01
< 0.01 < 0.01
0.01 < 0.01
< 0.01< 0.01 < 0.01 < 0.01
Parent: 0.21 Total (whole fruit): 0.22
Canada, Abbotsford 2007 (Noche F1) PTHIO_073
4 0.25 0.26 0.26 0.25
0.06 0.06 0.06 0.06
1 1
0.11 0.098
< 0.01 < 0.01
< 0.01 < 0.01
< 0.01< 0.01 < 0.01< 0.01 < 0.01 < 0.01
Parent: 0.10 Total (whole fruit): 0.12
a mean of replicate samples (if applicable); total residue based on the edible portion DAT: days after final treatment
Table 78 Residues in bell peppers following foliar application of penthiopyrad
Location, Year (variety) Reference
Application DAT Residues, mg/kg Selected residue mg/kg b
n kg ai/ha
kg ai/hL
parent PAM PCA 753-A-OH 753-F-DO DM-PCA
Protected
Italy, Casteldidone 2009 (Comune) PTHIO_070
2 0.2 0.59
0.04 0.04
1 0.65 < 0.01 < 0.01 < 0.01 < 0.01 < 0.01
Spain, Lleida 2009 (Lamuro) PTHIO_070
2 0.2 0.61
0.04 0.04
1 0.16 < 0.01 < 0.01 < 0.01 < 0.01 < 0.01
Spain, Berja 2009 (Fire Flame) PTHIO_070 Reverse decline
2 0.2 0.59
0.04 0.04
0a 0
0.075 0.4
< 0.01 < 0.01
< 0.01 < 0.01
< 0.01< 0.01 < 0.01< 0.01 < 0.01 < 0.01
2 0.2 0.59
0.04 0.04
1 0.53 < 0.01 < 0.01 < 0.01 < 0.01 < 0.01
2 0.2 0.59
0.04 0.04
3 0.69 < 0.01 < 0.01 < 0.01 < 0.01 < 0.01

Penthiopyrad
1494
Location, Year (variety) Reference
Application DAT Residues, mg/kg Selected residue mg/kg b
n kg ai/ha
kg ai/hL
parent PAM PCA 753-A-OH 753-F-DO DM-PCA
2 0.2 0.59
0.04 0.04
7 0.27 < 0.01 < 0.01 < 0.01 < 0.01 < 0.01
2 0.2 0.61
0.04 0.04
14 0.23 < 0.01 < 0.01 < 0.01 < 0.01 < 0.01
France (South), Pact 2009 (Hannibal) PTHIO_070
2 0.2 0.61
0.04 0.04
1 0.53 < 0.01 < 0.01 < 0.01 < 0.01 < 0.01
Greece, Chalkidona 2009 (Magnisias) PTHIO_070
2 0.2 0.61
0.04 0.04
1 0.5 < 0.01 < 0.01 0.01 < 0.01 < 0.01
Greece, Nea Magnisia 2009 (Raikon) PTHIO_070
2 0.2 0.59
0.04 0.04
1 0.63 < 0.01 < 0.01 < 0.01 < 0.01 < 0.01
Italy, Poirino 2009 (Sienor Quadrato Carmagnola) PTHIO_070 Reverse decline
2 0.2 0.61
0.04 0.04
0a 0
0.029 0.15
< 0.01 < 0.01
< 0.01 < 0.01
< 0.01< 0.01 < 0.01< 0.01 < 0.01 < 0.01
2 0.21 0.6
0.04 0.04
1 0.18 < 0.01 < 0.01 < 0.01 < 0.01 < 0.01
2 0.2 0.6
0.04 0.04
3 0.077 < 0.01 < 0.01 < 0.01 < 0.01 < 0.01
2 0.2 0.59
0.04 0.04
7 0.14 < 0.01 < 0.01 < 0.01 < 0.01 < 0.01
2 0.2 0.61
0.04 0.04
14 0.1 < 0.01 < 0.01 0.01 < 0.01 < 0.01
France (North), St. Denis En Val 2009 (Starter) PTHIO_070 Reverse decline
2 0.2 0.6
0.04 0.04
0a 0
0.12 0.52
< 0.01 < 0.01
< 0.01 < 0.01
< 0.01< 0.01 < 0.01< 0.01 < 0.01 < 0.01
2 0.2 0.6
0.04 0.04
1 0.43 < 0.01 < 0.01 < 0.01 < 0.01 < 0.01
2 0.2 0.6
0.04 0.04
3 0.29 < 0.01 < 0.01 < 0.01 < 0.01 < 0.01
2 0.2 0.6
0.04 0.04
7 0.22 < 0.01 < 0.01 < 0.01 < 0.01 < 0.01
2 0.21 0.61
0.04 0.04
14 0.13 < 0.01 < 0.01 < 0.01 < 0.01 < 0.01
France (North), Olivet 2009 (Norene) PTHIO_070
2 0.2 0.61
0.04 0.04
0a 0
0.087 0.58
< 0.01 < 0.01
< 0.01 < 0.01
< 0.01< 0.01 < 0.01< 0.01 < 0.01 < 0.01
2 0.21 0.6
0.04 0.04
1 0.64 < 0.01 < 0.01 < 0.01 < 0.01 < 0.01
2 0.2 0.6
0.04 0.04
3 0.55 < 0.01 < 0.01 < 0.01 < 0.01 < 0.01
2 0.2 0.61
0.04 0.04
7 0.18 < 0.01 < 0.01 < 0.01 < 0.01 < 0.01
2 0.2 0.6
0.04 0.04
14 0.62 < 0.01 < 0.01 0.011 < 0.01 < 0.01

Penthiopyrad
1495
Location, Year (variety) Reference
Application DAT Residues, mg/kg Selected residue mg/kg b
n kg ai/ha
kg ai/hL
parent PAM PCA 753-A-OH 753-F-DO DM-PCA
Outdoor
USA (GA), Chula 2008 (Excursion) PTHIO_069
3 0.36 0.35 0.36
0.13 0.12 0.12
0 0
0.15 0.22
< 0.01 < 0.01
< 0.01 < 0.01
0.011 0.014
< 0.01 < 0.01
< 0.01 < 0.01
Parent: 0.19 Total: 0.20
USA (FL), Hobe Sound 2008 (Revolution) PTHIO_069
3 0.36 0.36 0.36
0.1 0.1 0.09
0 0
0.2 0.21
< 0.01 < 0.01
< 0.01 < 0.01
< 0.01 < 0.01
< 0.01 < 0.01
< 0.01 < 0.01
Parent: 0.21 Total: 0.22
USA (IA), Richland 2008 (California Wonder) PTHIO_069
3 0.35 0.18 0a 0a 0 0 1 1 3 3 7 7 10 10
0.027 0.018 0.072 0.091 0.18 0.11 0.09 0.099 0.078 0.085 0.059 0.069
< 0.01 < 0.01 < 0.01 < 0.01 < 0.01 < 0.01 < 0.01 < 0.01 < 0.01 < 0.01 < 0.01 < 0.01
< 0.01 < 0.01 < 0.01 < 0.01 < 0.01 < 0.01 < 0.01 < 0.01 < 0.01 < 0.01 < 0.01 < 0.01
< 0.01 < 0.01 < 0.01 < 0.01 < 0.01 < 0.01 < 0.01 < 0.01 < 0.01 < 0.01 < 0.01 < 0.01
< 0.01 < 0.01 < 0.01 < 0.01 < 0.01 < 0.01 < 0.01 < 0.01 < 0.01 < 0.01 < 0.01 < 0.01
< 0.01 < 0.01 < 0.01 < 0.01 < 0.01 < 0.01 < 0.01 < 0.01 < 0.01 < 0.01 < 0.01 < 0.01
Parent: 0.15 Total: 0.16
Canada, St. Marc-sur-Richilieu 2008 (Bell Boy) PTHIO_069
3 0.35 0.37 0.35
0.14 0.14 0.14
0 0
0.16 0.19
< 0.01 < 0.01
< 0.01 < 0.01
< 0.01 < 0.01
< 0.01 < 0.01
< 0.01 < 0.01
Parent: 0.18 Total: 0.2
Canada, Branchton 2008 (Socrates) PTHIO_069
3 0.35 0.35 0.36
0.18 0.18 0.18
0 0
0.91 0.63
0.012 < 0.01
< 0.01 < 0.01
< 0.01 < 0.01
< 0.01 < 0.01
< 0.01 < 0.01
Parent: 0.77 Total: 0.79
Canada, Branchton 2008 (Red Knight) PTHIO_069
3 0.39 0.36 0.36
0.2 0.18 0.18
0 0
0.16 0.21
< 0.01 < 0.01
< 0.01 < 0.01
< 0.01 < 0.01
< 0.01 < 0.01
< 0.01 < 0.01
Parent: 0.19 Total: 0.20
Canada, Thorndale 2008 (Aristole) PTHIO_069
3 0.36 0.36 0.35
0.14 0.14 0.14
0 0
0.14 0.2
< 0.01 < 0.01
< 0.01 < 0.01
< 0.01 < 0.01
< 0.01 < 0.01
< 0.01 < 0.01
Parent: 0.17 Total: 0.19
Canada, Lakeside 2008 (Aristole) PTHIO_069
3 0.36 0.35 0.38
0.14 0.14 0.14
0 0
0.18 0.15
< 0.01 < 0.01
< 0.01 < 0.01
< 0.01 < 0.01
< 0.01 < 0.01
< 0.01 < 0.01
Parent: 0.17 Total: 0.18
USA (TX), Raymondville 2008 (Camelot)
3 0.36 0.12 0 0
0.14 0.15
< 0.01 < 0.01
< 0.01 < 0.01
0.011 0.012
< 0.01 < 0.01
< 0.01 < 0.01
Parent: 0.15 Total: 0.16

Penthiopyrad
1496
Location, Year (variety) Reference
Application DAT Residues, mg/kg Selected residue mg/kg b
n kg ai/ha
kg ai/hL
parent PAM PCA 753-A-OH 753-F-DO DM-PCA
USA (CA), Fresno 2008 (Indra) PTHIO_069
3 0.36 0.35 0.35
0.13 0.13 0.13
0 0
0.75 0.61
0.021 0.017
< 0.01 < 0.01
0.048 0.031
< 0.01 < 0.01
< 0.01 < 0.01
Parent: 0.68 Total: 0.7
USA (CA), Sanger 2008 (Turas) PTHIO_069
3 0.36 0.36 0.35
0.04 0.04 0.04
0 0
0.23 0.2
< 0.01 < 0.01
< 0.01 < 0.01
0.012 0.011
< 0.01 < 0.01
< 0.01 < 0.01
Parent: 0.22 Total: 0.23
a before last treatment b mean of replicate samples (if applicable); total residue based on the edible portion DAT: days after final treatment
Table 79 Residues in non-bell peppers following foliar application of penthiopyrad
Location, Year (variety) Reference
Application DAT Residues, mg/kg Selected residue mg/kg a
n kg ai/ha
kg ai/hL
parent PAM PCA 753-A-OH
753-F-DO
DM-PCA
USA (MN), Paynesville 2008 (Conchos) PTHIO_069
3 0.36 208 0 0
0.54 0.6
< 0.01 < 0.01
< 0.01 < 0.01
< 0.01 < 0.01
< 0.01 < 0.01
< 0.01 < 0.01
Parent: 0.57 Total: 0.59
Canada, St. Marc-sur-Richilieu 2008 (Jalapeno) PTHIO_069
3 0.35 250 0 0
0.37 0.34
0.012 0.01
< 0.01 < 0.01
0.037 0.032
< 0.01 < 0.01
< 0.01 < 0.01
Parent: 0.36 Total: 0.38
Canada, St. Marc-sur-Richilieu 2008 (Hungarian Hot Wax) PTHIO_069
3 0.36 0.36 0.35
259 262 253
0 0
0.91 0.51
0.015 < 0.01
< 0.01 < 0.01
0.027 0.015
0.028 0.015
< 0.01 < 0.01
Parent: 0.71 Total: 0.73
Canada, Branchton 2008 (Inferno) PTHIO_069
3 0.38 0.37 0.33
200 200 200
0 0
0.36 0.3
< 0.01 < 0.01
< 0.01 < 0.01
< 0.01 < 0.01
< 0.01 < 0.01
< 0.01 < 0.01
Parent: 0.33 Total: 0.35
Canada, Branchton 2008 (Budapest) PTHIO_069
3 0.36 0.37 0.37
200 200 200
0 0
0.16 0.18
< 0.01 < 0.01
< 0.01 < 0.01
< 0.01 < 0.01
< 0.01 < 0.01
< 0.01 < 0.01
Parent: 0.17 Total: 0.19
Canada, Thorndale 2008 (Hungarian Wax) PTHIO_069
3 0.36 0.36 0.35
250 250 250
0 0
1.7 1.4
< 0.01 < 0.01
< 0.01 < 0.01
< 0.01 < 0.01
< 0.01 < 0.01
< 0.01 < 0.01
Parent: 1.6 Total: 1.6
USA (TX), Claude 2008 (TAM Jalapeno) PTHIO_069
3 0.36 0.35 0.36
272 251 250
0 0
0.26 0.55
0.01 0.022
< 0.01 < 0.01
0.026 0.043
0.028 0.055
< 0.01 < 0.01
Parent: 0.41 Total: 0.44

Penthiopyrad
1497
Location, Year (variety) Reference
Application DAT Residues, mg/kg Selected residue mg/kg a
n kg ai/ha
kg ai/hL
parent PAM PCA 753-A-OH
753-F-DO
DM-PCA
USA (TX), Levelland 2008 (Hot Pepper) PTHIO_069
3 0.36 0.37 0.36
281 281 281
0 0
1.0 0.75
0.03 0.021
< 0.01 < 0.01
0.067 0.049
0.033 0.026
< 0.01 < 0.01
Parent: 0.88 Total: 0.92
USA (CA), Sanger 2008 (Sondra) PTHIO_069
3 0.36 0.35 0.36
941 917 947
0 0
0.17 0.22
0.02 0.019
0.014 0.015
0.016 0.017
< 0.01 < 0.01
0.027 0.019
Parent: 0.2 Total: 0.23
a mean of replicate samples (if applicable); total residue based on the edible portion DAT: days after final treatment
Table 80 Residues in sweet corn ears (= “kernels plus cob with husk removed”) following foliar application of penthiopyrad
Location, Year (variety) Reference
Application DAT Residues, mg/kg Selected residue mg/kg b n kg
ai/ha kg ai/hL
parent PAM PCA 753-A-OH
753-F-DO
DM-PCA
USA (PA), Germansville 2009 (Mirai) PTHIO_099
2 0.36 0.35
0.11 0.11
7 7
< 0.01 < 0.01
< 0.01 < 0.01
0.024 0.02
< 0.01 < 0.01
< 0.01 < 0.01
< 0.01 < 0.01
Parent: < 0.01 Total: < 0.01
USA (GA), Chula 2009 (Triple Sweet) PTHIO_099
2 0.35 0.12 7 7
< 0.01 < 0.01
< 0.01 < 0.01
0.01 0.011
< 0.01 < 0.01
< 0.01 < 0.01
0.015 0.013
Parent: < 0.01 Total: < 0.01
USA (FL), Oviedo 2009 (Sugar Buns Hybrid) PTHIO_099
2 0.37 0.36
0.13 0.13
7 7
< 0.01 < 0.01
< 0.01 < 0.01
0.047 0.05
< 0.01 < 0.01
< 0.01 < 0.01
< 0.01 < 0.01
Parent: < 0.01 Total: < 0.01
Canada, Branchton 2009 (Ambrosia) PTHIO_099
2 0.37 0.18 7 7
< 0.01 < 0.01
< 0.01 < 0.01
0.011 0.01
< 0.01 < 0.01
< 0.01 < 0.01
< 0.01 < 0.01
Parent: < 0.01 Total: < 0.01
Canada, St. Marc-sur-Richelieu 2009 (Mirai 336) PTHIO_099
2 0.35 0.36
0.18 0.18
7 7
< 0.01 < 0.01
< 0.01 < 0.01
0.019 0.014
< 0.01 < 0.01
< 0.01 < 0.01
< 0.01 < 0.01
Parent: < 0.01 Total: < 0.01
USA (MN), Paynesville 2009 (Jubilee) PTHIO_099
2 0.37 0.36
0.26 0.26
7 7
< 0.01 < 0.01
< 0.01 < 0.01
< 0.01 < 0.01
< 0.01 < 0.01
< 0.01 < 0.01
< 0.01 < 0.01
Parent: < 0.01 Total: < 0.01

Penthiopyrad
1498
Location, Year (variety) Reference
Application DAT Residues, mg/kg Selected residue mg/kg b n kg
ai/ha kg ai/hL
parent PAM PCA 753-A-OH
753-F-DO
DM-PCA
USA (KS), Lexena 2009 (Peaches and Cream) PTHIO_099
2 0.36 0.25 0a 0a 0 0 3 3 7 7 10 10
< 0.01 < 0.01 < 0.01 < 0.01 < 0.01 < 0.01 < 0.01 < 0.01 < 0.01 < 0.01
< 0.01 < 0.01 < 0.01 < 0.01 < 0.01 < 0.01 < 0.01 < 0.01 < 0.01 < 0.01
< 0.01 < 0.01 < 0.01 < 0.01 < 0.01 0.01 0.014 < 0.01 0.01 < 0.01
< 0.01 < 0.01 < 0.01 < 0.01 < 0.01 < 0.01 < 0.01 < 0.01 < 0.01 < 0.01
< 0.01 < 0.01 < 0.01 < 0.01 < 0.01 < 0.01 < 0.01 < 0.01 < 0.01 < 0.01
< 0.01 < 0.01 < 0.01 < 0.01 < 0.01 < 0.01 < 0.01 < 0.01 < 0.01 < 0.01
Parent: < 0.01 Total: < 0.01
Canada, Taber 2009 (King Cob) PTHIO_099
2 0.35 0.23 7 7
< 0.01 < 0.01
< 0.01 < 0.01
< 0.01 < 0.01
< 0.01 < 0.01
< 0.01 < 0.01
< 0.01 < 0.01
Parent: < 0.01 Total: < 0.01
Canada, Live Oak 2009 (Bodacious Sweet) PTHIO_099
2 0.36 0.11 7 7
< 0.01 < 0.01
< 0.01 < 0.01
< 0.01 < 0.01
0.023 0.013
< 0.01 < 0.01
< 0.01 < 0.01
Parent: < 0.01 Total: < 0.01
USA (OR), Parkdale 2009 (Serendipidity) PTHIO_099
2 0.35 0.36
0.19 0.24
7 7
< 0.01 < 0.01
< 0.01 < 0.01
0.015 0.013
< 0.01 < 0.01
< 0.01 < 0.01
< 0.01 < 0.01
Parent: < 0.01 Total: < 0.01
USA (OR), Portland 2009 (Nantasket) PTHIO_099
2 0.35 0.74 7 7
< 0.01 < 0.01
< 0.01 < 0.01
< 0.01 < 0.01
< 0.01 < 0.01
< 0.01 < 0.01
< 0.01 < 0.01
Parent: < 0.01 Total: < 0.01
a before last treatment b mean of replicate samples (if applicable); total residue based on the edible portion DAT: days after final treatment
Table 81 Residues in tomatoes following foliar application of penthiopyrad
Location, Year (variety) Reference
Application DAT Residues, mg/kg Selected residue mg/kg b
n kg ai/ha kg ai/hL
parent PAM PCA 753-A-OH
753-F-DO
DM-PCA
Protected
France (South), Pact 2007 (Felicia) PTHIO_067
2 0.2 0.58
0.04 0.04
0a 0 1 3 7 14
0.096 0.49 0.15 0.14 0.3 0.38
< 0.01 < 0.01 < 0.01 < 0.01 < 0.01 < 0.01
< 0.01 < 0.01 < 0.01 < 0.01 < 0.01 < 0.01
< 0.01 < 0.01 < 0.01 < 0.01 < 0.01 < 0.01
< 0.01 < 0.01 < 0.01 < 0.01 < 0.01 < 0.01
< 0.01 < 0.01 < 0.01 < 0.01 < 0.01 < 0.01
Greece, Nea Magnisia 2007 (Primadona) PTHIO_067
2 0.2 0.6
0.04 0.04
1 0.18 < 0.01 < 0.01 < 0.01 < 0.01 < 0.01

Penthiopyrad
1499
Location, Year (variety) Reference
Application DAT Residues, mg/kg Selected residue mg/kg b
n kg ai/ha kg ai/hL
parent PAM PCA 753-A-OH
753-F-DO
DM-PCA
Italy, Mediglia 2007 (Naram) PTHIO_067
2 0.19 0.59
0.04 0.04
0a 0 1 3 7 14
0.066 0.27 0.15 0.13 0.31 0.19
< 0.01 < 0.01 < 0.01 < 0.01 < 0.01 < 0.01
< 0.01 < 0.01 < 0.01 < 0.01 < 0.01 < 0.01
< 0.01 < 0.01 < 0.01 < 0.01 < 0.01 < 0.01
< 0.01 < 0.01 < 0.01 < 0.01 < 0.01 < 0.01
< 0.01 < 0.01 < 0.01 < 0.01 < 0.01 < 0.01
Spain, Lleida 2007 (not reported) PTHIO_067
2 0.2 0.59
0.04 0.04
1 0.18 < 0.01 < 0.01 < 0.01 < 0.01 < 0.01
Spain, Los Palacios 2007 (Jenaro) PTHIO_067
2 0.2 0.59
0.04 0.04
0a 0 1 3 7 14
0.06 0.18 0.15 0.19 0.24 0.15
< 0.01 < 0.01 < 0.01 < 0.01 < 0.01 < 0.01
< 0.01 < 0.01 < 0.01 < 0.01 < 0.01 < 0.01
< 0.01 < 0.01 < 0.01 < 0.01 < 0.01 < 0.01
< 0.01 < 0.01 < 0.01 < 0.01 < 0.01 < 0.01
< 0.01 < 0.01 < 0.01 < 0.01 < 0.01 < 0.01
Spain, Los Palacios 2008 (Hilton) PTHIO_067
2 0.21 0.6
0.04 0.04
1 0.086 < 0.01 < 0.01 < 0.01 < 0.01 < 0.01
Italy, Mediglia 2008 (Birichino) PTHIO_067
2 0.2 0.59
0.04 0.04
0a 0 1 3 7 14
0.12 0.85 0.42 0.4 0.55 0.16
< 0.01 < 0.01 < 0.01 < 0.01 < 0.01 < 0.01
< 0.01 < 0.01 < 0.01 < 0.01 < 0.01 < 0.01
< 0.01 < 0.01 < 0.01 < 0.01 < 0.01 < 0.01
< 0.01 < 0.01 < 0.01 < 0.01 < 0.01 < 0.01
< 0.01 < 0.01 < 0.01 < 0.01 < 0.01 < 0.01
Greece, Nea Magnisia 2008 (Winner F1) PTHIO_067
2 0.2 0.62
0.04 0.04
0a 0 1 3 7 14
0.12 0.76 0.6 0.76 0.55 0.46
< 0.01 < 0.01 < 0.01 < 0.01 < 0.01 < 0.01
< 0.01 < 0.01 < 0.01 < 0.01 < 0.01 < 0.01
< 0.01 < 0.01 < 0.01 < 0.01 < 0.01 < 0.01
< 0.01 < 0.01 < 0.01 < 0.01 < 0.01 < 0.01
< 0.01 < 0.01 < 0.01 < 0.01 < 0.01 < 0.01
France (South), Pact 2008 (Felicia) PTHIO_067
2 0.2 0.6
0.04 0.04
0a 0 1 3 7 14
0.045 0.3 0.12 0.092 0.15 0.12
< 0.01 < 0.01 < 0.01 < 0.01 < 0.01 < 0.01
< 0.01 < 0.01 < 0.01 < 0.01 < 0.01 < 0.01
< 0.01 < 0.01 < 0.01 < 0.01 < 0.01 < 0.01
< 0.01 < 0.01 < 0.01 < 0.01 < 0.01 < 0.01
< 0.01 < 0.01 < 0.01 < 0.01 < 0.01 < 0.01
Belgium, Eemegem 2008 (Growdena) PTHIO_067
2 0.2 0.59
0.04 0.04
0a 0 1 3 7 14
0.13 1.1 0.65 0.58 0.74 0.76
< 0.01 < 0.01 < 0.01 < 0.01 < 0.01 < 0.01
< 0.01 < 0.01 < 0.01 < 0.01 < 0.01 < 0.01
< 0.01 < 0.01 < 0.01 < 0.01 < 0.01 < 0.01
< 0.01 < 0.01 < 0.01 < 0.01 < 0.01 < 0.01
< 0.01 < 0.01 < 0.01 < 0.01 < 0.01 < 0.01
Belgium, Kools-kamp 2008 (Plaisance) PTHIO_067
2 0.2 0.59
0.04 0.04
1 0.84 < 0.01 < 0.01 < 0.01 < 0.01 < 0.01
Outdoor

Penthiopyrad
1500
Location, Year (variety) Reference
Application DAT Residues, mg/kg Selected residue mg/kg b
n kg ai/ha kg ai/hL
parent PAM PCA 753-A-OH
753-F-DO
DM-PCA
France (South), Vauna-veyes 2007 (Perfect peel) PTHIO_068
2 0.19 0.58
0.04 0.04
1 0.24 < 0.01 < 0.01 < 0.01 < 0.01 < 0.01
Spain, Lleida 2007 (Caramba) PTHIO_068 Reverse decline
2 0.2 0.59
0.04 0.04
0a 0
0.035 0.29
< 0.01 < 0.01
< 0.01 < 0.01
< 0.01 < 0.01
< 0.01 < 0.01
< 0.01 < 0.01
2 0.2 0.59
0.04 0.04
1 0.22 < 0.01 < 0.01 < 0.01 < 0.01 < 0.01
2 0.2 0.59
0.04 0.04
3 0.29 < 0.01 < 0.01 < 0.01 < 0.01 < 0.01
2 0.2 0.59
0.04 0.04
7 0.21 < 0.01 < 0.01 < 0.01 < 0.01 < 0.01
2 0.21 0.6
0.04 0.04
14 0.14 < 0.01 < 0.01 < 0.01 < 0.01 < 0.01
Greece, Platanos 2007 (Optima) PTHIO_068
2 0.2 0.6
0.04 0.04
1 0.62 < 0.01 < 0.01 < 0.01 < 0.01 < 0.01
Spain, Aguadulce 2007 (Manitu) PTHIO_068 Reverse decline
2 0.2 0.6
0.04 0.04
0a 0
0.057 0.35
< 0.01 < 0.01
< 0.01 < 0.01
< 0.01 < 0.01
< 0.01 < 0.01
< 0.01 < 0.01
2 0.2 0.6
0.04 0.04
1 0.18 < 0.01 < 0.01 < 0.01 < 0.01 < 0.01
2 0.2 0.6
0.04 0.04
3 0.16 < 0.01 < 0.01 < 0.01 < 0.01 < 0.01
2 0.21 0.59
0.04 0.04
7 0.22 < 0.01 < 0.01 < 0.01 < 0.01 < 0.01
2 0.19 0.59
0.04 0.04
14 0.05 < 0.01 < 0.01 < 0.01 < 0.01 < 0.01
Italy, Santa Cristina 2007 (Perfect peel) PTHIO_068 Reverse decline
2 0.19 0.6
0.04 0.04
0a 0
0.12 0.85
< 0.01 < 0.01
< 0.01 < 0.01
< 0.01 < 0.01
< 0.01 < 0.01
< 0.01 < 0.01
2 0.2 0.6
0.04 0.04
1 0.5 < 0.01 < 0.01 < 0.01 < 0.01 < 0.01
2 0.19 0.6
0.04 0.04
3 0.082 < 0.01 < 0.01 < 0.01 < 0.01 < 0.01
2 0.190.61 0.04 0.04
7 0.27 < 0.01 < 0.01 < 0.01 < 0.01 < 0.01
2 0.2 0.59
0.04 0.04
14 0.32 < 0.01 < 0.01 < 0.01 < 0.01 < 0.01
France (South), Vaunaveys 2008 (Perfect peel) PTHIO_068 Reverse decline
2 0.2 0.6
0.04 0.04
0a 0
< 0.01 0.042
< 0.01 < 0.01
< 0.01 < 0.01
< 0.01 < 0.01
< 0.01 < 0.01
< 0.01 < 0.01
2 0.2 0.59
0.04 0.04
1 0.031 < 0.01 < 0.01 < 0.01 < 0.01 < 0.01
2 0.2 0.6
0.04 0.04
3 0.18 < 0.01 < 0.01 < 0.01 < 0.01 < 0.01
2 0.2 0.6
0.04 0.04
7 0.012 < 0.01 < 0.01 < 0.01 < 0.01 < 0.01

Penthiopyrad
1501
Location, Year (variety) Reference
Application DAT Residues, mg/kg Selected residue mg/kg b
n kg ai/ha kg ai/hL
parent PAM PCA 753-A-OH
753-F-DO
DM-PCA
2 0.2 0.59
0.04 0.04
14 0.043 < 0.01 < 0.01 < 0.01 < 0.01 < 0.01
Greece, Chalkidona 2008 (Formula) PTHIO_068
2 0.2 0.63
0.04 0.04
1 0.58 < 0.01 < 0.01 < 0.01 < 0.01 < 0.01
Spain, Aguadulce 2008 (Manitu) PTHIO_068 Reverse decline
2 0.2 0.6
0.04 0.04
0a 0
< 0.01 0.082
< 0.01 < 0.01
< 0.01 < 0.01
< 0.01 < 0.01
< 0.01 < 0.01
< 0.01 < 0.01
2 0.2 0.6
0.04 0.04
1 0.11 < 0.01 < 0.01 < 0.01 < 0.01 < 0.01
2 0.2 0.6
0.04 0.04
3 0.11 < 0.01 < 0.01 < 0.01 < 0.01 < 0.01
2 0.2 0.6
0.04 0.04
7 0.078 < 0.01 < 0.01 < 0.01 < 0.01 < 0.01
2 0.2 0.61
0.04 0.04
14 0.011 < 0.01 < 0.01 < 0.01 < 0.01 < 0.01
Italy, Santa Cristina 2008 (Perfect peel) PTHIO_068
2 0.2 0.6
0.04 0.04
1 0.35 < 0.01 < 0.01 < 0.01 < 0.01 < 0.01
Canada, Berwick 2008 (Scotia) PTHIO_069
3 0.36 0.36 0.35
0.08 0.08 0.09
0 0
0.5 0.31
< 0.01 < 0.01
< 0.01 < 0.01
< 0.01 < 0.01
< 0.01 < 0.01
< 0.01 < 0.01
Parent: 0.41 Total: 0.42
USA (GA), Chula 2008 (Crista) PTHIO_069
3 0.36 0.36 0.36
0.13 0.12 0.12
0 0
0.24 0.24
< 0.01 < 0.01
< 0.01 < 0.01
< 0.01 < 0.01
< 0.01 < 0.01
< 0.01 < 0.01
Parent: 0.24 Total: 0.26
USA (FL), Bradenton 2008 (4 FL 47) PTHIO_069
3 0.35 0.35 0.36
0.04 0.04 0.04
0 0
0.43 0.37
< 0.01 < 0.01
< 0.01 < 0.01
< 0.01 < 0.01
< 0.01 < 0.01
< 0.01 < 0.01
Parent: 0.4 Total: 0.42
USA (FL), Oviedo 2008 (Better Boy) PTHIO_069
3 0.37 0.13 0 0
0.14 0.16
< 0.01 < 0.01
< 0.01 < 0.01
< 0.01 < 0.01
< 0.01 < 0.01
< 0.01 < 0.01
Parent: 0.15 Total: 0.17
USA (OH), Richwood 2008 (Jet Star) PTHIO_069
3 0.36 0.22 0a 0a 0 0 1 1 3 3 7 7 10 10
0.48 0.38 1.2 0.87 1.1 1.3 1.7 1.1 0.83 0.69 0.58 0.75
< 0.01 < 0.01 < 0.01 < 0.01 < 0.01 < 0.01 0.012 < 0.01 0.012 < 0.01 0.015 0.013
< 0.01 < 0.01 < 0.01 < 0.01 < 0.01 < 0.01 < 0.01 < 0.01 0.012 0.01 0.013 < 0.01
< 0.01 < 0.01 < 0.01 < 0.01 < 0.01 < 0.01 < 0.01 < 0.01 < 0.01 < 0.01 < 0.01 < 0.01
< 0.01 < 0.01 < 0.01 < 0.01 < 0.01 < 0.01 0.014 < 0.01 0.015 < 0.01 0.015 0.013
< 0.01 < 0.01 < 0.01 < 0.01 < 0.01 < 0.01 < 0.01 < 0.01 < 0.01 < 0.01 < 0.01 < 0.01
Parent: 1.4 Total: 1.4

Penthiopyrad
1502
Location, Year (variety) Reference
Application DAT Residues, mg/kg Selected residue mg/kg b
n kg ai/ha kg ai/hL
parent PAM PCA 753-A-OH
753-F-DO
DM-PCA
USA (KS), Lenexa 2008 (Early Girl) PTHIO_069
3 0.36 0.12 0 0
0.46 0.37
< 0.01 < 0.01
< 0.01 < 0.01
< 0.01 < 0.01
< 0.01 < 0.01
< 0.01 < 0.01
Parent: 0.42 Total: 0.43
Canada, St. Marc-sur-Richelieu 2008 (Big Beet) PTHIO_069
3 0.34 0.38 0.32
0.14 0.14 0.14
0 0
0.11 0.059
< 0.01 < 0.01
< 0.01 < 0.01
< 0.01 < 0.01
< 0.01 < 0.01
< 0.01 < 0.01
Parent: 0.085 Total: 0.10
Canada, St. Marc-sur-Richelieu 2008 (Mountain Spring) PTHIO_069
3 0.34 0.31 0.4
0.14 0.14 0.14
0 0
0.2 0.17
< 0.01 < 0.01
< 0.01 < 0.01
< 0.01 < 0.01
< 0.01 < 0.01
< 0.01 < 0.01
Parent: 0.19 Total: 0.20
Canada, Branchton 2008 (TSH 4) PTHIO_069
3 0.37 0.34 0.36
0.18 0.17 0.18
0 0
0.16 0.17
< 0.01 < 0.01
< 0.01 < 0.01
< 0.01 < 0.01
< 0.01 < 0.01
< 0.01 < 0.01
Parent: 0.17 Total: 0.18
Canada, Branchton 2008 (Heinz-9553) PTHIO_069
3 0.37 0.36 0.37
0.18 0.18 0.18
0 0
0.26 0.28
< 0.01 < 0.01
< 0.01 < 0.01
< 0.01 < 0.01
< 0.01 < 0.01
< 0.01 < 0.01
Parent: 0.27 Total: 0.29
Canada, Branchton 2008 (Heinz 9487) PTHIO_069
3 0.36 0.36 0.35
0.18 0.18 0.17
0 0
0.27 0.44
< 0.01 < 0.01
< 0.01 < 0.01
< 0.01 < 0.01
< 0.01 < 0.01
< 0.01 < 0.01
Parent: 0.36 Total: 0.37
Canada, Thorndale 2008 (H9314) PTHIO_069
3 0.37 0.35 0.36
0.14 0.14 0.14
0 0
0.76 0.64
< 0.01 < 0.01
< 0.01 < 0.01
< 0.01 < 0.01
< 0.01 < 0.01
< 0.01 < 0.01
Parent: 0.7 Total: 0.72
Canada, Lakeside 2008 (H9314) PTHIO_069
3 0.37 0.36 0.36
0.14 0.14 0.14
0 0
0.30 0.26
< 0.01 < 0.01
0.013 0.01
< 0.01 < 0.01
< 0.01 < 0.01
< 0.01 < 0.01
Parent: 0.28 Total: 0.3
USA (CA), Fresno 2008 (H8004) PTHIO_069
3 0.35 0.35 0.36
0.13 0.13 0.13
0a 0a 0 0 1 1 3 3 7 7 10 10
0.22 0.23 0.42 0.30 0.27 0.27 0.33 0.26 0.23 0.26 0.16 0.2
< 0.01 < 0.01 0.01 < 0.01 < 0.01 < 0.01 < 0.01 < 0.01 < 0.01 0.01 < 0.01 < 0.01
< 0.01 < 0.01 < 0.01 < 0.01 < 0.01 < 0.01 < 0.01 < 0.01 < 0.01 < 0.01 < 0.01 < 0.01
< 0.01 < 0.01 < 0.01 < 0.01 < 0.01 < 0.01 < 0.01 < 0.01 < 0.01 < 0.01 < 0.01 < 0.01
< 0.01 < 0.01 < 0.01 < 0.01 < 0.01 < 0.01 < 0.01 < 0.01 < 0.01 0.012 < 0.01 < 0.01
< 0.01 < 0.01 < 0.01 < 0.01 < 0.01 < 0.01 < 0.01 < 0.01 < 0.01 < 0.01 < 0.01 < 0.01
Parent: 0.36 Total: 0.38

Penthiopyrad
1503
Location, Year (variety) Reference
Application DAT Residues, mg/kg Selected residue mg/kg b
n kg ai/ha kg ai/hL
parent PAM PCA 753-A-OH
753-F-DO
DM-PCA
USA (CA), Corning 2008 (AB-2) PTHIO_069
3 0.35 0.19 0 0
1.5 1.1
0.022 0.016
0.014 0.014
< 0.01 < 0.01
0.064 0.052
< 0.01 < 0.01
Parent: 1.3 Total: 1.3
USA (CA), Maxwell 2008 (Apt 410) PTHIO_069
3 0.36 0.19 0 0
0.19 0.25
< 0.01 < 0.01
< 0.01 < 0.01
< 0.01 < 0.01
< 0.01 < 0.01
< 0.01 < 0.01
Parent: 0.22 Total: 0.24
USA (CA), Hickman 2008 (Processing 6366) PTHIO_069
3 0.36 0.36 0.35
0.13 0.13 0.13
0 0
0.36 0.36
< 0.01 < 0.01
< 0.01 < 0.01
< 0.01 < 0.01
0.02 0.019
< 0.01 < 0.01
Parent: 0.36 Total: 0.38
USA (CA), Sanger 2008 (Quality 21) PTHIO_069
3 0.36 0.04 0 0
0.15 0.18
< 0.01 < 0.01
0.01 < 0.01
< 0.01 < 0.01
< 0.01 < 0.01
< 0.01 < 0.01
Parent: 0.17 Total: 0.18
USA (CA), Porterville 2008 (Shady Lady) PTHIO_069
3 0.36 0.36 0.37
0.13 0.12 0.13
0 0
0.2 0.11
< 0.01 < 0.01
< 0.01 < 0.01
< 0.01 < 0.01
0.018 < 0.01
< 0.01 < 0.01
Parent: 0.16 Total: 0.17
USA (CA), Porterville 2008 (UC 82-B) PTHIO_069
3 0.36 0.36 0.37
0.12 0.13 0.13
0 0
0.26 0.24
< 0.01 < 0.01
< 0.01 < 0.01
< 0.01 < 0.01
0.012 0.012
< 0.01 < 0.01
Parent: 0.25 Total: 0.27
a before last treatment b mean of replicate samples (if applicable); total residue based on the edible portion DAT: days after final treatment
Table 82 Residues in head lettuce following foliar application of penthiopyrad
Location, Year (variety) Reference
Application DAT Residues, mg/kg Selected residue mg/kg b n kg
ai/ha kg ai/hL
parent PAM PCA 753-A-OH
753-F-DO
DM-PCA
USA (NY), Lyons 2008 (Ithaca MTO) PTHIO_083
3 0.35 0.36 0.35
0.13 0.13 0.13
0a 0a 0 0 1 1 3 3 7 7 10 10
0.84 0.65 1.4 2.9 1.3 1.6 0.29 0.44 0.33 0.26 0.23 0.24
0.015 0.013 0.017 0.023 0.016 0.018 0.01 0.01 0.011 0.01 < 0.01 < 0.01
0.012 0.012 0.011 0.015 0.012 0.011 < 0.01 < 0.01 < 0.01 < 0.01 < 0.01 < 0.01
0.022 0.019 0.035 0.04 0.041 0.035 0.021 0.019 0.013 0.01 < 0.01 < 0.01
0.01 < 0.01 0.013 0.017 0.016 0.018 0.01 0.01 0.011 0.01 < 0.01 < 0.01
< 0.01 < 0.01 < 0.01 < 0.01 < 0.01 < 0.01 < 0.01 < 0.01 < 0.01 < 0.01 < 0.01 < 0.01
Parent: 0.37 Total: 0.38

Penthiopyrad
1504
Location, Year (variety) Reference
Application DAT Residues, mg/kg Selected residue mg/kg b n kg
ai/ha kg ai/hL
parent PAM PCA 753-A-OH
753-F-DO
DM-PCA
USA (FL), Bradenton 2008 (Ithaca) PTHIO_083
3 0.36 0.08 3 3 w/o withered leaves 3 3
1.6 2.9 0.94 0.96
0.03 0.043 0.016 0.017
0.037 0.059 0.012 0.013
0.032 0.05 0.029 0.034
0.036 0.06 < 0.01 < 0.01
0.018 0.029 0.017 0.015
Parent: 2.3 Total: 2.3
Canada, St. Marc-sur-Richilieu 2008 (Great Lake) PTHIO_083
3 0.36 0.37 0.32
0.18 0.18 0.18
3 3
0.59 0.39
0.02 0.016
0.017 0.012
0.026 0.024
0.014 < 0.01
< 0.01 < 0.01
Parent: 0.49 Total: 0.52
Canada, Princeton 2008 (Skyline) PTHIO_083
3 0.36 0.34 0.34
0.18 0.17 0.17
3 3 w/o withered leaves 3 3
0.43 0.38 < 0.01 < 0.01
< 0.01 < 0.01 < 0.01 < 0.01
< 0.01 < 0.01 < 0.01 < 0.01
0.01 0.01 < 0.01 < 0.01
< 0.01 < 0.01 < 0.01 < 0.01
< 0.01 < 0.01 < 0.01 < 0.01
Parent: 0.41 Total: 0.42
Canada, Princeton 2008 (Mighty Joe) PTHIO_083
3 0.36 0.35 0.35
0.18 0.17 0.18
3 3
0.36 0.37
< 0.01 < 0.01
< 0.01 < 0.01
0.011 0.012
< 0.01 < 0.01
< 0.01 < 0.01
Parent: 0.37 Total: 0.38
Canada, Thorndale 2008 (Odyssey) PTHIO_083
3 0.36 0.36 0.35
0.14 0.14 0.14
3 3
3.4 2.2
0.022 0.012
0.025 0.013
0.058 0.036
0.019 0.01
0.012 0.012
Parent: 2.8 Total: 2.8
USA (CA), Fresno 2008 (Diamondback) PTHIO_083
3 0.35 0.12 3 3 w/o withered leaves 3 3
1.6 1.6 0.067 0.025
0.055 0.064 < 0.01 < 0.01
0.04 0.048 < 0.01 < 0.01
0.032 0.035 < 0.01 < 0.01
0.12 0.14 < 0.01 < 0.01
< 0.01 < 0.01 < 0.01 < 0.01
Parent: 1.6 Total: 1.7
USA (CA), Sanger 2008 (Side-Winder) PTHIO_083
3 0.36 0.04 3 3
0.62 0.57
0.049 0.045
0.04 0.033
0.015 0.013
0.12 0.1
< 0.01 < 0.01
Parent: 0.6 Total: 0.68

Penthiopyrad
1505
Location, Year (variety) Reference
Application DAT Residues, mg/kg Selected residue mg/kg b n kg
ai/ha kg ai/hL
parent PAM PCA 753-A-OH
753-F-DO
DM-PCA
USA (CA), Sanger 2008 (HXP-6203) PTHIO_083
3 0.36 0.04 3 3
0.4 0.34
0.022 0.019
0.024 0.023
0.021 0.017
0.036 0.024
< 0.01 < 0.01
Parent: 0.37 Total: 0.41
USA (CA), Hughson 2008 (Great Lakes 659) PTHIO_083
3 0.35 0.36 0.36
0.13 0.13 0.13
3 3
4.0 2.9
0.047 0.034
0.032 0.025
0.028 0.018
0.032 0.024
< 0.01 < 0.01
Parent: 3.5 Total: 3.5
USA (CA), Guadalupe 2008 (Durango) PTHIO_083
3 0.35 0.13 3 3
1.7 2.3
0.077 0.15
0.057 0.099
0.027 0.039
0.12 0.25
< 0.01 < 0.01
Parent: 2 Total: 2.2
Canada, Surrey 2008 Eldorado) PTHIO_083
3 0.36 0.35 0.37
0.16 0.19 0.19
3 3
< 0.01 < 0.01
< 0.01 < 0.01
< 0.01 < 0.01
< 0.01 < 0.01
< 0.01 < 0.01
< 0.01 < 0.01
Parent: < 0.01 Total: < 0.01
a before last treatment b mean of replicate samples (if applicable); total residue based on the edible portion DAT: days after final treatment
Table 83 Residues in leaf lettuce following foliar application of penthiopyrad
Location, Year (variety) Reference
Application DAT Residues, mg/kg Selected residue mg/kg b n kg
ai/ha kg ai/hL
parent PAM PCA 753-A-OH
753-F-DO
DM-PCA
USA (NY), Lyons 2008 (Green Bay) PTHIO_083
3 0.36 0.35 0.36
0.13 0.13 0.13
3 3
1.2 1.1
0.028 0.026
0.019 0.018
0.029 0.025
0.021 0.018
< 0.01 < 0.01
Parent: 1.2 Total: 1.2
USA (FL), Bradenton 2008 (Green Tower) PTHIO_083
3 0.36 0.08 3 3 w/o withered leaves 3 3
1.9 1.7 1.2 1.2
0.13 0.11 0.092 0.096
0.07 0.075 0.029 0.031
0.079 0.067 0.071 0.063
0.017 0.014 < 0.01 < 0.01
0.07 0.065 0.061 0.075
Parent: 1.8 Total: 2.0
Canada, Thorndale 2008 (Grand Rapids M1) PTHIO_083
3 0.35 0.14 3 3
3.3 4.9
0.039 0.041
0.038 0.038
0.075 0.079
0.015 0.017
0.01 0.011
Parent: 4.1 Total: 4.2

Penthiopyrad
1506
Location, Year (variety) Reference
Application DAT Residues, mg/kg Selected residue mg/kg b n kg
ai/ha kg ai/hL
parent PAM PCA 753-A-OH
753-F-DO
DM-PCA
Canada, Princeton 2008 (Summer Star) PTHIO_083
3 0.37 0.37 0.36
0.18 0.18 0.18
3 3 w/o withered leaves 3 3
1.1 1.1 1.0 0.95
0.15 0.14 0.16 0.14
0.11 0.095 0.11 0.1
0.022 0.02 0.03 0.026
< 0.01 < 0.01 < 0.01 < 0.01
0.15 0.12 0.14 0.12
Parent: 1.1 Total: 1.4
Canada, St. Marc-sur-Richilieu 2008 (Grand Rapids) PTHIO_083
3 0.35 0.34 0.33
0.15 0.14 0.13
3 3
5.7 4.9
0.035 0.031
0.033 0.026
0.055 0.054
0.04 0.034
0.019 0.015
Parent: 5.3 Total: 5.4
USA (OH), Richwood 2008 (Black Seeded Simpson) PTHIO_083
3 0.36 0.18 0a 0a 0 0 1 1 3 3 7 7 10 10
1.3 2.2 11 8.7 8.6 7.8 11 11 2.0 2.0 0.87 0.74
0.023 0.033 0.036 0.025 0.064 0.047 0.071 0.063 0.03 0.032 0.017 0.015
0.021 0.031 0.032 0.023 0.047 0.037 0.048 0.046 0.024 0.029 0.014 0.014
0.036 0.061 0.085 0.039 0.086 0.068 0.08 0.081 0.047 0.04 0.028 0.028
< 0.01 < 0.01 < 0.01 < 0.01 0.057 0.05 0.081 0.062 < 0.01 < 0.01 < 0.01 < 0.01
< 0.01 < 0.01 < 0.01 < 0.01 < 0.01 < 0.01 < 0.01 < 0.01 < 0.01 < 0.01 0.012 < 0.01
Parent: 11 Total: 11
USA (CA), Fresno 2008 (Romaine) PTHIO_083
3 0.36 0.35 0.35
0.13 0.13 0.12
0a 0a 0 0 1 1 3 3 7 7 10 10
2.4 2.4 5.3 5.5 7.1 5.9 3.8 4.9 1.6 2.5 1.3 1.2
0.14 0.13 0.12 0.13 0.13 0.12 0.094 0.15 0.094 0.12 0.098 0.091
0.05 0.048 0.045 0.048 0.053 0.05 0.053 0.062 0.049 0.061 0.039 0.042
0.047 0.048 0.042 0.049 0.049 0.044 0.047 0.063 0.042 0.051 0.029 0.026
0.062 0.056 0.058 0.059 0.091 0.069 0.032 0.042 0.019 0.032 0.023 0.022
< 0.01 < 0.01 < 0.01 < 0.01 < 0.01 < 0.01 0.011 < 0.01 0.014 0.011 0.014 0.013
Parent: 4.4 Total: 4.6
USA (CA), Santa Maria 2008 (Hearts Delight) PTHIO_083
3 0.34 0.35 0.36
0.13 0.12 0.12
3 3 w/o withered leaves 3 3
7.4 7.4 2.6 2.4
0.059 0.06 0.045 0.038
0.034 0.032 0.015 0.013
0.052 0.055 0.11 0.099
0.11 0.11 < 0.01 < 0.01
< 0.01 < 0.01 < 0.01 < 0.01
Parent: 7.4 Total: 7.5
USA (CA), Corning 2008 (Tohema) PTHIO_083
3 0.35 0.19 3 3
2.2 4.8
0.017 0.028
0.015 0.022
0.016 0.022
< 0.01 0.015
0.018 0.023
Parent: 3.5 Total: 3.5

Penthiopyrad
1507
Location, Year (variety) Reference
Application DAT Residues, mg/kg Selected residue mg/kg b n kg
ai/ha kg ai/hL
parent PAM PCA 753-A-OH
753-F-DO
DM-PCA
USA (CA), Sanger 2008 (HMX-5520) PTHIO_083
3 0.35 0.36 0.36
0.05 0.04 0.04
3 3
2.1 1.8
0.18 0.19
0.11 0.11
0.028 0.035
0.18 0.15
0.044 0.057
Parent: 2.0 Total: 2.3
USA (CA), Sanger 2008 (Tehama) PTHIO_083
3 0.38 0.36 0.36
0.04 0.04 0.04
3 3
1.7 1.8
0.26 0.25
0.12 0.12
0.08 0.083
0.26 0.25
0.026 0.027
Parent: 1.8 Total: 2.2
Canada, Abbortsford 2008 (Bergams Green) PTHIO_083
3 0.35 0.36 0.36
0.16 0.19 0.19
3 3
1.2 1.1
0.024 0.028
0.018 0.018
0.015 0.016
< 0.01 < 0.01
< 0.01 < 0.01
Parent: 1.2 Total: 1.2
a before last treatment b mean of replicate samples (if applicable); total residue based on the edible portion DAT: days after final treatment
Table 84 Residues in mustard greens following foliar application of penthiopyrad
Location, Year (variety) Reference
Application DAT Residues, mg/kg Selected residue mg/kg b
n kg ai/ha
kg ai/hL
parent PAM PCA 753-A-OH
753-F-DO
DM-PCA
Canada, Berwick 2009 (Southern Giant Curled) PTHIO_082
3 0.16 0.45 0.45
0.06 0.18 0.18
0a 0a 0 0 3 3 7 7 10 10
0.43 0.62 26 20 14 14 1.4 1.8 0.65 0.68
0.029 0.023 0.13 0.11 0.31 0.3 0.15 0.15 0.12 0.13
0.032 0.026 0.077 0.067 0.13 0.12 0.075 0.088 0.054 0.061
< 0.01 < 0.01 0.26 0.2 0.28 0.23 0.012 0.014 < 0.01 0.01
0.025 0.027 0.22 0.16 0.17 0.16 0.05 0.071 0.023 0.026
0.018 0.012 0.024 0.02 0.058 0.053 0.069 0.071 0.11 0.11
Parent: 23 Total: 23
USA (GA), Athens 2009 (Southern Giant Curled) PTHIO_082
3 0.15 0.45 0.44
0.07 0.2 0.21
0 0
9.3 7.2
0.083 0.089
0.062 0.068
< 0.01 0.01
0.2 0.22
0.011 0.011
Parent: 8.3 Total: 8.4
USA (NC), Seven Springs 2009 (Southern Giant Curled) PTHIO_082
3 0.16 0.46 0.45
0.08 0.18 0.18
0 0 edible part 0 0
27 32 13 19
0.36 0.4 0.2 0.28
0.21 0.22 0.088 0.12
0.089 0.083 0.022 0.044
0.82 1.2 0.95 1.1
0.022 0.023 0.013 0.016
Parent: 30 Total: 30

Penthiopyrad
1508
Location, Year (variety) Reference
Application DAT Residues, mg/kg Selected residue mg/kg b
n kg ai/ha
kg ai/hL
parent PAM PCA 753-A-OH
753-F-DO
DM-PCA
USA (FL), Hobe Sound 2009 (Florida Broadleaf) PTHIO_082
3 0.16 0.46 0.46
0.07 0.19 0.19
0 0
9.5 5.7
0.081 0.06
0.045 0.04
0.046 0.037
0.19 0.1
< 0.01 < 0.01
Parent: 7.6 Total: 7.7
USA (LA), Cheneyville 2009 (Florida Broadleaf) PTHIO_082
3 0.15 0.43 0.43
0.02 0.04 0.04
0 0
16 15
0.094 0.088
0.054 0.054
0.016 0.014
0.21 0.11
0.038 0.018
Parent: 16 Total: 16
USA (OH), Richwood 2009 (Southern Giant Curled) PTHIO_082
3 0.16 0.45 0.47
0.1 0.27 0.28
0 0 edible part 0 0
9.0 8.5 3.9 4.6
0.11 0.077 0.079 0.084
0.063 0.047 0.046 0.04
0.021 0.015 < 0.01 < 0.01
0.13 0.12 0.1 0.073
0.01 < 0.01 < 0.01 < 0.01
Parent: 8.8 Total: 8.9
USA (OK), Hinton 2009 (Florida Broadleaf) PTHIO_082
3 0.15 0.44 0.47
0.33 0.92 1.0
0 0
18 16
0.087 0.095
0.065 0.063
0.1 0.089
0.45 0.49
0.011 0.012
Parent: 17 Total: 17
USA (CA), Porterville 2009 (Florida Broadleaf) PTHIO_082
3 0.16 0.44 0.45
0.05 0.15 0.16
0 0 edible part 0 0
8.8 8.6 4.6 4.8
0.11 0.16 0.16 0.14
0.063 0.046 0.04 0.032
0.01 0.013 < 0.01 < 0.01
0.41 0.3 0.18 0.26
< 0.01 < 0.01 < 0.01 < 00.1
Parent: 8.7 Total: 9.0
USA (OR), Hillsboro 2009 (Green Wave) PTHIO_082
3 0.16 0.46 0.47
0.05 0.15 0.16
0 0
9.9 11
0.054 0.06
0.028 0.032
< 0.01 < 0.01
0.091 0.093
< 0.01 < 0.01
Parent: 10 Total: 11
a before last treatment b mean of replicate samples (if applicable); total residue based on the edible portion DAT: days after final treatment
Table 85 Residues in spinach following foliar application of penthiopyrad
Location, Year (variety) Reference
Application DAT Residues, mg/kg Selected residue mg/kg a
n kg ai/ha
kg ai/hL
parent PAM PCA 753-A-OH
753-F-DO
DM-PCA
USA (NY), Alton 2008 (Melody) PTHIO_083
3 0.36 0.35 0.36
0.13 0.13 0.13
3 3
2.2 3.2
0.3 0.27
0.15 0.13
0.045 0.044
0.036 0.035
0.016 0.013
Parent: 2.7 Total: 3.2

Penthiopyrad
1509
Location, Year (variety) Reference
Application DAT Residues, mg/kg Selected residue mg/kg a
n kg ai/ha
kg ai/hL
parent PAM PCA 753-A-OH
753-F-DO
DM-PCA
USA (GA), Chula 2008 (Space F1) PTHIO_083
3 0.36 0.16 3 3 w/o withered leaves 3 3
2.7 2.9 2.4 2.5
0.58 0.58 0.46 0.46
0.37 0.4 0.24 0.3
0.059 0.055 0.038 0.056
0.05 0.056 0.019 0.018
0.54 0.5 0.41 0.46
Parent: 2.8 Total: 3.9
Canada, St. Marc-sur-Richilieu 2008 (Tyee) PTHIO_083
3 0.36 0.36 0.37
0.14 0.14 0.14
3 3
1.4 1.5
0.21 0.2
0.11 0.11
0.04 0.04
0.017 0.02
0.031 0.034
Parent: 1.5 Total: 1.8
Canada, Branchton 2008 (Whale) PTHIO_083
3 0.36 0.35 0.35
0.18 0.180.17
3 3 w/o withered leaves 3 3
0.76 0.85 0.55 0.62
0.075 0.08 0.065 0.063
0.056 0.065 0.053 0.052
0.022 0.026 0.022 0.025
< 0.01 < 0.01 < 0.01 < 0.01
0.019 0.019 0.021 0.018
Parent: 0.81 Total: 0.95
Canada, Thorndale 2008 (Unipack 12 Hybrid) PTHIO_083
3 0.36 0.35 0.36
0.14 0.14 0.14
3 3
6.1 10
0.11 0.12
0.11 0.11
0.038 0.047
0.039 0.061
0.028 0.02
Parent: 8.1 Total: 8.3
USA (TX), Raymondville 2008 (Melody) PTHIO_083
3 0.36 0.13 3 3
13 9.4
0.43 0.4
0.2 0.18
0.056 0.057
0.15 0.095
0.036 0.037
Parent: 11 Total: 12
USA (TX), Uvalde 2008 (Siena) PTHIO_083
3 0.36 0.15 3 3
13 17
0.24 0.22
0.12 0.14
0.035 0.036
0.087 0.12
0.021 0.019
Parent: 15 Total: 15
USA (CA), Santa Maria 2008 (Mizano) PTHIO_083
3 0.35 0.13 3 3 w/o withered leaves 3 3
2.7 2.8 1.8 3.3
0.18 0.18 0.13 0.14
0.062 0.072 0.049 0.053
0.071 0.085 0.17 0.14
0.019 0.018 < 0.01 < 0.01
< 0.01 < 0.01 < 0.01 < 0.01
Parent: 2.8 Total: 3.1
USA (CA), Sanger 2008 (Hybrid 424) PTHIO_083
3 0.36 0.36 0.37
0.04 0.04 0.04
3 3
2.0 2.0
0.5 0.51
0.26 0.25
0.044 0.043
0.24 0.26
0.05 0.065
Parent: 2 Total: 2.9

Penthiopyrad
1510
Location, Year (variety) Reference
Application DAT Residues, mg/kg Selected residue mg/kg a
n kg ai/ha
kg ai/hL
parent PAM PCA 753-A-OH
753-F-DO
DM-PCA
Canada, Abbortsford 2008 (Unipack 12 F1) PTHIO_083
3 0.37 0.36 0.36
0.17 0.17 0.19
3 3
1.2 1.1
0.11 0.11
0.075 0.063
0.019 0.018
0.016 0.016
0.02 0.017
Parent: 1.2 Total: 1.4
a mean of replicate samples (if applicable); total residue based on the edible portion DAT: days after final treatment
Table 86 Residues in turnip leaves following foliar application of penthiopyrad
Location, Year (variety) Reference
Application DAT Residues, mg/kg Selected residue mg/kg a
n kg ai/ha
kg ai/hL
parent PAM PCA 753-A-OH
753-F-DO
DM-PCA
USA (GA), Athens 2009 (Shogoin) PTHIO_088
2 0.46 0.46
0.21 0.2
0 0
13 13
0.054 0.066
0.04 0.048
0.027 0.038
0.2 0.24
0.011 0.012
Parent: 13 Total: 13
USA (GA), Chula 2009 (Appin) PTHIO_088
2 0.45 0.46
0.15 0.15
0 0
20 19
0.21 0.2
0.074 0.073
0.077 0.083
0.16 0.17
0.084 0.098
Parent: 20 Total: 20
USA (LA), Cheneyville 2009 (Appin) PTHIO_088
2 0.46 0.46
0.22 0.24
0 0
27 19
0.11 0.086
0.049 0.043
0.026 0.022
0.09 0.07
0.021 0.018
Parent: 23 Total: 23
USA (IL), Rochelle 2009 (Appin) PTHIO_088
2 0.45 0.97 0 0
4.3 5.3
0.036 0.043
0.023 0.03
0.01 0.013
0.01 0.016
< 0.01 < 0.01
Parent: 4.8 Total: 4.9
USA (TX), Uvalde 2009 (Appin) PTHIO_088
2 0.46 0.05 0 0
4.5 3.5
0.026 0.029
0.015 0.016
0.01 0.014
0.13 0.076
< 0.01 < 0.01
Parent: 4.0 Total: 4.0
USA (CA), Madera 2009 (Appin) PTHIO_088
2 0.48 0.46
0.17 0.17
0 0
7.3 4.9
0.15 0.14
0.072 0.056
0.086 0.06
0.18 0.14
0.044 0.034
Parent: 6.1 Total: 6.4
a mean of replicate samples (if applicable); total residue based on the edible portion DAT: days after final treatment

Penthiopyrad
1511
Table 87 Residues in celery sticks following foliar application of penthiopyrad
Location, Year (variety) Reference
Application DAT Residues, mg/kg Selected residue mg/kg a
n kg ai/ha kg ai/hL parent PAM PCA 753-A-OH
753-F-DO
DM-PCA
USA (FL), Oviedo 2008 (Utah) PTHIO_083
3 0.37 0.13 3 3 trimmed 3 3
5.7 5.8 2.8 4.8
0.19 0.17 0.16 0.16
0.071 0.069 0.059 0.063
0.036 0.033 0.028 0.028
0.01 0.093 0.035 0.043
0.052 0.048 0.052 0.053
Parent: 5.8 Total: 6.1
USA (MI), Lainburg 2008 (Duchess) PTHIO_083
3 0.36 0.36 0.37
0.22 0.22 0.22
3 3
2.9 2.7
0.041 0.039
0.049 0.036
0.013 0.014
0.039 0.034
< 0.01 < 0.01
Parent: 2.8 Total: 2.9
Canada, St. Marc-sur-Richilieu 2008 (Victoria) PTHIO_083
3 0.38 0.36 0.36
0.14 0.14 0.14
3 3
1.9 2.1
0.019 0.018
0.013 0.014
0.012 0.02
0.017 0.018
< 0.01 < 0.01
Parent: 2.0 Total: 2.0
Canada, Branchton 2008 (Sabroso) PTHIO_083
3 0.36 0.35 0.35
0.18 0.18 0.18
2 2 trimmed 2 2
9.1 8.2 9.1 5.4
0.064 0.068 0.057 0.042
0.071 0.065 0.044 0.031
0.02 0.018 0.022 0.015
0.074 0.068 0.055 0.032
0.021 0.023 0.021 0.017
Parent: 8.7 Total: 8.8
Canada, Princeton 2008 (Sabrosa) PTHIO_083
3 0.38 0.35 0.35
0.19 0.17 0.17
3 3
2.6 2.3
0.067 0.068
0.026 0.026
< 0.01 < 0.01
0.012 0.011
0.042 0.042
Parent: 2.5 Total: 2.6
Canada, Thorndale 2008 (Sabro 50) PTHIO_083
3 0.36 0.14 3 3
1.7 1.6
0.015 0.013
0.029 0.03
0.01 < 0.01
0.014 0.012
< 0.01 < 0.01
Parent: 1.7 Total: 1.7
Canada, Lakeside 2008 (Duchess) PTHIO_083
3 0.37 0.36 0.34
0.14 0.14 0.14
3 3
3.8 2.2
0.072 0.048
0.075 0.054
0.021 0.015
0.07 0.046
0.016 0.011
Parent: 3 Total: 3.1
USA (CA), Santa Maria 2008 (Conquistador) PTHIO_083
3 0.35 0.35 0.35
0.13 0.09 0.12
3 3 trimmed 3 3
2.7 3.5 1.3 1.7
0.042 0.041 0.034 0.033
0.03 0.026 0.018 0.017
< 0.01 < 0.01 0.01 0.01
0.043 0.036 0.01 0.01
< 0.01 < 0.01 < 0.01 < 0.01
Parent: 3.1 Total: 3.2
USA (CA), Greenfield 2008 (Sonora) PTHIO_083
3 0.360.360.36
0.13 0.12 0.12
3 3
2.0 2.2
0.11 0.13
0.059 0.059
0.01 0.011
0.082 0.097
< 0.01 < 0.01
Parent: 2.1 Total: 2.3

Penthiopyrad
1512
Location, Year (variety) Reference
Application DAT Residues, mg/kg Selected residue mg/kg a
n kg ai/ha kg ai/hL parent PAM PCA 753-A-OH
753-F-DO
DM-PCA
USA (CA), Hughson 2008 (Conquistador) PTHIO_083
3 0.36 0.13 3 3
5.3 5.3
0.038 0.048
0.034 0.04
0.024 0.027
0.012 0.014
< 0.01 < 0.01
Parent: 5.3 Total: 5.4
USA (CA), Sanger 2008 (Mission) PTHIO_083
3 0.36 0.04 3 3
5.2 5.3
0.18 0.16
0.09 0.1
0.023 0.02
0.15 0.17
< 0.01 < 0.01
Parent: 5.3 Total: 5.6
a:mean of replicate samples (if applicable); total residue based on the edible portion DAT: days after final treatment
Table 88 Residues in legume beans following foliar application of penthiopyrad
Location, Year (variety) Reference
Application DAT Residues, mg/kg Selected residue mg/kg a
n kg ai/ha kg ai/hL
parent PAM PCA 753-A-OH
753-F-DO
DM-PCA
Succulent beans with pods
Canada, Berwick 2009 (Provider) PTHIO_084
3 0.16 0.460.45
0.06 0.18 0.18
0 0
0.84 0.7
< 0.01 < 0.01
< 0.01 < 0.01
< 0.01 < 0.01
< 0.01 < 0.01
0.023 0.022
Parent: 0.77 Total: 0.79
USA (GA), Chula 2009 (Terminator) PTHIO_084
3 0.16 0.460.46
0.06 0.16 0.16
0 0 w/o tips 0 0
0.97 1.0 0.8 0.92
0.033 0.032 0.033 0.037
0.016 0.014 0.013 0.013
< 0.01 < 0.01 < 0.01 < 0.01
< 0.01 < 0.01 < 0.01 < 0.01
0.041 0.044 0.045 0.06
Parent: 0.99 Total: 1.0
USA (FL), Hobe Sound 2009 (Eliminator) PTHIO_084
3 0.16 0.47 0.47
0.07 0.19 0.19
0 0
0.14 0.17
< 0.01 0.011
< 0.01 < 0.01
< 0.01 < 0.01
< 0.01 < 0.01
< 0.01 < 0.01
Parent: 0.16 Total: 0.18
USA (MN), Paynesville 2009 (Glenoble) PTHIO_084
3 0.15 0.45 0.45
0.11 0.32 0.32
0 0 w/o tips 0 0
1.3 1.7 0.68 0.42
< 0.01 < 0.01 < 0.01 < 0.01
< 0.01 < 0.01 < 0.01 < 0.01
< 0.01 < 0.01 < 0.01 < 0.01
< 0.01 < 0.01 < 0.01 < 0.01
< 0.01 < 0.01 < 0.01 < 0.01
Parent: 1.5 Total: 1.5
USA (KS), Lenexa 2009 (Contender) PTHIO_084
3 0.16 0.46 0.46
0.11 0.33 0.33
0 0
1.0 0.8
< 0.01 < 0.01
< 0.01 < 0.01
< 0.01 < 0.01
< 0.01 < 0.01
0.011 < 0.01
Parent: 0.9 Total: 0.92

Penthiopyrad
1513
Location, Year (variety) Reference
Application DAT Residues, mg/kg Selected residue mg/kg a
n kg ai/ha kg ai/hL
parent PAM PCA 753-A-OH
753-F-DO
DM-PCA
Canada, Branchton 2009 (Sea Biscuit) PTHIO_084
3 0.16 0.49 0.44
0.02 0.05 0.05
0 0
0.62 0.31
0.014 0.011
< 0.01 < 0.01
< 0.01 < 0.01
< 0.01 < 0.01
< 0.01 < 0.01
Parent: 0.47 Total: 0.49
Canada, St. Marc-sur-Richilieu 2009 (Bronco) PTHIO_084
3 0.16 0.45 0.45
0.32 0.96 0.96
0 0
0.12 0.13
< 0.01 < 0.01
< 0.01 < 0.01
< 0.01 < 0.01
< 0.01 < 0.01
< 0.01 < 0.01
Parent: 0.13 Total: 0.14
USA (OR), Parkdale 2009 (Blue Lake 274) PTHIO_084
3 0.16 0.46 0.48
0.09 0.25 0.25
0 0 w/o tips 0 0
0.46 0.26 0.22 0.26
< 0.01 < 0.01 < 0.01 < 0.01
< 0.01 < 0.01 < 0.01 < 0.01
< 0.01 < 0.01 < 0.01 < 0.01
< 0.01 < 0.01 < 0.01 < 0.01
< 0.01 < 0.01 < 0.01 < 0.01
Parent: 0.36 Total: 0.38
Succulent beans without pods
USA (GA), Athens 2009 (Jackson Wonder) PTHIO_084
3 0.16 0.46 0.45
0.07 0.19 0.19
0 0
0.058 0.053
0.01 0.011
< 0.01 < 0.01
< 0.01 < 0.01
< 0.01 < 0.01
< 0.01 < 0.01
Parent: 0.056 Total: 0.075
USA (GA), Chula 2009 (Cangreen) PTHIO_084
3 0.15 0.44 0.45
0.04 0.12 0.12
0 0
0.034 0.036
< 0.01 < 0.01
< 0.01 < 0.01
< 0.01 < 0.01
< 0.01 < 0.01
< 0.01 < 0.01
Parent: 0.035 Total: 0.054
USA (NC), Seven Springs 2009 (Cangreen) PTHIO_084
3 0.16 0.45 0.45
0.08 0.2 0.19
0 0
0.02 0.029
< 0.01 < 0.01
< 0.01 < 0.01
< 0.01 < 0.01
< 0.01 < 0.01
< 0.01 < 0.01
Parent: 0.025 Total: 0.043
USA (AL), Auburn 2009 (White Dixie Butter) PTHIO_084
3 0.16 0.46 0.45
0.75 0.75 0.75
0 0
0.094 < 0.01
< 0.01 < 0.01
< 0.01 < 0.01
< 0.01 < 0.01
< 0.01 < 0.01
< 0.01 < 0.01
Parent: 0.052 Total: 0.071
USA (ND), Gardner 2009 (Tender Green) PTHIO_084
3 0.16 0.48 0.46
0.02 0.05 0.05
0 0
0.026 0.022
< 0.01 < 0.01
< 0.01 < 0.01
< 0.01 < 0.01
< 0.01 < 0.01
< 0.01 < 0.01
Parent: 0.024 Total: 0.043
USA (CA), Porterville 2009 (Jade) PTHIO_084
3 0.16 0.45 0.47
0.05 0.08 0.16
0 0
0.12 0.13
0.021 0.02
0.034 0.035
< 0.01 < 0.01
< 0.01 < 0.01
< 0.01 < 0.01
Parent: 0.13 Total: 0.16

Penthiopyrad
1514
Location, Year (variety) Reference
Application DAT Residues, mg/kg Selected residue mg/kg a
n kg ai/ha kg ai/hL
parent PAM PCA 753-A-OH
753-F-DO
DM-PCA
USA (OR), Parkdale 2009 (Blue Lake 274) PTHIO_084
3 0.16 0.45 0.46
0.35 0.94 0.94
0 0
0.01 0.011
< 0.01 < 0.01
< 0.01 < 0.01
< 0.01 < 0.01
< 0.01 < 0.01
< 0.01 < 0.01
Parent: 0.011 Total: 0.029
a mean of replicate samples (if applicable); total residue based on the edible portion DAT: days after final treatment
Table 89 Residues in legume peas following foliar application of penthiopyrad
Location, Year (variety) Reference
Application DAT Residues, mg/kg Selected residue mg/kg a
n kg ai/ha
kg ai/hL
parent PAM PCA 753-A-OH
753-F-DO
DM-PCA
Succulent peas with pods
USA (KS), Lenexa 2009 (Dwarf Grey Sugar) PTHIO_084
3 0.16 0.46 0.46
0.11 0.32 0.32
0 0
1.5 1.5
0.029 0.028
0.021 0.026
< 0.01 0.012
0.066 0.077
0.013 0.017
Parent: 1.5 Total: 1.6
USA (MN), Paynesville 2009 (Sugar Bon) PTHIO_084
3 0.15 0.45 0.45
0.11 0.32 0.32
0 0 w/o tips 0 0
0.88 0.88 1.7 0.69
< 0.01 < 0.01 < 0.01 < 0.01
< 0.01 < 0.01 < 0.01 < 0.01
< 0.01 < 0.01 < 0.01 < 0.01
< 0.01 < 0.01 < 0.01 < 0.01
< 0.01 < 0.01 < 0.01 < 0.01
Parent: 0.88 Total: 0.9
USA (OH), Richwood 2009 (Super Sugar Snap) PTHIO_084
3 0.16 0.46 0.45
0.09 0.28 0.28
0 0 w/o tips 0 0
0.85 1.2 0.66 0.63
0.014 0.014 0.013 0.013
0.015 0.013 0.01 0.011
< 0.01 < 0.01 < 0.01 < 0.01
0.033 0.038 0.042 0.044
< 0.01 < 0.01 < 0.01 < 0.01
Parent: 1.0 Total: 1.1
USA (OR), Parkdale 2009 (Progress #4) PTHIO_084
3 0.16 0.46 0.46
0.08 0.25 0.24
0 0 w/o tips 0 0
1.2 1.3 0.95 0.99
0.018 0.017 0.014 0.015
< 0.01 < 0.01 < 0.01 < 0.01
0.014 0.012 < 0.01 0.01
0.067 0.063 0.052 0.065
0.024 0.02 0.022 0.024
Parent: 1.3 Total: 1.3
Succulent peas without pods
Canada, Berwick 2009 (Laxton´s Progress) PTHIO_084
3 0.16 0.45 0.45
0.06 0.18 0.18
0 0
0.081 0.099
< 0.01 < 0.01
0.012 0.011
< 0.01 < 0.01
< 0.01 < 0.01
< 0.01 < 0.01
Parent: 0.09 Total: 0.11

Penthiopyrad
1515
Location, Year (variety) Reference
Application DAT Residues, mg/kg Selected residue mg/kg a
n kg ai/ha
kg ai/hL
parent PAM PCA 753-A-OH
753-F-DO
DM-PCA
USA (ND), Gardner 2009 (Tender Green) PTHIO_084
3 0.16 0.47 0.46
0.02 0.05 0.05
0 0
0.069 0.064
< 0.01 < 0.01
< 0.01 < 0.01
< 0.01 < 0.01
< 0.01 < 0.01
< 0.01 < 0.01
Parent: 0.067 Total: 0.085
USA (MN), Geneva 2009 (Knight) PTHIO_084
3 0.16 0.46 0.46
0.1 0.25 0.27
0 0
0.15 0.13
< 0.01 < 0.01
0.025 0.026
< 0.01 < 0.01
< 0.01 < 0.01
0.011 < 0.01
Parent: 0.14 Total: 0.16
Canada, Branchton 2009 (Mr. Big) PTHIO_084
3 0.16 0.46 0.46
0.05 0.15 0.15
0 0
0.073 0.065
< 0.01 < 0.01
< 0.01 < 0.01
< 0.01 < 0.01
< 0.01 < 0.01
< 0.01 < 0.01
Parent: 0.069 Total: 0.088
Canada, St. Marc-sur-Richilieu 2009 (Spring) PTHIO_084
3 0.16 0.45 0.41
0.32 0.91 0.96
0 0
0.035 0.044
< 0.01 < 0.01
0.016 0.018
< 0.01 < 0.01
< 0.01 < 0.01
< 0.01 < 0.01
Parent: 0.05 Total: 0.068
USA (OR), Parkdale 2009 (Progress #9) PTHIO_084
3 0.16 0.46 0.46
0.08 0.24 0.28
0 0
0.081 0.072
< 0.01 < 0.01
0.016 0.015
< 0.01 < 0.01
< 0.01 < 0.01
< 0.01 < 0.01
Parent: 0.077 Total: 0.095
USA (OR), Corvallis 2009 (Green Arrow) PTHIO_084
3 0.15 0.47 0.44
0.05 0.17 0.16
0 0
0.042 0.038
< 0.01 < 0.01
< 0.01 < 0.01
< 0.01 < 0.01
< 0.01 < 0.01
< 0.01 < 0.01
Parent: 0.04 Total: 0.059
a mean of replicate samples (if applicable); total residue based on the edible portion DAT: days after final treatment
Table 90 Residues in beans (pulses) following foliar application of penthiopyrad
Location, Year (variety) Reference
Application DAT Residues, mg/kg Selected residue mg/kg a
n kg ai/ha
kg ai/hL
parent PAM PCA 753-A-OH
753-F-DO
DM-PCA
USA (MI), Saginaw 2007 (Vista Navy) PTHIO_085
2 0.31 0.19 21 21
< 0.01 < 0.01
< 0.01 < 0.01
0.063 0.058
< 0.01 < 0.01
< 0.01 < 0.01
< 0.01 < 0.01
Parent: < 0.01 Total: < 0.01
USA (MN), Paynesville 2007 (Black Turtle) PTHIO_085
2 0.3 0.2 21 21
< 0.01 < 0.01
< 0.01 < 0.01
< 0.01 < 0.01
< 0.01 < 0.01
< 0.01 < 0.01
< 0.01 < 0.01
Parent: < 0.01 Total: < 0.01

Penthiopyrad
1516
Location, Year (variety) Reference
Application DAT Residues, mg/kg Selected residue mg/kg a
n kg ai/ha
kg ai/hL
parent PAM PCA 753-A-OH
753-F-DO
DM-PCA
Canada, Branchton 2007 (Cranberry) PTHIO_085
2 0.31 0.3
0.16 0.15
21 21
< 0.01 < 0.01
< 0.01 < 0.01
0.012 0.011
< 0.01 < 0.01
< 0.01 < 0.01
< 0.01 < 0.01
Parent: < 0.01 Total: < 0.01
Canada, Branchton 2007 (White Beans) PTHIO_085
2 0.31 0.16 21 21
< 0.01 0.012
< 0.01 < 0.01
0.077 0.089
< 0.01 < 0.01
< 0.01 < 0.01
< 0.01 < 0.01
Parent: 0.011 Total: 0.03
Canada, Portage la Prairie 2007 (Pintoba) PTHIO_085
2 0.31 0.3
0.16 0.15
21 21
0.036 0.03
< 0.01 < 0.01
0.044 0.038
< 0.01 < 0.01
< 0.01 < 0.01
< 0.01 < 0.01
Parent: 0.033 Total: 0.052
USA (ND), Velva 2007 (Maverick) PTHIO_085
2 0.31 0.23 21 21
< 0.01 < 0.01
< 0.01 < 0.01
0.037 0.034
< 0.01 < 0.01
< 0.01 < 0.01
< 0.01 < 0.01
Parent: < 0.01 Total: < 0.01
Canada, Taber 2007 (Great Northern White) PTHIO_085
2 0.3 0.31
0.15 0.15
21 21
0.027 0.025
< 0.01 < 0.01
< 0.01 < 0.01
< 0.01 < 0.01
< 0.01 < 0.01
< 0.01 < 0.01
Parent: 0.026 Total: 0.045
USA (TX), Levelland 2007 (Vision) PTHIO_085
2 0.31 0.3
0.22 0.22
21 21
< 0.01 < 0.01
< 0.01 < 0.01
< 0.01 < 0.01
< 0.01 < 0.01
< 0.01 < 0.01
< 0.01 < 0.01
Parent: < 0.01 Total: < 0.01
USA (ID), Jerome 2007 (Othello Pinto) PTHIO_085
2 0.3 0.18 21 21
< 0.01 < 0.01
< 0.01 < 0.01
0.038 0.043
< 0.01 < 0.01
< 0.01 < 0.01
< 0.01 < 0.01
Parent: < 0.01 Total: < 0.01
USA (CA), Fresno 2007 (Black Eye Peas) PTHIO_085
2 0.3 0.16 21 21
0.18 0.21
0.05 0.055
0.027 0.029
0.011 0.014
< 0.01 < 0.01
< 0.01 < 0.01
Parent: 0.2 Total: 0.29
USA (WA), Ephrata 2007 (Othello Pinto) PTHIO_085
2 0.3 0.31
0.16 0.16
21 21
< 0.01 < 0.01
< 0.01 < 0.01
0.017 0.017
< 0.01 < 0.01
< 0.01 < 0.01
< 0.01 < 0.01
Parent: < 0.01 Total: < 0.01
USA (ND), Gardener 2008
2 0.32 0.31 (SC)
0.23 0.22
20 20
< 0.01 < 0.01
< 0.01 < 0.01
0.022 0.024
< 0.01 < 0.01
< 0.01 < 0.01
0.015 0.018
Parent: < 0.01 Total: < 0.01

Penthiopyrad
1517
Location, Year (variety) Reference
Application DAT Residues, mg/kg Selected residue mg/kg a
n kg ai/ha
kg ai/hL
parent PAM PCA 753-A-OH
753-F-DO
DM-PCA
(Navigator) PTHIO_086
2 0.32 0.31 (EC)
0.23 0.22
20 20
< 0.01 < 0.01
< 0.01 < 0.01
0.031 0.031
< 0.01 < 0.01
< 0.01 < 0.01
0.017 0.02
Canada, Branchton 2008 (Cranberry) PTHIO_086
2 0.29 0.29 (SC)
0.14 0.14
21 21
< 0.01 < 0.01
< 0.01 < 0.01
< 0.01 < 0.01
< 0.01 < 0.01
< 0.01 < 0.01
< 0.01 < 0.01
Parent: < 0.01 Total: < 0.01
2 0.31 0.29 (EC)
0.15 0.14
21 21
< 0.01 < 0.01
< 0.01 < 0.01
< 0.01 < 0.01
< 0.01 < 0.01
< 0.01 < 0.01
< 0.01 < 0.01
USA (ND), Eldridge 2008 (Pints Maverick) PTHIO_086
2 0.31 (SC)
0.22 21 21
< 0.01 < 0.01
< 0.01 < 0.01
0.035 0.028
< 0.01 < 0.01
< 0.01 < 0.01
< 0.01 < 0.01
Parent: < 0.01 Total: < 0.01
2 0.31 (EC)
0.22 21 21
< 0.01 < 0.01
< 0.01 < 0.01
0.085 0.084
< 0.01 < 0.01
< 0.01 < 0.01
0.014 0.011
a:mean of replicate samples (if applicable); total residue based on the edible portion DAT: days after final treatment
Table 91 Residues in peas (pulses) following foliar application of penthiopyrad
Location, Year (variety) Reference
Application DAT Residues, mg/kg Selected residue mg/kg a
n kg ai/ha
kg ai/hL
parent PAM PCA 753-A-OH
753-F-DO
DM-PCA
Canada, Branchton 2007 (DS Admiral) PTHIO_085
2 0.31 0.16 22 22
0.016 < 0.01
< 0.01 < 0.01
< 0.01 < 0.01
< 0.01 < 0.01
< 0.01 < 0.01
0.014 0.013
Parent: 0.014 Total: 0.033
Canada, Portage la Prairie 2007 (DS Admiral) PTHIO_085
2 0.3 0.15 22 22
< 0.01 < 0.01
< 0.01 < 0.01
< 0.01 < 0.01
< 0.01 < 0.01
< 0.01 < 0.01
< 0.01 < 0.01
Parent: < 0.01 Total: < 0.01
USA (ID), Jerome 2007 (Pendelton) PTHIO_085
2 0.3 0.18 21 21
0.012 < 0.01
< 0.01 < 0.01
< 0.01 < 0.01
< 0.01 < 0.01
< 0.01 < 0.01
< 0.01 < 0.01
Parent: 0.011 Total: 0.03
USA (ID), Payette 2007 (Austrian Winter Peas) PTHIO_085
2 0.31 0.16 21 21
0.056 0.12
0.016 0.018
0.015 0.017
< 0.01 < 0.01
< 0.01 < 0.01
< 0.01 < 0.01
Parent: 0.088 Total: 0.12
USA (OR), Madras 2007 (Ariel) PTHIO_085
2 0.31 0.18 24 24
< 0.01 < 0.01
< 0.01 < 0.01
< 0.01 < 0.01
< 0.01 < 0.01
< 0.01 < 0.01
< 0.01 < 0.01
Parent: < 0.01 Total: < 0.01

Penthiopyrad
1518
Location, Year (variety) Reference
Application DAT Residues, mg/kg Selected residue mg/kg a
n kg ai/ha
kg ai/hL
parent PAM PCA 753-A-OH
753-F-DO
DM-PCA
USA (WA), Ephrata 2007 (Dechutes) PTHIO_085
2 0.31 0.16 21 21
< 0.01 < 0.01
< 0.01 < 0.01
0.014 0.015
< 0.01 < 0.01
< 0.01 < 0.01
< 0.01 < 0.01
Parent: < 0.01 Total: < 0.01
USA (WA), Ephrata 2007 (Tonic) PTHIO_085
2 0.31 0.17 21 21
0.016 0.012
< 0.01 < 0.01
0.074 0.068
< 0.01 < 0.01
< 0.01 < 0.01
0.013 0.012
Parent: 0.014 Total: 0.033
Canada, Portage la Prairie 2007 (DS Admiral) PTHIO_085
2 0.3 0.15 20 20
< 0.01 < 0.01
< 0.01 < 0.01
< 0.01 < 0.01
< 0.01 < 0.01
< 0.01 < 0.01
< 0.01 < 0.01
Parent: < 0.01 Total: < 0.01
Canada, Wakaw 2007 (DS Admiral) PTHIO_085
2 0.31 0.3
0.15 0.15
21 21
< 0.01 < 0.01
< 0.01 < 0.01
< 0.01 < 0.01
< 0.01 < 0.01
< 0.01 < 0.01
< 0.01 0.014
Parent: < 0.01 Total: < 0.01
Canada, Alvera 2007 (DS Admiral) PTHIO_085
2 0.3 0.15 21 21
0.02 0.044
< 0.01 < 0.01
< 0.01 0.012
< 0.01 < 0.01
< 0.01 < 0.01
0.012 0.011
Parent: 0.032 Total: 0.051
Canada, Fort Saskatchewan 2007 (Cooper) PTHIO_085
2 0.31 0.3
0.15 0.15
21 21
< 0.01 < 0.01
< 0.01 < 0.01
< 0.01 < 0.01
< 0.01 < 0.01
< 0.01 < 0.01
< 0.01 < 0.01
Parent: < 0.01 Total: < 0.01
USA (WA), Ephrata 2008 (Kalamo) PTHIO_086
2 0.31 0.30 (SC)
0.16 0.16
21 21
< 0.01 < 0.01
< 0.01 < 0.01
0.013 < 0.01
< 0.01 < 0.01
< 0.01 < 0.01
< 0.01 < 0.01
Parent: 0.012 Total: 0.031
2 0.31 (EC)
0.16 21 21
0.011 0.013
< 0.01 < 0.01
0.096 0.096
< 0.01 < 0.01
< 0.01 < 0.01
< 0.01 < 0.01
Canada, Fort Saskatchewan 2008 (Midas) PTHIO_086
2 0.3 (SC)
0.13 22 22
0.027 0.04
< 0.01 < 0.01
0.015 0.013
< 0.01 < 0.01
< 0.01 < 0.01
0.013 0.013
Parent: 0.034 Total: 0.052
2 0.31 0.3 (EC)
0.14 0.14
22 22
0.013 0.019
< 0.01 < 0.01
0.04 0.037
< 0.01 < 0.01
< 0.01 < 0.01
0.03 0.032
Canada, Fort Saskatchewan 2008 (Cooper) PTHIO_086
2 0.31 0.3 (SC)
0.14 0.13
21 21
< 0.01 < 0.01
< 0.01 < 0.01
< 0.01 < 0.01
< 0.01 < 0.01
< 0.01 < 0.01
< 0.01 < 0.01
Parent: < 0.01 Total: < 0.01
2 0.33 0.31 (EC)
0.14 0.14
21 21
< 0.01 < 0.01
< 0.01 < 0.01
0.012 0.013
< 0.01 < 0.01
< 0.01 < 0.01
0.013 0.014
a mean of replicate samples (if applicable); total residue based on the edible portion DAT: days after final treatment

Penthiopyrad
1519
Table 92 Residues in soya beans following foliar application of penthiopyrad
Location, Year (variety) Reference
Application DAT Residues, mg/kg Selected residue mg/kg a
n kg ai/ha
kg ai/hL
parent PAM PCA 753-A-OH
753-F-DO
DM-PCA
USA (GA), Athens 2009 (4062885) PTHIO_087
2 0.46 0.21 14 14
< 0.01 < 0.01
< 0.01 < 0.01
< 0.01 < 0.01
< 0.01 < 0.01
< 0.01 < 0.01
< 0.01 < 0.01
Parent: < 0.01 Total: < 0.01
USA (NC), Seven Springs 2009 (DKB-64-51) PTHIO_087
2 0.45 0.18 14 14
0.041 0.056
0.01 0.012
< 0.01 < 0.01
< 0.01 < 0.01
< 0.01 < 0.01
< 0.01 < 0.01
Parent: 0.049 Total: 0.069
USA (LA), Cheneyville 2009 (Pioneer 95820) PTHIO_087
2 0.45 0.22 14 14
0.022 0.022
0.012 0.01
0.018 0.018
< 0.01 < 0.01
< 0.01 < 0.01
< 0.01 < 0.01
Parent: 0.022 Total: 0.042
USA (LA), Cheneyville 2009 (Asgrow R4519) PTHIO_087
2 0.46 0.21 15 15
< 0.01 < 0.01
< 0.01 < 0.01
0.011 0.011
< 0.01 < 0.01
< 0.01 < 0.01
< 0.01 < 0.01
Parent: < 0.01 Total: < 0.01
USA (MO), Fisk 2009 (54-17 RR1STS) PTHIO_087
2 0.47 0.25 13 13
< 0.01 0.015
< 0.01 < 0.01
< 0.01 < 0.01
< 0.01 < 0.01
< 0.01 < 0.01
< 0.01 < 0.01
Parent: 0.013 Total: 0.031
USA (MO), Dudley 2009 (Jake) PTHIO_087
2 0.47 0.25 13 13
0.026 0.018
< 0.01 < 0.01
< 0.01 < 0.01
< 0.01 < 0.01
< 0.01 < 0.01
< 0.01 < 0.01
Parent: 0.022 Total: 0.041
USA (KS), Gardner 2009 (Fontanelle 407NRS) PTHIO_087
2 0.46 0.34 13 13
< 0.01 < 0.01
< 0.01 < 0.01
< 0.01 < 0.01
< 0.01 < 0.01
< 0.01 < 0.01
< 0.01 < 0.01
Parent: < 0.01 Total: < 0.01
USA (IL), Carlyle 2009 (S43-N6) PTHIO_087
2 0.47 0.3 6 6
0.1 0.1
< 0.01 < 0.01
< 0.01 < 0.01
< 0.01 < 0.01
< 0.01 < 0.01
< 0.01 < 0.01
Parent: 0.1 Total: 0.12
USA (MO), Tipton 2009 (48-24 MorSoy) PTHIO_087
2 0.46 0.16 13 13
< 0.01 < 0.01
< 0.01 < 0.01
< 0.01 < 0.01
< 0.01 < 0.01
< 0.01 < 0.01
< 0.01 < 0.01
Parent: < 0.01 Total: < 0.01

Penthiopyrad
1520
Location, Year (variety) Reference
Application DAT Residues, mg/kg Selected residue mg/kg a
n kg ai/ha
kg ai/hL
parent PAM PCA 753-A-OH
753-F-DO
DM-PCA
USA (IL), Rochelle 2009 (Pioneer 92 M61) PTHIO_087
2 0.45 0.97 14 14
0.01 0.039
< 0.01 < 0.01
< 0.01 < 0.01
< 0.01 < 0.01
< 0.01 < 0.01
< 0.01 < 0.01
Parent: 0.025 Total: 0.043
USA (OH), Richwood 2009 (ShurGrow 289RR) PTHIO_087
2 0.45 0.28 14 14
0.01 0.038
< 0.01 < 0.01
< 0.01 < 0.01
< 0.01 < 0.01
< 0.01 < 0.01
< 0.01 < 0.01
Parent: 0.024 Total: 0.043
USA (NE), Springfield 2009 (NcT 2 A98) PTHIO_087
2 0.46 0.36 14 14
0.04 0.096
< 0.01 0.01
< 0.01 < 0.01
< 0.01 < 0.01
< 0.01 < 0.01
< 0.01 < 0.01
Parent: 0.068 Total: 0.087
USA (IA), Richland 2009 (Pioneer 93B82) PTHIO_087
2 0.45 0.28 14 14
< 0.01 0.018
< 0.01 < 0.01
< 0.01 < 0.01
< 0.01 < 0.01
< 0.01 < 0.01
< 0.01 < 0.01
Parent: 0.014 Total: 0.033
USA (MN), Geneva 2009 (Pioneer 91M80) PTHIO_087
2 0.46 0.26 15 15
< 0.01 < 0.01
< 0.01 < 0.01
< 0.01 < 0.01
< 0.01 < 0.01
< 0.01 < 0.01
< 0.01 < 0.01
Parent: < 0.01 Total: < 0.01
USA (WI), Delavan 2009 (AG 2002 RR) PTHIO_087
2 0.46 0.22 14 14
0.054 0.057
< 0.01 < 0.01
< 0.01 < 0.01
< 0.01 < 0.01
< 0.01 < 0.01
< 0.01 < 0.01
Parent: 0.056 Total: 0.074
Canada, Thorndale 2009 (Pioneer 91M41) PTHIO_087
2 0.46 0.23 13 13
0.17 0.25
< 0.01 0.013
< 0.01 0.01
< 0.01 < 0.01
< 0.01 < 0.01
< 0.01 < 0.01
Parent: 0.21 Total: 0.23
Canada, St. Marc-sur-Richilieu 2009 (Pro 2590 R) PTHIO_087
2 0.45 0.96 13 13
< 0.01 < 0.01
< 0.01 < 0.01
< 0.01 < 0.01
< 0.01 < 0.01
< 0.01 < 0.01
< 0.01 < 0.01
Parent: < 0.01 Total: < 0.01
Canada, St. Marc-sur-Richilieu 2009 (Pro 2590 R) PTHIO_087
2 0.45 0.23 13 13
< 0.01 < 0.01
< 0.01 < 0.01
< 0.01 < 0.01
< 0.01 < 0.01
< 0.01 < 0.01
< 0.01 < 0.01
Parent: < 0.01 Total: < 0.01

Penthiopyrad
1521
Location, Year (variety) Reference
Application DAT Residues, mg/kg Selected residue mg/kg a
n kg ai/ha
kg ai/hL
parent PAM PCA 753-A-OH
753-F-DO
DM-PCA
Canada, Branchton 2009 (RCAT Mirra) PTHIO_087
2 0.45 0.22 13 13
< 0.01 < 0.01
< 0.01 < 0.01
< 0.01 < 0.01
< 0.01 < 0.01
< 0.01 < 0.01
< 0.01 < 0.01
Parent: < 0.01 Total: < 0.01
Canada, Paris 2009 (91M41) PTHIO_087
2 0.44 0.22 13 13
0.012 0.011
< 0.01 < 0.01
< 0.01 < 0.01
< 0.01 < 0.01
< 0.01 < 0.01
< 0.01 < 0.01
Parent: 0.012 Total: 0.03
Canada, Paris 2009 (DeKalb 2707R2) PTHIO_087
2 0.48 0.24 13 13
< 0.01 < 0.01
< 0.01 < 0.01
< 0.01 < 0.01
< 0.01 < 0.01
< 0.01 < 0.01
< 0.01 < 0.01
Parent: < 0.01 Total: < 0.01
a mean of replicate samples (if applicable); total residue based on the edible portion DAT: days after final treatment
Table 93 Residues in carrot roots following foliar application of penthiopyrad
Location, Year (variety) Reference
Application DAT Residues, mg/kg Selected residue mg/kg a
n kg ai/ha
kg ai/hL
parent PAM PCA 753-A-OH
753-F-DO
DM-PCA
Canada, New Glasgow 2009 (Sweetness III) PTHIO_088
2 0.43 0.15 0 0
0.088 0.082
< 0.01 < 0.01
< 0.01 < 0.01
< 0.01 < 0.01
< 0.01 < 0.01
< 0.01 < 0.01
Parent: 0.085 Total: 0.10
USA (FL), Bradenton 2009 (Chantenay) PTHIO_088
2 0.47 0.44
0.12 0.12
0 0
0.13 0.11
< 0.01 < 0.01
< 0.01 < 0.01
< 0.01 < 0.01
< 0.01 < 0.01
< 0.01 < 0.01
Parent: 0.12 Total: 0.14
USA (OH), Richwood 2009 (Kuroda F1) PTHIO_088
2 0.45 0.28 0 0
0.042 0.06
< 0.01 < 0.01
< 0.01 < 0.01
< 0.01 < 0.01
< 0.01 < 0.01
< 0.01 < 0.01
Parent: 0.051 Total: 0.07
Canada, St. Marc-sur-Richilieu 2009 (Bolero) PTHIO_088
2 0.45 0.46
0.23 0.23
0 0
0.17 0.16
< 0.01 < 0.01
< 0.01 < 0.01
< 0.01 < 0.01
< 0.01 < 0.01
< 0.01 < 0.01
Parent: 0.17 Total: 0.18
Canada, Branchton 2009 (Sugar Snax) PTHIO_088 Replicate trials
2 0.46 0.23 0 0
0.36 0.43
< 0.01 < 0.01
< 0.01 < 0.01
< 0.01 < 0.01
< 0.01 < 0.01
< 0.01 < 0.01
Parent: 0.4 Total: 0.41 2 0.46
(i.f.) 0.46
0.46 0.23
0 0
0.72 0.63
< 0.01 < 0.01
< 0.01 < 0.01
< 0.01 < 0.01
0.014 0.013
< 0.01 < 0.01

Penthiopyrad
1522
Location, Year (variety) Reference
Application DAT Residues, mg/kg Selected residue mg/kg a
n kg ai/ha
kg ai/hL
parent PAM PCA 753-A-OH
753-F-DO
DM-PCA
USA (TX), D´Hanis 2009 (SDC 1682) PTHIO_088
2 0.46 0.98 0 0
0.086 0.056
< 0.01 < 0.01
< 0.01 < 0.01
< 0.01 < 0.01
< 0.01 < 0.01
< 0.01 < 0.01
Parent: 0.071 Total: 0.09
USA (CA), Madera 2009 (Danvers Half Long 126) PTHIO_088
2 0.47 0.46
0.17 0.17
0 0
0.021 0.02
< 0.01 < 0.01
< 0.01 < 0.01
< 0.01 < 0.01
< 0.01 < 0.01
< 0.01 < 0.01
Parent: 0.021 Total: 0.039
USA (CA), Porterville 2009 (Danvers 126) PTHIO_088 Replicate trials
2 0.46 0.18 0 0
0.044 0.05
< 0.01 < 0.01
< 0.01 < 0.01
< 0.01 < 0.01
< 0.01 < 0.01
< 0.01 < 0.01
Parent: 0.047 Total: 0.066
2 0.45 (i.f.) 0.46
0.25 0.18
0 0
0.071 0.055
< 0.01 < 0.01
< 0.01 < 0.01
< 0.01 < 0.01
< 0.01 < 0.01
< 0.01 < 0.01
USA (WA), Ephrata 2009 (Mokum) PTHIO_088 Replicate trials
2 0.46 0.25 0 0
0.023 0.027
< 0.01 < 0.01
< 0.01 < 0.01
< 0.01 < 0.01
< 0.01 < 0.01
< 0.01 < 0.01
Parent: 0.025 Total: 0.044
2 0.46 (i.f.) 0.46
0.33 0.25
0 0
1.2 1.0
< 0.01 < 0.01
< 0.01 < 0.01
< 0.01 < 0.01
0.011 < 0.01
< 0.01 < 0.01
i.f. = first treatment in-furrow at sowing/planting a mean of replicate samples (if applicable); total residue based on the edible portion DAT: days after final treatment
Table 94 Residues in potatoes following foliar and in-furrow application of penthiopyrad
Location, Year (variety) Reference
Application DAT Residues, mg/kg Selected residue mg/kg b n kg ai/ha kg
ai/hL parent PAM PCA 753-
A-OH 753-F-DO
DM-PCA
USA (NY), North Rose 2008 (Carola) PTHIO_089
3 0.36 0.37 0.36
0.13 0.13 0.13
7 7
< 0.01 0.011
< 0.01 < 0.01
< 0.01 < 0.01
< 0.01 < 0.01
< 0.01 < 0.01
< 0.01 < 0.01
Parent: 0.011 Total: 0.029
3 0.36 (i.f., EC) 0.37 0.36
0.25 0.13 0.13
7 7
< 0.01 < 0.01
< 0.01 < 0.01
< 0.01 < 0.01
< 0.01 < 0.01
< 0.01 < 0.01
< 0.01 < 0.01

Penthiopyrad
1523
Location, Year (variety) Reference
Application DAT Residues, mg/kg Selected residue mg/kg b n kg ai/ha kg
ai/hL parent PAM PCA 753-
A-OH 753-F-DO
DM-PCA
USA (GA), Germansville 2008 (Lehigh) PTHIO_089
3 0.36 0.37 0.36
0.12 0.12 0.12
0a 0a 0 0 3 3 7 7 14 14 21 21
< 0.01 < 0.01 < 0.01 < 0.01 < 0.01 < 0.01 < 0.01 < 0.01 < 0.01 < 0.01 < 0.01 < 0.01
< 0.01 < 0.01 < 0.01 < 0.01 < 0.01 < 0.01 < 0.01 < 0.01 < 0.01 < 0.01 < 0.01 < 0.01
< 0.01 < 0.01 < 0.01 < 0.01 < 0.01 < 0.01 < 0.01 < 0.01 < 0.01 < 0.01 < 0.01 < 0.01
< 0.01 < 0.01 < 0.01 < 0.01 < 0.01 < 0.01 < 0.01 < 0.01 < 0.01 < 0.01 < 0.01 < 0.01
< 0.01 < 0.01 < 0.01 < 0.01 < 0.01 < 0.01 < 0.01 < 0.01 < 0.01 < 0.01 < 0.01 < 0.01
< 0.01 < 0.01 < 0.01 < 0.01 < 0.01 < 0.01 < 0.01 < 0.01 < 0.01 < 0.01 < 0.01 < 0.01
Parent: < 0.01 Total: < 0.01
3 0.37 (i.f., EC) 0.36 0.37
0.19 0.12 0.12
0a 0a 0 0 3 3 7 7 14 14 21 21
0.02 0.024 0.022 0.017 0.011 0.016 0.016 0.013 0.014 0.011 < 0.01 < 0.01
< 0.01 < 0.01 < 0.01 < 0.01 < 0.01 < 0.01 < 0.01 < 0.01 < 0.01 < 0.01 < 0.01 < 0.01
< 0.01 < 0.01 < 0.01 < 0.01 < 0.01 0.01 < 0.01 0.01 < 0.01 < 0.01 0.01 < 0.01
< 0.01 < 0.01 < 0.01 < 0.01 < 0.01 < 0.01 < 0.01 < 0.01 < 0.01 < 0.01 < 0.01 < 0.01
< 0.01 < 0.01 < 0.01 < 0.01 < 0.01 < 0.01 < 0.01 < 0.01 < 0.01 < 0.01 < 0.01 < 0.01
0.049 0.046 0.042 0.043 0.056 0.056 0.046 0.057 0.038 0.041 0.04 0.032
3 0.36 0.36 (EC) 0.37
0.12 0.12 0.12
7 7
< 0.01 < 0.01
< 0.01 < 0.01
< 0.01 < 0.01
< 0.01 < 0.01
< 0.01 < 0.01
0.011 0.014
Canada, New Glasgow 2008 (Carola) PTHIO_089
3 0.34 0.37 0.35
0.16 0.17 0.17
7 7
< 0.01 < 0.01
< 0.01 < 0.01
< 0.01 < 0.01
< 0.01 < 0.01
< 0.01 < 0.01
< 0.01 < 0.01
Parent: < 0.01 Total: < 0.01
3 0.35 (i.f., EC) 0.37 0.37
0.59 0.17 0.18
7 7
0.01 < 0.01
< 0.01 < 0.01
< 0.01 < 0.01
< 0.01 < 0.01
< 0.01 < 0.01
< 0.01 < 0.01
Canada, New Glasgow 2008 (Shepody) PTHIO_089
3 0.34 0.37 0.35
0.16 0.17 0.17
7 7
< 0.01 < 0.01
< 0.01 < 0.01
< 0.01 < 0.01
< 0.01 < 0.01
< 0.01 < 0.01
< 0.01 < 0.01
Parent: < 0.01 Total: < 0.01
3 0.35 (i.f., EC) 0.37 0.37
0.59 0.17 0.18
7 7
0.01 < 0.01
< 0.01 < 0.01
< 0.01 < 0.01
< 0.01 < 0.01
< 0.01 < 0.01
< 0.01 < 0.01

Penthiopyrad
1524
Location, Year (variety) Reference
Application DAT Residues, mg/kg Selected residue mg/kg b n kg ai/ha kg
ai/hL parent PAM PCA 753-
A-OH 753-F-DO
DM-PCA
Canada, Berwick 2008 (Goldrush) PTHIO_089
3 0.36 0.35 0.36
0.07 0.06 0.07
8 8
< 0.01 < 0.01
< 0.01 < 0.01
< 0.01 < 0.01
< 0.01 < 0.01
< 0.01 < 0.01
< 0.01 < 0.01
Parent: < 0.01 Total: < 0.01
3 0.36 (i.f., EC) 0.36 0.35
0.07 0.06 0.07
8 8
0.058 0.046
< 0.01 < 0.01
< 0.01 < 0.01
< 0.01 < 0.01
< 0.01 < 0.01
< 0.01 < 0.01
Canada, Inglisville 2008 (Superior) PTHIO_089
3 0.35 0.07 6 6
< 0.01 < 0.01
< 0.01 < 0.01
< 0.01 < 0.01
< 0.01 < 0.01
< 0.01 < 0.01
< 0.01 < 0.01
Parent: 0.025 Total: 0.044
3 0.36 (i.f., EC) 0.35 0.36
0.07 0.07 0.07
6 6
< 0.01 0.013
< 0.01 < 0.01
< 0.01 < 0.01
< 0.01 < 0.01
< 0.01 < 0.01
< 0.01 < 0.01
3 0.36 0.37 (EC) 0.36
0.06 0.06 0.07
6 6
0.022 0.028
< 0.01 < 0.01
< 0.01 < 0.01
< 0.01 < 0.01
< 0.01 < 0.01
< 0.01 < 0.01
USA (GA), Chula 2008 (Red Pontiac) PTHIO_089
3 0.35 0.36 0.36
0.15 0.15 0.17
7 7
0.012 < 0.01
< 0.01 < 0.01
0.01 0.01
< 0.01 < 0.01
< 0.01 < 0.01
0.028 0.03
Parent: 0.011 Total: 0.03
3 0.36 (i.f., EC) 0.36 0.35
0.25 0.15 0.16
7 7
0.011 0.021
< 0.01 < 0.01
< 0.01 < 0.01
< 0.01 < 0.01
< 0.01 < 0.01
0.026 0.022
USA (FL), Oviedo 2008 (Red La Soda) PTHIO_089
3 0.36 0.34 0.36
0.13 0.12 0.13
7 7
< 0.01 < 0.01
< 0.01 < 0.01
< 0.01 < 0.01
< 0.01 < 0.01
< 0.01 < 0.01
< 0.01 < 0.01
Parent: < 0.01 Total: < 0.01
3 0.36 (i.f., EC) 0.36 0.36
0.13 0.13 0.13
7 7
< 0.01 < 0.01
< 0.01 < 0.01
0.011 0.011
< 0.01 < 0.01
< 0.01 < 0.01
0.018 0.018
USA (MI), Laingsburg 2008 (Goldrush) PTHIO_089
3 0.35 0.35 0.36
0.21 0.21 0.21
7 7
< 0.01 < 0.01
< 0.01 < 0.01
< 0.01 < 0.01
< 0.01 < 0.01
< 0.01 < 0.01
< 0.01 < 0.01
Parent: < 0.01 Total: < 0.01
3 0.35 (i.f., EC) 0.36 0.36
0.12 0.21 0.21
7 7
< 0.01 0.022
< 0.01 < 0.01
< 0.01 < 0.01
< 0.01 < 0.01
< 0.01 < 0.01
< 0.01 < 0.01
3 0.36 0.36 (EC) 0.36
0.22 0.22 0.21
7 7
< 0.01 < 0.01
< 0.01 < 0.01
< 0.01 < 0.01
< 0.01 < 0.01
< 0.01 < 0.01
< 0.01 < 0.01

Penthiopyrad
1525
Location, Year (variety) Reference
Application DAT Residues, mg/kg Selected residue mg/kg b n kg ai/ha kg
ai/hL parent PAM PCA 753-
A-OH 753-F-DO
DM-PCA
USA (IA), Richland 2008 (Kennebec) PTHIO_089
3 0.37 0.35 0.36
0.23 0.21 0.19
7 7
< 0.01 < 0.01
< 0.01 < 0.01
< 0.01 < 0.01
< 0.01 < 0.01
< 0.01 < 0.01
< 0.01 0.012
Parent: < 0.01 Total: < 0.01
3 0.36 (i.f., EC) 0.36 0.36
0.22 0.22 0.19
7 7
< 0.01 < 0.01
< 0.01 < 0.01
< 0.01 < 0.01
< 0.01 < 0.01
< 0.01 < 0.01
< 0.01 < 0.01
Canada, Branchton 2008 (Norlands) PTHIO_089
3 0.35 0.35 0.36
0.09 0.09 0.09
7 7
0.037 0.028
< 0.01 < 0.01
< 0.01 < 0.01
< 0.01 < 0.01
< 0.01 < 0.01
< 0.01 < 0.01
Parent: 0.033 Total: 0.051
3 0.34 (i.f., EC) 0.35 0.34
0.52 0.09 0.09
7 7
0.029 0.024
< 0.01 < 0.01
< 0.01 < 0.01
< 0.01 < 0.01
< 0.01 < 0.01
< 0.01 < 0.01
Canada, Branchton 2008 (Gold Rush) PTHIO_089
3 0.34 0.35 0.35
0.09 0.09 0.09
7 7
0.014 0.02
< 0.01 < 0.01
< 0.01 < 0.01
< 0.01 < 0.01
< 0.01 < 0.01
< 0.01 < 0.01
Parent: 0.017 Total: 0.036
3 0.39 (i.f., EC) 0.35 0.37
0.6 0.09 0.09
7 7
0.038 0.013
< 0.01 < 0.01
< 0.01 < 0.01
< 0.01 < 0.01
< 0.01 < 0.01
< 0.01 < 0.01
Canada, Portage la Prairie 2008 (Russet Burbank) PTHIO_089
3 0.36 0.35 0.34
0.1 0.1 0.1
7 7
< 0.01 < 0.01
< 0.01 < 0.01
< 0.01 < 0.01
< 0.01 < 0.01
< 0.01 < 0.01
< 0.01 < 0.01
Parent: < 0.01 Total: < 0.01
3 0.34 (i.f., EC) 0.35 0.35
0.12 0.1 0.1
7 7
0.016 < 0.01
< 0.01 < 0.01
< 0.01 < 0.01
< 0.01 < 0.01
< 0.01 < 0.01
< 0.01 < 0.01
Canada, Taber 2008 (Russet) PTHIO_089
3 0.36 0.35 0.34
0.23 0.23 0.23
7 7
< 0.01 < 0.01
< 0.01 < 0.01
< 0.01 < 0.01
< 0.01 < 0.01
< 0.01 < 0.01
< 0.01 < 0.01
Parent: < 0.01 Total: < 0.01
USA (ID), Jerome 2008 (Red Pontiac) PTHIO_089
3 0.36 0.36 0.35
0.17 0.18 0.18
7 7
< 0.01 < 0.01
< 0.01 < 0.01
< 0.01 < 0.01
< 0.01 < 0.01
< 0.01 < 0.01
< 0.01 < 0.01
Parent: < 0.01 Total: < 0.01
3 0.35 (i.f., EC) 0.36 0.35
0.27 0.18 0.18
7 7
0.01 < 0.01
< 0.01 < 0.01
< 0.01 < 0.01
< 0.01 < 0.01
< 0.01 < 0.01
< 0.01 < 0.01

Penthiopyrad
1526
Location, Year (variety) Reference
Application DAT Residues, mg/kg Selected residue mg/kg b n kg ai/ha kg
ai/hL parent PAM PCA 753-
A-OH 753-F-DO
DM-PCA
USA (CA), Sanger 2008 (Red Lozoda) PTHIO_089
3 0.35 0.36 0.35
0.11 0.04 0.04
7 7
< 0.01 < 0.01
< 0.01 < 0.01
< 0.01 < 0.01
< 0.01 < 0.01
< 0.01 < 0.01
< 0.01 < 0.01
Parent: 0.015 Total: 0.034
3 0.35 (EC) 0.36 0.36
0.04 0.04 0.04
7 7
0.014 0.016
< 0.01 < 0.01
< 0.01 < 0.01
< 0.01 < 0.01
< 0.01 < 0.01
< 0.01 < 0.01
USA (ID), Jerome 2008 (Ranger) PTHIO_089
3 0.35 0.36 0.35
0.16 0.16 0.16
7 7
< 0.01 < 0.01
< 0.01 < 0.01
< 0.01 < 0.01
< 0.01 < 0.01
< 0.01 < 0.01
< 0.01 < 0.01
Parent: 0.014 Total: 0.033
3 0.35 (EC) 0.36 0.35
0.27 0.16 0.16
7 7
0.018 0.01
< 0.01 < 0.01
< 0.01 < 0.01
< 0.01 < 0.01
< 0.01 < 0.01
< 0.01 < 0.01
3 0.35 0.34 (EC) 0.35
0.2 0.19 0.16
7 7
< 0.01 < 0.01
< 0.01 < 0.01
0.012 0.013
< 0.01 < 0.01
< 0.01 < 0.01
0.031 0.032
USA (OR), Madras 2008 (Ranger Russett) PTHIO_089
3 0.36 0.38 0.36
0.19 0.19 0.19
7 7
< 0.01 < 0.01
< 0.01 < 0.01
< 0.01 < 0.01
< 0.01 < 0.01
< 0.01 < 0.01
< 0.01 < 0.01
Parent: < 0.01 Total: < 0.01
3 0.36 (i.f., EC) 0.38 0.36
0.25 0.19 0.19
7 7
< 0.01 < 0.01
< 0.01 < 0.01
< 0.01 < 0.01
< 0.01 < 0.01
< 0.01 < 0.01
< 0.01 < 0.01
USA (ID), Payette 2008 (Norkotah) PTHIO_089
3 0.35 0.36 0.35
0.15 0.15 0.15
7 7
< 0.01 < 0.01
< 0.01 < 0.01
< 0.01 < 0.01
< 0.01 < 0.01
< 0.01 < 0.01
< 0.01 < 0.01
Parent: < 0.01 Total: < 0.01
3 0.36 (i.f., EC) 0.37 0.36
0.25 0.16 0.15
7 7
0.019 0.021
< 0.01 < 0.01
< 0.01 < 0.01
< 0.01 < 0.01
< 0.01 < 0.01
0.015 0.015
3 0.35 0.35 (EC) 0.36
0.15 0.15 0.16
7 7
< 0.01 < 0.01
< 0.01 < 0.01
0.021 0.025
< 0.01 < 0.01
< 0.01 < 0.01
0.034 0.039

Penthiopyrad
1527
Location, Year (variety) Reference
Application DAT Residues, mg/kg Selected residue mg/kg b n kg ai/ha kg
ai/hL parent PAM PCA 753-
A-OH 753-F-DO
DM-PCA
USA (ID), Payette 2008 (Ranger Russett) PTHIO_089
3 0.35 0.36 0.36
0.15 0.15 0.15
0a 0a 0 0 3 3 7 7 14 14 21 21
< 0.01 < 0.01 < 0.01 < 0.01 < 0.01 < 0.01 < 0.01 < 0.01 < 0.01 < 0.01 < 0.01 < 0.01
< 0.01 < 0.01 < 0.01 < 0.01 < 0.01 < 0.01 < 0.01 < 0.01 < 0.01 < 0.01 < 0.01 < 0.01
< 0.01 < 0.01 < 0.01 < 0.01 < 0.01 < 0.01 < 0.01 < 0.01 < 0.01 < 0.01 < 0.01 < 0.01
< 0.01 < 0.01 < 0.01 < 0.01 < 0.01 < 0.01 < 0.01 < 0.01 < 0.01 < 0.01 < 0.01 < 0.01
< 0.01 < 0.01 < 0.01 < 0.01 < 0.01 < 0.01 < 0.01 < 0.01 < 0.01 < 0.01 < 0.01 < 0.01
< 0.01 < 0.01 < 0.01 < 0.01 < 0.01 < 0.01 < 0.01 < 0.01 < 0.01 < 0.01 < 0.01 < 0.01
Parent: < 0.01 Total: < 0.01
3 0.36 (i.f., EC) 0.36 0.36
0.26 0.16 0.15
0a 0a 0 0 3 3 7 7 14 14 21 21
< 0.01 < 0.01 0.011 0.011 0.011 < 0.01 0.015 0.013 0.01 < 0.01 < 0.01 < 0.01
< 0.01 < 0.01 < 0.01 < 0.01 < 0.01 < 0.01 < 0.01 < 0.01 < 0.01 < 0.01 < 0.01 < 0.01
< 0.01 < 0.01 < 0.01 < 0.01 < 0.01 < 0.01 < 0.01 < 0.01 < 0.01 < 0.01 < 0.01 < 0.01
< 0.01 < 0.01 < 0.01 < 0.01 < 0.01 < 0.01 < 0.01 < 0.01 < 0.01 < 0.01 < 0.01 < 0.01
< 0.01 < 0.01 < 0.01 < 0.01 < 0.01 < 0.01 < 0.01 < 0.01 < 0.01 < 0.01 < 0.01 < 0.01
< 0.01 < 0.01 < 0.01 < 0.01 < 0.01 < 0.01 < 0.01 < 0.01 < 0.01 < 0.01 < 0.01 < 0.01
Canada, Abbotsford 2008 (Warba) PTHIO_089
3 0.34 0.360.33
0.21 0.21 0.21
7 7
< 0.01 < 0.01
< 0.01 < 0.01
0.014 0.011
< 0.01 < 0.01
< 0.01 < 0.01
< 0.01 < 0.01
Parent: < 0.01 Total: < 0.01
3 0.35 (i.f., EC) 0.35 0.36
0.16 0.22 0.21
7 7
< 0.01 < 0.01
< 0.01 < 0.01
< 0.01 < 0.01
< 0.01 < 0.01
< 0.01 < 0.01
< 0.01 < 0.01
Canada, Fort Saskatchewan 2008 (Russet Burbank) PTHIO_089
3 0.35 0.36 0.36
0.14 0.14 0.14
7 7
< 0.01 < 0.01
< 0.01 < 0.01
< 0.01 < 0.01
< 0.01 < 0.01
< 0.01 < 0.01
< 0.01 < 0.01
Parent: < 0.01 Total: < 0.01
3 0.39 (i.f., EC) 0.36 0.36
0.1 0.14 0.14
7 7
< 0.01 < 0.01
< 0.01 < 0.01
< 0.01 < 0.01
< 0.01 < 0.01
< 0.01 < 0.01
< 0.01 < 0.01
a before last treatment b mean of replicate samples (if applicable); total residue based on the edible portion DAT: days after final treatment i.f. = first treatment in-furrow at sowing/planting

Penthiopyrad
1528
Table 95 Residues in radish roots following foliar application of penthiopyrad
Location, Year (variety) Reference
Application DAT Residues, mg/kg Selected residue mg/kg a
n kg ai/ha
kg ai/hL
parent PAM PCA 753-A-OH
753-F-DO
DM-PCA
USA (PA), Germansville 2009 (French Breakfast) PTHIO_088
2 0.46 0.47
0.17 0.18
0 0
1.2 1.1
< 0.01 < 0.01
0.01 0.011
< 0.01 < 0.01
< 0.01 < 0.01
< 0.01 < 0.01
Parent: 1.2 Total: 1.2
USA (FL), Brandenton 2009 (Sparkler) PTHIO_088
2 0.44 0.43
0.1 0.1
0 0
0.1 0.17
< 0.01 < 0.01
< 0.01 < 0.01
< 0.01 < 0.01
< 0.01 < 0.01
< 0.01 < 0.01
Parent: 0.14 Total: 0.15
USA (FL), Hobe Sound 2009 (Escala) PTHIO_088
2 0.46 0.18 0 0
0.9 0.93
< 0.01 < 0.01
0.013 0.014
< 0.01 < 0.01
< 0.01 < 0.01
< 0.01 < 0.01
Parent: 0.92 Total: 0.93
USA (IL), Rochelle 2009 (Altabelle) PTHIO_088
2 0.45 0.95 0 0
< 0.01 < 0.01
< 0.01 < 0.01
0.011 0.01
< 0.01 < 0.01
< 0.01 < 0.01
< 0.01 < 0.01
Parent: < 0.01 Total: < 0.01
Canada, St. Marc-sur-Richilieu 2009 (Monica) PTHIO_088
2 0.44 0.51
0.23 0.22
0 0
0.21 0.23
< 0.01 < 0.01
< 0.01 0.01
< 0.01 < 0.01
< 0.01 < 0.01
< 0.01 < 0.01
Parent: 0.22 Total: 0.24
USA (CA), Hughson 2009 (Cherry Belle) PTHIO_088
2 0.44 0.46
0.05 0.05
0 0
0.34 0.32
< 0.01 < 0.01
< 0.01 < 0.01
< 0.01 < 0.01
< 0.01 < 0.01
< 0.01 < 0.01
Parent: 0.33 Total: 0.35
a mean of replicate samples (if applicable); total residue based on the edible portion DAT: days after final treatment
Table 96 Residues in sugar beet roots following foliar and in-furrow application of penthiopyrad
Location, Year (variety) Reference
Application DAT Residues, mg/kg Selected residue mg/kg a
n kg ai/ha
kg ai/hL
parent PAM PCA 753-A-OH
753-F-DO
DM-PCA
USA (ND), Gardner 2009 (Crystal 539 RR) PTHIO_088
2 0.47 0.25 7 7
0.015 0.018
< 0.01 < 0.01
< 0.01 < 0.01
< 0.01 < 0.01
< 0.01 < 0.01
< 0.01 < 0.01
Parent: 0.017 Total: 0.035
2 0.47 (i.f.) 0.47
0.67 0.25
7 7
0.012 0.019
< 0.01 < 0.01
< 0.01 < 0.01
< 0.01 < 0.01
< 0.01 < 0.01
< 0.01 < 0.01
USA (ND), Northwood 2009 (Betaseed 86RR66) PTHIO_088
2 0.46 0.98 7 7
0.17 0.22
< 0.01 < 0.01
< 0.01 < 0.01
< 0.01 < 0.01
< 0.01 < 0.01
< 0.01 < 0.01
Parent: 0.2 Total: 0.21
2 0.46 (i.f.) 0.45
0.49 0.97
7 7
0.16 0.12
< 0.01 < 0.01
< 0.01 < 0.01
< 0.01 < 0.01
< 0.01 < 0.01
< 0.01 < 0.01

Penthiopyrad
1529
Location, Year (variety) Reference
Application DAT Residues, mg/kg Selected residue mg/kg a
n kg ai/ha
kg ai/hL
parent PAM PCA 753-A-OH
753-F-DO
DM-PCA
USA (MN), Geneva 2009 (Beta 4936R) PTHIO_088
2 0.46 0.44
0.27 0.25
7 7
0.091 0.078
< 0.01 < 0.01
< 0.01 < 0.01
< 0.01 < 0.01
< 0.01 < 0.01
< 0.01 < 0.01
Parent: 0.085 Total: 0.10
2 0.46 (i.f.) 0.44
0.27 0.25
7 7
0.09 0.054
< 0.01 < 0.01
< 0.01 < 0.01
< 0.01 < 0.01
< 0.01 < 0.01
< 0.01 < 0.01
Canada, Portage la Prairie 2009 (Beta seed) PTHIO_088
2 0.45 0.46
0.21 0.21
7 7
0.016 0.013
< 0.01 < 0.01
0.016 0.017
< 0.01 < 0.01
< 0.01 < 0.01
< 0.01 < 0.01
Parent: 0.015 Total: 0.033
2 0.45 (i.f.) 0.46
0.2 0.21
7 7
0.042 0.03
< 0.01 < 0.01
0.03 0.024
< 0.01 < 0.01
< 0.01 < 0.01
< 0.01 < 0.01
Canada, Oakville 2009 (Beta seed) PTHIO_088
2 0.46 0.45
0.21 0.2
6 6
0.18 0.19
< 0.01 < 0.01
0.013 0.016
< 0.01 < 0.01
< 0.01 < 0.01
< 0.01 < 0.01
Parent: 0.19 Total: 0.20
2 0.45 (i.f.) 0.46
0.2 0.21
6 6
0.063 0.052
< 0.01 < 0.01
< 0.01 < 0.01
< 0.01 < 0.01
< 0.01 < 0.01
< 0.01 < 0.01
USA (ND), Carrington 2009 (Betaseed 86RR66) PTHIO_088
2 0.46 0.46
0.25 0.12
6 6
0.18 0.18
< 0.01 < 0.01
< 0.01 < 0.01
< 0.01 < 0.01
< 0.01 < 0.01
< 0.01 < 0.01
Parent: 0.18 Total: 0.20
2 0.45 (i.f.) 0.46
0.49 0.12
6 6
0.18 0.17
< 0.01 < 0.01
< 0.01 < 0.01
< 0.01 < 0.01
< 0.01 < 0.01
< 0.01 < 0.01
Canada, Taber 2009 (not reported) PTHIO_088
2 0.46 0.3 8 8
0.019 0.018
< 0.01 < 0.01
0.014 0.012
< 0.01 < 0.01
< 0.01 < 0.01
< 0.01 < 0.01
Parent: 0.019 Total: 0.037
2 0.44 (i.f.) 0.46
0.15 0.3
8 8
0.018 0.02
< 0.01 < 0.01
< 0.01 < 0.01
< 0.01 < 0.01
< 0.01 < 0.01
< 0.01 < 0.01
USA (TX), Levelland 2009 (Phoenix) PTHIO_088
2 0.45 0.24 8 8
0.35 0.19
< 0.01 < 0.01
0.022 0.017
< 0.01 < 0.01
< 0.01 < 0.01
< 0.01 < 0.01
Parent: 0.27 Total: 0.29
2 0.45 (i.f.) 0.45
0.48 0.24
8 8
0.14 0.15
< 0.01 < 0.01
0.013 0.013
< 0.01 < 0.01
< 0.01 < 0.01
< 0.01 < 0.01
USA (CA), Hickman 2009 (Holly SSN B7R) PTHIO_088
2 0.45 0.05 6 6
0.17 0.095
0.011 < 0.01
0.039 0.039
< 0.01 < 0.01
< 0.01 < 0.01
< 0.01 < 0.01
Parent: 0.13 Total: 0.15
2 0.46 (i.f.) 0.46
0.05 0.05
6 6
0.04 0.049
< 0.01 < 0.01
0.018 0.018
< 0.01 < 0.01
< 0.01 < 0.01
< 0.01 < 0.01
USA (CA), Porterville 2009 (Lockhart Seed Lot 31288) PTHIO_088
2 0.46 0.45
0.18 0.17
8 8
0.091 0.089
< 0.01 < 0.01
0.04 0.04
< 0.01 < 0.01
< 0.01 < 0.01
< 0.01 < 0.01
Parent: 0.09 Total: 0.11
2 0.45 (i.f.) 0.45
0.24 0.17
8 8
0.03 0.032
< 0.01 < 0.01
0.029 0.026
< 0.01 < 0.01
< 0.01 < 0.01
< 0.01 < 0.01
USA (WA), Ephrata
2 0.45 0.24 7 7
0.026 0.039
< 0.01 < 0.01
< 0.01 < 0.01
< 0.01 < 0.01
< 0.01 < 0.01
< 0.01 < 0.01
Parent: 0.033

Penthiopyrad
1530
Location, Year (variety) Reference
Application DAT Residues, mg/kg Selected residue mg/kg a
n kg ai/ha
kg ai/hL
parent PAM PCA 753-A-OH
753-F-DO
DM-PCA
2009 (Prozoo – RR) PTHIO_088
2 0.46 (i.f.) 0.45
0.33 0.24
7 7
0.01 0.016
< 0.01 < 0.01
< 0.01 < 0.01
< 0.01 < 0.01
< 0.01 < 0.01
< 0.01 < 0.01
Total: 0.051
USA (ID), Jerome 2009 (Roundup Ready BTSCT01 RR07) PTHIO_088
2 0.45 0.22 7 7
0.058 0.025
< 0.01 < 0.01
< 0.01 < 0.01
< 0.01 < 0.01
< 0.01 < 0.01
< 0.01 < 0.01
Parent: 0.042 Total: 0.06
2 0.44 (i.f.) 0.45
0.27 0.22
7 7
0.048 0.046
< 0.01 < 0.01
< 0.01 < 0.01
< 0.01 < 0.01
< 0.01 < 0.01
< 0.01 < 0.01
a:mean of replicate samples (if applicable); total residue based on the edible portion DAT: days after final treatment i.f. = first treatment in-furrow at sowing
Table 97 Residues in barley grain following foliar application of penthiopyrad
Location, Year (variety) Reference
Application DAT Residues, mg/kg Selected residue mg/kg a
n kg ai/ha
kg ai/hL
parent PAM PCA 753-A-OH
753-F-DO
DM-PCA
UK, Aingers Green 2007 (Flagon) PTHIO_078
2 0.25 0.1 36 0.071 < 0.01 < 0.01 < 0.01 < 0.01 < 0.01
UK, Tranent 2007 (Oxbridge) PTHIO_078
2 0.26 0.25
0.1 0.1
49 0.01 < 0.01 < 0.01 < 0.01 < 0.01 < 0.01
Germany, Machern 2007 (Naomi) PTHIO_078
2 0.25 0.1 54 0.069 < 0.01 0.017 0.011 < 0.01 < 0.01
UK, Kennoway 2007 (Rebecca) PTHIO_078
2 0.26 0.1 45 < 0.01 < 0.01 < 0.01 < 0.01 < 0.01 < 0.01
UK, Harwich 2008 (Flagon) PTHIO_078
2 0.25 0.1 47 0.057 0.025 0.054 0.014 < 0.01 < 0.01
2 0.24 0.1 47 < 0.01 < 0.01 < 0.01 < 0.01 < 0.01 < 0.01
Germany, Motterwitz 2008 (Laverda) PTHIO_078
2 0.26 (SC)
0.1 37 0.09 0.01 0.022 0.01 < 0.01 < 0.01
2 0.26 0.25 (EC)
0.1 0.1
37 0.071 0.011 0.021 0.017 < 0.01 < 0.01

Penthiopyrad
1531
Location, Year (variety) Reference
Application DAT Residues, mg/kg Selected residue mg/kg a
n kg ai/ha
kg ai/hL
parent PAM PCA 753-A-OH
753-F-DO
DM-PCA
2 0.24 0.23 (SC)
0.1 0.1
37 0.058 < 0.01 0.016 0.011 < 0.01 < 0.01
2 0.26 0.25 (SC)
0.1 0.1
37 0.076 < 0.01 0.016 0.013 < 0.01 < 0.01
Hungary, Velence 2008 (Nelly) PTHIO_078
2 0.24 0.26 (SC)
0.1 0.1
34 0.071 < 0.01 0.01 < 0.01 < 0.01 < 0.01
2 0.25 0.24 (EC)
0.1 0.1
34 0.12 < 0.01 0.011 0.014 < 0.01 < 0.01
2 0.24 0.25 (SC)
0.1 0.1
34 0.089 < 0.01 0.01 < 0.01 < 0.01 < 0.01
2 0.24 0.25 (SC)
0.1 0.1
34 0.063 < 0.01 < 0.01 < 0.01 < 0.01 < 0.01
France (North), Senlis le Sec 2008 (Sebastian) PTHIO_078
2 0.24 0.25 (SC)
0.1 0.1
60 0.015 < 0.01 < 0.01 < 0.01 < 0.01 < 0.01
2 0.24 0.25 (EC)
0.1 0.1
60 0.03 < 0.01 < 0.01 < 0.01 < 0.01 < 0.01
2 0.24 0.25 (SC)
0.1 0.1
60 0.039 < 0.01 < 0.01 < 0.01 < 0.01 < 0.01
2 0.25 (SC)
0.1 0.1
60 < 0.01 < 0.01 < 0.01 < 0.01 < 0.01 < 0.01
France (South), Charontonnay 2008 (Caravan) PTHIO_078
2 0.24 0.26 (SC)
0.1 0.1
42 < 0.01 < 0.01 < 0.01 < 0.01 < 0.01 < 0.01
2 0.25 0.26 (EC)
0.1 0.1
42 < 0.01 < 0.01 < 0.01 < 0.01 < 0.01 < 0.01
2 0.24 0.26 (SC)
0.1 0.1
42 < 0.01 < 0.01 < 0.01 < 0.01 < 0.01 < 0.01
2 0.25 0.26 (SC)
0.1 0.1
42 < 0.01 < 0.01 < 0.01 < 0.01 < 0.01 < 0.01
Hungary, Velence 2008 (Nelly)
2 0.24 0.26 (SC)
0.1 0.1
34 0.077 < 0.01 0.011 0.01 < 0.01 < 0.01

Penthiopyrad
1532
Location, Year (variety) Reference
Application DAT Residues, mg/kg Selected residue mg/kg a
n kg ai/ha
kg ai/hL
parent PAM PCA 753-A-OH
753-F-DO
DM-PCA
PTHIO_078 2 0.25 (EC)
0.1 34 0.1 < 0.01 0.01 0.013 < 0.01 < 0.01
2 0.25 0.26 (SC)
0.1 0.1
34 0.059 < 0.01 < 0.01 < 0.01 < 0.01 < 0.01
2 0.25 (SC)
0.1 0.1
34 0.051 < 0.01 < 0.01 < 0.01 < 0.01 < 0.01
France (South), Pact 2008 (Franzi) PTHIO_078
2 0.24 0.25 (SC)
0.1 0.1
45 < 0.01 < 0.01 < 0.01 < 0.01 < 0.01 < 0.01
2 0.26 (EC)
0.1 45 < 0.01 < 0.01 < 0.01 < 0.01 < 0.01 < 0.01
France (South), St Martin le Chatel 2008 (Platine) PTHIO_078
2 0.25 0.24 (SC)
0.1 0.1
39 0.01 < 0.01 < 0.01 < 0.01 < 0.01 < 0.01
2 0.25 0.24 (EC)
0.1 0.1
39 < 0.01 < 0.01 < 0.01 < 0.01 < 0.01 < 0.01
France (South), St Jean de Niost 2008 (Ketos) PTHIO_078
2 0.24 0.25 (SC)
0.1 0.1
35 0.063 < 0.01 < 0.01 0.011 < 0.01 < 0.01
2 0.24 0.25 (EC)
0.1 0.1
35 0.053 0.01 < 0.01 0.013 < 0.01 < 0.01
USA (ND), Northwood 2009 (Pinnacle) PTHIO_079
2 0.36 0.35
0.76 0.74
55 55
< 0.01 < 0.01
< 0.01 < 0.01
< 0.01 < 0.01
< 0.01 < 0.01
< 0.01 < 0.01
< 0.01 < 0.01
Parent: < 0.01 Total: < 0.01
Canada, Branchton 2009 (481-6R) PTHIO_079
2 0.35 0.34
0.17 0.17
54 54
0.12 0.1
0.015 0.015
0.029 0.029
< 0.01 < 0.01
0.13 0.12
0.014 0.013
Parent: 0.11 Total: 0.14
USA (ND), Carrington 2009 (Pinnacle) PTHIO_079
2 0.37 0.36
0.2 0.19
62 62
< 0.01 < 0.01
< 0.01 < 0.01
< 0.01 < 0.01
< 0.01 < 0.01
< 0.01 < 0.01
< 0.01 < 0.01
Parent: < 0.01 Total: < 0.01
Canada, Carberry 2009 (CDC Bold) PTHIO_079
2 0.35 0.16 59 59
0.01 0.011
< 0.01 < 0.01
0.011 0.011
< 0.01 < 0.01
0.013 0.015
< 0.01 < 0.01
Parent: 0.011 Total: 0.029
Canada, Justice 2009 (CDC Bold) PTHIO_079
2 0.35 0.16 47 47
0.029 0.03
< 0.01 < 0.01
0.01 0.012
< 0.01 < 0.01
0.018 0.02
< 0.01 < 0.01
Parent: 0.03 Total: 0.048

Penthiopyrad
1533
Location, Year (variety) Reference
Application DAT Residues, mg/kg Selected residue mg/kg a
n kg ai/ha
kg ai/hL
parent PAM PCA 753-A-OH
753-F-DO
DM-PCA
Canada, Alvena 2009 (Copeland) PTHIO_079
2 0.36 0.35
0.18 0.18
49 49
0.021 0.018
< 0.01 < 0.01
0.011 0.01
< 0.01 < 0.01
0.011 0.011
< 0.01 < 0.01
Parent: 0.02 Total: 0.038
Canada, Wakaw 2009 (Copeland) PTHIO_079
2 0.36 0.35
0.18 0.18
49 49
0.025 0.022
< 0.01 < 0.01
0.016 0.014
< 0.01 < 0.01
0.02 0.016
< 0.01 < 0.01
Parent: 0.024 Total: 0.042
Canada, Saskatoon 2009 (CDC Copeland) PTHIO_079
2 0.34 0.17 56 56
< 0.01 < 0.01
< 0.01 < 0.01
< 0.01 < 0.01
< 0.01 < 0.01
< 0.01 < 0.01
< 0.01 < 0.01
Parent: < 0.01 Total: < 0.01
Canada, Waldheim 2009 (CDC Copeland) PTHIO_079
2 0.34 0.17 53 53
< 0.01 < 0.01
< 0.01 < 0.01
0.01 < 0.01
< 0.01 < 0.01
< 0.01 < 0.01
< 0.01 < 0.01
Parent: < 0.01 Total: < 0.01
Canada, Fort Saskatchewan 2009 (Seebee) PTHIO_079
2 0.37 0.36
0.24 69 69
< 0.01 < 0.01
< 0.01 < 0.01
< 0.01 < 0.01
< 0.01 < 0.01
< 0.01 < 0.01
< 0.01 < 0.01
Parent: < 0.01 Total: < 0.01
Canada, Fort Saskatchewan 2009 (Seebee) PTHIO_079
2 0.36 0.34 68 68
< 0.01 < 0.01
< 0.01 < 0.01
< 0.01 < 0.01
< 0.01 < 0.01
< 0.01 < 0.01
< 0.01 < 0.01
Parent: < 0.01 Total: < 0.01
Canada, Lamont 2009 (Seebee) PTHIO_079
2 0.36 0.24 55 55
< 0.01 < 0.01
< 0.01 < 0.01
< 0.01 < 0.01
< 0.01 < 0.01
< 0.01 < 0.01
< 0.01 < 0.01
Parent: < 0.01 Total: < 0.01
Canada, Westlock 2009 (Seebee) PTHIO_079
2 0.36 0.24 60 60
0.01 < 0.01
0.01 < 0.01
0.018 0.015
< 0.01 < 0.01
0.012 0.01
< 0.01 < 0.01
Parent: 0.01 Total: 0.029
a mean of replicate samples (if applicable); total residue based on the edible portion DAT: days after final treatment

Penthiopyrad
1534
Table 98 Residues in maize grain following foliar application of penthiopyrad
Location, Year (variety) Reference
Application DAT Residues, mg/kg Selected residue mg/kg a n kg ai/ha kg
ai/hL parent PAM PCA 753-
A-OH 753-F-DO
DM-PCA
USA (NY), North Rose 2009 (DeKalb DKC 46-60) PTHIO_100
4 0.35 0.36 0.36 0.35
0.19 0.19 0.19 0.19
7 7
< 0.01 < 0.01
< 0.01 < 0.01
< 0.01 < 0.01
< 0.01 < 0.01
< 0.01 < 0.01
< 0.01 < 0.01
Parent: < 0.01 Total: < 0.01
USA (NC), Seven Springs 2009 (N77-P5) PTHIO_100
4 0.35 0.36 0.34 0.35
0.19 0.28 0.26 0.27
7 7
< 0.01 < 0.01
< 0.01 < 0.01
< 0.01 < 0.01
< 0.01 < 0.01
< 0.01 < 0.01
< 0.01 < 0.01
Parent: < 0.01 Total: < 0.01
Canada, St. George 2009 (38M58 RR) PTHIO_100
4 0.37 0.34 0.35 0.34
0.78 0.72 0.75 0.73
7 7
< 0.01 < 0.01
< 0.01 < 0.01
< 0.01 < 0.01
< 0.01 < 0.01
< 0.01 < 0.01
< 0.01 < 0.01
Parent: < 0.01 Total: < 0.01
Canada, Paris 2009 (DeKalb 3826) PTHIO_100
4 0.34 0.37 0.36 0.35
0.17 0.19 0.18 0.18
7 7
< 0.01 < 0.01
< 0.01 < 0.01
< 0.01 < 0.01
< 0.01 < 0.01
< 0.01 < 0.01
< 0.01 < 0.01
Parent: < 0.01 Total: < 0.01
Canada, Paris 2009 (DeKalb 4493) PTHIO_100
4 0.37 0.35 0.35 0.35
0.19 0.18 0.17 0.17
7 7
< 0.01 < 0.01
< 0.01 < 0.01
< 0.01 < 0.01
< 0.01 < 0.01
< 0.01 < 0.01
< 0.01 < 0.01
Parent: < 0.01 Total: < 0.01
Canada, St. Marc-sur-Richilieu 2009 (N27B G7/CB/LL) PTHIO_100
4 0.34 0.35 0.35 0.35
0.18 0.18 0.18 0.18
6 6
< 0.01 < 0.01
< 0.01 < 0.01
< 0.01 < 0.01
< 0.01 < 0.01
< 0.01 < 0.01
< 0.01 < 0.01
Parent: < 0.01 Total: < 0.01
Canada, Thorndale 2009 (Pioneer R38M57) PTHIO_100
4 0.36 0.37 0.36 0.34
0.18 0.18 0.18 0.17
7 7
< 0.01 < 0.01
< 0.01 < 0.01
< 0.01 < 0.01
< 0.01 < 0.01
< 0.01 < 0.01
< 0.01 < 0.01
Parent: < 0.01 Total: < 0.01
USA (IA), Richland 2009 (Pioneer 34R67) PTHIO_100
4 0.36 0.36 0.34 0.36
0.23 0.24 0.22 0.24
7 7
< 0.01 < 0.01
< 0.01 < 0.01
< 0.01 < 0.01
< 0.01 < 0.01
< 0.01 < 0.01
< 0.01 < 0.01
Parent: < 0.01 Total: < 0.01
USA (ND), Gardner 2009 (INT 65085R) PTHIO_100
4 0.36 0.19 7 7
< 0.01 < 0.01
< 0.01 < 0.01
< 0.01 < 0.01
< 0.01 < 0.01
< 0.01 < 0.01
< 0.01 < 0.01
Parent: < 0.01 Total: < 0.01

Penthiopyrad
1535
Location, Year (variety) Reference
Application DAT Residues, mg/kg Selected residue mg/kg a n kg ai/ha kg
ai/hL parent PAM PCA 753-
A-OH 753-F-DO
DM-PCA
USA (KS), Gardner 2009 (6464 VT3) PTHIO_100
4 0.35 0.35 0.36 0.36
0.24 0.24 0.25 0.25
6 6
< 0.01 < 0.01
< 0.01 < 0.01
< 0.01 < 0.01
< 0.01 < 0.01
< 0.01 < 0.01
< 0.01 < 0.01
Parent: < 0.01 Total: < 0.01
USA (NE), Springfield 2009 (N38-54) PTHIO_100
4 0.37 0.37 0.37 0.35
0.28 0.28 0.28 0.27
6 6
< 0.01 < 0.01
< 0.01 < 0.01
< 0.01 < 0.01
< 0.01 < 0.01
< 0.01 < 0.01
< 0.01 < 0.01
Parent: < 0.01 Total: < 0.01
USA (MN), Rice 2009 (DKC 41-63) PTHIO_100
4 0.36 0.19 7 7
< 0.01 < 0.01
< 0.01 < 0.01
< 0.01 < 0.01
< 0.01 < 0.01
< 0.01 < 0.01
< 0.01 < 0.01
Parent: < 0.01 Total: < 0.01
USA (IL), Carlyle 2009 (8G23) PTHIO_100
4 0.36 0.340.37 0.36
0.14 0.27 0.24 0.23
8 8 AGF 8
< 0.01 < 0.01 0.067
< 0.01 < 0.01 < 0.02
< 0.01 < 0.01 < 0.02
< 0.01 < 0.01 < 0.02
< 0.01 < 0.01 < 0.02
< 0.01 < 0.01 < 0.02
Parent: < 0.01 Total: < 0.01
USA (TX), Uvalde 2009 (DK69) PTHIO_100
4 0.35 0.34 0.35 0.35
0.15 0.15 0.25 0.25
7 7 AGF 7
< 0.01 < 0.01 0.33
< 0.01 < 0.01 0.25
< 0.01 < 0.01 0.18
< 0.01 < 0.01 0.56
< 0.01 < 0.01 < 0.02
< 0.01 < 0.01 < 0.02
Parent: < 0.01 Total: < 0.01
a mean of replicate samples (if applicable); total residue based on the edible portion DAT: days after final treatment AGF = aspirated grain fractions
Table 99 Residues in sorghum grain following foliar application of penthiopyrad
Location, Year (variety) Reference
Application DAT Residues, mg/kg Selected residue mg/kg a
n kg ai/ha
kg ai/hL
parent PAM PCA 753-A-OH
753-F-DO
DM-PCA
USA (LA), Cheneyville 2009 (Dyna Gro 780B) PTHIO_079
2 0.34 0.36
0.18 0.19
30 30
0.27 0.28
0.034 0.032
0.044 0.048
0.024 0.026
0.026 0.028
< 0.01 < 0.01
Parent: 0.28 Total: 0.34
USA (IA), Richland 2009 (Pioneer 8500) PTHIO_079
2 0.34 0.35
0.72 0.74
31 31
0.12 0.12
0.011 0.011
0.014 0.013
0.013 0.014
< 0.01 < 0.01
< 0.01 < 0.01
Parent: 0.12 Total: 0.14
USA (NE), York 2009 (NC+ 6B50) PTHIO_079
2 0.34 0.18 32 32
0.37 0.41
0.028 0.036
0.03 0.04
0.025 0.032
0.032 0.037
< 0.01 < 0.01
Parent: 0.39 Total: 0.45

Penthiopyrad
1536
Location, Year (variety) Reference
Application DAT Residues, mg/kg Selected residue mg/kg a
n kg ai/ha
kg ai/hL
parent PAM PCA 753-A-OH
753-F-DO
DM-PCA
USA (GA), Chula 2009 (Pioneer 84G62) PTHIO_079
2 0.36 0.35
0.18 0.19
28 28
0.19 0.17
0.023 0.021
0.011 0.01
< 0.01 < 0.01
0.036 0.034
< 0.01 < 0.01
Parent: 0.18 Total: 0.22
USA (TX), Uvalde 2009 (A571) PTHIO_079
2 0.36 0.26 Grain 28 28 AGF 28
0.16 0.15 0.34
0.024 0.022 0.11
0.015 0.014 0.08
0.015 0.015 0.19
< 0.01 < 0.01 0.011
< 0.01 < 0.01 0.021
Parent: 0.16 Total: 0.20
USA (TX), Raymondville 2009 (DKS 3707) PTHIO_079
2 0.37 0.2 29 29
0.43 0.42
0.16 0.13
0.15 0.15
0.12 0.13
0.03 0.031
< 0.01 < 0.01
Parent: 0.43 Total: 0.70
USA (ND), Jamestown 2009 (8500) PTHIO_079
2 0.36 0.19 31 31
0.063 0.056
0.014 0.012
0.025 0.026
< 0.01 < 0.01
< 0.01 < 0.01
0.012 0.013
Parent: 0.06 Total: 0.084
USA (TX), Whitharral 2009 (DeKalb 44 Bronze) PTHIO_079
2 0.35 0.19 29 29
0.27 0.33
0.047 0.057
0.023 0.028
0.033 0.041
0.032 0.037
< 0.01 < 0.01
Parent: 0.3 Total: 0.40
USA (KS), Larned 2009 (DK 537-07) PTHIO_079
2 0.35 0.36
0.2 0.22
Grain 33 33 AGF 33
0.085 0.1 0.91
0.019 0.019 0.15
0.012 0.013 0.18
< 0.01 0.012 0.26
0.018 0.019 0.11
< 0.01 < 0.01 0.056
Parent: 0.093 Total: 0.13
a mean of replicate samples (if applicable); total residue based on the edible portion DAT: days after final treatment AGF = aspirated grain fractions
Table 100 Residues in wheat grain following foliar application of penthiopyrad
Location, Year (variety) Reference
Application DAT Residues, mg/kg Selected residue mg/kg a
n kg ai/ha
kg ai/hL
parent PAM PCA 753-A-OH
753-F-DO
DM-PCA
UK, Colchester 2007 (Istabraq) PTHIO_077
2 0.25 0.1 44 < 0.01 < 0.01 < 0.01 < 0.01 < 0.01 < 0.01

Penthiopyrad
1537
Location, Year (variety) Reference
Application DAT Residues, mg/kg Selected residue mg/kg a
n kg ai/ha
kg ai/hL
parent PAM PCA 753-A-OH
753-F-DO
DM-PCA
UK, Peaston 2007 (Robigus) PTHIO_077
2 0.24 0.25
0.1 0.1
63 < 0.01 < 0.01 < 0.01 < 0.01 < 0.01 < 0.01
Germany, Motterwitz 2007 (Schamane) PTHIO_077
2 0.26 0.24
0.1 0.1
44 < 0.01 < 0.01 < 0.01 < 0.01 < 0.01 < 0.01
Hungary, Velence 2007 (GK Kapos) PTHIO_077
2 0.26 0.1 18 0.081 < 0.01 < 0.01 < 0.01 < 0.01 < 0.01
France (North), Charmée 2007 (Apache) PTHIO_077
2 0.25 0.24
0.1 0.1
44 0.015 < 0.01 < 0.01 < 0.01 < 0.01 < 0.01
UK, Peaston 2008 (Consort) PTHIO_077
2 0.25 (SC)
0.1 55 < 0.01 < 0.01 < 0.01 < 0.01 < 0.01 < 0.01
2 0.25 0.26 (EC)
0.1 0.1
55 < 0.01 < 0.01 < 0.01 < 0.01 < 0.01 < 0.01
2 0.26 0.27 (SC)
0.1 0.1
55 < 0.01 < 0.01 < 0.01 < 0.01 < 0.01 < 0.01
2 0.25 (SC)
0.1 55 < 0.01 < 0.01 < 0.01 < 0.01 < 0.01 < 0.01
Germany, Motterwitz 2008 (Inspiration) PTHIO_077
2 0.26 0.24 (SC)
0.1 0.1
60 < 0.01 < 0.01 < 0.01 < 0.01 < 0.01 < 0.01
2 0.26 0.24 (EC)
0.1 0.1
60 < 0.01 < 0.01 < 0.01 < 0.01 < 0.01 < 0.01
2 0.25 (SC)
0.1 60 < 0.01 < 0.01 < 0.01 < 0.01 < 0.01 < 0.01
2 0.26 (SC)
0.1 60 < 0.01 < 0.01 < 0.01 < 0.01 < 0.01 < 0.01
Hungary, Kápolnásnyék 2008 (Petur) PTHIO_077
2 0.26 (SC)
0.1 44 0.015 < 0.01 < 0.01 < 0.01 < 0.01 < 0.01
2 0.26 (EC)
0.1 44 0.014 < 0.01 < 0.01 < 0.01 < 0.01 < 0.01

Penthiopyrad
1538
Location, Year (variety) Reference
Application DAT Residues, mg/kg Selected residue mg/kg a
n kg ai/ha
kg ai/hL
parent PAM PCA 753-A-OH
753-F-DO
DM-PCA
France (North), Douai 2008 (Bermude) PTHIO_077
2 0.25 (SC)
0.1 58 0.011 < 0.01 < 0.01 < 0.01 < 0.01 < 0.01
2 0.25 (EC)
0.1 58 0.013 < 0.01 < 0.01 < 0.01 < 0.01 < 0.01
France (South), Charantonnay 2008 (Garcia) PTHIO_077
2 0.24 0.25 (SC)
0.1 0.1
49 < 0.01 < 0.01 < 0.01 < 0.01 < 0.01 < 0.01
2 0.25 0.25 (EC)
0.1 0.1
49 < 0.01 < 0.01 < 0.01 < 0.01 < 0.01 < 0.01
2 0.24 0.25 (SC)
0.1 0.1
49 < 0.01 < 0.01 < 0.01 < 0.01 < 0.01 < 0.01
2 0.24 0.25 (SC)
0.1 0.1
49 < 0.01 < 0.01 < 0.01 < 0.01 < 0.01 < 0.01
France (South), St Jean di Niost 2008 (Aubusson) PTHIO_077
2 0.24 0.25 (SC)
0.1 0.1
43 < 0.01 < 0.01 < 0.01 < 0.01 < 0.01 < 0.01
2 0.24 (EC)
0.1 43 < 0.01 < 0.01 < 0.01 < 0.01 < 0.01 < 0.01
France (South), St Trivier-sur-Moignans 2008 (Aubusson) PTHIO_077
2 0.25 (SC)
0.1 36 < 0.01 < 0.01 < 0.01 < 0.01 < 0.01 < 0.01
2 0.25 (EC)
0.1 36 < 0.01 < 0.01 < 0.01 < 0.01 < 0.01 < 0.01
2 0.25 0.24 (SC)
0.1 0.1
36 < 0.01 < 0.01 < 0.01 < 0.01 < 0.01 < 0.01
2 0.25 (SC)
0.1 36 < 0.01 < 0.01 < 0.01 < 0.01 < 0.01 < 0.01
France (South), St Martin le Chatel 2008 (Aubusson) PTHIO_077
2 0.25 (SC)
0.1 47 < 0.01 < 0.01 < 0.01 < 0.01 < 0.01 < 0.01
2 0.25 (EC)
0.1 47 < 0.01 < 0.01 < 0.01 < 0.01 < 0.01 < 0.01
USA (GA), Chula 2009 (Pioneer 26RG1) PTHIO_079
2 0.36 0.35
0.18 0.18
35 35
< 0.01 < 0.01
< 0.01 < 0.01
< 0.01 < 0.01
< 0.01 < 0.01
< 0.01 < 0.01
< 0.01 < 0.01
Parent: < 0.01 Total: < 0.01
USA (MO), Fisk 2009 (Coker 9663) PTHIO_079
2 0.36 0.19 35 35
0.012 0.011
< 0.01 < 0.01
< 0.01 < 0.01
< 0.01 < 0.01
0.011 0.012
< 0.01 < 0.01
Parent: 0.012 Total: 0.03

Penthiopyrad
1539
Location, Year (variety) Reference
Application DAT Residues, mg/kg Selected residue mg/kg a
n kg ai/ha
kg ai/hL
parent PAM PCA 753-A-OH
753-F-DO
DM-PCA
Canada, Branchton 2009 (Surge) PTHIO_079
2 0.36 0.35
0.18 0.18
48 48
< 0.01 < 0.01
< 0.01 < 0.01
< 0.01 < 0.01
< 0.01 < 0.01
0.01 0.011
< 0.01 < 0.01
Parent: < 0.01 Total: < 0.01
USA (ND), Northwood 2009 (Divide) PTHIO_079
2 0.36 0.19 55 55
< 0.01 < 0.01
< 0.01 < 0.01
< 0.01 < 0.01
< 0.01 < 0.01
< 0.01 < 0.01
< 0.01 < 0.01
Parent: < 0.01 Total: < 0.01
USA (KS), Gardner 2009 (Winter Hawk PTHIO_079
2 0.36 0.25 41 41
< 0.01 < 0.01
< 0.01 < 0.01
< 0.01 < 0.01
< 0.01 < 0.01
< 0.01 < 0.01
< 0.01 < 0.01
Parent: < 0.01 Total: < 0.01
USA (TX), Uvalde 2009 (Fannin) PTHIO_079
2 0.36 0.35
0.26 0.25
42 42
< 0.01 < 0.01
< 0.01 < 0.01
< 0.01 < 0.01
< 0.01 < 0.01
< 0.01 < 0.01
< 0.01 < 0.01
Parent: < 0.01 Total: < 0.01
USA (ND), Carrington 2009 (Glenn) PTHIO_079
2 0.35 0.36
0.75 0.76
62 62
< 0.01 < 0.01
< 0.01 < 0.01
< 0.01 < 0.01
< 0.01 < 0.01
< 0.01 < 0.01
< 0.01 < 0.01
Parent: < 0.01 Total: < 0.01
USA (ND), Velva 2009 (Fuller) PTHIO_079
2 0.36 0.35
0.32 0.31
54 54
< 0.01 < 0.01
< 0.01 < 0.01
< 0.01 < 0.01
< 0.01 < 0.01
< 0.01 < 0.01
< 0.01 < 0.01
Parent: < 0.01 Total: < 0.01
USA (NE), Grand Island 2009 (Traverse HRS) PTHIO_079
2 0.34 0.18 36 36
< 0.01 < 0.01
< 0.01 < 0.01
< 0.01 < 0.01
< 0.01 < 0.01
< 0.01 < 0.01
< 0.01 < 0.01
Parent: < 0.01 Total: < 0.01
Canada, Dundurn 2009 (Infinity) PTHIO_079
2 0.35 0.18 62 62
< 0.01 < 0.01
< 0.01 < 0.01
< 0.01 < 0.01
< 0.01 < 0.01
< 0.01 < 0.01
< 0.01 < 0.01
Parent: < 0.01 Total: < 0.01
Canada, Vanscoy 2009 (AC Lillian) PTHIO_079
2 0.35 0.21 55 55
< 0.01 < 0.01
< 0.01 < 0.01
< 0.01 < 0.01
< 0.01 < 0.01
< 0.01 < 0.01
< 0.01 < 0.01
Parent: < 0.01 Total: < 0.01
Canada, Taber 2009 (Supurb) PTHIO_079
2 0.34 0.23 51 51
< 0.01 < 0.01
< 0.01 < 0.01
< 0.01 < 0.01
< 0.01 < 0.01
< 0.01 < 0.01
< 0.01 < 0.01
Parent: < 0.01 Total: < 0.01

Penthiopyrad
1540
Location, Year (variety) Reference
Application DAT Residues, mg/kg Selected residue mg/kg a
n kg ai/ha
kg ai/hL
parent PAM PCA 753-A-OH
753-F-DO
DM-PCA
USA (OK), Hinton 2009 (Endurance) PTHIO_079
2 0.36 0.28 Grain 63 63 AGF 63
< 0.01 < 0.01 0.16
< 0.01 < 0.01 0.053
< 0.01 < 0.01 0.068
< 0.01 < 0.01 0.025
< 0.01 < 0.01 0.28
< 0.01 0.01 0.054
Parent: < 0.01 Total: < 0.01
USA (OK), Hydro 2009 (OK Bullet) PTHIO_079
2 0.36 0.35
0.18 0.16
50 50
< 0.01 < 0.01
< 0.01 < 0.01
< 0.01 < 0.01
< 0.01 < 0.01
< 0.01 < 0.01
< 0.01 < 0.01
Parent: < 0.01 Total: < 0.01
USA (KS), Larned 2009 (Jagger) PTHIO_079
2 0.35 0.36
0.19 0.19
45 45
< 0.01 < 0.01
< 0.01 < 0.01
< 0.01 < 0.01
< 0.01 < 0.01
< 0.01 < 0.01
< 0.01 < 0.01
Parent: < 0.01 Total: < 0.01
USA (TX), Olton 2009 (T2M 111) PTHIO_079
2 0.36 0.35
0.23 0.23
40 40
< 0.01 < 0.01
< 0.01 < 0.01
< 0.01 < 0.01
< 0.01 < 0.01
< 0.01 < 0.01
< 0.01 < 0.01
Parent: < 0.01 Total: < 0.01
USA (WA), Ephrata 2009 (Nick) PTHIO_079
2 0.36 0.18 57 57
< 0.01 < 0.01
< 0.01 < 0.01
< 0.01 < 0.01
< 0.01 < 0.01
< 0.01 < 0.01
< 0.01 < 0.01
Parent: < 0.01 Total: < 0.01
Canada, Carberry 2009 (AC Domain) PTHIO_079
2 0.35 0.16 59 59
0.017 0.02
< 0.01 0.01
0.012 0.013
< 0.01 < 0.01
0.034 0.039
< 0.01 < 0.01
Parent: < 0.01 Total: < 0.01
Canada, Justice 2009 (AC Domain) PTHIO_079
2 0.35 0.14 59 59
< 0.01 < 0.01
< 0.01 < 0.01
< 0.01 < 0.01
< 0.01 < 0.01
< 0.01 < 0.01
< 0.01 < 0.01
Parent: < 0.01 Total: < 0.01
Canada, Alvena 2009 (Infinity) PTHIO_079
2 0.36 0.35
0.18 0.18
49 49
0.034 0.034
< 0.01 < 0.01
< 0.01 < 0.01
< 0.01 < 0.01
0.024 0.02
< 0.01 < 0.01
Parent: < 0.01 Total: < 0.01
Canada, Waldheim 2009 (AC Elsa) PTHIO_079
2 0.35 0.34
0.18 0.17
53 53
< 0.01 < 0.01
< 0.01 < 0.01
< 0.01 < 0.01
< 0.01 < 0.01
< 0.01 < 0.01
< 0.01 < 0.01
Parent: 0.019 Total: 0.037
Canada, Blaine Lake 2009 (Infinity) PTHIO_079
2 0.34 0.33
0.17 0.17
56 56
0.016 0.018
< 0.01 < 0.01
< 0.01 < 0.01
< 0.01 < 0.01
0.011 0.012
< 0.01 < 0.01
Parent: < 0.01 Total: < 0.01

Penthiopyrad
1541
Location, Year (variety) Reference
Application DAT Residues, mg/kg Selected residue mg/kg a
n kg ai/ha
kg ai/hL
parent PAM PCA 753-A-OH
753-F-DO
DM-PCA
Canada, Fort Saskatchewan 2009 (Harvest) PTHIO_079
2 0.36 0.24 69 69
< 0.01 < 0.01
< 0.01 < 0.01
< 0.01 < 0.01
< 0.01 < 0.01
< 0.01 < 0.01
< 0.01 < 0.01
Parent: 0.034 Total: 0.053
Canada, Fort Saskatchewan 2009 (Harvest) PTHIO_079
2 0.36 0.24 68 68
< 0.01 < 0.01
< 0.01 < 0.01
< 0.01 < 0.01
< 0.01 < 0.01
0.013 0.01
< 0.01 < 0.01
Parent: < 0.01 Total: < 0.01
Canada, Lamont 2009 (Harvest) PTHIO_079
2 0.37 0.35
0.24 0.24
55 55
0.011 < 0.01
0.014 < 0.01
0.01 < 0.01
< 0.01 < 0.01
0.023 0.012
< 0.01 < 0.01
Parent: 0.017 Total: 0.036
Canada, Westlock 2009 (Emagine) PTHIO_079
2 0.36 0.24 60 60
< 0.01 < 0.01
< 0.01 < 0.01
< 0.01 < 0.01
< 0.01 < 0.01
< 0.01 < 0.01
< 0.01 < 0.01
Parent: < 0.01 Total: < 0.01
a mean of replicate samples (if applicable); total residue based on the edible portion DAT: days after final treatment AGF: aspirated grain fractions
Table 101 Residues in almond nutmeat following foliar application of penthiopyrad
Location, Year (variety) Reference
Application DAT Residues, mg/kg Selected residue mg/kg a
n kg ai/ha
kg ai/hL
parent PAM PCA 753-A-OH
753-F-DO
DM-PCA
USA (CA), Kerman 2007 (Nonpareil) PTHIO_090
3 0.31 0.03 14 14
< 0.01 0.01
< 0.01 < 0.01
< 0.01 < 0.01
< 0.01 < 0.01
< 0.01 < 0.01
< 0.01 < 0.01
Parent: 0.01 Total: 0.029
USA (CA), Madera 2007 (Padre) PTHIO_090
3 0.31 0.03 14 14
< 0.01 < 0.01
< 0.01 < 0.01
< 0.01 < 0.01
< 0.01 < 0.01
< 0.01 < 0.01
< 0.01 < 0.01
Parent: < 0.01 Total: < 0.01
USA (CA), Sanger 2007 (Nonpareil) PTHIO_090
3 0.31 0.31 0.3
0.05 0.05 0.05
14 14
0.045 0.028
< 0.01 < 0.01
< 0.01 < 0.01
< 0.01 < 0.01
< 0.01 < 0.01
< 0.01 < 0.01
Parent: 0.037 Total: 0.056
USA (CA), Hickman 2007 (Carmel) PTHIO_090
3 0.31 0.3 0.3
0.02 0.02 0.02
14 14
< 0.01 < 0.01
< 0.01 < 0.01
< 0.01 < 0.01
< 0.01 < 0.01
< 0.01 < 0.01
< 0.01 < 0.01
Parent: < 0.01 Total: < 0.01

Penthiopyrad
1542
Location, Year (variety) Reference
Application DAT Residues, mg/kg Selected residue mg/kg a
n kg ai/ha
kg ai/hL
parent PAM PCA 753-A-OH
753-F-DO
DM-PCA
USA (CA), Turlock 2007 (Thompson) PTHIO_090
3 0.31 0.3 0.3
0.03 0.03 0.02
14 14
< 0.01 < 0.01
< 0.01 < 0.01
< 0.01 < 0.01
< 0.01 < 0.01
< 0.01 < 0.01
< 0.01 < 0.01
Parent: < 0.01 Total: < 0.01
USA (CA), Terra Bella 2007 (Carmel) PTHIO_090
3 0.31 0.02 14 14
< 0.01 < 0.01
< 0.01 < 0.01
< 0.01 < 0.01
< 0.01 < 0.01
< 0.01 < 0.01
< 0.01 < 0.01
Parent: < 0.01 Total: < 0.01
a mean of replicate samples (if applicable); total residue based on the edible portion DAT: days after final treatment
Table 102 Residues in pecan nutmeat following foliar application of penthiopyrad
Location, Year (variety) Reference
Application DAT Residues, mg/kg Selected residue mg/kg a
n kg ai/ha
kg ai/hL
parent PAM PCA 753-A-OH
753-F-DO
DM-PCA
USA (GA), Chula 2007 (Sumner) PTHIO_090
3 0.31 0.03 13 13
< 0.01 < 0.01
< 0.01 < 0.01
< 0.01 < 0.01
< 0.01 < 0.01
< 0.01 < 0.01
< 0.01 < 0.01
Parent: < 0.01 Total: < 0.01
USA (GA), Chula 2007 (Sumner) PTHIO_090
3 0.3 0.02 14 14
< 0.01 < 0.01
< 0.01 < 0.01
< 0.01 < 0.01
< 0.01 < 0.01
< 0.01 < 0.01
< 0.01 < 0.01
Parent: < 0.01 Total: < 0.01
USA (GA), Albany 2007 (Sumner) PTHIO_090
3 0.3 0.32 0.31
0.02 0.02 0.02
13 13
< 0.01 < 0.01
< 0.01 < 0.01
< 0.01 < 0.01
< 0.01 < 0.01
< 0.01 < 0.01
< 0.01 < 0.01
Parent: < 0.01 Total: < 0.01
USA (LA), Alexandria 2007 (Creek) PTHIO_090
3 0.31 0.03 14 14
< 0.01 < 0.01
< 0.01 < 0.01
< 0.01 < 0.01
< 0.01 < 0.01
< 0.01 < 0.01
< 0.01 < 0.01
Parent: < 0.01 Total: < 0.01
USA (TX), D´Hanis 2007 (Desirable) PTHIO_090
3 0.3 0.31 0.31
0.02 0.03 0.02
14 14
< 0.01 < 0.01
< 0.01 < 0.01
< 0.01 < 0.01
< 0.01 < 0.01
< 0.01 < 0.01
< 0.01 < 0.01
Parent: < 0.01 Total: < 0.01
USA (TX), Anton 2007 (Western Schley) PTHIO_090
3 0.31 0.32 0.31
0.03 0.03 0.03
14 14
< 0.01 < 0.01
< 0.01 < 0.01
< 0.01 < 0.01
< 0.01 < 0.01
< 0.01 < 0.01
< 0.01 < 0.01
Parent: < 0.01 Total: < 0.01
a mean of replicate samples (if applicable); total residue based on the edible portion DAT: days after final treatment

Penthiopyrad
1543
Table 103 Residues in cotton seeds following foliar and in-furrow application of penthiopyrad
Location, Year (variety) Reference
Application DAT Residues, mg/kg Selected residue mg/kg a
n kg ai/ha
kg ai/hL
parent PAM PCA 753-A-OH
753-F-DO
DM-PCA
USA (AL), Auburn 2009 (DBPL 555) PTHIO_101
3 0.35 (i.f.) 0.36 0.35
0.27 0.31 0.29
20 20
< 0.01 < 0.01
0.012 0.016
< 0.01 < 0.01
< 0.01 < 0.01
< 0.01 < 0.01
< 0.01 < 0.01
Parent: < 0.01 Total: 0.036
USA (LA), Cheneyville 2009 (DP 0935 BZRF) PTHIO_101
3 0.34 (i.f.) 0.34 0.36
0.58 0.16 0.17
21 21
0.11 0.17
< 0.01 0.022
0.01 0.024
< 0.01 < 0.01
< 0.01 0.01
< 0.01 < 0.01
Parent: 0.14 Total: 0.17
USA (LA), Cheneyville 2009 (Phytogen 375 WRF) PTHIO_101
3 0.35 (i.f.) 0.36 0.36
0.59 0.17 0.16
21 21
0.1 0.081
0.013 0.017
0.011 0.012
< 0.01 < 0.01
< 0.01 < 0.01
< 0.01 < 0.01
Parent: 0.091 Total: 0.12
USA (MO), Fisk 2009 (DP 164 82RF) PTHIO_101
3 0.35 (i.f.) 0.36 0.37
0.37 0.19 0.2
19 19
< 0.01 < 0.01
0.019 0.017
< 0.01 < 0.01
< 0.01 < 0.01
< 0.01 < 0.01
< 0.01 < 0.01
Parent: < 0.01 Total: 0.043
USA (TX), Uvalde 2009 (DPL 167 B2RF) PTHIO_101
3 0.37 (i.f.) 0.38 0.36
0.71 0.82 0.77
20 20
0.018 0.054
0.021 0.024
0.016 0.021
< 0.01 < 0.01
< 0.01 < 0.01
< 0.01 < 0.01
Parent: 0.036 Total: 0.083
USA (TX), Olton 2009 (DP 924) PTHIO_101
3 0.34 (i.f.) 0.35 0.35
0.8 0.22 0.22
21 21
0.11 0.14
0.13 0.13
0.088 0.097
0.035 0.034
< 0.01 < 0.01
< 0.01 < 0.01
Parent: 0.13 Total: 0.37
USA (TX), Edmonson 2009 (DP 924) PTHIO_101
3 0.36 (i.f.) 0.36 0.35
1.3 0.23 0.22
20 20
0.19 0.27
0.067 0.11
0.044 0.085
< 0.01 < 0.01
< 0.01 < 0.01
< 0.01 < 0.01
Parent: 0.23 Total: 0.40
USA (TX), Levelland 2009 (FM 9063 B2F) PTHIO_101
3 0.35 (i.f.) 0.35 0.35
0.37 0.19 0.19
21 21
0.13 0.09
0.038 0.027
0.028 0.016
< 0.01 < 0.01
< 0.01 < 0.01
< 0.01 < 0.01
Parent: 0.11 Total: 0.17
USA (TX), Wolfforth 2009 (3273 B2RF) PTHIO_101
3 0.35 (i.f.) 0.35 0.35
0.37 0.19 0.19
21 21
0.22 0.28
0.054 0.092
0.046 0.064
0.015 < 0.01
< 0.01 < 0.01
< 0.01 < 0.01
Parent: 0.25 Total: 0.39

Penthiopyrad
1544
Location, Year (variety) Reference
Application DAT Residues, mg/kg Selected residue mg/kg a
n kg ai/ha
kg ai/hL
parent PAM PCA 753-A-OH
753-F-DO
DM-PCA
USA (OK), Hinton 2009 (FM 1740 B2F) PTHIO_101
3 0.36 (i.f.) 0.36 0.36
0.39 0.18 0.25
19 19
0.11 0.15
0.043 0.058
0.013 0.019
< 0.01 < 0.01
< 0.01 < 0.01
< 0.01 < 0.01
Parent: 0.13 Total: 0.22
USA (CA), Hickman 2009 (Pima) PTHIO_101
3 0.36 (i.f.) 0.36 0.36
0.04 0.1 0.1
22 22
0.076 0.11
0.069 0.072
0.057 0.056
0.028 0.025
< 0.01 < 0.01
< 0.01 < 0.01
Parent: 0.093 Total: 0.22
USA (CA), Porterville 2009 (Delta Pine Bollgard II RR) PTHIO_101
3 0.36 (i.f.) 0.36 0.36
0.26 0.13 0.11
21 21
0.047 0.032
0.012 < 0.01
< 0.01 < 0.01
< 0.01 < 0.01
< 0.01 < 0.01
< 0.01 < 0.01
Parent: 0.04 Total: 0.06
USA (CA), Porterville 2009 (Delta Pine Bollgard II RR) PTHIO_101
3 0.36 (i.f.) 0.36 0.35
0.26 0.12 0.12
21 21
< 0.01 0.012
< 0.01 0.016
< 0.01 < 0.01
< 0.01 0.011
< 0.01 < 0.01
< 0.01 < 0.01
Parent: 0.011 Total: 0.035
a mean of replicate samples (if applicable); total residue based on the edible portion DAT: days after final treatment i.f. first treatment in-furrow at sowing
Table 104 Residues in Oilseed rape (seeds) following foliar application of penthiopyrad
Location, Year (variety) Reference
Application DAT Residues, mg/kg Selected residue mg/kg a
n kg ai/ha
kg ai/hL
parent PAM PCA 753-A-OH
753-F-DO
DM-PCA
UK, Maldon 2007 (Apex) PTHIO_091
1 0.3 0.12 75 < 0.01 < 0.01 < 0.01 < 0.01 < 0.01 < 0.01
UK, Carberry Mains 2007 (Canberra) PTHIO_091
1 0.29 0.12 79 < 0.01 < 0.01 < 0.01 < 0.01 < 0.01 < 0.01
Germany, Naundorf 2007 (Tenno) PTHIO_091
1 0.31 0.12 58 < 0.01 < 0.01 < 0.01 < 0.01 < 0.01 < 0.01
Hungary, Pázmánd 2007 (Smart) PTHIO_091
1 0.31 0.08 39 < 0.01 < 0.01 < 0.01 < 0.01 < 0.01 < 0.01

Penthiopyrad
1545
Location, Year (variety) Reference
Application DAT Residues, mg/kg Selected residue mg/kg a
n kg ai/ha
kg ai/hL
parent PAM PCA 753-A-OH
753-F-DO
DM-PCA
France (North), Villers Carbonnel 2007 (Nexera) PTHIO_091
1 0.3 0.12 67 < 0.01 < 0.01 < 0.01 < 0.01 < 0.01 < 0.01
UK, Maldon 2008 (Castille) PTHIO_091
1 0.31 0.12 50 < 0.01 < 0.01 < 0.01 < 0.01 < 0.01 < 0.01
Germany, Cunnersdorf 2008 (NK-Fair) PTHIO_091
1 0.32 0.12 52 0.034 0.012 0.02 < 0.01 < 0.01 0.011
Hungary, Pázmánd 2008 (Catonic) PTHIO_091
1 0.31 0.12 42 < 0.01 < 0.01 < 0.01 < 0.01 < 0.01 < 0.01
France (North), Cavron St. Martin 2008 (Pollen) PTHIO_091
1 0.31 0.12 64 < 0.01 < 0.01 < 0.01 < 0.01 < 0.01 < 0.01
UK, Great Totham 2008 (Castille) PTHIO_092
1 0.31 0.12 50 < 0.01 0.01 < 0.01 < 0.01 < 0.01 < 0.01
Germany, Machern 2008 (Smart) PTHIO_092
1 0.3 0.12 70 < 0.01 < 0.01 0.01 < 0.01 < 0.01 < 0.01
Hungary, Pázmánd 2008 (Catonic) PTHIO_092
1 0.31 0.12 35 < 0.01 < 0.01 0.014 < 0.01 < 0.01 < 0.01
France (North), Cavron St. Martin 2008 (Pollen) PTHIO_092
1 0.31 0.12 64 < 0.01 < 0.01 < 0.01 < 0.01 < 0.01 < 0.01
UK, Beaston 2008 (Mercant) PTHIO_092
1 0.32 0.12 55 < 0.01 < 0.01 < 0.01 < 0.01 < 0.01 < 0.01
France (South), Charantonnay 2008 (Hexagone) PTHIO_092
1 0.31 0.12 56 < 0.01 < 0.01 < 0.01 < 0.01 < 0.01 < 0.01

Penthiopyrad
1546
Location, Year (variety) Reference
Application DAT Residues, mg/kg Selected residue mg/kg a
n kg ai/ha
kg ai/hL
parent PAM PCA 753-A-OH
753-F-DO
DM-PCA
France (South), Saint Trivier 2008 (Artist) PTHIO_092
1 0.31 0.12 52 < 0.01 < 0.01 < 0.01 < 0.01 < 0.01 < 0.01
USA (VA), Bumpass 2007 (KAB-36) PTHIO_093
2 0.3 0.31
0.21 0.22
21 21
< 0.01 < 0.01
< 0.01 < 0.01
< 0.01 < 0.01
< 0.01 < 0.01
< 0.01 < 0.01
< 0.01 < 0.01
Parent: < 0.01 Total: < 0.01
USA (MN), Paynesville 2007 (Croplan Freedom) PTHIO_093
2 0.31 0.3
0.2 0.2
21 21
< 0.01 < 0.01
< 0.01 < 0.01
< 0.01 < 0.01
< 0.01 < 0.01
< 0.01 < 0.01
< 0.01 < 0.01
Parent: < 0.01 Total: < 0.01
Canada, Branchton 2007 (71-45 RR) PTHIO_093
2 0.3 0.15 21 21
< 0.01 < 0.01
< 0.01 < 0.01
< 0.01 < 0.01
< 0.01 < 0.01
< 0.01 < 0.01
< 0.01 < 0.01
Parent: < 0.01 Total: < 0.01
USA (ND), Velva 2007 (5550) PTHIO_093
2 0.31 0.3
0.22 0.24
21 21
0.069 0.12
< 0.01 0.017
0.015 0.021
< 0.01 < 0.01
< 0.01 0.012
< 0.01 < 0.01
Parent: 0.095 Total: 0.12
Canada, Dubdam 2007 (621 Hybrid RR) PTHIO_093
2 0.3 0.29
0.15 0.15
21 21
0.12 0.13
0.013 0.01
0.012 < 0.01
< 0.01 < 0.01
< 0.01 < 0.01
< 0.01 < 0.01
Parent: 0.13 Total: 0.15
USA (WA), Lake Moses 2007 (71-45 RR) PTHIO_093
2 0.31 0.17 21 21
< 0.01 < 0.01
< 0.01 < 0.01
< 0.01 < 0.01
< 0.01 < 0.01
< 0.01 < 0.01
< 0.01 < 0.01
Parent: < 0.01 Total: < 0.01
USA (WA), Ephrata 2007 (71-45 RR) PTHIO_093
2 0.31 0.17 21 21
0.027 0.021
0.014 0.012
< 0.01 < 0.01
< 0.01 < 0.01
0.023 0.023
< 0.01 < 0.01
Parent: 0.024 Total: 0.048

Penthiopyrad
1547
Location, Year (variety) Reference
Application DAT Residues, mg/kg Selected residue mg/kg a
n kg ai/ha
kg ai/hL
parent PAM PCA 753-A-OH
753-F-DO
DM-PCA
USA (ID), Jerome 2007 (Phoenix) PTHIO_093
2 0.31 0.3
0.18 0.18
pods with seeds 0a 0a 0 0 7 7 14 14 seeds 21 21 28 28
0.24 0.25 7.6 6.3 0.15 0.17 0.093 0.11 0.066 0.096 0.037 0.057
0.041 0.048 0.059 0.043 0.11 0.13 0.11 0.12 0.024 0.021 0.026 0.026
< 0.01 < 0.01 0.012 0.012 0.014 0.014 0.015 0.014 0.011 0.011 0.011 0.013
< 0.01 < 0.01 0.011 < 0.01 < 0.01 < 0.01 < 0.01 < 0.01 < 0.01 < 0.01 < 0.01 < 0.01
< 0.01 < 0.01 < 0.01 < 0.01 < 0.01 < 0.01 < 0.01 < 0.01 < 0.01 < 0.01 < 0.01 < 0.01
< 0.01 < 0.01 < 0.01 < 0.01 < 0.01 < 0.01 < 0.01 < 0.01 < 0.01 < 0.01 < 0.01 < 0.01
Parent: 0.081 Total: 0.13
Canada, Portage la Prairie 2007 (RR 32-75) PTHIO_093
2 0.3 0.15 22 0.041 0.088
< 0.01 0.01
< 0.01 0.012
< 0.01 < 0.01
< 0.01 < 0.01
< 0.01 < 0.01
Parent: 0.065 Total: 0.083
Canada, Edmonton 2007 (Roundup Ready) PTHIO_093
2 0.31 0.3
0.16 0.15
21 21
0.018 0.037
< 0.01 < 0.01
< 0.01 < 0.01
< 0.01 < 0.01
< 0.01 < 0.01
< 0.01 < 0.01
Parent: 0.028 Total: 0.046
Canada, Blaine Lake 2007 (Invigor 5030) PTHIO_093
2 0.3 0.15 21 21
0.025 0.025
0.032 0.031
< 0.01 < 0.01
< 0.01 < 0.01
< 0.01 < 0.01
< 0.01 < 0.01
Parent: 0.025 Total: 0.084
Canada, Alvena 2007 (IMC 106 RR) PTHIO_093
2 0.29 0.15 21 21
0.061 0.047
0.015 0.021
0.014 0.016
< 0.01 < 0.01
< 0.01 < 0.01
< 0.01 < 0.01
Parent: 0.054 Total: 0.087
Canada, Waldeim 2007 (Invigor 5030) PTHIO_093
2 0.3 0.15 21 21
< 0.01 < 0.01
0.03 0.038
0.018 0.018
< 0.01 < 0.01
< 0.01 < 0.01
0.015 0.014
Parent: < 0.01 Total: 0.073
Canada, Wakaw 2007 (SP 451 RR) PTHIO_093
2 0.29 0.3
0.15 0.15
21 21
0.013 0.02
0.042 0.041
< 0.01 0.01
< 0.01 < 0.01
< 0.01 < 0.01
< 0.01 < 0.01
Parent: 0.017 Total: 0.094

Penthiopyrad
1548
Location, Year (variety) Reference
Application DAT Residues, mg/kg Selected residue mg/kg a
n kg ai/ha
kg ai/hL
parent PAM PCA 753-A-OH
753-F-DO
DM-PCA
Canada, Fort Saskatchewan 2007 (46A76 Clearfield) PTHIO_093
2 0.31 0.15 21 21
0.036 0.03
0.03 0.014
0.011 0.01
< 0.01 < 0.01
< 0.01 < 0.01
< 0.01 < 0.01
Parent: 0.033 Total: 0.074
Canada, Fort Saskatchewan 2007 (RR 3275) PTHIO_093
2 0.31 0.15 pods with seeds 0a 0a 0 0 7 7 14 14 seeds 21 21 28 28
1.6 1.7 7.1 7.6 3.7 2.8 1.8 1.9 0.073 0.086 0.011 0.012
0.077 0.071 0.085 0.097 0.21 0.18 0.28 0.27 < 0.01 0.011 < 0.01 < 0.01
0.015 0.015 0.023 0.025 0.054 0.043 0.11 0.099 < 0.01 < 0.01 < 0.01 < 0.01
0.029 0.028 0.041 0.048 0.11 0.095 0.086 0.093 < 0.01 < 0.01 < 0.01 < 0.01
< 0.01 < 0.01 < 0.01 0.01 0.025 0.021 0.057 0.055 < 0.01 < 0.01 < 0.01 < 0.01
< 0.01 < 0.01 < 0.01 < 0.01 < 0.01 < 0.01 < 0.01 < 0.01 < 0.01 < 0.01 < 0.01 < 0.01
Parent: 0.08 Total: 0.099
Canada, Edmonton 2007 (Invigor 5020) PTHIO_093
2 0.31 0.3
0.15 0.15
21 0.055 0.049
< 0.01 < 0.01
< 0.01 < 0.01
< 0.01 < 0.01
< 0.01 < 0.01
< 0.01 < 0.01
Parent: 0.052 Total: 0.071
Canada, Westlock 2007 (RR 1818) PTHIO_093
2 0.3 0.15 22 22
0.36 0.47
0.014 0.016
0.011 0.011
0.012 0.016
< 0.01 < 0.01
< 0.01 < 0.01
Parent: 0.42 Total: 0.44
Canada, Portage la Prairie 2008 (93H01) PTHIO_094
2 0.3 0.32
0.13 0.14
21 0.012 < 0.01
< 0.01 < 0.01
0.01 < 0.01
< 0.01 < 0.01
< 0.01 < 0.01
< 0.01 < 0.01
Parent: 0.011 Total: 0.03 2 0.3
0.31 (EC)
0.13 0.13
21 < 0.01 < 0.01
< 0.01 < 0.01
0.022 0.019
< 0.01 < 0.01
< 0.01 < 0.01
< 0.01 < 0.01
USA (WA), Ephrata 2008 (71-45 RR) PTHIO_094
2 0.31 0.16 21 < 0.01 < 0.01
0.042 0.03
< 0.01 < 0.01
< 0.01 < 0.01
< 0.01 < 0.01
< 0.01 < 0.01
Parent: < 0.01 Total: 0.15
2 0.3 0.31 (EC)
0.16 0.16
21 < 0.01 < 0.01
0.075 0.08
0.018 0.018
< 0.01 < 0.01
< 0.01 < 0.01
< 0.01 < 0.01
Canada, Minto 2008 (5030) PTHIO_094
2 0.3 0.19 20 < 0.01 < 0.01
< 0.01 < 0.01
< 0.01 < 0.01
< 0.01 < 0.01
< 0.01 < 0.01
< 0.01 < 0.01
Parent: < 0.01 Total: < 0.01
2 0.31 0.3 (EC)
0.19 0.19
20 < 0.01 < 0.01
< 0.01 < 0.01
< 0.01 < 0.01
< 0.01 < 0.01
< 0.01 < 0.01
< 0.01 < 0.01
a mean of replicate samples (if applicable); total residue based on the edible portion

Penthiopyrad
1549
DAT: days after final treatment
Table 105 Residues in peanut seeds following foliar application of penthiopyrad
Location, Year (variety) Reference
Application DAT Residues, mg/kg Selected residue mg/kg a n kg
ai/ha kg ai/hL
parent PAM PCA 753-A-OH
753-F-DO
DM-PCA
USA (VA), Bumpass 2007 (Georgia Green) PTHIO_098
3 0.36 0.37 0.35
0.12 0.12 0.12
14 14
< 0.01 < 0.01
< 0.01 < 0.01
< 0.01 < 0.01
< 0.01 < 0.01
< 0.01 < 0.01
< 0.01 < 0.01
Parent: < 0.01 Total: < 0.01
USA (SC), Blackville 2007 (Georgia Green) PTHIO_098
3 0.35 0.36 0.36
0.11 0.12 0.12
14 14
< 0.01 < 0.01
< 0.01 < 0.01
< 0.01 < 0.01
< 0.01 < 0.01
< 0.01 < 0.01
< 0.01 < 0.01
Parent: < 0.01 Total: < 0.01
USA (NC), Pikeville 2007 (Gregory) PTHIO_098
3 0.35 0.36 0.35
0.15 0.15 0.15
13 13
< 0.01 < 0.01
< 0.01 < 0.01
< 0.01 < 0.01
< 0.01 < 0.01
< 0.01 < 0.01
< 0.01 < 0.01
Parent: < 0.01 Total: < 0.01
USA (GA), Sycamore 2007 (GA-02) PTHIO_098
3 0.36 0.36 0.36
0.19 0.18 0.18
14 14
< 0.01 < 0.01
< 0.01 < 0.01
< 0.01 < 0.01
< 0.01 < 0.01
< 0.01 < 0.01
< 0.01 < 0.01
Parent: < 0.01 Total: < 0.01
3 1.8 1.8 1.8
0.95 0.94 0.95
Nutmeat 14 14 14 Meal 14 14 Refined oil 14 14
0.053 0.04 0.06 0.027 0.025 0.071 0.068
0.013 0.013 0.014 0.021 0.019 < 0.01 < 0.01
< 0.01 < 0.01 < 0.01 < 0.01 < 0.01 < 0.01 < 0.01
< 0.01 < 0.01 < 0.01 < 0.01 < 0.01 < 0.01 < 0.01
< 0.01 < 0.01 < 0.01 < 0.01 < 0.01 < 0.01 < 0.01
< 0.01 < 0.01 < 0.01 < 0.01 < 0.01 < 0.01 < 0.01
USA (GA), Chula 2007 (Georgia Green) PTHIO_098
3 0.36 0.36 0.36
0.18 0.19 0.19
14 14
< 0.01 < 0.01
< 0.01 < 0.01
< 0.01 < 0.01
< 0.01 < 0.01
< 0.01 < 0.01
< 0.01 < 0.01
Parent: < 0.01 Total: < 0.01
USA (GA), Quitman 2007 (Georgia Green) PTHIO_098
3 0.36 0.36 0.36
0.18 0.18 0.19
14 < 0.01 < 0.01
< 0.01 < 0.01
< 0.01 < 0.01
< 0.01 < 0.01
< 0.01 < 0.01
< 0.01 < 0.01
Parent: < 0.01 Total: < 0.01

Penthiopyrad
1550
Location, Year (variety) Reference
Application DAT Residues, mg/kg Selected residue mg/kg a n kg
ai/ha kg ai/hL
parent PAM PCA 753-A-OH
753-F-DO
DM-PCA
USA (GA), Athens 2007 (Georgia Green) PTHIO_098
3 0.35 0.36 0.36
0.13 0.13 0.13
14 < 0.01 < 0.01
< 0.01 < 0.01
< 0.01 < 0.01
< 0.01 < 0.01
< 0.01 < 0.01
< 0.01 < 0.01
Parent: < 0.01 Total: < 0.01
USA (GA), Chula 2007 (GA02C) PTHIO_098
3 0.35 0.09 14 < 0.01 < 0.01
< 0.01 < 0.01
< 0.01 < 0.01
< 0.01 < 0.01
< 0.01 < 0.01
< 0.01 < 0.01
Parent: < 0.01 Total: < 0.01
USA (GA), Montezuma 2007 (Georgia Green) PTHIO_098
3 0.36 0.14 14 < 0.01 < 0.01
< 0.01 < 0.01
< 0.01 < 0.01
< 0.01 < 0.01
< 0.01 < 0.01
< 0.01 < 0.01
Parent: < 0.01 Total: < 0.01
USA (FL), Bradenton 2007 (Georgia Green) PTHIO_098
3 0.37 0.36 0.36
0.08 0.08 0.08
15 < 0.01 < 0.01
< 0.01 < 0.01
< 0.01 < 0.01
< 0.01 < 0.01
< 0.01 < 0.01
< 0.01 < 0.01
Parent: < 0.01 Total: < 0.01
USA (OK), Hinton 2007 (Olin) PTHIO_098
3 0.36 0.35 0.36
0.16 0.16 0.16
15 < 0.01 < 0.01
< 0.01 < 0.01
< 0.01 < 0.01
< 0.01 < 0.01
< 0.01 < 0.01
< 0.01 < 0.01
Parent: < 0.01 Total: < 0.01
USA (TX), Charlotte 2007 (TAM RUN OL-1) PTHIO_098
3 0.36 0.15 15 0.047 0.02
0.013 < 0.01
< 0.01 < 0.01
< 0.01 < 0.01
< 0.01 < 0.01
< 0.01 < 0.01
Parent: 0.034 Total: 0.055 3 1.8
1.8 1.8
0.76 0.760.76
Nutmeat 14 14 14 Meal 14 14 Refined oil 14 14
0.11 0.11 0.12 0.039 0.042 0.19 0.2
0.013 0.011 0.013 0.02 0.023 < 0.01 < 0.01
< 0.01 < 0.01 0.01 0.013 0.015 < 0.01 < 0.01
< 0.01 < 0.01 < 0.01 < 0.01 < 0.01 < 0.01 < 0.01
< 0.01 < 0.01 < 0.01 < 0.01 < 0.01 < 0.01 < 0.01
< 0.01 < 0.01 < 0.01 < 0.01 < 0.01 < 0.01 < 0.01
USA (TX), Levelland 2007 (TAMSPAN 90) PTHIO_098
3 0.36 0.35 0.36
0.15 0.15 0.15
14 < 0.01 < 0.01
< 0.01 < 0.01
< 0.01 < 0.01
< 0.01 < 0.01
< 0.01 < 0.01
< 0.01 < 0.01
Parent: < 0.01 Total: < 0.01
a mean of replicate samples (if applicable); total residue based on the edible portion DAT: days after final treatment

Penthiopyrad
1551
Table 106 Residues in sunflower seeds following foliar application of penthiopyrad
Location, Year (variety) Reference
Application DAT Residues, mg/kg Selected residue mg/kg a
n kg ai/ha
kg ai/hL
parent PAM PCA 753-A-OH
753-F-DO
DM-PCA
Hungary, Pázmánd 2007 (NK Brio) PTHIO_095
2 0.2 0.08 35 0.01 < 0.01 < 0.01 < 0.01 < 0.01 < 0.01
France (North), Argilly 2007 (Pacific) PTHIO_095
2 0.2 0.08 50 0.011 < 0.01 < 0.01 < 0.01 < 0.01 < 0.01
Hungary, Velence 2007 (NK Brio) PTHIO_095
2 0.2 0.08 35 < 0.01 < 0.01 < 0.01 < 0.01 < 0.01 < 0.01
Hungary, Kápolnásnyék 2008 (NK Armoni) PTHIO_095
2 0.19 0.08 70 < 0.01 < 0.01 < 0.01 < 0.01 < 0.01 < 0.01
Germany, Motterwitz 2008 (Sanluka) PTHIO_095
2 0.21 0.08 56 < 0.01 < 0.01 0.012 < 0.01 < 0.01 < 0.01
UK, Wigborough 2008 (Blizzar) PTHIO_095
2 0.2 0.21
0.08 0.08
43 < 0.01 < 0.01 < 0.01 < 0.01 < 0.01 < 0.01
France (North), Sommere 2008 (LG 54.50) PTHIO_095
2 0.2 0.08 53 0.023 < 0.01 < 0.01 < 0.01 < 0.01 < 0.01
France (North), Goudelancourt 2008 (PR 64 H41) PTHIO_095
2 0.2 0.19
0.08 0.08
42 < 0.01 < 0.01 < 0.01 < 0.01 < 0.01 < 0.01
Hungary, Kápolnásnyék 2008 (NK Armoni) PTHIO_096
1 0.19 0.08 117 < 0.01 < 0.01 < 0.01 < 0.01 < 0.01 < 0.01
France (North), Juvincourt 2008 (LG 54.50) PTHIO_096
1 0.2 0.08 98 < 0.01 < 0.01 < 0.01 < 0.01 < 0.01 < 0.01

Penthiopyrad
1552
Location, Year (variety) Reference
Application DAT Residues, mg/kg Selected residue mg/kg a
n kg ai/ha
kg ai/hL
parent PAM PCA 753-A-OH
753-F-DO
DM-PCA
Germany, Motterwitz 2008 (Sanluka) PTHIO_096
1 0.19 0.08 107 < 0.01 < 0.01 < 0.01 < 0.01 < 0.01 < 0.01
France (South), Villebichot 2008 (Extrasol) PTHIO_096
1 0.2 0.08 112 < 0.01 < 0.01 < 0.01 < 0.01 < 0.01 < 0.01
Germany, Bernburg 2008 (Kronosol) PTHIO_096
1 0.21 0.08 108 < 0.01 < 0.01 < 0.01 < 0.01 < 0.01 < 0.01
Canada, Elm Creek 2009 (Viper) PTHIO_097
2 0.47 0.47
0.46 0.23
14 0.087 0.07
< 0.01 < 0.01
< 0.01 < 0.01
< 0.01 < 0.01
< 0.01 < 0.01
< 0.01 < 0.01
Parent: 0.079 Total: 0.097
USA (ND), Gardner 2009 (IS 8048) PTHIO_097
2 0.45 0.48
0.24 0.2
15 < 0.01 < 0.01
< 0.01 < 0.01
< 0.01 < 0.01
< 0.01 < 0.01
< 0.01 < 0.01
< 0.01 < 0.01
Parent: < 0.01 Total: < 0.01
USA (MN), Geneva 2009 (Pioneer 64 H 41) PTHIO_097
2 0.46 0.46
0.27 0.26
14 0.081 0.12
< 0.01 < 0.01
< 0.01 < 0.01
< 0.01 < 0.01
< 0.01 < 0.01
< 0.01 < 0.01
Parent: 0.10 Total: 0.12
Canada, Vanscoy 2009 (63A21) PTHIO_097
2 0.46 0.45
0.28 0.27
15 0.5 0.38
0.07 0.068
0.03 0.03
0.027 0.026
0.011 < 0.01
< 0.01 < 0.01
Parent: 0.44 Total: 0.57
Canada, Delisle 2009 (Viper) PTHIO_097
2 0.47 0.45
0.28 0.27
13 0.34 0.34
0.08 0.098
0.035 0.038
< 0.01 0.013
< 0.01 < 0.01
< 0.01 < 0.01
Parent: 0.34 Total: 0.51
USA (ND); Velva 2009 (8N83SCL) PTHIO_097
2 0.46 0.47
0.24 0.25
14 0.072 0.086
< 0.01 < 0.01
< 0.01 < 0.01
< 0.01 < 0.01
< 0.01 < 0.01
< 0.01 < 0.01
Parent: 0.079 Total: 0.098
USA (ND), Carrignton 2009 (Pioneer) PTHIO_097
2 0.46 0.47
0.16 0.17
14 0.064 0.092
< 0.01 < 0.01
< 0.01 < 0.01
< 0.01 < 0.01
< 0.01 < 0.01
< 0.01 < 0.01
Parent: 0.078 Total: 0.097
USA (OK), Hinton 2009 (8N453DM) PTHIO_097
2 0.46 0.47
0.98 0.99
13 0.69 0.92
0.068 0.074
0.046 0.059
0.047 0.056
0.015 0.02
< 0.01 < 0.01
Parent: 0.81 Total: 0.94

Penthiopyrad
1553
Location, Year (variety) Reference
Application DAT Residues, mg/kg Selected residue mg/kg a
n kg ai/ha
kg ai/hL
parent PAM PCA 753-A-OH
753-F-DO
DM-PCA
Canada, Minto 2009 (Viper) PTHIO_097
2 0.46 0.29 15 0.3 0.25
0.025 0.021
0.021 0.019
0.017 < 0.01
< 0.01 < 0.01
< 0.01 < 0.01
Parent: 0.28 Total: 0.32
a mean of replicate samples (if applicable); total residue based on the edible portion DAT: days after final treatment
Table 107 Residues in alfalfa forage and hay following foliar application of penthiopyrad
Location, Year (variety) Reference
Application DAT Residues, mg/kg Selected residue mg/kg a n kg
ai/ha kg ai/hL
parent PAM PCA 753-A-OH
753-F-DO DM-PCA
USA (PA), Germansville 2009 (American 403T) PTHIO_102
2 0.37 0.13 Forage 13 13 Hay 13 13
0.29 0.39 1.9 1.8
0.069 0.069 0.39 0.33
0.017 0.02 0.11 0.11
< 0.01 < 0.01 < 0.05 < 0.05
< 0.01 0.012 < 0.05< 0.05
< 0.01 < 0.01 < 0.05 < 0.05
Parent (forage): 0.34 Total (forage): 0.47 Parent (hay): 1.9 Total (forage): 2.5
USA (GA), Moultrie 2009 (Bulldog 805) PTHIO_102
2 0.36 0.18 Forage 14 14 Hay 14 14
0.23 0.23 0.6 0.55
0.12 0.12 0.83 1.0
0.024 0.024 0.62 0.69
< 0.01 < 0.01 0.08 < 0.05
0.024 0.024 0.18 < 0.05
0.015 0.014 0.15 0.25
Parent (forage): 0.23 Total (forage): 0.45 Parent (hay): 0.58 Total (forage): 2.3
USA (NE), Springfield 2009 (NE Certified) PTHIO_102
2 0.35 0.27 Forage 13 13 Hay 13 13
1.2 1.1 4.8 4.9
0.16 0.14 0.55 0.55
0.048 0.041 0.19 0.2
0.024 0.019 < 0.05 < 0.05
0.04 0.035 0.05 0.05
0.011 0.01 < 0.05 < 0.05
Parent (forage): 1.2 Total (forage): 1.4 Parent (hay): 4.9 Total (forage): 5.9

Penthiopyrad
1554
Location, Year (variety) Reference
Application DAT Residues, mg/kg Selected residue mg/kg a n kg
ai/ha kg ai/hL
parent PAM PCA 753-A-OH
753-F-DO DM-PCA
USA (MN), Geneva 2009 (Viking 3000) PTHIO_102
2 0.37 0.36
0.25 0.22
Forage 14 14 Hay 14 14
0.74 0.73 1.8 1.7
0.12 0.11 0.4 0.38
0.027 0.026 0.21 0.24
< 0.01 < 0.01 < 0.05 < 0.05
0.027 0.023 0.58 0.66
< 0.01 < 0.01 0.066 0.082
Parent (forage): 0.74 Total (forage): 0.95 Parent (hay): 1.8 Total (forage): 2.5
USA (ND), Gardner 2009 (Multi-F-2) PTHIO_102
2 0.36 0.35
0.26 0.25
Forage 0 0 3 3 7 7 14 14 Hay 0 0 3 3 7 7 14 14
25 27 14 18 5.1 7.8 1.8 1.5 92 57 57 54 15 22 4.5 4.8
0.11 0.11 0.14 0.15 0.24 0.27 0.24 0.21 0.79 0.73 0.91 0.81 0.99 1.4 0.9 0.93
0.037 0.038 0.08 0.078 0.094 0.11 0.051 0.045 0.48 0.4 0.48 0.47 0.42 0.51 0.2 0.21
0.095 0.092 0.092 0.092 0.068 0.081 0.031 0.03 0.26 0.36 0.1 0.11 0.066 0.35 0.08 0.094
0.051 0.049 0.11 0.11 0.062 0.079 0.042 0.033 0.23 0.28 0.39 0.14 0.089 0.26 0.077 0.091
< 0.01 < 0.01 < 0.01 < 0.01 0.011 0.011 < 0.01 < 0.01 < 0.05 < 0.05 < 0.05 < 0.05 0.06 0.061 < 0.05 < 0.05
Parent (forage): 1.7 Total (forage): 2.1 Parent (hay): 4.7 Total (forage): 6.4
Canada, Portage la Prairie 2009 (Ultrastar) PTHIO_102
2 0.34 0.16 Forage 14 14 Hay 14 14
0.24 0.25 0.73 1.2
0.2 0.2 1.0 1.1
0.039 0.039 0.39 0.53
< 0.01 < 0.01 < 0.05 < 0.05
0.022 0.025 0.47 0.64
< 0.01 < 0.01 0.084 0.1
Parent (forage): 0.25 Total (forage): 0.62 Parent (hay): 0.97 Total (forage): 2.9
Canada, Portage la Prairie 2009 (Magnum 3801) PTHIO_102
2 0.35 0.16 Forage 14 14 Hay 14 14
0.056 0.034 0.37 0.18
0.09 0.088 0.61 0.4
0.012 0.014 0.27 0.22
< 0.01 < 0.01 < 0.05 < 0.05
< 0.01 < 0.01 0.23 0.14
< 0.01 < 0.01 < 0.05 < 0.05
Parent (forage): 0.045 Total (forage): 0.21 Parent (hay): 0.28 Total (forage): 1.2

Penthiopyrad
1555
Location, Year (variety) Reference
Application DAT Residues, mg/kg Selected residue mg/kg a n kg
ai/ha kg ai/hL
parent PAM PCA 753-A-OH
753-F-DO DM-PCA
USA (ND), Jamestown 2009 (Multi-F-2) PTHIO_102
2 0.35 0.36
0.25 0.26
Forage 13 13 Hay 13 13
3.9 4.0 14 13
0.37 0.37 1.4 1.4
0.076 0.074 0.33 0.31
0.15 0.13 0.32 0.26
0.049 0.046 0.081 0.07
0.011 0.012 < 0.05 < 0.05
Parent (forage): 4.0 Total (forage): 4.6 Parent (hay): 14 Total (forage): 16
USA (ID), Jerome 2009 (Ranger) PTHIO_102
2 0.35 0.18 Forage 15 15 Hay 15 15
0.025 0.03 0.08 0.14
0.043 0.035 0.22 0.31
0.011 < 0.01 0.054 0.082
< 0.01 < 0.01 < 0.05 < 0.05
< 0.01 < 0.01 < 0.05 0.058
< 0.01 < 0.01 < 0.05 < 0.05
Parent (forage): 0.028 Total (forage): 0.1 Parent (hay): 0.11 Total (forage): 0.60
USA (CA), Madera 2009 (Magna 788) PTHIO_102
2 0.36 0.13 Forage 14 14 Hay 14 14
0.55 0.6 1.6 1.5
0.27 0.23 1.0 0.92
0.041 0.047 0.31 0.3
0.011 0.013 < 0.05 < 0.05
0.038 0.038 < 0.05 < 0.05
0.026 0.017 0.074 0.076
Parent (forage): 0.58 Total (forage): 1.0 Parent (hay): 1.6 Total (forage): 3.3
USA (ID), Payette 2009 (Agate) PTHIO_102
2 0.37 0.16 Forage 14 14 Hay 14 14
0.32 0.32 1.7 1.8
0.23 0.21 0.84 0.93
0.022 0.023 0.18 0.22
0.012 0.013 < 0.05 < 0.05
0.023 0.023 < 0.05 < 0.05
0.016 0.012 < 0.05 0.05
Parent (forage): 0.32 Total (forage): 0.73 Parent (hay): 1.8 Total (forage): 3.4
Canada, Josephburg 2009 (not reported) PTHIO_102
2 0.35 0.28 Forage 13 13 Hay 13 13
1.3 1.4 3.1 3.3
0.2 0.25 0.7 0.73
0.029 0.034 0.35 0.35
0.022 0.027 0.054 0.056
0.018 0.021 0.31 0.32
< 0.01 < 0.01 0.064 0.065
Parent (forage): 1.4 Total (forage): 1.8 Parent (hay): 3.2 Total (forage): 4.5

Penthiopyrad
1556
Location, Year (variety) Reference
Application DAT Residues, mg/kg Selected residue mg/kg a n kg
ai/ha kg ai/hL
parent PAM PCA 753-A-OH
753-F-DO DM-PCA
Canada, Gibbons 2009 (not reported) PTHIO_102
2 0.36 0.29 Forage 14 14 Hay 14 14
1.6 1.5 3.7 3.4
0.23 0.28 0.75 0.67
0.03 0.028 0.24 0.26
0.03 0.035 0.063 0.069
0.015 0.016 0.069 0.062
< 0.01 < 0.01 < 0.05 < 0.05
Parent (forage): 1.6 Total (forage): 2.0 Parent (hay): 3.6 Total (forage): 4.9
Canada, Rosthern 2009 (not reported) PTHIO_102
2 0.35 0.18 Forage 13 13 Hay 13 13
0.27 0.33 0.68 0.85
0.15 0.16 0.59 0.64
0.026 0.03 0.37 0.37
0.01 0.014 < 0.05 < 0.05
0.014 0.022 0.57 0.7
< 0.01 0.011 0.22 0.23
Parent (forage): 0.3 Total (forage): 0.59 Parent (hay): 0.77 Total (forage): 1.9
Canada, Wakaw 2009 (Rambler) PTHIO_102
2 0.35 0.17 Forage 14 14 Hay 14 14
0.41 0.55 1.7 1.5
0.12 0.12 0.5 0.44
0.028 0.032 0.15 0.14
< 0.01 0.011 < 0.05 < 0.05
0.021 0.022 0.2 0.28
< 0.01 < 0.01 0.072 0.06
Parent (forage): 0.48 Total (forage): 0.70 Parent (hay): 1.6 Total (forage): 2.5
a mean of replicate samples (if applicable); total residue based on the edible portion DAT: days after final treatment
Table 108 Residues in pea vines and hay following foliar application of penthiopyrad
Location, Year (variety) Reference
Application DAT Residues, mg/kg Selected residue mg/kg a
n kg ai/ha
kg ai/hL
parent PAM PCA 753-A-OH
753-F-DO
DM-PCA
USA (ID), Jerome 2007 (Pendelton) PTHIO_085
2 0.3 0.18 Hay 0 0 Vines 0 0
19 11 5.8 4.7
0.24 0.23 0.017 0.015
0.34 0.33 0.013 0.01
0.06 0.071 < 0.01 < 0.01
0.14 0.14 < 0.01 < 0.01
< 0.05 < 0.05 < 0.01 < 0.01
Parent (vines): 5.3 Total (vines): 5.3 Parent (hay): 15 Total (hay): 15

Penthiopyrad
1557
Location, Year (variety) Reference
Application DAT Residues, mg/kg Selected residue mg/kg a
n kg ai/ha
kg ai/hL
parent PAM PCA 753-A-OH
753-F-DO
DM-PCA
USA (ID), Payette 2007 (Austrian Winter Peas) PTHIO_085
2 0.31 0.16 Hay 0 0 Vines 0 0
31 28 24 21
0.63 0.42 0.25 0.17
0.44 0.32 0.13 0.09
0.75 0.51 0.082 0.052
0.18 0.13 0.41 0.31
< 0.05 < 0.05 0.012 0.014
Parent (vines): 23 Total (vines): 23 Parent (hay): 30 Total (hay): 30
USA (WA), Ephrata 2007 (Dec0hutes) PTHIO_085
2 0.31 0.16 Hay 0 0 Vines 0 0
14 14 13 11
0.24 0.24 0.073 0.055
0.29 0.29 0.033 0.025
0.17 0.14 0.025 0.022
< 0.05 < 0.05 0.033 0.025
< 0.05 < 0.05 < 0.01 < 0.01
Parent (vines): 12 Total (vines): 12 Parent (hay): 14 Total (hay): 14
USA (WA), Ephrata 2007 (Tonic) PTHIO_085
2 0.31 0.17 Hay 0a 0a 0 0 7 7 14 14 21 21 28 28 Vines 0a 0a 0 0 7 7 14 14 21 21 28 28
0.53 0.51 6.5 7.5 4.1 3.4 7.3 8.5 9.6 9.1 7.4 7.1 0.25 0.17 3.8 3.3 5.9 5.3 4.9 5.6 4.5 4.7 4.1 3.1
0.064 0.08 0.21 0.2 0.32 0.23 0.48 0.6 0.77 0.73 0.95 0.79 0.015 0.012 0.013 0.012 0.28 0.21 0.42 0.49 0.59 0.65 0.69 0.54
0.064 0.1 0.28 0.28 0.26 0.21 0.41 0.48 0.68 0.65 0.83 0.72 0.012 0.01 0.012 0.01 0.24 0.19 0.36 0.4 0.44 0.48 0.59 0.44
< 0.05 < 0.05 0.13 0.13 0.18 0.12 0.26 0.36 0.42 0.44 0.56 0.43 0.011 < 0.01 0.017 0.01 0.11 0.092 0.095 0.11 0.089 0.091 0.095 0.093
< 0.05 < 0.05 0.074 0.071 0.1 0.091 0.12 0.11 0.13 0.13 0.14 0.15 < 0.01 < 0.01 < 0.01 < 0.01 0.27 0.17 0.32 0.37 0.37 0.41 0.35 0.27
< 0.05 < 0.05 < 0.05 < 0.05 < 0.05 < 0.05 < 0.05 < 0.05 < 0.05 < 0.05 < 0.05 < 0.05 < 0.01 < 0.01 < 0.01 < 0.01 < 0.01 < 0.01 0.013 0.013 0.013 0.015 0.016 0.015
Parent (vines): 5.6 Total (vines): 6.1 Parent (hay): 9.4 Total (hay): 11
USA (WA), Ephrata 2008 (Kalamo) PTHIO_086
2 0.31 0.30 (SC)
0.16 0.16
Hay 0 0 Vines 0 0
8.8 14 5.5 6.7
0.17 0.17 0.025 0.028
0.21 0.21 0.017 0.017
0.11 0.14 0.019 0.024
0.05 0.05 0.013 0.016
< 0.05 < 0.05 < 0.01 < 0.01
Parent (vines): 6.1 Total (vines): 6.1 Parent (hay): 11

Penthiopyrad
1558
Location, Year (variety) Reference
Application DAT Residues, mg/kg Selected residue mg/kg a
n kg ai/ha
kg ai/hL
parent PAM PCA 753-A-OH
753-F-DO
DM-PCA
2 0.31 (EC)
0.16 Hay 0 0 Vines 0 0
5.0 8.5 5.0 4.2
0.44 0.56 0.077 0.061
0.61 0.76 0.047 0.036
0.23 0.28 0.069 0.055
0.31 0.35 0.019 0.016
< 0.05 < 0.05 < 0.01 < 0.01
Total (hay): 12
Canada, Fort Saskatchewan 2008 (Midas) PTHIO_086
2 0.3 (SC)
0.13 Hay 0 0 Vines 0 0
9.4 8.1 4.3 4.6
0.15 0.13 0.017 0.02
0.18 0.15 0.015 0.018
0.077 0.059 0.02 0.021
0.21 0.17 0.016 0.018
< 0.05 < 0.05 < 0.01 < 0.01
Parent (vines): 4.5 Total (vines): 4.5 Parent (hay): 8.7 Total (hay): 8.9
2 0.31 0.3 (EC)
0.14 0.14
Hay 0 0 Vines 0 0
2.1 2.4 4.0 4.3
0.61 0.58 0.073 0.085
0.42 0.4 0.052 0.061
0.18 0.17 0.036 0.038
0.21 0.22 0.061 0.064
< 0.05 < 0.05 < 0.01 < 0.01
Canada, Fort Saskatchewan 2008 (Cooper) PTHIO_086
2 0.31 0.3 (SC)
0.14 0.13
Hay 0 0 Vines 0 0
3.7 3.7 4.5 4.9
0.1 0.11 0.017 0.017
0.096 0.1 0.013 0.013
< 0.05 < 0.05 0.015 0.015
0.12 0.11 0.013 0.013
< 0.05 < 0.05 < 0.01 < 0.01
Parent (vines): 6.2 Total (vines): 6.3 Parent (hay): 3.7 Total (hay): 3.9
2 0.33 0.31 (EC)
0.14 0.14
Hay 0 0 Vines 0 0
1.9 1.4 5.2 7.2
0.39 0.34 0.064 0.074
0.26 0.23 0.027 0.029
0.14 0.14 0.047 0.056
0.23 0.22 0.054 0.069
< 0.05 < 0.05 < 0.01 < 0.01
a mean of replicate samples (if applicable); total residue based on the edible portion DAT: days after final treatment

Penthiopyrad
1559
Table 109 Residues in soya bean forage and hay following foliar application of penthiopyrad
Location, Year (variety) Reference
Application DAT Residues, mg/kg Selected residue mg/kg a n kg
ai/ha kg ai/hL
parent PAM PCA 753-A-OH 753-F-DO
DM-PCA
USA (GA), Athens 2009 (4062885) PTHIO_087
2 0.46 0.21 Forage 0 0 Hay 0 0
3.9 4.3 11 11
< 0.01 < 0.01 0.25 0.23
< 0.01 < 0.01 0.23 0.24
< 0.01 < 0.01 < 0.05 0.056
< 0.01 < 0.01 0.072 0.09
< 0.01 < 0.01 < 0.05 < 0.05
Parent (vines): 4.1 Total (vines): 4.1 Parent (hay): 11 Total (hay): 11
USA (LA), Cheneyville 2009 (Pioneer 95820) PTHIO_087
2 0.45 0.22 Forage 0 0 Hay 0 0
19 18 43 54
0.025 0.02 1.1 1.3
0.018 0.018 0.025 0.024
0.02 0.016 0.57 0.7
0.02 0.023 0.35 0.48
< 0.01 < 0.01 0.58 0.68
Parent (vines): 19 Total (vines): 19 Parent (hay): 49 Total (hay): 51
USA (MO), Fisk 2009 (54-17 RR1STS) PTHIO_087
2 0.47 0.25 Forage 0 0 Hay 0 0
19 22 156 90
0.098 0.098 1.4 1.1
0.072 0.068 1.8 1.7
0.06 0.06 0.31 0.28
0.045 0.05 0.85 0.79
0.017 0.018 0.11 0.088
Parent (vines): 21 Total (vines): 21 Parent (hay): 123 Total (hay): 125
USA (MO), Dudley 2009 (Jake) PTHIO_087
2 0.47 0.25 Forage 0 0 Hay 0 0
15 14 60 58
0.043 0.047 0.76 0.89
0.042 0.04 0.61 0.71
0.04 0.032 0.4 0.45
0.014 0.016 0.15 0.13
< 0.01 < 0.01 < 0.05 0.052
Parent (vines): 15 Total (vines): 15 Parent (hay): 59 Total (hay): 61

Penthiopyrad
1560
Location, Year (variety) Reference
Application DAT Residues, mg/kg Selected residue mg/kg a n kg
ai/ha kg ai/hL
parent PAM PCA 753-A-OH 753-F-DO
DM-PCA
USA (KS), Gardner 2009 (Fontanelle 407NRS) PTHIO_087
2 0.46 0.34 Forage 0a 0a 0 0 3 3 6 6 10 10 Hay 0a 0a
0 0 3 3 6 6 10 10
< 0.01 < 0.01 22 24 10 11 7.2 5.4 2.7 3.4 < 0.05 < 0.05 92 107 50 48 23 20 9.5 9.7
< 0.01 < 0.01 0.015 0.018 0.25 0.33 0.39 0.28 0.23 0.29 < 0.05 < 0.05 0.38 0.36 1.5 1.4 1.9 2.0 1.3 1.2
< 0.01 < 0.01 0.015 0.017 0.14 0.16 0.15 0.1 0.043 0.053 < 0.05 < 0.05 0.33 0.26 0.76 0.76 0.65 0.65 0.27 0.26
< 0.01< 0.01 < 0.01 0.012 0.25 0.28 0.33 0.22 0.11 0.14 < 0.05 < 0.05 0.26 0.3 0.74 0.69 0.86 0.73 0.3 0.31
< 0.01 < 0.01 0.051 0.049 0.11 0.12 0.097 0.07 0.052 0.061 < 0.05 < 0.05 0.65 0.83 0.49 0.47 0.42 0.36 0.26 0.26
< 0.01 < 0.01 < 0.01 < 0.01 0.078 0.083 0.096 0.069 0.067 0.075 < 0.05 < 0.05 < 0.05 < 0.05 0.27 0.26 0.29 0.31 0.2 0.18
Parent (vines): 23 Total (vines): 23 Parent (hay): 100 Total (hay): 100
USA (IL), Rochelle 2009 (Pioneer 92 M61) PTHIO_087
2 0.45 0.97 Forage 0 0 Hay 0 0
11 11 47 43
< 0.01 < 0.01 < 0.05 < 0.05
0.062 0.053 0.062 0.053
< 0.01 < 0.01 < 0.05 < 0.05
< 0.01 < 0.01 0.065 0.068
< 0.01 < 0.01 < 0.05 < 0.05
Parent (vines): 11 Total (vines): 11 Parent (hay): 45 Total (hay): 45
USA (OH), Richwood 2009 (ShurGrow 289RR) PTHIO_087
2 0.45 0.28 Forage 0 0 Hay 0 0
13 14 47 62
0.032 0.029 0.12 0.13
0.022 0.018 0.051 0.077
0.018 0.018 < 0.05 0.05
0.023 0.024 0.16 0.16
0.012 0.011 < 0.05 < 0.05
Parent (vines): 14 Total (vines): 14 Parent (hay): 55 Total (hay): 55
USA (NE), Springfield 2009 (NcT 2 A98) PTHIO_087
2 0.46 0.36 Forage 0 0 Hay 0 0
16 15 52 47
< 0.01 < 0.01 0.18 0.18
< 0.01 < 0.01 0.2 0.2
< 0.01 < 0.01 0.14 0.13
< 0.01 < 0.01 0.24 0.2
< 0.01 < 0.01 < 0.05 < 0.05
Parent (vines): 16 Total (vines): 16 Parent (hay): 50 Total (hay): 50

Penthiopyrad
1561
Location, Year (variety) Reference
Application DAT Residues, mg/kg Selected residue mg/kg a n kg
ai/ha kg ai/hL
parent PAM PCA 753-A-OH 753-F-DO
DM-PCA
USA (IA), Richland 2009 (Pioneer 93B82) PTHIO_087
2 0.45 0.28 Forage 0 0 Hay 0 0
23 24 51 55
0.016 0.018 0.37 0.37
0.021 0.025 0.51 0.47
0.021 0.025 0.2 0.19
< 0.01 < 0.01 0.12 0.2
< 0.01 < 0.01 < 0.05 < 0.05
Parent (vines): 24 Total (vines): 24 Parent (hay): 53 Total (hay): 54
USA (MN), Geneva 2009 (Pioneer 91M80) PTHIO_087
2 0.46 0.26 Forage 0 0 Hay 0 0
17 15 43 52
0.012 0.011 0.25 0.31
0.015 0.012 0.26 0.33
0.014 0.012 0.16 0.18
0.016 0.016 0.11 0.13
< 0.01 < 0.01 < 0.05 < 0.05
Parent (vines): 16 Total (vines): 16 Parent (hay): 48 Total (hay): 48
USA (WI), Delavan 2009 (AG 2002 RR) PTHIO_087
2 0.46 0.22 Forage 0 0 Hay 0 0
14 13 60 48
0.01 0.011 0.38 0.35
0.013 0.013 0.47 0.39
0.011 0.012 0.23 0.19
0.01 0.011 0.15 0.12
< 0.01 < 0.01 < 0.05 < 0.05
Parent (vines): 14 Total (vines): 14 Parent (hay): 54 Total (hay): 55
Canada, St. Marc-sur-Richilieu 2009 (Pro 2590 R) PTHIO_087
2 0.45 0.96 Forage 0 0 Hay 0 0
3.5 6.2 23 20
0.012 0.017 0.25 0.25
0.012 0.014 0.45 0.44
< 0.01 < 0.01 < 0.05 < 0.05
0.014 0.018 0.12 0.13
< 0.01 < 0.01 < 0.05 < 0.05
Parent (vines): 4.9 Total (vines): 4.9 Parent (hay): 22 Total (hay): 22
Canada, St. Marc-sur-Richilieu 2009 (Pro 2590 R) PTHIO_087
2 0.45 0.23 Forage 0 0 Hay 0 0
6.1 6.6 26 39
0.04 0.033 0.42 0.46
0.029 0.03 0.56 0.63
0.017 0.017 0.08 0.094
0.028 0.028 0.17 0.19
0.014 0.015 < 0.05 0.064
Parent (vines): 6.4 Total (vines): 6.4 Parent (hay): 33 Total (hay): 33

Penthiopyrad
1562
Location, Year (variety) Reference
Application DAT Residues, mg/kg Selected residue mg/kg a n kg
ai/ha kg ai/hL
parent PAM PCA 753-A-OH 753-F-DO
DM-PCA
Canada, Branchton 2009 (RCAT Mirra) PTHIO_087
2 0.45 0.22 Forage 0 0 Hay 0 0
17 14 39 55
0.054 0.045 0.87 0.7
0.052 0.049 0.71 0.56
0.03 0.03 0.18 0.16
0.029 0.022 4.5 0.38
0.01 < 0.01 0.1 0.058
Parent (vines): 16 Total (vines): 16 Parent (hay): 47 Total (hay): 48
Canada, Paris 2009 (91M41) PTHIO_087
2 0.44 0.22 Forage 0 0 Hay 0 0
22 18 73 73
0.052 0.051 0.091 0.091
0.054 0.046 0.87 0.77
0.035 0.027 0.23 0.19
0.034 0.031 4.0 5.4
0.018 0.015 0.11 0.12
Parent (vines): 20 Total (vines): 20 Parent (hay): 73 Total (hay): 73
Canada, Paris 2009 (DeKalb 2707R2) PTHIO_087
2 0.48 0.24 Forage 0 0 Hay 0 0
27 20 103 94
0.13 0.095 1.9 1.7
0.1 0.081 1.5 1.3
0.12 0.078 0.33 0.3
0.048 0.037 3.4 3.3
0.033 0.027 0.15 0.16
Parent (vines): 24 Total (vines): 24 Parent (hay): 99 Total (hay): 102
a mean of replicate samples (if applicable); total residue based on the edible portion DAT: days after final treatment
Table 110 Residues in barley forage following foliar application of penthiopyrad
Location, Year (variety) Reference
Application DAT Residues, mg/kg Selected residue mg/kg b
n kg ai/ha
kg ai/hL
parent PAM PCA 753-A-OH
753-F-DO
DM-PCA
UK, Aingers Green 2007 (Flagon) PTHIO_078
2 0.25 0.1 0a 0 7 15 21 28
0.14 3.9 1.0 0.39 0.24 0.48
< 0.05 < 0.05 < 0.05 < 0.05 < 0.05 < 0.05
< 0.05 < 0.05 < 0.05 < 0.05 < 0.05 < 0.05
< 0.05 < 0.05 < 0.05 < 0.05 < 0.05 < 0.05
< 0.05 < 0.05 < 0.05 < 0.05 < 0.05 < 0.05
< 0.05 < 0.05 < 0.05 < 0.05 < 0.05 < 0.05
UK, Tranent 2007 (Oxbridge) PTHIO_078
2 0.26 0.25
0.1 0.1
0a 0 7 14 21 28
0.079 4.4 0.75 0.4 0.17 0.13
< 0.05 < 0.05 < 0.05 < 0.05 < 0.05 < 0.05
< 0.05 < 0.05 < 0.05 < 0.05 < 0.05 < 0.05
< 0.05 < 0.05 < 0.05 < 0.05 < 0.05 < 0.05
< 0.05 < 0.05 < 0.05 < 0.05 < 0.05 < 0.05
< 0.05 < 0.05 < 0.05 < 0.05 < 0.05 < 0.05

Penthiopyrad
1563
Location, Year (variety) Reference
Application DAT Residues, mg/kg Selected residue mg/kg b
n kg ai/ha
kg ai/hL
parent PAM PCA 753-A-OH
753-F-DO
DM-PCA
UK, Harwich 2008 (Flagon) PTHIO_078
2 0.25 0.1 0a 0 7 14 21 28
0.11 1.9 1.2 0.75 0.91 0.42
< 0.05 < 0.05 < 0.05 < 0.05 0.083 < 0.05
< 0.05 < 0.05 0.06 0.05 0.13 0.084
< 0.05 < 0.05 < 0.05 < 0.05 < 0.05 0.05
< 0.05 < 0.05 < 0.05 < 0.05 < 0.05 < 0.05
< 0.05 < 0.05 < 0.05 < 0.05 < 0.05 < 0.05
2 0.24 0.1 0a 0 7 14 21 28
< 0.05 1.8 0.56 0.31 0.23 0.095
< 0.05 < 0.05 0.061 0.069 0.096 < 0.05
< 0.05 < 0.05 0.079 0.069 0.16 0.071
< 0.05 < 0.05 < 0.05 < 0.05 0.063 < 0.05
< 0.05 < 0.05 < 0.05 < 0.05 < 0.05 < 0.05
< 0.05 < 0.05 < 0.05 < 0.05 < 0.05 < 0.05
Germany, Motterwitz 2008 (Laverda) PTHIO_078
2 0.26 (SC)
0.1 0a 0 7 14 21 28
0.12 3.8 2.4 0.65 0.46 0.46
< 0.05 < 0.05 0.066 < 0.05 < 0.05 < 0.05
< 0.05 < 0.05 0.094 < 0.05 0.063 0.068
< 0.05 < 0.05 < 0.05 < 0.05 0.081 0.083
< 0.05 < 0.05 < 0.05 < 0.05 < 0.05 < 0.05
< 0.05 < 0.05 < 0.05 < 0.05 < 0.05 < 0.05
2 0.26 0.25 (EC)
0.1 0.1
0a 0 7 14 21 28
< 0.05 1.9 2.0 0.48 0.21 0.27
< 0.05 < 0.05 0.13 0.064 0.077 < 0.05
< 0.05 < 0.05 0.15 0.063 0.099 0.096
< 0.05 < 0.05 < 0.05 0.09 0.12 0.11
< 0.05 < 0.05 0.077 < 0.05 < 0.05 < 0.05
< 0.05 < 0.05 < 0.05 < 0.05 < 0.05 < 0.05
2 0.24 0.23 (SC)
0.1 0.1
0a 0 7 14 21 28
0.16 2.9 1.7 0.58 0.25 0.20
< 0.05 < 0.05 0.11 0.057 < 0.05 < 0.05
< 0.05 < 0.05 0.061 0.05 < 0.05 0.065
< 0.05 < 0.05 < 0.05 < 0.05 < 0.05 0.052
< 0.05 < 0.05 0.05 < 0.05 < 0.05 < 0.05
< 0.05 < 0.05 < 0.05 < 0.05 < 0.05 < 0.05
2 0.26 0.25 (SC)
0.1 0.1
0a 0 7 14 21 28
0.15 2.7 2.2 0.55 0.48 0.37
< 0.05 < 0.05 0.083 < 0.05 < 0.05 < 0.05
< 0.05 < 0.05 0.058 < 0.05 0.05 0.058
< 0.05 < 0.05 < 0.05 < 0.05 0.081 0.081
< 0.05 < 0.05 0.051 < 0.05 < 0.05 < 0.05
< 0.05 < 0.05 < 0.05 < 0.05 < 0.05 < 0.05
France (South), St Martin le Chatel 2008 (Platine) PTHIO_078
2 0.25 0.24 (SC)
0.1 0.1
0a 0 7 14 21 28
0.2 3.6 0.82 0.34 0.083 0.095
< 0.05 < 0.05 < 0.05 < 0.05 < 0.05 < 0.05
< 0.05 < 0.05 < 0.05 < 0.05 < 0.05 < 0.05
< 0.05 < 0.05 < 0.05 < 0.05 < 0.05 < 0.05
< 0.05 < 0.05 < 0.05 < 0.05 < 0.05 < 0.05
< 0.05 < 0.05 < 0.05 < 0.05 < 0.05 < 0.05
2 0.25 0.24 (EC)
0.1 0.1
0a 0 7 14 21 28
0.12 3.8 0.33 0.089 < 0.05 < 0.05
< 0.05 < 0.05 < 0.05 < 0.05 < 0.05 < 0.05
< 0.05 < 0.05 < 0.05 < 0.05 < 0.05 < 0.05
< 0.05 < 0.05 < 0.05 < 0.05 < 0.05 < 0.05
< 0.05 < 0.05 < 0.05 < 0.05 < 0.05 < 0.05
< 0.05 < 0.05 < 0.05 < 0.05 < 0.05 < 0.05

Penthiopyrad
1564
Location, Year (variety) Reference
Application DAT Residues, mg/kg Selected residue mg/kg b
n kg ai/ha
kg ai/hL
parent PAM PCA 753-A-OH
753-F-DO
DM-PCA
France (South), St Jean de Niost 2008 (Ketos) PTHIO_078
2 0.24 0.25 (SC)
0.1 0.1
0a 0 7 14 21 28
0.069 2.8 0.63 0.24 0.12 0.095
< 0.05 < 0.05 < 0.05 < 0.05 < 0.05 < 0.05
< 0.05 < 0.05 < 0.05 < 0.05 < 0.05 < 0.05
< 0.05 < 0.05 < 0.05 < 0.05 < 0.05 < 0.05
< 0.05 < 0.05 < 0.05 < 0.05 < 0.05 < 0.05
< 0.05 < 0.05 < 0.05 < 0.05 < 0.05 < 0.05
2 0.24 0.25 (EC)
0.1 0.1
0a 0 7 14 21 28
< 0.05 3.4 0.49 0.16 0.059 0.064
< 0.05 < 0.05 0.059 0.05 < 0.05 < 0.05
< 0.05 < 0.05 < 0.05 < 0.05 < 0.05 < 0.05
< 0.05 < 0.05 < 0.05 < 0.05 < 0.05 < 0.05
< 0.05 < 0.05 < 0.05 < 0.05 < 0.05 < 0.05
< 0.05 < 0.05 < 0.05 < 0.05 < 0.05 < 0.05
a before last treatment b: mean of replicate samples (if applicable); total residue based on the edible portion DAT: days after final treatment
Table 111 Residues in barley hay following foliar application of penthiopyrad
Location, Year (variety) Reference
Application DAT Residues, mg/kg Selected residue mg/kg a n kg
ai/ha kg ai/hL
parent PAM PCA 753-A-OH
753-F-DO
DM-PCA
Canada, Branchton 2009 (481-6R) PTHIO_079
2 0.35 0.34
0.17 0.17
Hay 0 0
11 12
0.88 1.0
0.65 0.83
0.24 0.27
0.15 0.12
< 0.05 < 0.05
Parent: 8.2 Total: 9.7
USA (ND), Carrington 2009 (Pinnacle) PTHIO_079
2 0.37 0.36
0.2 0.19
Hay 0 0
7.2 6.8
0.49 0.46
0.33 0.31
0.2 0.28
0.12 0.17
< 0.05 < 0.05
Parent: 12 Total: 13
Canada, Carberry 2009 (CDC Bold) PTHIO_079
2 0.35 0.16 Hay 0 0
39 41
0.85 0.72
0.43 0.35
0.12 0.1
2.0 0.51
< 0.05 < 0.05
Parent: 7 Total: 7.9
Canada, Justice 2009 (CDC Bold) PTHIO_079
2 0.35 0.16 Hay 0 0
33 35
1.3 1.2
0.79 0.79
0.13 0.16
2.9 2.4
0.091 0.083
Parent: 40 Total: 41
Canada, Alvena 2009 (Copeland) PTHIO_079
2 0.36 0.35
0.18 0.18
Hay 0 0
23 23
0.67 0.79
0.42 0.58
0.12 0.16
0.09 0.07
< 0.05 < 0.05
Parent: 34 Total: 36
Canada, Wakaw 2009 (Copeland) PTHIO_079
2 0.36 0.35
0.18 0.18
Hay 0 0
30 20
0.64 0.74
0.51 0.53
0.25 0.23
0.19 0.096
< 0.05 < 0.05
Parent: 23 Total: 24

Penthiopyrad
1565
Location, Year (variety) Reference
Application DAT Residues, mg/kg Selected residue mg/kg a n kg
ai/ha kg ai/hL
parent PAM PCA 753-A-OH
753-F-DO
DM-PCA
Canada, Saskatoon 2009 (CDC Copeland) PTHIO_079
2 0.34 0.17 Hay 0 0
17 17
0.082 0.1
0.065 0.099
< 0.05 < 0.05
0.064 < 0.05
< 0.05 < 0.05
Parent: 25 Total: 26
Canada, Waldheim 2009 (CDC Copeland) PTHIO_079
2 0.34 0.17 Hay 0 0
24 31
0.54 0.61
0.22 0.34
0.17 0.19
0.25 0.91
< 0.05 < 0.05
Parent: 17 Total: 17
Canada, Fort Saskatchewan 2009 (Seebee) PTHIO_079
2 0.37 0.36
0.24 Hay 0 0
8.0 9.7
0.5 0.54
0.89 0.99
0.16 0.22
1.3 1.3
0.05 0.052
Parent: 28 Total: 29
Canada, Fort Saskatchewan 2009 (Seebee) PTHIO_079
2 0.36 0.34 Hay 0 0
3.8 3.9
0.18 0.2
0.47 0.46
0.1 0.1
0.55 0.44
< 0.05 < 0.05
Parent: 8.9 Total: 9.8
Canada, Lamont 2009 (Seebee) PTHIO_079
2 0.36 0.24 Hay 0 0
4.9 3.8
0.34 0.26
1.4 1.1
0.25 0.19
0.78 0.79
0.078 0.064
Parent: 3.9 Total: 4.2
Canada, Westlock 2009 (Seebee) PTHIO_079
2 0.36 0.24 Hay 0 0
3.3 1.8
0.21 0.16
0.57 0.44
0.24 0.2
0.47 0.28
0.051 0.056
Parent: 4.4 Total: 4.9
a mean of replicate samples (if applicable); total residue based on the edible portion DAT: days after final treatment
Table 112 Residues in maize forage following foliar application of penthiopyrad
Location, Year (variety) Reference
Application DAT Residues, mg/kg Selected residue mg/kg a
n kg ai/ha
kg ai/hL
parent PAM PCA 753-A-OH
753-F-DO
DM-PCA
USA (NY), North Rose 2009 (DeKalb DKC 46-60) PTHIO_100
4 0.35 0.36 0.36 0.35
0.19 0.19 0.19 0.19
0 0
4.5 5.9
0.053 0.069
0.078 0.11
0.063 0.083
0.023 0.029
< 0.01 < 0.01
Parent: 5.2 Total: 5.3
USA (NC), Seven Springs 2009 (N77-P5) PTHIO_100
4 0.35 0.36 0.34 0.35
0.19 0.28 0.26 0.27
6 6
0.88 0.94
0.05 0.05
0.053 0.053
0.028 0.037
0.036 0.048
0.03 0.035
Parent: 3.4 Total: 3.4

Penthiopyrad
1566
Location, Year (variety) Reference
Application DAT Residues, mg/kg Selected residue mg/kg a
n kg ai/ha
kg ai/hL
parent PAM PCA 753-A-OH
753-F-DO
DM-PCA
Canada, St. George 2009 (38M58 RR) PTHIO_100
4 0.37 0.34 0.35 0.34
0.78 0.72 0.75 0.73
0 0
3.3 3.4
0.015 0.016
0.03 0.03
0.022 0.022
0.015 0.015
< 0.01 < 0.01
Parent: 4.7 Total: 4.7
Canada, Paris 2009 (DeKalb 3826) PTHIO_100
4 0.34 0.37 0.36 0.35
0.17 0.19 0.18 0.18
0 0
4.2 5.2
0.014 0.014
0.021 0.022
< 0.01 < 0.01
0.12 0.11
< 0.01 < 0.01
Parent: 3.6 Total: 3.6
Canada, Paris 2009 (DeKalb 4493) PTHIO_100
4 0.37 0.35 0.35 0.35
0.19 0.18 0.17 0.17
0 0
3.9 3.3
0.013 0.011
0.027 0.021
0.013 < 0.01
0.045 0.032
< 0.01 < 0.01
Parent: 5 Total: 5.1
Canada, St. Marc-sur-Richilieu 2009 (N27B G7/CB/LL) PTHIO_100
4 0.34 0.35 0.35 0.35
0.18 0.18 0.18 0.18
0 0
5.7 4.3
0.035 0.025
0.031 0.022
0.033 0.026
0.024 0.019
< 0.01 < 0.01
Parent: 4.4 Total: 4.4
Canada, Thorndale 2009 (Pioneer R38M57) PTHIO_100
4 0.36 0.37 0.36 0.34
0.18 0.18 0.18 0.17
0 0
4.4 4.4
0.016 0.012
0.022 0.014
< 0.01 < 0.01
0.043 0.043
< 0.01 < 0.01
Parent: 3.7 Total: 3.7
USA (IA), Richland 2009 (Pioneer 34R67) PTHIO_100
4 0.36 0.36 0.34 0.36
0.23 0.24 0.22 0.24
0 0
3.4 4.0
0.014 < 0.01
0.018 0.01
0.016 < 0.01
0.01 < 0.01
< 0.01 < 0.01
Parent: 3.3 Total: 3.4
USA (ND), Gardner 2009 (INT 65085R) PTHIO_100
4 0.36 0.19 0 0
3.2 3.4
0.036 0.04
0.049 0.054
0.036 0.04
0.027 0.029
< 0.01 < 0.01
Parent: 5.2 Total: 5.2
USA (KS), Gardner 2009 (6464 VT3) PTHIO_100
4 0.35 0.35 0.36 0.36
0.24 0.24 0.25 0.25
0 0
5.5 4.9
0.02 0.025
0.035 0.041
0.028 0.027
0.053 0.049
< 0.01 < 0.01
Parent: 4.2 Total: 4.2
USA (NE), Springfield 2009 (N38-54) PTHIO_100
4 0.37 0.37 0.37 0.35
0.28 0.28 0.28 0.27
0 0
4.5 3.9
0.025 0.027
0.037 0.036
0.026 0.023
0.035 0.033
< 0.01 < 0.01
Parent: 2.9 Total: 3.0

Penthiopyrad
1567
Location, Year (variety) Reference
Application DAT Residues, mg/kg Selected residue mg/kg a
n kg ai/ha
kg ai/hL
parent PAM PCA 753-A-OH
753-F-DO
DM-PCA
USA (MN), Rice 2009 (DKC 41-63) PTHIO_100
4 0.36 0.19 0 0
2.8 2.9
0.068 0.065
0.075 0.063
0.038 0.038
0.019 0.016
< 0.01 < 0.01
Parent: 7.3 Total: 7.3
USA (OH), Richwood 2009 (Shur Grow 686 UT3) PTHIO_100
4 0.35 0.21 0a 0a 0 0 3 3 7 7 10 10
2.5 0.8 8.6 5.9 3.2 3.3 1.4 1.4 2.6 1.1
0.047 0.023 0.05 0.037 0.18 0.19 0.054 0.054 0.066 0.032
0.073 0.042 0.1 0.057 0.2 0.22 0.11 0.1 0.17 0.097
0.03 0.014 0.036 0.038 0.15 0.17 0.041 0.036 0.076 0.036
0.026 0.014 0.027 0.024 0.039 0.045 0.04 0.034 0.098 0.054
< 0.01 < 0.01 < 0.01 < 0.01 < 0.01 < 0.01 0.01 < 0.01 0.018 < 0.01
Parent: 4.8 Total: 4.9
USA (TX), Uvalde 2009 (DK69) PTHIO_100
4 0.35 0.34 0.35 0.35
0.15 0.15 0.25 0.25
0 0
4.1 5.4
0.1 0.1
0.08 0.08
0.17 0.15
< 0.01 < 0.01
< 0.01 < 0.01
Parent: 5.2 Total: 5.3
a mean of replicate samples (if applicable); total residue based on the edible portion DAT: days after final treatment
Table 113 Residues in sorghum forage following foliar application of penthiopyrad
Location, Year (variety) Reference
Application DAT Residues, mg/kg Selected residue mg/kg a
n kg ai/ha
kg ai/hL
parent PAM PCA 753-A-OH
753-F-DO
DM-PCA
USA (LA), Cheneyville 2009 (Dyna Gro 780B) PTHIO_079
2 0.34 0.36
0.18 0.19
0 0
8.6 6.8
0.11 0.068
0.043 0.037
0.13 0.08
0.12 0.086
< 0.01 < 0.01
Parent: 7.7 Total: 7.9
USA (IA), Richland 2009 (Pioneer 8500) PTHIO_079
2 0.34 0.35
0.72 0.74
0 0
3.8 3.1
0.086 0.054
0.06 0.055
0.093 0.055
0.04 0.024
< 0.01 < 0.01
Parent: 3.5 Total: 3.6
USA (NE), York 2009 (NC+ 6B50) PTHIO_079
2 0.34 0.18 0 0
6.7 5.3
0.095 0.062
0.051 0.04
0.07 0.042
0.05 0.041
< 0.01 < 0.01
Parent: 6 Total: 6.1
USA (GA), Chula 2009 (Pioneer 84G62) PTHIO_079
2 0.36 0.35
0.18 0.19
0 0
6.5 7.2
0.051 0.052
0.032 0.042
0.034 0.039
0.13 0.12
< 0.01 < 0.01
Parent: 6.9 Total: 6.9

Penthiopyrad
1568
Location, Year (variety) Reference
Application DAT Residues, mg/kg Selected residue mg/kg a
n kg ai/ha
kg ai/hL
parent PAM PCA 753-A-OH
753-F-DO
DM-PCA
USA (TX), Uvalde 2009 (A571) PTHIO_079
2 0.36 0.26 0 0
6.8 6.1
0.14 0.12
0.071 0.059
0.21 0.16
0.015 0.014
< 0.01 < 0.01
Parent: 6.5 Total: 6.7
USA (TX), Raymondville 2009 (DKS 3707) PTHIO_079
2 0.37 0.2 0 0
6.8 7.7
0.099 0.12
0.076 0.085
0.15 0.18
0.028 0.033
< 0.01 < 0.01
Parent: 7.3 Total: 7.5
USA (ND), Jamestown 2009 (8500) PTHIO_079
2 0.36 0.19 0 0
14 14
0.072 0.064
0.041 0.036
0.035 0.034
0.27 0.24
< 0.01 < 0.01
Parent: 14 Total: 14
USA (TX), Whitharral 2009 (DeKalb 44 Bronze) PTHIO_079
2 0.35 0.19 0 0
5.6 7.5
0.093 0.11
0.056 0.069
0.071 0.098
0.026 0.033
< 0.01 < 0.01
Parent: 6.6 Total: 6.7
USA (KS), Larned 2009 (DK 537-07) PTHIO_079
2 0.35 0.36
0.2 0.22
0 0
3.9 3.9
0.018 0.019
0.02 0.023
0.014 0.014
0.035 0.043
< 0.01 < 0.01
Parent: 3.9 Total: 3.9
b mean of replicate samples (if applicable); total residue based on the edible portion DAT: days after final treatment
Table 114 Residues in wheat forage following foliar application of penthiopyrad
Location, Year (variety) Reference
Application DAT Residues, mg/kg Selected residue mg/kg b
n kg ai/ha
kg ai/hL
parent PAM PCA 753-A-OH
753-F-DO
DM-PCA
UK, Colchester 2007 (Istabraq) PTHIO_077
2 0.25 0.1 0a 0 7 14 21 28
0.02 2.1 0.57 0.54 0.53 0.23
< 0.05 < 0.05 < 0.05 < 0.05 0.05 < 0.05
< 0.05 < 0.05 < 0.05 < 0.05 0.055 < 0.05
< 0.05 < 0.05 < 0.05 < 0.05 < 0.05 0.051
< 0.05 < 0.05 < 0.05 < 0.05 < 0.05 < 0.05
< 0.05 < 0.05 < 0.05 < 0.05 < 0.05 < 0.05
UK, Peaston 2007 (Robigus) PTHIO_077
2 0.24 0.25
0.1 0.1
0a 0 7 14 21 28
0.03 3.7 0.63 0.21 0.17 0.11
< 0.05 < 0.05 < 0.05 < 0.05 < 0.05 < 0.05
< 0.05 < 0.05 < 0.05 < 0.05 < 0.05 0.058
< 0.05 < 0.05 < 0.05 < 0.05 < 0.05 0.054
< 0.05 < 0.05 < 0.05 < 0.05 < 0.05 < 0.05
< 0.05 < 0.05 < 0.05 < 0.05 < 0.05 < 0.05
UK, Peaston 2008 (Consort) PTHIO_077
2 0.25 (SC)
0.1 0a 0 7 14 21 28
0.13 4.7 0.33 0.22 0.18 0.14
< 0.05 < 0.05 < 0.05 < 0.05 < 0.05 < 0.05
< 0.05 < 0.05 < 0.05 < 0.05 < 0.05 < 0.05
< 0.05 < 0.05 < 0.05 < 0.05 < 0.05 < 0.05
< 0.05 < 0.05 < 0.05 < 0.05 < 0.05 < 0.05
< 0.05 < 0.05 < 0.05 < 0.05 < 0.05 < 0.05

Penthiopyrad
1569
Location, Year (variety) Reference
Application DAT Residues, mg/kg Selected residue mg/kg b
n kg ai/ha
kg ai/hL
parent PAM PCA 753-A-OH
753-F-DO
DM-PCA
2 0.25 0.26 (EC)
0.1 0.1
0a 0 7 14 21 28
0.02 4.9 0.21 0.21 0.14 0.079
< 0.05 < 0.05 < 0.05 < 0.05 < 0.05 < 0.05
< 0.05 < 0.05 < 0.05 < 0.05 < 0.05 0.052
< 0.05 < 0.05 < 0.05 < 0.05 < 0.05 0.051
< 0.05 < 0.05 < 0.05 < 0.05 < 0.05 < 0.05
< 0.05 < 0.05 < 0.05 < 0.05 < 0.05 < 0.05
2 0.26 0.27 (SC)
0.1 0.1
0a 0 7 14 21 28
0.15 4.7 0.38 0.24 0.18 0.12
< 0.05 < 0.05 < 0.05 < 0.05 < 0.05 < 0.05
< 0.05 < 0.05 < 0.05 < 0.05 < 0.05 < 0.05
< 0.05 < 0.05 < 0.05 < 0.05 < 0.05 < 0.05
< 0.05 < 0.05 < 0.05 < 0.05 < 0.05 < 0.05
< 0.05 < 0.05 < 0.05 < 0.05 < 0.05 < 0.05
2 0.25 (SC)
0.1 0a 0 7 14 21 28
0.18 5.2 0.6 0.25 0.18 0.14
< 0.05 < 0.05 < 0.05 < 0.05 < 0.05 < 0.05
< 0.05 < 0.05 < 0.05 < 0.05 < 0.05 < 0.05
< 0.05 < 0.05 < 0.05 < 0.05 < 0.05 < 0.05
< 0.05 < 0.05 < 0.05 < 0.05 < 0.05 < 0.05
< 0.05 < 0.05 < 0.05 < 0.05 < 0.05 < 0.05
Germany, Motterwitz 2008 (Inspiration) PTHIO_077
2 0.26 0.24 (SC)
0.1 0.1
0a 0 7 14 21 28
0.66 3.9 0.58 0.25 0.18 0.067
< 0.05 < 0.05 < 0.05 < 0.05 < 0.05 < 0.05
< 0.05 < 0.05 < 0.05 < 0.05 < 0.05 0.075
< 0.05 < 0.05 < 0.05 < 0.05 < 0.05 0.089
< 0.05 < 0.05 < 0.05 < 0.05 < 0.05 < 0.05
< 0.05 < 0.05 < 0.05 < 0.05 < 0.05 < 0.05
2 0.26 0.24 (EC)
0.1 0.1
0a 0 7 14 21 28
0.12 2.6 0.17 0.063 < 0.05 < 0.05
0.08 0.075 0.069 0.05 0.054 < 0.05
< 0.05 < 0.05 < 0.05 < 0.05 < 0.05 < 0.05
< 0.05 < 0.05 < 0.05 < 0.05 < 0.05 0.063
< 0.05 < 0.05 < 0.05 < 0.05 < 0.05 < 0.05
< 0.05 < 0.05 < 0.05 < 0.05 < 0.05 < 0.05
2 0.25 (SC)
0.1 0a 0 7 14 21 28
0.42 3.5 0.5 0.14 0.09 < 0.05
< 0.05 < 0.05 0.05 < 0.05 < 0.05 < 0.05
< 0.05 < 0.05 < 0.05 < 0.05 < 0.05 < 0.05
< 0.05 < 0.05 < 0.05 < 0.05 < 0.05 < 0.05
< 0.05 < 0.05 < 0.05 < 0.05 < 0.05 < 0.05
< 0.05 < 0.05 < 0.05 < 0.05 < 0.05 < 0.05
2 0.26 (SC)
0.1 0a 0 7 14 21 28
1.1 5.6 0.94 0.22 0.15 0.1
< 0.05 < 0.05 0.051 < 0.05 0.05 < 0.05
< 0.05 < 0.05 < 0.05 < 0.05 < 0.05 < 0.05
< 0.05 < 0.05 < 0.05 < 0.05 < 0.05 0.061
< 0.05 < 0.05 < 0.05 < 0.05 < 0.05 < 0.05
< 0.05 < 0.05 < 0.05 < 0.05 < 0.05 < 0.05
France (South), St Trivier-sur-Moignans 2008 (Aubusson) PTHIO_077
2 0.25 (SC)
0.1 0a 0 7 14 21 28
< 0.05 4.2 0.15 0.12 0.067 0.059
< 0.05 < 0.05 < 0.05 < 0.05 < 0.05 < 0.05
< 0.05 < 0.05 < 0.05 < 0.05 < 0.05 < 0.05
< 0.05 < 0.05 < 0.05 < 0.05 < 0.05 < 0.05
< 0.05 < 0.05 < 0.05 < 0.05 < 0.05 < 0.05
< 0.05 < 0.05 < 0.05 < 0.05 < 0.05 < 0.05

Penthiopyrad
1570
Location, Year (variety) Reference
Application DAT Residues, mg/kg Selected residue mg/kg b
n kg ai/ha
kg ai/hL
parent PAM PCA 753-A-OH
753-F-DO
DM-PCA
2 0.25 (EC)
0.1 0a 0 7 14 21 28
< 0.05 4.1 0.24 0.057 0.061 < 0.05
< 0.05 < 0.05 < 0.05 < 0.05 < 0.05 < 0.05
< 0.05 < 0.05 < 0.05 < 0.05 < 0.05 < 0.05
< 0.05 < 0.05 < 0.05 < 0.05 < 0.05 < 0.05
< 0.05 < 0.05 < 0.05 < 0.05 < 0.05 < 0.05
< 0.05 < 0.05 < 0.05 < 0.05 < 0.05 < 0.05
2 0.25 0.24 (SC)
0.1 0.1
0a 0 7 14 21 28
< 0.05 3.9 0.13 0.06 0.054 < 0.05
< 0.05 < 0.05 < 0.05 < 0.05 < 0.05 < 0.05
< 0.05 < 0.05 < 0.05 < 0.05 < 0.05 < 0.05
< 0.05 < 0.05 < 0.05 < 0.05 < 0.05 < 0.05
< 0.05 < 0.05 < 0.05 < 0.05 < 0.05 < 0.05
< 0.05 < 0.05 < 0.05 < 0.05 < 0.05 < 0.05
2 0.25 (SC)
0.1 0a 0 7 14 21 28
< 0.05 3.6 0.18 0.08 0.05 < 0.05
< 0.05 < 0.05 < 0.05 < 0.05 < 0.05 < 0.05
< 0.05 < 0.05 < 0.05 < 0.05 < 0.05 < 0.05
< 0.05 < 0.05 < 0.05 < 0.05 < 0.05 < 0.05
< 0.05 < 0.05 < 0.05 < 0.05 < 0.05 < 0.05
< 0.05 < 0.05 < 0.05 < 0.05 < 0.05 < 0.05
France (South), St Martin le Chatel 2008 (Aubusson) PTHIO_077
2 0.25 (SC)
0.1 0a 0 7 14 21 28
0.07 2.5 0.29 0.18 0.13 0.093
< 0.05 < 0.05 < 0.05 < 0.05 < 0.05 < 0.05
< 0.05 < 0.05 < 0.05 < 0.05 < 0.05 < 0.05
< 0.05 < 0.05 < 0.05 < 0.05 < 0.05 < 0.05
< 0.05 < 0.05 < 0.05 < 0.05 < 0.05 < 0.05
< 0.05 < 0.05 < 0.05 < 0.05 < 0.05 < 0.05
2 0.25 (EC)
0.1 0a 0 7 14 21 28
< 0.05 2.9 0.18 0.13 0.081 0.065
< 0.05 < 0.05 < 0.05 < 0.05 < 0.05 < 0.05
< 0.05 < 0.05 < 0.05 < 0.05 < 0.05 < 0.05
< 0.05 < 0.05 < 0.05 < 0.05 < 0.05 < 0.05
< 0.05 < 0.05 < 0.05 < 0.05 < 0.05 < 0.05
< 0.05 < 0.05 < 0.05 < 0.05 < 0.05 < 0.05
USA (GA), Chula 2009 (Pioneer 26RG1) PTHIO_079
2 0.36 0.35
0.18 0.18
Forage 0 0 Hay 0 0
7.6 7.6 15 18
0.37 0.34 2.1 2.9
0.14 0.14 1.1 1.2
0.28 0.28 0.67 0.74
0.02 0.017 0.058 0.067
0.012 0.01 < 0.05 < 0.05
Parent (forage): 7.6 Total (forage): 8.3 Parent (hay): 17 Total (hay): 21
USA (MO), Fisk 2009 (Coker 9663) PTHIO_077
2 0.36 0.19 Forage 0 0 Hay 0 0
8.8 8.1 17 21
0.11 0.11 0.46 0.45
0.064 0.071 0.3 0.32
0.086 0.09 0.16 0.17
0.028 0.027 0.071 0.071
< 0.01 < 0.01 < 0.05 < 0.05
Parent (forage): 8.5 Total (forage): 8.7 Parent (hay): 19 Total (hay): 20

Penthiopyrad
1571
Location, Year (variety) Reference
Application DAT Residues, mg/kg Selected residue mg/kg b
n kg ai/ha
kg ai/hL
parent PAM PCA 753-A-OH
753-F-DO
DM-PCA
Canada, Branchton 2009 (Surge) PTHIO_079
2 0.36 0.35
0.18 0.18
Forage 0 0 Hay 0 0
5.5 5.7 7.8 7.5
0.11 0.11 0.97 0.83
0.066 0.072 0.9 0.75
0.067 0.071 0.24 0.19
< 0.01 0.012 0.072 0.07
< 0.01 < 0.01 < 0.05 < 0.05
Parent (forage): 5.6 Total (forage): 5.8 Parent (hay): 7.7 Total (hay): 9.3
USA (ND), Northwood 2009 (Divide) PTHIO_079
2 0.36 0.19 Forage 0 0 Hay 0 0
14 14 9.2 13
0.42 0.39 0.76 0.84
0.34 0.3 0.53 0.7
0.51 0.44 0.3 0.45
< 0.01 < 0.01 < 0.05 0.056
0.01 < 0.01 < 0.05 < 0.05
Parent (forage): 14 Total (forage): 15 Parent (hay): 11 Total (hay): 13
USA (KS), Gardner 2009 (Winter Hawk) PTHIO_079
2 0.36 0.25 Forage 0 0 Hay 0 0
10 10 37 33
0.059 0.059 0.33 0.35
0.041 0.042 0.18 0.18
0.041 0.044 0.22 0.21
0.029 0.028 0.16 0.16
< 0.01 < 0.01 < 0.05 < 0.05
Parent (forage): 10 Total (forage): 10 Parent (hay): 35 Total (hay): 36
USA (TX), Uvalde 2009 (Fannin) PTHIO_079
2 0.36 0.35
0.26 0.25
Forage 0 0 Hay 0 0
5.1 6.1 12 16
0.32 0.29 1.1 1.1
0.22 0.19 0.61 0.73
0.23 0.23 0.83 0.7
0.01 0.012 < 0.05 < 0.05
< 0.01 < 0.01 < 0.05 < 0.05
Parent (forage): 5.6 Total (forage): 6.2 Parent (hay): 14 Total (hay): 16
USA (ND), Carrington 2009 (Glenn) PTHIO_079
2 0.35 0.36
0.75 0.76
Forage 0 0 Hay 0 0
13 15 14 10
0.05 0.053 0.3 0.24
0.04 0.035 0.23 0.17
0.021 0.017 0.28 0.18
< 0.01 < 0.01 0.13 0.12
< 0.01 < 0.01 < 0.05 < 0.05
Parent (forage): 14 Total (forage): 14 Parent (hay): 12 Total (hay): 13
USA (ND), Velva 2009 (Fuller) PTHIO_079
2 0.36 0.35
0.32 0.31
Forage 0 0 Hay 0 0
17 14 43 32
0.16 0.15 0.64 0.61
0.11 0.1 0.41 0.43
0.094 0.094 0.4 0.39
0.012 0.013 0.055 0.064
0.01 0.013 < 0.05 < 0.05
Parent (forage): 16 Total (forage): 16 Parent (hay): 38 Total (hay): 39

Penthiopyrad
1572
Location, Year (variety) Reference
Application DAT Residues, mg/kg Selected residue mg/kg b
n kg ai/ha
kg ai/hL
parent PAM PCA 753-A-OH
753-F-DO
DM-PCA
USA (NE), Grand Island 2009 (Traverse HRS) PTHIO_079
2 0.34 0.18 Forage 0 0 Hay 0 0
12 13 31 25
0.049 0.042 0.78 0.77
0.037 0.039 0.79 0.75
0.026 0.02 0.46 0.42
0.024 0.025 0.15 0.16
< 0.01 < 0.01 < 0.05 < 0.05
Parent (forage): 13 Total (forage): 13 Parent (hay): 28 Total (hay): 29
Canada, Dundurn 2009 (Infinity) PTHIO_079
2 0.35 0.18 Forage 0a 0a 0 0 4 4 7 7 11 11 Hay 0 0
2.0 1.9 16 17 6.3 5.2 3.8 4.4 2.0 2.1 52 53
0.069 0.061 0.074 0.073 0.62 0.44 0.71 0.64 0.45 0.56 0.42 0.4
0.048 0.045 0.051 0.055 0.19 0.16 0.14 0.15 0.08 0.099 0.26 0.28
0.056 0.062 0.053 0.078 0.68 0.56 0.45 0.63 0.21 0.3 0.16 0.18
0.031 0.026 0.043 0.034 0.079 0.054 0.1 0.059 0.042 0.043 0.25 0.26
< 0.01 < 0.01 < 0.01 < 0.01 0.012 0.011 0.01 0.01 < 0.01 < 0.01 < 0.05 < 0.05
Parent (forage): 17 Total (forage): 17 Parent (hay): 53 Total (hay): 53
Canada, Vanscoy 2009 (AC Lillian) PTHIO_079
2 0.35 0.21 Forage 0 0 Hay 0 0
10 11 26 24
0.21 0.22 0.85 0.95
0.072 0.075 0.43 0.49
0.11 0.11 0.49 0.1
0.032 0.033 0.099 0.1
< 0.01 < 0.01 < 0.05 < 0.05
Parent (forage): 11 Total (forage): 11 Parent (hay): 25 Total (hay): 27
Canada, Taber 2009 (Supurb) PTHIO_079
2 0.34 0.23 Forage 0 0 Hay 0 0
7.6 6.4 16 22
0.13 0.14 0.39 0.48
0.089 0.091 0.15 0.18
0.074 0.077 0.11 0.085
0.013 0.012 0.073 0.09
< 0.01 < 0.01 < 0.05 < 0.05
Parent (forage): 7 Total (forage): 7.3 Parent (hay): 19 Total (hay): 20
USA (OK), Hinton 2009 (Endurance) PTHIO_079
2 0.36 0.28 Forage 0 0 Hay 0 0
7.2 10 22 24
0.17 0.15 0.51 0.55
0.072 0.078 0.58 0.68
0.066 0.091 0.16 0.19
0.029 0.038 0.73 0.69
< 0.01 < 0.01 < 0.05 < 0.05
Parent (forage): 8.6 Total (forage): 8.9 Parent (hay): 23 Total (hay): 24

Penthiopyrad
1573
Location, Year (variety) Reference
Application DAT Residues, mg/kg Selected residue mg/kg b
n kg ai/ha
kg ai/hL
parent PAM PCA 753-A-OH
753-F-DO
DM-PCA
USA (OK), Hydro 2009 (OK Bullet) PTHIO_079
2 0.36 0.35
0.18 0.16
Forage 0 0 Hay 0 0
13 12 42 46
0.21 0.15 1.4 1.3
0.11 0.11 1.7 1.2
0.077 0.076 0.28 0.21
0.044 0.038 1.5 2.1
< 0.01 < 0.01 0.051 0.05
Parent (forage): 13 Total (forage): 13 Parent (hay): 44 Total (hay): 47
USA (KS), Larned 2009 (Jagger) PTHIO_079
2 0.35 0.36
0.19 0.19
Forage 0 0 Hay 0 0
6.0 4.9 12 14
0.029 0.025 0.093 0.09
0.034 0.026 0.12 0.12
0.025 0.02 0.06 0.075
< 0.01 < 0.01 < 0.05 < 0.05
< 0.01 < 0.01 < 0.05 < 0.05
Parent (forage): 5.5 Total (forage): 5.5 Parent (hay): 13 Total (hay): 13
USA (TX), Olton 2009 (T2M 111) PTHIO_079
2 0.36 0.35
0.23 0.23
Forage 0 0 Hay 0 0
10 8.5 21 23
0.14 0.11 0.38 0.42
0.092 0.093 0.29 0.35
0.079 0.072 0.22 0.21
0.027 0.032 0.072 0.068
< 0.01 < 0.01 < 0.05 < 0.05
Parent (forage): 9.3 Total (forage): 9.5 Parent (hay): 22 Total (hay): 23
USA (WA), Ephrata 2009 (Nick) PTHIO_079
2 0.36 0.18 Forage 0 0 Hay 0 0
13 12 24 33
0.065 0.063 0.59 0.56
0.04 0.03 0.57 0.64
0.03 0.04 0.35 0.32
0.02 0.02 0.07 0.082
< 0.01 < 0.01 < 0.05 < 0.05
Parent (forage): 13 Total (forage): 13 Parent (hay): 29 Total (hay): 30
Canada, Carberry 2009 (AC Domain) PTHIO_079
2 0.35 0.16 Forage 0 0 Hay 0 0
8.6 11 26 29
0.11 0.11 0.51 0.55
< 0.01 0.067 0.35 0.3
0.087 0.086 0.12 0.14
0.042 0.047 1.1 0.31
< 0.01 < 0.01 < 0.05 < 0.05
Parent (forage): 9.8 Total (forage): 10 Parent (hay): 28 Total (hay): 28
Canada, Justice 2009 (AC Domain) PTHIO_079
2 0.35 0.14 Forage 0 0 Hay 0 0
11 12 27 27
0.1 0.12 0.66 0.77
0.067 0.075 0.55 0.58
0.06 0.063 0.093 0.095
0.035 0.035 1.5 2.3
< 0.01 < 0.01 < 0.05 < 0.05
Parent (forage): 12 Total (forage): 12 Parent (hay): 27 Total (hay): 28

Penthiopyrad
1574
Location, Year (variety) Reference
Application DAT Residues, mg/kg Selected residue mg/kg b
n kg ai/ha
kg ai/hL
parent PAM PCA 753-A-OH
753-F-DO
DM-PCA
Canada, Alvena 2009 (Infinity) PTHIO_079
2 0.36 0.35
0.18 0.18
Forage 0 0 Hay 0 0
14 13 29 29
0.19 0.18 0.76 0.87
0.048 0.048 0.59 0.65
0.11 0.11 0.15 0.19
0.08 0.076 0.2 0.19
< 0.01 < 0.01 < 0.05 < 0.05
Parent (forage): 14 Total (forage): 14 Parent (hay): 29 Total (hay): 31
Canada, Waldheim 2009 (AC Elsa) PTHIO_079
2 0.35 0.34
0.18 0.17
Forage 0 0 Hay 0 0
9.2 7.9 34 24
0.11 0.11 0.63 0.59
0.06 0.061 0.2 0.19
0.047 0.053 0.12 0.1
0.026 0.028 0.28 0.25
< 0.01 < 0.01 < 0.05 < 0.05
Parent (forage): 8.6 Total (forage): 8.8 Parent (hay): 29 Total (hay): 30
Canada, Blaine Lake 2009 (Infinity) PTHIO_079
2 0.34 0.33
0.17 0.17
Forage 0 0 Hay 0 0
12 11 27 33
0.013 0.013 0.1 0.094
0.011 < 0.01 0.11 0.098
0.015 0.012 < 0.05 < 0.05
0.018 0.012 0.24 0.24
< 0.01 < 0.01 < 0.05 < 0.05
Parent (forage): 12 Total (forage): 12 Parent (hay): 30 Total (hay): 30
Canada, Fort Saskatchewan 2009 (Harvest) PTHIO_079
2 0.36 0.24 Forage 0 0 Hay 0 0
8.6 9.5 6.2 6.5
0.084 0.082 0.37 0.46
0.051 0.055 0.7 0.73
0.064 0.07 0.24 0.32
0.016 0.014 1.0 0.99
< 0.01 < 0.01 0.05 0.05
Parent (forage): 9.1 Total (forage): 0.20 Parent (hay): 6.4 Total (hay): 7.1
Canada, Fort Saskatchewan 2009 (Harvest) PTHIO_079
2 0.36 0.24 Forage 0 0 Hay 0 0
8.2 11 5.2 4.2
0.088 0.13 0.57 0.55
0.048 0.061 0.89 0.97
0.094 0.11 0.59 0.69
0.017 0.023 0.71 0.62
< 0.01 < 0.01 0.11 0.083
Parent (forage): 9.6 Total (forage): 9.8 Parent (hay): 4.7 Total (hay): 5.7
Canada, Lamont 2009 (Harvest) PTHIO_079
2 0.37 0.35
0.24 0.24
Forage 0 0 Hay 0 0
12 14 5.1 3.9
0.17 0.19 0.34 0.34
0.081 0.087 0.62 0.56
0.16 0.2 0.45 0.45
0.023 0.032 0.67 0.59
< 0.01 < 0.01 0.053 0.05
Parent (forage): 13 Total (forage): 13 Parent (hay): 4.5 Total (hay): 5.1

Penthiopyrad
1575
Location, Year (variety) Reference
Application DAT Residues, mg/kg Selected residue mg/kg b
n kg ai/ha
kg ai/hL
parent PAM PCA 753-A-OH
753-F-DO
DM-PCA
Canada, Westlock 2009 (Emagine) PTHIO_079
2 0.36 0.24 Forage 0 0 Hay 0 0
11 9.5 6.9 7.9
0.072 0.073 0.38 0.4
0.038 0.039 0.61 0.68
0.043 0.046 0.25 0.27
0.064 0.064 0.81 0.96
< 0.01 < 0.01 0.052 0.066
Parent (forage): 10 Total (forage): 10 Parent (hay): 7.4 Total (hay): 8.1
a before last treatment b mean of replicate samples (if applicable); total residue based on the edible portion DAT: days after final treatment
Table 115 Residues in barley straw following foliar application of penthiopyrad
Location, Year (variety) Reference
Application DAT Residues, mg/kg Selected residue mg/kg a
n kg ai/ha
kg ai/hL
parent PAM PCA 753-A-OH
753-F-DO
DM-PCA
UK, Aingers Green 2007 (Flagon) PTHIO_078
2 0.25 0.1 36 0.68 < 0.05 0.066 < 0.05 < 0.05 < 0.05
UK, Tranent 2007 (Oxbridge) PTHIO_078
2 0.26 0.25
0.1 0.1
49 0.15 < 0.05 < 0.05 < 0.05 < 0.05 < 0.05
Germany, Machern 2007 (Naomi) PTHIO_078
2 0.25 0.1 54 0.28 < 0.05 0.095 < 0.05 < 0.05 < 0.05
UK, Kennoway 2007 (Rebecca) PTHIO_078
2 0.26 0.1 45 0.051 < 0.05 < 0.05 < 0.05 < 0.05 < 0.05
UK, Harwich 2008 (Flagon) PTHIO_078
2 0.25 0.1 47 0.92 0.072 0.27 0.098 < 0.05 < 0.05
2 0.24 0.1 47 0.28 0.088 0.41 0.12 < 0.05 < 0.05
Germany, Motterwitz 2008 (Laverda) PTHIO_078
2 0.26 (SC)
0.1 37 0.35 < 0.05 0.067 0.07 < 0.05 < 0.05
2 0.26 0.25 (EC)
0.1 0.1
37 0.15 < 0.05 0.098 0.094 < 0.05 < 0.05
2 0.24 0.23 (SC)
0.1 0.1
37 0.34 < 0.05 0.092 0.08 < 0.05 < 0.05

Penthiopyrad
1576
Location, Year (variety) Reference
Application DAT Residues, mg/kg Selected residue mg/kg a
n kg ai/ha
kg ai/hL
parent PAM PCA 753-A-OH
753-F-DO
DM-PCA
2 0.26 0.25 (SC)
0.1 0.1
37 0.36 < 0.05 0.092 0.11 < 0.05 < 0.05
Hungary, Velence 2008 (Nelly) PTHIO_078
2 0.24 0.26 (SC)
0.1 0.1
34 0.19 < 0.05 0.063 < 0.05 < 0.05 < 0.05
2 0.25 0.24 (EC)
0.1 0.1
34 0.17 < 0.05 0.081 < 0.05 < 0.05 < 0.05
2 0.24 0.25 (SC)
0.1 0.1
34 0.28 < 0.05 0.054 < 0.05 < 0.05 < 0.05
2 0.24 0.25 (SC)
0.1 0.1
34 0.16 < 0.05 0.05 < 0.05 < 0.05 < 0.05
France (North), Senlis le Sec 2008 (Sebastian) PTHIO_078
2 0.24 0.25 (SC)
0.1 0.1
60 0.084 < 0.05 < 0.05 < 0.05 < 0.05 < 0.05
2 0.24 0.25 (EC)
0.1 0.1
60 0.22 < 0.05 0.055 < 0.05 < 0.05 < 0.05
2 0.24 0.25 (SC)
0.1 0.1
60 0.57 < 0.05 0.063 0.052 < 0.05 < 0.05
2 0.25 (SC)
0.1 0.1
60 0.16 < 0.05 < 0.05 < 0.05 < 0.05 < 0.05
France (South), Charontonnay 2008 (Caravan) PTHIO_078
2 0.24 0.26 (SC)
0.1 0.1
42 < 0.05 < 0.05 0.051 < 0.05 < 0.05 < 0.05
2 0.25 0.26 (EC)
0.1 0.1
42 0.058 < 0.05 0.082 < 0.05 < 0.05 < 0.05
2 0.24 0.26 (SC)
0.1 0.1
42 0.11 < 0.05 0.062 < 0.05 < 0.05 < 0.05
2 0.25 0.26 (SC)
0.1 0.1
42 0.13 < 0.05 0.058 < 0.05 < 0.05 < 0.05
Hungary, Velence 2008 (Nelly) PTHIO_078
2 0.24 0.26 (SC)
0.1 0.1
34 0.25 < 0.05 0.072 < 0.05 < 0.05 < 0.05
2 0.25 (EC)
0.1 34 0.15 < 0.05 0.08 < 0.05 < 0.05 < 0.05

Penthiopyrad
1577
Location, Year (variety) Reference
Application DAT Residues, mg/kg Selected residue mg/kg a
n kg ai/ha
kg ai/hL
parent PAM PCA 753-A-OH
753-F-DO
DM-PCA
2 0.25 0.26 (SC)
0.1 0.1
34 0.13 < 0.05 < 0.05 < 0.05 < 0.05 < 0.05
2 0.25 (SC)
0.1 0.1
34 0.19 < 0.05 0.065 < 0.05 < 0.05 < 0.05
France (South), Pact 2008 (Franzi) PTHIO_078
2 0.24 0.25 (SC)
0.1 0.1
45 < 0.05 < 0.05 < 0.05 < 0.05 < 0.05 < 0.05
2 0.26 (EC)
0.1 45 < 0.05 < 0.05 0.067 < 0.05 < 0.05 < 0.05
France (South), St Martin le Chatel 2008 (Platine) PTHIO_078
2 0.25 0.24 (SC)
0.1 0.1
39 0.11 < 0.05 < 0.05 < 0.05 < 0.05 < 0.05
2 0.25 0.24 (EC)
0.1 0.1
39 < 0.05 < 0.05 0.076 0.05 < 0.05 < 0.05
France (South), St Jean de Niost 2008 (Ketos) PTHIO_078
2 0.24 0.25 (SC)
0.1 0.1
35 0.2 < 0.05 0.051 < 0.05 < 0.05 < 0.05
2 0.24 0.25 (EC)
0.1 0.1
35 0.14 < 0.05 0.088 < 0.05 < 0.05 < 0.05
USA (ND), Northwood 2009 (Pinnacle) PTHIO_079
2 0.36 0.35
0.76 0.74
55 55
0.1 0.11
< 0.05 < 0.05
0.062 0.062
< 0.05 < 0.05
0.064 0.075
< 0.05 < 0.05
Parent: 0.11 Total: 0.2
Canada, Branchton 2009 (481-6R) PTHIO_079
2 0.35 0.34
0.17 0.17
54 54
0.1 0.11
< 0.05 0.05
0.096 0.1
< 0.05 < 0.05
0.21 0.2
< 0.05 0.051
Parent: 0.11 Total: 0.20
USA (ND), Carrington 2009 (Pinnacle) PTHIO_079
2 0.37 0.36
0.2 0.19
62 62
0.12 0.12
< 0.05 < 0.05
< 0.05 < 0.05
0.092 0.079
0.093 0.087
< 0.05 < 0.05
Parent: 0.12 Total: 0.21
Canada, Carberry 2009 (CDC Bold) PTHIO_079
2 0.35 0.16 59 59
0.19 0.19
0.08 0.076
0.15 0.14
< 0.05 < 0.05
0.17 0.16
< 0.05 < 0.05
Parent: 0.19 Total: 0.34
Canada, Justice 2009 (CDC Bold) PTHIO_079
2 0.35 0.16 47 47
0.39 0.4
0.075 0.082
0.15 0.14
< 0.05 < 0.05
0.16 0.17
< 0.05 < 0.05
Parent: 0.40 Total: 0.54

Penthiopyrad
1578
Location, Year (variety) Reference
Application DAT Residues, mg/kg Selected residue mg/kg a
n kg ai/ha
kg ai/hL
parent PAM PCA 753-A-OH
753-F-DO
DM-PCA
Canada, Alvena 2009 (Copeland) PTHIO_079
2 0.36 0.35
0.18 0.18
49 49
0.27 0.21
0.091 0.076
0.16 0.14
< 0.05 < 0.05
0.24 0.2
< 0.05 < 0.05
Parent: 0.24 Total: 0.40
Canada, Wakaw 2009 (Copeland) PTHIO_079
2 0.36 0.35
0.18 0.18
49 49
0.78 0.62
0.17 0.12
0.29 0.22
< 0.05 < 0.05
0.91 0.66
< 0.05 < 0.05
Parent: 0.70 Total: 0.97
Canada, Saskatoon 2009 (CDC Copeland) PTHIO_079
2 0.34 0.17 56 56
0.1 0.12
< 0.05 < 0.05
0.06 0.067
< 0.05 < 0.05
0.086 0.1
< 0.05 < 0.05
Parent: 0.11 Total: 0.20
Canada, Waldheim 2009 (CDC Copeland) PTHIO_079
2 0.34 0.17 53 53
0.34 0.4
0.12 0.14
0.23 0.28
< 0.05 0.058
0.24 0.28
0.068 0.058
Parent: 0.37 Total: 0.61
Canada, Fort Saskatchewan 2009 (Seebee) PTHIO_079
2 0.37 0.36
0.24 69 69
0.48 0.24
0.17 0.1
0.33 0.19
< 0.05 < 0.05
0.46 0.27
< 0.05 < 0.05
Parent: 0.36 Total: 0.61
Canada, Fort Saskatchewan 2009 (Seebee) PTHIO_079
2 0.36 0.34 68 68
0.23 0.22
0.11 0.1
0.23 0.19
< 0.05 < 0.05
0.2 0.11
0.07 0.068
Parent: 0.23 Total: 0.42
Canada, Lamont 2009 (Seebee) PTHIO_079
2 0.36 0.24 55 55
0.21 0.19
0.12 0.11
0.19 0.17
< 0.05 < 0.05
0.23 0.21
< 0.05 0.05
Parent: 0.2 Total: 0.41
Canada, Westlock 2009 (Seebee) PTHIO_079
2 0.36 0.24 60 60
0.32 0.51
0.18 0.25
0.32 0.38
0.077 0.1
0.24 0.37
0.17 0.2
Parent: 0.42 Total: 0.82
a:mean of replicate samples (if applicable); total residue based on the edible portion DAT: days after final treatment

Penthiopyrad
1579
Table 116 Residues in maize stover following foliar application of penthiopyrad
Location, Year (variety) Reference
Application DAT Residues, mg/kg Selected residue mg/kg a
n kg ai/ha kg ai/hL
parent PAM PCA 753-A-OH
753-F-DO
DM-PCA
USA (NY), North Rose 2009 (DeKalb DKC 46-60) PTHIO_100
4 0.35 0.36 0.36 0.35
0.19 0.19 0.19 0.19
7 7
5.3 5.3
0.14 0.15
0.17 0.18
0.096 0.1
0.061 0.069
< 0.01 < 0.01
USA (NC), Seven Springs 2009 (N77-P5) PTHIO_100
4 0.35 0.36 0.34 0.35
0.19 0.28 0.26 0.27
6 6
3.4 3.6
0.17 0.2
0.24 0.29
0.17 0.2
0.22 0.25
0.04 0.04
Canada, St. George 2009 (38M58 RR) PTHIO_100
4 0.37 0.34 0.35 0.34
0.78 0.72 0.75 0.73
8 8
4.1 3.8
0.23 0.18
0.2 0.16
0.18 0.15
0.13 0.095
< 0.01 < 0.01
Canada, Paris 2009 (DeKalb 3826) PTHIO_100
4 0.34 0.37 0.36 0.35
0.17 0.19 0.18 0.18
7 7
3.6 3.4
0.31 0.29
0.21 0.2
0.27 0.26
0.063 0.057
< 0.01 < 0.01
Canada, Paris 2009 (DeKalb 4493) PTHIO_100
4 0.37 0.35 0.35 0.35
0.19 0.18 0.17 0.17
7 7
3.3 4.0
0.17 0.26
0.14 0.2
0.13 0.21
0.092 0.095
< 0.01 < 0.01
Canada, St. Marc-sur-Richilieu 2009 (N27B G7/CB/LL) PTHIO_100
4 0.34 0.35 0.35 0.35
0.18 0.18 0.18 0.18
6 6
9.0 9.2
0.16 0.15
0.34 0.36
0.087 0.078
0.03 0.03
< 0.01 < 0.01
Canada, Thorndale 2009 (Pioneer R38M57) PTHIO_100
4 0.36 0.37 0.36 0.34
0.18 0.18 0.18 0.17
6 6
4.4 3.9
0.15 0.15
0.22 0.22
0.075 0.066
0.079 0.065
< 0.01 < 0.01
USA (IA), Richland 2009 (Pioneer 34R67) PTHIO_100
4 0.36 0.36 0.34 0.36
0.23 0.24 0.22 0.24
7 7
5.7 8.7
0.28 0.4
0.45 0.57
0.13 0.24
< 0.01 0.02
< 0.01 < 0.01
USA (ND), Gardner 2009 (INT 65085R) PTHIO_100
4 0.36 0.19 7 7
3.9 5.2
0.13 0.16
0.16 0.21
0.066 0.097
0.021 0.035
< 0.01 < 0.01

Penthiopyrad
1580
Location, Year (variety) Reference
Application DAT Residues, mg/kg Selected residue mg/kg a
n kg ai/ha kg ai/hL
parent PAM PCA 753-A-OH
753-F-DO
DM-PCA
USA (KS), Gardner 2009 (6464 VT3) PTHIO_100
4 0.35 0.35 0.36 0.36
0.24 0.24 0.25 0.25
6 6
10 8.7
0.51 0.41
0.64 0.52
0.35 0.26
0.47 0.39
< 0.01 < 0.01
USA (NE), Springfield 2009 (N38-54) PTHIO_100
4 0.37 0.37 0.37 0.35
0.28 0.28 0.28 0.27
6 6
3.4 4.5
0.19 0.29
0.39 0.54
0.18 0.32
0.16 0.23
< 0.01 < 0.01
USA (MN), Rice 2009 (DKC 41-63) PTHIO_100
4 0.36 0.19 7 7
5.8 6.2
0.21 0.22
0.35 0.36
0.065 0.075
0.023 0.022
< 0.01 < 0.01
USA (IL), Carlyle 2009 (8G23) PTHIO_100
4 0.36 0.340.37 0.36
0.14 0.27 0.24 0.23
8 8
5.3 2.6
0.17 0.11
0.15 0.12
0.17 0.075
0.04 0.03
< 0.01 < 0.01
USA (TX), Uvalde 2009 (DK69) PTHIO_100
4 0.35 0.34 0.35 0.35
0.15 0.15 0.25 0.25
7 7
2.1 2.6
0.45 0.53
0.39 0.45
0.49 0.24
< 0.01 < 0.01
< 0.01 < 0.01
a mean of replicate samples (if applicable); total residue based on the edible portion DAT: days after final treatment
Table 117 Residues in sorghum stover following foliar application of penthiopyrad
Location, Year (variety) Reference
Application DAT Residues, mg/kg Selected residue mg/kg a
n kg ai/ha
kg ai/hL
parent PAM PCA 753-A-OH
753-F-DO
DM-PCA
USA (LA), Cheneyville 2009 (Dyna Gro 780B) PTHIO_079
2 0.34 0.36
0.18 0.19
30 30
0.37 0.51
< 0.05 0.067
0.091 0.18
< 0.05 0.05
0.081 0.16
< 0.05 0.06
Parent: 0.44 Total: 0.55
USA (IA), Richland 2009 (Pioneer 8500) PTHIO_079
2 0.34 0.35
0.72 0.74
31 31
0.58 0.66
0.061 0.083
0.056 0.067
0.05 0.062
< 0.05 0.05
< 0.05 < 0.05
Parent: 0.62 Total: 0.75
USA (NE), York 2009 (NC+ 6B50) PTHIO_079
2 0.34 0.18 32 32
0.66 0.65
0.082 0.1
0.074 0.091
0.053 0.071
< 0.05 0.05
< 0.05 < 0.05
Parent: 0.66 Total: 0.82

Penthiopyrad
1581
Location, Year (variety) Reference
Application DAT Residues, mg/kg Selected residue mg/kg a
n kg ai/ha
kg ai/hL
parent PAM PCA 753-A-OH
753-F-DO
DM-PCA
USA (GA), Chula 2009 (Pioneer 84G62) PTHIO_079
2 0.36 0.35
0.18 0.19
28 28
6.0 4.9
0.27 0.2
0.29 0.26
0.16 0.13
0.49 0.5
0.12 0.11
Parent: 5.5 Total: 5.9
USA (TX), Uvalde 2009 (A571) PTHIO_079
2 0.36 0.26 28 28
0.19 0.19
0.13 0.12
0.069 0.06
0.053 0.058
< 0.05 < 0.05
< 0.05 < 0.05
Parent: 0.19 Total: 0.42
USA (TX), Raymondville 2009 (DKS 3707) PTHIO_079
2 0.37 0.2 29 29
0.21 0.24
0.15 0.17
0.35 0.35
0.071 0.069
0.05 0.05
< 0.05 < 0.05
Parent: 0.23 Total: 0.52
USA (ND), Jamestown 2009 (8500) PTHIO_079
2 0.36 0.19 31 31
2.8 2.1
0.16 0.13
0.1 0.082
0.12 0.1
0.094 0.083
< 0.05 < 0.05
Parent: 2.5 Total: 2.7
USA (TX), Whitharral 2009 (DeKalb 44 Bronze) PTHIO_079
2 0.35 0.19 29 29
0.32 0.32
0.085 0.081
0.057 0.057
< 0.05 < 0.05
< 0.05 < 0.05
< 0.05 < 0.05
Parent: 0.32 Total: 0.47
USA (KS), Larned 2009 (DK 537-07) PTHIO_079
2 0.35 0.36
0.2 0.22
33 33
0.15 0.12
0.05 < 0.05
0.059 0.051
< 0.05 < 0.05
< 0.05 < 0.05
< 0.05 < 0.05
Parent: 0.14 Total: 0.23
a mean of replicate samples (if applicable); total residue based on the edible portion DAT: days after final treatment
Table 118 Residues in wheat straw following foliar application of penthiopyrad
Location, Year (variety) Reference
Application DAT Residues, mg/kg Selected residue mg/kg a
n kg ai/ha
kg ai/hL
parent PAM PCA 753-A-OH
753-F-DO
DM-PCA
UK, Colchester 2007 (Istabraq) PTHIO_077
2 0.25 0.1 44 0.26 < 0.05 0.076 0.1 < 0.05 < 0.05
UK, Peaston 2007 (Robigus) PTHIO_077
2 0.24 0.25
0.1 0.1
63 0.059 < 0.05 0.058 0.054 < 0.05 < 0.05

Penthiopyrad
1582
Location, Year (variety) Reference
Application DAT Residues, mg/kg Selected residue mg/kg a
n kg ai/ha
kg ai/hL
parent PAM PCA 753-A-OH
753-F-DO
DM-PCA
Germany, Motterwitz 2007 (Schamane) PTHIO_077
2 0.26 0.24
0.1 0.1
44 0.13 < 0.05 0.067 0.082 < 0.05 < 0.05
Hungary, Velence 2007 (GK Kapos) PTHIO_077
2 0.26 0.1 18 2.3 0.17 0.27 0.16 0.071 < 0.05
France (North), Charmée 2007 (Apache) PTHIO_077
2 0.25 0.24
0.1 0.1
44 1.1 < 0.05 0.13 0.39 < 0.05 < 0.05
UK, Peaston 2008 (Consort) PTHIO_077
2 0.25 (SC)
0.1 55 < 0.05 < 0.05 < 0.05 < 0.05 < 0.05 < 0.05
2 0.25 0.26 (EC)
0.1 0.1
55 < 0.05 < 0.05 0.052 0.051 < 0.05 < 0.05
2 0.26 0.27 (SC)
0.1 0.1
55 < 0.05 < 0.05 < 0.05 < 0.05 < 0.05 < 0.05
2 0.25 (SC)
0.1 55 0.05 < 0.05 < 0.05 < 0.05 < 0.05 < 0.05
Germany, Motterwitz 2008 (Inspiration) PTHIO_077
2 0.26 0.24 (SC)
0.1 0.1
60 0.05 < 0.05 0.075 0.089 < 0.05 0.37
2 0.26 0.24 (EC)
0.1 0.1
60 < 0.05 < 0.05 0.12 0.17 < 0.05 0.19
2 0.25 (SC)
0.1 60 < 0.05 < 0.05 0.065 0.077 < 0.05 0.49
2 0.26 (SC)
0.1 60 0.067 < 0.05 0.084 0.16 < 0.05 0.15
Hungary, Kápolnásnyék 2008 (Petur) PTHIO_077
2 0.26 (SC)
0.1 44 0.32 0.086 < 0.05 0.12 < 0.05 < 0.05
2 0.26 (EC)
0.1 44 0.75 < 0.05 0.1 0.15 < 0.05 < 0.05
France (North), Douai 2008 (Bermude) PTHIO_077
2 0.25 (SC)
0.1 58 0.21 < 0.05 < 0.05 0.28 < 0.05 < 0.05
2 0.25 (EC)
0.1 58 0.13 < 0.05 0.14 0.2 < 0.05 0.15
France (South), Charantonnay 2008 (Garcia)
2 0.24 0.25 (SC)
0.1 0.1
49 < 0.05 < 0.05 < 0.05 0.05 < 0.05 < 0.05

Penthiopyrad
1583
Location, Year (variety) Reference
Application DAT Residues, mg/kg Selected residue mg/kg a
n kg ai/ha
kg ai/hL
parent PAM PCA 753-A-OH
753-F-DO
DM-PCA
PTHIO_077 2 0.25 0.25 (EC)
0.1 0.1
49 < 0.05 < 0.05 < 0.05 0.074 < 0.05 < 0.05
2 0.24 0.25 (SC)
0.1 0.1
49 0.062 < 0.05 < 0.05 0.052 < 0.05 < 0.05
2 0.24 0.25 (SC)
0.1 0.1
49 0.077 < 0.05 < 0.05 0.06 < 0.05 < 0.05
France (South), St Jean di Niost 2008 (Aubusson) PTHIO_077
2 0.24 0.25 (SC)
0.1 0.1
43 < 0.05 < 0.05 < 0.05 0.076 < 0.05 < 0.05
2 0.24 (EC)
0.1 43 0.052 < 0.05 < 0.05 0.066 < 0.05 < 0.05
France (South), St Trivier-sur-Moignans 2008 (Aubusson) PTHIO_077
2 0.25 (SC)
0.1 36 0.12 < 0.05 0.05 0.074 < 0.05 < 0.05
2 0.25 (EC)
0.1 36 0.058 < 0.05 0.086 0.063 < 0.05 < 0.05
2 0.25 0.24 (SC)
0.1 0.1
36 0.087 < 0.05 0.055 0.063 < 0.05 < 0.05
2 0.25 (SC)
0.1 36 0.072 < 0.05 0.08 0.05 < 0.05 < 0.05
France (South), St Martin le Chatel 2008 (Aubusson) PTHIO_077
2 0.25 (SC)
0.1 47 0.16 < 0.05 0.05 0.096 < 0.05 < 0.05
2 0.25 (EC)
0.1 47 0.12 < 0.05 0.1 0.15 < 0.05 < 0.05
USA (GA), Chula 2009 (Pioneer 26RG1) PTHIO_079
2 0.36 0.35
0.18 0.18
35 35
0.11 0.16
0.05 0.05
0.13 0.14
< 0.05 < 0.05
0.27 0.29
< 0.05 < 0.05
Parent: 0.14 Total: 0.23
USA (MO), Fisk 2009 (Coker 9663) PTHIO_079
2 0.36 0.19 35 35
0.089 0.1
< 0.05 < 0.05
0.083 0.099
< 0.05 < 0.05
0.19 0.21
< 0.05 0.056
Parent: 0.095 Total: 0.19
Canada, Branchton 2009 (Surge) PTHIO_079
2 0.36 0.35
0.18 0.18
48 48
< 0.05 0.051
< 0.05 < 0.05
0.096 0.11
< 0.05 < 0.05
0.18 0.25
0.051 0.053
Parent: 0.051 Total: 0.14

Penthiopyrad
1584
Location, Year (variety) Reference
Application DAT Residues, mg/kg Selected residue mg/kg a
n kg ai/ha
kg ai/hL
parent PAM PCA 753-A-OH
753-F-DO
DM-PCA
USA (ND), Northwood 2009 (Divide) PTHIO_079
2 0.36 0.19 55 55
< 0.05 < 0.05
< 0.05 < 0.05
< 0.05 < 0.05
< 0.05 < 0.05
< 0.05 < 0.05
< 0.05 < 0.05
Parent: < 0.05 Total: < 0.1
USA (KS), Gardner 2009 (Winter Hawk) PTHIO_079
2 0.36 0.25 41 41
0.1 0.12
< 0.05 0.05
0.084 0.1
< 0.05 < 0.05
0.31 0.35
< 0.05 < 0.05
Parent: 0.11 Total: 0.2
USA (TX), Uvalde 2009 (Fannin) PTHIO_079
2 0.36 0.35
0.26 0.25
42 42
0.34 0.33
0.18 0.2
0.26 0.21
0.11 0.095
0.062 0.05
< 0.05 < 0.05
Parent: 0.34 Total: 0.69
USA (ND), Carrington 2009 (Glenn) PTHIO_079
2 0.35 0.36
0.75 0.76
62 62
0.082 0.086
< 0.05 < 0.05
0.091 0.097
< 0.05 < 0.05
0.14 0.15
< 0.05 < 0.05
Parent: 0.084 Total: 0.18
USA (ND), Velva 2009 (Fuller) PTHIO_079
2 0.36 0.35
0.32 0.31
54 54
< 0.05 < 0.05
< 0.05 < 0.05
0.077 0.11
< 0.05 < 0.05
0.18 0.24
< 0.05 < 0.05
Parent: < 0.05 Total: < 0.1
USA (NE), Grand Island 2009 (Traverse HRS) PTHIO_079
2 0.34 0.18 36 36
< 0.05 0.058
0.05 < 0.05
0.099 0.084
< 0.05 < 0.05
0.34 0.3
< 0.05 < 0.05
Parent: 0.054 Total: 0.15
Canada, Dundurn 2009 (Infinity) PTHIO_079
2 0.35 0.18 62 62
0.23 0.21
0.15 0.15
0.22 0.22
< 0.05 < 0.05
0.39 0.38
0.18 0.15
Parent: 0.22 Total: 0.5
Canada, Vanscoy 2009 (AC Lillian) PTHIO_079
2 0.35 0.21 55 55
0.16 0.21
0.25 0.26
0.4 0.46
< 0.05 < 0.05
1.6 2.2
0.05 0.05
Parent: 0.19 Total: 0.66
Canada, Taber 2009 (Supurb) PTHIO_079
2 0.34 0.23 51 51
0.085 0.034
0.08 < 0.05
0.13 0.062
< 0.05 < 0.05
0.17 0.075
< 0.05 < 0.05
Parent: 0.06 Total: 0.18
USA (OK), Hinton 2009 (Endurance) PTHIO_079
2 0.36 0.28 63 63
0.17 0.18
0.085 0.1
0.12 0.14
< 0.05 < 0.05
0.4 0.48
0.072 0.097
Parent: 0.18 Total: 0.35

Penthiopyrad
1585
Location, Year (variety) Reference
Application DAT Residues, mg/kg Selected residue mg/kg a
n kg ai/ha
kg ai/hL
parent PAM PCA 753-A-OH
753-F-DO
DM-PCA
USA (OK), Hydro 2009 (OK Bullet) PTHIO_079
2 0.36 0.35
0.18 0.16
50 50
0.12 0.1
0.071 0.054
0.11 0.096
< 0.05 < 0.05
0.34 0.28
< 0.05 < 0.05
Parent: 0.11 Total: 0.23
USA (KS), Larned 2009 (Jagger) PTHIO_079
2 0.35 0.36
0.19 0.19
45 45
0.05 0.066
< 0.05 < 0.05
0.059 0.071
< 0.05 < 0.05
0.066 0.086
< 0.05 < 0.05
Parent: 0.058 Total: 0.15
USA (TX), Olton 2009 (T2M 111) PTHIO_079
2 0.36 0.35
0.23 0.23
40 40
0.12 0.12
< 0.05 < 0.05
0.05 0.05
< 0.05 < 0.05
0.12 0.13
< 0.05 < 0.05
Parent: 0.12 Total: 0.21
USA (WA), Ephrata 2009 (Nick) PTHIO_079
2 0.36 0.18 57 57
0.054 0.051
< 0.05 < 0.05
0.072 0.072
< 0.05 < 0.05
0.34 0.37
< 0.05 < 0.05
Parent: 0.053 Total: 0.15
Canada, Carberry 2009 (AC Domain) PTHIO_079
2 0.35 0.16 59 59
0.14 0.14
0.069 0.069
0.14 0.13
< 0.05 < 0.05
0.46 0.42
< 0.05 < 0.05
Parent: 0.14 Total: 0.27
Canada, Justice 2009 (AC Domain) PTHIO_079
2 0.35 0.14 59 59
0.19 0.19
0.07 0.068
0.18 0.17
< 0.05 < 0.05
0.51 0.5
< 0.05 < 0.05
Parent: 0.19 Total: 0.32
Canada, Alvena 2009 (Infinity) PTHIO_079
2 0.36 0.35
0.18 0.18
49 49
0.44 0.3
0.13 0.087
0.2 0.14
< 0.05 < 0.05
0.76 0.57
< 0.05 < 0.05
Parent: 0.37 Total: 0.57
Canada, Waldheim 2009 (AC Elsa) PTHIO_079
2 0.35 0.34
0.18 0.17
53 53
0.25 0.22
0.057 0.052
0.096 0.084
< 0.05 < 0.05
0.49 0.44
< 0.05 < 0.05
Parent: 0.24 Total: 0.34
Canada, Blaine Lake 2009 (Infinity) PTHIO_079
2 0.34 0.33
0.17 0.17
56 56
0.3 0.3
0.07 0.07
0.079 0.084
< 0.05 < 0.05
0.62 0.61
< 0.05 < 0.05
Parent: 0.3 Total: 0.43
Canada, Fort Saskatchewan 2009 (Harvest) PTHIO_079
2 0.36 0.24 69 69
0.14 0.15
0.091 0.096
0.15 0.16
< 0.05 < 0.05
0.28 0.31
< 0.05 < 0.05
Parent: 0.15 Total: 0.32

Penthiopyrad
1586
Location, Year (variety) Reference
Application DAT Residues, mg/kg Selected residue mg/kg a
n kg ai/ha
kg ai/hL
parent PAM PCA 753-A-OH
753-F-DO
DM-PCA
Canada, Fort Saskatchewan 2009 (Harvest) PTHIO_079
2 0.36 0.24 68 68
0.1 0.076
0.1 0.093
0.19 0.17
< 0.05 < 0.05
0.33 0.28
< 0.05 < 0.05
Parent: 0.088 Total: 0.27
Canada, Lamont 2009 (Harvest) PTHIO_079
2 0.37 0.35
0.24 0.24
55 55
0.1 0.092
0.091 0.081
0.14 0.11
< 0.05 < 0.05
0.25 0.22
< 0.05 < 0.05
Parent: 0.096 Total: 0.26
Canada, Westlock 2009 (Emagine) PTHIO_079
2 0.36 0.24 60 60
0.2 0.24
0.1 0.11
0.24 0.21
< 0.05 < 0.05
0.36 0.37
< 0.05 < 0.05
Parent: 0.22 Total: 0.42
a mean of replicate samples (if applicable); total residue based on the edible portion DAT: days after final treatment
Table 119 Residues in sugar beet leaves following foliar and in-furrow application of penthiopyrad
Location, Year (variety) Reference
Application DAT Residues, mg/kg Selected residue mg/kg a
n kg ai/ha
kg ai/hL
parent PAM PCA 753-A-OH
753-F-DO
DM-PCA
USA (ND), Gardner 2009 (Crystal 539 RR) PTHIO_088
2 0.47 0.25 7 7
1.2 0.81
0.19 0.14
0.065 0.052
0.024 0.017
0.016 0.011
0.019 0.014
2 0.47 (i.f.) 0.47
0.67 0.25
7 7
0.65 0.73
0.093 0.1
0.036 0.034
0.012 0.013
< 0.01 < 0.01
0.037 0.029
USA (ND), Northwood 2009 (Betaseed 86RR66) PTHIO_088
2 0.46 0.98 7 7
3.8 3.8
0.13 0.12
0.13 0.11
0.036 0.035
0.03 0.024
< 0.01 < 0.01
2 0.46 (i.f.) 0.45
0.49 0.97
7 7
2.4 2.3
0.072 0.074
0.087 0.084
0.023 0.023
0.019 0.022
0.044 0.048
USA (MN), Geneva 2009 (Beta 4936R) PTHIO_088
2 0.46 0.44
0.27 0.25
7 7
0.74 0.86
0.14 0.15
0.039 0.048
0.01 0.014
0.012 0.012
0.015 0.014
2 0.46 (i.f.) 0.44
0.27 0.25
7 7
0.72 0.53
0.07 0.072
0.025 0.026
< 0.01 < 0.01
< 0.01 < 0.01
0.018 0.02
Canada, Portage la Prairie 2009 (Beta seed) PTHIO_088
2 0.45 0.46
0.21 0.21
7 7
0.18 0.21
0.36 0.34
0.11 0.11
0.05 0.048
< 0.01 < 0.01
0.043 0.051
2 0.45 (i.f.) 0.46
0.2 0.21
7 7
0.37 0.31
0.58 0.65
0.15 0.16
0.07 0.067
< 0.01 < 0.01
0.06 0.066
Canada, Oakville
2 0.46 0.45
0.21 0.2
6 6
4.4 4.0
0.33 0.29
0.088 0.083
0.025 0.022
0.03 0.027
0.03 0.028

Penthiopyrad
1587
Location, Year (variety) Reference
Application DAT Residues, mg/kg Selected residue mg/kg a
n kg ai/ha
kg ai/hL
parent PAM PCA 753-A-OH
753-F-DO
DM-PCA
2009 (Beta seed) PTHIO_088
2 0.45 (i.f.) 0.46
0.2 0.21
6 6
3.7 2.6
0.19 0.19
0.06 0.05
0.017 0.012
0.021 0.024
0.016 0.015
USA (ND), Carrington 2009 (Betaseed 86RR66) PTHIO_088
2 0.46 0.46
0.25 0.12
6 6
2.5 2.5
0.18 0.19
0.097 0.097
0.04 0.038
0.064 0.057
0.026 0.026
2 0.45 (i.f.) 0.46
0.49 0.12
6 6
2.0 2.1
0.083 0.094
0.046 0.051
0.017 0.020
0.041 0.04
0.1 0.13
Canada, Taber 2009 (not reported) PTHIO_088
2 0.46 0.3 8 8
0.74 0.83
0.54 0.68
0.11 0.15
0.086 0.14
< 0.01 < 0.01
0.066 0.067
2 0.44 (i.f.) 0.46
0.15 0.3
8 8
0.17 0.12
0.056 0.043
0.02 0.016
< 0.01 < 0.01
< 0.01 < 0.01
0.046 0.042
USA (TX), Levelland 2009 (Phoenix) PTHIO_088
2 0.45 0.24 8 8
3.5 3.3
0.33 0.27
0.21 0.18
0.12 0.091
0.032 0.032
0.031 0.024
2 0.45 (i.f.) 0.45
0.48 0.24
8 8
1.9 1.6
0.14 0.12
0.089 0.077
0.042 0.038
0.019 0.017
0.054 0.06
USA (CA), Hickman 2009 (Holly SSN B7R) PTHIO_088
2 0.45 0.05 6 6
1.0 1.1
1.0 1.1
0.35 0.39
0.29 0.33
0.018 0.019
0.058 0.061
2 0.46 (i.f.) 0.46
0.05 0.05
6 6
0.91 0.79
0.38 0.37
0.17 0.18
0.15 0.17
0.014 0.012
0.021 0.017
USA (CA), Porterville 2009 (Lockhart Seed Lot 31288) PTHIO_088
2 0.46 0.45
0.18 0.17
8 8
0.13 0.095
0.32 0.44
0.074 0.08
0.02 0.02
0.01 0.01
0.048 0.059
2 0.45 (i.f.) 0.45
0.24 0.17
8 8
0.13 0.086
0.29 0.29
0.078 0.083
0.023 0.015
< 0.01 < 0.01
0.2 0.24
USA (WA), Ephrata 2009 (Prozoo – RR) PTHIO_088
2 0.45 0.24 7 7
0.52 0.45
0.12 0.086
0.029 0.026
0.01 0.01
< 0.01 < 0.01
0.018 0.012
2 0.46 (i.f.) 0.45
0.33 0.24
7 7
0.31 0.33
0.064 0.057
0.021 0.018
< 0.01 < 0.01
< 0.01 < 0.01
0.068 0.065
USA (ID), Jerome 2009 (Roundup Ready BTSCT01 RR07) PTHIO_088
2 0.45 0.22 7 7
0.24 0.26
0.12 0.11
0.037 0.037
0.021 0.025
< 0.01 < 0.01
0.018 0.21
2 0.44 (i.f.) 0.45
0.27 0.22
7 7
0.23 0.28
0.2 0.19
0.039 0.043
0.014 0.02
< 0.01 < 0.01
0.027 0.022
a mean of replicate samples (if applicable); total residue based on the edible portion DAT: days after final treatment i.f. = first treatment in-furrow at sowing

Penthiopyrad
1588
Table 120 Residues in oilseed rape forage following foliar application of penthiopyrad
Location, Year (variety) Reference
Application DAT Residues, mg/kg Selected residue mg/kg a
n kg ai/ha
kg ai/hL
parent PAM PCA 753-A-OH
753-F-DO
DM-PCA
UK, Maldon 2007 (Apex) PTHIO_091
1 0.3 0.12 Plant w/o pods 0a 0 7 14 21 28 Pods 0a 0 7 14 21 28
0.02 7.6 2.4 0.4 0.51 0.14 0.024 2.9 1.2 0.098 0.1 0.13
< 0.01 < 0.01 0.05 0.04 0.04 0.02 < 0.01 < 0.01 0.052 0.04 0.038 0.038
< 0.01 < 0.01 0.03 0.03 0.03 < 0.01 < 0.01 < 0.01 0.016 0.012 0.011 < 0.01
< 0.01 0.02 0.03 < 0.01 < 0.01 < 0.01 < 0.01 0.024 0.025 < 0.01 < 0.01 < 0.01
< 0.01 < 0.01 0.02 < 0.01 < 0.01 < 0.01 < 0.01 < 0.01 0.019 < 0.01 < 0.01 < 0.01
< 0.01 < 0.01 < 0.01 < 0.01 < 0.01 < 0.01 < 0.01 < 0.01 < 0.01 < 0.01 < 0.01 < 0.01
UK, Carberry Mains 2007 (Canberra) PTHIO_091
1 0.29 0.12 Plant w/o pods 0a 0 7 14 21 28 Pods 0a 0 7 14 21 28
< 0.01 0.86 0.37 0.072 0.065 0.05 < 0.01 6.6 1.0 0.12 0.12 0.03
< 0.01 < 0.01 < 0.01 < 0.01 < 0.01 < 0.01 < 0.01 < 0.01 0.035 0.027 0.041 0.015
< 0.01 < 0.01 < 0.01 < 0.01 < 0.01 < 0.01 < 0.01 < 0.01 0.017 0.011 0.02 < 0.01
< 0.01 < 0.01 < 0.01 < 0.01 < 0.01 < 0.01 < 0.01 0.06 0.045 0.01 < 0.01 < 0.01
< 0.01 < 0.01 < 0.01 < 0.01 < 0.01 < 0.01 < 0.01 < 0.01 < 0.01 < 0.01 < 0.01 < 0.01
< 0.01 < 0.01 < 0.01 < 0.01 < 0.01 < 0.01 < 0.01 < 0.01 < 0.01 < 0.01 < 0.01 < 0.01
Hungary, Pázmánd 2008 (Catonic) PTHIO_091
1 0.31 0.12 Plant w/o pods 0a 0 7 14 21 28 Pods 0a 0 7 14 21 28
< 0.01 0.68 0.98 0.074 0.044 0.02 < 0.01 0.87 0.66 < 0.01 0.038 0.02
< 0.01 < 0.01 0.02 < 0.01 < 0.01 < 0.01 < 0.01 < 0.01 0.026 < 0.01 0.041 0.024
< 0.01 < 0.01 0.02 < 0.01 < 0.01 < 0.01 < 0.01 < 0.01 < 0.01 < 0.01 0.026 0.044
< 0.01 < 0.01 0.02 < 0.01 < 0.01 < 0.01 < 0.01 < 0.01 < 0.01 < 0.01 0.042 0.11
< 0.01 < 0.01 < 0.01 < 0.01 < 0.01 < 0.01 < 0.01 < 0.01 0.01 < 0.01 < 0.01 < 0.01
< 0.01 < 0.01 < 0.01 < 0.01 < 0.01 < 0.01 < 0.01 < 0.01 < 0.01 < 0.01 < 0.01 < 0.01

Penthiopyrad
1589
Location, Year (variety) Reference
Application DAT Residues, mg/kg Selected residue mg/kg a
n kg ai/ha
kg ai/hL
parent PAM PCA 753-A-OH
753-F-DO
DM-PCA
France (North), Cavron St. Martin 2008 (Pollen) PTHIO_091
1 0.31 0.12 Plant w/o pods 0a 0 7 14 21 28 Pods 0a 0 7 14 21 28
< 0.01 3.4 0.063 0.03 < 0.01 < 0.01 < 0.01 5.6 0.06 0.014 < 0.01 < 0.01
< 0.01 < 0.01 < 0.01 < 0.01 < 0.01 < 0.01 < 0.01 < 0.01 0.017 0.02 0.019 0.012
< 0.01 < 0.01 < 0.01 < 0.01 < 0.01 < 0.01 < 0.01 < 0.01 < 0.01 < 0.01 < 0.01 < 0.01
< 0.01 < 0.01 < 0.01 < 0.01 < 0.01 < 0.01 < 0.01 0.033 < 0.01 < 0.01 < 0.01 < 0.01
< 0.01 < 0.01 < 0.01 < 0.01 < 0.01 < 0.01 < 0.01 < 0.01 < 0.01 < 0.01 < 0.01 < 0.01
< 0.01 < 0.01 < 0.01 < 0.01 < 0.01 < 0.01 < 0.01 < 0.01 < 0.01 < 0.01 < 0.01 < 0.01
Hungary, Pázmánd 2008 (Catonic) PTHIO_092
1 0.31 0.12 Plant w/o pods 0a 0 7 14 21 28 Pods 0a 0 7 14 21 28
< 0.01 0.99 0.22 0.05 0.05 < 0.01 < 0.01 4.3 0.23 0.14 0.079 0.01
< 0.01 < 0.01 0.05 0.02 0.04 < 0.01 < 0.01 < 0.01 0.024 0.069 0.043 0.013
< 0.01 < 0.01 0.04 0.02 0.051 0.03 < 0.01 < 0.01 < 0.01 0.034 0.097 0.043
< 0.01 < 0.01 < 0.01 < 0.01 < 0.01 < 0.01 < 0.01 0.01 < 0.01 < 0.01 0.03 0.022
< 0.01 < 0.01 0.02 < 0.01 < 0.01 < 0.01 < 0.01 < 0.01 0.028 0.024 0.024 < 0.01
< 0.01 < 0.01 < 0.01 < 0.01 < 0.01 < 0.01 < 0.01 < 0.01 < 0.01 < 0.01 < 0.01 < 0.01
France (North), Cavron St. Martin 2008 (Pollen) PTHIO_092
1 0.31 0.12 Plant w/o pods 0a 0 7 14 21 28 Pods 0a 0 7 14 21 28
< 0.01 6.6 0.64 0.03 0.02 < 0.01 < 0.01 17 0.085 0.019 < 0.01 < 0.01
< 0.01 < 0.01 0.02 0.02 0.02 < 0.01 < 0.01 0.043 0.14 0.092 0.074 0.071
< 0.01 < 0.01 < 0.01 < 0.01 < 0.01 < 0.01 < 0.01 0.037 0.039 0.017 0.013 0.015
< 0.01 0.05 < 0.01 < 0.01 < 0.01 < 0.01 < 0.01 0.16 < 0.01 < 0.01 < 0.01 < 0.01
< 0.01 < 0.01 < 0.01 < 0.01 < 0.01 < 0.01 < 0.01 0.029 0.03 < 0.01 < 0.01 < 0.01
< 0.01 < 0.01 < 0.01 < 0.01 < 0.01 < 0.01 < 0.01 < 0.01 < 0.01 < 0.01 < 0.01 < 0.01

Penthiopyrad
1590
Location, Year (variety) Reference
Application DAT Residues, mg/kg Selected residue mg/kg a
n kg ai/ha
kg ai/hL
parent PAM PCA 753-A-OH
753-F-DO
DM-PCA
UK, Beaston 2008 (Mercant) PTHIO_092
1 0.32 0.12 Plant w/o pods 0a 0 7 14 21 28 Pods 0a 0 7 14 21 28
< 0.01 0.74 0.14 0.065 0.02 < 0.01 < 0.01 5.5 0.35 0.12 0.05 0.023
< 0.01 < 0.01 < 0.01 < 0.01 < 0.01 < 0.01 < 0.01 < 0.01 0.14 0.11 0.067 0.056
< 0.01 < 0.01 < 0.01 < 0.01 < 0.01 < 0.01 < 0.01 < 0.01 0.027 0.023 0.015 0.011
< 0.01 < 0.01 < 0.01 < 0.01 < 0.01 < 0.01 < 0.01 0.048 0.013 < 0.01 < 0.01 < 0.01
< 0.01 < 0.01 < 0.01 < 0.01 < 0.01 < 0.01 < 0.01 < 0.01 0.049 0.03 0.023 0.019
< 0.01 < 0.01 < 0.01 < 0.01 < 0.01 < 0.01 < 0.01 < 0.01 < 0.01 < 0.01 < 0.01 < 0.01
a mean of replicate samples (if applicable); total residue based on the edible portion DAT: days after final treatment
Table 121 Residues in peanut hay following foliar application of penthiopyrad
Location, Year (variety) Reference
Application DAT Residues, mg/kg Selected residue mg/kg a n kg
ai/ha kg ai/hL
parent PAM PCA 753-A-OH
753-F-DO
DM-PCA
USA (VA), Bumpass 2007 (Georgia Green) PTHIO_098
3 0.36 0.37 0.35
0.12 0.12 0.12
14 14
1.8 1.8
0.18 0.19
0.43 0.45
< 0.05 < 0.05
0.23 0.2
< 0.05 < 0.05
Parent: 1.8 Total: 2.1
USA (SC), Blackville 2007 (Georgia Green) PTHIO_098
3 0.35 0.36 0.36
0.11 0.12 0.12
14 14
6.5 7.6
0.81 0.99
0.56 0.66
0.12 0.15
0.45 0.57
< 0.05 0.05
Parent: 7.1 Total: 8.7
USA (NC), Pikeville 2007 (Gregory) PTHIO_098
3 0.35 0.36 0.35
0.15 0.15 0.15
13 13
17 16
0.59 0.6
0.23 0.24
0.21 0.22
0.29 0.28
< 0.05 < 0.05
Parent: 17 Total: 18
USA (GA), Sycamore 2007 (GA-02) PTHIO_098
3 0.36 0.36 0.36
0.19 0.18 0.18
14 14
1.7 1.2
0.11 0.092
< 0.05 < 0.05
< 0.05 < 0.05
0.059 < 0.05
< 0.05 < 0.05
Parent: 1.5 Total: 1.6
3 1.8 1.8 1.8
0.95 0.94 0.95
14 14
not analysed

Penthiopyrad
1591
Location, Year (variety) Reference
Application DAT Residues, mg/kg Selected residue mg/kg a n kg
ai/ha kg ai/hL
parent PAM PCA 753-A-OH
753-F-DO
DM-PCA
USA (GA), Chula 2007 (Georgia Green) PTHIO_098
3 0.36 0.36 0.36
0.18 0.19 0.19
14 14
5.2 5.6
0.23 0.25
0.17 0.2
0.11 0.11
0.054 0.059
< 0.05 < 0.05
Parent: 8.8 Total: 9.4
USA (GA), Quitman 2007 (Georgia Green) PTHIO_098
3 0.36 0.36 0.36
0.18 0.18 0.19
14 14
8.2 9.4
0.32 0.37
0.23 0.25
0.17 0.18
0.089 0.1
< 0.05 < 0.05
Parent: 6.8 Total: 7.9
USA (GA), Athens 2007 (Georgia Green) PTHIO_098
3 0.35 0.36 0.36
0.13 0.13 0.13
14 14
5.7 7.9
0.54 0.65
0.39 0.47
0.17 0.19
0.21 0.25
< 0.05 < 0.05
Parent: 4.5 Total: 4.9
USA (GA), Chula 2007 (GA02C) PTHIO_098
3 0.35 0.09 14 14
4.5 4.4
0.22 0.21
0.078 0.067
< 0.05 < 0.05
0.11 0.094
< 0.05 < 0.05
Parent: 8.6 Total: 9.1
USA (GA), Montezuma 2007 (Georgia Green) PTHIO_098
3 0.36 0.14 14 14
8.5 8.6
0.32 0.32
0.2 0.18
0.075 0.066
0.3 0.29
< 0.05 < 0.05
Parent: 6.9 Total: 7.3
USA (FL), Bradenton 2007 (Georgia Green) PTHIO_098
3 0.37 0.36 0.36
0.08 0.08 0.08
15 15
7.7 6.1
0.25 0.21
0.11 0.087
0.05 < 0.05
0.2 0.15
< 0.05 < 0.05
Parent: 1.9 Total: 2.1
USA (OK), Hinton 2007 (Olin) PTHIO_098
3 0.36 0.35 0.36
0.16 0.16 0.16
15 15
1.5 2.3
0.1 0.14
0.05 0.068
< 0.05 < 0.05
0.058 0.081
< 0.05 < 0.05
Parent: 2.9 Total: 3.6
USA (TX), Charlotte 2007 (TAM RUN OL-1) PTHIO_098
3 0.36 0.15 15 15
2.6 3.2
0.34 0.38
0.14 0.18
< 0.05 < 0.05
0.097 0.14
< 0.05 < 0.05
Parent: 1.8 Total: 2.0
3 1.8 1.8 1.8
0.76 0.760.76
not analysed
USA (TX), Levelland 2007 (TAMSPAN 90) PTHIO_098
3 0.36 0.35 0.36
0.15 0.15 0.15
14 14
1.4 2.1
0.11 0.13
0.14 0.15
0.062 0.069
< 0.05 < 0.05
< 0.05 < 0.05
Parent: 7.1 Total: 8.7
a: mean of replicate samples (if applicable); total residue based on the edible portion DAT: days after final treatment

Penthiopyrad
1592
Table 122 Residues in sunflower forage following foliar application of penthiopyrad
Location, Year (variety) Reference
Application DAT Residues, mg/kg Selected residue mg/kg a
n kg ai/ha
kg ai/hL
parent PAM PCA 753-A-OH
753-F-DO
DM-PCA
Hungary, Pázmánd 2007 (NK Brio) PTHIO_095
2 0.2 0.08 0a 0 7 14 21 28
0.19 1.6 0.35 0.3 0.097 0.16
< 0.05 < 0.05 < 0.05 < 0.05 < 0.05 < 0.05
< 0.05 < 0.05 < 0.05 < 0.05 < 0.05 < 0.05
< 0.05 < 0.05 < 0.05 < 0.05 < 0.05 < 0.05
< 0.05 < 0.05 < 0.05 < 0.05 < 0.05 < 0.05
< 0.05 < 0.05 < 0.05 < 0.05 < 0.05 < 0.05
Germany, Motterwitz 2008 (Sanluka) PTHIO_095
2 0.21 0.08 0a 0 7 14 21 28
< 0.05 2.8 1.5 0.36 0.5 0.38
< 0.05 < 0.05 < 0.05 < 0.05 < 0.05 < 0.05
< 0.05 < 0.05 < 0.05 < 0.05 < 0.05 < 0.05
< 0.05 < 0.05 < 0.05 < 0.05 < 0.05 < 0.05
< 0.05 < 0.05 < 0.05 < 0.05 < 0.05 < 0.05
< 0.05 < 0.05 < 0.05 < 0.05 < 0.05 < 0.05
France (North), Sommere 2008 (LG 54.50) PTHIO_095
2 0.2 0.08 0a 0 7 14 21 28
< 0.05 1.9 0.43 0.72 0.38 0.63
< 0.05 < 0.05 < 0.05 < 0.05 < 0.05 < 0.05
< 0.05 < 0.05 < 0.05 < 0.05 < 0.05 < 0.05
< 0.05 < 0.05 < 0.05 < 0.05 < 0.05 < 0.05
< 0.05 < 0.05 < 0.05 < 0.05 < 0.05 < 0.05
< 0.05 < 0.05 < 0.05 < 0.05 < 0.05 < 0.05
a mean of replicate samples (if applicable); total residue based on the edible portion DAT: days after final treatment
Table 123 Residues in almond hulls following foliar application of penthiopyrad
Location, Year (variety) Reference
Application DAT Residues, mg/kg Selected residue mg/kg a
n kg ai/ha
kg ai/hL
parent PAM PCA 753-A-OH
753-F-DO
DM-PCA
USA (CA), Kerman 2007 (Nonpareil) PTHIO_090
3 0.31 0.03 14 14
1.5 1.9
0.25 0.27
0.28 0.33
0.012 0.038
0.048 0.059
< 0.01 < 0.01
Parent: 1.4 Total: 1.9
USA (CA), Madera 2007 (Padre) PTHIO_090
3 0.31 0.03 14 14
0.99 1.2
0.26 0.33
0.25 0.23
0.039 0.06
0.048 0.06
< 0.01 < 0.01
Parent: 1.1 Total: 1.6
USA (CA), Sanger 2007 (Nonpareil) PTHIO_090
3 0.31 0.31 0.3
0.05 0.05 0.05
14 14
2.6 2.7
0.22 0.25
0.22 0.25
0.04 0.056
0.031 0.037
< 0.01 < 0.01
Parent: 2.7 Total: 3.1
USA (CA), Hickman 2007 (Carmel) PTHIO_090
3 0.31 0.3 0.3
0.02 0.02 0.02
14 14
2.0 2.7
0.3 0.36
0.28 0.38
0.18 0.22
0.057 0.073
< 0.01 < 0.01
Parent: 2.4 Total: 3.0

Penthiopyrad
1593
Location, Year (variety) Reference
Application DAT Residues, mg/kg Selected residue mg/kg a
n kg ai/ha
kg ai/hL
parent PAM PCA 753-A-OH
753-F-DO
DM-PCA
USA (CA), Turlock 2007 (Thompson) PTHIO_090
3 0.31 0.3 0.3
0.03 0.03 0.02
14 14
2.3 1.9
0.45 0.45
0.46 0.42
0.053 0.025
0.088 0.084
< 0.01 < 0.01
Parent: 2.1 Total: 2.9
USA (CA), Terra Bella 2007 (Carmel) PTHIO_090
3 0.31 0.02 14 14
0.53 0.72
0.11 0.14
0.044 0.063
0.16 0.19
0.028 0.042
< 0.01 < 0.01
Parent: 0.68 Total: 0.91
a: mean of replicate samples (if applicable); total residue based on the edible portion DAT: days after final treatment
Table 124 Residues in cotton gin by-products following foliar and in-furrow application of penthiopyrad
Location, Year (variety) Reference
Application DAT Residues, mg/kg Selected residue mg/kg a
n kg ai/ha
kg ai/hL
parent PAM PCA 753-A-OH
753-F-DO
DM-PCA
USA (TX), Edmonson 2009 (DP 924) PTHIO_101
3 0.36 (i.f.) 0.36 0.35
1.3 0.23 0.22
20 20
3.1 4.0
0.65 0.79
0.46 0.57
0.34 0.42
< 0.05 < 0.05
< 0.05 < 0.05
Parent: 3.6 Total: 4.9
USA (TX), Levelland 2009 (FM9063B2F) PTHIO_101
3 0.35 (i.f.) 0.35 0.35
0.37 0.19 0.19
21 21
2.3 2.3
0.37 0.37
0.25 0.24
0.12 0.12
0.051 0.065
< 0.05 < 0.05
Parent: 2.3 Total: 3.0
USA (TX), Wolfforth 2009 (3273B2RF) PTHIO_101
3 0.35 (i.f.) 0.35 0.35
0.37 0.19 0.19
21 21
3.9 2.8
0.56 0.37
0.43 0.29
0.17 0.12
0.077 0.057
< 0.05 < 0.05
Parent: 3.4 Total: 4.2
USA (OK), Hinton 2009 (FM1740B2F) PTHIO_101
3 0.36 (i.f.) 0.36 0.36
0.39 0.18 0.25
19 19
5.8 7.3
0.62 0.73
0.37 0.43
0.35 0.34
0.088 0.1
0.053 0.06
Parent: 6.6 Total: 7.8
a mean of replicate samples (if applicable); total residue based on the edible portion DAT: days after final treatment i.f. = first treatment in-furrow at sowing

Penthiopyrad
1594
FATE OF RESIDUES IN STORAGE AND PROCESSING
Residues after processing
Processing studies are necessary according to the uses and the residues of penthiopyrad on raw agricultural commodities (RAC). The fate of penthiopyrad and its metabolites during processing of RAC was investigated in several major registered crops using important processing procedures.
As a measure for the transfer of residues into processed products, a processing factor was used, which is defined as:
If residues in the RAC were below the LOQ, no processing factor could be derived. In case of residues below the LOQ, but above the LOD in the processed product, the numeric value of the LOQ was used for the calculation. If residues in the processed product were below the LOD, the numeric value of the LOQ was used for the calculation but the PF was expressed as “less than” (e.g. < 0.5).
The calculation of PFs was performed for penthiopyrad and for the sum of penthiopyrad and PAM, expressed as penthiopyrad (referred to as “total”, molecular weight adjustment factor for PAM is 1.86). A summary of all processing factors for penthiopyrad relevant for the estimation of maximum residue levels of the dietary intake is given in Table 137.
Pome fruit
Apple trees in the US were treated with penthiopyrad at rates of 3× 0.3 kg ai/ha. Samples were collected 28 days after harvest and processed into washed fruit, wet pomace, dry pomace, juice, canned fruit, frozen apple slices and apple sauce.
For juicing washed fruits were crushed, steamed and treated with peptic enzyme, pressed, filtered and finally heated and canned. Apple sauce was processed by coring/peeling, cooking, straining through a pulper, cooking with sugar and finally heating and canning. Washed fruits processed into frozen or canned apple slices were cored/peeled and sliced, steam blanched, blended with sugar and packaged and frozen or steamed and canned. Samples for analyses were collected for each of the steps described.
An overview of residues of penthiopyrad and all metabolites found in processed apple products is presented in Table 125.
Table 125 Processing of apples treated with penthiopyrad in the USA with a PHI of 28 days (Shepard, E, 2008, PTHIO_103; values in brackets were extrapolated below the LOQ)
Matrix Penthiopyrad PAM Total PCA 753-A-OH 753-F-DO DM-PCA mg/kg PF mg/kg mg/kg PF mg/kg mg/kg mg/kg mg/kg Test 01, USA (NY), North Rose, 2007, Variety: Ida Red, 3× 0.31 kg ai/ha (0.03 kg ai/hL), PHI 28 days Fruit (RAC) 0.14 – < 0.01
(0.005) 0.16 – < 0.01
(ND) < 0.01 (0.008)
< 0.01 (0.004)
< 0.01 (ND)
Washed fruit 0.082 0.59 < 0.01 (0.003)
0.1 0.63 < 0.01 (ND)
< 0.01 (0.008)
< 0.01 (ND)
< 0.01 (ND)
Pomace, wet 0.71 5.1 < 0.01 (0.008)
0.73 4.6 < 0.01 (ND)
0.019 < 0.01 (0.008)
< 0.01 (ND)
Pomace, dry 1.4 10 0.02 1.4 8.8 < 0.01 (0.008)
0.05 0.02 < 0.01 (ND)
Canned apple juice
< 0.01 (0.006)
0.07 < 0.01 (0.005)
< 0.02 < 0.13 < 0.01 (0.004)
< 0.01 (0.006)
< 0.01 (0.005)
< 0.01 (ND)
Canned fruit < 0.01 (ND)
< 0.07 < 0.01 (ND)
< 0.02 < 0.13 < 0.01 (ND)
< 0.01 (ND)
< 0.01 (ND)
< 0.01 (ND)
Frozen apple slices
< 0.01 (ND)
< 0.07 < 0.01 (ND)
< 0.02 < 0.13 < 0.01 (ND)
< 0.01 (ND)
< 0.01 (ND)
< 0.01 (ND)
Apple sauce < 0.01 < 0.07 < 0.01 < 0.02 < 0.13 < 0.01 < 0.01 < 0.01 < 0.01
PF = Residue in processed product (mg/kg
Residue in raw agricultural commodity (mg/kg

Penthiopyrad
1595
Matrix Penthiopyrad PAM Total PCA 753-A-OH 753-F-DO DM-PCA mg/kg PF mg/kg mg/kg PF mg/kg mg/kg mg/kg mg/kg
(ND) (ND) (ND) (ND) (ND) (ND) Wash water 0.022 0.16 < 0.01
(ND) 0.041 0.26 < 0.01
(ND) < 0.01 (ND)
< 0.01 (ND)
< 0.01 (ND)
Crushed apple 0.25 1.7 < 0.01 (0.006)
0.27 1.7 < 0.01 (ND)
0.013 < 0.01 (0.005)
< 0.01 (ND)
Raw juice < 0.01 (0.007)
0.07 < 0.01 (0.004)
< 0.02 < 0.13 < 0.01 (ND)
< 0.01 (0.005)
< 0.01 (ND)
< 0.01 (ND)
Juice after filtration
< 0.01 (0.006)
0.07 < 0.01 (0.005)
< 0.02 < 0.13 < 0.01 (ND)
< 0.01 (0.005)
< 0.01 (ND)
< 0.01 (ND)
Peeled apple without core
< 0.01 (0.004)
0.07 < 0.01 (ND)
< 0.02 < 0.13 < 0.01 (ND)
< 0.01 (ND)
< 0.01 (ND)
< 0.01 (ND)
Apple core 0.068 0.49 < 0.01 (0.003)
0.087 0.54 < 0.01 (ND)
< 0.01 (0.006)
< 0.01 (ND)
< 0.01 (ND)
Apple peel 0.3 2.1 0.01 0.32 2 < 0.01 (ND)
0.02 < 0.01 (0.009)
< 0.01 (ND)
Peeled, blanched apple without core
< 0.01 (ND)
< 0.07 < 0.01 (ND)
< 0.02 < 0.13 < 0.01 (ND)
< 0.01 (ND)
< 0.01 (ND)
< 0.01 (ND)
Raw applesauce < 0.01 (ND)
< 0.07 < 0.01 (ND)
< 0.02 < 0.13 < 0.01 (ND)
< 0.01 (ND)
< 0.01 (ND)
< 0.01 (ND)
Apple waste < 0.01 (0.003)
0.07 < 0.01 (ND)
< 0.02 < 0.13 < 0.01 (ND)
< 0.01 (ND)
< 0.01 (ND)
< 0.01 (ND)
Test 02, USA (MI), Conklin, 2007, Variety: Ida Red, 3× 0.3 kg ai/ha (0.03 kg ai/hL), PHI 28 days Fruit (RAC) 0.12 - < 0.01
(0.009) 0.14 – < 0.01
(ND) < 0.01 (0.006)
< 0.01 (0.006)
< 0.01 (ND)
Washed fruit 0.084 0.7 < 0.01 (0.006)
0.1 0.71 < 0.01 (ND)
< 0.01 (0.007)
< 0.01 (0.004)
< 0.01 (ND)
Pomace, wet 0.59 4.9 0.01 0.61 4.4 < 0.01 (ND)
0.017 0.014 < 0.01 (ND)
Pomace, dry 0.79 6.6 0.024 0.83 5.9 < 0.01 (0.007)
0.038 0.032 < 0.01 (ND)
Canned apple juice
< 0.01 (0.004)
0.08 < 0.01 (0.006)
< 0.02 < 0.14 < 0.01 (ND)
< 0.01 (0.003)
< 0.01 (ND)
< 0.01 (ND)
Canned fruit < 0.01 (ND)
< 0.08 < 0.01 (ND)
< 0.02 < 0.14 < 0.01 (ND)
< 0.01 (ND)
< 0.01 (ND)
< 0.01 (ND)
Frozen apple slices
< 0.01 (ND)
< 0.08 < 0.01 (ND)
< 0.02 < 0.14 < 0.01 (ND)
< 0.01 (ND)
< 0.01 (ND)
< 0.01 (ND)
Apple sauce < 0.01 (ND)
< 0.08 < 0.01 (ND)
< 0.02 < 0.14 < 0.01 (ND)
< 0.01 (ND)
< 0.01 (ND)
< 0.01 (ND)
Wash water < 0.01 (0.009)
0.08 < 0.01 (ND)
< 0.02 < 0.14 < 0.01 (ND)
< 0.01 (ND)
< 0.01 (ND)
< 0.01 (ND)
Crushed apple 0.15 1.3 < 0.01 (0.007)
0.17 1.2 < 0.01 (ND)
< 0.01 (0.008)
< 0.01 (0.005)
< 0.01 (ND)
Raw juice < 0.01 (0.007)
0.08 < 0.01 (0.005)
< 0.02 < 0.14 < 0.01 (ND)
< 0.01 (0.003)
< 0.01 (ND)
< 0.01 (ND)
Juice after filtration
< 0.01 (0.003)
0.08 < 0.01 (0.004)
< 0.02 < 0.14 < 0.01 (ND)
< 0.01 (ND)
< 0.01 (ND)
< 0.01 (ND)
Peeled apple without core
< 0.01 (ND)
< 0.08 < 0.01 (ND)
< 0.02 < 0.14 < 0.01 (ND)
< 0.01 (ND)
< 0.01 (ND)
< 0.01 (ND)
Apple core 0.08 0.67 < 0.01 (0.005)
0.1 0.71 < 0.01 (ND)
< 0.01 (0.005)
< 0.01 (ND)
< 0.01 (ND)
Apple peel 0.24 2 0.012 0.26 1.9 < 0.01 (ND)
0.01 0.014 < 0.01 (ND)
Peeled, blanched apple without core
< 0.01 (ND)
< 0.08 < 0.01 (ND)
< 0.02 < 0.14 < 0.01 (ND)
< 0.01 (ND)
< 0.01 (ND)
< 0.01 (ND)
Raw applesauce < 0.01 (ND)
< 0.08 < 0.01 (ND)
< 0.02 < 0.14 < 0.01 (ND)
< 0.01 (ND)
< 0.01 (ND)
< 0.01 (ND)
Apple waste < 0.01 (ND)
< 0.08 < 0.01 (ND)
< 0.02 < 0.14 < 0.01 (ND)
< 0.01 (ND)
< 0.01 (ND)
< 0.01 (ND)
Test 03, USA (ID), Weiser, 2007, Variety: Law Rome, 3× 0.31 kg ai/ha (0.03 kg ai/hL), PHI 28 days Fruit (RAC) 0.23 – < 0.01 0.25 – < 0.01 < 0.01 < 0.01 < 0.01 (ND)

Penthiopyrad
1596
Matrix Penthiopyrad PAM Total PCA 753-A-OH 753-F-DO DM-PCA mg/kg PF mg/kg mg/kg PF mg/kg mg/kg mg/kg mg/kg
(0.007) (ND) (0.004) (0.005) Washed fruit 0.12 0.52 < 0.01
(0.005) 0.14 0.56 < 0.01
(ND) < 0.01 (0.003)
< 0.01 (ND)
< 0.01 (ND)
Pomace, wet 1.5 6.5 0.01 1.5 6 < 0.01 (0.003)
0.01 < 0.01 (0.008)
< 0.01 (ND)
Pomace, dry 2.7 12 0.031 2.8 11 0.01 0.022 0.018 < 0.01 (ND) Canned apple juice
0.01 0.04 < 0.01 (0.006)
0.029 0.12 < 0.01 (0.003)
< 0.01 (ND)
< 0.01 (ND)
< 0.01 (ND)
Canned fruit < 0.01 (ND)
< 0.04 < 0.01 (ND)
< 0.02 < 0.08 < 0.01 (ND)
< 0.01 (ND)
< 0.01 (ND)
< 0.01 (ND)
Frozen apple slices
< 0.01 (ND)
< 0.04 < 0.01 (ND)
< 0.02 < 0.08 < 0.01 (ND)
< 0.01 (ND)
< 0.01 (ND)
< 0.01 (ND)
Apple sauce < 0.01 (0.003)
0.04 < 0.01 (ND)
< 0.02 < 0.08 < 0.01 (ND)
< 0.01 (ND)
< 0.01 (ND)
< 0.01 (ND)
Wash water 0.039 0.17 < 0.01 (ND)
0.058 0.23 < 0.01 (ND)
< 0.01 (ND)
< 0.01 (ND)
< 0.01 (ND)
Crushed apple 0.019 0.08 < 0.01 (0.006)
0.038 0.15 < 0.01 (ND)
< 0.01 (0.003)
< 0.01 (ND)
< 0.01 (ND)
Raw juice 0.016 0.07 < 0.01 (0.006)
0.035 0.14 < 0.01 (ND)
< 0.01 (ND)
< 0.01 (ND)
< 0.01 (ND)
Juice after filtration
0.011 0.05 < 0.01 (0.006)
0.02 0.08 < 0.01 (ND)
< 0.01 (ND)
< 0.01 (ND)
< 0.01 (ND)
Peeled apple without core
< 0.01 (ND)
< 0.04 < 0.01 (ND)
< 0.02 < 0.08 < 0.01 (ND)
< 0.01 (ND)
< 0.01 (ND)
< 0.01 (ND)
Apple core 0.081 0.35 < 0.01 (ND)
0.1 0.4 < 0.01 (ND)
< 0.01 (ND)
< 0.01 (ND)
< 0.01 (ND)
Apple peel 1.2 5.2 0.016 1.2 4.8 < 0.01 (0.004)
< 0.01 (0.008)
0.01 < 0.01 (ND)
Peeled, blanched apple without core
< 0.01 (0.004)
0.04 < 0.01 (ND)
< 0.02 < 0.08 < 0.01 (ND)
< 0.01 (ND)
< 0.01 (ND)
< 0.01 (ND)
Raw applesauce < 0.01 (0.005)
0.04 < 0.01 (ND)
< 0.02 < 0.08 < 0.01 (ND)
< 0.01 (ND)
< 0.01 (ND)
< 0.01 (ND)
Apple waste < 0.01 (0.005)
0.04 < 0.01 (ND)
< 0.02 < 0.08 < 0.01 (ND)
< 0.01 (ND)
< 0.01 (ND)
< 0.01 (ND)
ND not detected, LOD: 0.003 mg/kg
Plums
The effect of processing on plums was investigated in two supervised field trials in the USA. Application rates were 3× 0.3 kg ai/ha with a PHI of 0 days. Samples of fruits were collected and processed into pitted plums and pitted dried prunes.
In a first step fresh plums were washed and subsequently hand-pitted into pitted plums. A subsample was air-dried to a moisture content of approx. 32–38% (dried pitted prunes).
An overview of residues of penthiopyrad and all metabolites found in processed apple products is presented in Table 126.
Table 126 Processing of plums treated with penthiopyrad in the USA with a PHI of 0 days (Shepard, E, 2008, PTHIO_105; values in brackets were extrapolated below the LOQ)
Matrix Penthiopyrad PAM Total PCA 753-A-OH 753-F-DO DM-PCA mg/kg PF mg/kg mg/kg PF mg/kg mg/kg mg/kg mg/kg Test 01, USA (MI), Conklin, 2007, Variety: Vision, 3× 0.3 kg ai/ha (0.04 kg ai/hL), PHI 0 days Whole fruit (RAC)
0.12 – < 0.01 (0.003)
0.14 – < 0.01 (ND) < 0.01 (0.003)
< 0.01 (ND) < 0.01 (ND)
Pitted fruit 0.12 1 < 0.01 (0.004)
0.14 1 < 0.01 (ND) < 0.01 (0.004)
< 0.01 (ND) < 0.01 (ND)
Dried pitted 0.18 1.5 < 0.01 0.2 1.4 < 0.01 < 0.01 < 0.01 (ND) < 0.01 (ND)

Penthiopyrad
1597
prune (0.006) (0.009) (0.006) Test 02, USA (CA), Kerman, 2007, Variety: French, 3× 0.3 kg ai/ha (0.02 kg ai/hL), PHI 0 days Whole fruit (RAC)
0.1 – < 0.01 (0.005)
0.12 – < 0.01 (ND) < 0.01 (0.003)
< 0.01 (ND) < 0.01 (ND)
Pitted fruit 0.1 – < 0.01 (0.005)
0.12 1 < 0.01 (ND) < 0.01 (0.003)
< 0.01 (ND) < 0.01 (ND)
Dried pitted prune
0.13 1.3 0.01 0.15 1.3 0.012 < 0.01 (0.005)
< 0.01 (ND) < 0.01 (ND)
ND not detected, LOD: 0.003 mg/kg
Tomatoes
In three supervised field trials conducted in Southern Europe field tomatoes were treated twice with application rates of 1.0 and 3.0 kg ai/ha. Samples of fruits were collected after one day and processed into unprocessed tomatoes, washed tomatoes, washing water, juice, wet pomace, dry pomace, puree, paste, ketchup , and canned tomatoes.
For the preparation of tomato juice the tomatoes were washed, crushed (resulting in raw juice and pomace) and the juice was finally pasteurised.
Tomato paste was processed by first crushing the washed fruits. Subsequently the tomatoes were reduced into raw paste and waste. Finally the raw paste was sterilised.
For tomato ketchup the crushed fruits were also reduced into raw puree and waste. The puree was packaged into jars and sterilised as ketchup.
An overview of residues of penthiopyrad and all metabolites found in processed tomato products is presented in Table 127.
Table 127 Processing of tomatoes treated with penthiopyrad in Southern Europe with a PHI of 1 days (Old, J, 2009, PTHIO_104; values in brackets were extrapolated below the LOQ)
Matrix Penthiopyrad PAM Total PCA 753-A-OH 753-F-DO DM-PCA mg/kg PF mg/kg mg/kg PF mg/kg mg/kg mg/kg mg/kg Italy, Santa Cristina e Bissone, 2007, Variety: Perfect Peel, 1.0 and 3.0 kg ai/ha, PHI: 1 day Fruits (RAC) 0.2 – < 0.01
(ND) 0.22 – < 0.01
(ND) < 0.01 (ND) < 0.01 (ND) < 0.01 (ND)
Washed fruits 0.16 0.8 < 0.01 (ND)
0.18 0.82 < 0.01 (ND)
< 0.01 (ND) < 0.01 (ND) < 0.01 (ND)
Washing water 0.039 0.2 < 0.01 (ND)
0.058 0.26 < 0.01 (ND)
< 0.01 (ND) < 0.01 (ND) < 0.01 (ND)
Juice 0.038 0.19 < 0.01 (ND)
0.057 0.26 < 0.01 (ND)
< 0.01 (ND) < 0.01 (ND) < 0.01 (ND)
Pomace, wet 1.1 5.5 < 0.05 (ND)
1.2 5.5 < 0.05 (ND)
< 0.05 (ND) < 0.05 (ND) < 0.05 (ND)
Pomace, dry 8.5 43 < 0.05 (ND)
8.6 39 < 0.05 (ND)
< 0.05 (ND) < 0.05 (ND) < 0.05 (ND)
Puree 0.41 2.1 < 0.01 (ND)
0.43 2 < 0.01 (ND)
< 0.01 (ND) < 0.01 (ND) < 0.01 (ND)
Paste 0.72 3.6 < 0.01 (ND)
0.74 3.4 0.015 < 0.01 (ND) < 0.01 (ND) < 0.01 (ND)
Ketchup 0.38 1.9 < 0.01 (ND)
0.40 1.8 < 0.01 (ND)
< 0.01 (ND) < 0.01 (ND) < 0.01 (ND)
Canned tomatoes
0.013 0.07 < 0.01 (ND)
0.031 0.14 < 0.01 (ND)
< 0.01 (ND) < 0.01 (ND) < 0.01 (ND)
Spain, Los Palacios, 2007, Variety: Juncal, 1.0 and 3.0 kg ai/ha, PHI: 1 day Fruits (RAC) 0.18 – < 0.01
(ND) 0.20 – < 0.01
(ND) < 0.01 (ND) < 0.01 (ND) < 0.01 (ND)
Washed fruits 0.24 1.3 < 0.01 (ND)
0.26 1.3 < 0.01 (ND)
< 0.01 (ND) < 0.01 (ND) < 0.01 (ND)
Washing water 0.09 0.5 < 0.01 (ND)
0.11 0.55 < 0.01 (ND)
< 0.01 (ND) < 0.01 (ND) < 0.01 (ND)

Penthiopyrad
1598
Matrix Penthiopyrad PAM Total PCA 753-A-OH 753-F-DO DM-PCA mg/kg PF mg/kg mg/kg PF mg/kg mg/kg mg/kg mg/kg Juice 0.048 0.27 < 0.01
(ND) 0.067 0.34 < 0.01
(ND) < 0.01 (ND) < 0.01 (ND) < 0.01 (ND)
Pomace, wet 0.91 5.1 < 0.05 (ND)
1.0 5 < 0.05 (ND)
< 0.05 (ND) < 0.05 (ND) < 0.05 (ND)
Pomace, dry 4.6 26 < 0.05 (0.018)
4.7 24 < 0.05 (0.029)
< 0.05 (ND) < 0.05 (ND) < 0.05 (ND)
Puree 0.27 1.5 < 0.01 (0.004)
0.29 1.5 < 0.01 (0.006)
< 0.01 (ND) < 0.01 (ND) < 0.01 (ND)
Paste < 0.01 (ND)
< 0.06 < 0.01 (ND)
< 0.02 0.1 < 0.01 (ND)
< 0.01 (ND) < 0.01 (ND) < 0.01 (ND)
Ketchup 0.2 1.1 < 0.01 (ND)
0.22 1.1 < 0.01 (0.005)
< 0.01 (ND) < 0.01 (ND) < 0.01 (ND)
Canned tomatoes
< 0.01 (ND)
< 0.06 < 0.01 (ND)
< 0.02 0.1 < 0.01 (ND)
< 0.01 (ND) < 0.01 (ND) < 0.01 (ND)
France (South), Vaunaveys, 2007, Variety: Perfect Peel, 1.0 and 3.0 kg ai/ha, PHI: 1 day Fruits (RAC) 0.2 – < 0.01
(ND) 0.22 – < 0.01
(ND) < 0.01 (ND) < 0.01 (ND) < 0.01 (ND)
Washed fruits 0.16 0.8 < 0.01 (ND)
0.18 0.82 < 0.01 (ND)
< 0.01 (ND) < 0.01 (ND) < 0.01 (ND)
Washing water 0.1 0.5 < 0.01 (ND)
0.12 0.55 < 0.01 (ND)
< 0.01 (ND) < 0.01 (ND) < 0.01 (ND)
Juice 0.094 0.47 < 0.01 (ND)
0.11 0.5 < 0.01 (ND)
< 0.01 (ND) < 0.01 (ND) < 0.01 (ND)
Pomace, wet 0.85 5 < 0.05 (ND)
0.94 4.3 < 0.05 (ND)
< 0.05 (ND) < 0.05 (ND) < 0.05 (ND)
Pomace, dry 8.1 41 < 0.05 (0.025)
9.0 41 < 0.05 (ND)
< 0.05 (ND) < 0.05 (ND) < 0.05 (ND)
Puree 0.43 2.2 < 0.01 (0.006)
0.45 2.0 < 0.01 (0.005)
< 0.01 (ND) < 0.01 (ND) < 0.01 (ND)
Paste 0.76 3.8 0.013 0.78 3.5 0.021 < 0.01 (ND) < 0.01 (ND) < 0.01 (ND) Ketchup 0.19 0.95 < 0.01
(ND) 0.21 0.95 < 0.01
(ND) < 0.01 (ND) < 0.01 (ND) < 0.01 (ND)
Canned tomatoes
0.071 0.36 < 0.01 (ND)
0.08 0.36 < 0.01 (ND)
< 0.01 (ND) < 0.01 (ND) < 0.01 (ND)
ND not detected, LOD: 0.003 mg/kg for all commodities except for pomace (0.017 mg/kg)
Soya beans
In the USA two supervised field trials were conducted at exaggerated rates to investigate the influence of processing on penthiopyrad residues in soya beans. Both trials were conducted with application rates of 2× 2.3 kg ai/ha with a PHI of 6 or 14 days.
The seeds were harvested and processed into meal, hulls and refined oil using common processing techniques.
An overview of residues of penthiopyrad and all metabolites found in processed soya bean products is presented in Table 128.
Table 128 Processing of soya bean treated with penthiopyrad in the USA with a PHI of 6 or 14 days (Shepard, E, 2010, PTHIO_106; values in brackets were extrapolated below the LOQ)
Matrix Penthiopyrad PAM Total PCA 753-A-OH 753-F-DO DM-PCA mg/kg PF mg/kg mg/kg PF mg/kg mg/kg mg/kg mg/kg USA (IL), Carlyle, 2009, Variety: S43-N6, 2× 2.3 kg ai/ha, PHI: 6 days Seed (RAC) 0.42 – < 0.01
(0.008) 0.44 – < 0.01
(0.008) 0.012 0.013 < 0.01 (ND)
Meal < 0.05 (ND)
< 0.12 < 0.05 (ND)
< 0.1 0.23 < 0.05 (ND)
< 0.05 (ND)
< 0.05 (ND) < 0.05 (ND)
Hulls 0.21 0.5 < 0.05 (ND)
0.30 0.44 < 0.05 (ND)
< 0.05 (ND)
< 0.05 (ND) < 0.05 (ND)

Penthiopyrad
1599
Matrix Penthiopyrad PAM Total PCA 753-A-OH 753-F-DO DM-PCA mg/kg PF mg/kg mg/kg PF mg/kg mg/kg mg/kg mg/kg Refined oil 0.025 0.06 < 0.01
(ND) 0.044 0.1 < 0.01
(ND) < 0.01 (ND)
< 0.01 (ND) < 0.01 (ND)
USA (MO), Tipton, 2009, Variety: 48-24 Mor Soy, 2× 2.3 kg ai/ha, PHI: 14 days Seed (RAC) 0.057 – 0.01 0.073 – 0.012 < 0.01
(ND) < 0.01 (ND) < 0.01 (0.004)
Meal < 0.05 (ND)
< 0.88 < 0.05 (ND)
< 0.1 < 1.4 < 0.05 (ND)
< 0.05 (ND)
< 0.05 (ND) < 0.05 (ND)
Hulls 0.25 4.4 < 0.05 (0.02)
0.34 4.7 < 0.05 (ND)
< 0.05 (ND)
< 0.05 (ND) < 0.05 (ND)
Refined oil 0.11 1.9 < 0.01 (ND)
0.13 1.8 < 0.01 (ND)
< 0.01 (ND)
< 0.01 (ND) < 0.01 (ND)
ND not detected, LOD: 0.003 mg/kg for seed and oil, LOD: 0.02 mg/kg for meal and hulls
Potatoes
In the USA two field trials were conducted involving different modes of application to potatoes intended for processing. Each trial consisted of two plots which were either treated “in-furrow” at planting, followed by two foliar applications shortly before harvest or with three foliar sprays. All treatments were conducted with application rates of 1.8 kg ai/ha. One sample of potato tubers following each of the applications was collected after 7 days for further processing.
The raw potato samples were processed into washed tubers, cull tubers, steam-peeled tubers, trim waste/wet peel, abrasion-peeled tubers, potato flakes, potato chips, unpeeled French fries, peeled fries, unpeeled boiled potatoes, peeled boiled potatoes and unpeeled microwaved potatoes.
All processing steps, except boiling and microwaving of potatoes, were performed using common industrial practice. Boiled and peeled potatoes were hand-cooked and hand-peeled.
An overview of residues of penthiopyrad and all metabolites found in processed potato products is presented in Table 129.
Table 129 Processing of potatoes treated with penthiopyrad in the USA with a PHI of 7 days (Rice F, 2009, PTHIO_107; values in brackets were extrapolated below the LOQ)
Matrix Penthiopyrad PAM Total PCA 753-A-OH 753-F-DO DM-PCA mg/kg PF mg/kg mg/kg PF mg/kg mg/kg mg/kg mg/kg USA (ID), Payettet, 2008, Variety: Ranger Russet, 3× 1.8 kg ai/ha, PHI: 7 days Tubers (RAC) 0.025 – < 0.01
(ND) 0.044 – < 0.01
(0.006) < 0.01 (ND) < 0.01
(0.003) 0.01
Washed tubers 0.03 1.2 < 0.01 (ND)
0.049 1.1 < 0.01 (0.009)
< 0.01 (ND) < 0.01 (0.005)
0.011
Cull tubers 0.03 1.2 < 0.01 (ND)
0.049 1.1 0.013 < 0.01 (ND) < 0.01 (0.008)
0.01
Steam-peeled tubers
< 0.01 (0.004)
0.4 < 0.01 (ND)
< 0.02 < 0.45 < 0.01 (0.005)
< 0.01 (ND) < 0.01 (0.003)
< 0.01 (0.006)
Trim waste/ wet waste (steam peeling)
0.084 3.4 < 0.01 (ND)
0.10 2.3 < 0.01 (ND) < 0.01 (ND) < 0.01 (0.005)
< 0.01 (ND)
Abrasion-peeled potatoes
< 0.01 (ND)
< 0.4 < 0.01 (ND)
< 0.02 < 0.45 < 0.01 (0.004)
< 0.01 (ND) < 0.01 (ND) < 0.01 (0.004)
Trim waste/ wet waste (abrasion peeling)
0.081 3.2 < 0.01 (ND)
0.10 2.3 < 0.01 (ND) < 0.01 (ND) < 0.01 (0.007)
< 0.01 (ND)
Potato flakes < 0.01 (0.006)
0.4 < 0.01 (ND)
< 0.02 < 0.45 0.01 < 0.01 (ND) < 0.01 (0.005)
0.014
Potato chips < 0.01 (0.005)
0.4 < 0.01 (ND)
< 0.02 < 0.45 < 0.01 (0.005)
< 0.01 (ND) < 0.01 (ND) 0.012
Unpeeled French fries
0.023 0.92 < 0.01 (ND)
0.041 0.93 0.013 < 0.01 (ND) < 0.01 (0.008)
0.014
Peeled fries < 0.01 0.4 < 0.01 < 0.02 < 0.45 < 0.01 < 0.01 (ND) < 0.01 (ND) < 0.01

Penthiopyrad
1600
Matrix Penthiopyrad PAM Total PCA 753-A-OH 753-F-DO DM-PCA mg/kg PF mg/kg mg/kg PF mg/kg mg/kg mg/kg mg/kg
(0.003) (ND) (0.004) (0.007) Boiled unpeeled potatoes
0.011 0.44 < 0.01 (ND)
0.030 0.68 < 0.01 (0.006)
< 0.01 (ND) < 0.01 (ND) < 0.01 (0.007)
Boiled peeled potatoes
< 0.01 (0.004)
0.4 < 0.01 (ND)
< 0.02 < 0.45 < 0.01 (0.006)
< 0.01 (ND) < 0.01 (ND) < 0.01 (0.009)
Unpeeled microwaved potatoes
0.017 0.68 < 0.01 (ND)
0.036 0.82 < 0.01 (0.006)
< 0.01 (ND) < 0.01 (ND) 0.014
USA (OR), Corvallis, 2008, Variety: Ranger Russet, 1× In-furrow with 1.8 kg ai/ha and 2× 1.8 kg ai/ha foliar spray, PHI: 6 days Tubers (RAC) 0.075 – < 0.01
(0.003) 0.094 – < 0.01
(0.004) < 0.01 (0.004)
< 0.01 (0.007)
< 0.01 (0.004)
Washed tubers 0.037 0.49 < 0.01 (ND)
0.056 0.60 < 0.01 (0.003)
< 0.01 (ND) < 0.01 (0.003)
< 0.01 (0.003)
Cull tubers 0.042 0.56 < 0.01 (ND)
0.061 0.65 < 0.01 (0.004)
< 0.01 (ND) < 0.01 (0.004)
< 0.01 (0.006)
Steam-peeled tubers
< 0.01 (ND)
< 0.13 < 0.01 (ND)
< 0.02 < 0.21 < 0.01 (0.004)
< 0.01 (ND) < 0.01 (ND) < 0.01 (0.004)
Trim waste/ wet waste (steam peeling)
0.32 4.3 < 0.01 (ND)
0.34 3.6 < 0.01 (ND) < 0.01 (ND) 0.013 < 0.01 (ND)
Abrasion-peeled potatoes
< 0.01 (0.005)
0.13 < 0.01 (ND)
< 0.02 < 0.21 < 0.01 (0.004)
< 0.01 (ND) < 0.01 (ND) < 0.01 (0.004)
Trim waste/ wet waste (abrasion peeling)
0.16 2.1 < 0.01 (ND)
0.18 1.9 < 0.01 (ND) < 0.01 (0.004)
0.012 < 0.01 (ND)
Potato flakes < 0.01 (0.003)
0.13 < 0.01 (0.004)
< 0.02 < 0.21 < 0.01 (0.008)
< 0.01 (ND) < 0.01 (0.004)
< 0.01 (0.008)
Potato chips < 0.01 (0.006)
0.13 < 0.01 (ND)
< 0.02 < 0.21 < 0.01 (ND) < 0.01 (ND) < 0.01 (ND) < 0.01 (0.004)
Unpeeled French fries
0.019 0.25 < 0.01 (ND)
0.038 0.40 < 0.01 (0.004)
< 0.01 (ND) < 0.01 (0.004)
< 0.01 (0.006)
Peeled fries < 0.01 (ND)
< 0.13 < 0.01 (ND)
< 0.02 < 0.21 < 0.01 (ND) < 0.01 (ND) < 0.01 (ND) < 0.01 (ND)
Boiled unpeeled potatoes
0.021 0.28 < 0.01 (ND)
0.040 0.43 < 0.01 (0.003)
< 0.01 (ND) < 0.01 (ND) < 0.01 (0.003)
Boiled peeled potatoes
< 0.01 (ND)
< 0.13 < 0.01 (ND)
< 0.02 < 0.21 < 0.01 (0.004)
< 0.01 (ND) < 0.01 (ND) < 0.01 (ND)
Unpeeled microwaved potatoes
0.039 0.52 < 0.01 (0.003)
0.058 0.62 < 0.01 (0.006)
< 0.01 (ND) < 0.01 (0.005)
< 0.01 (0.005)
ND not detected, LOD: 0.003 mg/kg
Sugar beets
For sugar beets two supervised field trials were conducted in the USA using one treatment “in-furrow” and one foliar spray at rates of 2.3 kg ai/ha each. Mature roots were collected 7 days after the foliar treatment. Samples were shipped under frozen conditions to the processing facility where samples were processed to refined sugar, molasses, and dried pulp using common industrial practice.
An overview of residues of penthiopyrad and all metabolites found in processed sugar beet products is presented in Table 130.
Table 130 Processing of sugar beets treated with penthiopyrad in the USA with a PHI of 7 days (Shepard, E, 2010, PTHIO_108; values in brackets were extrapolated below the LOQ)
Matrix Penthiopyrad PAM Total PCA 753-A-OH 753-F-DO DM-PCA mg/kg PF mg/kg mg/kg PF mg/kg mg/kg mg/kg mg/kg USA (ND), Northwood, 2009, Variety: Betaseed 86RR66, 1× 2.3 kg ai/ha in-furrow plus 1× 2.3 kg ai/ha foliar, PHI: 7 days Roots (RAC) 0.12 – < 0.01 0.14 – < 0.01 < 0.01 (ND) < 0.01 < 0.01

Penthiopyrad
1601
Matrix Penthiopyrad PAM Total PCA 753-A-OH 753-F-DO DM-PCA mg/kg PF mg/kg mg/kg PF mg/kg mg/kg mg/kg mg/kg
(0.005) (0.006) (0.003) (0.004) Refined sugar 0.016 0.13 < 0.01
(ND) 0.35 2.5 < 0.01
(0.007) < 0.01 (ND) < 0.01 (ND) < 0.01 (ND)
Molasses 0.023 0.19 0.027 0.072 0.51 0.21 < 0.01 (ND) 0.011 0.03 Dried pulp 0.77 6.4 0.011 0.79 5.6 0.011 < 0.01
(0.008) < 0.01 (0.006)
< 0.01 (ND)
USA (ND), Carrington, 2009, Variety: Betaseed 86RR66, 1× 2.3 kg ai/ha in-furrow plus 1× 2.3 kg ai/ha foliar, PHI: 6 days Roots (RAC) 1.4 – < 0.01
(0.006) 1.4 – 0.015 < 0.01 (ND) < 0.01
(0.004) < 0.01 (0.004)
Refined sugar 0.25 0.18 < 0.01 (ND)
0.27 0.19 0.01 < 0.01 (ND) < 0.01 (ND) < 0.01 (ND)
Molasses 0.2 0.14 0.045 0.28 0.20 0.42 < 0.01 (ND) 0.013 0.05 Dried pulp 6.8 4.9 0.027 6.9 4.9 0.033 0.011 < 0.01
(0.009) < 0.01 (0.004)
ND not detected, LOD: 0.003 mg/kg
Barley
Processing of barley was performed to determine the quantitative distribution of residues in various intermediate and end products, to allow the determination of transfer factors. Trials were conducted in Germany and in the UK. All plots were treated with application rates of 2× 0.4 kg ai/ha. At maturity (29–49) days after the final treatment) samples were collected and processed into malt, spent grain, wort, flocs, young beer, spent yeast, beer, abrasion and pot barley following common commercial practice.
An overview of residues of penthiopyrad and all metabolites found in processed barley is presented in Table 131.
Table 131 Processing of barley treated with penthiopyrad in Northern Europe with a PHI of 29–49 days (Old, J, 2009, PTHIO_109; values in brackets were extrapolated below the LOQ)
Matrix Penthiopyrad PAM Total PCA 753-A-OH 753-F-DO DM-PCA mg/kg PF mg/kg mg/kg PF mg/kg mg/kg mg/kg mg/kg UK, Maldon, 2007, Variety: Optic, 2× 0.4 kg ai/ha, PHI:29 days Grain (RAC) 0.13 – 0.027 0.18 – 0.042 0.027 0.012 < 0.01 (ND) Grain after cleaning
0.21 1.6 0.026 0.26 1.4 0.037 0.024 < 0.01 (0.009)
< 0.01 (ND)
Offal after cleaning
0.55 4.2 0.11 0.75 4.2 0.15 0.08 0.059 0.013
Grain after sieving
0.2 1.5 0.022 0.24 1.3 0.028 0.02 < 0.01 (0.009)
< 0.01 (ND)
Malt after drying 0.15 1.2 < 0.01 (0.004)
0.17 0.94 < 0.01 (ND)
0.021 < 0.01 (ND) < 0.01 (ND)
Malt sprouts 0.18 1.4 0.01 0.20 1.1 0.014 < 0.01 (0.008)
< 0.01 (ND) < 0.01 (0.006)
Spent grain 0.071 0.55 < 0.01 (ND)
0.090 0.5 < 0.01 (ND)
< 0.01 (ND)
< 0.01 (ND) < 0.01 (ND)
Wort before cooking
< 0.01 (ND)
< 0.08 < 0.01 (ND)
< 0.02 < 0.11 < 0.01 (ND)
< 0.01 (ND)
< 0.01 (ND) < 0.01 (ND)
Flocs (spent hops)
0.057 0.44 < 0.01 (ND)
0.076 0.42 < 0.01 (ND)
< 0.01 (0.009)
< 0.01 (ND) < 0.01 (ND)
Wort after cooking
< 0.01 (ND)
< 0.08 < 0.01 (ND)
< 0.02 < 0.11 < 0.01 (ND)
< 0.01 (ND)
< 0.01 (ND) < 0.01 (ND)
Young beer < 0.01 (ND)
< 0.08 < 0.01 (ND)
< 0.02 < 0.11 < 0.01 (ND)
< 0.01 (ND)
< 0.01 (ND) < 0.01 (ND)
Spent yeast 0.017 0.13 < 0.01 (ND)
0.036 0.2 < 0.01 (ND)
< 0.01 (ND)
< 0.01 (ND) < 0.01 (ND)
Beer < 0.01 (ND)
< 0.08 < 0.01 (ND)
< 0.02 < 0.11 < 0.01 (ND)
< 0.01 (ND)
< 0.01 (ND) < 0.01 (ND)
Abrasion 0.47 3.6 0.11 0.67 3.7 0.1 0.06 0.045 < 0.01

Penthiopyrad
1602
Matrix Penthiopyrad PAM Total PCA 753-A-OH 753-F-DO DM-PCA mg/kg PF mg/kg mg/kg PF mg/kg mg/kg mg/kg mg/kg
(0.007) Pot barley 0.1 0.77 < 0.01
(0.004) 0.12 0.67 < 0.01
(0.004) 0.015 < 0.01 (ND) < 0.01 (ND)
Germany, Posthausen, 2007, Variety: Tocada, 2× 0.4 kg ai/ha, PHI: 43 days Grain (RAC) 0.036 – 0.011 0.056 – 0.01 < 0.01 (0.008) < 0.01 (ND) 0.033 Grain after cleaning
0.037 1 < 0.01 (0.009)
0.056 1 < 0.01 (0.005)
< 0.01 (0.009) < 0.01 (ND) < 0.01 (0.009)
Malt after drying 0.029 0.81 < 0.01 (ND)
0.048 0.86 0.01 < 0.01 (0.004) < 0.01 (ND) < 0.01 (ND)
Spent grain 0.016 0.44 < 0.01 (ND)
0.035 0.63 < 0.01 (ND)
< 0.01 (ND) < 0.01 (ND) < 0.01 (ND)
Flocs (spent hops)
0.01 0.27 < 0.01 (ND)
0.029 0.52 0.079 < 0.01 (ND) < 0.01 (ND) < 0.01 (ND)
Young beer < 0.01 (ND)
< 0.27 < 0.01 (ND)
< 0.02 < 0.36 < 0.01 (ND)
< 0.01 (ND) < 0.01 (ND) < 0.01 (ND)
Spent yeast < 0.01 (ND)
< 0.27 < 0.01 (ND)
< 0.02 < 0.36 < 0.01 (ND)
< 0.01 (ND) < 0.01 (ND) < 0.01 (ND)
Beer < 0.01 (ND)
< 0.27 < 0.01 (ND)
< 0.02 < 0.36 < 0.01 (ND)
< 0.01 (ND) < 0.01 (ND) < 0.01 (ND)
Abrasion 0.089 2.5 0.022 0.13 2.3 0.03 0.018 < 0.01 (ND) 0.03 Pot barley 0.019 0.53 < 0.01
(0.004) 0.038 0.68 < 0.01
(ND) < 0.01 (0.004) < 0.01 (ND) < 0.01 (ND)
UK, Tranent, 2007, Variety: Oxbridge, 2× 0.4 kg ai/ha, PHI: 49 days Grain (RAC) < 0.01
(0.009) – < 0.01
(ND) < 0.02 – < 0.01
(0.004) < 0.01 (0.005) < 0.01 (ND) < 0.01 (ND)
Grain after cleaning
< 0.01 (0.009)
– < 0.01 (0.003)
< 0.02 – < 0.01 (ND)
< 0.01 (0.005) < 0.01 (ND) < 0.01 (ND)
Malt after drying < 0.01 (0.004)
– < 0.01 (ND)
< 0.02 – < 0.01 (ND)
< 0.01 (ND) < 0.01 (ND) < 0.01 (ND)
Spent grain < 0.01 (0.004)
– < 0.01 (ND)
< 0.02 – < 0.01 (ND)
< 0.01 (ND) < 0.01 (ND) < 0.01 (ND)
Flocs (spent hops)
< 0.01 (ND)
– < 0.01 (ND)
< 0.02 – 0.17 < 0.01 (ND) < 0.01 (ND) < 0.01 (ND)
Young beer < 0.01 (ND)
– < 0.01 (ND)
< 0.02 – < 0.01 (ND)
< 0.01 (ND) < 0.01 (ND) < 0.01 (ND)
Spent yeast < 0.01 (ND)
– < 0.01 (ND)
< 0.02 – < 0.01 (ND)
< 0.01 (ND) < 0.01 (ND) < 0.01 (ND)
Beer < 0.01 (ND)
– < 0.01 (ND)
< 0.02 – < 0.01 (ND)
< 0.01 (ND) < 0.01 (ND) < 0.01 (ND)
Abrasion 0.024 – < 0.01 (0.006)
0.043 – < 0.01 (0.007)
< 0.01 (0.009) < 0.01 (ND) < 0.01 (ND)
Pot barley < 0.01 (0.004)
– < 0.01 (ND)
< 0.02 – < 0.01 (ND)
< 0.01 (ND) < 0.01 (ND) < 0.01 (ND)
ND not detected, LOD: 0.003 mg/kg
Maize
The processing of maize was investigated in two supervised field trials conducted in the USA. Plants were treated with application rates equivalent to 2× 1.8 kg ai/ha. Samples of mature grain were collected after 7 and 8 days and processed into starch, grits, flour, meal and refined oil (wet and dry milled).
An overview of residues of penthiopyrad and all metabolites found in processed maize is presented in Table 132.

Penthiopyrad
1603
Table 132 Processing of maize treated with penthiopyrad in the USA with a PHI of 7 or 8 days (Shepard, E, PTHIO_112); values in brackets were extrapolated below the LOQ
Matrix Penthiopyrad PAM Total PCA 753-A-OH 753-F-DO DM-PCA mg/kg PF mg/kg mg/kg PF mg/kg mg/kg mg/kg mg/kg USA (IL), Carlyle, 2009, Variety: 8G23, 2× 1.8 kg ai/ha, PHI:8 days Grain (RAC) < 0.01
(0.009) – < 0.01
(ND) < 0.02 – < 0.01
(ND) < 0.01 (ND) < 0.01 (ND) < 0.01 (ND)
Starch < 0.01 (ND)
– < 0.01 (ND)
< 0.02 – < 0.01 (ND)
< 0.01 (ND) < 0.01 (ND) < 0.01 (ND)
Grits < 0.01 (0.004)
– < 0.01 (ND)
< 0.02 – < 0.01 (ND)
< 0.01 (ND) < 0.01 (ND) < 0.01 (ND)
Flour < 0.01 (0.008)
– < 0.01 (ND)
< 0.02 – < 0.01 (ND)
< 0.01 (ND) < 0.01 (ND) < 0.01 (ND)
Meal < 0.01 (0.007)
– < 0.01 (ND)
< 0.02 – < 0.01 (ND)
< 0.01 (ND) < 0.01 (ND) < 0.01 (ND)
Refined oil (wet milled)
0.039 – < 0.01 (ND)
0.058 – < 0.01 (ND)
< 0.01 (ND) < 0.01 (ND) < 0.01 (ND)
Refined oil (dry milled)
0.026 – < 0.01 (ND)
0.045 – < 0.01 (ND)
< 0.01 (ND) < 0.01 (ND) < 0.01 (ND)
USA (TX), Uvalde, 2009, Variety: DK69 Field corn, 2× 1.8 kg ai/ha, PHI: 7 days Grain (RAC) 0.011 – < 0.01
(0.004) 0.030 – < 0.01
(0.004) < 0.01 (0.006)
< 0.01 (ND) < 0.01 (ND)
Starch < 0.01 (ND)
< 0.91 < 0.01 (ND)
< 0.02 < 0.67 < 0.01 (ND)
< 0.01 (ND) < 0.01 (ND) < 0.01 (ND)
Grits < 0.01 (0.004)
0.91 < 0.01 (ND)
< 0.02 < 0.67 < 0.01 (ND)
< 0.01 (0.004)
< 0.01 (ND) < 0.01 (ND)
Flour 0.023 2.1 < 0.01 (0.008)
0.042 1.4 < 0.01 (0.005)
0.015 < 0.01 (ND) < 0.01 (ND)
Meal 0.016 1.5 < 0.01 (0.006)
0.035 1.2 < 0.01 (0.004)
0.014 < 0.01 (ND) < 0.01 (ND)
Refined oil (wet milled)
0.062 5.6 < 0.01 (ND)
0.081 2.7 < 0.01 (ND)
< 0.01 (ND) < 0.01 (ND) < 0.01 (ND)
Refined oil (dry milled)
0.049 4.5 < 0.01 (ND)
0.068 2.3 < 0.01 (ND)
< 0.01 (ND) < 0.01 (ND) < 0.01 (ND)
ND not detected, LOD: 0.003 mg/kg
Wheat
For wheat two studies were conducted to investigate the behaviour of penthiopyrad residues during processing.
In the first study by Old J (2009, PHTIO_110) three supervised field trials in Europe were conducted with application rates of 0.38–0.41 kg ai/ha with PHIs of 44 to 63 days. Grain was collected at maturity and processed into flour, bran, dough, bread and germ, involving various degrees of milling from wholemeal to type 550.
The processing was conducted in laboratory scale using appropriate equipment to gain different flour types. The preparation of dough and bread was also conducted in laboratory scale by addition of yeast, tap water and salt.
An overview of residues of penthiopyrad and all metabolites found in processed wheat is presented in Table 133.
Table 133 Processing of wheat treated with penthiopyrad in Northern Europe with a PHI of 44–63 days (Old J, 2009, PTHIO_110; values in brackets were extrapolated below the LOQ)
Matrix Penthiopyrad PAM Total PCA 753-A-OH 753-F-DO DM-PCA mg/kg PF mg/kg mg/kg PF mg/kg mg/kg mg/kg mg/kg UK, Ormiston, 2007, Variety: Robigus, 2× 0.41 kg ai/ha, PHI:63 days Grain (RAC) < 0.01
(ND) – < 0.01
(ND) < 0.02 – < 0.01
(ND) < 0.01 (ND) < 0.01 (ND) < 0.01 (ND)

Penthiopyrad
1604
Matrix Penthiopyrad PAM Total PCA 753-A-OH 753-F-DO DM-PCA mg/kg PF mg/kg mg/kg PF mg/kg mg/kg mg/kg mg/kg Grain after cleaning
< 0.01 (ND)
– < 0.01 (ND)
< 0.02 – < 0.01 (ND)
< 0.01 (ND) < 0.01 (ND) < 0.01 (ND)
Offal after cleaning
0.023 – 0.077 0.17 – 0.018 < 0.01 (0.009)
< 0.01 (ND) < 0.01 (0.009)
Straight flour < 0.05 (ND)
– < 0.05 (ND)
< 0.1 – < 0.05 (ND)
< 0.05 (ND) < 0.05 (ND) < 0.05 (ND)
Middlings < 0.05 (ND)
– < 0.05 (ND)
< 0.1 – < 0.05 (ND)
< 0.05 (ND) < 0.05 (ND) < 0.05 (ND)
Coarse bran < 0.05 (ND)
– < 0.05 (ND)
< 0.1 – < 0.05 (ND)
< 0.05 (ND) < 0.05 (ND) < 0.05 (ND)
Total bran < 0.05 (ND)
– < 0.05 (ND)
< 0.1 – < 0.05 (ND)
< 0.05 (ND) < 0.05 (ND) < 0.05 (ND)
Low grade meal (toppings)
< 0.05 (ND)
– < 0.05 (ND)
< 0.1 – < 0.05 (ND)
< 0.05 (ND) < 0.05 (ND) < 0.05 (ND)
Flour type 550 < 0.05 (ND)
– < 0.05 (ND)
< 0.1 – < 0.05 (ND)
< 0.05 (ND) < 0.05 (ND) < 0.05 (ND)
Wholemeal flour < 0.05 (ND)
– < 0.05 (ND)
< 0.1 – < 0.05 (ND)
< 0.05 (ND) < 0.05 (ND) < 0.05 (ND)
Dough < 0.05 (ND)
– < 0.05 (ND)
< 0.1 – < 0.05 (ND)
< 0.05 (ND) < 0.05 (ND) < 0.05 (ND)
Wholemeal bread
< 0.05 (ND)
– < 0.05 (ND)
< 0.1 – < 0.05 (ND)
< 0.05 (ND) < 0.05 (ND) < 0.05 (ND)
Wheat germ < 0.05 (ND)
– < 0.05 (ND)
< 0.1 – < 0.05 (ND)
< 0.05 (ND) < 0.05 (ND) < 0.05 (ND)
France (North), Douai, 2007, Variety: Cap Horn, 2× 0.4 kg ai/ha, PHI: 60 days Grain (RAC) < 0.01
(0.008) – < 0.01
(ND) < 0.02 – < 0.01
(0.005) < 0.01 (0.003) < 0.01 (ND) < 0.01 (ND)
Grain after cleaning
< 0.01 (0.008)
– < 0.01 (ND)
< 0.02 – < 0.01 (0.005)
< 0.01 (0.004) < 0.01 (ND) < 0.01 (ND)
Flour type 550 < 0.05 (ND)
– < 0.05 (ND)
< 0.1 – < 0.05 (ND)
< 0.05 (ND) < 0.05 (ND) < 0.05 (ND)
Wholemeal flour < 0.05 (ND)
– < 0.05 (ND)
< 0.1 – < 0.05 (ND)
< 0.05 (ND) < 0.05 (ND) < 0.05 (ND)
Wholemeal bread
< 0.05 (ND)
– < 0.05 (ND)
< 0.1 – < 0.05 (ND)
< 0.05 (ND) < 0.05 (ND) < 0.05 (ND)
Wheat germ < 0.05 (ND)
– < 0.05 (ND)
< 0.1 – < 0.05 (ND)
< 0.05 (ND) < 0.05 (ND) < 0.05 (ND)
Germany, Motterwitz, 2007, Variety: Schamane, 2× 0.39 kg ai/ha, PHI: 44 days Grain (RAC) < 0.01
(ND) – < 0.01
(ND) < 0.02 – < 0.01
(ND) < 0.01 (ND) < 0.01 (ND) < 0.01 (ND)
Grain after cleaning
< 0.01 (ND)
– < 0.01 (ND)
< 0.02 – < 0.01 (ND)
< 0.01 (ND) < 0.01 (ND) < 0.01 (ND)
Flour type 550 < 0.05 (ND)
– < 0.05 (ND)
< 0.1 – < 0.05 (ND)
< 0.05 (ND) < 0.05 (ND) < 0.05 (ND)
Wholemeal flour < 0.05 (ND)
– < 0.05 (ND)
< 0.1 – < 0.05 (ND)
< 0.05 (ND) < 0.05 (ND) < 0.05 (ND)
Wholemeal bread
< 0.05 (ND)
– < 0.05 (ND)
< 0.1 – < 0.05 (ND)
< 0.05 (ND) < 0.05 (ND) < 0.05 (ND)
Wheat germ < 0.05 (ND)
– < 0.05 (ND)
< 0.1 – < 0.05 (ND)
< 0.05 (ND) < 0.05 (ND) < 0.05 (ND)
ND not detected, LOD: 0.003 mg/kg for grain, 0.017 mg/kg for processed fractions
In a second study on wheat conducted by Shepard, E (2010, PTHIO_111) two supervised
field trials in the USA were treated with application rates of 2× 1.8 kg ai/ha. Samples of mature grain were collected after 42 and 62 days. The grain obtained was processed into bran, flour, middlings, shorts and germs.
An overview of residues of penthiopyrad and all metabolites found in processed wheat is presented in Table 134.

Penthiopyrad
1605
Table 134 Processing of wheat treated with penthiopyrad in the USA with a PHI of 42 and 62 days (Shepard, E., 2010, PTHIO_111; values in brackets were extrapolated below the LOQ)
Matrix Penthiopyrad PAM Total PCA 753-A-OH 753-F-DO DM-PCA mg/kg PF mg/kg mg/kg PF mg/kg mg/kg mg/kg mg/kg USA (ND), Carrington, 2009, Variety: Glenn, 2× 1.8 kg ai/ha, PHI: 62 days Grain (RAC) < 0.01
(0.006) – < 0.01
(0.004) < 0.02 – < 0.01
(0.007) < 0.01 (ND) < 0.01
(0.008) 0.018
Bran < 0.01 (0.008)
– < 0.01 (0.007)
< 0.02 – 0.015 < 0.01 (ND) 0.012 0.021
Flour < 0.01 (ND)
– < 0.01 (ND)
< 0.02 – < 0.01 (ND)
< 0.01 (ND) < 0.01 (ND) < 0.01 (ND)
Middlings < 0.01 (0.004)
– < 0.01 (ND)
< 0.02 – < 0.01 (0.003)
< 0.01 (ND) < 0.01 (ND) < 0.01 (0.004)
Shorts < 0.01 (0.004)
– < 0.01 (ND)
< 0.02 – < 0.01 (0.005)
< 0.01 (ND) < 0.01 (0.004)
< 0.01 (0.005)
Germ 0.01 – < 0.01 (0.005)
0.029 – 0.014 < 0.01 (ND) 0.011 0.018
USA (TX), Uvalde, 2009, Variety: Fannin, 2× 1.8 kg ai/ha, PHI: 42 days Grain (RAC) 0.091 – 0.011 0.11 – 0.013 < 0.01
(0.003) < 0.01 (0.007)
< 0.01 (ND)
Bran 0.16 1.8 0.02 0.20 1.8 0.032 < 0.01 (0.005)
0.017 < 0.01 (0.004)
Flour 0.024 0.26 < 0.01 (ND)
0.043 0.39 < 0.01 (ND)
< 0.01 (ND) < 0.01 (ND) < 0.01 (ND)
Middlings 0.06 0.66 < 0.01 (0.004)
0.079 0.72 < 0.01 (0.008)
< 0.01 (ND) < 0.01 (0.005)
< 0.01 (ND)
Shorts 0.11 1.2 < 0.01 (0.008)
0.13 1.2 0.015 < 0.01 (ND) < 0.01 (0.008)
< 0.01 (ND)
Germ 0.19 2.1 0.013 0.21 1.9 0.021 < 0.01 (0.004)
0.011 < 0.01 (ND)
ND not detected, LOD: 0.003 mg/kg
Rape seed
The influence of processing on rape seed was investigated in three supervised field trials in Canada and the USA. Rape seed (canola) was treated with application rates of 2 × 1.5 kg ai/ha with a PHI of 21 days. The seeds were collected at the stage of commercial harvest and processed into crude and refined oil using mechanical and solvent extraction. In addition by-products (solvent, soapstock, impurities etc.) were analysed.
An overview of residues of penthiopyrad and all metabolites found in processed rape seed is presented in Table 135.
Table 135 Processing of rape seed (canola) treated with penthiopyrad in the USA with a PHI of 21 days (Thie,l A, 2009, PTHIO_113); values in brackets were extrapolated below the LOQ
Matrix Penthiopyrad PAM Total PCA 753-A-OH 753-F-DO DM-PCA mg/kg PF mg/kg mg/kg PF mg/kg mg/kg mg/kg mg/kg USA (ND), Northwood, 2007, Variety: Pioneer 45H21, 2× 1.5 kg ai/ha, PHI: 21 days Seeds (RAC) 0.19 – < 0.01
(0.009) 0.21 – 0.034 < 0.01 (ND) < 0.01
(0.009) < 0.01 (0.006)
Presscake 0.25 1.3 < 0.05 (ND)
0.34 1.6 < 0.05 (0.04)
< 0.05 (ND) < 0.05 (0.02) < 0.05 (ND)
Crude oil (mechanically extracted)
0.37 1.9 < 0.01 (ND)
0.39 1.9 < 0.01 (ND)
< 0.01 (ND) < 0.01 (0.004)
< 0.01 (ND)
Crude oil (solvent extracted)
0.26 1.4 < 0.01 (ND)
0.28 1.3 < 0.01 (ND)
< 0.01 (ND) < 0.01 (0.004)
< 0.01 (ND)
Refined oil 0.3 1.6 < 0.01 (ND)
0.32 1.5 < 0.01 (ND)
< 0.01 (ND) < 0.01 (0.004)
< 0.01 (ND)

Penthiopyrad
1606
Matrix Penthiopyrad PAM Total PCA 753-A-OH 753-F-DO DM-PCA mg/kg PF mg/kg mg/kg PF mg/kg mg/kg mg/kg mg/kg Solvent extracted meal
0.18 0.95 < 0.05 (ND)
0.27 1.3 0.054 < 0.05 (ND) < 0.05 (ND) < 0.01 (ND)
Cleaned seed 0.25 1.3 0.011 0.27 1.3 0.042 < 0.01 (ND) 0.011 < 0.01 (0.007)
Light impurities 8.3 44 0.91 10 48 0.99 0.076 1.5 0.2 Large Screenings
0.64 3.4 0.066 0.76 3.6 0.068 < 0.01 (0.004)
0.07 0.015
Small Screenings
0.51 2.7 0.031 0.57 2.7 0.087 < 0.01 (ND) 0.043 0.014
Flaked seed 0.28 1.5 0.012 0.30 1.4 0.043 < 0.01 (ND) 0.01 < 0.01 (0.008)
Hexane < 0.01 (ND)
< 0.05 < 0.01 (ND)
< 0.02 < 0.1 < 0.01 (ND)
< 0.01 (ND) < 0.01 (ND) < 0.01 (ND)
Soapstock 0.14 0.74 < 0.05 (ND)
0.23 1.1 < 0.05 (0.04)
< 0.05 (ND) < 0.05 (ND) < 0.05 (ND)
USA (WA), Ephrata, 2007, Variety: 71-45RR, 2× 1.5 kg ai/ha, PHI: 21 days Seeds (RAC) 0.52 – 0.1 0.71 – 0.079 0.01 0.28 0.03 Presscake 0.14 0.27 < 0.05
(ND) 0.23 0.32 < 0.05
(ND) < 0.05 (ND) < 0.05 (0.03) < 0.05 (ND)
Crude oil (mechanically extracted)
0.41 0.78 < 0.01 (ND)
0.60 0.85 < 0.01 (ND)
< 0.01 (ND) 0.026 < 0.01 (ND)
Crude oil (solvent extracted)
0.28 0.54 < 0.01 (ND)
0.30 0.42 < 0.01 (ND)
< 0.01 (ND) 0.012 < 0.01 (ND)
Refined oil 0.26 0.48 < 0.01 (0.003)
0.28 0.39 < 0.01 (ND)
< 0.01 (ND) 0.012 < 0.01 (ND)
Solvent extracted meal
0.06 0.12 < 0.05 (ND)
0.15 0.21 < 0.05 (ND)
< 0.05 (ND) < 0.05 (0.03) < 0.05 (ND)
Cleaned seed 0.18 0.35 0.014 0.21 0.30 0.014 < 0.01 (ND) 0.019 < 0.01 (ND) Light impurities 9.1 18 1.6 12 17 1.3 0.28 5.1 0.48 Large Screenings
0.77 1.5 0.29 1.3 1.8 0.07 < 0.01 (0.007)
0.19 0.069
Flaked seed 0.14 0.27 0.019 0.18 0.25 0.016 < 0.01 (ND) 0.029 < 0.01 (ND) Hexane < 0.01
(ND) < 0.02 < 0.01
(ND) < 0.02 < 0.03 < 0.01
(ND) < 0.01 (ND) < 0.01 (ND) < 0.01 (ND)
Soapstock 0.14 0.27 < 0.05 (ND)
0.23 0.32 < 0.05 (0.04)
< 0.05 (ND) < 0.05 (0.02) < 0.05 (ND)
Canada, Fort Saskatchewan, 2007, Variety: DeKalb 34-55, 2× 1.5 kg ai/ha, PHI: 21 days Seeds (RAC) 0.63 – 0.056 0.73 – 0.027 0.014 0.018 < 0.01
(0.003) Presscake 0.93 1.5 < 0.05
(0.04) 1.0 1.4 0.05 < 0.05 (ND) < 0.05 (ND) < 0.05 (ND)
Crude oil (mechanically extracted)
1.6 2.5 < 0.01 (ND)
1.6 2.2 < 0.01 (ND)
< 0.01 (ND) < 0.01 (ND) < 0.01 (ND)
Crude oil (solvent extracted)
1.5 2.4 < 0.01 (ND)
1.5 2.1 < 0.01 (ND)
< 0.01 (ND) < 0.01 (ND) < 0.01 (ND)
Refined oil 1.6 2.5 < 0.01 (ND)
1.6 2.2 < 0.01 (ND)
< 0.01 (ND) < 0.01 (ND) < 0.01 (ND)
Solvent extracted meal
0.73 1.2 < 0.05 (0.04)
0.82 1.1 0.06 < 0.05 (ND) < 0.05 (ND) < 0.05 (ND)
Cleaned seed 0.2 0.32 0.026 0.25 0.34 0.026 < 0.01 (0.005) < 0.01 (0.004)
< 0.01 (0.005)
Light impurities 33 52 1.4 36 49 0.69 0.33 0.5 0.33 Large Screenings
8.1 13 0.3 8.7 12 0.11 0.061 0.12 0.061
Small Screenings
3.3 5.2 0.18 3.6 4.9 0.06 0.042 0.047 0.042
Flaked seed 0.34 0.54 0.02 0.37 0.51 0.024 < 0.01 (0.004) < 0.01 (ND) < 0.01 (0.004)

Penthiopyrad
1607
Matrix Penthiopyrad PAM Total PCA 753-A-OH 753-F-DO DM-PCA mg/kg PF mg/kg mg/kg PF mg/kg mg/kg mg/kg mg/kg Hexane < 0.01
(ND) < 0.02 < 0.01
(ND) < 0.02 < 0.03 < 0.01
(ND) < 0.01 (ND) < 0.01 (ND) < 0.01 (ND)
Soapstock 0.89 1.4 < 0.05 (ND)
0.98 1.3 0.05 < 0.05 (ND) < 0.05 (ND) < 0.05 (ND)
ND not detected, LOD: 0.003 mg/kg except for presscake, meal and soapstock (0.02 mg/kg)
Peanuts
In two field trials on peanuts conducted in the USA by Thiel, A. (2009, PTHIO_098) peanuts were processed into refined oil and meal. The corresponding field trial summary is presented in Table 136.
Table 136 Processing of peanuts treated with penthiopyrad in the USA with a PHI of 12 days (Thiel, A, 2009, PTHIO_098); values in brackets were extrapolated below the LOQ
Matrix Penthiopyrad PAM Total PCA 753-A-OH 753-F-DO DM-PCA mg/kg PF mg/kg mg/kg PF mg/kg mg/kg mg/kg mg/kg USA (GA), Sycamore, 2009, Variety: GA-02, 3 × 1.8 kg ai/ha, PHI: 14 days Nutmeat (RAC) 0.051 – 0.013 0.075 – < 0.01
(0.004) < 0.01 (ND)
< 0.01 (0.006)
< 0.01 (ND)
Meal 0.026 0.51 0.02 0.063 0.84 < 0.01 (0.005)
< 0.01 (ND)
< 0.01 (0.007)
< 0.01 (ND)
Refined oil 0.07 1.4 < 0.01 (ND)
0.089 1.2 < 0.01 (ND)
< 0.01 (ND)
< 0.01 (0.007)
< 0.01 (ND)
USA (TX), Charlotte, 2009, Variety: TAM RUN OL-1, 3 × 1.8 kg ai/ha, PHI: 14 days Nutmeat (RAC) 0.011 – 0.012 0.033 – 0.01 < 0.01 (ND) < 0.01 (ND) < 0.01 (ND) Meal 0.041 3.7 0.022 0.082 2.5 0.014 < 0.01 (ND) < 0.01
(0.006) < 0.01 (ND)
Refined oil 0.2 18 < 0.01 (ND)
0.22 6.7 < 0.01 (ND)
< 0.01 (ND) < 0.01 (0.004)
< 0.01 (ND)
ND not detected, LOD: 0.003 mg/kg
Table 137 Summary of processing factors for penthiopyrad and its metabolites in plant commodities
Raw agricultural commodity (RAC)
Processed commodity
Calculated processing factors Median or best estimate
Apples Canned fruit Penthiopyrad: < 0.04, < 0.07, < 0.08 Penthiopyrad: < 0.07
Total: < 0.08, < 0.13, < 0.14 Total: < 0.13
Apple sauce Penthiopyrad: 0.04, < 0.07, < 0.08 Penthiopyrad: < 0.07
Total: < 0.08, < 0.13, < 0.14 Total: < 0.13
Raw juice Penthiopyrad: 0.07, 0.07, 0.08 Penthiopyrad: 0.07
Total: < 0.13, < 0.14, 0.14 Total: 0.14
Pomace, wet Penthiopyrad: 4.9, 5.1, 6.5 Penthiopyrad: 5.1
Total: 4.4, 4.6, 6 Total: 4.6
Pomace, dry Penthiopyrad: 6.6, 10, 12 Penthiopyrad: 10
Total: 5.9, 8.8, 11 Total: 8.8
Plums Pitted fruits Penthiopyrad: 1, 1 Penthiopyrad: 1
Total: 1, 1 Total: 1
Dried pitted prunes Penthiopyrad: 1.3, 1.5 Penthiopyrad: 1.4
Total: 1.3, 1.4 Total: 1.4

Penthiopyrad
1608
Raw agricultural commodity (RAC)
Processed commodity
Calculated processing factors Median or best estimate
Tomatoes Juice Penthiopyrad: 0.19, 0.27, 0.47 Penthiopyrad: 0.27
Total: 0.26, 0.34, 0.5 Total: 0.34
Puree Penthiopyrad: 1.5, 2.1, 2.2 Penthiopyrad: 2.1
Total: 1.5, 2.0, 2.0 Total: 2.0
Paste Penthiopyrad: < 0.06, 3.6, 3.8 Penthiopyrad: 3.6
Total: 0.1, 3.4, 3.5 Total: 3.4
Ketchup Penthiopyrad: 0.95, 1.1, 1.9 Penthiopyrad: 1.1
Total: 0.95, 1.1, 1.8 Total: 1.1
Canned fruits Penthiopyrad: < 0.06, 0.07, 0.36 Penthiopyrad: 0.07
Total: 0.1, 0.14, 0.36 Total: 0.14
Pomace, wet Penthiopyrad: 5, 5.1, 5.5 Penthiopyrad: 5.1
Total: 4.3, 5.0, 5.5 Total: 5.0
Pomace, dry Penthiopyrad: 26, 41, 43 Penthiopyrad: 41
Total: 24, 39, 41 Total: 39
Soya beans Meal Penthiopyrad: < 0.12, < 0.88 Penthiopyrad: < 0.5
Total: 0.23, <1.4 Total: 0.23
Hulls Penthiopyrad: 0.5, 4.4 Penthiopyrad: 2.5
Total: 0.44, 4.7 Total: 2.5
Refined oil Penthiopyrad: 0.06, 1.9 Penthiopyrad: 1
Total: 0.1, 1.8 Total: 0.95
Potatoes Steam-peeled tubers Penthiopyrad: < 0.13, 0.4 Penthiopyrad: 0.26
Total: < 0.21, < 0.45 Total: < 0.33
Abrasion-peeled tubers
Penthiopyrad: 0.13, < 0.4 Penthiopyrad: 0.26
Total: < 0.21, < 0.45 Total: < 0.33
Potato flakes Penthiopyrad: 0.13, 0.4 Penthiopyrad: 0.26
Total: < 0.21, < 0.45 Total: < 0.33
Potato chips Penthiopyrad: 0.13, 0.4 Penthiopyrad: 0.26
Total: < 0.21, < 0.45 Total: < 0.33
Unpeeled French fries
Penthiopyrad: 0.25, 0.92 Penthiopyrad: 0.58
Total: 0.40, 0.93 Total: 0.67
Peeled fries Penthiopyrad: < 0.13, 0.4 Penthiopyrad: 0.26
Total: < 0.21, < 0.45 Total: < 0.33
Boiled unpeeled potatoes
Penthiopyrad: 0.28, 0.44 Penthiopyrad: 0.36
Total: 0.43, < 0.45 Total: 0.43
Boiled peeled potatoes
Penthiopyrad: < 0.13, 0.4 Penthiopyrad: 0.26
Total: < 0.21, < 0.45 Total: < 0.33
Unpeeled microwaved potatoes
Penthiopyrad: 0.52, 0.68 Penthiopyrad: 0.6
Total: 0.62, 0.82 Total: 0.72
Trim waste (steam- Penthiopyrad: 3.4, 4.3 Penthiopyrad: 3.8

Penthiopyrad
1609
Raw agricultural commodity (RAC)
Processed commodity
Calculated processing factors Median or best estimate
peeling) Total: 2.3, 3.6 Total: 3.0
Trim waste (abrasion-peeling)
Penthiopyrad: 2.1, 3.2 Penthiopyrad: 2.6
Total: 1.9, 2.3 Total: 2.1
Sugar beets Refined sugar Penthiopyrad: 0.13, 0.18 Penthiopyrad: 0.16
Total: 0.27, 0.35 Total: 0.31
Molasses Penthiopyrad: 0.14, 0.19 Penthiopyrad: 0.17
Total: 0.20, 0.51 Total: 0.36
Dried pulp Penthiopyrad: 4.9, 6.4 Penthiopyrad: 5.7
Total: 4.9, 5.6 Total: 5.3
Barley Spent grain Penthiopyrad: 0.44, 0.55 Penthiopyrad: 0.5
Total: 0.5, 0.63 Total: 0.56
Young beer Penthiopyrad: < 0.08,< 0.27 Penthiopyrad: < 0.18
Total: < 0.11, < 0.36 Total: < 0.24
Beer Penthiopyrad: < 0.08,< 0.27 Penthiopyrad: < 0.18
Total: < 0.11, < 0.36 Total: < 0.24
Pot barley Penthiopyrad: 0.53, 0.77 Penthiopyrad: 0.65
Total: 0.67, 0.68 Total: 0.68
Spent yeast Penthiopyrad: 0.13, < 0.27 Penthiopyrad: 0.13
Total: 0.2, < 0.36 Total: 0.28
Maize Starch Penthiopyrad: < 0.91 Penthiopyrad: < 0.91
Total: < 0.67 Total: < 0.67
Grits Penthiopyrad: 0.91 Penthiopyrad: 0.91
Total: < 0.67 Total: < 0.67
Flour Penthiopyrad: 2.1 Penthiopyrad: 2.1
Total: 1.4 Total: 1.4
Meal Penthiopyrad: 1.5 Penthiopyrad: 1.5
Total: 1.2 Total: 1.2
Refined oil (wet milled)
Penthiopyrad: 5.6 Penthiopyrad: 5.6
Total: 2.7 Total: 2.7
Refined oil (dry milled)
Penthiopyrad: 4.5 Penthiopyrad: 4.5
Total: 2.3 Total: 2.3
Wheat Bran Penthiopyrad: 1.8 Penthiopyrad: 1.8
Total: 1.8 Total: 1.8
Flour Penthiopyrad: 0.26 Penthiopyrad: 0.26
Total: 0.39 Total: 0.39
Middling Penthiopyrad: 0.66 Penthiopyrad: 0.66
Total: 0.72 Total: 0.72
Shorts Penthiopyrad: 1.2 Penthiopyrad: 1.2
Total: 1.2 Total: 1.2

Penthiopyrad
1610
Raw agricultural commodity (RAC)
Processed commodity
Calculated processing factors Median or best estimate
Germ Penthiopyrad: 2.1 Penthiopyrad: 2.1
Total: 1.9 Total: 1.9
Oilseed rape Presscake Penthiopyrad: 0.27, 1.3, 1.5 Penthiopyrad: 1.3
Total: 0.32, 1.4, 1.6 Total: 1.4
Crude oil (mechanically extracted)
Penthiopyrad: 0.78, 1.9, 2.5 Penthiopyrad: 1.9
Total: 0.85, 1.9, 2.2 Total: 2.2
Crude oil (solvent extracted)
Penthiopyrad: 0.54, 1.4, 2.4 Penthiopyrad: 1.4
Total: 0.42, 1.3, 2.1 Total: 1.3
Refined oil Penthiopyrad: 0.48, 1.6, 2.5 Penthiopyrad: 1.6
Total: 0.39, 1.5, 2.2 Total: 2.2
Solvent extracted meal
Penthiopyrad: 0.12, 0.95, 1.2 Penthiopyrad: 0.95
Total: 0.21, 1.1, 1.3 Total: 1.1
Cleaned seed Penthiopyrad: 0.32, 0.35, 1.3 Penthiopyrad: 0.35
Total: 0.3, 0.34, 1.3 Total: 0.34
Light impurities Penthiopyrad: 18, 44, 52 Penthiopyrad: 44
Total: 17, 48, 49 Total: 49
Large Screenings Penthiopyrad: 1.5, 3.4, 13 Penthiopyrad: 3.4
Total: 1.8, 3.6, 12 Total: 3.6
Small Screenings Penthiopyrad: 2.7, 5.2 Penthiopyrad: 3.9
Total: 2.7, 4.9 Total: 3.8
Flaked seed Penthiopyrad: 0.27, 0.54, 1.5 Penthiopyrad: 0.54
Total: 0.16, 0.51, 1.4 Total: 0.51
Soapstock Penthiopyrad: 0.27, 0.74, 1.4 Penthiopyrad: 0.74
Total: 0.32, 1.1, 1.3 Total: 1.3
Peanuts Meal Penthiopyrad: 0.51, 3.7 Penthiopyrad: 2.1
Total: 0.84, 2.5 Total: 2.7
Refined oil Penthiopyrad: 1.4, 18 Penthiopyrad: 9.7
Total: 1.2, 6.7 Total: 4
RESIDUES IN ANIMAL COMMODITIES
Farm animal feeding studies
For the estimation of residues of penthiopyrad and its metabolites PAM, PCA and 753-A-OH in animal matrices laying hens and lactating cow feeding studies were submitted to the Meeting.
Lactating cows
Residues in lactating cows were investigated by Rawle, NW (2008, PTHIO_040). Dairy cows were administered penthiopyrad twice daily for at least 28 days. The total dose rates of penthiopyrad per cow per day were 100 mg (1× dose rate, three cows), 300 mg (3x× dose rate, three cows) and 1000 mg (10× dose rate, five cows). Based on the average weights of the cows in each dose group,

Penthiopyrad
1611
dose levels were calculated to be 0.15 mg/kg bw/day (1×), 0.48 mg/kg bw/day (3×) and 1.65 mg/kg bw/day (10×), equivalent to 8.4, 21.4 and 74.6 ppm in feed.
Milk samples from each animal were collected twice daily and combined as one pooled sample. Milk from Day 23 was separated into cream and skim milk for separate analysis. Animals were sacrificed within 24 hours after the final dosing and muscle, liver, kidney and three types of fat samples were taken. Two cows of the 10× group were slaughtered three and seven days after the final dose to determine residue levels after cessation of dosing.
Residues of penthiopyrad and its metabolites (PAM, PCA and 753-A-OH) were determined following extraction with acetone/water, hydrolysis of conjugates and partition of all analytes into ethyl acetate. Following solvent exchange, the analytes were measured by LC-MS/MS.
In milk residues of penthiopyrad and its metabolites were below the LOQ of 0.01 mg/kg for the control, 1× and 3× dose groups in all samples. The 10× group gave detectable residues above the LOQ, summarized in Table 142.
Table 138 Residues of penthiopyrad, PAM, PCA and 753-A-OH in whole milk (10× dose group)
Days Penthiopyrad in mg/kg (mean)
PAM in mg/kg (mean) PCA in mg/kg (mean) 753-A-OH in mg/kg (mean)
–7 < 0.01, < 0.01, < 0.01, < 0.01, < 0.01
< 0.01, < 0.01, < 0.01, < 0.01, < 0.01
< 0.01, < 0.01, < 0.01, < 0.01, < 0.01
< 0.01, < 0.01, < 0.01, < 0.01, < 0.01
–3 < 0.01, < 0.01, < 0.01, < 0.01, < 0.01
< 0.01, < 0.01, < 0.01, < 0.01, < 0.01
< 0.01, < 0.01, < 0.01, < 0.01, < 0.01
< 0.01, < 0.01, < 0.01, < 0.01, < 0.01
–1 < 0.01, < 0.01, < 0.01, < 0.01, < 0.01
< 0.01, < 0.01, < 0.01, < 0.01, < 0.01
< 0.01, < 0.01, < 0.01, < 0.01, < 0.01
< 0.01, < 0.01, < 0.01, < 0.01, < 0.01
1 < 0.01, < 0.01, < 0.01, < 0.01, < 0.01
< 0.01, < 0.01, < 0.01, < 0.01, < 0.01
< 0.01, < 0.01, < 0.01, < 0.01, < 0.01
< 0.01, < 0.01, < 0.01, < 0.01, < 0.01
3 < 0.01, < 0.01, < 0.01, < 0.01, < 0.01
< 0.01, < 0.01, < 0.01, 0.01, 0.01 (0.01)
< 0.01, < 0.01, < 0.01, < 0.01, < 0.01
< 0.01, < 0.01, < 0.01, < 0.01, < 0.01
6 < 0.01, < 0.01, < 0.01, < 0.01, < 0.01
< 0.01, < 0.01, < 0.01, < 0.01, < 0.01
< 0.01, < 0.01, < 0.01, < 0.01, < 0.01
< 0.01, < 0.01, < 0.01, < 0.01, < 0.01
9 < 0.01, < 0.01, < 0.01, < 0.01, < 0.01
< 0.01, < 0.01, < 0.01, < 0.01, 0.01 (0.01)
< 0.01, < 0.01, < 0.01, < 0.01, < 0.01
< 0.01, < 0.01, < 0.01, < 0.01, < 0.01
12 < 0.01, < 0.01, < 0.01, < 0.01, < 0.01
0.01, 0.01, 0.02, 0.01, 0.01 (0.01)
< 0.01, < 0.01, < 0.01, < 0.01, < 0.01
< 0.01, < 0.01, < 0.01, < 0.01, < 0.01
15 < 0.01, < 0.01, < 0.01, < 0.01, < 0.01
0.01, 0.01, 0.01, 0.01, 0.01 (0.01)
< 0.01, < 0.01, < 0.01, < 0.01, < 0.01
< 0.01, < 0.01, < 0.01, < 0.01, < 0.01
18 < 0.01, < 0.01, < 0.01, < 0.01, < 0.01
< 0.01, 0.01, 0.01, 0.01, 0.01 (0.01)
< 0.01, < 0.01, < 0.01, < 0.01, < 0.01
< 0.01, < 0.01, < 0.01, < 0.01, < 0.01
21 < 0.01, < 0.01, < 0.01, < 0.01, < 0.01
0.01, 0.01, 0.01, 0.01, 0.01 (0.01)
< 0.01, < 0.01, < 0.01, < 0.01, < 0.01
< 0.01, < 0.01, < 0.01, < 0.01, < 0.01
24 < 0.01, < 0.01, < 0.01, < 0.01, < 0.01
< 0.01, 0.01, 0.01, < 0.01, 0.01 (0.01)
< 0.01, < 0.01, < 0.01, < 0.01, < 0.01
< 0.01, < 0.01, < 0.01, < 0.01, < 0.01
28 < 0.01, < 0.01, < 0.01, < 0.01, < 0.01
< 0.01, < 0.01, 0.01, 0.01, < 0.01 (0.01)
< 0.01, < 0.01, < 0.01, < 0.01, < 0.01
< 0.01, < 0.01, < 0.01, < 0.01, < 0.01
30 < 0.01, < 0.01 < 0.01, < 0.01 < 0.01, < 0.01 < 0.01, < 0.01
34 < 0.01 < 0.01 < 0.01 < 0.01

Penthiopyrad
1612
Samples taken on day 23 from all dose groups were separated in skim milk and cream. For the control, 1× and 3× dose group no residues above the LOQ of 0.01 mg/kg were found in any of the samples. For 10× detectable residues were found, but the levels were near the LOQ (see Table 143).
Table 139 Residues of penthiopyrad, PAM, PCA and 753-A-OH in skim milk and cream (10× dose group)
Matrix Penthiopyrad in mg/kg (mean)
PAM in mg/kg (mean)
PCA in mg/kg (mean) 753-A-OH in mg/kg (mean)
Skim milk < 0.01, < 0.01, < 0.01, < 0.01, < 0.01
< 0.01, < 0.01, < 0.01, < 0.01, < 0.01
< 0.01, < 0.01, < 0.01, < 0.01, < 0.01
< 0.01, < 0.01, < 0.01, < 0.01, < 0.01
Cream < 0.01, < 0.01, 0.01, 0.01, 0.01 (0.01)
< 0.01, 0.01, 0.01, 0.01, 0.01 (0.01)
< 0.01, < 0.01, < 0.01, < 0.01, < 0.01
< 0.01, < 0.01, < 0.01, < 0.01, < 0.01
In bovine tissues residues found are summarized in the following table.
Table 140 Residues in tissues of lactating cows after administration of 0.15 (1×), 0.48 (3×) or 1.65 (10×) mg penthiopyrad per kg bw and day
Matrix Dose level
Penthiopyrad in mg/kg (mean)
PAM in mg/kg (mean)
PCA in mg/kg (mean) 753-A-OH in mg/kg (mean)
Liver 1× 3× 10×
< 0.01, < 0.01, < 0.01 < 0.01, < 0.01, < 0.01 0.02, 0.03, 0.02 (0.02)
< 0.01, < 0.01, < 0.01 0.02, 0.01, 0.02 (0.02) 0.04, 0.03, 0.06 (0.04)
< 0.01, < 0.01, < 0.01 < 0.01, < 0.01, < 0.01 < 0.01, < 0.01, < 0.01
< 0.01, < 0.01, < 0.01 < 0.01, < 0.01, < 0.01 < 0.01, < 0.01, < 0.01
Muscle 1× 3× 10×
< 0.01, < 0.01, < 0.01 < 0.01, < 0.01, < 0.01 < 0.01, < 0.01, < 0.01
< 0.01, < 0.01, < 0.01 < 0.01, < 0.01, < 0.01 0.01, 0.01, 0.02 (0.013)
< 0.01, < 0.01, < 0.01 < 0.01, < 0.01, < 0.01 < 0.01, < 0.01, < 0.01
< 0.01, < 0.01, < 0.01 < 0.01, < 0.01, < 0.01 < 0.01, < 0.01, < 0.01
Kidney 1× 3× 10×
< 0.01, < 0.01, < 0.01 < 0.01, < 0.01, < 0.01 < 0.01, < 0.01, < 0.01
< 0.01, < 0.01, < 0.01 < 0.01, < 0.01, 0.01 (0.01) 0.03, 0.02, 0.03 (0.03)
< 0.01, < 0.01, < 0.01 < 0.01, < 0.01, < 0.01 < 0.01, < 0.01, < 0.01
< 0.01, < 0.01, < 0.01 < 0.01, < 0.01, < 0.01 < 0.01, < 0.01, < 0.01
Subcutaneous fat
1× 3× 10×
< 0.01 < 0.01, < 0.01 < 0.01, 0.01 (0.01)
< 0.01 < 0.01, < 0.01 < 0.01, < 0.01
< 0.01 < 0.01, < 0.01 < 0.01, < 0.01
< 0.01 < 0.01, < 0.01 < 0.01, < 0.01
Mesenteric fat
1× 3× 10×
< 0.01, < 0.01, 0.01 (0.01) < 0.01, < 0.01, < 0.01 < 0.01, 0.02, 0.02 (0.02)
< 0.01, < 0.01, < 0.01 0.01, 0.01, 0.01 (0.01) < 0.01, 0.01, 0.01 (0.01)
< 0.01, < 0.01, < 0.01 < 0.01, < 0.01, < 0.01 < 0.01, < 0.01, < 0.01
< 0.01, < 0.01, < 0.01 < 0.01, < 0.01, < 0.01 < 0.01, < 0.01, < 0.01
Renal fat 1×
< 0.01, < 0.01, < 0.01
< 0.01, < 0.01, < 0.01
< 0.01, < 0.01, < 0.01
< 0.01, < 0.01, < 0.01

Penthiopyrad
1613
Matrix Dose level
Penthiopyrad in mg/kg (mean)
PAM in mg/kg (mean)
PCA in mg/kg (mean) 753-A-OH in mg/kg (mean)
3× 10×
< 0.01, < 0.01, < 0.01 < 0.01, < 0.01, 0.01 (0.01)
< 0.01, < 0.01, < 0.01 < 0.01, < 0.01, 0.02 (0.01)
< 0.01, < 0.01, < 0.01 < 0.01, < 0.01, 0.02 (0.01)
< 0.01, < 0.01, < 0.01 < 0.01, < 0.01, < 0.01
Poultry
For laying hens a study conducted by Rodgers M (2009, PTHIO_039) involved administration of penthiopyrad via capsule for 28 consecutive days. Treatment levels were 0.4 (1×), 1.2 (3×) and 4.0 (10×) mg/kg bw/day and were calculated after the study to be equivalent to 5.85, 17.54 and 58.46 ppm in the feed. An additional 12 hens dosed at the 10× level were maintained for depuration. Subgroups of four hens were killed at 7, 14 and 21 days after the final dose administration. During the whole dosing period eggs were collected and after sacrificing the animal (within 6h after the final dosing) analysed with the tissues for residues of penthiopyrad, PAM, PCA and 753-A-OH.
Residues of penthiopyrad and its metabolites were determined by LC-MS/MS following extraction with acetone/water, hydrolysis of conjugates and partition of all analytes into ethyl acetate. Samples were coarsely chopped and mixed before pooling the tissues from each subgroup containing four hens which were then divided into two subsamples.
In eggs residues were generally low. At the high dose level (10×), PAM was quantified in all samples from Day 3 until Day 27 at levels ranging from 0.011 to 0.028 mg/kg. Penthiopyrad was measurable in only 7 of the 48 samples with concentration ranging from 0.011 to 0.016 mg/kg. 753-A-OH was measurable in only 4 of the 48 samples in concentrations ranging from 0.010 to 0. 0.014 mg/kg. PCA was not measurable in any sample and, moreover, was not detected in any sample. In control samples all residues were below the limit of determination (0.005 mg/kg) for all analytes (see Table 141).
Table 141 Residues in eggs of laying hens after administration of 0.4 (1×), 1.2 (3×) or 4.0 (10×) mg penthiopyrad per kg bw and day
Days Dose level
Penthiopyrad in mg/kg (mean)
PAM in mg/kg (mean) PCA in mg/kg (mean) 753-A-OH in mg/kg (mean)
–7 1× 3× 10×
< 0.01, < 0.01, < 0.01 < 0.01, < 0.01, < 0.01 < 0.01, < 0.01, < 0.01
< 0.01, < 0.01, < 0.01 < 0.01, < 0.01, < 0.01 < 0.01, < 0.01, < 0.01
< 0.01, < 0.01, < 0.01 < 0.01, < 0.01, < 0.01 < 0.01, < 0.01, < 0.01
< 0.01, < 0.01, < 0.01 < 0.01, < 0.01, < 0.01 < 0.01, < 0.01, < 0.01
–1 1× 3× 10×
< 0.01, < 0.01, < 0.01 < 0.01, < 0.01, < 0.01 < 0.01, < 0.01, < 0.01, < 0.01, < 0.01, < 0.01
< 0.01, < 0.01, < 0.01 < 0.01, < 0.01, < 0.01 < 0.01, < 0.01, < 0.01, < 0.01, < 0.01, < 0.01
< 0.01, < 0.01, < 0.01 < 0.01, < 0.01, < 0.01 < 0.01, < 0.01, < 0.01, < 0.01, < 0.01, < 0.01
< 0.01, < 0.01, < 0.01 < 0.01, < 0.01, < 0.01 < 0.01, < 0.01, < 0.01, < 0.01, < 0.01, < 0.01
1 1× 3× 10×
< 0.01, < 0.01, < 0.01 < 0.01, < 0.01, < 0.01 < 0.01, < 0.01, < 0.01, < 0.01, < 0.01, < 0.01
< 0.01, < 0.01, < 0.01 < 0.01, < 0.01, < 0.01 < 0.01, < 0.01, < 0.01, < 0.01, < 0.01, < 0.01
< 0.01, < 0.01, < 0.01 < 0.01, < 0.01, < 0.01 < 0.01, < 0.01, < 0.01, < 0.01, < 0.01, < 0.01
< 0.01, < 0.01, < 0.01 < 0.01, < 0.01, < 0.01 < 0.01, < 0.01, < 0.01, < 0.01, < 0.01, < 0.01
3 1×
< 0.01, < 0.01, < 0.01
< 0.01, < 0.01, < 0.01
< 0.01, < 0.01, < 0.01
< 0.01, < 0.01, < 0.01

Penthiopyrad
1614
Days Dose level
Penthiopyrad in mg/kg (mean)
PAM in mg/kg (mean) PCA in mg/kg (mean) 753-A-OH in mg/kg (mean)
3× 10×
< 0.01, < 0.01, < 0.01 < 0.01, < 0.01, < 0.01
< 0.01, < 0.01, < 0.01 0.011, 0.013, 0.014 (0.013)
< 0.01, < 0.01, < 0.01 < 0.01, < 0.01, < 0.01
< 0.01, < 0.01, < 0.01 < 0.01, < 0.01, < 0.01
5 1× 3× 10×
< 0.01, < 0.01, < 0.01 < 0.01, < 0.01, < 0.01 < 0.01, < 0.01, < 0.01
< 0.01, < 0.01, < 0.01 < 0.01, < 0.01, < 0.01 0.016, 0.017, 0.015 (0.016)
< 0.01, < 0.01, < 0.01 < 0.01, < 0.01, < 0.01 < 0.01, < 0.01, < 0.01
< 0.01, < 0.01, < 0.01 < 0.01, < 0.01, < 0.01 < 0.01, < 0.01, 0.014 (0.011)
8 1× 3× 10×
< 0.01, < 0.01, < 0.01 < 0.01, < 0.01, < 0.01 < 0.01, < 0.01, < 0.01, < 0.01, < 0.01, 0.012 (0.01)
< 0.01, < 0.01, < 0.01 < 0.01, < 0.01, < 0.01 0.015, 0.013, 0.016, 0.015, 0.020, 0.028 (0.018)
< 0.01, < 0.01, < 0.01 < 0.01, < 0.01, < 0.01 < 0.01, < 0.01, < 0.01, < 0.01, < 0.01, < 0.01
< 0.01, < 0.01, < 0.01 < 0.01, < 0.01, < 0.01 < 0.01, < 0.01, < 0.01, < 0.01, < 0.01, < 0.01
10 1× 3× 10×
< 0.01, < 0.01, < 0.01 < 0.01, < 0.01, < 0.01 < 0.01, < 0.01, 0.015 (0.012)
< 0.01, < 0.01, < 0.01 < 0.01, < 0.01, < 0.01 0.014, 0.017, 0.014 (0.015)
< 0.01, < 0.01, < 0.01 < 0.01, < 0.01, < 0.01 < 0.01, < 0.01, < 0.01
< 0.01, < 0.01, < 0.01 < 0.01, < 0.01, < 0.01 < 0.01, < 0.01, 0.01 (0.01)
12 1× 3× 10×
< 0.01, < 0.01, < 0.01 < 0.01, < 0.01, < 0.01 < 0.01, < 0.01, < 0.01
< 0.01, < 0.01, < 0.01 < 0.01, < 0.01, < 0.01 0.017, 0.016, 0.014 (0.016)
< 0.01, < 0.01, < 0.01 < 0.01, < 0.01, < 0.01 < 0.01, < 0.01, < 0.01
< 0.01, < 0.01, < 0.01 < 0.01, < 0.01, < 0.01 < 0.01, < 0.01, < 0.01
15 1× 3× 10×
< 0.01, < 0.01, < 0.01 < 0.01, < 0.01, < 0.01 < 0.01, < 0.01, < 0.01, < 0.01, 0.011, 0.016 (0.011)
< 0.01, < 0.01, < 0.01 < 0.01, < 0.01, < 0.01 0.015, 0.013, 0.015, 0.017, 0.021, 0.02 (0.017)
< 0.01, < 0.01, < 0.01 < 0.01, < 0.01, < 0.01 < 0.01, < 0.01, < 0.01, < 0.01, < 0.01, < 0.01
< 0.01, < 0.01, < 0.01 < 0.01, < 0.01, < 0.01 < 0.01, < 0.01, < 0.01, < 0.01, < 0.01, < 0.01
17 1× 3× 10×
< 0.01, < 0.01, < 0.01 < 0.01, < 0.01, < 0.01 < 0.01, < 0.01, 0.011 (0.01)
< 0.01, < 0.01, < 0.01 < 0.01, < 0.01, < 0.01 0.017, 0.013, 0.016 (0.015)
< 0.01, < 0.01, < 0.01 < 0.01, < 0.01, < 0.01 < 0.01, < 0.01, < 0.01
< 0.01, < 0.01, < 0.01 < 0.01, < 0.01, < 0.01 < 0.01, < 0.01, 0.011 (0.01)
19 1× 3× 10×
< 0.01, < 0.01, < 0.01 < 0.01, < 0.01, < 0.01 < 0.01, < 0.01, 0.01 (0.01)
< 0.01, < 0.01, < 0.01 < 0.01, < 0.01, < 0.01 0.017, 0.018, 0.018 (0.018)
< 0.01, < 0.01, < 0.01 < 0.01, < 0.01, < 0.01 < 0.01, < 0.01, < 0.01
< 0.01, < 0.01, < 0.01 < 0.01, < 0.01, < 0.01 < 0.01, < 0.01, 0.012 (0.011)
22 1× 3×
< 0.01, < 0.01, < 0.01 < 0.01, < 0.01, < 0.01
< 0.01, < 0.01, < 0.01 < 0.01, < 0.01, < 0.01
< 0.01, < 0.01, < 0.01 < 0.01, < 0.01, < 0.01
< 0.01, < 0.01, < 0.01 < 0.01, < 0.01, < 0.01

Penthiopyrad
1615
Days Dose level
Penthiopyrad in mg/kg (mean)
PAM in mg/kg (mean) PCA in mg/kg (mean) 753-A-OH in mg/kg (mean)
10×
< 0.01, < 0.01, < 0.01
0.015, 0.016, 0.018 (0.016)
< 0.01, < 0.01, < 0.01
< 0.01, < 0.01, < 0.01
25 1× 3× 10×
< 0.01, < 0.01, < 0.01 < 0.01, < 0.01, < 0.01 < 0.01, < 0.01, 0.011 (0.01)
< 0.01, < 0.01, < 0.01 < 0.01, < 0.01, < 0.01 0.012, 0.018, 0.014 (0.015)
< 0.01, < 0.01, < 0.01 < 0.01, < 0.01, < 0.01 < 0.01, < 0.01, < 0.01
< 0.01, < 0.01, < 0.01 < 0.01, < 0.01, < 0.01 < 0.01, < 0.01, < 0.01
27 1× 3× 10×
< 0.01, < 0.01, < 0.01 < 0.01, < 0.01, < 0.01 < 0.01, < 0.01, < 0.01, < 0.01, < 0.01, < 0.01
< 0.01, < 0.01, < 0.01 < 0.01, < 0.01, < 0.01 0.016, 0.013, 0.014, 0.017, 0.018, 0.02 (0.016)
< 0.01, < 0.01, < 0.01 < 0.01, < 0.01, < 0.01 < 0.01, < 0.01, < 0.01, < 0.01, < 0.01, < 0.01
< 0.01, < 0.01, < 0.01 < 0.01, < 0.01, < 0.01 < 0.01, < 0.01, < 0.01, < 0.01, < 0.01, < 0.01
30 10× < 0.01, < 0.01, < 0.01 < 0.01, < 0.01, < 0.01 < 0.01, < 0.01, < 0.01 < 0.01, < 0.01, < 0.01
32 10× < 0.01, < 0.01, < 0.01 < 0.01, < 0.01, < 0.01 < 0.01, < 0.01, < 0.01 < 0.01, < 0.01, < 0.01
34 10× < 0.01, < 0.01, < 0.01 < 0.01, < 0.01, < 0.01 < 0.01, < 0.01, < 0.01 < 0.01, < 0.01, < 0.01
38 10× < 0.01, < 0.01 < 0.01, < 0.01 < 0.01, < 0.01 < 0.01, < 0.01
41 10× < 0.01, < 0.01 < 0.01, < 0.01 < 0.01, < 0.01 < 0.01, < 0.01
45 10× < 0.01 < 0.01 < 0.01 < 0.01
48 10× < 0.01 < 0.01 < 0.01 < 0.01
In poultry tissues residues in the 1× and 3× dose group were all below the LOQ of
0.01 mg/kg. Only the 10× dose group showed residues above the LOQ. All matrices sampled from the animals destined for depuration were below 0.01 mg/kg for all analytes.
Table 142 Residues in tissues of laying hens after administration of 4.0 (10×) mg penthiopyrad per kg bw and day
Matrix Dose level
Penthiopyrad in mg/kg (mean)
PAM in mg/kg (mean) PCA in mg/kg (mean) 753-A-OH in mg/kg (mean)
Liver 1× 3× 10×
< 0.01, < 0.01, < 0.01 < 0.01, < 0.01, < 0.01 < 0.01, 0.021, 0.018 (0.016)
< 0.01, < 0.01, < 0.01 < 0.01, < 0.01, < 0.01 0.017, 0.017, 0.019 (0.018)
< 0.01, < 0.01, < 0.01 < 0.01, < 0.01, < 0.01 < 0.01, 0.01, 0.014 (0.012)
< 0.01, < 0.01, < 0.01 < 0.01, < 0.01, < 0.01 < 0.01, < 0.01, 0.011 (0.01)
Muscle 1× 3× 10×
< 0.01, < 0.01, < 0.01 < 0.01, < 0.01, < 0.01 < 0.01, < 0.01, < 0.01
< 0.01, < 0.01, < 0.01 < 0.01, < 0.01, < 0.01 < 0.01, < 0.01, 0.01 (0.01)
< 0.01, < 0.01, < 0.01 < 0.01, < 0.01, < 0.01 < 0.01, < 0.01, < 0.01
< 0.01, < 0.01, < 0.01 < 0.01, < 0.01, < 0.01 < 0.01, < 0.01, < 0.01
Skin + Fat 1× 3×
< 0.01, < 0.01, < 0.01 < 0.01, < 0.01, < 0.01
< 0.01, < 0.01, < 0.01 < 0.01, < 0.01, < 0.01
< 0.01, < 0.01, < 0.01 < 0.01, < 0.01, < 0.01
< 0.01, < 0.01, < 0.01 < 0.01, < 0.01, < 0.01

Penthiopyrad
1616
Matrix Dose level
Penthiopyrad in mg/kg (mean)
PAM in mg/kg (mean) PCA in mg/kg (mean) 753-A-OH in mg/kg (mean)
10×
< 0.01, 0.016, 0.018 (0.015)
< 0.01, < 0.01, < 0.01
< 0.01, < 0.01, < 0.01
< 0.01, < 0.01, < 0.01
Abdominal fat
1× 3× 10×
< 0.01, < 0.01, < 0.01 < 0.01, < 0.01, < 0.01 0.016, 0.023, 0.036 (0.025)
< 0.01, < 0.01, < 0.01 < 0.01, < 0.01, < 0.01 < 0.01, < 0.01, < 0.01
< 0.01, < 0.01, < 0.01 < 0.01, < 0.01, < 0.01 < 0.01, < 0.01, < 0.01
< 0.01, < 0.01, < 0.01 < 0.01, < 0.01, < 0.01 < 0.01, < 0.01, < 0.01
APPRAISAL
Penthiopyrad (ISO common name) is a carboxamide fungicide used to control a broad spectrum of diseases on large varieties of crops. Penthiopyrad inhibits fungal respiration by binding to mitochondrial respiratory complex II. It was considered for the first time by the 2011 JMPR for toxicology, establishing an acceptable daily intake (ADI) of 0–0.1 mg/kg bw and an acute reference dose (ARfD) of 1 mg/kg bw.
The IUPAC name of penthiopyrad is (RS)-N-[2-(1,3-dimethylbutyl)-3-thienyl]-1-methyl-3-(trifluoromethyl) pyrazole-4-carboxamide and the CA name is N-[2-(1,3-dimethylbutyl)-3-thienyl]-1-methyl-3-(trifluoromethyl)-1H-pyrazole-4-carboxamide (9CI).
Penthiopyrad labelled either in the pyrazole- (P-label) or thienyl-moiety (T-label) was used in the metabolism and environmental fate studies.
The following abbreviations are used for the metabolites discussed below:
753-A-OH
753-F-DO
SNHN
N
OCF3
S
NHN
N
OCF3
OH
NN
ONH
OCF3
O
OH

Penthiopyrad
1617
PAM
PCA
DM-PCA
dihydroxy-cys-F-DO
dihydroxy-cys-T-DO
Animal metabolism
Information was available on metabolism of penthiopyrad in laboratory animals, lactating goats and laying hens.
Rats
In the 2011 JMPR Report on penthiopyrad the following conclusions were drawn by the WHO Experts regarding the metabolism of the active substance in rats:
“The absorption, distribution, metabolism and excretion of penthiopyrad were investigated in rats. 14C labelled penthiopyrad was rapidly and extensively absorbed from the gastrointestinal tract of rats following oral dosing. The extent of absorption was approximately 80–90% of the administered dose, independent of dose and sex.
Very little penthiopyrad was retained in the tissues.
Faecal excretion was the primary route of elimination, and excretion was rapid, with the majority excreted by all routes 24 hours after dosing (74.8–85.0%).
Extensive metabolism occurred at numerous positions within the molecule, including thienyl ring oxidation and conjugation with glutathione, thienyl ring opening, N-demethylation and alkyl side-chain hydroxylation, followed by oxidation to carboxylic acids and glucuronidation. The most abundant metabolite in both urine and faeces was formed as the result of N-demethylation and oxidation of the methyl moiety of the alkyl side-chain. The most abundant metabolites found in bile were formed as a result of thienyl ring oxidation to 753-F-DO, followed by its conjugation with glutathione and the catabolism of this product. Other significant metabolites in bile were glucuronic acid conjugates of the intermediate demethylated and hydroxylated metabolites. Four metabolites
NN
NH2
OCF3
NN
OH
OCF3
NNH
OH
OCF3
NN
ONH
OCF3
O
OH
Cys
dihydroxy
NN
SNH
OCF3
O
OH
Cys
dihydroxy

Penthiopyrad
1618
containing the pyrazole moiety following cleavage from the thienyl moiety were excreted in both urine and faeces. The two acids, 1-methyl-3-trifluoromethyl-1H-pyrazole-4-carboxylic acid (PCA) and 3-trifluoromethyl-1H-pyrazole-4-carboxylic acid (DM-PCA) are likely formed by amide hydrolysis from 1-methyl-3-trifluoromethyl-1H-pyrazole-4-carboxamide (PAM) and DM-PAM. PAM and subsequent metabolites account for less than 1% of the administered dose. The thienyl ring appears to be completely degraded.”
Goats
Two studies on metabolism in goats were available. In the first study on lactating goats radiolabelled penthiopyrad was administered at a rate equivalent to 20 ppm in the feed, less than 1% of the total dose was recovered from milk or tissues of the animals. Most of the radioactivity was excreted via faeces and urine.
In muscle and fat TRR levels were 0.011–0.038 mg eq/kg and 0.015–0.028 mg eq/kg, respectively. For muscle only PAM and PCA were identified present at 51% and 7% of the TRR. In fat unchanged penthiopyrad (32% TRR, 0.009 mg eq/kg) and PAM (12% TRR, 0.003 mg eq/kg) were the only structures identified.
For kidney (TRR: 0.11–0.33 mg eq/kg) PAM was the major component for the P-label accounting for 19% of the TRR (0.062 mg eq/kg). Unchanged penthiopyrad was detected in traces only (3% TRR, 0.011 mg eq/kg). For the T-label only 753-A-OH was identified, being present at 6% of the TRR (0.007 mg eq/kg). The remaining radioactivity for both labels could not be attributed to specific reference compounds.
In liver TRR levels were 1.9 mg eq/kg for P- and 0.99 mg eq/kg for the T-label. Of the TRR 2% (0.037 mg eq/kg, T-label only) could be attributed to penthiopyrad. The radioactivity recovered was distributed between numerous analytical peaks accounting less than 10% of the TRR each. Identified metabolites were PAM (3% TRR, 0.053 mg eq/kg), PCA (9% TRR, 0.17 mg eq/kg), 753-F-DO (1% TRR, 0.02 mg eq/kg) and 753-A-OH (0.5% TRR, 0.005 mg eq/kg).
In the second study on lactating goats the animals were administered radiolabelled penthiopyrad at rates equivalent to 10 ppm in the feed. TRR levels found were 0.66–0.74 mg eq/kg in liver, followed by kidney (0.15–0.17 mg eq/kg). In muscle, fat and milk the TRR was between 0.013 to 0.072 mg eq/kg.
In muscle PAM was identified as major metabolite being present at levels of 46% of the TRR (0.012 mg eq/kg). In addition traces of DM-PAM were detected (12% TRR, 0.003 mg eq/kg). In fat only DM-PAM, PAM and penthiopyrad were detected at traces up to 0.005 mg eq/kg.
In milk PAM was the major residue at 30% of the TRR (0.013 mg eq/kg) for the P-label, followed by cys-T-DO-isomer with 16% of the TRR (0.007 mg eq/kg). For the T-label the degradation was more extensive, showing unattributed analytical peaks at levels of 8% of the TRR or less (0.008 mg eq/kg or less) each.
In liver solvent extraction with ACN/water released approx. 40% of the TRR, characterised as numerous unassigned analytical peaks present at < 10% of the TRR each. Only hydroxy-penthiopyrad was found in the T-label sample at or above 10% of the TRR (10% TRR, 0.069 mg eq/kg). Following protease, acid and base hydrolysis 97–99% of the TRR could be released. Identification of the residue again gave mainly unassigned chromatographic peaks quantified at rates of < 4% of the TRR each. Only PCA and PAM were identified at levels of 13% (0.10 mg eq/kg) and 8% (0.063 mg eq/kg) of the TRR, respectively.
For kidney solvent extraction with ACN/water gave numerous single metabolites each below 10% of the TRR (0.017 mg eq/kg and less). For the T-label only PAM and the dihydroxy-cys-F-DO isomer were present at amounts of 10% (0.016 mg eq/kg) and 11% (0.017 mg eq/kg) of the TRR, respectively. After protease, acid and base hydrolysis 97–103% of the TRR were released. A large number of substances at individual levels all below 4% of the TRR (0.006 mg eq/kg or less) were found. Additional major metabolites at levels > 10% of the TRR could not be identified.

Penthiopyrad
1619
Laying hens
For laying hens radiolabelled penthiopyrad equivalent to 10 ppm in the diet was administered for 14 consecutive days. For both the P- and the T-label TRR levels in egg yolk (0.28–0.37 mg eq/kg) were higher than in the egg white (0.05–0.06 mg eq/kg). In tissues TRR levels were 0.021–0.049 mg eq/kg in fat, 0.038–0.052 mg eq/kg in muscle, 0.053–0.059 mg eq/kg in skin and 0.6–0.68 mg eq/kg in liver.
In egg white PAM was the major residue present following administration of the P-label, being present up to 50% of the TRR. Unchanged penthiopyrad was identified in all samples, but near the LOQ (0.001 mg/kg). In addition minor levels of 753-A-OH (5–7% TRR) were found.
For egg yolk PAM was the major residue (24–28% of the TRR) following solvent extraction. Hydrolysis released additional 10% of the TRR as PAM. Penthiopyrad was found at levels of 2–15% of the TRR following hydrolysis. Additional minor metabolites all being present at levels of < 10% of the TRR each could be attributed to known reference substances.
For hens’ liver also numerous metabolites were present at individual levels of 13% of the TRR and less (0.079 mg eq/kg and less). The only substances identified were PCA with 1.4% TRR (0.009 mg eq/kg) and PAM with 8% TRR (0.05 mg eq/kg). Following hydrolysis, releasing the major part of the radioactivity, PCA and PAM gave additional amounts of 2% TRR (0.012 mg eq/kg) and 7% TRR (0.043 mg eq/kg), respectively.
In a second study laying hens were administered radiolabelled penthiopyrad equivalent to 10 ppm in the diet. TRR levels found were 0.062–0.094 mg eq/kg in whole eggs, 0.014–0.022 mg eq/kg in muscle, 0.014–0.02 mg eq/kg in fat and 0.24–0.35 mg eq/kg in liver. Further investigation on the nature of residues was performed for eggs and liver only.
For eggs a broad pattern of metabolites all being present below 0.01 mg eq/kg (less than 16% of the TRR) was found. PAM was identified as major residue (0.007 mg eq/kg, 11% TRR) followed by DM-PAM (0.004 mg eq/kg, 7% TRR). Hydrolysis released some additional radioactivity too low for further identification. Only two major chromatographic peaks attributed to PAM were detected, adding 0.01 mg eq/kg for the P-label and 0.008 mg eq/kg for the T-label.
In liver numerous metabolites were found mainly being present at individual levels of < 10% of the TRR for both labels. PAM was the major residue in hens’ liver for the P-label with a total amount of 0.046 mg eq/kg parent equivalents (19% of the TRR). For the T-label dihydroxy-cys-T-DO was identified following digestion at a total of 0.042 mg eq/kg parent equivalents (12% of the TRR).
No unchanged penthiopyrad could be identified in hens liver or eggs.
In summary penthiopyrad is effectively degraded in goats and hens into a large number of minor metabolites following hydrolysis, oxidation, N-demethylation and conjugation. Major metabolites were mainly PAM, formed by cleavage of the molecule, or the hydroxylation product 753-A-OH. Unchanged parent substance was found in several samples; however, individual levels were normally below 10% of the TRR. The metabolites dihydroxy-cys-F-DO in goats’ kidney (11%TRR, 0.017 mg eq/kg) and dihydroxy-cys-T-DO in hens liver (12%TRR, 0.042 mg eq/kg) wer not identified in rats. All other major metabolites identified were also found in rats.
Plant metabolism
The Meeting received plant metabolism studies for penthiopyrad following foliar application to grapes, cabbage, tomatoes, wheat and rape seed using a mixture of both radiolabelled active substances.
Grapes
Two plots of grapes were treated with a 1:1 mixture of P- and T-radiolabelled penthiopyrad at rates equivalent to 0.4 kg ai/ha each. Samples of grapes and leaves were collected after either 30 of 60 days. Total radioactive residues in grapes were 0.20–0.24 mg eq/kg after 30 days and 0.083–0.21 mg eq/kg after 60 days. In leaves TRR levels of 5.1 mg eq/kg were found 30 day after treatment (DAT) and of 3.3 mg eq/kg 60 DAT.

Penthiopyrad
1620
Rinsing of grapes released 24% and 12% of the TRR from 30 DAT and 60 DAT samples, respectively. In the rinse unchanged parent penthiopyrad was the major residue (11% TRR for 30 DAT and 2.4% TRR for 60 DAT). In the rinsed fruits penthiopyrad amounts of 9% TRR for 30 DAT and 2.4% TRR for 60 DAT were found. Besides PAM in grapes after 60 DAT (13% TRR) no further metabolites present at relative amounts > 10 of the TRR were identified. Additional attempts for identification using acid hydrolysis released minor amounts of 753-A-OH.
Cabbage
Cabbage plants were treated with a SC formulation using application rates equivalent to either 0.2 or 1 kg ai/ha. After 21 days samples of outer leaves, inner heads and roots were samples and analysed for residues. Total radioactive residues were 1.4 mg eq/kg and 7.9 mg eq/kg for outer leaves, 0.045 mg eq/kg and 0.16 mg eq/kg for inner heads and 0.48 mg eq/kg and 2.6 mg eq/kg for roots, following the lower or higher application rate, respectively.
Rinsing of the outer leaves recovered 44% of the TRR for both application rates. Rinsing the inner leaves additionally recovered 8–11% of the TRR. In the rinses and extracts of leaves penthiopyrad was identified as the major residue, represent at 20–34% of the TRR. Metabolites DM-753, 753-F-DO, 753-A-OH, PCA and PAM were identified, however only PAM was present at amounts higher than 10% of the TRR (10–11% TRR).
Tomatoes
Field grown tomatoes were treated with a 1:1 mixture of P- or T-radiolabelled penthiopyrad at rates equivalent to either 0.3 kg ai/ha or 1.5 kg ai/ha. Total radioactive residues for the low and high rate plots found in fruits after 14 days were 0.014 mg eq/kg and 0.46 mg eq/kg and after 21 days 0.022 mg eq/kg and 0.28 mg eq/kg, respectively. In leaves (21 DAT) TRR levels of 0.65 mg eq/kg for the low rate and 4.8 mg eq/kg for the high rate samples were found.
Rinsing of fruits treated with the higher application rate recovered 76% of the TRR after 14 days and 68% of the TRR after 21 days. In the 14 DAT samples 45% of the TRR (combined rinse and extract) were identified as penthiopyrad, decreasing to 23–38% TRR after 21 days of the TRR. Other metabolites identified were PAM (4–6% TRR), PCA (4–8% TRR), 753-A-OH (1% TRR) and 753-F-DO (3–4% TRR).
In leaves treated with low or high rates penthiopyrad was the major residue with levels ranging from 37% to 55% (0.24 and 2.7 mg eq/kg), respectively. Identified metabolites were PCA (8% TRR or 0.053 mg eq/kg; 3% TRR or 0.14 mg eq/kg), PAM (4% TRR or 0.027 mg eq/kg; 5% TRR or 0.24 mg eq/kg) and 753-F-DO (2% TRR or 0.014 mg eq/kg; 5% TRR or 0.22 mg/kg).
Wheat
Wheat plants were treated with a 1:1 mixture of P- and T-radiolabelled penthiopyrad in the field at application rates equivalent to 2× 0.25 kg ai/ha or 2× 0.75 kg ai/ha. The applications were conducted at stem elongation and the end of flowering (BBCH 59). Samples of forage (7 days after 1st application), hay (5 days after 2nd application), wheat and straw (32 days after 2nd application) were collected. TRR levels found were 6.5 mg eq/kg and 22 mg eq/kg for forage, 4.0 mg eq/kg and 17 mg eq/kg for hay, 9.4 mg eq/kg and 42 mg eq/kg for straw and 0.34 mg eq/kg and 0.87 mg eq/kg for grain following low or high rate treatment, respectively. Only low rate samples were further analysed.
In forage and hay unchanged penthiopyrad was the major residue being present at 75% and 44% of the TRR. Other metabolites identified (PAM, PCA, F-DO and 753-T-DO) each amounted less than 5% of the TRR in forage and hay. In straw penthiopyrad also contributed most to the TRR (19%). Identified metabolites were identical to forage and hay; however PCA and PAM were found at slightly higher levels of 9% and 6% of the TRR, respectively.
In grain penthiopyrad was found at 8% of the TRR, representing the major residue. Both PAM and PCA were present at 4% of the TRR. No further metabolites were identified in grain.

Penthiopyrad
1621
Rape seed
Rape seed plants (canola) was treated with a 1:1 mixture of P- or T-radiolabelled penthiopyrad in the field two times with 0.4 kg ai/ha at stem elongation and the end of flowering. Forage was collected 14 days after the first application, mature seeds 34 days after the second application. TRR levels in forage and seeds were 12 mg eq/kg and 0.14 mg eq/kg, respectively.
In forage the major residue was 753-A-OH malonyl glucoside (25% TRR, 3.0 mg eq/kg). Unchanged penthiopyrad was found at 11% of the TRR (1.4 mg eq/kg). Other metabolites were all below 10% of the TRR remained mainly unidentified except PAM (1 % TRR, 0.16 mg eq/kg), PCA (0.5% TRR, 0.062 mg eq/kg) and DM-A-OH malonyl glucoside (9%TRR, 1.1 mg eq/kg).
In seeds penthiopyrad and PCA were identified at the LOQ of 0.001 mg/kg (0.7% TRR) in the organic phase following extraction. Approximately 27% of the TRR (0.038 mg eq/kg) was indistinguishable from natural lipids. In the aqueous phase DM-PAM and PAM were attributed to 2 chromatographic peaks at levels of 5% TRR (0.007 mg eq/kg) and 8% TRR (0.011 mg eq/kg), respectively. Additional PCA was found with 2% TRR (0.003 mg/kg). No further metabolites were identified in the aqueous phase.
Summary
In summary the plant metabolism of penthiopyrad is extensive. Following hydroxylation of the dimethyl-butyl-side chain, 753-A-OH is formed as the first stable intermediate. Subsequently conjugation with glucose or glucose malonyl occurs. In case of a hydroxylation at the thienyl moiety, the metabolite 753-F-DO is formed after substitution of the sulphur by oxygen. This structure is then cleaved, leaving the pyrazole moiety to form PAM, PCA and DM-PCA. All major metabolites identified were also found in rats.
Environmental fate in soil
The Meeting received information on the fate of penthiopyrad after aerobic degradation in soil and after photolysis on the soil surface. In addition, the Meeting received information on the uptake of penthiopyrad soil residues by rotational crops. Experiments were carried out using penthiopyrad 14C labelled in the pyrazole or thienyl moiety.
In aerobic soil metabolism studies the metabolic pattern was more or less comparable to the plant metabolism. In nearly all samples PAM, PCA, 753-A-OH and 753-F-DO were found at levels of 2–10% of the applied radioactivity (AR). DM-PCA was identified as major residue in most samples, although mainly being present at levels below 10% of the AR after 140–269 days (in two samples up to 17% and 28% of the AR). Depending on the soil type remaining levels of penthiopyrad ranged from 11% to 78% of the AR (161–300 d). Estimated half-life times (1st order kinetics) were between 65 to 356 days for penthiopyrad.
Soil photolysis of penthiopyrad resulted in less than 50% remaining after three days. After 15 days only 4% of the initial concentration of the parent was recovered from the soil. According to the underlying study the irradiation of 15 days corresponds to 29 midsummer days at latitude 50°N. Main degradation products were PAM and PCA with 27% and 23% of the initial activity, respectively.
Residues in rotational crops
In a confined rotational crop study, a 1:1 mixture of P- and T-radiolabelled penthiopyrad was applied to bare soil at a rate equivalent to 0.8 kg ai/ha. Rotational crops (spinach, lettuce, radish and wheat) were sown or planted 30, 120 and 360 days later. Radioactive residues above the LOQ of 0.001 mg eq/kg were found in all samples, ranging from 0.011–0.73 mg eq/kg after the first, 0.005–0.16 mg eq/kg for the second and 0.003–0.086 mg eq/kg after the third rotation.

Penthiopyrad
1622
Identification of radioactivity was performed for samples with TRR levels above 0.01 mg/kg parent equivalents. Although extraction released 50–100% of the TRRs, rates of identification were low, showing 753-A-OH as highest residue present in spinach leaves (0.039 mg eq/kg). Parent penthiopyrad was identified in chaff samples from 30 days crops rotation. In addition PCA and DM-PAM were identified in spinach leaves and chaff (0.012–0.014 mg eq/kg). In other samples the radioactivity was present in polar fractions consisting of at least 14 individual components not further identified.
Field rotation studies reflecting authorised application rates are available from Europe and the USA. In Europe either cucumbers (Southern Europe) or barley (Northern Europe) were treated with two sprayings of 0.4 kg ai/ha each. Lettuce, spinach, radish, wheat and barley were planted as rotational crops. In all samples no residues above the LOQ were found for penthiopyrad except one detect at 0.017 mg/kg in radish roots. PCA and DM-PCA were frequently present in lettuce, radish and wheat, ranging up to 0.16 mg/kg for DM-PCA in wheat forage. PAM, 753-A-OH and 753-F-DO were not found above the LOQs of 0.01–0.05 mg/kg.
In USA trials field crops were treated with application rates of four sprayings with 0.25 kg ai/ha each. Radish, lettuce and wheat were planted as rotational crops and grown to maturity. In none of the samples residues above the LOQ were found for penthiopyrad, 753-A-OH, 753-F-DO and PCA. Several minor results of up to 0.064 mg/kg were found for PAM, while DM-PCA was present in most samples ranging up to 0.12 mg/kg (radish tops).
In soil the degradation pathway is similar to plants, although no conjugates were observed. The translocation of residues into rotational crops was limited mainly to PCA and DM-PCA, latter being found in concentrations up to 0.09 mg/kg in food commodities, but without a tendency for accumulation. Based on the current use pattern from the USA, the submitted field rotation studies provide a realistic estimate for potential residues arising. For penthiopyrad, PAM, 753-A-OH and 753-F-DO no significant uptake via the roots occurred.
Methods of residue analysis
The Meeting received a number of analytical methods have for the analysis of penthiopyrad, PAM, PCA, 753-A-OH, 753-F-DO and DM-PCA in plant and animal matrices. The basic principle employs extraction by homogenisation with acetone/water or acetonitrile/water. After partitioning against an organic solvent (normally ethyl acetate) the extracts were cleaned with GPC or directly used for analysis. Residues are determined by liquid chromatography (LC) in combination with tandem mass spectroscopy (MS/MS). Validated LOQs for all analytes were 0.01 mg/kg for plant and animal matrices.
For the application of multi-residue methods the DFG S-19 was tested with satisfactory recoveries for parent penthiopyrad. The metabolites PAM, PCA and DM-PCA did not give acceptable recoveries using the DFG S-19 method.
Stability of residues in stored analytical samples
The Meeting received information on the storage stability of penthiopyrad, PAM, PCA, 753-A-OH, 753-F-DO and DM-PCA in plant and animal matrices. The results confirmed the stability of residues for all analytes for at least 18 months in plant matrices.
In animal matrices the percentage of recoveries were measured after a period of one month. Within this timeframe, which covers the storage period of animal metabolism and feeding studies submitted, no significant degradation of the analytes was observed. For bovine milk the storage stability of penthiopyrad, 753-A-OH, PAM and PCA was tested for up to 6 months without significant degradation.

Penthiopyrad
1623
Definition of the residue
Livestock animal metabolism studies were conducted on laying hens (10 ppm) and lactating goats (10 and 20 ppm). In lactating goats penthiopyrad was seldom present, normally near the LOQ amounting 2–3% of the TRR in liver and kidney. In fat 32% of the TRR were present as penthiopyrad, however absolute levels were low (0.009 mg eq/kg). The major residue in goats was PAM, being present at 10% TRR in milk, 3% TRR in liver, 19 % TRR in kidney, 8% TRR in muscle and 12% TRR in fat. Except for dihydroxy-cys-F-DO in goats kidney (11%TRR, 0.017 mg eq/kg) other metabolites were only identified at minor levels less than 10% TRR or less than 0.01 mg eq/kg in tissues and milk, even following acidic, basic or enzymic hydrolysis.
For laying hens parent penthiopyrad was only detected in eggs (up to 0.038 mg eq/kg or 15% TRR in egg yolk). The major residue identified was PAM with levels of 50% TRR in egg white, 24% TRR in egg yolk and 15% TRR in liver (sum of extracts). Except for dihydroxy-cys-T-DO found in one hen’s liver sample (0.042 mg eq/kg, 12% TRR) all other metabolites were present at less than 10% of the TRR or less than 0.01 mg eq/kg in tissue and eggs even following acidic, basic or enzymic hydrolysis..
The Meeting concluded that penthiopyrad and PAM were the major residues found in all animal matrices. While parent penthiopyrad was more associated with fatty compartments, PAM was the dominant residue found in tissues, milk and eggs. Analytical methods are capable of measuring both analytes.
Concerning the toxicological relevance of penthiopyrad and its metabolites, PAM was identified to be of higher acute toxicity compared to the parent substance. However PAM was also identified in rats and is covered by the toxicological endpoints of the parent penthiopyrad. The major metabolites dihydroxy-cys-F-DO in goats’ kidney and dihydroxy-cys-T-DO in hens’ liver were not found in the rat. Dihydroxy degradates would be derived from the monohydroxy-F and –T-DO metabolites, which are found in rats and have very little toxicity concern. Any further metabolism would result in non-toxic products and they would be readily excreted in the body. Other metabolites (PCA, 753-F-DO, 753-A-OH and DM-PCA) are also of lower acute toxicity than penthiopyrad.
For MRL compliance and for dietary intake assessment the Meeting recommended use of the sum of penthiopyrad and PAM, expressed as penthiopyrad, in animal matrices. Although the parent substance was found at higher levels in fat than in muscle, the overall residue including PAM was evenly distributed, suggesting that the residue is not fat-soluble.
The fate of penthiopyrad in plants was investigated following foliar application to grapes, cabbage, tomatoes, wheat and rape seed. The parent substance was the major residue, being present at levels of 21% TRR in grapes, 20–34% TRR in cabbage, 45–46% TRR in tomatoes, 19% TRR in wheat grain and 11% TRR in rape seeds. The only other major metabolite found was PAM (14% TRR in grapes, 11% TRR in cabbage, 6% TRR in tomato, 6% TRR in wheat grain and 1% TRR in rape seeds). Further minor metabolites identified (PCA, 753-F-DO, 753-A-OH, DM-PCA) were normally below 10% of the TRR and often below the limit for identification.
Data from supervised field trials confirmed the results of the plant metabolism studies. Parent penthiopyrad was the highest residue of all analytes, followed by PAM and PCA. 753-F-DO and 753-A-OH were normally not present above the LOQ (0.01 mg/kg). DM-PCA was found in soil and may be taken up by following crops, resulting in detectable residues above the LOQ up to 0.09 mg/kg in food items under field conditions. However, DM-PCA is of lower acute toxicity than the parent substance and its residues make an insignificant contribution to the overall exposure compared to penthiopyrad and PAM.
Based on the overall data in plants the Meeting concluded that parent penthiopyrad is a suitable marker substance for compliance of MRLs for plant commodities. Penthiopyrad can be analysed using established analytical methods.
For dietary intake purposes PAM is covered by the toxiological reference values for penthiopyrad. Other metabolites (PCA, 753-F-DO, 753-A-OH and DM-PCA) were of lower acute

Penthiopyrad
1624
toxicity compared to parent penthiopyrad and contributing insignificantly to the overall exposure compared to concentrations found for penthiopyrad and PAM.
The Meeting recommends that for MRL compliance the residue definition for plant commodities should be penthiopyrad. For dietary intake purposes the residue is defined as sum of penthiopyrad and PAM, expressed as penthiopyrad.
Definition of the residue for compliance with MRL for plant commodities: penthiopyrad
Definition of the residue for compliance with MRL for animal commodities and (for the estimation of dietary intake) for plant and animal commodities: sum of penthiopyrad and 1-methyl-3-trifluoromethyl-1H-pyrazole-4-carboxamide (PAM), expressed as penthiopyrad
The residue is not fat-soluble.
Results of supervised residue trials on crops
The Meeting received supervised trial data for applications of penthiopyrad on a range of crops (fruits, vegetables, oilseed and cereal grains), conducted in Europe and North America. The OECD MRL calculator was used as a tool to assist in the estimation of maximum residue levels from the selected residue data set obtained from the supervised residue trials. As a first step, the Meeting reviewed all relevant factors related to each data set in arriving at a best estimate of the maximum residue level using expert judgement. Then the OECD calculator was employed. If the statistical calculation spreadsheet suggested a different value from that recommended by the Meeting, a brief explanation of the deviation was supplied.
In trials where duplicate field samples from replicated or unreplicated plots were taken at each sampling time and analysed separately, the mean sample was taken as the best estimate of the residue from the plot.
Labels (or translation of labels) were available from Japan and the USA, describing the registered uses of penthiopyrad.
Supervised field trial data for penthiopyrad conducted in Europe were submitted for various crops. However authorisations in European Member states are still pending, not allowing an assessment of these field trials.
For dietary intake assessment the residue is defined as the sum of penthiopyrad and PAM, expressed as penthiopyrad (referred to as “total”). Since residue data were expressed in mg of the specific analyte per kg sample, PAM needs to be converted into penthiopyrad equivalents. The corresponding factor is: PAM → penthiopyrad = 359.42 g/mol ÷ 193.13 g/mol = 1.86. In supervised field trials PAM residues were normally found at much lower levels than parent penthiopyrad. Therefore no adjustment of PAM or addition of LOQs was conducted, if both analytes were below the LOQ. For all other purposes of calculation < LOQ values were handled as their numeric value (e.g. < 0.01 mg/kg as 0.01 mg/kg).
This is illustrated below:
Penthiopyrad [mg/kg]
PAM [mg/kg]
Total [mg/kg]* (Sum of penthiopyrad and PAM, expressed as penthiopyrad equivalents)
< 0.01 < 0.01 < 0.01 0.1 < 0.01 0.12 (0.1 + 1.86 × 0.01) < 0.01 0.1 0.2 (0.01 + 1.86 × 0.1) 0.1 0.1 0.29 (0.1 + 1.86 × 0.1) * rounded to two significant figures above the LOQ

Penthiopyrad
1625
Pome fruits
Penthiopyrad is registered in Canada and the USA for the use on pome fruit at rates of 3–4 × 0.3 kg ai/ha with a PHI of 28 day. Supervised field trials conducted in the USA on apples and pears according to these GAPs were submitted.
Residues of parent penthiopyrad in apple were (n = 17): < 0.01, 0.076, 0.099, 0.12(4), 0.13, 0.14, 0.14, 0.15, 0.16, 0.21, 0.22 and 0.23(3) mg/kg.
The total residues in apples were (n = 17): < 0.01, 0.10, 0.12, 0.13, 0.13, 0.14, 0.14, 0.15, 0.15, 0.16, 0.17, 0.17, 0.22, 0.24, 0.24, 0.25 and 0.26 mg/kg.
Residues of parent penthiopyrad in pears were (n = 10): < 0.01, 0.035, 0.064, 0.097, 0.12, 0.17, 0.18, 0.19, 0.22 and 0.25 mg/kg.
The total residues in pears were (n = 10): < 0.01, 0.05, 0.09, 0.12, 0.13, 0.19, 0.20, 0.22, 0.24 and 0.27 mg/kg.
The Meeting noted that corresponding GAP is for all pome fruits and decided to make recommendations for the whole group. Residues in apples and pears treated according to the US GAP for pome fruits were not significantly different and may be combined.
Residues of parent penthiopyrad in pome fruits were (n = 27): < 0.01, < 0.01, 0.035, 0.064, 0.076, 0.097, 0.099, 0.12(5), 0.13, 0.14, 0.14, 0.15, 0.16, 0.17, 0.18, 0.19, 0.21, 0.22, 0.22, 0.23(3) and 0.25 mg/kg.
The total residues in pome fruits were (n = 27): < 0.01, < 0.01, 0.05, 0.09, 0.10, 0.12, 0.12, 0.13(3), 0.14, 0.14, 0.15, 0.15, 0.16, 0.17, 0.17, 0.19, 0.20, 0.22, 0.22, 0.24(3), 0.25, 0.26 and 0.27 mg/kg.
Based on the combined dataset for apples and pears the Meeting estimated a maximum residue level, an STMR and an HR of 0.4 mg/kg, 0.15 mg/kg and 0.27 mg/kg for penthiopyrad in pome fruits, respectively.
Stone fruits
Residue data were provided to the Meeting from trials in USA on cherries, peaches and plums. GAP for stone fruits is for a maximum of four foliar applications of up to 0.3 kg ai/ha in Canada and for a maximum of three foliar applications of up to 0.35 kg ai/ha in the USA with a PHI of 0 days, respectively.
Residues of parent penthiopyrad in cherries (whole fruits) were (n = 9): 0.38, 0.44, 0.9, 0.96, 1.1, 1.1, 1.3, 1.6 and 1.7 mg/kg.
The total residues in cherries (pitted fruits) were (n = 9): 0.71, 0.8, 1.0, 1.0, 1.3, 1.3, 1.4, 1.8 and 1.9 mg/kg.
Residues of parent penthiopyrad in peaches (whole fruits) were (n = 13): 0.18, 0.2, 0.28, 0.35, 0.44, 0.47, 0.56, 0.58, 0.61, 0.61, 0.69, 0.7 and 1.4 mg/kg.
The total residues in peaches (pitted fruits) were (n = 13): 0.2, 0.31, 0.32, 0.4, 0.54, 0.60, 0.63, 0.67, 0.67, 0.71, 0.73, 0.76 and 1.6 mg/kg.
Residues of parent penthiopyrad in plums (whole fruits) were (n = 12): 0.047, 0.076, 0.08, 0.089, 0.1, 0.11, 0.12, 0.13, 0.15, 0.29, 0.51 and 0.77 mg/kg.
The total residues in plums (pitted fruits) were (n = 12): 0.068, 0.072, 0.099, 0.10, 0.12, 0.12, 0.13, 0.14, 0.14, 0.24, 0.33 and 0.83 mg/kg.
The Meeting noted that the corresponding GAP is for all stone fruits and decided to make recommendations on the whole group. However the Meeting recognized that datasets for individual commodities within the group were significantly different and could not be combined. Therefore recommendations on stone fruits will be based on cherries, representing the commodity resulting in highest residues within the group.
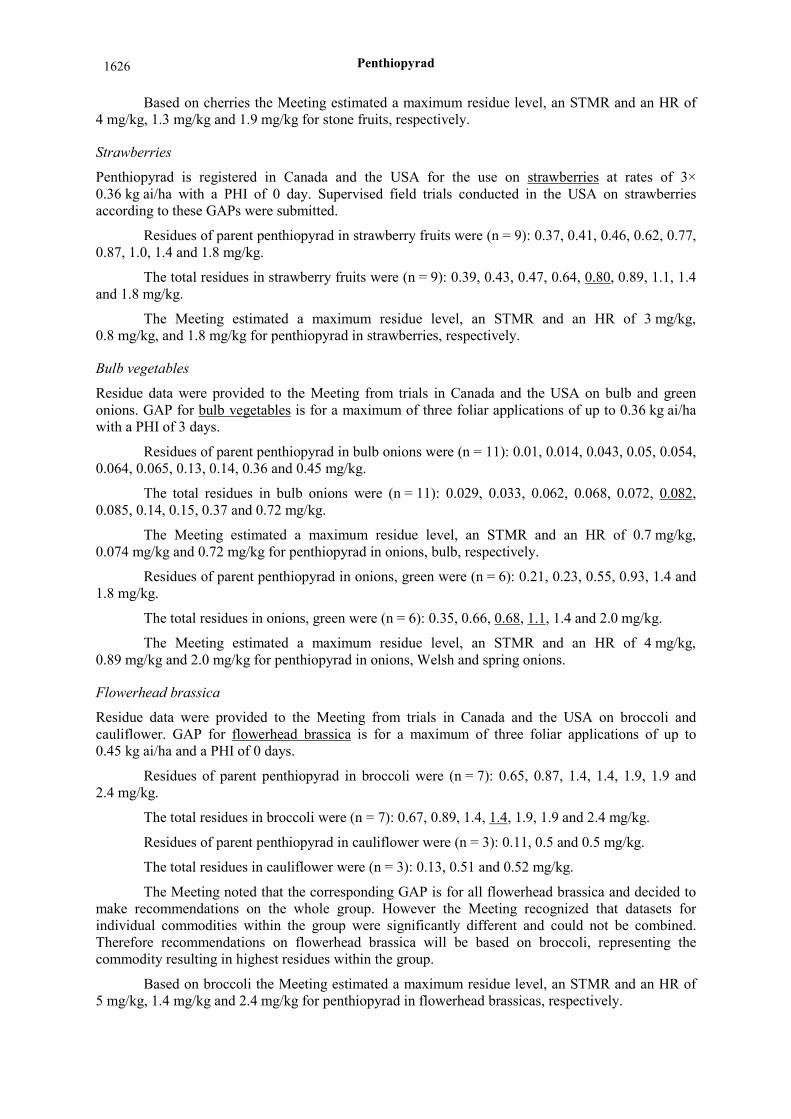
Penthiopyrad
1626
Based on cherries the Meeting estimated a maximum residue level, an STMR and an HR of 4 mg/kg, 1.3 mg/kg and 1.9 mg/kg for stone fruits, respectively.
Strawberries
Penthiopyrad is registered in Canada and the USA for the use on strawberries at rates of 3× 0.36 kg ai/ha with a PHI of 0 day. Supervised field trials conducted in the USA on strawberries according to these GAPs were submitted.
Residues of parent penthiopyrad in strawberry fruits were (n = 9): 0.37, 0.41, 0.46, 0.62, 0.77, 0.87, 1.0, 1.4 and 1.8 mg/kg.
The total residues in strawberry fruits were (n = 9): 0.39, 0.43, 0.47, 0.64, 0.80, 0.89, 1.1, 1.4 and 1.8 mg/kg.
The Meeting estimated a maximum residue level, an STMR and an HR of 3 mg/kg, 0.8 mg/kg, and 1.8 mg/kg for penthiopyrad in strawberries, respectively.
Bulb vegetables
Residue data were provided to the Meeting from trials in Canada and the USA on bulb and green onions. GAP for bulb vegetables is for a maximum of three foliar applications of up to 0.36 kg ai/ha with a PHI of 3 days.
Residues of parent penthiopyrad in bulb onions were (n = 11): 0.01, 0.014, 0.043, 0.05, 0.054, 0.064, 0.065, 0.13, 0.14, 0.36 and 0.45 mg/kg.
The total residues in bulb onions were (n = 11): 0.029, 0.033, 0.062, 0.068, 0.072, 0.082, 0.085, 0.14, 0.15, 0.37 and 0.72 mg/kg.
The Meeting estimated a maximum residue level, an STMR and an HR of 0.7 mg/kg, 0.074 mg/kg and 0.72 mg/kg for penthiopyrad in onions, bulb, respectively.
Residues of parent penthiopyrad in onions, green were (n = 6): 0.21, 0.23, 0.55, 0.93, 1.4 and 1.8 mg/kg.
The total residues in onions, green were (n = 6): 0.35, 0.66, 0.68, 1.1, 1.4 and 2.0 mg/kg.
The Meeting estimated a maximum residue level, an STMR and an HR of 4 mg/kg, 0.89 mg/kg and 2.0 mg/kg for penthiopyrad in onions, Welsh and spring onions.
Flowerhead brassica
Residue data were provided to the Meeting from trials in Canada and the USA on broccoli and cauliflower. GAP for flowerhead brassica is for a maximum of three foliar applications of up to 0.45 kg ai/ha and a PHI of 0 days.
Residues of parent penthiopyrad in broccoli were (n = 7): 0.65, 0.87, 1.4, 1.4, 1.9, 1.9 and 2.4 mg/kg.
The total residues in broccoli were (n = 7): 0.67, 0.89, 1.4, 1.4, 1.9, 1.9 and 2.4 mg/kg.
Residues of parent penthiopyrad in cauliflower were (n = 3): 0.11, 0.5 and 0.5 mg/kg.
The total residues in cauliflower were (n = 3): 0.13, 0.51 and 0.52 mg/kg.
The Meeting noted that the corresponding GAP is for all flowerhead brassica and decided to make recommendations on the whole group. However the Meeting recognized that datasets for individual commodities within the group were significantly different and could not be combined. Therefore recommendations on flowerhead brassica will be based on broccoli, representing the commodity resulting in highest residues within the group.
Based on broccoli the Meeting estimated a maximum residue level, an STMR and an HR of 5 mg/kg, 1.4 mg/kg and 2.4 mg/kg for penthiopyrad in flowerhead brassicas, respectively.

Penthiopyrad
1627
Cabbages, Head
Residue data were provided to the Meeting from trials in Canada and the USA on head cabbage. GAP for head cabbages is for a maximum of three foliar applications of up to 0.45 kg ai/ha and a PHI of 0 days.
Residues of parent penthiopyrad in head cabbage were (n = 10): 0.024, 0.089, 0.19, 0.22, 0.29, 0.48, 1.0, 1.3, 1.5 and 2.3 mg/kg.
The total residues in head cabbage were (n = 10): 0.043, 0.11, 0.21, 0.24, 0.31, 0.49, 1.0, 1.3, 1.5 and 2.4 mg/kg.
The Meeting estimated a maximum residue level, an STMR and an HR of 4 mg/kg, 0.4 mg/kg and 2.4 mg/kg for penthiopyrad in head cabbages, respectively.
Fruiting vegetables, Cucurbits
Residue data were provided to the Meeting from trials in Canada and the USA on summer squash, cucumber, melon and winter squash. GAP in the field for cucurbits (cucumbers, melons, watermelons, squashes) is for a maximum of four foliar applications of up to 0.3 kg ai/ha and a PHI of 1 days.
Residues of parent penthiopyrad in summer squash were (n = 4): 0.01, 0.13, 0.18 and 0.19 mg/kg.
Residues of parent penthiopyrad in cucumber were (n = 10): 0.012, 0.015, 0.029, 0.034, 0.043, 0.047, 0.065, 0.086, 0.11 and 0.13 mg/kg.
Residues of parent penthiopyrad in melon (whole fruit) were (n = 8): 0.098, 0.17, 0.17, 0.18, 0.22, 0.26, 0.26 and 0.27 mg/kg.
Residues of parent penthiopyrad in winter squash were (n = 5): 0.067, 0.1, 0.12, 0.18 and 0.21 mg/kg.
The Meeting noted that Canadian and US GAP are for all members of the cucurbits group and decided to make recommendations for the whole group. Residues of penthiopyrad in summer squash, cucumber, melon, and winter squash (whole fruits) treated according to the US GAP for cucurbits were not significantly different and may be combined.
The combined residues for penthiopyrad in cucurbits (whole fruits) were (n = 27): 0.01, 0.012, 0.015, 0.029, 0.034, 0.043, 0.047, 0.065, 0.067, 0.086, 0.098, 0.1, 0.11, 0.12, 0.13, 0.13, 0.17, 0.17, 0.18(3), 0.19, 0.21, 0.22, 0.26, 0.26 and 0.27 mg/kg.
Based on the combined dataset the Meeting estimated a maximum residue level of 0.5 mg/kg for penthiopyrad in fruiting vegetables, cucurbits.
The total residues in summer squash were (n = 4): 0.029, 0.14, 0.2 and 0.21 mg/kg.
The total residues in cucumber were (n = 10): 0.031, 0.033, 0.048, 0.052, 0.061, 0.066, 0.084, 0.10, 0.13 and 0.15 mg/kg.
The total residues in melon (whole fruit) were (n = 8): 0.12, 0.18, 0.19, 0.19, 0.24, 0.28, 0.29 and 0.3 mg/kg.
The total residues in melon (pulp) were (n = 8): < 0.01(8) mg/kg.
The total residues in winter squash were (n = 5): 0.086, 0.12, 0.14, 0.21 and 0.22 mg/kg.
For dietary intake purposes the Meeting noted that residues in cucurbits, whole fruits and in the pulp (based on melons) differ significantly.
Therefore the Meeting decided to extrapolate all data on whole fruits to cucurbits with edible peel, also accommodating large varieties within the group like pumpkins with edible peel. The combined total residues in cucurbits (whole fruits) were (n = 27): 0.02, 0.025, 0.031, 0.039, 0.044, 0.053, 0.057, 0.075, 0.077, 0.096, 0.11, 0.12, 0.12, 0.13, 0.14, 0.15, 0.18, 0.19(3), 0.2, 0.21, 0.22, 0.24, 0.28, 0.29 and 0.3 mg/kg.

Penthiopyrad
1628
For dietary intake purposes of cucurbits with edible peel, the Meeting estimated an STMR and an HR of 0.13 mg/kg and 0.3 mg/kg, based on the combined dataset for the total residue in all cucurbits (whole fruits).
The Meeting also decided to extrapolate data on melon pulp to the edible portion of all cucurbits with inedible peel, to reflect to the much lower residue situation in these commodities.
For dietary intake purposes of cucurbits with inedible peel, the Meeting estimated an STMR and an HR of 0.01 mg/kg and 0.01 mg/kg, based on the total residue in melon pulp.
Fruiting vegetables, other than cucurbits except sweet corn and mushroom
Residue data were provided to the Meeting from trials in Canada and the USA on peppers (sweet and chilli) and tomatoes. GAP for fruiting vegetables is for a maximum of three foliar applications of up to 0.36 kg ai/ha and a PHI of 0 days.
Residues of parent penthiopyrad in sweet peppers were (n = 11): 0.15, 0.15, 0.17, 0.17, 0.18, 0.19, 0.19, 0.21, 0.22, 0.68 and 0.77 mg/kg.
The total residues in sweet peppers were (n = 11): 0.16, 0.16, 0.18, 0.19, 0.2(3), 0.22, 0.23, 0.70 and 0.79 mg/kg.
Residues of parent penthiopyrad in chilli peppers were (n = 9): 0.17, 0.2, 0.33, 0.36, 0.41, 0.57, 0.71, 0.88 and 1.6 mg/kg.
The total residues in chilli peppers were (n = 9): 0.19, 0.23, 0.35, 0.38, 0.43, 0.59, 0.73, 0.92 and 1.6 mg/kg.
Residues of parent penthiopyrad in tomatoes were (n = 20): 0.085, 0.15, 0.16, 0.17, 0.17, 0.18, 0.22, 0.24, 0.25, 0.27, 0.28, 0.36(3), 0.4, 0.41, 0.42, 0.7, 1.3 and 1.4 mg/kg.
The total residues in tomatoes were (n = 20): 0.10, 0.17, 0.17, 0.18, 0.18, 0.2, 0.24, 0.26, 0.27, 0.29, 0.30, 0.37, 0.38, 0.38, 0.42, 0.42, 0.43, 0.72, 1.3, 1.4 mg/kg.
The Meeting noted that the corresponding GAP is for all fruiting vegetables other than cucurbits, except sweet corn and mushroom and decided to make recommendations for the whole group. Based on the Kruskal-Wallis test the dataset for sweet peppers, chilli peppers and tomatoes were not significantly different and may be combined.
Residues of parent penthiopyrad in fruiting vegetables, other than cucurbits except sweet corn and mushroom were (n = 40): 0.085, 0.15(3), 0.16, 0.17(5), 0.18, 0.19(3), 0.2, 0.21, 0.22, 0.22, 0.24, 0.25, 0.27, 0.28, 0.33, 0.36(4), 0.4, 0.41, 0.41, 0.42, 0.57, 0.68, 0.7, 0.71, 0.77, 0.88, 1.3, 1.4 and 1.6 mg/kg.
The total residues in fruiting vegetables, other than cucurbits except sweet corn and fungi were (n = 40): 0.095, 0.16(3), 0.17, 0.18(5), 0.2(4), 0.22, 0.23(3), 0.25, 0.26, 0.28, 0.29, 0.34, 0.37, 0.37, 0.38, 0.38, 0.41, 0.42, 0.43, 0.44, 0.58, 0.69, 0.71, 0.73, 0.78, 0.92, 1.3, 1.4 and 1.6 mg/kg.
Based on the combined dataset for sweet pepper, chilli pepper and tomatoes the Meeting estimated a maximum residue level, an STMR and an HR of 2 mg/kg, 0.27 mg/kg and 1.6 mg/kg for penthiopyrad in fruiting vegetables, other than cucurbits except sweet corn and mushroom, respectively.
The Meeting noted that residues in chilli pepper and in other commodities within the group of fruiting vegetables, except sweet corn and mushroom do not differ significantly. Since the group maximum residue level of 2 mg/kg is expected to provide a reliable estimate for chilli peppers also, the default dehydration factor of 7 for chilli pepper instead of the default factor of 10 for peppers was used to estimate a maximum residue level of 14 mg/kg for dried chilli peppers.
Sweet corn (Corn on the Cob)
For sweet corn GAP is for a maximum of two foliar applications of up to 0.36 kg ai/ha and a PHI of 30 days.

Penthiopyrad
1629
Residues of parent penthiopyrad in sweet corn (corn on the cob) were (n = 11): < 0.01(11) mg/kg.
The total residues in sweet corn (corn on the cob) were (n = 11): < 0.01(11) mg/kg.
The Meeting estimated a maximum residue level, an STMR and an HR of 0.01 mg/kg, 0.01 mg/kg and 0.02 mg/kg for penthiopyrad in sweet corn (corn on the cob), respectively. The Meeting noted the in maize treated identically as sweet corn following processing finite residues in processed products occur, also precluding a zero-residue situation for sweet corn.
Brassica leafy vegetables
Residue data were provided to the Meeting from trials in Canada and the USA on mustard greens and turnip leaves. GAP from the US for brassica, leafy vegetables is for a maximum of three foliar applications of up to 0.45 kg ai/ha and a PHI of 0 days.
Residues of parent penthiopyrad in mustard greens were (n = 9): 7.6, 8.3, 8.7, 8.75, 11, 16, 17, 23 and 30 mg/kg.
The total residues in mustard greens were (n = 9): 7.7, 8.4, 8.9, 9.0, 11, 16, 17, 23 and 30 mg/kg.
The Meeting estimated a maximum residue level, an STMR and an HR of 50 mg/kg, 11 mg/kg and 30 mg/kg for penthiopyrad in mustard greens, respectively.
The Meeting noted that for mustard greens the IESTI exceeds the ARfD by 150%. No alternative GAP for mustard greens is available.
Residues of parent penthiopyrad in turnip greens were (n = 6): 4, 4.8, 6.1, 13, 20 and 23 mg/kg.
The total residues in turnip greens were (n = 6): 4.1, 4.9, 6.4, 13, 20 and 23 mg/kg.
The Meeting estimated a maximum residue level, an STMR and an HR of 50 mg/kg, 9.4 mg/kg and 23 mg/kg for penthiopyrad in turnip greens, respectively.
Leafy vegetables, except brassica leafy vegetables
Residue data were provided to the Meeting from trials in Canada and the USA on lettuce and spinach. GAP for leafy vegetables is for a maximum of three foliar applications of up to 0.36 kg ai/ha and a PHI of 3 days.
Residues of parent penthiopyrad in head lettuce were (n = 12): < 0.01, 0.37(3), 0.41, 0.49, 0.6, 1.6, 2.0, 2.3, 2.8 and 3.5 mg/kg.
The total residues in head lettuce were (n = 12): < 0.01, 0.38, 0.38, 0.41, 0.42, 0.52, 0.68, 1.7, 2.2, 2.3, 2.8 and 3.5 mg/kg.
Residues of parent penthiopyrad in leaf lettuce were (n = 12): 1.1, 1.2, 1.2, 1.8, 1.8, 2.0, 3.5, 4.1, 4.4, 5.3, 7.4 and 11 mg/kg.
The total residues in leaf lettuce were (n = 12): 1.2, 1.2, 1.4, 2.0, 2.2, 2.3, 3.5, 4.2, 4.6, 5.4, 7.5 and 11 mg/kg.
Residues of parent penthiopyrad in spinach were (n = 10): 0.81, 1.2 1.5, 2, 2.7, 2.8, 2.8, 8.1, 11 and 15 mg/kg.
The total residues in spinach were (n = 10): 0.95, 1.4, 1.8, 2.9, 3.1, 3.2, 3.9, 8.3, 12 and 15 mg/kg.
The Meeting notes that the corresponding GAP is for all leafy vegetables, except brassica leafy vegetables, and decided to make recommendations on the whole group. However the Meeting recognized that datasets for individual commodities within the group were significantly different and could not be combined. Therefore recommendations on leafy vegetables, except brassica leafy

Penthiopyrad
1630
vegetables, will be based on spinach, representing the commodity resulting in highest residues within the group.
Based on the critical use on spinach the Meeting estimated a maximum residue level, an STMR and an HR of 30 mg/kg, 3.15 mg/kg and 15 mg/kg for penthiopyrad in leafy vegetables, except brassica leafy vegetables, respectively.
Celery
Residue data were provided to the Meeting from trials in Canada and the USA on celery. GAP for celery is for a maximum of three foliar applications of up to 0.36 kg ai/ha and a PHI of 3 days.
Residues of parent penthiopyrad in celery were (n = 11): 1.7, 2, 2.1, 2.5, 2.8, 3, 3.1, 5.3, 5.3, 5.8 and 8.7 mg/kg.
The total residues in celery were (n = 11): 1.7, 2.0, 2.3, 2.6, 2.9, 3.1, 3.2, 5.4, 5.6, 6.1 and 8.8 mg/kg.
The Meeting estimated a maximum residue level, an STMR and an HR of 15 mg/kg, 3.1 mg/kg and 8.8 mg/kg for penthiopyrad in celery, respectively.
Legume vegetables, immature with pods
Residue data were provided to the Meeting from trials in Canada and the USA on succulent beans and peas. GAP for legume vegetables is for a maximum of three foliar applications of up to 0.45 kg ai/ha and a PHI of 0 days.
Residues of parent penthiopyrad in green beans with pods were (n = 8): 0.13, 0.16, 0.36, 0.47, 0.77, 0.9, 0.99 and 1.5 mg/kg.
The total residues in green beans with pods were (n = 8): 0.14, 0.17, 0.38, 0.49, 0.79, 0.92, 1.1 and 1.5 mg/kg.
Residues of parent penthiopyrad in green peas with pods were (n = 4): 0.88, 1.0, 1.3 and 1.5 mg/kg.
The total residues in peas with pods were (n = 4): 0.90, 1.1, 1.3 and 1.6 mg/kg.
The Meeting decided that residues in green beans with pods and in green peas with pods are similar and can be combined for mutual support. Residues of parent penthiopyrad in green beans with pods and peas with pods were (n = 12): 0.13, 0.16, 0.36, 0.47, 0.77, 0.88, 0.9, 0.99, 1.0, 1.3, 1.5 and 1.5 mg/kg.
The total residues in green beans with pods and peas with pods were (n = 12): 0.14, 0.178, 0.37, 0.49, 0.78, 0.89, 0.91, 1.1, 1.1, 1.3, 1.5 and 1.6 mg/kg.
Based on the combined dataset of the Meeting estimated a maximum residue level, an STMR and an HR of 3 mg/kg, 0.9 mg/kg and 1.6 mg/kg for penthiopyrad in beans, except broad bean and soya bean (green pods and immature seeds) and in peas (pods and succulent), respectively.
Legume vegetables, shelled
Residue data were provided to the Meeting from trials in Canada and the USA on shelled succulent beans and peas. GAP for legume vegetables is for a maximum of three foliar applications of up to 0.45 kg ai/ha and a PHI of 0 days.
Residues of parent penthiopyrad in shelled beans were (n = 7): 0.011, 0.024, 0.025, 0.035, 0.052 and 0.056, 0.13 mg/kg.
The total residues in shelled beans were (n = 7): 0.029, 0.043, 0.043, 0.054, 0.071, 0.075 and 0.16 mg/kg.
Residues of parent penthiopyrad in shelled peas were (n = 7): 0.04, 0.05, 0.067, 0.069, 0.077, 0.09 and 0.14 mg/kg.

Penthiopyrad
1631
The total residues in shelled peas were (n = 7): 0.059, 0.068, 0.085, 0.088, 0.095, 0.11 and 0.16 mg/kg.
The Meeting decided that residues in shelled beans and in shelled peas without pods are similar and can be combined for mutual support. Residues of parent penthiopyrad in shelled beans and peas without pods were (n = 14): 0.011, 0.024, 0.025, 0.035, 0.04, 0.05, 0.052, 0.056, 0.067, 0.069, 0.077, 0.09, 0.13 and 0.14 mg/kg.
The total residues in shelled beans and peas without pods were (n = 14): 0.021, 0.034, 0.035, 0.045, 0.05, 0.06, 0.062, 0.075, 0.077, 0.079, 0.087, 0.1, 0.15 and 0.16 mg/kg.
Based on the combined dataset the Meeting estimated a maximum residue level, an STMR and an HR of 0.3 mg/kg, 0.0685 mg/kg and 0.16 mg/kg for penthiopyrad in beans, shelled and in peas, shelled, respectively.
Pulses, except soya beans
Residue data were provided to the Meeting from trials in Canada and the USA on beans and peas as pulses. GAP for pulses except soya beans is for a maximum of three foliar applications of up to 0.35 kg ai/ha and a PHI of 21 days.
Residues of parent penthiopyrad in beans were (n = 14): < 0.01(10), 0.011, 0.026, 0.033 and 0.2 mg/kg.
The total residues in beans were (n = 14): < 0.01(10), 0.029, 0.030, 0.045 and 0.29 mg/kg.
Residues of parent penthiopyrad in peas were (n = 14): < 0.01(7), 0.011, 0.012, 0.014, 0.014, 0.032, 0.034 and 0.088 mg/kg.
The total residues in peas were (n = 14): < 0.01(7), 0.030, 0.031, 0.033, 0.033, 0.051, 0.052 and 0.12 mg/kg.
The Meeting noted that corresponding GAP is for all pulses, except soya beans and decided to make recommendations for the whole group. The Meeting also noted that beans and peas treated according to the same GAP result in comparable residues and could be combined.
Combined residues of parent penthiopyrad in beans and peas were (n = 28): < 0.01(17), 0.011, 0.011, 0.012, 0.014, 0.014, 0,026, 0.032, 0.033, 0.034, 0.088 and 0.2 mg/kg.
The total residues in beans and peas were (n = 28): < 0.01(17), 0.029, 0.030, 0.030, 0.031, 0.033, 0.033, 0.045, 0.051, 0.052, 0.12 and 0.29 mg/kg.
Based on the combined dataset of the Meeting estimated a maximum residue level and an STMR of 0.3 mg/kg and 0.01 mg/kg for penthiopyrad in pulses, except soya beans, respectively.
Soya beans
Residue data were provided to the Meeting from trials in Canada and the USA on soya beans. GAP for soya beans is for a maximum of three foliar applications of up to 0.45 kg ai/ha and a PHI of 14 days.
Residues of parent penthiopyrad in soya beans were (n = 21): < 0.01(9), 0.012, 0.013, 0.014, 0.022, 0.022, 0.024, 0.025, 0.049, 0.056, 0.068, 0.1 and 0.21 mg/kg.
The total residues in soya beans were (n = 21): < 0.01(9), 0.030, 0.031, 0.033, 0.041, 0.042, 0.043, 0.043, 0.069, 0.074, 0.087, 0.12 and 0.23 mg/kg.
The Meeting estimated a maximum residue level and an STMR of 0.3 mg/kg and 0.032 mg/kg for penthiopyrad in soya beans, respectively.

Penthiopyrad
1632
Carrots
Residue data were provided to the Meeting from trials in Canada and the USA on carrots. GAP for carrots in the USA is for a maximum of two foliar applications of up to 0.39 kg ai/ha and a PHI of 0 days.
Residues of parent penthiopyrad in carrots were (n = 9): 0.021, 0.025, 0.047, 0.051, 0.071, 0.085, 0.12, 0.1 and, 0.4 mg/kg.
The total residues in carrots were (n = 9): 0.039, 0.044, 0.066, 0.070, 0.09, 0.10, 0.14, 0.18 and 0.41 mg/kg.
The Meeting estimated a maximum residue level, an STMR and an HR of 0.6 mg/kg, 0.09 mg/kg and 0.41 mg/kg for penthiopyrad in carrots, respectively.
Potatoes
Residue data were provided to the Meeting from trials in Canada and the USA on potatoes.
GAP for potatoes in the USA is for a maximum of three foliar applications of up to 0.31 kg ai/ha and a PHI of 7 days.
Residues of parent penthiopyrad in potato tubers were (n = 22): < 0.01(15), 0.011, 0.011, 0.014, 0.015, 0.017, 0.025 and 0.033 mg/kg.
The total residues in potato tubers were (n = 22): < 0.01(15), 0.029, 0.030, 0.033, 0.03, 0.036, 0.044 and 0.051 mg/kg.
The OECD Calculator suggests a maximum residue level of 0.04 mg/kg for penthiopyrad in potatoes; however, a high uncertainty due to the limited number of results above the LOQ was indicated. The Meeting decided to estimate a maximum residue level at the next higher MRL-step of 0.05 mg/kg.
The Meeting estimated a maximum residue level, an STMR and an HR of 0.05 mg/kg, 0.01 mg/kg and 0.051 mg/kg for penthiopyrad in potatoes, respectively.
Radish
Residue data were provided to the Meeting from trials in Canada and the USA on radishes.
GAP for radish in the USA is for a maximum of three foliar applications of up to 0.45 kg ai/ha and a PHI of 0 days.
Residues of parent penthiopyrad in radish roots were (n = 6): < 0.01, 0.14, 0.22, 0.33, 0.92 and 1.2 mg/kg.
The total residues in radish roots were (n = 6): < 0.01, 0.15, 0.24, 0.35, 0.93 and 1.2 mg/kg.
The Meeting estimated a maximum residue level, an STMR and an HR of 3 mg/kg, 0.305 mg/kg and 1.2 mg/kg for penthiopyrad in radish roots, respectively.
Sugar beet
Residue data were provided to the Meeting from trials in Canada and the USA on sugar beets.
GAP for sugar beets in the USA is for a maximum of three foliar applications of up to 0.45 kg ai/ha and a PHI of 7 days.
Residues of parent penthiopyrad in sugar beet roots were (n = 12): 0.015, 0.017, 0.019, 0.033, 0.042, 0.085, 0.090, 0.13, 0.18, 0.19, 0.2 and 0.27 mg/kg.
The total residues in sugar beet roots were (n = 12): 0.033, 0.035, 0.037, 0.051, 0.060, 0.1, 0.11, 0.15, 0.20, 0.20, 0.21 and 0.29 mg/kg.

Penthiopyrad
1633
The Meeting estimated a maximum residue level and an STMR of 0.5 mg/kg and 0.105 mg/kg for penthiopyrad in sugar beets, respectively.
Barley and oats
Residue data were provided to the Meeting from trials in Canada and the USA on barley grain. GAP for barley and oats in the USA is for a maximum of two foliar applications before flowering (BBCH 59) of up to 0.36 kg ai/ha without a specified PHI for the grain (covered by growth stage).
Residues of parent penthiopyrad in barley grain were (n = 13): < 0.01(7), 0.01, 0.011, 0.02, 0.024, 0.03 and 0.11 mg/kg.
The total residues in barley grain were (n = 13): < 0.01(7), 0.029, 0.029, 0.038, 0.042, 0.048 and 0.14 mg/kg.
The Meeting recognised that barley and oats share an identical GAP and normally show comparable residues. It was therefore decided to extrapolate residue data from barley to oats.
The Meeting estimated a maximum residue level and an STMR of 0.15 mg/kg and 0.01 mg/kg for penthiopyrad in barley and oats, respectively.
Rye, triticale and wheat
Residue data were provided to the Meeting from trials in Canada and the USA on wheat grain. GAP for rye, triticale and wheat in the USA is for a maximum of two foliar applications before flowering (BBCH 59) of up to 0.36 kg ai/ha without a specified PHI for the grain (covered by growth stage).
Residues of parent penthiopyrad in wheat grain were (n = 29): < 0.01(24), 0.011, 0.012, 0.017, 0.019 and 0.034 mg/kg.
The total residues in wheat grain were (n = 29): < 0.01(24), 0.030, 0.033, 0.036, 0.037 and 0.053, mg/kg.
The Meeting recognised that wheat, triticale and rye share an identical GAP and normally show comparable residues. It was therefore decided to extrapolate residue data from wheat to rye and triticale.
The Meeting estimated a maximum residue level and an STMR of 0.04 mg/kg and 0.01 mg/kg for penthiopyrad in rye, triticale and wheat, respectively.
Maize
Residue data were provided to the Meeting from trials in Canada and the USA on maize. GAP for maize in the USA is for a maximum of two foliar applications of up to 0.36 kg ai/ha and a PHI of 30 days.
Residues of parent penthiopyrad in maize grain were (n = 14): < 0.01(14) mg/kg.
The total residues in maize grain were (n = 14): < 0.01(14) mg/kg.
The Meeting estimated a maximum residue level and an STMR of 0.01 mg/kg and 0.01 mg/kg for penthiopyrad in maize, respectively. The Meeting noted the in maize processing finite residues in processed products occur, precluding a zero-residue situation for maize grain.
Millet and sorghum
Residue data were provided to the Meeting from trials in Canada and the USA on sorghum. GAP for sorghum and millet in the USA is for a maximum of two foliar applications of up to 0.36 kg ai/ha and a PHI of 30 days.
Residues of parent penthiopyrad in sorghum grain were (n = 9): 0.06, 0.093, 0.12, 0.16, 0.18, 0.28, 0.3, 0.39 and 0.43 mg/kg.

Penthiopyrad
1634
The total residues in sorghum grain were (n = 9): 0.084, 0.13, 0.14, 0.2, 0.22, 0.34, 0.4, 0.45 and 0.69 mg/kg.
The Meeting recognised that sorghum and millet share an identical GAP and normally show comparable residues. It was therefore decided to extrapolate residue data from sorghum to millet.
The Meeting estimated a maximum residue level and an STMR of 0.8 mg/kg and 0.22 mg/kg for penthiopyrad in millet and sorghum grain, respectively.
Tree nuts
Residue data were provided to the Meeting from trials in Canada and the USA on almonds and pecans. GAP for tree nuts in the USA is for a maximum of four foliar applications of up to 0.3 kg ai/ha and a PHI of 14 days.
Residues of parent penthiopyrad in almond nutmeat were (n = 6): < 0.01(4), 0.01 and 0.037 mg/kg.
The total residues in almond nutmeat were (n = 6): < 0.01(4), 0.029 and 0.056 mg/kg.
Residues of parent penthiopyrad in pecan nutmeat were (n = 6): < 0.01(6) mg/kg.
The total residues in pecan nutmeat were (n = 6): < 0.01(6) mg/kg.
The Meeting noted that corresponding GAP is for all tree nuts and decided to make recommendations for the whole group. The Meeting concluded that the dataset for almonds and pecan treated according to US GAP for tree nuts are not significantly different and can be combined.
Residues of parent penthiopyrad in almond and pecan nutmeat were (n = 6): < 0.01(10), 0.01 and 0.037 mg/kg.
The total residues in almond and pecan nutmeat were (n = 6): < 0.01(10), 0.02 and 0.047 mg/kg.
Based on the combined dataset of the Meeting estimated a maximum residue level, an STMR and an HR of 0.05 mg/kg, 0.01 mg/kg and 0.047 mg/kg for penthiopyrad in tree nuts, respectively.
Cotton
Residue data were provided to the Meeting from trials in the USA on cotton. GAP for cotton in the USA is one in-furrow spray and a maximum of two foliar applications of up to 0.35 kg ai/ha each and a PHI of 21 days.
Residues of parent penthiopyrad in cotton seeds were (n = 13): < 0.01, < 0.01, 0.011, 0.036, 0.04, 0.091, 0.093, 0.11, 0.13, 0.13, 0.14, 0.23 and 0.25 mg/kg.
The total residues in cotton seeds were (n = 13): 0.035, 0.036, 0.043, 0.060, 0.083, 0.12, 0.17, 0.17, 0.22, 0.22, 0.37, 0.39 and 0.39 mg/kg.
The Meeting estimated a maximum residue level and an STMR of 0.5 mg/kg and 0.17 mg/kg for penthiopyrad in cotton seeds, respectively.
Rape seed
Residue data were provided to the Meeting from trials in Canada and the USA on oilseed rape. GAP for rape seed in the USA is for a maximum of three foliar applications of up to 0.3 kg ai/ha and a PHI of 21 days.
Residues of parent penthiopyrad in rape seed were (n = 21): < 0.01(7), 0.011, 0.017, 0.024, 0.025, 0.028, 0.033, 0.052, 0.054, 0.065, 0.08, 0.081, 0.085, 0.13 and 0.42 mg/kg.
The total residues in rape seeds were (n = 21): < 0.01(5), 0.03, 0.046, 0.048, 0.071, 0.073, 0.074, 0.083, 0.084, 0.087, 0.094, 0.099, 0.12, 0.13, 0.15, 0.15 and 0.44 mg/kg.

Penthiopyrad
1635
The Meeting estimated a maximum residue level and an STMR of 0.5 mg/kg and 0.084 mg/kg for penthiopyrad in rape seed, respectively.
Peanuts
Residue data were provided to the Meeting from trials in the USA on peanuts. GAP for peanuts in the USA is for a maximum of three foliar applications of up to 0.36 kg ai/ha and a PHI of 14 days.
Residues of parent penthiopyrad in peanut nutmeat were (n = 13): < 0.01(12) and 0.034 mg/kg.
The total residues in peanut nutmeat were (n = 13): < 0.01(12) and 0.055 mg/kg.
The OECD Calculator suggests a maximum residue level of 0.04 mg/kg for penthiopyrad in peanuts; however, a high uncertainty due to the limited number of results above the LOQ was indicated. The Meeting decided to estimate a maximum residue level at the next higher MRL-step of 0.05 mg/kg.
The Meeting estimated a maximum residue level and an STMR of 0.05 mg/kg and 0.01 mg/kg for penthiopyrad in peanuts, respectively.
Sunflowers
Residue data were provided to the Meeting from trials in Canada and the USA on sunflowers. GAP for sunflowers in the USA is for a maximum of three foliar applications of up to 0.45 kg ai/ha and a PHI of 14 days.
Residues of parent penthiopyrad in sunflower seeds were (n = 9): < 0.01, 0.078, 0.079, 0.079, 0.1, 0.28, 0.34, 0.44 and 0.81 mg/kg.
The total residues in sunflower seeds were (n = 9): < 0.01, 0.097, 0.097, 0.098, 0.12, 0.32, 0.51, 0.57 and 0.94 mg/kg.
The Meeting estimated a maximum residue level and an STMR of 1.5 mg/kg and 0.12 mg/kg for penthiopyrad in sunflower seeds, respectively.
Animal feeds
Alfalfa, forage and hay
Residue data were provided to the Meeting from trials in Canada and the USA on alfalfa. GAP for alfalfa in the USA is for a maximum of two foliar applications of up to 0.36 kg ai/ha and a PHI of 14 days.
The total residues in alfalfa forage were (n = 15): 0.1, 0.21, 0.45, 0.47, 0.59, 0.62, 0.7, 0.73, 0.95, 1.0, 1.4, 1.8, 2.0, 2.1 and 4.6 mg/kg.
Residues of parent penthiopyrad in alfalfa hay were (n = 15): 0.11, 0.28, 0.58, 0.77, 0.97, 1.6, 1.6, 1.8, 1.8, 1.9, 3.2, 3.6, 4.7, 4.9 and 14 mg/kg.
The total residues in alfalfa hay were (n = 15): 0.6, 1.2, 1.9, 2.3, 2.5(3), 2.9, 3.3, 3.4, 4.5, 4.9, 5.9, 6.4 and 16 mg/kg.
The Meeting estimated STMR values of 0.73 mg/kg and 2.9 mg/kg and highest residue values of 4.6 mg/kg and 16 mg/kg for alfalfa forage and hay (fresh weight basis), respectively.
The Meeting also estimated a maximum residue level of 20 mg/kg for penthiopyrad in alfalfa fodder (DM basis, 89% dry-matter content).
Pea vines and hay
Residue data were provided to the Meeting from trials in Canada and the USA on pea vines. GAP for peas in the USA are for a maximum of three foliar applications of up to 0.3 kg ai/ha and a PHI of 0 days for vines and hay.

Penthiopyrad
1636
The total residues in pea vines were (n = 7): 4.5, 5.3, 6.1, 6.2, 6.3, 12 and 23 mg/kg.
Residues of parent penthiopyrad in pea hay were (n = 7): 3.7, 8.7, 9.4, 11, 14, 15 and 30 mg/kg.
The total residues in pea hay were (n = 7): 3.9, 8.9, 11, 12, 14, 15 and 31 mg/kg.
The Meeting estimated STMR values of 6.2 mg/kg and 12 mg/kg and highest residue values of 23 mg/kg and 31 mg/kg for pea vines and hay (fresh weight basis), respectively.
The Meeting also estimated a maximum residue level of 60 mg/kg for penthiopyrad in pea hay (DM basis, 88% dry-matter content).
Soya beans, forage and hay
Residue data were provided to the Meeting from trials in Canada and the USA on soya beans. GAP for soya beans in the USA is for a maximum of three foliar applications of up to 0.45 kg ai/ha and a PHI of 0 days for forage and hay.
The total residues in soya forage were (n = 16): 4.1, 4.9, 6.4, 11, 14, 14, 15, 16(3), 19, 20, 21, 23, 24 and 24 mg/kg.
Residues of parent penthiopyrad in soya hay were (n = 16): 11, 22, 33, 45, 47, 48, 49, 50, 53, 54, 55, 59, 73, 99, 100 and 123 mg/kg.
The total residues in soya hay were (n = 16): 11, 22, 33, 45, 48, 49, 50, 51, 54, 55, 55, 61, 73, 100, 102 and 125 mg/kg.
The Meeting estimated STMR values of 16 mg/kg and 52.5 mg/kg and highest residue values of 24 mg/kg and 125 mg/kg for soya forage and fodder (fresh weight basis), respectively.
The Meeting also estimated a maximum residue level of 200 mg/kg for penthiopyrad in soya bean fodder (DM basis, 85% dry-matter content).
Barley, oats, rye, triticale and wheat—straw, fodder and forage of cereals
GAPs for barley, oats, rye, triticale and wheat in the USA are for a maximum of two foliar applications before flowering (BBCH 59) of up to 0.36 kg ai/ha and a 0 day PHI for the forage/hay and an unspecified PHI for the straw (covered by growth stage).
The Meeting concluded that straw, fodder and forage of barley, oats, rye, triticale and wheat are indistinguishable and result in comparable residues following treatment according to the identical US GAPs for these crops. Therefore all estimations on forage, fodder and straw will be based on the combined residue dataset for these crops and applied to each of them.
The total residues in forage based on wheat trials were (n = 26): 5.5, 5.8, 6.2, 7.3, 8.3, 8.7, 8.8, 8.9, 9.2, 9.5, 9.8, 10(3), 11, 12, 12, 13(4), 14, 14, 15, 16 and 17 mg/kg (fresh weight basis).
Residues of parent penthiopyrad in hay based on barley and wheat trials were (n = 39): 2.6, 3.9, 4.4, 4.5, 4.7, 6.4, 7.0, 7.4, 7.7, 8.2, 8.9, 11, 12, 12, 13, 14, 17, 17, 19, 19, 22, 23, 23, 25, 25, 27, 28(3), 29(3), 30, 34, 35, 38, 40, 44 and 53 mg/kg.
Residues of parent penthiopyrad in straw based on barley and wheat trials were (n = 13): < 0.05, < 0.05, 0.051, 0.053, 0.054, 0.058, 0.06, 0.084, 0.088, 0.095, 0.096, 0.11(5), 0.12, 0.12, 0.14, 0.14, 0.15, 0.18, 0.19(3), 0.2, 0.22, 0.22, 0.23, 0.24, 0.24, 0.3, 0.34, 0.36, 0.37, 0.37, 0.4, 0.42 and 0.7 mg/kg.
The total residues in hay based on barley and wheat trials were (n = 39): 2.9, 4.2, 4.9, 5.1, 5.7, 7.1, 7.9, 8.1, 9.3, 9.7, 9.8, 13(4), 16, 17, 20, 20, 21, 23, 24, 24, 26, 27, 28, 29(3), 30(3), 31, 36, 36, 39, 42, 47 and 54 mg/kg
The total residues in straw based on barley and wheat trials were (n = 39): < 0.1, < 0.1, 0.14, 0.15(3), 0.18, 0.18, 0.19, 0.20(4), 0.21, 0.21, 0.23, 0.23, 0.26, 0.27, 0.27, 0.32, 0.32, 0.34, 0.34, 0.35, 0.40, 0.41, 0.42, 0.42, 0.43, 0.50, 0.54, 0.57, 0.61, 0.61, 0.66, 0.69, 0.81 and 0.97 mg/kg.

Penthiopyrad
1637
The Meeting concluded that residues in hay are significantly higher as in straw and should be used as basis for recommendations on straw, fodder and forage of barley, oats, rye, triticale and wheat.
The Meeting estimated an STMR value of 10 mg/kg and a highest residue value of 17 mg/kg for barley, oats, rye, triticale and wheat forage (fresh weight basis).
The Meeting also estimated a maximum residue level, an STMR value and a highest residue of 80 mg/kg (DM based, 88% dry-matter content), 21 mg/kg (fresh weight basis) and 54 mg/kg (fresh weight basis) for penthiopyrad in barley, oats, rye, triticale and wheat straw and fodder.
Maize, millet and sorghum—forage and fodder
GAP for maize, sorghum and millet in the USA is for a maximum of two foliar applications of up to 0.36 kg ai/ha and a PHI of 0 days for forage and hay and of 30 days for stover.
The total residues in maize forage were (n = 13): 3.0, 3.4, 3.4, 3.6, 3.7, 4.3, 4.4, 4.7, 4.9, 5.1, 5.2, 5.3 and 7.3 mg/kg.
The total residues in sorghum forage were (n = 9): 3.6, 3.9, 6.2, 6.7, 6.7, 7.0, 7.5, 7.9 and 14 mg/kg.
Residues of parent penthiopyrad in sorghum stover were (n = 9): 0.14, 0.19, 0.23, 0.32, 0.44, 0.62, 0.66, 2.5 and 5.5 mg/kg.
The total residues in sorghum stover were (n = 9): 0.23, 0.42, 0.47, 0.52, 0.55, 0.75, 0.82, 2.7 and 5.9 mg/kg.
Supervised field trial data on maize stover from the USA was not conducted according to the submitted GAPs.
The Meeting concluded that forage and fodder of maize, millet and sorghum treated according to identical US GAPs result in comparable residues and may be combined for mutual support. Therefore all estimations on forage and fodder will be based on the combined residue dataset for these crops and applied to each of them.
For forage of maize and stover combined total residues were (n = 22): 3.0, 3.4, 3.4, 3.6, 3.6, 3.7, 3.9, 4.3, 4.4, 4.7, 4.9, 5.1, 5.2, 5.3, 6.2, 6.7, 6.7, 7.0, 7.3, 7.5, 7.9 and 14 mg/kg.
The Meeting estimated an STMR value of 5 mg/kg and a highest residue value of 14 mg/kg for maize, millet and sorghum forage (fresh weight basis).
The Meeting also estimated a maximum residue level, an STMR value and a highest residue of 10 mg/kg (DM basis, 88% dry-matter content), 0.52 mg/kg (fresh weight basis) and 5.9 mg/kg (fresh weight basis) for penthiopyrad in maize, millet and sorghum fodder.
Sugar beet leaves
GAP for sugar beets in the USA is for a maximum of three foliar applications of up to 0.45 kg ai/ha and a PHI of 0 days for the forage. In Canada GAP for sugar beets is for a maximum of three foliar applications of up to 0.3 kg ai/ha and a PHI of 7 days for the forage.
All supervised field trials on sugar beet leaves involve two treatments of 0.45 kg ai/ha and a PHI of 6–8 days. Since neither the Canadian nor the US GAP matched these field trials, the Meeting concluded that for sugar beets leaves no STMR value or highest residue can be estimated.
Oilseed rape forage
GAP for oilseed rape in the USA is for a maximum of three foliar applications of up to 0.3 kg ai/ha and a PHI of 21 days.
Supervised field trial data submitted from Europe involve single treatment at 0.3 kg ai/ha. The Meeting noted that the data submitted involving single application probably underestimates the true

Penthiopyrad
1638
residue situation according to US GAP and concluded that for rape forage no STMR value or highest residue could be estimated.
Peanut hay
GAP for peanuts in the USA is for a maximum of three foliar applications of up to 0.36 kg ai/ha (maximum annual rate in 1.1 kg ai/ha) and a PHI of 14 days.
Residues of parent penthiopyrad in peanut hay were (n = 13): 1.5, 1.8, 1.8, 1.9, 2.9, 4.5, 5.4, 6.8, 6.9, 7.1, 8.6, 8.8 and 17 mg/kg.
The total residues in peanut hay were (n = 13): 1.6, 2.0, 2.1, 2.1, 3.6, 4.9, 5.9, 7.3, 7.9, 8.7, 9.2, 9.4 and 18 mg/kg.
The Meeting estimated a maximum residue level, an STMR and an highest residue of 30 mg/kg (DM basis, 85% dry-matter content), 5.9 mg/kg (fresh weight basis) and 18 mg/kg (fresh weight basis) for penthiopyrad in peanut hay(fresh weight basis), respectively.
Almond hulls
GAP for tree nuts in the USA is for a maximum of four foliar applications of up to 0.3 kg ai/ha and a PHI of 14 days.
Residues of parent penthiopyrad in almond hulls were (n = 6): 0.8, 1.1, 1.4, 2.1, 2.4 and 2.7 mg/kg.
The total residues in almond hulls were (n = 6): 0.91, 1.6, 1.9, 2.9, 3.0 and 3.1 mg/kg.
The Meeting estimated a maximum residue level and an STMR of 6 mg/kg (DM basis, 90% dry-matter content) and 2.4 mg/kg (fresh weight basis) for penthiopyrad in almond hulls, respectively.
Cotton gin trash
GAP for cotton in the USA is for a maximum of three foliar applications of up to 0.35 kg ai/ha and a PHI of 21 days.
The total residues in cotton gin trash were (n = 4): 3.0, 4.2, 4.9 and 7.8 mg/kg.
The Meeting estimated an STMR of 4.55 mg/kg (fresh weight basis) for penthiopyrad in cotton gin trash.
Fate of residues during processing
The Meeting received information on the hydrolysis of radiolabelled penthiopyrad as well as processing studies using unlabelled material on grown residues in apples, plums, tomatoes, soya beans, potatoes, sugar beet, barley, maize, wheat, oilseed rape and peanuts.
In a hydrolysis study using radiolabelled penthiopyrad (1:1 mixture) typical processing conditions were simulated (pH 4,5 and 6 with 90 °C, 100 °C and 120 °C for 20, 60 and 20 minutes). In duplicate samples of sterile buffer solution no degradation of the parent substance was observed.
In the following table all processing factor relevant for the estimation of the dietary intake or recommendation of maximum residue levels for processed commodities are summarized. Processing factors for additional processed products are reported in the corresponding evaluation for penthiopyrad; however no conclusion could be drawn based on this information. If analytes were present below the LOQ in the RAC for specific commodities, no processing factors were derived.
Commodity Processing factor Processing factor
(median or best estimate)
HR / STMR (mg/kg)
MRL, HR-P / STMR-P (mg/kg)
Apple juice Total: < 0.13, < 0.14, 0.14
Total: 0.14 STMR: 0.15 STMR-P: 0.021

Penthiopyrad
1639
Commodity Processing factor Processing factor (median or best estimate)
HR / STMR (mg/kg)
MRL, HR-P / STMR-P (mg/kg)
Apple pomace (wet) Total: 4.4, 4.6, 6 Total: 4.6 STMR: 0.15 STMR-P: 0.69 Apple pomace (dry) Total: 5.9, 8.8, 11
Total: 8.8 STMR: 0.15 STMR-P: 1.3
Prunes Total: 1.3, 1.4 Total: 1.4 STMR: 1.3 HR: 1.9
STMR-P: 1.8 HR-P: 2.7
Tomato juice Total: 0.26, 0.34, 0.5 Total: 0.34 STMR: 0.27 STMR-P: 0.092 Tomato puree Total: 1.5, 2.0, 2.0 Total: 2.0 STMR: 0.27 STMR-P: 0.54 Tomato paste Total: 0.1, 3.4, 3.5 Total: 3.4 STMR: 0.27 STMR-P: 0.92 Tomato pomace (wet) Total: 4.3, 5.0, 5.5 Total: 5.0 STMR: 0.27 STMR-P: 1.4 Tomato pomace (dry) Total: 24, 39, 41 Total: 39 STMR: 0.27 STMR-P: 11 Soya beans, meal Total: 0.23, <1.4 Total: 0.23 STMR: 0.032 STMR-P: 0.007 Soya beans, hulls Total: 0.44, 4.7 Total: 2.5 STMR: 0.032 STMR-P: 0.08 Soya beans, refined oil Total: 0.1, 1.8 Total: 1 STMR: 0.032 STMR-P: 0.032 Peeled potatoes (steam peeled and abrasion peeled)
Total: < 0.21, < 0.45 Total: < 0.33 STMR: 0.01 HR: 0.05
STMR-P: 0.003 HR-P: 0.017
Sugar beet, refined sugar Total: 0.27, 0.35 Total: 0.31 STMR: 0.105 STMR-P: 0.033 Sugar beet, molasses Total: 0.20, 0.51 Total: 0.36 STMR: 0.105 STMR-P: 0.038 Sugar beet, dried pulp Total: 4.9, 5.6 Total: 5.3 STMR: 0.105 STMR-P: 0.56 Barley beer Total: < 0.11, < 0.36 Total: < 0.24 STMR: 0.01 STMR-P: 0.002 Pot barley Total: 0.67, 0.68 Total: 0.68 STMR: 0.01 STMR-P: 0.007 Maize flour Penthiopyrad: 2.1 Penthiopyrad: 2.1 MRL: 0.01 MRL: 0.03 Total: 1.4 Total: 1.4 STMR: 0.01 STMR-P: 0.014 Maize oil (wet milled) Penthiopyrad: 5.6 Penthiopyrad: 5.6 MRL: 0.01 MRL: 0.05 Total: 2.7 Total: 2.7 STMR: 0.01 STMR-P: 0.027 Wheat bran Penthiopyrad: 1.8 Penthiopyrad: 1.8 MRL: 0.04 MRL: 0.1 Total: 1.8 Total: 1.8 STMR: 0.01 STMR-P: 0.018 Wheat flour Total: 0.39 Total: 0.39 STMR: 0.01 STMR-P: 0.004 Wheat germ Penthiopyrad: 2.1 Penthiopyrad: 2.1 MRL: 0.04 MRL: 0.1 Total: 1.9 Total: 1.9 STMR: 0.01 STMR-P: 0.019 Oilseed rape crude oil (mechanically extracted)
Penthiopyrad: 0.78, 1.9, 2.5 Penthiopyrad: 1.9 MRL: 0.5 MRL: 1
Oilseed rape refined oil Penthiopyrad: 0.48, 1.6, 2.5 Penthiopyrad: 1.6 MRL: 0.5 MRL: 1 Total: 0.39, 1.3, 2.1 Total: 1.3 STMR: 0.084 STMR-P: 0.11 Peanuts, meal Total: 0.84, 2.5 Total: 1.7 STMR: 0.01 STMR-P: 0.017 Peanut refined oil Penthiopyrad: 1.4, 18 Penthiopyrad: 9.7 MRL: 0.05 MRL-P: 0.5 Total: 1.2, 6.7 Total: 4 STMR: 0.01 STMR-P: 0.04
Processing factors, STMR-P, HR-P and, if necessary, maximum residue levels for processed commodities are presented in the table above. Under consideration of penthiopyrad being the major residue in all supervised field trials, the processing factors for the parent substance were selected for the estimations.
For the processing for plums into prunes a processing factor of 1.4 was derived for penthiopyrad. In view of the highest residue of 0.77 mg/kg found in plums, the Meeting concluded that residues in prunes will be covered by the estimated maximum residue level for the stone fruit group.
For maize processed into maize flour and maize oil the Meeting estimated maximum residue levels of 0.05 mg/kg and 0.15 mg/kg, respectively.
For wheat processed into wheat bran and wheat germ the Meeting estimated maximum residue levels of 0.1 mg/kg, respectively.

Penthiopyrad
1640
For rape processed into crude and refined oil the Meeting estimated maximum residue levels of 1 mg/kg, respectively.
Peanuts processed into refined peanut oil show an accumulation of residues exceeding the recommended maximum residue for peanuts of 0.05 mg/kg. Under consideration of the derived processing factor of 9.7 the Meeting recommended a maximum residue level of 0.5 mg/kg for penthiopyrad in peanut oil, edible.
Residues in animal commodities
Livestock dietary burden
The Meeting received feeding studies involving penthiopyrad on lactating cows and laying hens.
Three groups of lactating cows were dosed daily at levels of 8.4, 21.4 and 74.6 ppm dry weight feed (0.15, 0.48 and 1.65 mg/kg bw) for 28 consecutive days. Milk was collected throughout the study and tissues were collected on day 29 within 24 hrs after the last dose.
In milk no residues above the LOQ of 0.01 mg/kg were found for the two lower dose groups. Only the 74.6 ppm dose group contained single positive detects of PAM between 0.01 and 0.02 mg/kg. Separation of milk obtained from high dosed animals into cream and skim milk revealed a slight concentration of parent penthiopyrad in cream (positive detect at 0.01 mg/kg). However, the results were not sufficient to estimate a ratio (< 0.01 to 0.01 mg/kg).
In tissues penthiopyrad was only found for the highest dose group, resulting in residues above the LOQ in liver (0.02–0.03 mg/kg) and fat (0.01–0.02 mg/kg). PAM was present in all dose groups except the lowest, giving residues of 0.01–0.02 mg/kg in liver, < 0.01 mg/kg in muscle, 0.01 mg/kg in kidney and 0.01 mg/kg in fat for the 51.4 ppm dose group and 0.03–0.06 mg/kg in liver, 0.01–0.02 mg/kg in muscle, 0.02–0.03 mg/kg in kidney and 0.01–0.02 mg/kg in fat for the 74.6 ppm dose group.
For laying hens three groups of animals were dosed with rates of 5.85, 17.54 and 58.46 ppm in the dry weight feed (0.4, 1.2 and 1.2 mg/kg bw) for 28 consecutive days. Eggs were collected throughout the study and tissues were collected on day 29 within 6 hrs after the last dose.
In eggs residues were very low showing detectable residues only for the highest dose group. PAM was quantified in all samples from Day 3 until Day 27 at levels ranging from 0.011 to 0.028 mg/kg. Penthiopyrad was measurable in only 7 of the 48 samples with concentration ranging from 0.011 to 0.016 mg/kg.
In tissues again only the highest dose group gave detectable residues above the LOQ. Penthiopyrad was found at levels of < 0.01–0.021 mg/kg in liver, < 0.01 mg/kg in muscle, < 0.01–0.018 mg/kg in skin and 0.016–0.036 mg/kg in fat. PAM was present above the LOQ in liver (0.017–0.019 mg/kg) and in a single sample of muscle (0.01 mg/kg). In other tissues no residues above the LOQ were found.
Estimated maximum and mean dietary burdens of livestock
Dietary burden calculations for beef cattle, dairy cattle, broilers and laying poultry are presented in Annex X. The calculations were made according to the livestock diets from US-Canada, EU, Australia and Japan in the OECD Table (Annex 6 of the 2006 JMPR Report).
Livestock dietary burden, ACTIVE-SUBSTANCE, ppm of dry matter diet US-Canada EU Australia Japan max. mean max. mean max. mean max. mean Beef cattle 12 4.5 56 23 130 a 57 b 1.9 0.5 Dairy cattle 55 26 43 20 100 c 49 d 24 7.9

Penthiopyrad
1641
Poultry—broiler 0.2 0.2 0.2 0.2 0.2 0.2 0.8 0.3 Poultry—layer 0.2 0.2 22 e 10 f 0.2 0.2 0.1 0.1 a Highest maximum beef or dairy cattle burden suitable for MRL estimates for mammalian meat b Highest mean beef or dairy cattle burden suitable for STMR estimates for mammalian meat c Highest maximum dairy cattle burden suitable for MRL estimates for milk d Highest mean dairy cattle burden suitable for STMR estimates for milk e Highest maximum broiler or laying hen burden suitable for MRL estimates for poultry products and eggs f Highest mean broiler or laying hen burden suitable for STMR estimates for poultry products and eggs
Animal commodities, MRL estimation Feed level (ppm) for
eggs and tissues Total residues (mg/kg)
Eggs Muscle Liver Fat Maximum residue level poultry Feeding study 18
58 < 0.02 0.044
< 0.02 0.029
< 0.02 0.045
< 0.02 0.046
Dietary burden and residue estimate 22 0.023 0.021 0.023 0.023 STMR poultry Feeding study 5.9
18 < 0.02 < 0.02
< 0.02 < 0.02
< 0.02 < 0.02
< 0.02 < 0.02
Dietary burden and residue estimate 10 0.02 0.02 0.02 0.02
For beef and dairy cattle the maximum dietary burden (130 ppm) exceeds the highest dose level of 74.6 ppm in the corresponding lactating cow feeding study. The Meeting concluded that based on the available information no recommendation for residues of penthiopyrad in mammalian tissues and milk can be made.
For poultry the maximum calculated dietary burden resulted in HR values for the sum of penthiopyrad and PAM, expressed as penthiopyrad of 0.023 mg/kg in eggs, 0.021 mg/kg in muscle, 0.023 mg/kg in liver and 0.023 mg/kg in fat.
Correlating to this estimation the Meeting recommended maximum residue levels of 0.03 mg/kg for poultry meat, fat and eggs. The Meeting also decided to extrapolate the data on poultry liver to poultry, edible offal of and also recommended a maximum residue level of 0.03 mg/kg for this commodity.
For dietary intake purposes no residues above the LOQ of 0.02 mg/kg were found in samples collected from animals dosed above and below the calculated mean dietary burden. The Meeting estimated STMR values for poultry meat, fat and edible offal of as well as for eggs of 0.02 mg/kg.
RECOMMENDATIONS
The Meeting estimated the STMR, HR and MRL values shown below.
Definition of the residue for compliance with MRL for plant commodities: penthiopyrad.
Definition of the residue for compliance with MRL for animal commodities and for the estimation of dietary intake for plant and animal commodities: sum of penthiopyrad and 1-methyl-3-trifluoromethyl-1H-pyrazole-4-carboxamide (PAM), expressed as penthiopyrad.
The residue is not fat-soluble.

Penthiopyrad
1642
Maximum residue levels and dietary intake
Commodity MRL, mg/kg STMR or STMR-P, mg/kg
HR, mg/kg
CCN Name New Previous AL 1020 Alfalfa, fodder 20 (DM) – 2.9 (fresh weight
basis) 16 (fresh weight basis)
AB 0660 Almond hulls 6 (DM) – 2.4 (fresh weight basis)
3.1 (fresh weight basis)
GC 0640 Barley 0.15 – 0.01 – AS 0640 Barley, straw and fodder 80 (DM) – 21 (fresh weight
basis) 54 (fresh weight basis)
VP 0061 Beans, except broad bean and soya bean (green pods and immature seeds)
3 – 0.9 1.6
VP 0062 Beans, shelled 0.3 – 0.0685 0.16 VB 0041 Cabbages, head 4 – 0.4 2.4 VR 0577 Carrots 0.6 – 0.09 0.41 VX 0624 Celery 15 – 3.1 8.8 Cotton gin trash 20 (DM) – 4.55 – SO 0691 Cotton seed 0.5 – 0.17 – HS 0444 Peppers Chili, dried 14 – See fruiting
vegetables, other cucurbits, except sweet corn and mushroom
See fruiting vegetables, other cucurbits, except sweet corn and mushroom
PE 0112 Eggs 0.03 – 0.02 0.023 VB 0042 Flower head brassica 5 – 1.4 2.4 VC 0045 Fruiting vegetables, cucurbits 0.5 – Edible peel: 0.13
in-edible peel: 0.01 Edible peel: 0.3 in-edible peel: 0.01
VO 0050 Fruiting vegetables, other than cucurbits, except sweet corn and mushroom
2 – 0.27 1.6
VL 0053 Leafy vegetables, except brassica leafy vegetables
30 – 3.15 15
GC 0645 Maize 0.01 – 0.01 – AS 0645 Maize fodder 10 (DM) – 0.52 (fresh weight
basis) 5.9 (fresh weight basis)
CF 1255 Maize, flour 0.05 – 0.014 OC 0645 Maize, oil 0.15 – 0.027 – GC 0646 Millet 0.8 – 0.22 – AS 0646 Millet, fodder 10 (DM) – 0.52 (fresh weight
basis) 5.9 (fresh weight basis)
VL 0485 Mustard greens 50 a – 11 30 GC 0647 Oats 0.15 – 0.02 – AS 0647 Oats, straw and fodder 80 (DM) – 21 (fresh weight
basis) 54 (fresh weight basis)
VA 0385 Onion, bulb 0.7 – 0.074 0.72 VA 0387 Onion, Welsh 4 – 0.89 2.0 AL 0072 Pea hay or fodder 60 (DM) – 12 (fresh weight
basis) 31 (fresh weight basis)
SO 0697 Peanut 0.05 – 0.01 – OR 0697 Peanut oil, edible 0.5 – 0.04 – AL 0697 Peanut, fodder 30 (DM) – 5.9 (fresh weight
basis) 18 (fresh weight basis)
VP 0063 Peas (pods and succulent) 3 – 0.9 1.6

Penthiopyrad
1643
Commodity MRL, mg/kg STMR or STMR-P, mg/kg
HR, mg/kg
CCN Name New Previous VP 0064 Peas, shelled 0.3 – 0.0685 0.16 FP 0009 Pome fruits 0.4 – 0.15 0.27 VR 0589 Potato 0.05 – 0.01 0.051 PO 0111 Poultry, edible offal of 0.03 – 0.02 0.023 PF 0111 Poultry, fats 0.03 – 0.02 0.023 PM 0110 Poultry, meat 0.03 – 0.02 0.021 VD 0070 Pulses, except soya beans 0.3 – 0.01 – VR 0494 Radish 3 – 0.305 1.2 SO 0495 Rape seed 0.5 – 0.084 – OC 0495 Rape seed oil, crude 1 – – – OR 0495 Rape seed oil, refined 1 – 0.11 – GC 0650 Rye 0.04 – 0.01 – AS 0650 Rye, straw and fodder 80 (DM) – 21 (fresh weight
basis) 54 (fresh weight basis)
GC 0651 Sorghum 0.8 – 0.22 – AS 0651 Sorghum, straw and fodder 10 (DM) – 0.52 (fresh weight
basis) 5.9 (fresh weight basis)
AL 0541 Soya bean fodder 200 (DM) – 52.5 (fresh weight basis)
125 (fresh weight basis)
VA 0389 Spring onions 4 – 0.89 2.0 FS 0012 Stone fruits 4 – 1.3 1.9 FB 0275 Strawberry 3 – 0.8 1.8 VR 0596 Sugar beet 0.5 – 0.105 – SO 0702 Sunflower seed 1.5 – 0.12 – VO 0447 Sweet corn (on the cob) 0.02 – 0.01 0.01 TN 0085 Tree nuts 0.05 – 0.01 0.047 GC 0653 Triticale 0.04 – 0.01 – AS 0653 Triticale, straw and fodder 80 (DM) – 21 (fresh weight
basis) 54 (fresh weight basis)
VL 0506 Turnip greens 50 – 9.4 23 GC 0654 Wheat 0.04 – 0.01 – CF 0654 Wheat, bran 0.1 – 0.018 – CF 1210 Wheat, germ 0.1 – 0.019 AS 0654 Wheat, straw and fodder 80 (DM) – 21 (fresh weight
basis) 54 (fresh weight basis)
a On the basis of information provided to the JMPR it was not possible to conclude from the estimate of short-term intake for Penthiopyrad that the consumption of mustard greens was less than the ARfD.
Dietary intake only
Commodity MRL, mg/kg STMR or STMR-P, mg/kg
HR, mg/kg
Name New Previous AL 1021 Alfalfa, forage – – 0.73 (fresh weight
basis) 4.6 (fresh weight basis)
JF 0226 Apple juice – – 0.021 – AB 0226 Apple pomace, dry – – 1.3 – AB 1230 Apple pomace, wet – – 0.69 – – Barley, beer – – 0.002 –

Penthiopyrad
1644
Commodity MRL, mg/kg STMR or STMR-P, mg/kg
HR, mg/kg
Name New Previous Barley, forage – – 10 (fresh weight
basis) 17 (fresh weight basis)
Maize, forage – – 5 (fresh weight basis)
14 (fresh weight basis)
Millet, forage – – 5 (fresh weight basis)
14 (fresh weight basis)
Oats, forage – – 10 (fresh weight basis)
17 (fresh weight basis)
AL 0528 Pea vines – – 6.2 (fresh weight basis)
23 (fresh weight basis)
Peanuts, meal – – 0.017 – Peeled potato – – 0.003 0.017 Pot barley – – 0.007 – DF 0014 Prunes – – 1.8 2.7 Rye, forage – – 10 (fresh weight
basis) 17 (fresh weight basis)
Sorghum, forage – – 5 (fresh weight basis)
14 (fresh weight basis)
AL 1265 Soya bean forage – – 16 (fresh weight basis)
24 (fresh weight basis)
AB 0541 Soya bean, hulls – – 0.08 (fresh weight basis)
–
AB 1265 Soya bean, meal – – 0.007 (fresh weight basis)
–
OR 0541 Soya bean, refined oil – – 0.032 AB 0596 Sugar beet, dried pulp – – 0.56 – DM 0596 Sugar beet, molasses – – 0.038 – Sugar beet, refined sugar – – 0.033 – – Tomato pomace, dry – – 11 – – Tomato pomace, wet – – 1.4 – JF 0048 Tomato, juice – – 0.092 – VW 0448 Tomato, paste – – 0.92 – – Tomato, puree – – 0.54 Triticale, forage – – 10 (fresh weight
basis) 17 (fresh weight basis)
CF 1211 Wheat, flour – – 0.004 Wheat, forage – – 10 (fresh weight
basis) 16 (fresh weight basis)
DIETARY RISK ASSESSMENT
Long-term intake
The WHO Panel of the 2011 JMPR established an Acceptable Daily Intake (ADI) of 0–0.1 mg/kg bw/day for penthiopyrad.
The evaluation of penthiopyrad resulted in recommendations for MRLs and STMR values for raw and processed commodities. Where data on consumption were available for the listed food commodities, dietary intakes were calculated for the 13 GEMS/Food Consumption Cluster Diets. The results are shown in Annex 3 of the 2012 Report of the JMPR.

Penthiopyrad
1645
The IEDIs in the thirteen Cluster Diets, based on the estimated STMRs were 0–6% of the maximum ADI (0.1 mg/kg bw). The Meeting concluded that the long-term intake of residues of penthiopyrad from uses that have been considered by the JMPR is unlikely to present a public health concern.
Short-term intake
The WHO Panel of the 2011 JMPR established an Acute Reference Dose (ARfD) of 1 mg/kg bw for penthiopyrad.
For mustard greens, the IESTI represented 150% of the ARfD of 1 mg/kg bw. On the basis of the information provided to the JMPR it was not possible to conclude that the estimate of the short-term intake of penthiopyrad, from the consumption of mustard greens, was less than the ARfD. The Meeting noted that an alternative GAP for mustard greens was not available.
For other commodities the IESTI for penthiopyrad calculated on the basis of the recommendations made by the JMPR represented 0–90% of the ARfD (1 mg/kg bw) for children and 0–90% for the general population.
The Meeting concluded that the short-term intake of residues of penthiopyrad resulting from uses that have been considered by the JMPR (other than mustard greens) is unlikely to present a public health concern.
REFERENCES Code Author Year Title, Institute, Report reference PTHIO_001 Tognucci, A 1999 Determination of the melting point/melting range of MTF-753, RCC Ltd. ,
Report No. 728346, GLP, unpublished PTHIO_002 Tognucci, A 1999 Determination of the boiling point/boiling range of MTF-753, RCC Ltd.,
Report No. 728357, GLP, unpublished PTHIO_003 Badt-Tognucci, A 2007 Determination of the relative density and the bulk density of MTF-753, RCC
Ltd., Report No. A59398, GLP, unpublished PTHIO_004 Tognucci, A 1999 Determination of the vapour pressure of MTF-753, RCC Ltd., Report No.
728368, GLP, unpublished PTHIO_005 Matsumoto, T 2006 Measurement of vapour pressure of DM-PCA (gas saturation method), Kurume
Laboratory, Chemicals Evaluation and Research Institute Japan, , Report No. 82557, GLP, unpublished
PTHIO_006 Weissenfeld, M 2008 PCA – Determination of the vapour pressure, RCC Ltd., Report No. B57227, GLP, unpublished
PTHIO_007 Labano, S 2009 Penthiopyrad: Calculation of Henry’s Law Constant, LKC Switzerland Ltd., Report No. 08-LKC-03, Non-GLP, unpublished
PTHIO_008 Tomiya, K 2008 Physical state of purified active substance, penthiopyrad (MTF-753), Mitsui Chemicals, Inc., Agrochemicals Division, Report No. not specified, Not GLP, unpublished
PTHIO_009 Tomiya, K 2008 Physical state of penthiopyrad technical (MTF-753)., Mitsui Chemicals, Inc., Agrochemicals Division , Report No. not specified, Non-GLP, unpublished
PTHIO_010 Tomiya, K 2008 Colour of purified active substance, penthiopyrad (MTF-753)., Mitsui Chemicals, Inc., Agrochemicals Division , Report No. not specified, Non-GLP, unpublished
PTHIO_011 Tomiya, K 2008 Colour of penthiopyrad technical (MTF-753)., Mitsui Chemicals, Inc., Agrochemicals Division , Report No. not specified, Non-GLP, unpublished
PTHIO_012 Tomiya, K 2008 Odour of purified active substance, penthiopyrad (MTF-753)., Mitsui Chemicals, Inc., Agrochemicals Division , Report No. not specified, Non-GLP, unpublished
PTHIO_013 Tomiya, K 2008 Odour of penthiopyrad technical (MTF-753)., Mitsui Chemicals, Inc., Agrochemicals Division, Report No. not specified, Non-GLP, unpublished
PTHIO_014 Badt-Tognucci, A 2007 Determination of the NMR-, IR-, UV/Vis absorption and mass spectra of MTF-753, RCC Ltd., Report No. A59433, GLP, unpublished
PTHIO_015 Franke, J 2008 Determination of the water solubility of MTF-753 including effect of pH and temperature, RCC Ltd., Report No. A79435, GLP, unpublished
PTHIO_016 Tognucci, A 1999 Determination of the solubility of MTF-753 in water and in organic solvents, RCC Ltd. , Report No. 728370, GLP, unpublished

Penthiopyrad
1646
Code Author Year Title, Institute, Report reference PTHIO_017 Matsumoto, T 2006 Measurement of water solubility for DM-PCA by flask method, Kurume
Laboratory, Chemicals Evaluation and Research Institute Japan , Report No. 82554, GLP, unpublished
PTHIO_018 Weissenfeld, M 2008 PCA: Determination of the water solubility at pH 2, pH 7 and pH 9, RCC Ltd , Report No. B57251, GLP, unpublished
PTHIO_019 Franke, J 2008 Determination of the partition coefficient (N-octanol/water) of MTF-753 including effect of pH and temperature, Harlan Laboratories Ltd., Report No. A79424, GLP, unpublished
PTHIO_020 Matsumoto, T 2006 1-Octanol/water partition coefficient for DM-PCA, Kurume Laboratory, Chemicals Evaluation and Research Institute Japan, Report No. 82555, GLP, unpublished
PTHIO_021 Furutani, E 2006 Measurement of partition coefficient of PCA (HPLC method), Kurume Laboratory, Chemicals Evaluation and Research Institute Japan , Report No. 82564, GLP, unpublished
PTHIO_022 Furutani, E 2006 1-Octanol/water partition coefficient for PAM (HPLC method), Kurume Laboratory, Chemicals Evaluation and Research Institute Japan , Report No. 82562, GLP, unpublished
PTHIO_023 Furutani, E 2006 1-Octanol/water partition coefficient for 753-A-OH (HPLC method), Kurume Laboratory, Chemicals Evaluation and Research Institute Japan, Report No. 82560, GLP, unpublished
PTHIO_024 Tognucci, A 1999 Hydrolysis determination of MTF-753 at different pH values , RCC Ltd., Report No. 728381, GLP, unpublished
PTHIO_025 Burgener, A 1999 Aqueous photolysis of MTF-753 under laboratory conditions , RCC Ltd., Report No. 728414, GLP, unpublished
PTHIO_026 Tognucci, A 1999 Determination of the dissociation constant of MTF-753 in water, RCC Ltd., Report No. 728403, GLP, unpublished
PTHIO_027 Adam, D 2006 [14C] MTF-753: simulated processing, RCC Ltd., Report No. A59635, GLP, unpublished
PTHIO_028 Burri, R 2009 [14C] MTF-753: absorption, distribution, metabolism and excretion after repeated oral administration to lactating goats, Harlan Laboratories Ltd., Report No. A59657, GLP, unpublished
PTHIO_029 Marin, J 2009 A metabolism study of [14C]pyrazole and [14C]thienyl MTF-753 in lactating goats, PTRL West, Inc., Report No. 1794W, GLP, unpublished
PTHIO_030 Burri, R 2009 [14C]-MTF-753: absorption, distribution, metabolism and excretion after repeated oral administration to laying hens, Harlan Laboratories Ltd., Report No. A59646, GLP, unpublished
PTHIO_031 Marin, J 2009 A metabolism study with [14C]pyrazole and [14C]thienyl MTF-753 in the laying hens, PTRL West, Inc., Report No. 1795W, GLP, unpublished
PTHIO_032 Baker, FC, Bautista, A
2006 A metabolism study with [14C]pyrazole and [14C]thienyl MTF-753 on cabbage , PTRL West, Inc. , Report No 1261W-1, GLP, unpublished
PTHIO_033 Baker, FC, Bautista, A
2006 A metabolism study with [14C]pyrazole and [14C]thienyl MTF-753 on tomatoes, PTRL West, Inc. , Report No. 1178W-1, GLP, unpublished
PTHIO_034 Baker, FC, Bautista, A
2009 A metabolism study with [14C]pyrazole and [14C]thienyl MTF-753 on wheat, PTRL West, Inc. , Report No 1508W-1, GLP, unpublished
PTHIO_035 Baker, FC, Bautista, A
2009 A metabolism study with [14C]pyrazole and [14C]thienyl MTF-753 on canola, PTRL West, Inc. , Report No 1509W-1, GLP, unpublished
PTHIO_036 Walther, D 2009 [14C]Penthiopyrad (14C-MTF-753): confined accumulation of 14C-MTF-753 in rotational crops, Harlan Laboratories Ltd., Report No. A59624, GLP, unpublished
PTHIO_037 Cairns, SD, Hoskins, M, McConnell, K
2009 Storage stability of penthiopyrad (MTF-753), PAM (IN-PGH45), 753-A-OH (IN-PGH53), 753-F-DO (IN-PGH59), PCA (IN-MR507) and DM-PCA (IN-DRJ75) in representative crop commodities , Charles River Laboratories , Report No. DuPont-20368, GLP, unpublished
PTHIO_038 Cairns, SD, Hoskins, M, McConnell, K
2010 Storage stability of penthiopyrad (MTF-753), PAM (IN-PGH45), 753-A-OH (IN-PGH53), 753-F-DO (IN-PGH59), PCA (IN-MR507) and DM-PCA (IN-DRJ75) in representative crop commodities, Charles River Laboratories (UK), DuPont-20368, GLP, unpublished
PTHIO_039 Rodgers, M 2009 MTF-753 (Penthiopyrad): Residues of MTF-753 and its metabolites in eggs and tissues of laying hens. , Huntingdon Life Sciences Ltd., Report No. LDA0081, Amendment 1, GLP, unpublished
PTHIO_040 Rawle, NW 2008 Residues of MTF-753 in milk and edible tissues following oral administration to lactating dairy cattle, CEM Analytical Services Ltd. (CEMAS) , Report No CEMR-3569, GLP, unpublished
PTHIO_041 Old, J, Ferguson, L 2009 Field crop rotation study with DPX-LEM17 20SC—Europe 2007/8, Charles River Laboratories, DuPont-22835, Interim Report No. 1, GLP, unpublished

Penthiopyrad
1647
Code Author Year Title, Institute, Report reference PTHIO_042 Old, J, Ferguson, L,
Woodmansey, L 2009 Field crop rotation study with DPX-LEM17 20SC—Europe 2007–2009,
Charles River Laboratories, DuPont-22835, GLP, unpublished PTHIO_043 Shepard, E 2009 Field crop rotation study with DPX-LEM17 20SC—USA and Canada, 2007/8
(interim report), ABC Laboratories, Inc., DuPont-22836, Interim Report No. 1, GLP, unpublished
PTHIO_044 Shepard, E 2009 Field crop rotation study with DPX-LEM17 20SC—USA and Canada, 2007–2009, ABC Laboratories, Inc., DuPont-22836, GLP, unpublished
PTHIO_045 Mamouni, A. 2008 14C-MT-753: phototransformation on soil surfaces under laboratory conditions, RCC Ltd., Report No. A56204, GLP, unpublished
PTHIO_046 Mamouni, A 2008 14C-MT-753: degradation and metabolism in four soils incubated under aerobic conditions, RCC Ltd. Report No. A56215, GLP, unpublished
PTHIO_047 Gassen, M 2009 First amendment to report—14C-MT-753: degradation and metabolism in four soils incubated under aerobic conditions, Harlan Laboratories Ltd. (former RCC Ltd.), Report No. A56215, GLP, unpublished
PTHIO_048 Mamouni, A 2008 14C-MT-753: degradation and metabolism in one north American soil incubated under aerobic conditions, RCC Ltd., Report No. A56226, GLP, unpublished
PTHIO_049 Gassen, M 2009 First amendment to report - 14C-MT-753: degradation and metabolism in one north American soil incubated under aerobic conditions, Harlan Laboratories Ltd. (former RCC Ltd.) , Report No. A56226, GLP, unpublished
PTHIO_050 Gassen, M 2009 Second amendment to report - 14C-MT-753: degradation and metabolism in one north American soil incubated under aerobic conditions, Harlan Laboratories Ltd. (former RCC Ltd.), Report No. A56226, GLP, unpublished
PTHIO_051 Satsuma, K 2005 Metabolic fate of MTF-753 in aerobic soil, The Institute of Environmental Toxicology, Report No IET 03-8002, GLP, unpublished
PTHIO_052 Rzepka, S 2008 Assessment of the applicability of DFG Method S 19 for the determination of penthiopyrad (MTF-753) and its metabolites PCA, 753-A-OH and PAM. , Eurofins Analytik GmbH Dr. Specht Laboratories. , Report No.: LKC-0701. , GLP, unpublished
PTHIO_053 Rzepka, S 2008 Validation according to DFG Method S 19 for the determination of penthiopyrad (MTF-753) and its metabolites in plant matrices (wheat (straw), oil seed rape (seeds), oranges (whole fruit) and grapes (fruit)). , Eurofins Analytik GmbH Dr. Specht Laboratories. , Report No. MCI-0801V. , GLP, unpublished
PTHIO_054 Daneva, E 2009 First Amendment to Report: Validation according to DFG Method S 19 for the determination of penthiopyrad (MTF-753) and its metabolites in plant matrices (wheat (straw), oil seed rape (seeds), oranges (whole fruit) and grapes (fruit)). , Eurofins Analytik GmbH Dr. Specht Laboratories. , Report No. MCI-0801V. , GLP, unpublished
PTHIO_055 Meyer, M 2009 Independent Laboratory Validation of the Analytical DFG Method S19 for the Determination of Residues of Penthiopyrad and its Metabolites 753-A-OH and PAM in Plant and Animal Matrices Using LC-MS/MS., SGS Institute Fresenius, Report No. IF 09/01405021. , GLP, unpublished
PTHIO_056 Ballard, TD 2009 United States Food and Drug Administration (FDA) Multi-residue Method (MRM) Testing for Penthiopyrad and 4 Metabolites. , EN-CAS Analytical Laboratories. , Report No. 08-0008. , GLP, unpublished
PTHIO_057 Bell, A 2008 Method validation for the determination of penthiopyrad (MTF-753) and its metabolites in watery, acidic, dry and oily matrices using LC MS/MS. , CEM Analytical Services Limited (CEMAS)., Report No. CEMR 3727. , GLP, unpublished
PTHIO_058 Stry, JJ 2009 Validation and Description of an Analytical Method for the Analysis of Penthiopyrad and its Metabolites in Various Crop Commodities Used to Support European Union Magnitude of Residue Field Trials , E.I. du Pont de Nemours and Company. Report No. DuPont-26589 Revision 1, GLP, unpublished.
PTHIO_059 Stry, JJ 2009 Validation and Description of an Analytical Method for the Analysis of Penthiopyrad and its Metabolites in Various Crop Commodities Used to Support North American Magnitude of Residue Field Trials. , E.I. du Pont de Nemours and Company, Report No. DuPont-26592, GLP, unpublished.
PTHIO_060 Sadgrove, L 2009 Penthiopyrad and its metabolites 753-A-OH, PCA, PAM and DM-PCA: Independent laboratory validation of methodology for the determination of residues of Penthiopyrad (MTF-753) and its metabolites 753-A-OH, PCA, PAM and DM-PCA in 3 crop types: dry, oily and watery/acidic. , Huntingdon Life Sciences Ltd., Report No. MTU0436. , GLP, unpublished.
PTHIO_061 Class, T 2009 Validation of the DFG Method S19 for the Determination of Penthiopyrad and its Metabolites 753-A-OH and PAM in Foodstuffs of Animal Origin, using LC-

Penthiopyrad
1648
Code Author Year Title, Institute, Report reference MS/MS. , PTRL Europe. , Report No. P/B 1508 G. , GLP, unpublished
PTHIO_062 Airs, D 2008 MTF-753, PCA, PAM and 753-A-OH—validation of methodology for the determination of residues in chicken (liver, muscle, skin/fat, abdominal fat and eggs)., Huntingdon Life Sciences Ltd., Report No. LDA0082., GLP, unpublished
PTHIO_063 Airs, D 2008 MTF-753, PCA, PAM and 753-A-OH Validation of the methodology for the determination of the residue in bovine tissue (liver, muscle, kidney and fat) and milk., Huntingdon Life Sciences Ltd. , Report No. LDA0083., GLP, unpublished
PTHIO_064 Oliver-Kang, J 2008 Method validation for the determination of MTF-753 and its metabolites in milk, CEM Analytical Services Limited (CEMAS). , Report No.: CEMR-3574. , GLP, unpublished
PTHIO_065 Oliver-Kang, J 2008 Method Validation for the determination of MTF-753 and its metabolites in tissues of ruminants. , CEM Analytical Services Limited (CEMAS). , Report No.: CEMR-3657., GLP, unpublished
PTHIO_066 Class, T 2009 Independent Laboratory Validation of HLS Methods LDA0082 and LDA0083 for the Determination of Penthiopyrad and its Metabolites 753-A-OH and PAM in Foodstuffs of Animal Origin, using LC/MS/MS. (With first amendment), PTRL Europe. , Report No.: P/B 1631 G. , GLP, unpublished
PTHIO_067 Old, J, Cairns, S 2009 Combined decline and magnitude of residues of penthiopyrad and its metabolites in protected tomatoes (solanaceae—fruiting vegetables) following applications of DPX-LEM17 20SC under maximum label rate - Europe, 2007-2008, Charles River Laboratories, DuPont-22361, GLP, unpublished
PTHIO_068 Old, J, Cairns, S 2009 Combined decline and magnitude of residues of penthiopyrad and its metabolites in field tomatoes (solanaceae—fruiting vegetables) following applications of DPX-LEM17 20SC under maximum label rate—Europe, 2007–2008, Charles River Laboratories, DuPont-22362, GLP, unpublished
PTHIO_069 Shepard, E 2009 Combined decline and magnitude of residues of penthiopyrad and its metabolites in tomatoes and peppers (fruiting vegetables) following applications of DPX-LEM17 20SC under maximum label rate—USA and Canada, 2008, ABC Laboratories, Inc., DuPont-24953, GLP, unpublished
PTHIO_070 Old, J, Woodmansey, L
2010 Combined decline and magnitude of residues of penthiopyrad and its metabolites in protected peppers (solanaceae—fruiting vegetables) following applications of penthiopyrad (DPX-LEM17) 200 g/L SC under maximum label rate—Europe, 2009, Charles River Laboratories, DuPont-27268, GLP, unpublished
PTHIO_071 Old, J, Cairns, S 2009 Combined decline and magnitude of residues of penthiopyrad and its metabolites in protected cucumbers and courgettes (edible peel cucurbits) following applications of DPX-LEM17 20SC under maximum label rate—Europe, 2007–2008, Charles River Laboratories, DuPont-22366, GLP, unpublished
PTHIO_072 Old, J, Cairns, S 2009 Combined decline and magnitude of residues of penthiopyrad and its metabolites in field cucumbers (edible peel cucurbits) following applications of DPX-LEM17 20SC under maximum label rate—Europe, 2007–2008, Charles River Laboratories, DuPont-22367, GLP, unpublished
PTHIO_073 Thiel, A 2008 Combined decline and magnitude of residues of penthiopyrad and its metabolites in cucumbers, summer squash and melons (cucurbits) following applications of DPX-LEM17 20SC under maximum label rate—USA and Canada, 2007, ABC Laboratories, Inc., DuPont-22425, GLP, unpublished
PTHIO_074 Old, J, Hoskins, M &, Foster, A
2009 Combined decline and magnitude of residues of penthiopyrad and its metabolites in apples and pears (pome fruit) following applications of DPX-LEM17 20SC under maximum label rate—Europe, 2007–2008, Charles River Laboratories, DuPont-22364, GLP, unpublished
PTHIO_075 Shepard, E 2008 Combined decline and magnitude of residues of penthiopyrad and its metabolites in apples and pears (pome fruit) following applications of DPX-LEM17 20SC under maximum label rate USA and Canada, 2007, ABC Laboratories, Inc., DuPont-22299, GLP, unpublished
PTHIO_076 Shepard, E 2008 Combined decline and magnitude of residue of penthiopyrad and its metabolites in peaches, plums, sweet and tart cherries (stone fruit) following applications of DPX-LEM17 20SC under maximum label rate—USA and Canada, 2007, ABC Laboratories, Inc., DuPont-22300, GLP, unpublished
PTHIO_077 Old, J, Hoskins, M & Foster, A
2009 Combined decline and magnitude of residues of penthiopyrad and its metabolites in wheat (cereals) following applications of DPX-LEM17 20SC, DPX-LEM17 200 g/L EC, chlorothalonil/ penthiopyrad (DPX-QFA61) SC (250 g/L:100 g/L) and cyproconazole/penthiopyrad, Charles River

Penthiopyrad
1649
Code Author Year Title, Institute, Report reference Laboratories, DuPont-22360, Revision No. 2, GLP, unpublished
PTHIO_078 Old, J, & Woodmansey, L
2009 Combined decline and magnitude of residues of penthiopyrad and its metabolites in barley (cereals) following applications of DPX-LEM17 20SC, DPX-LEM17 200 g/L EC, chlorothalonil/ penthiopyrad (DPX-QFA61) SC (250 g/L:100 g/L) and cyproconazole/penthiopyrad (DPX-QEK67) SC (60 g/L:150 g/L) under maximum label rate—France and northern Europe 2007–2008, Charles River Laboratories, DuPont-22358, GLP, unpublished
PTHIO_079 Shepard, E 2010 Combined decline and magnitude of residues of penthiopyrad and its metabolites in wheat and barley following applications of Penthiopyrad (DPX-LEM17) 200 g/L EC under maximum label rate—USA and Canada, 2009, ABC Laboratories, Inc., DuPont-27968, GLP, unpublished
PTHIO_080 Shepard, E 2008 Combined decline and magnitude of residues of penthiopyrad and its metabolites in strawberries following applications of DPX-LEM17 20SC under maximum label rate —USA and Canada, 2008, ABC Laboratories, Inc., DuPont-24952, GLP, unpublished
PTHIO_081 Thiel, A 2009 Combined decline and magnitude of residues of penthiopyrad and its metabolites in dry bulb onions and green onions (bulb vegetables) following applications of DPX-LEM17 20SC under maximum label rate—USA and Canada, 2008, ABC Laboratories, Inc., DuPont-24954, GLP, unpublished
PTHIO_082 Shepard, E 2010 Combined decline and magnitude of residues of penthiopyrad and its metabolites in broccoli/cauliflower, cabbage, mustard greens (brassica vegetables) following applications of Penthiopyrad (DPX-LEM17) 200 g/L SC under maximum label rate—USA and Canada, 2009, ABC Laboratories, Inc., DuPont-27258, Revision No. 1, GLP, unpublished
PTHIO_083 Shepard, E 2009 Combined decline and magnitude of residues of penthiopyrad and its metabolites in celery, head lettuce, leaf lettuce, and spinach (leafy vegetables) following applications of DPX-LEM17 20SC under maximum label rate—USA and Canada, 2008, ABC Laboratories, Inc., DuPont-24955, GLP, unpublished
PTHIO_084 Shepard, E 2010 Magnitude of residues of penthiopyrad and its metabolites in edible-podded beans and peas (Subcrop group 6A) and succulent shelled beans and peas (Subcrop group 6B) following applications of Penthiopyrad (DPX-LEM17) 200 g/L SC under maximum label rate—USA and Canada, 2009, ABC Laboratories, Inc. (Missouri), DuPont-27964, GLP, unpublished
PTHIO_085 Thiel, A 2009 Combined decline and magnitude of residues of penthiopyrad and its metabolites in dried peas and beans (crop subgroup 6C) following applications of DPX-LEM17 20SC under maximum label rate—USA and Canada, 2007, ABC Laboratories, Inc., DuPont-22303, Revision No. 1, GLP, unpublished
PTHIO_086 Thiel, A 2009 Magnitude of residues of penthiopyrad and its metabolites in dried peas and beans (subcrop group 6C) following applications of DPX-LEM17 20SC and DPX-LEM17 20EC under maximum label rate - USA and Canada, 2008, ABC Laboratories, Inc., DuPont-24709, GLP, unpublished
PTHIO_087 Shepard, E 2010 Combined decline and magnitude of residues of penthiopyrad and its metabolites in soya beans following applications of Penthiopyrad (DPX-LEM17) 200 g/L EC under maximum label rate—USA and Canada, 2009, ABC Laboratories, Inc. (Missouri), DuPont-27966, GLP, unpublished
PTHIO_088 Shepard, E 2010 Magnitude of residues of penthiopyrad and its metabolites in carrot, radish, sugar beet and turnip (root and tuber vegetables) following applications of Penthiopyrad (DPX-LEM17) 200 g/L SC or Penthiopyrad (DPX-LEM17) 200 g/L EC under maximum label rate—USA and Canada, 2009, ABC Laboratories, Inc., DuPont-27906, GLP, unpublished
PTHIO_089 Thiel, A 2009 Combined decline and magnitude of residues of penthiopyrad and its metabolites in potatoes following applications of DPX-LEM17 20SC and DPX-LEM17 20EC under maximum label rate - USA and Canada, 2008, ABC Laboratories, Inc., DuPont-24958, GLP, unpublished
PTHIO_090 Shepard, E 2009 Magnitude of residues of penthiopyrad and its metabolites In almonds and pecans (tree nuts) following applications of DPX-LEM17 20SC under maximum label rate—USA, 2007, ABC Laboratories, Inc., DuPont-22305, Revision No. 1, GLP, unpublished
PTHIO_091 Old, J, & Spence, C 2009 Combined decline and magnitude of residues of penthiopyrad and its metabolites in oilseed rape (oilseeds) following application of DPX-LEM17 20SC under maximum label rate—northern Europe, 2007–2008, Charles River Laboratories, DuPont-22365, GLP, unpublished
PTHIO_092 Old, J, Cairns, S & McConnell, K
2009 Combined decline and magnitude of residues of penthiopyrad and its metabolites in oilseed rape (oilseeds) following applications of DPX-LEM17 200 g/L EC under maximum label rate—France and northern Europe, 2008,

Penthiopyrad
1650
Code Author Year Title, Institute, Report reference Charles River Laboratories, DuPont-24712, GLP, unpublished
PTHIO_093 Thiel, A 2009 Combined decline and magnitude of residues of penthiopyrad and its metabolites in canola (oilseed) following applications of DPX-LEM17 20SC under maximum label rate—USA and Canada, 2007, ABC Laboratories, Inc., DuPont-22298, GLP, unpublished
PTHIO_094 Thiel, A 2009 Magnitude of residues of penthiopyrad and its metabolites in canola (oilseed) following applications of DPX-LEM17 20SC and DPX-LEM17 20EC under maximum label rate - USA and Canada, 2008, ABC Laboratories, Inc., DuPont-24711, GLP, unpublished
PTHIO_095 Old, J & Cairns, S 2009 Magnitude of residues of cyproconazole, penthiopyrad and its metabolites in sunflowers (oilseeds) following applications of Cyproconazole/Penthiopyrad (DPX-QEK67) SC (60 g/L:150 g/L) under maximum label rate—northern Europe 2008, Charles River Laboratories, DuPont-24500, GLP, unpublished
PTHIO_096 Old, J & Spence, C 2009 Combined decline and magnitude of residues of penthiopyrad and its metabolites in sunflowers (oilseeds) following applications of DPX-LEM17 20SC under maximum label rate—northern Europe, 2007–2008, Charles River Laboratories, DuPont-22363, GLP, unpublished
PTHIO_097 Shepard, E 2010 Magnitude of residues of penthiopyrad and its metabolites in sunflower following applications of Penthiopyrad (DPX-LEM17) 200 g/L EC under maximum label rate—USA and Canada, 2009, ABC Laboratories, Inc., DuPont-27969, GLP, unpublished
PTHIO_098 Thiel, A 2009 Magnitude of residues of penthiopyrad and its metabolites in peanuts and their processed fractions following applications of DPX-LEM17 20SC under maximum label rate—USA, 2007, ABC Laboratories, Inc., DuPont-22296, GLP, unpublished
PTHIO_099 Shepard, E 2009 Combined decline and magnitude of residues of penthiopyrad and its metabolites in sweet corn following applications of Penthiopyrad (DPX-LEM17) 200 g/L EC under maximum label rate—USA and Canada, 2009, ABC Laboratories, Inc. (Missouri), DuPont-28056, GLP, unpublished
PTHIO_100 Shepard, E 2010 Combined decline and magnitude of residues of penthiopyrad and its metabolites in field corn following applications of Penthiopyrad (DPX-LEM17) 200 g/L EC under maximum label rate—USA and Canada, 2009, ABC Laboratories, Inc. (Missouri), DuPont-28055, GLP, unpublished
PTHIO_101 Shepard, E 2010 Magnitude of residues of penthiopyrad and its metabolites in cotton following applications of Penthiopyrad (DPX-LEM17) 200 g/L EC under maximum label rate - USA, 2009, ABC Laboratories, Inc. (Missouri), DuPont-27905, GLP, unpublished
PTHIO_102 Shepard, E 2010 Combined decline and magnitude of residues of penthiopyrad and its metabolites in alfalfa following applications of Penthiopyrad (DPX-LEM17) 200 g/L SC under maximum label rate—USA and Canada, 2009, ABC Laboratories, Inc., DuPont-27967, GLP, unpublished
PTHIO_103 Shepard, E 2008 Magnitude of residues of penthiopyrad and its metabolites in processed fractions of apples (pome fruit) following applications of DPX-LEM17 20SC under maximum label rate—USA, 2007, ABC Laboratories, Inc., DuPont-22302, GLP, unpublished
PTHIO_104 Old, J, Cairns, S, Hansford, RJ & Hoskins, M
2009 Magnitude of residues of penthiopyrad and its metabolites in processed fractions of field tomatoes (solanaceae—fruiting vegetables) following applications of DPX-LEM17 20SC under maximum label rate—Europe, 2007, Charles River Laboratories, DuPont- 22356, GLP, unpublished
PTHIO_105 Shepard, E 2008 Magnitude of residues of penthiopyrad and its metabolites in processed fractions of plums (stone fruit) following applications of DPX-LEM17 20SC under maximum label rate—USA, 2007, ABC Laboratories, Inc., DuPont-22304, Revision No. 1, GLP, unpublished
PTHIO_106 Shepard, E 2010 Magnitude of residues of penthiopyrad and its metabolites in processed commodities of soya beans following applications of Penthiopyrad (DPX-LEM17) 200 g/L EC at an exaggerated rate—USA and Canada, 2009, ABC Laboratories, Inc., DuPont-27965, Revision No. 1, GLP, unpublished
PTHIO_107 Rice F 2009 Magnitude of residues of penthiopyrad and its metabolites in potatoes and potato processed fractions following applications of DPX-LEM17 20SC and 20EC at an exaggerated rate—USA and Canada, 2008, ABC Laboratories, Inc., DuPont-24499, GLP, unpublished
PTHIO_108 Shepard, E 2010 Magnitude of residues of penthiopyrad and its metabolites in processed commodities of sugar beets following applications of Penthiopyrad (DPX-LEM17) 200 g/L EC at an exaggerated rate—USA and Canada, 2009, ABC Laboratories, Inc., DuPont-27907, GLP, unpublished

Penthiopyrad
1651
Code Author Year Title, Institute, Report reference PTHIO_109 Old, J &
Woodmansey, L 2009 Magnitude of residues of penthiopyrad and its metabolites in processed
fractions of barley (cereals) following applications of DPX-LEM17 20SC under maximum label rate—northern Europe, 2007, Charles River Laboratories, DuPont-22389, GLP, unpublished
PTHIO_110 Old, J & Woodmansey, L
2009 Magnitude of residues of penthiopyrad and its metabolites in processed fractions of wheat (cereals) following applications of DPX-LEM17 20SC under maximum label rate—northern Europe, 2007, Charles River Laboratories, DuPont-22390, Revision No. 1, GLP, unpublished
PTHIO_111 Shepard, E 2010 Magnitude of residues of penthiopyrad and its metabolites in processed commodities of wheat following applications of Penthiopyrad (DPX-LEM17) 200 g/L EC at an exaggerated rate—USA and Canada, 2009, ABC Laboratories, Inc., DuPont-27270, GLP, unpublished
PTHIO_112 Shepard, E 2010 Magnitude of residues of penthiopyrad and its metabolites in processed commodities of field corn following applications of Penthiopyrad (DPX-LEM17) 200 g/L EC at an exaggerated rate—USA and Canada, 2009, ABC Laboratories, Inc., DuPont-27970, GLP, unpublished
PTHIO_113 Thiel, A 2009 Magnitude of residues of penthiopyrad and its metabolites in processed fractions of canola (oilseed) following applications of DPX-LEM17 20SC under maximum label rate—USA and Canada, 2007, ABC Laboratories, Inc., DuPont-22301, GLP, unpublished
PTHIO_114 Baker, FC & Bautista, A
2006 A metabolism study with [14C]pyrazole and [14C]thienyl MTF-753 on grapes, PTRL West Inc., Mitsui Chemicals, 1177W-1, GLP, unpublished