Embed Size (px)
Citation preview
8/8/2019 PEG Concept
http://slidepdf.com/reader/full/peg-concept 1/19
8/8/2019 PEG Concept
http://slidepdf.com/reader/full/peg-concept 2/19
PEG Con: 2
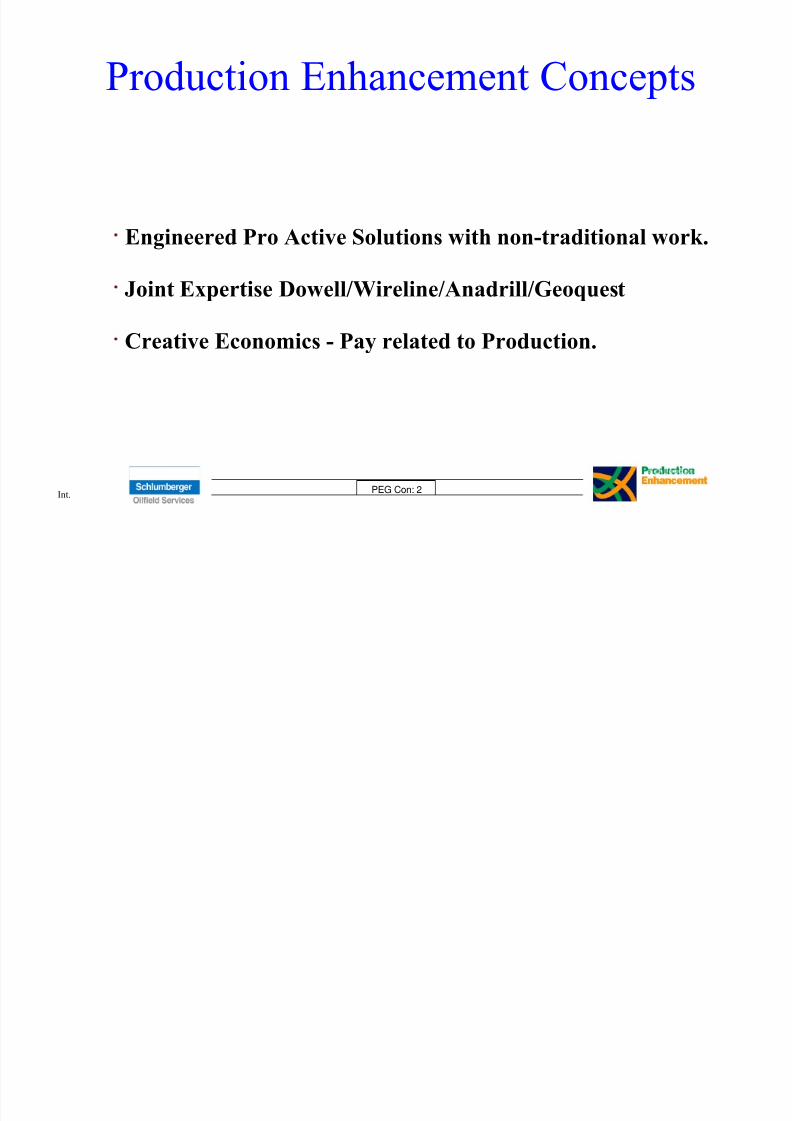
Engineered Pro Active Solutions with non-traditional work.
Joint Expertise Dowell/Wireline/Anadrill/Geoquest
Creative Economics - Pay related to Production.
Production Enhancement Concepts
Int.
8/8/2019 PEG Concept
http://slidepdf.com/reader/full/peg-concept 3/19
PEG Con: 3
IMPROVING OUR CLIENTS PRODUCTION IN EXISTING
WELLS THROUGH THE SYNERGISTIC TECHNOLOGIESOF THE SCHLUMBERGER COMPANIES.
Mission Statement
8/8/2019 PEG Concept
http://slidepdf.com/reader/full/peg-concept 4/19
PEG Con: 4
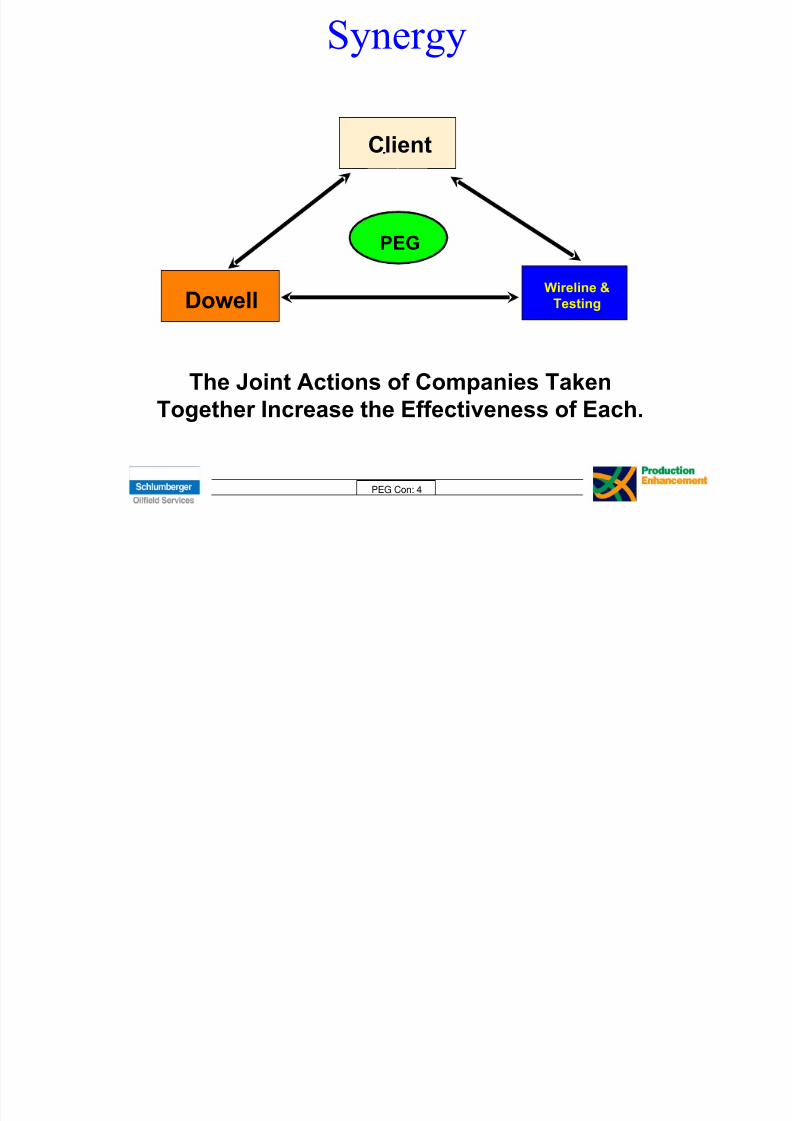
Synergy
The Joint Actions of Companies Taken
Together Increase the Effectiveness of Each.
Client
DowellWireline &
Testing
PEG
8/8/2019 PEG Concept
http://slidepdf.com/reader/full/peg-concept 5/19
PEG Con: 5
Objectives of Production
Enhancement
• Identify Wells with a Production Gap.
• Apply services that economically enhance production.
• Establish Feedback Loop.
• Improve Communication.
8/8/2019 PEG Concept
http://slidepdf.com/reader/full/peg-concept 6/19
PEG Con: 6
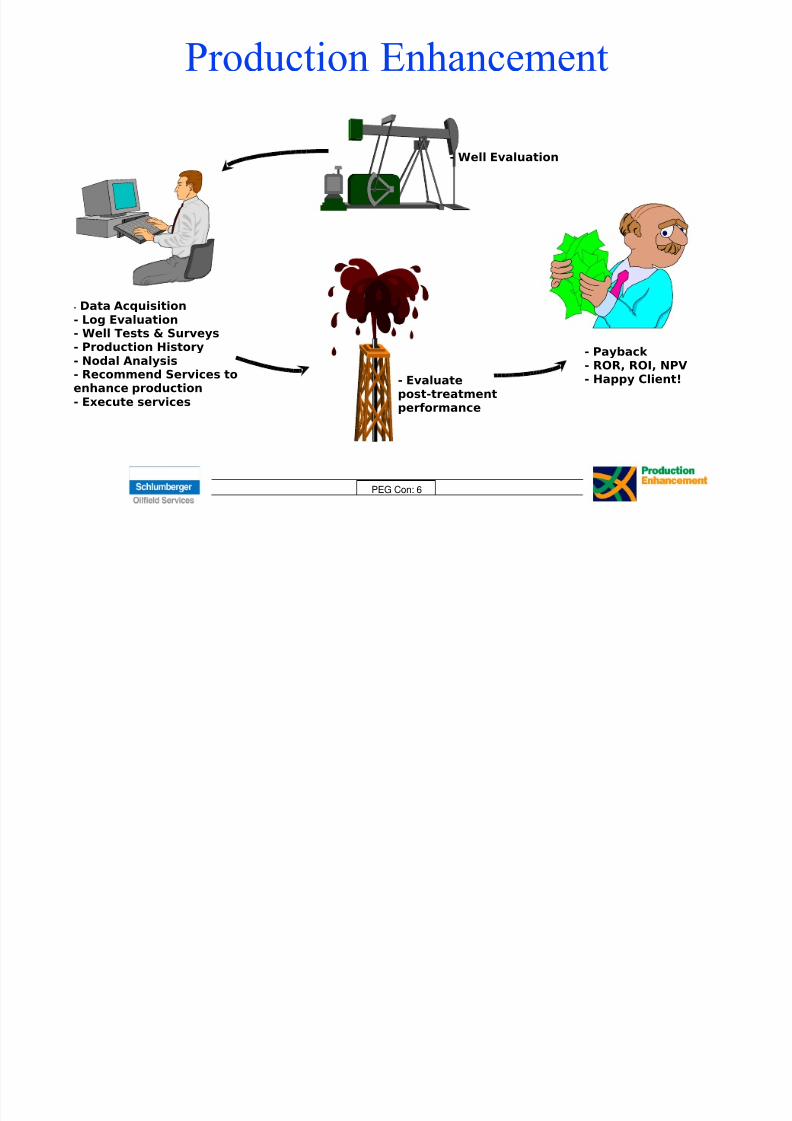
Production Enhancement
- Well Evaluation
- Data Acquisition- Log Evaluation- Well Tests & Surveys- Production History
- Nodal Analysis- Recommend Services toenhance production- Execute services
- Evaluatepost-treatmentperformance
- Payback
- ROR, ROI, NPV- Happy Client!
8/8/2019 PEG Concept
http://slidepdf.com/reader/full/peg-concept 7/19
PEG Con: 7
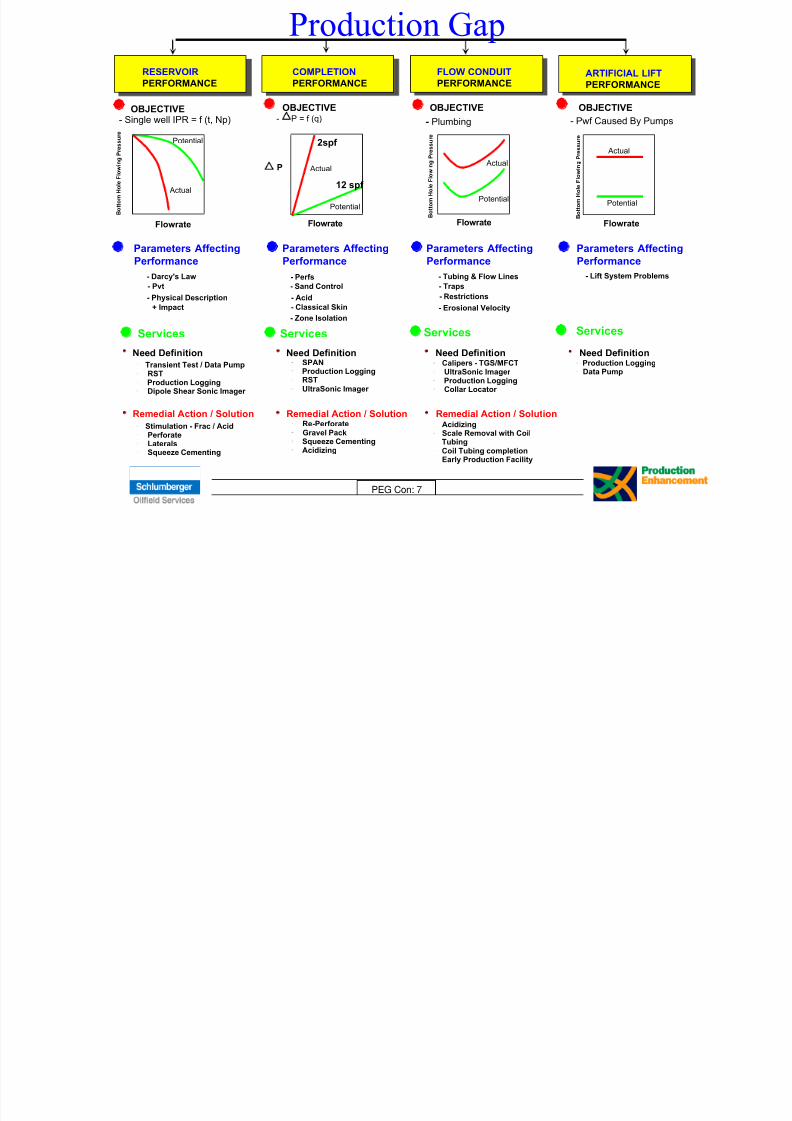
Flowrate
- Single well IPR = f (t, Np)
- Pvt
- Plumbing - Pwf Caused By Pumps
- Restrictions- Acid
- Lift System Problems
Potential
Actual
Actual
Potential
Actual
Potential
Actual
Potential
SPANProduction LoggingRSTUltraSonic Imager
Re-PerforateGravel PackSqueeze CementingAcidizing
Transient Test / Data PumpRSTProduction LoggingDipole Shear Sonic Imager
Stimulation - Frac / AcidPerforateLateralsSqueeze Cementing
Calipers - TGS/MFCTUltraSonic Imager Production LoggingCollar Locator
AcidizingScale Removal with CoilTubingCoil Tubing completionEarly Production Facility
Production LoggingData Pump
- P = f (q)
- Darcy's Law
- Physical Description
+ Impact
- Perfs
- Sand Control
- Classical Skin
- Zone Isolation
- Tubing & Flow Lines
- Traps
- Erosional Velocity
P
Services Services Services Services
Parameters Affecting
Performance
Parameters Affecting
Performance
Parameters Affecting
Performance
Parameters Affecting
Performance
Need DefinitionNeed Definition Need Definition Need Definition
Remedial Action / SolutionRemedial Action / Solution Remedial Action / Solution
Production Gap
RESERVOIR
PERFORMANCE
COMPLETION
PERFORMANCE
FLOW CONDUIT
PERFORMANCEARTIFICIAL LIFT
PERFORMANCE
OBJECTIVE
Bottom
HoleFlowing
Pressure
2spf
12 spf
OBJECTIVE OBJECTIVE OBJECTIVE
Flowrate Flowrate FlowrateBottom
HoleFlowing
Pressure
Bottom
HoleFlowing
Pressure
8/8/2019 PEG Concept
http://slidepdf.com/reader/full/peg-concept 8/19
PEG Con: 8
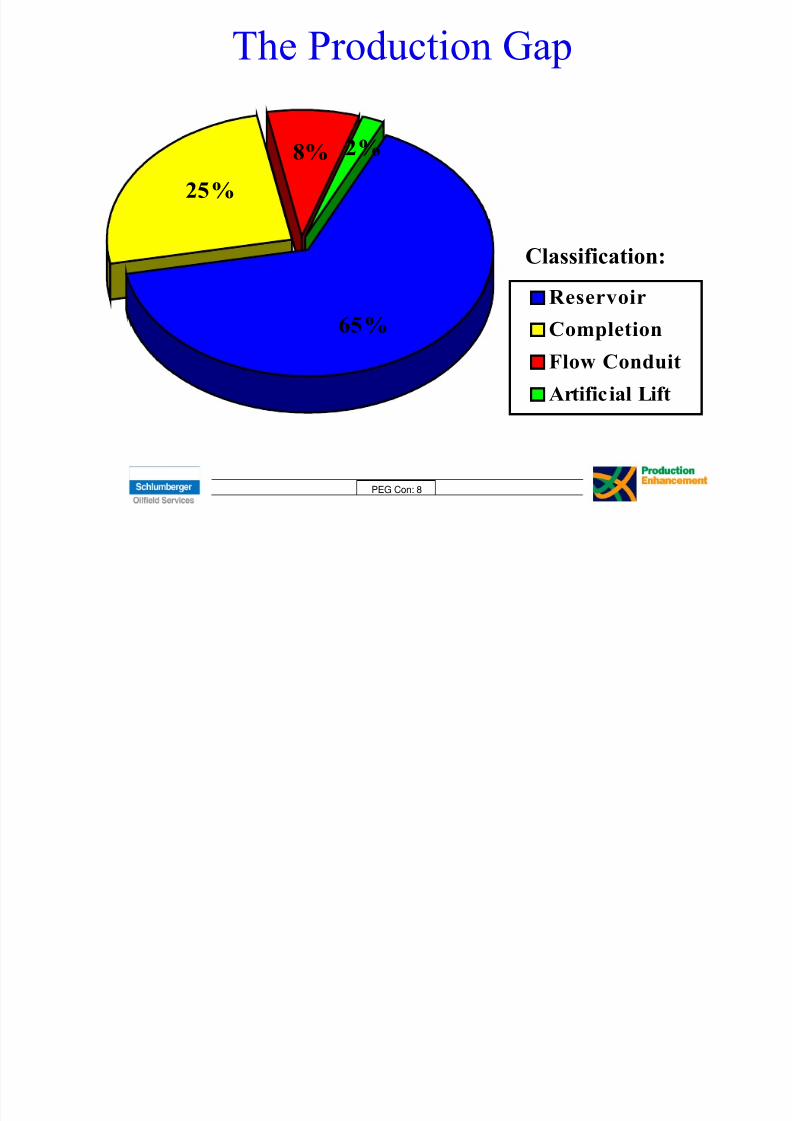
The Production Gap
25%
65%
8% 2%
Reservoir
Completion
Flow Conduit
Artificial Lift
Classification:
8/8/2019 PEG Concept
http://slidepdf.com/reader/full/peg-concept 9/19
PEG Con: 9
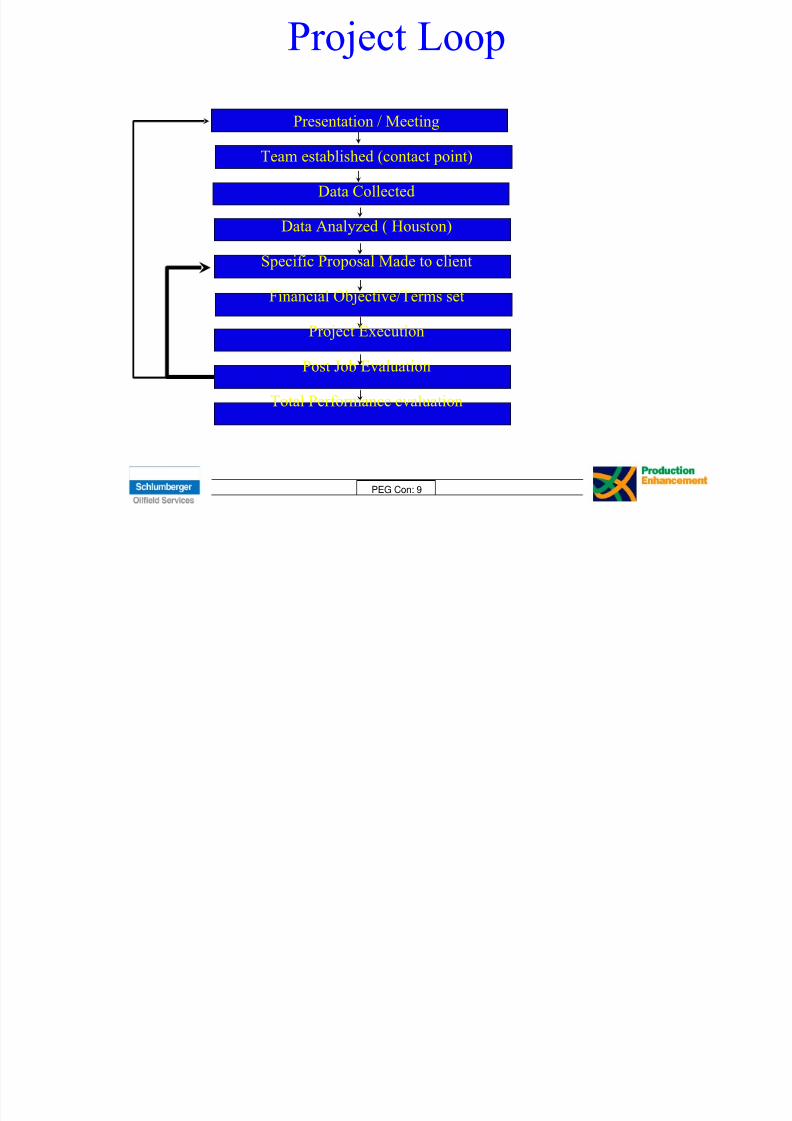
Project Loop
Presentation / Meeting
Team established (contact point)
Data Collected
Data Analyzed ( Houston)
Specific Proposal Made to client
Financial Objective/Terms set
Project Execution
Post Job Evaluation
Total Performance evaluation
8/8/2019 PEG Concept
http://slidepdf.com/reader/full/peg-concept 10/19
PEG Con: 10
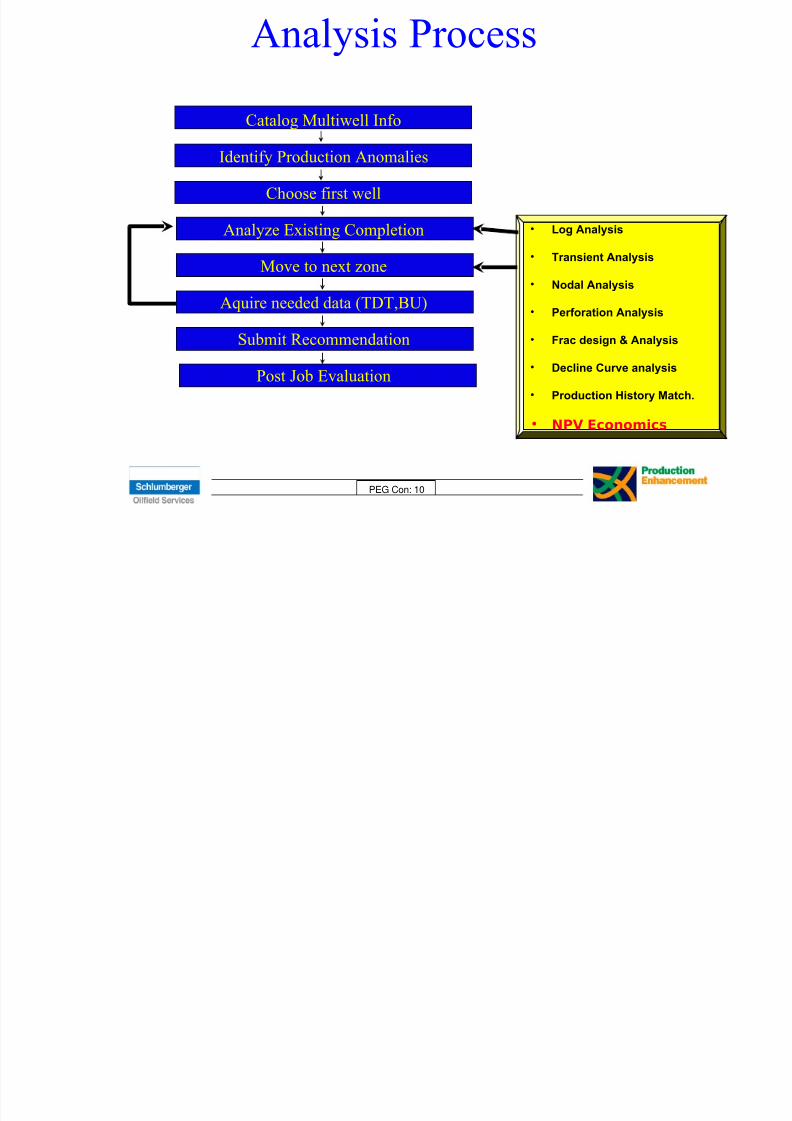
Analysis Process
Catalog Multiwell Info
Identify Production Anomalies
Choose first well
Analyze Existing Completion
Move to next zone
Aquire needed data (TDT,BU)
Submit Recommendation
Post Job Evaluation
• Log Analysis
• Transient Analysis
• Nodal Analysis
• Perforation Analysis
• Frac design & Analysis
• Decline Curve analysis
• Production History Match.
• NPV Economics
8/8/2019 PEG Concept
http://slidepdf.com/reader/full/peg-concept 11/19
PEG Con: 11
Data Requirements
• Open hole logs
• Existing completions / workover history
•Transient analysis data, pressure surveys
• Production history / Decline curves
• PVT analysis, core test data
• Field maps, structure maps, sand plays etc.• Stratigraphic correlations
8/8/2019 PEG Concept
http://slidepdf.com/reader/full/peg-concept 12/19
PEG Con: 12
Reservoir Monitoring & PEG
• Single well simulation
• History matching / Decline curve analysis
• Reserves estimates / Remaining reserves
• Production Gap - Candidate Recognition• Well Production & Intervention Services
• Economic analysis
• Full Field Simulation (with other Schlumberger companies
8/8/2019 PEG Concept
http://slidepdf.com/reader/full/peg-concept 13/19
PEG Con: 13
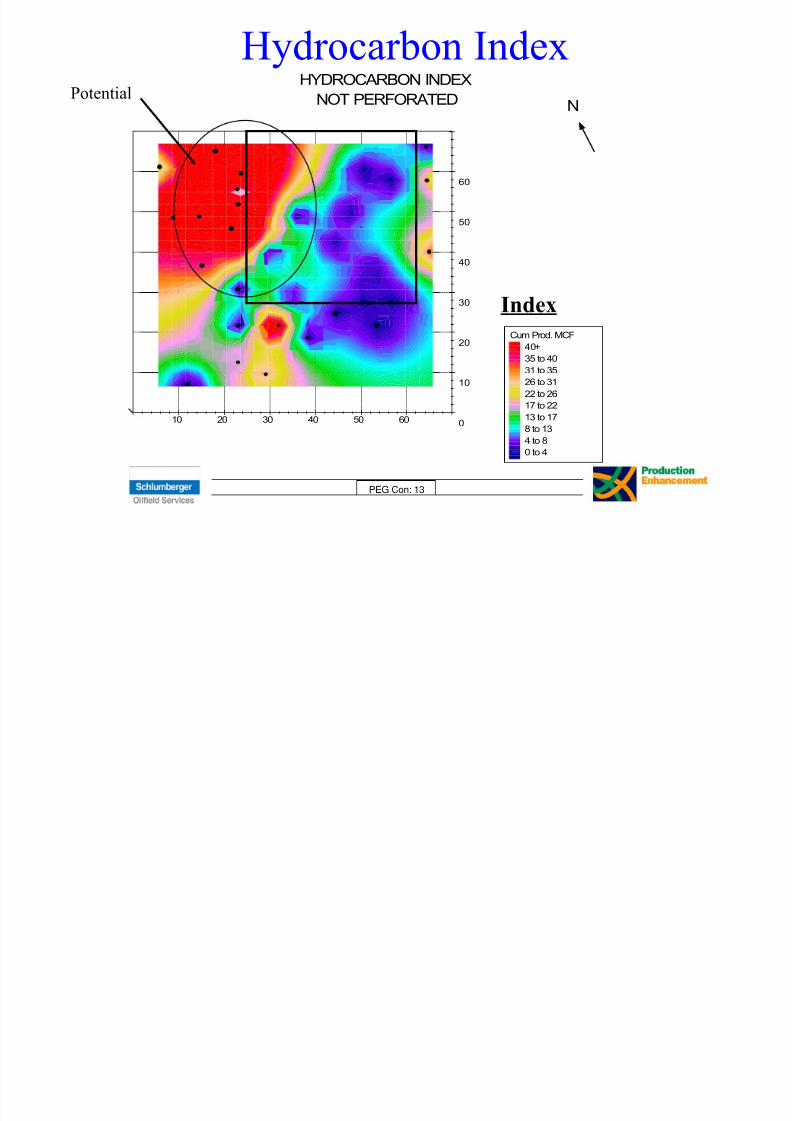
Hydrocarbon Index
10 20 30 40 50 600
10
20
30
40
50
60
Cum Prod. MCF
40+
35 to 40
31 to 35
26 to 31
22 to 26
17 to 22
13 to 17
8 to 13
4 to 8
0 to 4
N
HYDROCARBON INDEX
NOT PERFORATED
Index
Potential
8/8/2019 PEG Concept
http://slidepdf.com/reader/full/peg-concept 14/19
PEG Con: 14
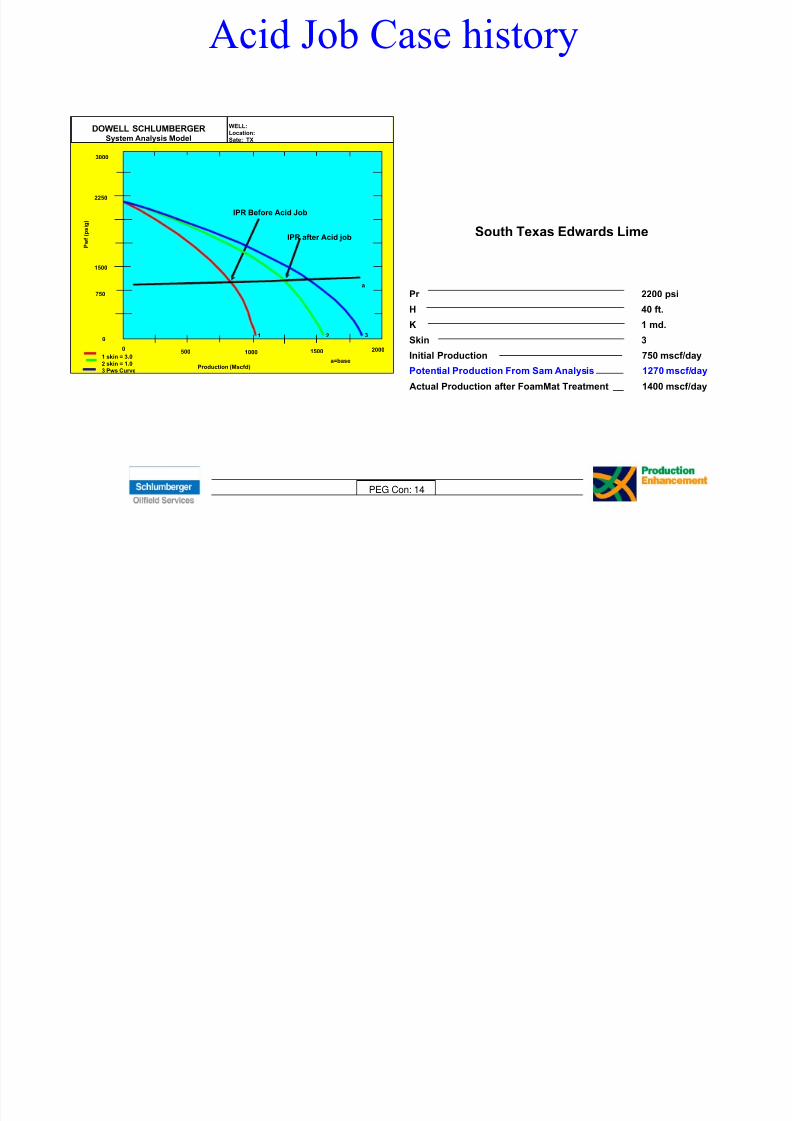
Acid Job Case history
IPR Before Acid Job
IPR after Acid job
WELL:
Location:
Sate: TX
DOWELL SCHLUMBERGERSystem Analysis Model
3000
2250
1500
750
0
0500 1000 1500 2000
Production (Mscfd) a=base
1 2 3
a
1 skin = 3.0
2 skin = 1.03 Pws Curve
Pw
f(psig)
South Texas Edwards Lime
Pr 2200 psi
H 40 ft.
K 1 md.
Skin 3
Initial Production 750 mscf/day
Potential Production From Sam Analysis 1270 mscf/day
Actual Production after FoamMat Treatment 1400 mscf/day
8/8/2019 PEG Concept
http://slidepdf.com/reader/full/peg-concept 15/19
PEG Con: 15
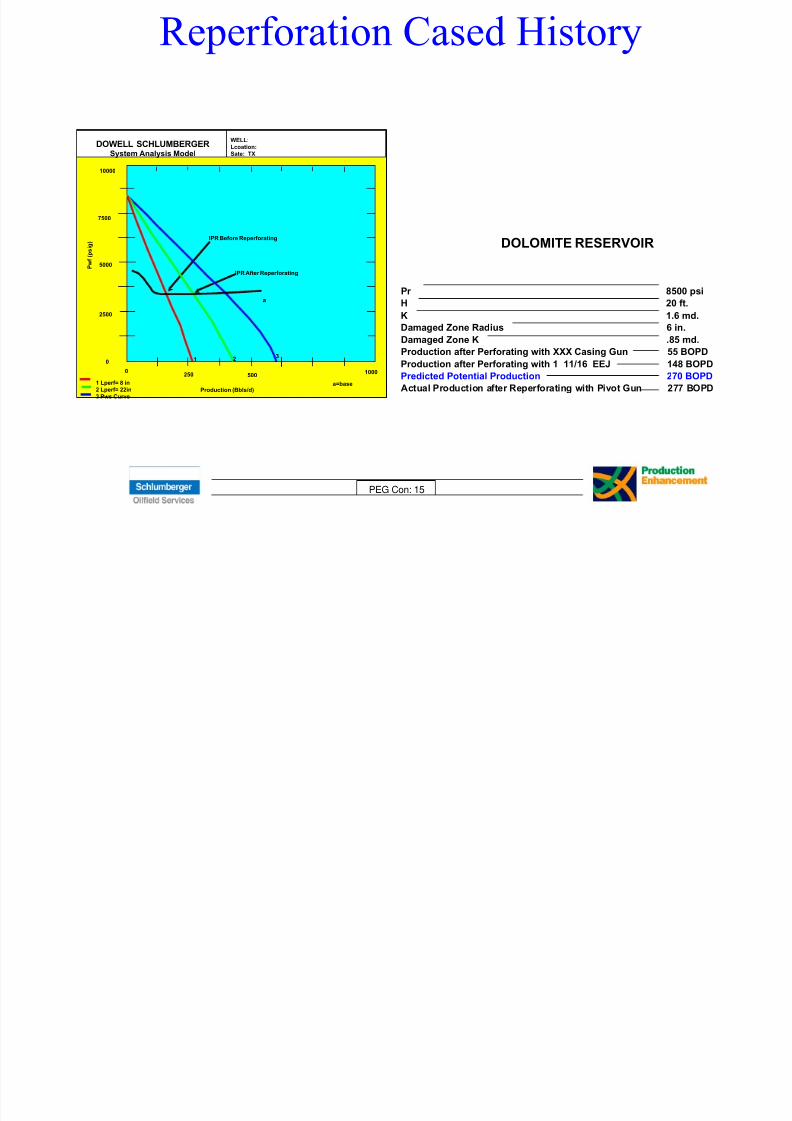
Reperforation Cased History
WELL:
Lcoation:
Sate: TX
DOWELL SCHLUMBERGERSystem Analysis Model
10000
7500
2500
00
250 5001000
Production (Bbls/d)a=base1 Lperf= 8 in
2 Lperf= 22in
3 Pws Curve
Pwf(psig)
5000
1 23
a
IPR Before Reperforating
IPR After Reperforating
DOLOMITE RESERVOIR
Pr 8500 psi
H 20 ft.
K 1.6 md.
Damaged Zone Radius 6 in.
Damaged Zone K .85 md.
Production after Perforating with XXX Casing Gun 55 BOPD
Production after Perforating with 1 11/16 EEJ 148 BOPDPredicted Potential Production 270 BOPD
Actual Production after Reperforating with Pivot Gun 277 BOPD
8/8/2019 PEG Concept
http://slidepdf.com/reader/full/peg-concept 16/19
PEG Con: 16
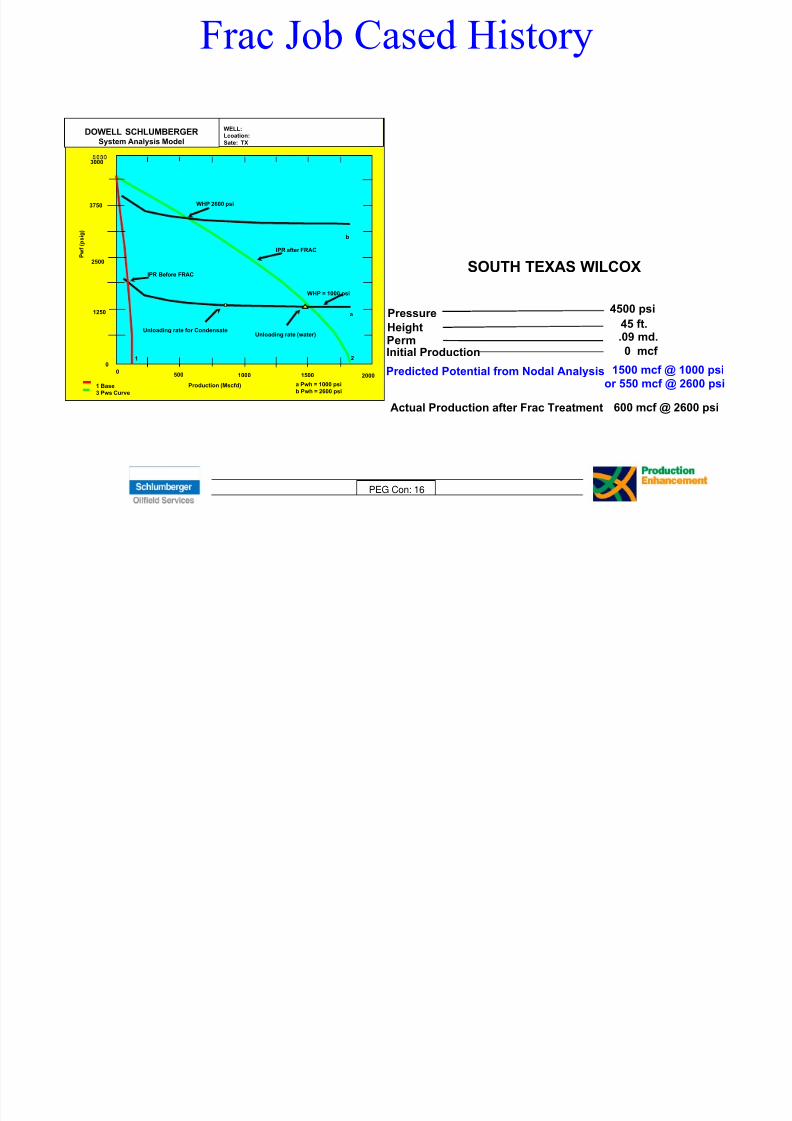
Frac Job Cased History
WELL:
Lcoation:
Sate: TX
DOWELL SCHLUMBERGERSystem Analysis Model
3000
3750
2500
1250
00
500 1000 1500 2000
Production (Mscfd) a Pwh = 1000 psi
b Pwh = 2600 psi1 Base
3 Pws Curve
Pwf(p
sig)
IPR Before FRAC
WHP 2600 psi
Unloading rate for Condensate
1 2
a
WHP = 1000 psi
Unloading rate (water)
b
IPR after FRAC
or 550 mcf @ 2600 psi
SOUTH TEXAS WILCOX
Pressure
4500 psi
Height 45 ft.
Perm .09 md.
Initial Production 0 mcf
Predicted Potential from Nodal Analysis 1500 mcf @ 1000 psi
Actual Production after Frac Treatment 600 mcf @ 2600 psi
8/8/2019 PEG Concept
http://slidepdf.com/reader/full/peg-concept 17/19
PEG Con: 17
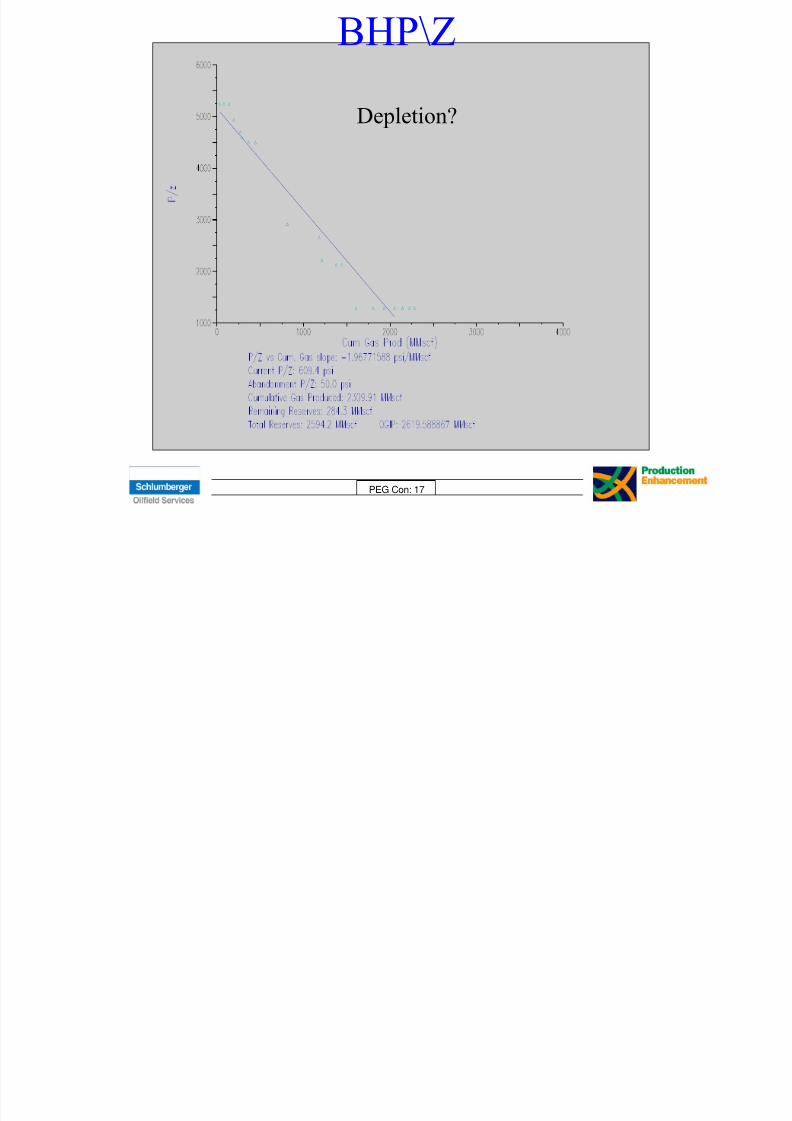
BHP\Z
Depletion?
8/8/2019 PEG Concept
http://slidepdf.com/reader/full/peg-concept 18/19
PEG Con: 18
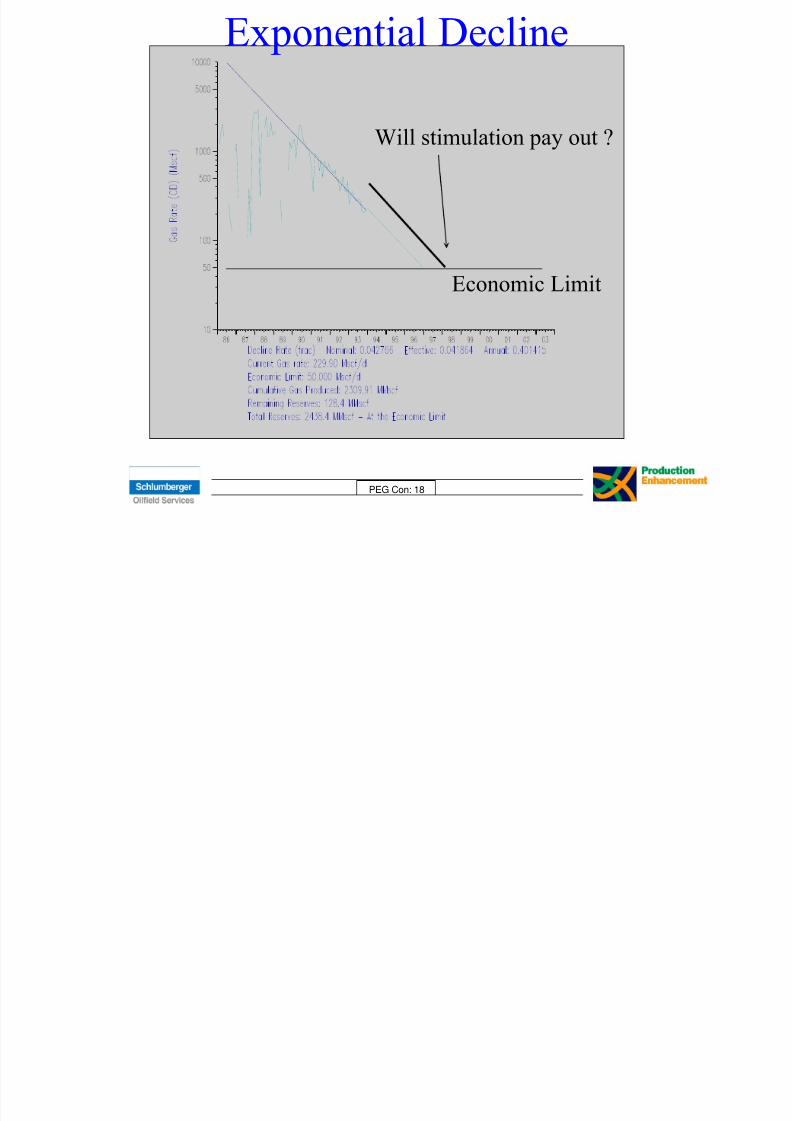
Exponential Decline
Economic Limit
Will stimulation pay out ?
8/8/2019 PEG Concept
http://slidepdf.com/reader/full/peg-concept 19/19
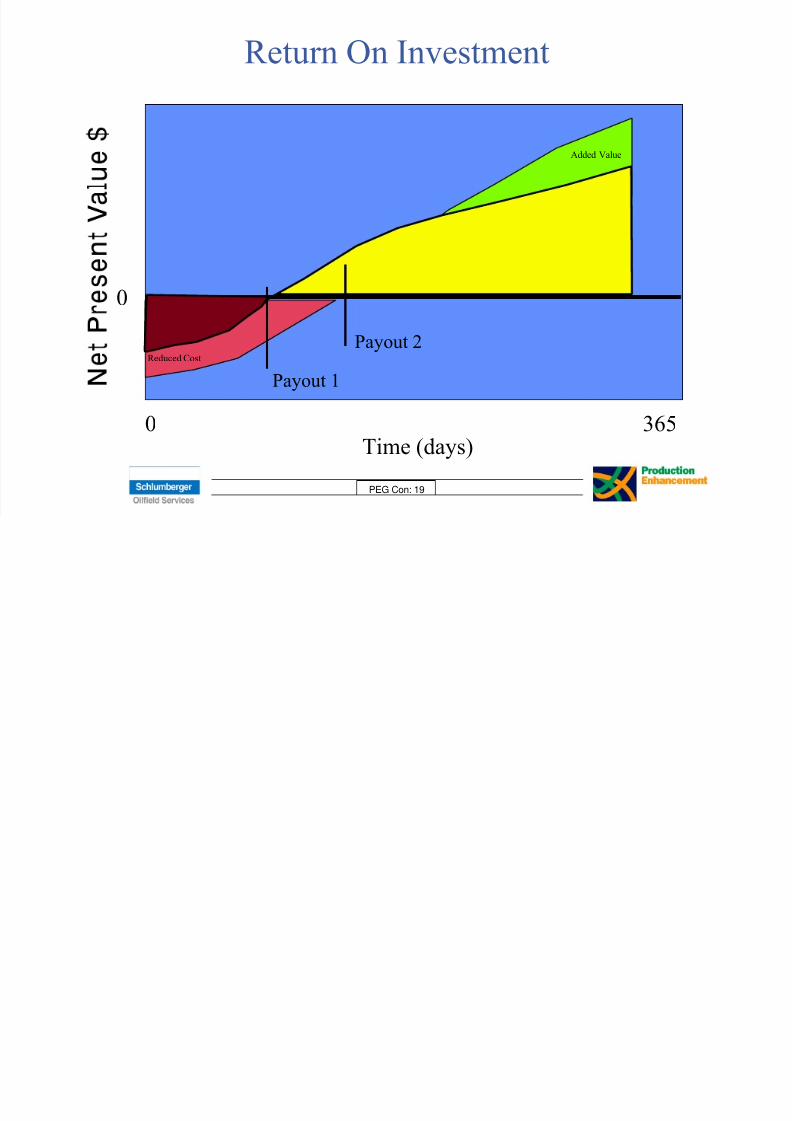
PEG Con: 19
Return On Investment
Time (days)0 365
0
Payout 2
Payout 1
Added Value
Reduced Cost